Embed Size (px)
Citation preview

Virginia Department of TransportationOn-Call ITS / Safety / Operations Contract
151-BLW (Task 10)
Newport News Signal SystemFeasibility Study and ITS Master Plan
Volume 1 of 2
FEASIBILITY STUDY - FinalApril 2006
Prepared for:
Prepared by:
Under SubContract to:
Newport NewsDepartment of Engineering

Newport News Signal System Feasibility Study
April 2006 Page i of iv
Table of ContentsExecutive Summary..............................................................................................1Technical Summary..............................................................................................21.0 Introduction ................................................................................................5
1.1 Document Organization .............................................................................................. 51.2 Project Overview ........................................................................................................ 51.3 Mission Statement ....................................................................................................... 6
2.0 System Inventory Baseline .........................................................................72.1 Central System............................................................................................................ 72.2 Communications ......................................................................................................... 82.3 Field Equipment........................................................................................................ 112.4 Overview Base Map and Database............................................................................ 142.5 Existing Staffing and Operations............................................................................... 16
3.0 System Evaluation Criteria ......................................................................203.1 Proposed System Functional Needs/Features ............................................................ 203.2 System Elements Inventory Summary ........................................................................ 213.3 Weighted Evaluation Criteria Matrix ........................................................................ 22
4.0 Proposed System Concept of Operations.................................................284.1 Proposed Operations ................................................................................................ 284.2 Proposed Staffing...................................................................................................... 314.3 Proposed Training .................................................................................................... 314.4 Proposed Inter-Agency Coordination........................................................................ 324.5 Proposed Incident and Emergency Management ....................................................... 334.6 Maintenance ............................................................................................................. 344.7 Traveler Information................................................................................................. 34
5.0 System Architecture..................................................................................366.0 Technology Evaluation and Recommendations ......................................38
6.1 Traffic Control Strategies.......................................................................................... 386.2 Traffic signal controller and cabinet options............................................................. 416.3 Other ITS Technologies............................................................................................. 576.4 Central system alternatives ....................................................................................... 666.5 Peer ATMS Review ................................................................................................... 676.6 Preliminary Technology Recommendations............................................................... 746.7 Technology Evaluation Summary .............................................................................. 78
7.0 Communication Media and Infrastructure Evaluation..........................797.1 Communication Media Evaluation ............................................................................ 797.2 Existing Infrastructure Resources ............................................................................. 987.3 Communications Expansion Routes......................................................................... 105
8.0 Proposed System Functional Requirements ..........................................1078.1 Platform/Architecture & System Administration Requirements................................ 1078.2 System Capacity...................................................................................................... 1128.3 Security/Reliability.................................................................................................. 113

Newport News Signal System Feasibility Study
April 2006 Page ii of iv
8.4 System Feature Requirements ................................................................................. 1148.5 Intersection Monitoring .......................................................................................... 1158.6 Traffic Control........................................................................................................ 1158.7 Database Features .................................................................................................. 1168.8 Status Monitoring ................................................................................................... 1178.9 Reporting................................................................................................................ 1188.10 Other ITS Devices................................................................................................... 1188.11 Local Intersection Functional Requirements ........................................................... 1198.12 Hardware ............................................................................................................... 1208.13 Communications ..................................................................................................... 1208.14 Traffic Control Features ......................................................................................... 1208.15 Time-Base Control.................................................................................................. 1208.16 Preemption/Priority ................................................................................................ 1208.17 Logs........................................................................................................................ 1218.18 Diagnostics & Status Displays ................................................................................ 1218.19 Communications ..................................................................................................... 121
9.0 Summary .................................................................................................1239.1 Framework for the Future Policies ......................................................................... 123

Newport News Signal System Feasibility Study
April 2006 Page iii of iv
List of Figures
Figure 1 - Existing Central/Communication Architecture ......................................................... 10Figure 2 - Newport News Signal System Baseline Overview Map ............................................ 15Figure 3 - Newport News Transportation Division System Architecture ................................... 37Figure 4 - NEMA TS-1 Layout Figure 5 - Photograph of TS-1 Cabinet ................................ 43Figure 6 - Model 170 Cabinet Architecture............................................................................... 45Figure 7 - Model 170 Cabinet Configurations (Source: 1989 Caltrans TSCES)......................... 46Figure 8 - Model 170 Cabinet and Controller (Source: Safetran)............................................... 47Figure 9 - NEMA TS-2 Type 1 Cabinet .................................................................................... 49Figure 10 - NEMA TS-2 Type 1 (Left) and Type 2 (Right)....................................................... 50Figure 11 - 2070 Chassis Front and Rear View (Source: TEES, August 16, 2002) .................... 52Figure 12 - Empty 2070 with VME chassis (rear view)............................................................. 54Figure 13 - 2070L N1, front (Left) and rear (Right) view.......................................................... 55Figure 14 - 2070 with VME bus, front (Left) and rear (Right) view .......................................... 55Figure 15 - A sample 170 cabinet with local camera controller. ................................................ 58Figure 16 - Dome and Barrel Style Cameras............................................................................. 60Figure 17 - DMS Matrix Display Types.................................................................................... 61Figure 18 - Examples of full-matrix displays with graphics ...................................................... 61Figure 19 - Loop detector schematic......................................................................................... 63Figure 20 - Sample Non-intrusive Detector (RTMS Microwave Radar) .................................... 65Figure 21 - SmarTek SAS-1 Acoustic Sensor (left) and SpeedInfo DVSS-100 Doppler Sensor(right) ....................................................................................................................................... 65Figure 22 - Typical PON Topology .......................................................................................... 92Figure 23 - Inter-Agency Connection and Proposed Fiber Expansion Map ............................. 103
Newport News Signal System Feasibility Study
April 2006 Page iv of iv
List of Tables
Table 1: Master Controller Locations and System Report-In Times ............................................ 8Table 2: Cabinet Size and Classification................................................................................... 12Table 3: System Detector Locations ......................................................................................... 13Table 4: Newport News Survey Summary ................................................................................ 25Table 5 - Compatible Controllers and Cabinets Pairings ........................................................... 42Table 6 - 2070 ATC Varieties (Source: Caltrans 2002 TEES)................................................... 53Table 7 - 2070 ATC Controller Configurations (Source: Caltrans 2002 TEES)......................... 53Table 8 - Comparison of Controller Platform Features.............................................................. 56Table 9 - Pairing of Central Software with Cabinet/Controller Architecture.............................. 67Table 10 - Summary of Peer Review Questions ........................................................................ 68Table 11 - Scenario A Pros and Cons........................................................................................ 75Table 12 - Scenario A Estimated Costs..................................................................................... 75Table 13 - Scenario B Pros and Cons........................................................................................ 76Table 14 - Scenario B Estimated Costs ..................................................................................... 76Table 15 - Scenario C Pros and Cons........................................................................................ 77Table 16 - Scenario C Estimated Costs ..................................................................................... 77Table 17:Advantages and Disadvantages of Leased Lines ........................................................ 82Table 18 – Wireless Local Area Networks – ISM Bands........................................................... 83Table 19 - Advantages and Disadvantages of Wireless ............................................................. 87Table 20 – Bandwidth Table..................................................................................................... 89Table 21 - Advantages and Disadvantages of an Agency-Owned Fiber Optic Network............. 96Table 22: Citywide IT Fiber Network Access Points................................................................. 99Table 23: Wi-Fi Hot Spots........................................................................................................ 99
AppendicesAPPENDIX A Newport News Signal System Baseline Database
APPENDIX B Stakeholder Survey and Detailed Responses
APPENDIX C ATMS Peer Review and Detailed Responses
APPENDIX D Definitions
APPENDIX E Acronyms
APPENDIX F Central Software Comparison

Newport News Signal System Feasibility Study
April 2006 Page 1 of 125
Executive SummaryThe Feasibility Study was conducted as part of a pre-design evaluation for the upgrade ofthe citywide traffic signal system in Newport News. The findings that follow establish aplan to guide the City through the design and construction phases of the project. It wasdetermined that the City will pursue a multiyear development of a Citywide Signal SystemUpgrade. It is essential that this citywide signal system upgrade project move forwardnow because the existing signal infrastructure has exceeded its 20 year life expectancy andmust be replaced with an expandable system to meet future transportation needs. Theprimary objective of this project is defined in the mission statement as follows:
The Feasibility Study is comprised of two volumes. Volume 1 presents the analysis andfindings of the review of signal system upgrades. Volume 2 presents the ITS Master Planfor use in expanding the traffic signal system capabilities.
TThhee mmiissssiioonn ppuurrppoossee aanndd nneeeedd ooff tthhee pprroojjeecctt iiss ttoo ddeessiiggnn aanndd iimmpplleemmeenntt aann
aaddvvaanncceedd ttrraannssppoorrttaattiioonn mmaannaaggeemmeenntt ssyysstteemm ffoorr cciittyywwiiddee ccoonnttrrooll ooff hhiigghhwwaayy aanndd
llooccaall ttrraaffffiicc iinn NNeewwppoorrtt NNeewwss uuttiilliizziinngg ssiiggnnaallss,, wwaarrnniinngg ddeevviicceess,, aanndd iinnccoorrppoorraattiinngg
IInntteelllliiggeenntt TTrraannssppoorrttaattiioonn SSyysstteemm ((IITTSS)) ccoommppoonneennttss.. TThhee ffooccuuss ooff ddeessiiggnn wwiillll bbee ttoo
ddeevveelloopp aa ssyysstteemm,, wwhhiicchh ssaaffeellyy aanndd eeffffiicciieennttllyy mmoovveess ppeeooppllee aanndd ggooooddss wwiitthhiinn tthhee
CCiittyy aanndd bbeettwweeeenn ssuurrrroouunnddiinngg jjuurriissddiiccttiioonnss aanndd iiss rreessppoonnssiivvee ttoo tthhee ddyynnaammiicc
ddeemmaannddss ooff ccoooorrddiinnaatteedd ttrraaffffiicc ooppeerraattiioonnss.. CCoommppoonneennttss ooff tthhee ssyysstteemm wwiillll ffoorrmm aa
fflleexxiibbllee aarrcchhiitteeccttuurree tthhaatt aalllloowwss ffoorr eexxppaannddaabbiilliittyy,, iiss eeaassiillyy mmaaiinnttaaiinneedd,, iiss iinntteerrooppeerraabbllee
wwiitthhiinn tthhee rreeggiioonnaall vviissiioonn//aarrcchhiitteeccttuurree,, aanndd ssuuppppoorrttss aa pphhaasseedd ppllaann ooff iimmpplleemmeennttaattiioonn..

Newport News Signal System Feasibility Study
April 2006 Page 2 of 125
Technical SummaryThe primary objective of developing the Newport News Signal System Feasibility Studyis to establish a plan to guide the City through the design and construction phases of theproject. The Feasibility Study contributes to long range planning by offering policies andstrategies for implementation in the City’s “Framework for the Future” document basedupon operational, technological, and economic analysis. The Feasibility Study focuses onthe functional requirements for traffic signal system components that are regionally andlocally significant, as well as addresses the specific needs of staff and steering committeemembers.
Kimley-Horn and Associates, Inc., under subcontract to Wilbur Smith Associates, wasretained under the VDOT ITS On-Call contract, to prepare the City of Newport News’Signal System Feasibility Study. When combined with the Intelligent TransportationSystems (ITS) Master Plan, the Signal System Feasibility study provides a comprehensivedocument to serve as the basis for the development of plans and specifications for anAdvanced Traffic Management System (ATMS). The Signal System Feasibility Study is acompilation of the following seven technical documents:
• System Inventory Baseline
• Mission Statement and Draft Operational Concepts
• System Evaluation Criteria
• Technology Evaluation and Recommendations
• Proposed Communication System Upgrades
• Proposed System Functional Requirements
• Proposed System ArchitectureThe system inventory baseline identified that the current 254 signalized intersectionsoperate in 27 coordinated signal systems with a few isolated operations. The inventorysummarized controller type, location, and operational characteristics for each intersection.In addition, the baseline inventory reviewed current staffing levels and determined that theCity currently operates and maintains all existing controller equipment andcommunications infrastructure.
During the early stages of this study, the project team worked with the steering committeeto establish a mission statement to help guide the decision-making process throughoutsubsequent activities. The identified mission statement is as follows:

Newport News Signal System Feasibility Study
April 2006 Page 3 of 125
To ensure the development of a comprehensive study that addresses the City’s needs, atwo-day workshop was held to gain input from key stakeholders that would ultimatelybenefit from the future ATMS. The stakeholders were divided into two categories: 1)Public Transportation & Public Safety, and 2) Institutional & Operations. Several issueswere identified during the two-day workshop as well as through the surveys received fromparticipants.In addition to the features of thesystem, the workshop alsoaddressed current and futureoperating arrangements between theCity and other agencies. Based onthe request to share data with otherCity agencies, emergencyoperations personnel, as well asnon-City stakeholders, a proposedarchitecture was recommended thatidentified the City of Newport NewsEngineering Division as the clearinghouse of information between theCity and the Virginia Department ofTransportation (VDOT) regarding transportation specific issues. VDOT will provide theCity with regional information for the interstate system, bridges, and tunnels, which willbe dispersed to other City divisions such as public works, schools, and emergencyoperations. Conversely, the City will provide information such as road closures, detours,and incidents along the major arterials to VDOT. During the design phases, detailedprotocols and formats will be developed to stream-line this process.After determining the focus areas and desired functions, the next step involved evaluatingcurrent technologies available to support the three elements of an ATMS:
TThhee mmiissssiioonn ppuurrppoossee aanndd nneeeedd ooff tthhee pprroojjeecctt iiss ttoo ddeessiiggnn aanndd
iimmpplleemmeenntt aann aaddvvaanncceedd ttrraannssppoorrttaattiioonn mmaannaaggeemmeenntt ssyysstteemm ffoorr
cciittyywwiiddee ccoonnttrrooll ooff hhiigghhwwaayy aanndd llooccaall ttrraaffffiicc iinn NNeewwppoorrtt NNeewwss
uuttiilliizziinngg ssiiggnnaallss,, wwaarrnniinngg ddeevviicceess,, aanndd iinnccoorrppoorraattiinngg IInntteelllliiggeenntt
TTrraannssppoorrttaattiioonn SSyysstteemm ((IITTSS)) ccoommppoonneennttss.. TThhee ffooccuuss ooff ddeessiiggnn wwiillll
bbee ttoo ddeevveelloopp aa ssyysstteemm,, wwhhiicchh ssaaffeellyy aanndd eeffffiicciieennttllyy mmoovveess ppeeooppllee
aanndd ggooooddss wwiitthhiinn tthhee CCiittyy aanndd bbeettwweeeenn ssuurrrroouunnddiinngg jjuurriissddiiccttiioonnss
aanndd iiss rreessppoonnssiivvee ttoo tthhee ddyynnaammiicc ddeemmaannddss ooff ccoooorrddiinnaatteedd ttrraaffffiicc
ooppeerraattiioonnss.. CCoommppoonneennttss ooff tthhee ssyysstteemm wwiillll ffoorrmm aa fflleexxiibbllee
aarrcchhiitteeccttuurree tthhaatt aalllloowwss ffoorr eexxppaannddaabbiilliittyy,, iiss eeaassiillyy mmaaiinnttaaiinneedd,, iiss
iinntteerrooppeerraabbllee wwiitthhiinn tthhee rreeggiioonnaall vviissiioonn//aarrcchhiitteeccttuurree,, aanndd ssuuppppoorrttss
aa pphhaasseedd ppllaann ooff iimmpplleemmeennttaattiioonn..
Vital functions identified through stakeholderoutreach include the following:
• Providing wireless remote access tofacilitate uploading/downloading timingchanges and status monitoring
• Supporting a minimum of seven timingplans per intersection
• Automated reporting of controller,detector, and communication failures
• Automated reporting of special eventschedules and road closures

Newport News Signal System Feasibility Study
April 2006 Page 4 of 125
• Signal Controllers
• Signal Cabinets
• Central SystemsThe technology evaluation included the NEMA and 170/2070 environments, both ofwhich have the ability to provide the requested functionality. The City is alreadycomfortable with the NEMA environment, and the ability to transition new controllers intoexisting cabinets provides the flexibility for phased construction.However, with the NEMA environment the selection of a hardware vendor alsoestablishes the software functionality for the central system. Nonetheless, given thecurrent NEMA market there are several vendors capable of supplying the functionality theCity is seeking, and therefore there is a competitive environment in which to obtain a costeffective system.
In addition to reviewing the hardware elements of the system, the feasibility study alsoevaluated communications media alternatives ranging from a twisted pair environment towireless networks to an all fiber backbone. After evaluating the existing twisted paircommunication infrastructure and opportunities to share the existing Citywide IT fiberinfrastructure, it was determined that an all fiber network would be optimal for providingaccess to real-time traffic data as well as accommodating the needs of the ITS elements,which are discussed in a separate document.Based upon input received through the steering committee and stakeholders input process,the following recommendations should be considered as detailed design plans andspecifications are developed to construct the Newport News Advanced TrafficManagement System.
• Design an ATMS to accommodate a NEMA environment cabinet, controller, andcentral system
• Design the system to include TS-2 controllers Citywide to provide current equipmentand provide for maintenance and replacement parts at all signalized locations
• Design for TS-2 cabinets in locations requiring additional functionality such asmultiple phase signal operations and traffic responsive mode
• Design the system to accommodate two redundant traffic control centers
• Design an all fiber communication network that maximizes the use of the existingCitywide IT network but minimizes the number of new connection points
• Design the communications system to operate in an Ethernet environment to controlthe ATMS function and proposed ITS functions identified in a separate document

Newport News Signal System Feasibility Study
April 2006 Page 5 of 125
1.0 IntroductionThe purpose of Subtask B of the Newport News Signal System ATMS Feasibility Studyand ITS Master Plan is to prepare the functional requirements that will become the basisfor the City’s planned system upgrades. The Feasibility Study reviews operations andtechnology alternatives that will enhance existing operations within the City as well aswith surrounding jurisdictions by expanding traffic management.
The primary objective of developing the Feasibility Study is to establish policies andstrategies for implementation in the City’s “Framework for the Future” based uponoperational, technological, and economic analysis. The Feasibility Study focuses on thefunctional requirements for traffic signal system components that are regionally andlocally significant, as well as addressing the specific needs of staff and steering committeemembers.
1.1 Document OrganizationThis document is divided into 8 sections. Section 1 provides an introductory projectoverview, document organization, and mission statement. Section 2 summarizes thesystem inventory baseline. Section 3 provides the evaluation criteria for proposed systemalternatives. Section 4 describes the existing and proposed concept of operations. Section5 reviews the evaluation of technologies and traffic control strategies. Section 6 analyzescommunication upgrade alternatives and resource sharing opportunities. Section 7provides the culmination of the findings into a series of functional requirements for theproposed system. In Section 8, a summary of the feasibility study and a conclusion will beprovided.
1.2 Project OverviewThe City of Newport News is developing a detailed Signal System Feasibility Study andIntelligent Transportation Systems (ITS) Master Plan that when combined will provide acomprehensive document to serve as the basis for the development of plans andspecifications for an Advanced Traffic Management System (ATMS). Kimley-Horn andAssociates, Inc., under subcontract to Wilbur Smith Associates, is preparing thesedocuments within the VDOT ITS On-Call contract.The ATMS Feasibility Study is a compilation of seven technical documents, submittedpreviously in draft versions, which have been combined into this final report. Under aseparate phase of this effort, an ITS Master Plan is also being developed to account forelements beyond the scope of traditional traffic signal system deployment. The seventechnical documents represented within this ATMS Feasibility Study are:
• System Inventory Baseline• Mission Statement and Draft Operational Concepts• System Evaluation Criteria• Technology Evaluation and Recommendations• Proposed Communication System Upgrades• Proposed System Functional Requirements• Proposed System Architecture

Newport News Signal System Feasibility Study
April 2006 Page 6 of 125
1.3 Mission StatementDuring the early stages of this project, the project team worked with the steeringcommittee to establish a mission statement to help guide the decision-making throughoutsubsequent activities. The identified mission statement is as follows:
TThhee mmiissssiioonn ppuurrppoossee aanndd nneeeedd ooff tthhee pprroojjeecctt iiss ttoo ddeessiiggnn aanndd iimmpplleemmeenntt
aann aaddvvaanncceedd ttrraannssppoorrttaattiioonn mmaannaaggeemmeenntt ssyysstteemm ffoorr cciittyywwiiddee ccoonnttrrooll ooff
hhiigghhwwaayy aanndd llooccaall ttrraaffffiicc iinn NNeewwppoorrtt NNeewwss uuttiilliizziinngg ssiiggnnaallss,, wwaarrnniinngg
ddeevviicceess,, aanndd iinnccoorrppoorraattiinngg IInntteelllliiggeenntt TTrraannssppoorrttaattiioonn SSyysstteemm ((IITTSS))
ccoommppoonneennttss.. TThhee ffooccuuss ooff ddeessiiggnn wwiillll bbee ttoo ddeevveelloopp aa ssyysstteemm,, wwhhiicchh
ssaaffeellyy aanndd eeffffiicciieennttllyy mmoovveess ppeeooppllee aanndd ggooooddss wwiitthhiinn tthhee CCiittyy aanndd
bbeettwweeeenn ssuurrrroouunnddiinngg jjuurriissddiiccttiioonnss aanndd iiss rreessppoonnssiivvee ttoo tthhee ddyynnaammiicc
ddeemmaannddss ooff ccoooorrddiinnaatteedd ttrraaffffiicc ooppeerraattiioonnss.. CCoommppoonneennttss ooff tthhee ssyysstteemm
wwiillll ffoorrmm aa fflleexxiibbllee aarrcchhiitteeccttuurree tthhaatt aalllloowwss ffoorr eexxppaannddaabbiilliittyy,, iiss eeaassiillyy
mmaaiinnttaaiinneedd,, iiss iinntteerrooppeerraabbllee wwiitthhiinn tthhee rreeggiioonnaall vviissiioonn//aarrcchhiitteeccttuurree,, aanndd
ssuuppppoorrttss aa pphhaasseedd ppllaann ooff iimmpplleemmeennttaattiioonn..

Newport News Signal System Feasibility Study
April 2006 Page 7 of 125
2.0 System Inventory BaselineThe following information has been compiled from GIS data and signal design plans supplied bythe City, and supplemented with field investigations and interviews with the City’s staff. Theexisting system information has been divided into three subsections: central system,communications, and field equipment. The data gathered has been consolidated into the GISdatabase. The contents of the GIS data fields, illustrated on the base map, are explained in thissection.
2.1 Central SystemThe software used to communicate with the field hardware described in the subsequentsection is the LM System Software (Rev. 6.3A/1996) provided by Traffic ControlTechnologies. The LM100 Software used in Newport News can supervise up to 32 fieldmasters on two system servers: Server “C” and Server “D” shown in Figure 1. Server “C”manages the south end of Newport News, while Server “D” manages the north end. Thesoftware has the capability to communicate with the master in a closed-loop system. In theNewport News architecture, all communications with local controllers are via the fieldmasters, and 24 local intersections can be communicated with simultaneously if they areconnected to the same master. Two masters can communicate with one another to extendthe system boundaries beyond the local controller capacity limitations. Some isolatedintersections are operating as a stand-alone master controller, but are not currentlyconnected/monitored by the central system. These isolated intersections are onlyaccessible by technicians in the field or by dial-up from vendor software. There are 27master controllers within the Newport News Signal System. The J Clyde MorrisBoulevard & Old Oyster Point Road system is not part of the LM System. This systemcurrently has Eagle equipment and does not report to the LM System. Table 1 shows theexisting master controller locations that are currently connected to the central systemservers.

Newport News Signal System Feasibility Study
April 2006 Page 8 of 125
Table 1: Master Controller Locations and System Report-In Times**************************************************** ************************ **** ****************CITYWIDE SYSTEM "C" Server TIME
75TH-WARWICK A - 1 0200-023042ND-HUNTINGTON B - 2 0230-030039TH-HUNTINGTON C - 3 0300-033016TH-MARSHALL D - 4 0330-040026TH-MARSHALL E - 5 0400-043027TH-WICKHAM F - 6 0430-050039TH-MARSHALL G - 7 0500-053036TH-MARSHALL H - 8 0530-0600BRIARFIELD-MARSHALL I - 9 0600-063025TH - JEFFERSON J - 10 0630-0700CANON-MIDDLEGROUND No CommunicationSAUNDERS-DAPHIA L - 12 0130-0200
CITYWIDE SYSTEM "D" Server
YORKTOWN-JEFFERSON No CommunicationFT EUSTIS-JEFFERSON B - 2 0005-0030LUCAS CREEK-DENBIGH C - 3 0030-0100COLONY-WARWICK D - 4 0100-0130WARWICK-ELMHURST E - 5 0830-0930MAIN-WARWICK F - 6 0200-0230LOGAN-WARWICK G - 7 0230-0300OPERATIONS-JEFFERSON H - 8 0300-0330JEFFERSON-HOGAN I - 9 0330-0400CENTER-JEFFERSON J - 10 0400-0430MAXWELL-WARWICK K - 11 0430-0500TURNBERRY-JEFFERSON L - 12 0500-0530 J C MORRIS -THIMBLE SHOALS M - 13 0530-0600J C MORRIS – OLD OYSTER POINT N - 14 0600-0630MARRY OAKS-WARWICK O - 15 0630-0700
2.2 CommunicationsWithin the Newport News traffic signal system there are two central communication linesthat are used to communicate with the 27 master controllers throughout the system. Themaster controllers, in turn, communicate with the 250+ attached local controllers. The twocommunication lines are plain old telephone system (POTS) lines that operate on theVerizon public telephone network. There are currently no agency-owned communicationlines in operation between the central system and the masters. Data is transmitted on thesedial-up communication lines via low bandwidth data modems operating at 300 bits persecond (bps) data rates.
A 300 bps communications rate is less than ideal by today’s standards, let alone theincreasing demand for bandwidth by advanced signal controllers. These slow data transferrates inhibit the upload and download rate at which data is transferred. The master

Newport News Signal System Feasibility Study
April 2006 Page 9 of 125
controller communicates with the local controllers by using internal modems within thecontroller to communicate over City-owned twisted pair cables. The communicationsarchitecture is illustrated in Figure 1 below. There is a mixture of 6-pair and 12-pair size19-AWG twisted pair cable throughout the system.
As seen on the base map (Figure 2), there are gaps within the current system that do notallow for complete connectivity between the closed loop systems nor directly with theoperations centers without using the dial-up public telephone network.A further limitation on the existing communication network is that the dial-up fieldmodems at the master cabinet locations are no longer produced. These Bell 212A-stylemodems, once manufactured by UDS/Motorola, are currently being repaired by staff whenpossible. If modems are not repaired, adjacent systems are being chained in order to sharethe modem at the master controller and remotely communicate with central operations. Inorder to maintain remote operations prior to the ultimate replacement of the system, it maybe necessary to obtain and test alternative vendor modems for compatibility with thecurrent system. Two vendors worth noting are GDI and ARC Electronics, both of whichmanufacture a field-hardened Bell-212 compatible modem.
(http://www.sgdi.com/pdf_files/GDI%20SM336SA.pdf; andhttp://www.arcelect.com/ARC_IM_Modem_24_manual.html

Newport News Signal System Feasibility Study
April 2006 Page 10 of 125
Figure 1 - Existing Central/Communication Architecture
TrafficOperations
STC
FIELD CABINET
TP
SIGNAL SYSTEMSERVER
“C”
TP
SIGNALCONTROLLER
SIGNALCONTROLLER
SIGNALCONTROLLER
TP
FIELD MASTER CABINET
SIGNALCONTROLLER
MASTER
Modem (Bell 212A)
PublicTelephone
Network
SIGNAL SYSTEMSERVER
“D”
Modem
Modem
FIELD CABINET FIELD CABINET
TP = Twisted Pair
City Hall STCPartitioned Drive“C/D” Modems

Newport News Signal System Feasibility Study
April 2006 Page 11 of 125
2.3 Field EquipmentThe Newport News Signal System consists of several styles of field equipment.The equipment can be broken into several categories and are listed in the databasethat is included in this document as an appendix.Each signal in the database is identified by intersection location and a controllernumber. Other contributing descriptive factors are whether the signal is existing orfuture, a master or local controller, actuation or fixed-timed operations, video orloop detection, pedestrian push-button actuation for pedestrian cross-walks, pre-emption for emergency vehicles, signal span type (span wire or mast arm),physical cabinet location (ground or pole mount), cabinet type, controller type, andcontroller size.
Controller Number: Each signal is listed in the database with a controller number.A “0” is representative of a future signal and therefore no controller number hasbeen assigned.Location: This is the intersection location where the signal is installed or plannedto be installed.Existing or Future: Many of the signals listed in the database are currentlyinstalled and in operation. The database identifies the signal type with a “Y” foryes in this data field column, either existing or future.Master: There are 27 master controllers within the Newport News Signal System.These master controllers are the central control and communication points for thesub-systems. Typically, one master control cabinet communicates and controlsseveral other local controllers (no more than 24 per master). A “Y” for yes is usedin the database for identifying the master controller locations.
Actuation: Each traffic signal is either a fixed time signal or an actuated signal. A“Y” is used to identify an actuated signal, while a blank cell is used to show thatthe signal operates under a fixed time-based.Video Detection: Actuated traffic signals are split into two categories, inductive-loop detection or video detection. If the signal is actuated by video detection a “Y”for yes will be present in the appropriate cell of the database.
Pedestrian Actuation: There are 39 signal locations that have pedestrian crosswalks with pedestrian push-buttons and pedestrian signals. These signals are listedas having pedestrian-actuation and are identified in the database with a “Y” foryes. Typically, these signals are in high pedestrian areas, and this feature helpswith the safe movement of pedestrians across roadways.

Newport News Signal System Feasibility Study
April 2006 Page 12 of 125
Pre-emption: There are 68 signals that are equipped with emergency vehicle pre-emption. In the Newport News Signal System, pre-emption is the device thatsignals the controller to immediately service an emergency vehicle. As anemergency vehicle approaches the intersection (in an emergency situation, i.e. withemergency lights on) the controller interrupts its normal phasing cycle to servicethe approach actuated by the emergency vehicle, allowing the vehicle to passthrough the intersection with little delay. A “Y” for yes is used to identify a signallocation with emergency vehicle pre-emption.
Span Type: There are two primary methods used to install signal heads across anintersection, either by a mast arm or span-wire installation. In some locations(mainly large intersections and intersections underneath overpasses) a third methodis used that places the signal heads on top of a pedestal pole at a height that istypically less than that of a span wire or mast arm height.Cabinet Location: The cabinet location is listed in the database as either groundmounted or pole-mounted.Cabinet Type: The cabinet type used throughout the system is the TS-1. This datafield is used to differentiate with other cabinet types (i.e. TS-2, 170/2070 style,ITS, etc.).
Controller Type: The controller type identifies the controller as “Flasher”, “LC”, or“LMD.” “Flasher” represents locations where either dedicated school flashers ornon-signalized intersection warning flashers are used. “LC” and “LMD” representlocations where there are traffic signal controllers from Traffic ControllerTechnologies or PEEK. Additionally, there are three “EAGLE” controllerlocations along J. Clyde Morris, which are coordinated with the VDOT HamptonRoads District traffic signals along that corridor.Cabinet Classification: The existing cabinet sizes have been placed into sixcategories with a separate category for flasher controls. The sizes are listed belowin Table 2. Please note that these sizes are approximate.
Table 2: Cabinet Size and ClassificationCabinet Sizes and Classification for Newport News SignalSystem
Cabinet Classification Approximate Size of CabinetNN1 48" x 30" x 18"NN2 48" x 36" x 24"NN3 48" x 48" x 30"NN4 48" x 48" x 18"NN5 48" x 48" x 24"NN6 60" x 48" x 30"FL 12" x 12" x 12"

Newport News Signal System Feasibility Study
April 2006 Page 13 of 125
System Detectors: The existing system detector locations are noted in the databasewith the direction of travel and lanes covered. Currently, all system detectors areusing inductive loops. Systems loops that are within closed-loop systemboundaries provide data for supporting traffic responsive operations for thatsystem. Table 3 summarizes the existing system detector locations. Lanedescriptions include L for Left, C for Center and R for Right lanes.
Table 3: System Detector LocationsLOCATION DIRECTION LANES
Jefferson between Ivy Farms and Dresden NB L,C,RJefferson between Harpersville and Winston SB L,C,RMercury between Newmarket and Jefferson EB L,C,RJefferson between Hemlock and Lyliston NB L,C,RJefferson between Ivy Farms and Dresden SB L,C,RJefferson between Harpersville and Winston NB L,C,RMercury between Newmarket and Hampton City Limits WB L,C,RWarwick between 75th St. and Mercury NB L,C,RWarwick between 75th St. and Mercury SB L,C,RMercury between JRB and River EB LMercury between Warwick and River WB L39th St. between Marshall and Roanoke EB L,R39th St. between Marshall and Roanoke WB L,RWarwick between Cedar and Logan NB L,C,RWarwick between Cedar and Logan SB L,RWarwick SBLT at Ridgeway SB LJefferson between Clair La. and Operations Dr. SB L,C,ROyster Point b/w Criston - Village Green (system) EB L,C,ROyster Point b/w Criston - Jefferson (system) WB L,C,ROyster Point b/w Canon - Village Green (system) WB L,C,RJefferson between Oyster Point and HQ Way NB L,C,RJefferson between Oyster Point and Hogan NB L,C,RJefferson between Muller La. and Hogan SB L,C,RJefferson between Thimble Shoals and Pilot House SB L,C,RJefferson between J.Clyde and Pilot House NB L,C,RDenbigh east of McManus WB L,RDenbigh west of McManus EB L,RJefferson Ave between Turnberry and Bland SB L,C,RJefferson Ave b/w Turnberry and Denbigh Crossing NB L,C,RJefferson Ave between Bland and Habersham SB L,C,RJefferson Ave between Bland and Turnberry NB L,C,RJefferson between Habersham and Brick Kiln NB L,C,RJefferson between Richneck and Buchanan SB L,C,R

Newport News Signal System Feasibility Study
April 2006 Page 14 of 125
2.4 Overview Base Map and DatabaseUsing the geographic information system (GIS) database from the City as abaseline, the information gathered from signal design plans, Operations’spreadsheets, and field reviews have been consolidated onto the GIS database.Figure 2 depicts the existing City-wide signal system element locations and someidentified future locations. The base map also includes City IT fiber networkaccess points that are described further in Table 22 in Section 7.2. Appendix A:Newport News Signal System Baseline Database provides the output of entriesfor each field location based upon the database fields described in Section 2.3above. Some data is missing, particularly for locations that have been implementedrelatively recently. However, since it is anticipated that the whole system will beupgraded, this information is not critical to subsequent analysis.

Newport News Signal System Feasibility Study
April 2006 Page 15 of 125
Figure 2 - Newport News Signal System Baseline Overview Map
Newport News Signal System Feasibility Study
April 2006 Page 16 of 125
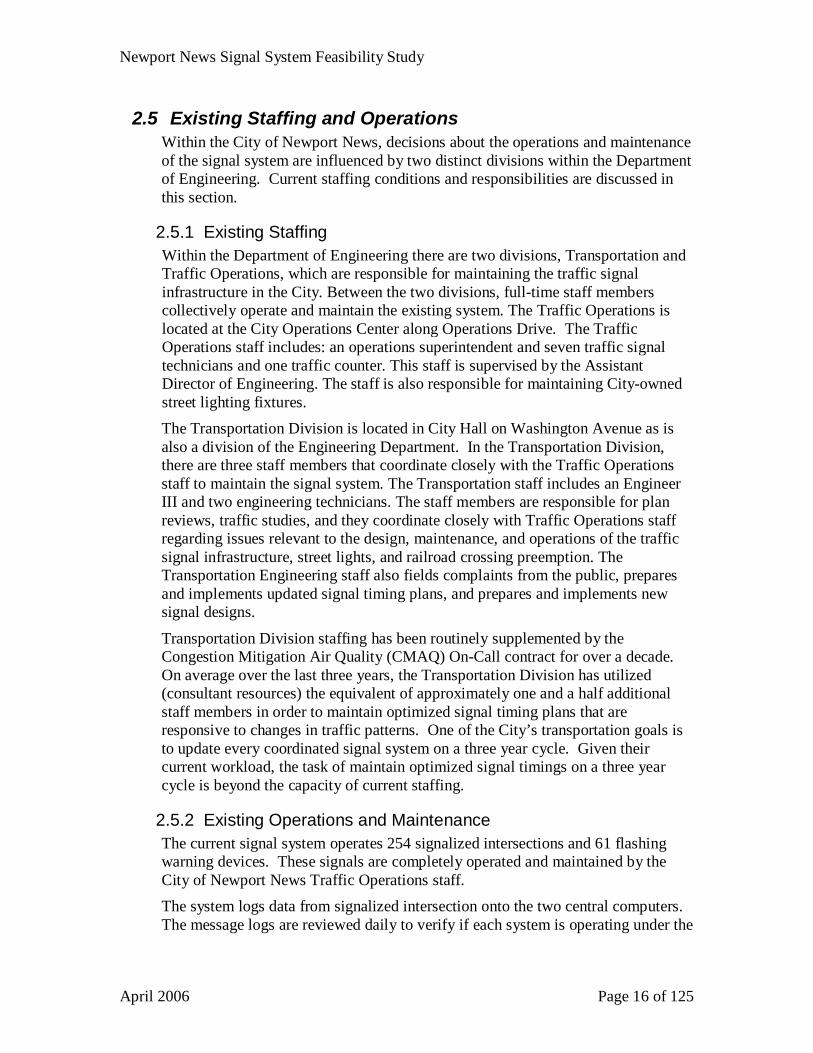
2.5 Existing Staffing and OperationsWithin the City of Newport News, decisions about the operations and maintenanceof the signal system are influenced by two distinct divisions within the Departmentof Engineering. Current staffing conditions and responsibilities are discussed inthis section.
2.5.1 Existing StaffingWithin the Department of Engineering there are two divisions, Transportation andTraffic Operations, which are responsible for maintaining the traffic signalinfrastructure in the City. Between the two divisions, full-time staff memberscollectively operate and maintain the existing system. The Traffic Operations islocated at the City Operations Center along Operations Drive. The TrafficOperations staff includes: an operations superintendent and seven traffic signaltechnicians and one traffic counter. This staff is supervised by the AssistantDirector of Engineering. The staff is also responsible for maintaining City-ownedstreet lighting fixtures.The Transportation Division is located in City Hall on Washington Avenue as isalso a division of the Engineering Department. In the Transportation Division,there are three staff members that coordinate closely with the Traffic Operationsstaff to maintain the signal system. The Transportation staff includes an EngineerIII and two engineering technicians. The staff members are responsible for planreviews, traffic studies, and they coordinate closely with Traffic Operations staffregarding issues relevant to the design, maintenance, and operations of the trafficsignal infrastructure, street lights, and railroad crossing preemption. TheTransportation Engineering staff also fields complaints from the public, preparesand implements updated signal timing plans, and prepares and implements newsignal designs.
Transportation Division staffing has been routinely supplemented by theCongestion Mitigation Air Quality (CMAQ) On-Call contract for over a decade.On average over the last three years, the Transportation Division has utilized(consultant resources) the equivalent of approximately one and a half additionalstaff members in order to maintain optimized signal timing plans that areresponsive to changes in traffic patterns. One of the City’s transportation goals isto update every coordinated signal system on a three year cycle. Given theircurrent workload, the task of maintain optimized signal timings on a three yearcycle is beyond the capacity of current staffing.
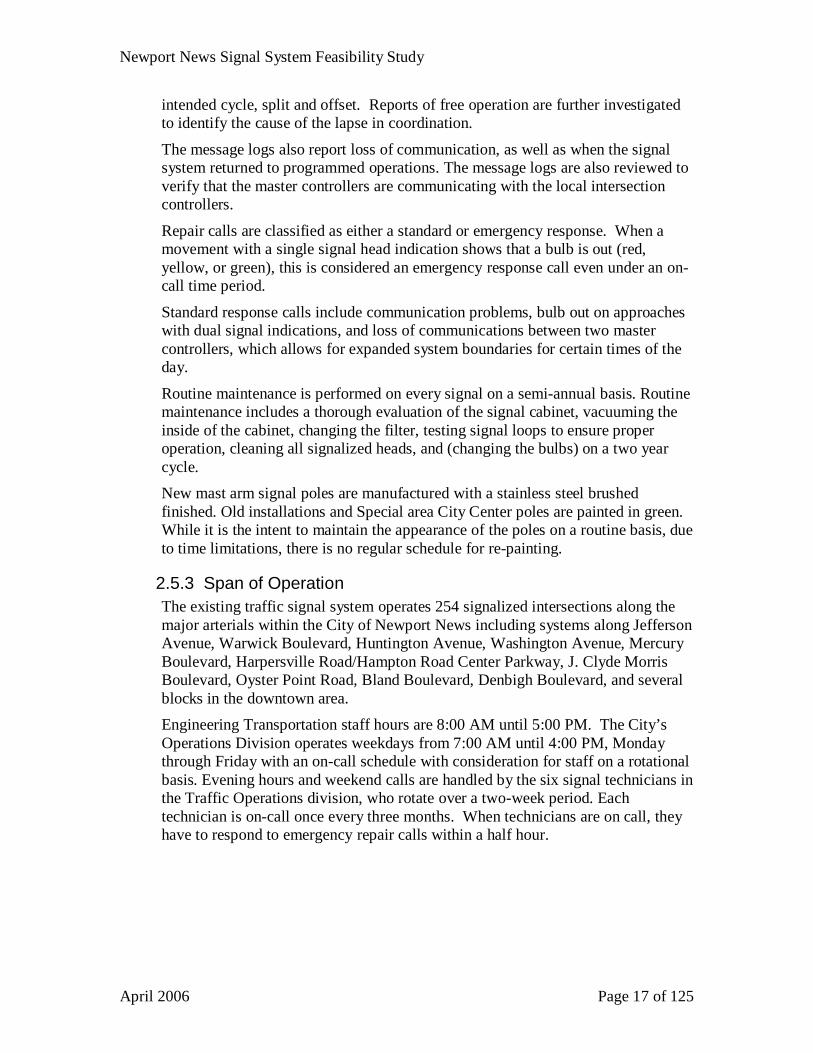
2.5.2 Existing Operations and MaintenanceThe current signal system operates 254 signalized intersections and 61 flashingwarning devices. These signals are completely operated and maintained by theCity of Newport News Traffic Operations staff.The system logs data from signalized intersection onto the two central computers.The message logs are reviewed daily to verify if each system is operating under the
Newport News Signal System Feasibility Study
April 2006 Page 17 of 125
intended cycle, split and offset. Reports of free operation are further investigatedto identify the cause of the lapse in coordination.
The message logs also report loss of communication, as well as when the signalsystem returned to programmed operations. The message logs are also reviewed toverify that the master controllers are communicating with the local intersectioncontrollers.
Repair calls are classified as either a standard or emergency response. When amovement with a single signal head indication shows that a bulb is out (red,yellow, or green), this is considered an emergency response call even under an on-call time period.
Standard response calls include communication problems, bulb out on approacheswith dual signal indications, and loss of communications between two mastercontrollers, which allows for expanded system boundaries for certain times of theday.
Routine maintenance is performed on every signal on a semi-annual basis. Routinemaintenance includes a thorough evaluation of the signal cabinet, vacuuming theinside of the cabinet, changing the filter, testing signal loops to ensure properoperation, cleaning all signalized heads, and (changing the bulbs) on a two yearcycle.New mast arm signal poles are manufactured with a stainless steel brushedfinished. Old installations and Special area City Center poles are painted in green.While it is the intent to maintain the appearance of the poles on a routine basis, dueto time limitations, there is no regular schedule for re-painting.
2.5.3 Span of OperationThe existing traffic signal system operates 254 signalized intersections along themajor arterials within the City of Newport News including systems along JeffersonAvenue, Warwick Boulevard, Huntington Avenue, Washington Avenue, MercuryBoulevard, Harpersville Road/Hampton Road Center Parkway, J. Clyde MorrisBoulevard, Oyster Point Road, Bland Boulevard, Denbigh Boulevard, and severalblocks in the downtown area.Engineering Transportation staff hours are 8:00 AM until 5:00 PM. The City’sOperations Division operates weekdays from 7:00 AM until 4:00 PM, Mondaythrough Friday with an on-call schedule with consideration for staff on a rotationalbasis. Evening hours and weekend calls are handled by the six signal technicians inthe Traffic Operations division, who rotate over a two-week period. Eachtechnician is on-call once every three months. When technicians are on call, theyhave to respond to emergency repair calls within a half hour.

Newport News Signal System Feasibility Study
April 2006 Page 18 of 125
2.5.4 Incident and Emergency ManagementThe City of Newport News operates its signal system on either time-basedcoordination or using traffic responsive thresholds. The major commuter corridorsthat provide access to Interstate 64 primarily operate under traffic responsivemode. Under this condition, the system loops in the pavement collect volume-datain 10-minute increments and compare this information against pre-determinedthresholds, which then operate a specific timing plan. When field data for aspecific loop exceeds the peak condition, pre-developed incident managementplans are downloaded from the timing library. There are corridors, where thesystem loops are not properly placed or they are malfunctioning such that thesystem only operates in a time-based mode. Under these conditions, incidentmanagement plans can only be implemented by manually downloading them.The City of Newport News also operates special plans within school zones. Basedon known operating hours, certain signals that service a school entrance or majorintersection are allowed to run in free operation for a period of approximately 15minutes to allow bus traffic associated with adjacent schools to enter the systemquickly. These plans are implemented on a time-of-day basis at specificintersections. When natural disasters or winter storms cause a delay in schoolschedules, often times the flasher schedules cannot be updated in time, since amanual download must be initiated to each individual local controller or flashercontroller.
Given the significant growth in retail activity along certain corridors (JeffersonAvenue; immediately north and south of I-64), the City has also developed holidayplans during the late evening and weekend periods. These plans are implementedon a time-of-day basis and re-evaluated every one to three years.
2.5.5 Timing PlansCurrently the City operates most of its system with a library of seven timing plansthat are implemented by either time-based coordination or traffic-responsivethresholds. The seven plans include the following plans:
1. Transitional PlanThe transitional plan usually operates at the lowest acceptable cycle lengthand is developed to address the minimum volume of traffic that warrantscoordination. It is usually the first and last plan run prior to allowing thesystem to operate in a free capacity.
2. AM PlanThe AM plan is developed to meet the needs of the morning commuters.
3. Off-Peak / Pre-PM PlanThe off peak plan is usually implemented in residential areas where theAM volumes spikes and then drops off allowing for a lower cycle lengthbetween the morning and noon periods.The Pre-PM plan is implemented in commercial areas where volumesconsistently rise throughout the day and though the cycle length may notvary there is a shift in the time allocated (i.e. splits) between the mainlineand side street.
Newport News Signal System Feasibility Study
April 2006 Page 19 of 125
4. Noon PlanThe Noon plan is developed to meet the needs of the “lunch” time patronsas well as commercial uses and businesses, when there is a more balance ingreen time between side street demand and mainline progression.
5. PM PlanThe PM peak emphasizes mainline progression for the commuter returninghome, but must also balance the demand of the commercial needs in heavyretail areas.
6. Incident Management Inbound PlanThis plan is developed if there is an incident on the interstate and traffic isdiverted into the City. The inbound direction (northbound or southbound)varies depending on where the system falls relative to the interstate.
7. Incident Management Outbound PlanThis plan is developed to evacuate the local streets onto the interstatesystem. The outbound direction (northbound or southbound) variesdepending on where the system falls relative to the interstate.
Plan development is further complicated by the limitations of the older PEEKequipment that only allows the use of four different cycle lengths, four differentsplits, and three different offsets.
For the systems with primarily two phased intersections, the number of timingplans is reduced based on a lower volume demand and a reduced need for varyingtiming plans.

Newport News Signal System Feasibility Study
April 2006 Page 20 of 125
3.0 System Evaluation CriteriaThe objective of this section is to compile and document relevant systemevaluation criteria for subsequent ATMS review and technology analysis. Theevaluation criteria, builds upon the input and information gathered during thedevelopment of the previous two reports in preparation for ultimately identifyingthe functional requirements for the proposed system upgrades. The prioritizationof user needs and functional requirements is analyzed and summarized within thissection.
In this section, proposed system functional needs and features were surveyed froma variety of stakeholders both in a written survey and during a 2-day workshopenvironment. An existing system inventory was provided by the City of NewportNews and verified by Kimley-Horn in a windshield survey to determine howfuture functions can be implemented. Survey results were documented andanalyzed based on guidance from the steering committee and detailed results areprovided in Appendix B. Priority is recommended to be given to providing thebasic function of uploading and downloading a minimum of seven timing plansfrom a remote location and communicating key road closure and incidentinformation to other City Departments and VDOT to help response times withinthe City limits.
3.1 Proposed System Functional Needs/FeaturesIn order to clearly understand the functional needs of all the stakeholders, afunctional survey was developed and distributed prior to the two-day workshop.This process allowed each organizations representative to seek additional feedbackand more accurately summarize the needs of the organizations they represented.
The fifteen question survey, which included an extensive list of sub-questions, wasdivided into four focus categories dealing with Public Transportation/Transit,Public Safety, Institutional/IT, and a Traffic Operations.The survey was distributed to the following stakeholders:
Newport News TransportationNewport News Traffic Operations
Newport News GISNewport News Citywide IT
Newport News Fire/Rescue× Newport News Police
Newport News School TransportationNewport News Public Works
Newport News Emergency Operations Center(Office of Emergency Management)
City of Hampton Traffic Engineering

Newport News Signal System Feasibility Study
April 2006 Page 21 of 125
VDOT Hampton Roads STCVDOT Hampton Roads District
× VDOT Hampton Roads TunnelsFHWA
Hampton Roads Planning District CommissionHampton Roads Transit
× Newport News-Williamsburg Airport Authority× Amtrak
× CSX× Virginia Department of Rail and Public Transportation
Of the 20 stakeholders, 14 responded to the survey and are indicated with a checkby their organization. This information has been compiled in a matrix andillustrated in the Table 4.
3.2 System Elements Inventory SummaryGiven the age of the existing equipment and lack of current vendor support, duringthe scoping phase of this project it was assumed that the existing system hardwareat a local level and central level would be completely replaced with newtechnology. Therefore, it was determined that a detailed intersection byintersection inventory would be very labor intensive and was not the best use ofthe overall project budget. Therefore, a more comprehensive “windshield”inventory was performed to validate existing conditions.The City provided a detailed list of signalized intersection information with thefollowing attributes:
• Signal Operations (Existing, Future, or Master)
• Actuation Type (vehicle, pedestrian, video)
• Cabinet information (mounting, cabinet type, foundation size and controllertype)
Kimley-Horn took this data in the field to verify information in addition toperforming a visual evaluation of the following elements:
• Controller ID Number
• Signal Type (Span Wire or Mast Arm)
• Cabinet Type (Pole Mount or Ground Mount)
• Cabinet Size (approximate for possible future re-use)
• Cabinet Color (for maintenance requirements)
• Actuation Type (Loops or Video)

Newport News Signal System Feasibility Study
April 2006 Page 22 of 125
• Pedestrian Actuation (yes or no)
• Pre-Emption (yes or no)
• Communication (aerial or underground)
• Flasher Type (school or other)
Given the assumption that the central and local hardware is obsolete, there is stillan opportunity to salvage some infrastructure. Therefore, as part of the fieldinventory, cabinet size and mounting types were noted in order to evaluate ifvarious types of controllers can be mounted into existing cabinets.
While there is a cost saving by using existing cabinets, consideration must also begiven to operational constraints and what is required to maintain current signalizedcontrol during the upgrades (i.e. minimize downtime).The system inventory elements verified in the field are indicated by a legendsymbol on the City Wide Base Map prepared as part of Task B.2 System InventoryDatabase and Base Map. The additional detailed information is included in tabularformat and is included in an attachment.
3.3 Weighted Evaluation Criteria MatrixThe values presented in this matrix represent the results of a sequential process togain insight and consensus along the way. This process began with surveysprovided to stakeholder representative to answer specific question that helpedguide the development of the general needs of their organizations as it relates tothe City of Newport News Signal System Operations. Not all questions wereanswered due to the fact that not all the questions were relevant to each of thestakeholders.The fifteen question survey was divided into four focus categories
• Public Transportation/Transit
• Public Safety
• Institutional/IT
• Traffic OperationsEach question was further broken down into detailed functions and features ofspecific applications. Some of the questions pertain to the stakeholders’ desire tomaintain existing functionality, while others focus more on new functionality. Theresults are summarized and sorted by total merit in the attached matrix (Table 4).From the survey responses, factors and priority rankings were applied to eachresponse based on:
• the importance of the functionality;
• the strength of need; and

Newport News Signal System Feasibility Study
April 2006 Page 23 of 125
• the criticality (or rank/priority) of the focus category.To clarify the step by step process used to develop the total merit of each function,an alphabetical sequence from A through I was assigned to each step in the processand is labeled in the attached matrix.
Columns A through C simply identify the raw results of those who responded tothe survey questions. The functionality description, as well as those whoresponded, is identified in the following two columns.Columns D through F establish a weighted value based upon the importance of thefunctionality to those who responded. Column G provides the rank/priority of thefocus category. Column H identifies the degree of interest for each function.Column I provides the combined total merit by multiplying the weightedimportance by the focus category priority as well as the degree of interestpercentage as seen in the following column headings from Table 4, and describedin further detail below.
The stakeholders were given three options to rank the importance of each question.Questions ranged from a variety of topics from “How and when do organizationscommunicate?” to “What do they do with the information received?” Thefunctions were ranked 1, 2 or 3 with the following understanding:
#1 – Must have it (column A)
#2 – Would be nice to have (column B)#3 – Don’t need/not a priority (column C)
The overall importance (column D) was calculated by multiplying the amount ofrespondents with an answer from options 1, 2, or 3 with an associated multiplier of10, 5, or 1 respectively.
The overall strength (Column E) was calculated by multiplying the totalimportance by the percentage of the respondents prioritizing a function #1 (Musthave) and then dividing by the percentage of the total responses.The importance and strength are combined to an initial weighting of the functions(column F – Weighted Importance). Several topics in the four categories may
PriorityG A B C
1 2 3
1 OP1.1 5 1 Wireless remote access connectivity with central to upload/download timing changes NNOPS, NNOEM, NNPS, FHWA(2), NNGIS, VDOT
Survey Question Who needs it?
Importance Ranking
Rank/Priority % Responded Total MeritD E F G H I
A*10+B*5+C*1 A / (A+B+C) D*E G (A+B+C)/respondents F*G*H
Importance StrengthWeighted
Importance
Weighted Importance

Newport News Signal System Feasibility Study
April 2006 Page 24 of 125
have received an equal weighting since some stakeholders did not respond to everytopic.
Therefore, it was determined that each of the four categories would be furtherranked relative to the overall needs and functions of an ATMS. Based on directionfrom the steering committee, the following ranking was applied to the four focusareas, with four being the most important attribute (column G – Rank/Priority).
1 - Institutional/IT (IT) 2 - Public Safety (PS)
3 - ATMS functionality (ATMS) 4 - Traffic Operations functionality (OP)
An overall importance factor was calculated similar to Column E (Strength).However, in Column H the number of responses (A+B+C) is divided by theoverall importance by the total number of respondents (e.g. 13). This gives arepresentation of the degree of interest for the functionality, in comparison toColumn E where the calculation was based only on the number of responses toeach function/question.
The weighted importance value (Column F) is then multiplied by the focus priorityranking (Column G) and by the percentage of total respondents (Column H) todetermine the Total Merit (column I).This step by step evaluation generated Total Merit values ranging from 3 to 85 forthe 76 survey questions. Table 5 is sorted by Total Merit in descending order.Nearly half of the questions resulted in a Total Merit greater than 50, with onlyseven functions receiving values in the 80s.Based on the information provided by the stakeholders and direction provided bythe steering committee, the following functionalities are recommended to be giventop priority as the City-wide signal system moves from study into design.
• Provide wireless remote access to upload and download timing changes
• Support a minimum of seven timing plans
• Report controller, detector, and communication failures
• Report special event schedule and road closures.All of the functions have a direct impact on the way services are provided (police,fire, HRT, school and VDOT) within the City roadway network. Accurate andreliable information focus on these topics identified above will allow eachorganization to adjust their own operations and maximize the efficiency to theirparticular users.
The information is summarized in Table 4 to illustrate the importance and merit ofinterest the stakeholders have for each function.

Newport News Signal System Feasibility Study
April 2006 Page 25 of 125
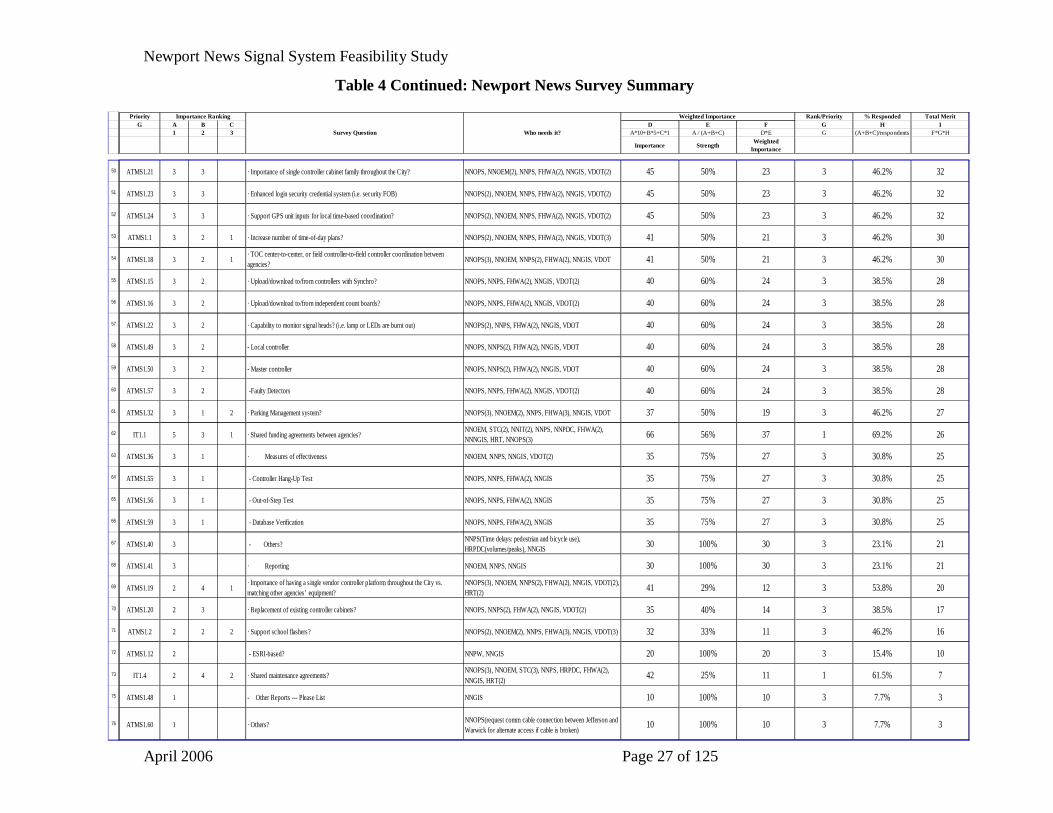
Table 4: Newport News Survey Summary
14 Respondents NN Ops NN Emerg. MgmtNN Publ Works NN ITNN Fire NN Public Schools Priority (1=Low to 4 = High)
Value HRPDC FHWA PS =Transportation information for Public Safety 210 NN GIS HRTransit IT = Institutional/IT 15 VDOT District VDOT HRSTC OP = Traffic Operations functionality 41 Hampton Traf Engineering NN Transp./Engineering ATMS = ATMS functionality 3
Priority Rank/Priority % Responded Total MeritG A B C D E F G H I
1 2 3 A*10+B*5+C*1 A / (A+B+C) D*E G (A+B+C)/respondents F*G*H
Importance StrengthWeighted
Importance
1 OP1.2 6 1 · Support 7+ time of day plans NNTE, NNOPS, NNOEM(2), NNPS, FHWA, NNGIS, VDOT 55 86% 48 4 50.0% 96
2 ATMS1.44 7 - Controller Failure Report NNTE,NNOPS, NNOEM, NNPS, FHWA, NNGIS, VDOT 60 100% 60 3 50.0% 90
3 ATMS1.45 7 - Detector Failure Report NNTE,NNOPS, NNOEM, NNPS, FHWA, NNGIS, VDOT 60 100% 60 3 50.0% 90
4 ATMS1.46 7 - Communication Failure Report (Type and Frequency) NNTE,NNOPS, NNOEM, NNPS, FHWA, NNGIS, VDOT 60 100% 60 3 50.0% 90
5 PS1.1 8 1 · Special event schedules?NNTE, FD, NNPS, HRPDC, NNOPS, NNGIS, VDOT,HRT(2), NNEM 75 89% 67 2 64.3% 87
6 PS1.2 8 1 · Road closure notification?NNTE, FD, NNPS, HRPDC, NNOPS(2), NNGIS, VDOT,HRT, NNEM 75 89% 67 2 64.3% 87
7 OP1.1 5 2 Wireless remote access connectivity with central to upload/download timing changesNNOPS, NNOEM, NNPS, NNTE(2), FHWA(2), NNGIS,VDOT 55 71% 40 4 50.0% 80
8 ATMS1.27 6 2 · Paging system for alerts and/or alarm levels?NNTE, NNOPS, NNOEM, NNPS, FHWA(2), NNGIS, VDOT,HRT(2) 60 75% 45 3 57.1% 78
9 ATMS1.28 6 2 · Transit/emergency vehicle priority system functionality?NNTE, NNOPS, NNOEM, NNPS, FHWA(2), NNGIS, VDOT,HRT(2) 60 75% 45 3 57.1% 78
10 ATMS1.03 6 1 · Vehicle count data acquisition? NNTE, NNOPS(2), NNPS, HRPDC, FHWA, NNGIS, VDOT 55 86% 48 3 50.0% 72
11 ATMS1.04 6 1 - For use with congestion management plan? NNOPS(2), NNPS, HRPDC, FHWA, NNGIS, VDOT 55 86% 48 3 50.0% 72
12 ATMS1.26 6 1· Modification or regrouping of intersections into different subgroups for timing controlboundaries by time of day, scheduler initiation, or user intervention? NNTE, NNOPS, NNOEM, NNPS, FHWA, NNGIS, VDOT(2) 55 86% 48 3 50.0% 72
13 ATMS1.30 6 1 · Traffic responsive/adaptive operations? NNTE, NNOPS, NNOEM, NNPS, FHWA(2), NNGIS, VDOT 55 86% 48 3 50.0% 72
14 ATMS1.31 6 1 · Pedestrian crossing equipment – countdown, audible, etc.? NNTE, NNOPS, NNOEM, NNPS, FHWA(2), NNGIS, VDOT 55 86% 48 3 50.0% 72
15 ATMS1.43 6 1 - Intersections On-Line Status NNTE, NNOPS, NNOEM, NNPS, FHWA(2), NNGIS, VDOT 55 86% 48 3 50.0% 72
16 PS1.3 7 2 · Construction activities/schedules?NNTE, FD, NNPS, HRPDC, NNOPS(2), NNGIS, VDOT,HRT(2), NNEM 70 78% 55 2 64.3% 71
17 OP1.3 5 1 1 · Maintain at least two operation centersNNTE, NNOPS, NNOEM(2), NNPS, FHWA(3), NNGIS,VDOT 46 71% 33 4 50.0% 66
18 OP1.4 5 1 · Emergency pre-emption NNTE, NNOPS, NNPS, FHWA(2), NNGIS, VDOT 45 83% 38 4 42.9% 66
19 ATMS1.14 5 2 · Expanded traffic signal system coverage?NNOPS, NNOEM, NNPS, NNTE(2), FHWA(2), NNGIS,VDOT 55 71% 40 3 50.0% 60
20 ATMS1.25 5 2 · Ability to visually verify reported equipment malfunctions?NNOPS, NNTE(2), NNOEM, NNPS, FHWA(2), NNGIS,VDOT 55 71% 40 3 50.0% 60
21 ATMS1.29 5 3· Central system open interfaces for exchanging information with other agencies? (i.e.VDOT, 511, Hampton, etc.)
NNTE, NNOPS(2), NNOEM, NNPS(2), FHWA, NNGIS,VDOT, HRT(2) 55 63% 35 3 57.1% 60
22 ATMS1.39 5 2 - System DelayNNOPS, NNOEM, NNPS, HRPDC, NNTE(2), FHWA(2),NNGIS, 55 71% 40 3 50.0% 60
23 PS1.5 6 3 · Congestion alerts?NNTE, NNPS, FD(2), HRPDC, NNOPS(2), NNGIS, VDOT,NNEM, HRT(2) 65 67% 44 2 64.3% 57
24 ATMS1.11 5 1 · GIS-based map? NNOPS, NNOEM, NNPW, NNPS, FHWA(3), VDOT 51 83% 43 3 42.9% 56
25 ATMS1.34 5 1 1 · Reduced equipment maintenance costs?NNOPS, NNTE(2), NNOEM, NNPS, FHWA(3), NNGIS,VDOT 51 71% 37 3 50.0% 56
Weighted Importance
Survey Question Who needs it?
1 = Must have it;2 = Would be nice to have;3 = Don’t need/not a priority
Importance Ranking

Newport News Signal System Feasibility Study
April 2006 Page 26 of 125
Table 4 Continued: Newport News Survey Summary
Priority Rank/Priority % Responded Total MeritG A B C D E F G H I
1 2 3 A*10+B*5+C*1 A / (A+B+C) D*E G (A+B+C)/respondents F*G*H
Importance Strength WeightedImportance
Weighted Importance
Survey Question Who needs it?
Importance Ranking
26 ATMS1.29 4 3· Central system open interfaces for exchanging information with other agencies? (i.e.VDOT, 511, Hampton, etc.)
NNOPS(2), NNOEM, NNPS(2), FHWA, NNGIS, VDOT,HRT(2) 55 57% 32 3 53.8% 52
27 ATMS1.6 4 3 1 · Replace in-pavement loop detectors with video or other non-intrusive detectors?NNOPS, NNOEM, NNPW(2), NNPS, HRPDC(2), FHWA(2),NNGIS, VDOT(3) 56 50% 28 3 61.5% 52
28 PS1.5 5 3 · Congestion alerts?NNPS, FD(2), HRPDC, NNOPS(2), NNGIS, VDOT, NNEM,HRT(2) 65 63% 41 2 61.5% 51
29 ATMS1.35 4 2 · More efficient use of available operations and maintenance staff? NNOPS, NNOEM, NNPS, FHWA(2), NNGIS, VDOT(2) 50 67% 34 3 46.2% 48
30 ATMS1.37 4 2 - Phase Utilization NNOPS, NNOEM, NNPS, FHWA(2), NNGIS, VDOT(2) 50 67% 34 3 46.2% 48
31 ATMS1.38 4 2 - # of Stops NNOPS, NNOEM NNPS, FHWA(2), NNGIS, VDOT(2) 50 67% 34 3 46.2% 48
32 ATMS1.42 4 2 - Current Pattern/Performance Level Report NNOPS, NNOEM(2), NNPS, FHWA(2), NNGIS, VDOT 50 67% 34 3 46.2% 48
33 ATMS1.47 4 2 - Software emulation of graphic display of field controller front panel diagnostics? NNOPS, NNOEM(2), NNPS, FHWA(2), NNGIS, VDOT 50 67% 34 3 46.2% 48
34 ATMS1.7 4 2 · Traffic surveillance capability? NNOPS, NNOEM, NNPS, FHWA(2), NNGIS, VDOT(2) 50 67% 34 3 46.2% 48
35 ATMS1.8 4 2 · Integration with local police Computer-Aided-Dispatch (CAD) data? NNOPS, NNOEM, NNPS, FHWA(2), NNGIS, VDOT(2) 50 67% 34 3 46.2% 48
36 PS1.6 5 2 1 · Emergency maintenance notification?FD, NNPS, HRPDC, NNOPS(2), NNGIS, VDOT, HRT(2),NNEM(3) 61 63% 39 2 61.5% 48
37 ATMS1.10 4 1 1 · Better graphical user interface? NNOPS, NNOEM, NNPS, FHWA(3), NNGIS, VDOT(2) 46 67% 31 3 46.2% 43
38 ATMS1.51 4 1 o Communication infrastructure/equipment NNOPS, NNPS, FHWA(2), NNGIS, VDOT 45 80% 36 3 38.5% 42
39 ATMS1.52 4 1 o Local controller NNOPS, NNPS, FHWA(2), NNGIS, VDOT 45 80% 36 3 38.5% 42
40 ATMS1.53 4 1 o Master controller NNOPS, NNPS, FHWA(2), NNGIS, VDOT 45 80% 36 3 38.5% 42
41 ATMS1.54 4 1 o Communication systems/technologies NNOPS, NNPS, FHWA(2), NNGIS, VDOT 45 80% 36 3 38.5% 42
42 ATMS1.58 4 1 o Conflict Monitor Alarm NNOPS, NNPS, FHWA(2), NNGIS, VDOT 45 80% 36 3 38.5% 42
43 ATMS1.33 4 2 · Reduced dependency on any leased line operational costs? NNOPS(3), NNOEM, NNPS, FHWA(3), NNGIS, VDOT 42 67% 28 3 46.2% 39
44 ATMS1.5 4 - For use with highway performance monitoring system? NNPS, HRPDC, FHWA, NNGIS, VDOT 40 100% 40 3 30.8% 37
45 IT1.3 6 4· Emergency pre-emption operational guidelines and equipment maintenance/fundingrequirements?
NNOPS(2), NNOEM, STC(2), NNIT, NNPS, HRPDC(2),FHWA(2), NNGIS, VDOT, HRT 80 60% 48 1 76.9% 37
46 IT1.5 6 4 · Various levels of security clearance?NNOPS, NNOEM, STC, NNIT(2), NNPS, HRPDC(2),FHWA(2), NNGIS, VDOT, HRT(2) 80 60% 48 1 76.9% 37
47 PS1.4 4 3 1 · Incidents in other neighboring localities?FD(2), NNPS(2), HRPDC, NNOPS(3), NNGIS, VDOT,HRT(2), NNEM 56 50% 28 2 61.5% 35
48 ATMS1.9 3 3 1 · Integrated flood/weather detection?NNOPS(3), NNOEM, NNPW(2), NNPS, FHWA(2), NNGIS,VDOT(2) 46 43% 20 3 53.8% 33
49 ATMS1.17 3 3 · Integrated timing coordination with adjacent agencies? NNOPS(2), NNOEM, NNPS(2), FHWA(2), NNGIS, VDOT 45 50% 23 3 46.2% 32
Newport News Signal System Feasibility Study
April 2006 Page 27 of 125
Table 4 Continued: Newport News Survey Summary
50 ATMS1.21 3 3 · Importance of single controller cabinet family throughout the City? NNOPS, NNOEM(2), NNPS, FHWA(2), NNGIS, VDOT(2) 45 50% 23 3 46.2% 32
51 ATMS1.23 3 3 · Enhanced login security credential system (i.e. security FOB) NNOPS(2), NNOEM, NNPS, FHWA(2), NNGIS, VDOT(2) 45 50% 23 3 46.2% 32
52 ATMS1.24 3 3 · Support GPS unit inputs for local time-based coordination? NNOPS(2), NNOEM, NNPS, FHWA(2), NNGIS, VDOT(2) 45 50% 23 3 46.2% 32
53 ATMS1.1 3 2 1 · Increase number of time-of-day plans? NNOPS(2), NNOEM, NNPS, FHWA(2), NNGIS, VDOT(3) 41 50% 21 3 46.2% 30
54 ATMS1.18 3 2 1· TOC center-to-center, or field controller-to-field controller coordination betweenagencies? NNOPS(3), NNOEM, NNPS(2), FHWA(2), NNGIS, VDOT 41 50% 21 3 46.2% 30
55 ATMS1.15 3 2 · Upload/download to/from controllers with Synchro? NNOPS, NNPS, FHWA(2), NNGIS, VDOT(2) 40 60% 24 3 38.5% 28
56 ATMS1.16 3 2 · Upload/download to/from independent count boards? NNOPS, NNPS, FHWA(2), NNGIS, VDOT(2) 40 60% 24 3 38.5% 28
57 ATMS1.22 3 2 · Capability to monitor signal heads? (i.e. lamp or LEDs are burnt out) NNOPS(2), NNPS, FHWA(2), NNGIS, VDOT 40 60% 24 3 38.5% 28
58 ATMS1.49 3 2 - Local controller NNOPS, NNPS(2), FHWA(2), NNGIS, VDOT 40 60% 24 3 38.5% 28
59 ATMS1.50 3 2 - Master controller NNOPS, NNPS(2), FHWA(2), NNGIS, VDOT 40 60% 24 3 38.5% 28
60 ATMS1.57 3 2 -Faulty Detectors NNOPS, NNPS, FHWA(2), NNGIS, VDOT(2) 40 60% 24 3 38.5% 28
61 ATMS1.32 3 1 2 · Parking Management system? NNOPS(3), NNOEM(2), NNPS, FHWA(3), NNGIS, VDOT 37 50% 19 3 46.2% 27
62 IT1.1 5 3 1 · Shared funding agreements between agencies?NNOEM, STC(2), NNIT(2), NNPS, NNPDC, FHWA(2),NNNGIS, HRT, NNOPS(3) 66 56% 37 1 69.2% 26
63 ATMS1.36 3 1 · Measures of effectiveness NNOEM, NNPS, NNGIS, VDOT(2) 35 75% 27 3 30.8% 25
64 ATMS1.55 3 1 - Controller Hang-Up Test NNOPS, NNPS, FHWA(2), NNGIS 35 75% 27 3 30.8% 25
65 ATMS1.56 3 1 - Out-of-Step Test NNOPS, NNPS, FHWA(2), NNGIS 35 75% 27 3 30.8% 25
66 ATMS1.59 3 1 - Database Verification NNOPS, NNPS, FHWA(2), NNGIS 35 75% 27 3 30.8% 25
67 ATMS1.40 3 - Others?NNPS(Time delays: pedestrian and bicycle use),HRPDC(volumes/peaks), NNGIS 30 100% 30 3 23.1% 21
68 ATMS1.41 3 · Reporting NNOEM, NNPS, NNGIS 30 100% 30 3 23.1% 21
69 ATMS1.19 2 4 1· Importance of having a single vendor controller platform throughout the City vs.matching other agencies’ equipment?
NNOPS(3), NNOEM, NNPS(2), FHWA(2), NNGIS, VDOT(2),HRT(2) 41 29% 12 3 53.8% 20
70 ATMS1.20 2 3 · Replacement of existing controller cabinets? NNOPS, NNPS(2), FHWA(2), NNGIS, VDOT(2) 35 40% 14 3 38.5% 17
71 ATMS1.2 2 2 2 · Support school flashers? NNOPS(2), NNOEM(2), NNPS, FHWA(3), NNGIS, VDOT(3) 32 33% 11 3 46.2% 16
72 ATMS1.12 2 - ESRI-based? NNPW, NNGIS 20 100% 20 3 15.4% 10
73 IT1.4 2 4 2 · Shared maintenance agreements?NNOPS(3), NNOEM, STC(3), NNPS, HRPDC, FHWA(2),NNGIS, HRT(2) 42 25% 11 1 61.5% 7
75 ATMS1.48 1 - Other Reports --- Please List NNGIS 10 100% 10 3 7.7% 3
76 ATMS1.60 1 · Others? NNOPS(request comm cable connection between Jefferson andWarwick for alternate access if cable is broken) 10 100% 10 3 7.7% 3
Priority Rank/Priority % Responded Total MeritG A B C D E F G H I
1 2 3 A*10+B*5+C*1 A / (A+B+C) D*E G (A+B+C)/respondents F*G*H
Importance StrengthWeighted
Importance
Weighted Importance
Survey Question Who needs it?
Importance Ranking

Newport News Signal System Feasibility Study
April 2006 Page 28 of 125
4.0 Proposed System Concept of OperationsUsing the mission statement and the regional Intelligent Transportation Systems(ITS) vision as guidelines, a system concept was developed to satisfy the identifiedneeds for ATMS deployments in the City of Newport News. The City currentlyhas the ability to manage traffic operations from two separate locations: City Hall,and the Traffic Operations facility off of Oyster Point Road and Operations Drive.Redundant operations capabilities are envisioned to remain in effect with theproposed system upgrades.
With the addition of approximately 5 to 10 new traffic signals per year, by the year2010, it is anticipated that the current number of signals that the city will beresponsible for maintaining will increase from 254 to approximately 280intersections. This includes locations where signals do not currently exist but areexpected to be constructed and in operation by the time the system is completed.A new traffic signal central system with expanded capabilities and peripheral ITScomponents will serve to meet the needs of the City as well as the region.Expanded capabilities will focus on the replacement of outdated field controllersalong with the addition of equipment to support additional planned ITS elements.With the Emergency Operation Center’s (EOC) close proximity to the TrafficOperations facility, integration with public safety can be more easilyaccomplished. This will be especially useful since the survey results indicate asignificant desire for sharing information with public safety staff regardingconstruction activities/schedules, road closures, special event schedules, and visualverification of incidents. The system infrastructure and operations will be expectedto support regional incident management functions.
Overall, the primary scope of responsibilities for the signal and systemmanagement staff at the city will not change dramatically. However, between“coming up to speed” on new equipment, being responsible for an expandedgeographic coverage, and being involved in an increasingly active coordinatedincident response program, the training and operations for the new system willrequire some changes and learning for the staff.
Deployment of additional ITS devices will support the City’s ITS goals. Forexample, CCTV cameras can provide improved congestion information andincident verification allowing traffic management and public safety staff to makemore informed traffic management and public safety responses. Strategicallydeployed dynamic message signs (DMS) can relay information to the public aboutthe state of the transportation network. Flood detection and road closure systemsallow for automated road closures due to high water on roadways that are prone toperiodic flooding. ITS elements will be discussed in further details within thesubsequent ITS Master Plan reports.
4.1 Proposed OperationsStakeholders in the City of Newport News identified operational goals for theirtraffic management system. Some of these operational requirements will drive

Newport News Signal System Feasibility Study
April 2006 Page 29 of 125
specific staffing needs for the system. The specific set of functions desired by theCity of Newport News includes:
• Traffic signals and traffic control;• Enhanced traffic and system monitoring;• Enhanced reporting and alarm alerting;• Incident management;• Special event management;• Coordination and collaboration with other agencies; and• Information gathering and dissemination.
A key operational characteristic that affects each of these functions is the hours ofoperation of the system. While many large urban freeway operations centers arestaffed 24 hours per day seven days per week, it is not envisioned that continuousoperations are needed in Newport News at this time. However, given the currentemployment centers within the City, the peak hours are naturally extending. Earlypeak period traffic volumes are generated by Northrop Grumman shipbuilding atthe southern end of the City and Fort Eustis Army Facility at the northern Citylimits. Furthermore, more dense office developments are occurring in the CityCenter and Denbigh areas of the City, which causes expanded peak periods for thenormal 8-5 commuter. An evaluation of key major intersection including JeffersonAvenue at Fort Eustis Boulevard, Oyster Point Road, J. Clyde Morris Boulevard,Mercury Boulevard and Warwick Boulevard at Denbigh Boulevard, BlandBoulevard and Mercury Boulevard identified the A.M. peak hour from 7:00 to8:00 A.M and the PM peak hour from 4:30 to 5:30 P.M. If these peak hourrepresent the highest demand period at 100% the adjacent half hour periods form abell curve around both peak periods. Currently the hours of operation cover allperiods with a 65% range of the peak period. Given these trends, consideration isrecommended to be given to expanding hours for traffic operations in the form ofshifts. One option could be that certain employees work 7:00 a.m. to 4:00 p.m.and others work 9:00 a.m. to 6:00 p.m., which expands the coverage of operationsby two hours without adding to the overall staff. As traffic demands lengthen evenmore in the future demands in excess of 80% if the peak period occur beyondstandard operating hours, shifts should be adjusted by ½ to one hour increments toallow greater coverage.
If the City of Newport News’ STC becomes a more integral part of the emergencyoperations center/911 dispatch that operates 24 hours per day, it may be reasonableat that time to have a traffic representative present at all times or for extendedhours in the morning and evening. This person could respond to incidents bymodifying traffic control schemes and disseminating information to the public andmedia during off-hours based upon pre-arranged standard operating procedures. Ata minimum, the Transportation Division is envisioned to be a clearinghouse forlocal incident data and construction/ maintenance/special event schedules for otherCity departments. The culmination of this flow of information is documented inthe System Architecture in Section 5.0.

Newport News Signal System Feasibility Study
April 2006 Page 30 of 125
Supplementing this information with regional incident data from VDOT’sHampton Roads STC, the Transportation Division is envisioned to supply thisinformation to the City EOC and Public Safety dispatch center, Newport NewsPublic Schools Pupil Transporation, and the Public Works departments. Directaccess to HRT and Newport News Public School is envisioned to provide access toAVL information provided from the respective buses. HRT, in accordance with theRegional ITS Architecture, will receive incident data from the VDOT HRSTC.Therefore, a separate dedicated link is not envisioned to supply this information toHRT, but instead to make it available to all by submitting it to the VDOT HRSTC.Incident data will be shared internally with Public Schools and Public Safety, andmay be posted via the City GIS mapping division.Through a series of signal projects that will upgrade the controller units,restructure communication links, and establish flexible boundaries of existing andnew systems, the City of Newport News will improve signal coordination andtraffic progression.Coordination projects with VDOT’s Hampton Roads Smart Traffic Center inconjunction with the Monitor-Merrimac Memorial Bridge Tunnel operations willenable the City of Newport News to better control and manage traffic takingalternate/diversion routes through the city.Dynamic message signs can be deployed to alert and advise motorists whether tostay on the interstate or exit onto arterial diversion routes and other key decisionpoints throughout the city. CCTV cameras installed in the area will allow CitySTC staff to visually verify congestion conditions and provide improved travelerinformation, particularly associated with known high accident locations andinterstate diversion plan (IDP) routes.CCTV and DMS positioned around the city will facilitate incident management aswell as special event management. With improved incident detection andmonitoring capabilities more accurate information can be provided to travelers.Improved signal system communications will provide the opportunity to adjustsignal timing plans remotely for a severe incident and especially for special eventmanagement because advance notice can ensure a structured implementation ofalternate timing plans. Additional communication infrastructure will also allowcurrent system boundaries to be extended and extend diversion route to keydecision points rather than be limited based on the current system limitations.
The existing City Hall STC is already capable of receiving video feeds fromVDOT’s Hampton Roads STC, and it is anticipated that the planned CCTVcameras within the City of Newport News will be shared with the VDOT STC andemergency services so that dispatchers can make more informed decisions aboutthe most appropriate equipment to route to the scene of an incident, where video isavailable.

Newport News Signal System Feasibility Study
April 2006 Page 31 of 125
4.2 Proposed StaffingBased on conversations with the steering committee, it is not anticipated that thecity will hire additional staff to operate and maintain the system immediately.Therefore, it will be important that the new system be capable of enhancing userproductivity and reducing maintenance issues. Although no new positions will beallocated initially, following recommendations are offered related to future staffingand staff responsibilities:
• Plan to hire one or more signal technicians over the next 5 years.Typically, a ratio of 30:1 for the number of signals maintained by one traffictechnician is considered to be good, as stated in the ITE Traffic Installation andMaintenance Manual (1989).1 Currently, the city is operating in a range ofabout a 35:1 ratio. Given the projected rate of increase in number ofintersections added to the city inventory, one additional technician will allowthe city to maintain its current ratio. If the position is not filled, this ratio willrise to about 40:1. If the staff was expanded by two technicians, the futureoperating ratio would be closer to 31:1 within five years.
• Plan to hire one engineer and two engineering technicians over the next 5years. CMAQ on-call consultants are currently supplying an annual equivalentof 1 1/2 engineers to update the signal timings within a three year cycle.Furthermore, the expanded signal system coverage and distributed system willallow for greater flexibility in timing plan development along with additionalefforts to coordinate with neighboring Cities and Counties. In addition, therewill be an added demand for implementing ITS device locations andfunctioning as the city clearing house for incident data for other city agencieswill place an additional load on existing staff.
• A back-up staffing option is recommended to be created to fill in for timeswhen the signal system analyst is not available. With remote access options inthis day and age, times are rare when a staff member is completely unavailable;however, these times are not entirely impossible. When a staff member isunavailable and an incident or emergency situation arises, it would bebeneficial for someone else to be capable of implementing system changes toresponse to public needs. It is recommended that training and role assignmentsbe put in place so a city or VDOT staff person may have adequate knowledgeof the system functionality to perform tasks that would be useful in an incidentsituation, such as implementing pre-planned timing plans.
4.3 Proposed TrainingThe most significant short term training needs for implementation of the newsystem will be as follows:
• Staff training to enable the signal crew, the operations supervisor, and thetraffic engineers and technicians to operate and maintain the new controllerhardware and software.
1 Institute of Transportation Engineers, ITE Traffic Instillation & Maintenance Manual, Washington, D.C.,U.S. Printing Office, 1989.
Newport News Signal System Feasibility Study
April 2006 Page 32 of 125
• Staff training to enable the City of Newport News operations and maintenancestaff to maintain and repair future fiber-optic communications cable plant.
• Staff training to enable the traffic engineer, engineering technicians, the trafficoperations supervisor and technicians, and appropriate VDOT Hampton RoadsSTC staff to operate the new system traffic control software.
• Staff training to enable the signal crew, and the signal system supervisor tomaintain and repair the ITS field equipment proposed for use in this system(i.e. CCTV, DMS, flood sensor/warning systems, etc.).
• Staff training to enable the engineering technicians, the traffic operationssupervisor, the traffic engineer, appropriate VDOT Hampton Roads STC staffto operate the new CCTV subsystem.
• Staff training to enable the signal system analyst and appropriate cityinformation technology staff to operate and maintain the local area network(LAN) access points that will be used to support interconnection of someportions of the signal system.
Based on current discussions among the steering committee, it is anticipated thatthe City of Newport News Traffic Operations staff will be responsible formaintenance of the proposed communications plant with the aforementionedtraining.
4.4 Proposed Inter-Agency CoordinationAs proposed based on input from steering members and stakeholders, the City ofNewport News will be charged with maintaining all signals within their city limits.To improve signal coordination across boundaries with the City of Hampton andVDOT-administered county roads, the proposed signal system upgrades wouldallow agencies to share timing plan changes with one another in real-time.Additionally, based upon the regional Interstate Diversion Plan report prepared forthe Hampton Roads Smart Traffic Center, pre-existing routes through the City ofNewport News have been identified by interstate segment (i.e. betweeninterchanges) to re-route motorists in the event of major incidents and/or interstateclosures along I-64 and I-664. Upon notification from the State Police via theHampton Roads STC, the proposed system would allow timing plans to be appliedacross traditional closed-loop system boundaries, and become seamless to themotorist. This allows the arterial streets to handle the abnormal congestioncondition more effectively.Similarly, Newport News Computer-Aided-Dispatch (CAD) would notify theDepartment of Engineering, other Departments including Public Schools andPublic Works, the VDOT STC, and Hampton Roads Transit of managed incidentsin progress. This will minimize the amount of time each agency spends on thephone providing or obtaining situation updates. 911 CAD dispatchers would haveaccess to CCTV video images, particularly for diversion corridors and highaccident locations to assist in verifying incidents and the severity.

Newport News Signal System Feasibility Study
April 2006 Page 33 of 125
4.5 Proposed Incident and Emergency ManagementIn support of the regional ITS architecture, as updated within the Hampton Roads– ITS Strategic Plan 2004 (by PB Farradyne), the proposed system shall facilitatea higher level of coordination to respond to incidents, both local and regional innature.2 A key area of need identified by many of the stakeholder respondentsinvolves visual verification of incidents, congestion, and special event conditions.From an operations standpoint, the CCTV subsystem will aid in this effort. CCTVviewing should be available to City staff within both operations facilities (CityHall STC and Traffic Operations STC), as well as VDOT STC staff, City ofHampton Traffic Engineering, and the Newport News EOC/911 dispatch centerstaff. In addition, as part of the regional traffic management operations, viewing orstill-frame capabilities may be extended to other groups/agencies through a third-party provider such as VDOT’s Statewide Video Distribution System contractor,or by way of the city’s own website. Control of the CCTV will be limited to Citystaff within both operations facilities (City Hall STC and Traffic Operations STC).
In addition, it is recommended that remote access to the signal system from theCity of Hampton STC be available in at least a view only mode, allowing incidentmanagers from the Hampton STC to be aware of the actual timing plans inoperation during an incident or special event. This will entail some level of stafftraining for Hampton STC staff in order to be able to perform cursory functions toview the system graphics and timing plan in effect. This will be particularly usefulalong key interconnecting corridors such as J. Clyde Morris, Harpersville/Hampton Roads Center Parkway, and Mercury Boulevard.No-notice events may call upon many of the same aspects of evacuation andincident management planning, but under much different circumstances. A no-notice event, such as a terrorist attack or sudden disaster (e.g. reservoir break ortunnel flooding), may call upon the need to allow the City of Hampton STC tohave full-access to the City of Newport News signal system in the event that boththe City Hall STC and the Traffic Operations STC are incapacitated, or simplydisconnected from portions of the field communication network. The City ofNewport News would need to provide approval to allow the City of Hampton tohave full-access.
Due to limited staff and hours of operation (not 24x7x365), it is envisioned that thecity would enter into an agreement with the VDOT Hampton Roads STC to allowoperation of dynamic message signs throughout the city under establishedcircumstances, provided that appropriate staff at the City are also notified of theincident during normal hours of operation, or first thing the morning after anovernight incident.
2 PB Farradyne, ITS Strategic Plan, Virginia Department of Transportation - Hampton Roads PlanningDistrict Commission, April/May 2004.

Newport News Signal System Feasibility Study
April 2006 Page 34 of 125
4.6 MaintenanceIn addition to the staff training needs discussed above, the new system will includetwo additional changes that will impact maintenance. One will be the likelyinclusion of fiber optic communications cables in addition to, or in place of, theexisting twisted pair cables. With the potential for acquiring some fiber capacityfrom the Citywide Information Technology access points that have been madeavailable through arrangements with the Newport News Public Schools (NNPS), itmay also be possible to outsource fiber cable maintenance to a common contractorfor both NNPS and Department of Engineering’s cables. Access and maintenanceprotocols are recommended to be developed in accordance with other agreementsthat have been commenced between City departments and are recommended to bereferenced as part of any new municipal agreements developed for this project.A second change involves the increased reporting capability of the vast majority ofadvanced traffic signal system software packages. With the added reportingcapabilities, “repair” phone calls between Operations and Engineering inestablishing a daily or weekly punch-list of repairs can be significantly reduced, ifnot avoided altogether. Routine maintenance is not anticipated to greatly changewith the proposed system upgrades. Over a period of time, it is proposed to replaceexisting painted signal poles and cabinets with the stainless steel brushed-finishedinstallations to match more recent intersection deployments, which will alleviatethe need to keep up with any re-painting activities once completed.
4.7 Traveler InformationCurrently, VDOT has an internet site for traveler information. Thewww.511virginia.org website provides travelers with information regardingconstruction and incidents on state roads. As part of the system upgrade, it isrecommended that protocols and/or training be put in place so that incidentsidentified by City of Newport News staff can be reported to the VDOT HamptonRoads STC staff for upload into the 511 database or that Newport News staffdirectly post information to this site. The VDOT Hampton Roads STC (HRSTC)has been deemed the repository for the Regional Multi-Modal information System(RMMS). Currently, the Virginia Operational Information System (VOIS)platform is the data entry system for documenting road conditions and incidents onVDOT-managed roads.
This information could be further enhanced by integrating the local police, fire andrescue computer-aided-dispatch (CAD) system to export incident data for use inpopulating many of the fields that provide incident data to the public by way of theRMMS and the VDOT HRSTC. It is envisioned that, similar to the current manualfiltering process by STC staff for data from the Virginia State Police (VSP), thelocal CAD data would be filtered by HRSTC staff prior to populating the VOISdatabase for subsequent inclusion into the 511 database. VDOT currently performsautomated filtering based upon VSP “10 codes”, which are used to quicklydistinguish for example between freeway incidents versus robberies, domesticincidents, and other issues that typically do not affect transportation networks. A
Newport News Signal System Feasibility Study
April 2006 Page 35 of 125
similar integration is envisioned to reduce the amount of manual filteringnecessary to supply useful information to 511 and the traveling public.
Additionally, traveler information consists of congestion information. With morerobust information supplied by an upgraded signal system, the city will be able toestimate travel times along key corridors (Jefferson Avenue and WarwickBoulevard) with system detectors as well as with automatic vehicle location (AVL)information supplied by Newport News Public School buses, Hampton RoadsTransit (HRT) buses, as well as local police/fire/rescue vehicles throughout thecity.
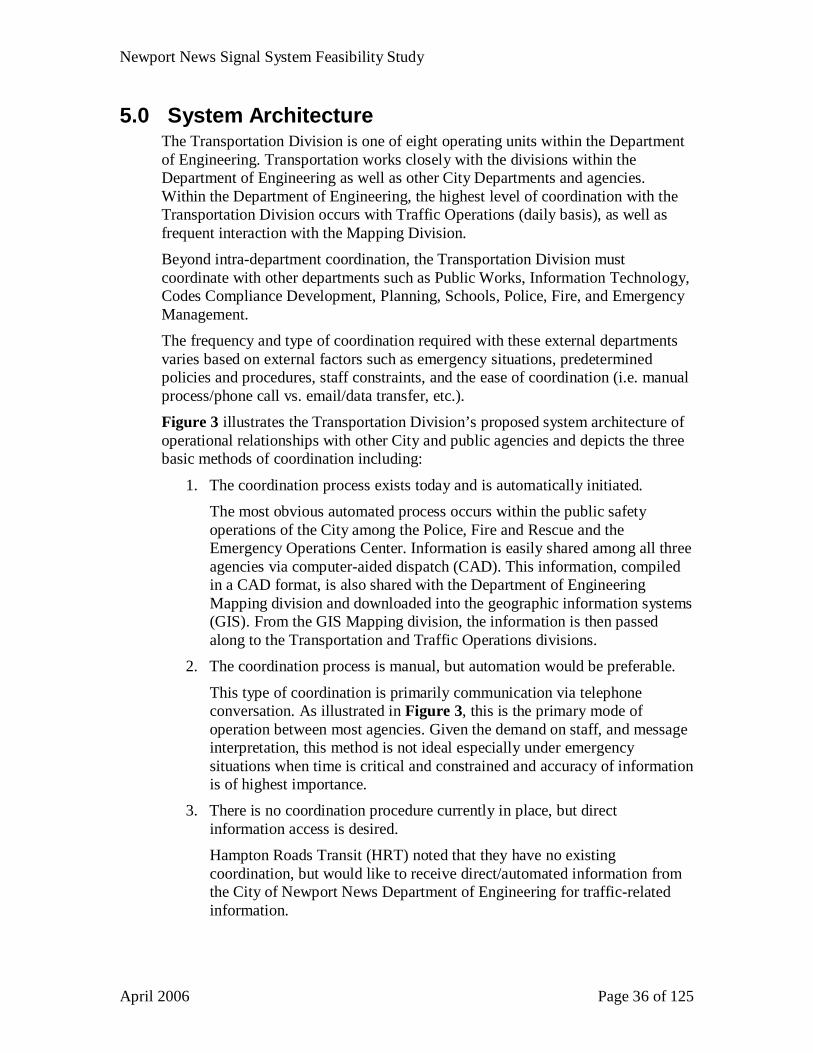
Newport News Signal System Feasibility Study
April 2006 Page 36 of 125
5.0 System ArchitectureThe Transportation Division is one of eight operating units within the Departmentof Engineering. Transportation works closely with the divisions within theDepartment of Engineering as well as other City Departments and agencies.Within the Department of Engineering, the highest level of coordination with theTransportation Division occurs with Traffic Operations (daily basis), as well asfrequent interaction with the Mapping Division.Beyond intra-department coordination, the Transportation Division mustcoordinate with other departments such as Public Works, Information Technology,Codes Compliance Development, Planning, Schools, Police, Fire, and EmergencyManagement.The frequency and type of coordination required with these external departmentsvaries based on external factors such as emergency situations, predeterminedpolicies and procedures, staff constraints, and the ease of coordination (i.e. manualprocess/phone call vs. email/data transfer, etc.).Figure 3 illustrates the Transportation Division’s proposed system architecture ofoperational relationships with other City and public agencies and depicts the threebasic methods of coordination including:
1. The coordination process exists today and is automatically initiated.The most obvious automated process occurs within the public safetyoperations of the City among the Police, Fire and Rescue and theEmergency Operations Center. Information is easily shared among all threeagencies via computer-aided dispatch (CAD). This information, compiledin a CAD format, is also shared with the Department of EngineeringMapping division and downloaded into the geographic information systems(GIS). From the GIS Mapping division, the information is then passedalong to the Transportation and Traffic Operations divisions.
2. The coordination process is manual, but automation would be preferable.
This type of coordination is primarily communication via telephoneconversation. As illustrated in Figure 3, this is the primary mode ofoperation between most agencies. Given the demand on staff, and messageinterpretation, this method is not ideal especially under emergencysituations when time is critical and constrained and accuracy of informationis of highest importance.
3. There is no coordination procedure currently in place, but directinformation access is desired.Hampton Roads Transit (HRT) noted that they have no existingcoordination, but would like to receive direct/automated information fromthe City of Newport News Department of Engineering for traffic-relatedinformation.

Newport News Signal System Feasibility Study
April 2006 Page 37 of 125
Figure 3 - Newport News Transportation Division System Architecture

Newport News Signal System Feasibility Study
April 2006 Page 38 of 125
6.0 Technology Evaluation and Recommendations
6.1 Traffic Control StrategiesThe basic traffic control modes are common across all signal system platforms andvendors. There are subtle differences between vendors in the way coordination isimplemented, which has made standardization of these parameters difficult, but from atraffic engineering standpoint they function similarly. Larger differences arise in theimplementation of more advanced features such as traffic-responsive and traffic adaptivecontrol. This section describes the six main operational modes of traffic controllers: flash,manual, free operation, time base control, traffic-responsive and traffic adaptive.
6.1.1 FlashAn intersection on flash can operate as an all-way stop (all directions flash red) or a stopon side streets only (side streets flash red, main streets flash yellow). This makes thesignal act as an all-way or two-way stop. Flash operation is often used in remote or lowtraffic areas during non-peak periods. New signal installations also employ flash for aperiod of time to allow motorists to safely adjust to the presence of a signal.
6.1.2 ManualUnder this mode, a single timing plan with fixed green times and clearance intervals isused unless manually changed by an operator. Manual mode is typically used underspecific event conditions particularly adjacent to parking areas.
6.1.3 Free OperationAlso known as non-coordinated, under free mode each intersection runs independently,without a fixed cycle length, as each movement responds to demand. An intersection mustbe fully actuated or semi-actuated (side street and left-turn lanes) to operate in free mode.This is most appropriate for isolated intersections where arrivals are essentially random orwhere volume is low.
6.1.4 Time Base ControlIn time base control (TBC), each intersection in a group operates on a common cyclelength with offsets set relative to a common time base to allow for coordination. Grouptiming plans are generated using historical traffic counts to differentiate variations intraffic patterns throughout the day. This is also known as time-of-day/day-of-week controlas separate timing plans are typically generated and applied for morning and afternoonpeak periods, off-peak weekdays, and weekends and holidays. Within TBC, additionalgreen time during the cycle can be reallocated to actuated non-coordinated phases.Various types of software determine which phases receive this additional green time. Thismay include skipping or shortening protected left turns or side street green time in a givencycle.
Before the advent of closed-loop systems, intersections would lose their synchronizationover time as their internal clocks drifted. On-street master controllers served to keep a

Newport News Signal System Feasibility Study
April 2006 Page 39 of 125
group of intersections on a common time base. In modern systems, central software canserve this purpose by broadcasting the correct time to all controllers at regular intervals.
6.1.5 Traffic ResponsiveTraffic Responsive Plan Selection (TRPS) originated in the US in the 1970’s as part of theFederal Highway Administration (FHWA) Urban Traffic Control System (UTCS)software. There are variations between vendors in how this is implemented, but the basicpremise is that the system selects from a library of available timing plans based on apattern-matching algorithm from system detector volume and occupancy measurements(v+k·o, where k is a parameter to be set). TRPS has the potential to be responsive toprevailing traffic patterns if they deviate from historical patterns while always running off-line developed, agency-approved timing plans. However, the difficulties are in setting upthe algorithm to select the appropriate timing plans from the appropriate system detectormeasurements and in being responsive to traffic patterns while not being overly volatile.In order to achieve this, the sampling period over which detector measurements are takenhas to be short enough to be responsive to traffic but long enough so as not to respond torandom events that will have passed by the time a new timing plan is initiated. In addition,it is well understood that delays are often imposed by transitions between timing plans soit is important that any timing plan change be warranted in order to justify thecoordination deficiency during the transition period. Currently, Newport News transitionsbetween four and eight times between depending on the system. Given the capabilities ofthe new ATMS with system detectors and additional cycle lengths, it is anticipated thattraffic responsive plans may transition between five and fifteen times a day depending onthe demand of the system.
There are two ways that traffic responsive operation could be implemented. It could be aninsurance policy against significant temporary shifts in demand. For example, if anincident on the freeway shifts traffic to signalized streets, the typical time of day plancould be inappropriate. In these cases, traffic-responsive control could potentially act morequickly than traffic engineers to select an appropriate timing plan.
Another way traffic responsive operation could be implemented is as a proactive measureto transition between time-of-day plans at the appropriate time. For example, if there is asudden change in the weather or some other event that causes a shortened work day orschool closings, traffic-responsive control could prompt a transition from an off-peaktiming plan to a peak period timing plan sooner than normal. Or, if school is delayed dueto weather or a power outage, the morning peak could last longer than normal. As statedpreviously, the difficulty with this approach is in being responsive without being overlyvolatile (It must be noted that TRPS implementations have features that limit the amountof switching between timing plans). Furthermore, agencies have reported that forrobustness, it is best to maintain a limited number of timing plans from which a trafficresponsive algorithm can choose.3
3 Abbas, M., et al., Methodology for Determination of Optimal Traffic Responsive Plan Selection ControlParameters, Texas Department of Transportation, Report 0-4421-1, February 2004.

Newport News Signal System Feasibility Study
April 2006 Page 40 of 125
For each of these applications, however, the effectiveness of traffic-responsive operationis dependent upon the number and location of system detectors, the reliability of thosedetectors, and the way in which the pattern matching criteria are set. Setting parameters istypically done in an ad hoc way or through traffic simulation software.
Unfortunately, based on the references consulted for this report, there are no knownmethodologies for conducting cost-benefit analyses of traffic-responsive operation overtime base control.4
6.1.6 Traffic AdaptiveTraffic adaptive is not a standardized term in the industry and can mean different things todifferent people. Usually, however, it has been used to refer to more specialized andadvanced systems that use algorithms to make near-continual real-time signal timingadjustments in response to demand. In contrast to TBC or TRPS, adaptive controlalgorithms do not have timing plans, per se. Rather they continually “adapt” to trafficpatterns in finer increments by redistributing green times between the phases at individualintersections, switching offsets at multiple intersections to reverse the direction ofprogression along an arterial, or raising or lowering the group cycle time in response tochanges in demand. At any given time, the “timing plan” in effect is unique and able tochange at any time. As a result, they are not prone to the effects of timing plan “ageing.”In order to maintain coordination between intersections, cycle time and offsetdeterminations are made for an entire group rather than for individual intersections.
Examples of adaptive systems of this type are SCOOT, which was developed in the UKand is sold by Siemens in the US; RHODES, developed by the University of Arizona andGardner Transportation Systems and subsequently a Siemens product after its purchase ofGardner a few years ago; SCATS, which was developed in Australia and is sold byTranscore in the US; and the RT-TRACS family of systems which includes OPAC andRTACL, which are sold by PB Farradyne as add-ons to its MIST system.
While detector needs vary among systems, they typically require detectors 10-15 secondsof drive time upstream of the stop bar at every approach to estimate queue lengths. Thesedetectors typically require low bandwidth second-by-second communication with thecentral software to continually optimize signal timings. By FHWA estimates, for US-based adaptive systems (RHODES, OPAC, RTACL), costs for the controller,communication and detection components costs between $10,000 to $40,000 perintersection, depending on the field configuration. Maintenance costs are estimated at$1,000 per year per intersection compared with $5,000 per intersection for retiming everythree years.5
Traffic adaptive systems are far more common in Europe and Australia than in the US.This is probably due mostly to the fact that they originated there. For many years, evenwhile SCOOT and SCATS— the most mature systems— were sold in the US, the expertise
4 Gordon, R., Systems Engineering Processes for Developing Traffic Signal Systems, NCHRP Synthesis 307,Transportation Research Board, Washington, D.C., 2003.5 Adaptive Control Software, Federal Highway Administration, Publication HRTS-04-037. 2004.

Newport News Signal System Feasibility Study
April 2006 Page 41 of 125
to install, maintain and fine-tune these systems still resided many time zones away, addingto their initial and ongoing costs. The US entry to the adaptive market was initiated by theresearch arm of the US DOT in the 1990’s with RT-TRACS. These systems have beendeployed in pilot projects, and found to improve upon optimized fixed time plans, buthave not been deployed in large numbers. SCOOT and SCATS have been thoroughlystudied in simulations and in the field and have been shown to provide benefits over goodtime base plans in many different environments. However, adaptive control has not beenwidely accepted by the traffic engineering community in the US for a number of reasons.Among the more widely cited reasons are:
• Training, staffing, maintenance, and expertise needs are higher, and more thanagencies can typically provide
• Adaptive systems are risky because they are non-conventional and likely to bescrutinized
• Measured benefits do not justify the added initial and operating expense• The technology is still not widely understood and support can usually only come from
the vendor• In many instances, it is believed that adaptive control is not well suited to the specific
site or application given the predictable nature of the traffic patterns of the surroundland uses.
In short, it comes down to a belief that the benefits do not justify the higher costs— bothcapital and operations costs. System calibration is expensive and time consuming, andmore detectors are needed, which need to be kept in good working order. Furthermore,there is a good deal of risk to an agency that chooses to go against conventional practicesas there is likely to be additional scrutiny from public officials. Facing these barriers, mostagencies that have considered adaptive control have concluded that their resources arebetter spent on fine tuning time-of-day plans and retiming signals more often.
6.2 Traffic signal controller and cabinet optionsFor an agency upgrading its traffic signal system, the selection of traffic signal controllerand cabinet technology is the foundation for the rest of the system. Historically, cabinetstandards were developed in conjunction with controller standards, but there are caseswhere controllers are backward compatible with older cabinet standards. This section willpresent the main features of the four main controller platform standards:
• NEMA TS-1• 170 (Caltrans/NYSDOT)• NEMA TS-2 Types 1 and 2• 2070 (multiple varieties)
Table 5 lists the different cabinet standards and their compatible controllers

Newport News Signal System Feasibility Study
April 2006 Page 42 of 125
Table 5 - Compatible Controllers and Cabinets Pairings
Controller Cabinet(s)NEMA TS-1 NEMA TS-1NEMA TS-2 Type 1 NEMA TS-2NEMA TS-2 Type 2 NEMA TS-1170 Caltrans 33x (e.g., 332, 334, 336)2070 All of the above
ITS cabinet
The NEMA TS-1 standard has been replaced by the TS-2 standard, but many agencies stillhave TS-1 cabinets and can opt to purchase a more modern controller that is backwardcompatible to avoid the expense of replacing the cabinets. Note that the 2070 can bemated with any cabinet type. In this section, each of these controller platforms ispresented.
6.2.1 NEMA TS-1In 1976, the NEMA developed the TS-1 standard for solid state, actuated traffic signalcontrollers. The controller, a self-contained unit housing both hardware and softwareproduced by a single manufacturer, specifies the pins on three connections – the A, B andC connectors – and allows manufacturers to add an additional feature on a fourth Dconnector. The TS-1 standard also laid out a universally-accepted nomenclature foractuated controllers, defined the functionality of cabinet components, and set a standardfor interchangeability of cabinet components between manufacturers. A TS-1 cabinet hasshelf-mounted components (a power supply, detector amplifiers, and a conflict monitor)and connections to field units that terminate at a back plane with plug-in load switches.Figure 4 identifies the base layout of a NEMA TS-1 cabinet Figure 5 is a photograph of aTS-1 cabinet.

Newport News Signal System Feasibility Study
April 2006 Page 43 of 125
Figure 4 - NEMA TS-1 Layout Figure 5 - Photograph of TS-1 Cabinet

Newport News Signal System Feasibility Study
April 2006 Page 44 of 125
6.2.2 Model 170The model 170 family of controllers is based on a specification originally developed byFHWA and the California and New York Departments of Transportation (Caltrans andNYSDOT, respectively) around the same time as the development of the NEMA TS-1standard. This specification provides a rigid definition of controller, cabinet, and cabinetcomponents, including materials, form factors, and functionality. The 2002 TransportationElectrical Equipment Specification (TEES) has become the de facto standard for the 170family of equipment, although many jurisdictions have modified the specifications tobetter suit their needs. Multiple vendors exist for Model 170 controllers, cabinets andcomponents, several of which make both specification equipment and equipment withenhanced, albeit proprietary, functionality. Both Caltrans and NYSDOT maintain aQualified Products List (QPL) for traffic signal equipment, which provides a reference ofhardware that has been found to be compliant with Caltrans or NYSDOT 170specifications, respectively.
A key distinction between the 170 family of equipment and the NEMA family is that thecontroller firmware is provided separately from the hardware. The firmware is suppliedeither on a memory chip to be installed on the CPU module or on a removable PROMmodule, and only needs to adhere to the hardware constraints (memory addressing,communication port addressing, pin addressing, etc.) in order to drive the equipmentconnected to a 170 cabinet. Firmware for 170 controllers is provided by two vendors: BITran Systems and Wapiti. Caltrans, the City of Los Angeles and NYSDOT have in-housedeveloped firmware as well.
A cabinet specification was developed to house the 170 controller. The components ofthese cabinets are rack-mounted in a 19” equipment rack and include a 170 controller, apower supply, a conflict monitor, an input file (plug-in rack chassis for the installation ofdetector amplifiers and/or other field input peripherals), and an output file (a plug chassisfor switch packs to drive signal heads). The 1992 TEES includes specifications for threestandard cabinet sizes: 332, 334 and 336. These vary by their size and the number ofinputs and outputs, which limits the number of vehicle and pedestrian phases they canaccommodate. Cabinet inputs and outputs are mapped via software and not hard-wired.
Motorola has ceased production of the 8-bit chip from the 6800 family that was originallyused in the CPU of the 170 controller. However, vendors have replaced the 6800 chip withthe HC-11 chip and made the necessary modifications to their hardware and software.This has allowed the 170 to remain on the market. The end of the life of the 170 line hasbeen anticipated for many years though many large agencies continue to use it. Controllerswith this new chip are referred to as 170E controllers.

Newport News Signal System Feasibility Study
April 2006 Page 45 of 125
Figure 6 - Model 170 Cabinet Architecture

Newport News Signal System Feasibility Study
April 2006 Page 46 of 125
Figure 7 - Model 170 Cabinet Configurations (Source: 1989 Caltrans TSCES)

Newport News Signal System Feasibility Study
April 2006 Page 47 of 125
Figure 8 - Model 170 Cabinet and Controller (Source: Safetran)
6.2.3 NEMA TS-2The NEMA TS-2 specification was published in 1992 to improve upon the TS-1. TheNEMA TS-2 incorporates more modern technology to improve redundancy, diagnosticsand interchangeability between vendors. This section highlights some of the moreimportant improvements of the TS-2 over the TS-1.
• Updated technology and improved simplicity. The most noticeable difference is thereplacement of the A, B, C and D connectors with a single serial data link connector(SDLC). This provides greater flexibility to communicate with cabinet components.The four connectors on the TS-1 were pin-based, meaning each pin served a specificlimited function. Any additional functionality had to be provided through amanufacturer-specific D connector, which limited interchangeability. The SDLCconnector provides two-way communication with cabinet components simplifiescabinet wiring and eliminates the manufacturer-specific D connector, improvinginterchangeability. Detectors in TS-2 cabinets are rack-mounted, which provides asingle interface with the cabinet for the entire rack. Simplification also results inimproved reliably and diagnostics.

Newport News Signal System Feasibility Study
April 2006 Page 48 of 125
• Improved standardization. The TS-2 specifies coordination, preemption, time basecontrol and automatic flash operation more fully than TS-1. Removal of the Dconnector improves standardization of cabinet connections.
• Improved redundancy. In TS-1 cabinets, a conflict monitor served to ensure no twoconflicting phases showed green at the same time. The TS-2 standard replaces thiswith a malfunction management unit (MMU), which is more advanced and improvesredundancy. The MMU communicates continuously with the controller and eitherdevice can put an intersection into flash mode if there are any discrepancies.
• Improved diagnostics. The improved wiring simplicity through the use of serialconnections improves cabinet diagnostics and troubleshooting. In addition, the TS-2specifies self-test routines and verification of load switch performance for thecontroller and MMU. Furthermore, detector health is also continuously monitored bythe controller by checking for no activity, maximum presence and erratic output.When detectors fail in a TS-2 cabinet, the controller can place a constant call (as if avehicle were always present) and log the failure, preventing “entrapment” where anactuated phase is never served even when a vehicle is waiting.
• Backward compatibility. TS-2 Type 1 controllers are designed to use the SDLCconnector to interface with a TS-2 cabinet. Controllers conforming to anotherspecification called TS-2 Type 2 have the TS-1 type A, B, C and D connectors tointerface with a TS-1 cabinet. Of course, this limits the enhanced functionality of theTS-2 specification, but makes for backward compatibility with existing TS-1 cabinets.
The NEMA TS-2 Type 1 cabinet is shown in Figure 9 and the configuration is identifiedin Figure 10. Figure 10 also illustrates the Type 2 configuration.

Newport News Signal System Feasibility Study
April 2006 Page 49 of 125
Figure 9 - NEMA TS-2 Type 1 Cabinet

Newport News Signal System Feasibility Study
April 2006 Page 50 of 125
Figure 10 - NEMA TS-2 Type 1 (Left) and Type 2 (Right)(Source: Econolite)

Newport News Signal System Feasibility Study
April 2006 Page 51 of 125
6.2.4 Caltrans 2070By the late 1980s and early 1990s, Caltrans began development of a controllerplatform to succeed the 170. At the same time, FHWA began development of theNational Transportation Communications for ITS Protocol (NTCIP), a commonIntelligent Transportation Systems (ITS) communications protocol to promoteinterchangeability and interoperability between field devices and trafficmanagement centers. The emergence of ITS created the need for a controller withmore power and applications than existing standards afforded.
The result was the model 2070 controller, a diagram of which is shown in Figure11. The 2070 utilizes a 32-bit processor, five high speed communications ports anda real-time multitasking operating system (OS-9). The 2070 is a hardwarespecification only so it shares the primary benefit of the 170— that the software canbe purchased separately from the hardware— thus avoiding vendor lock-in forhardware. The 2070 improves upon the 170 by allowing enhanced processingpower, the ability to program in higher level languages such as C, multiple highspeed communications ports, and compatibility with NEMA TS-1, NEMA TS-2and 170-style cabinets.
The 2070 controller is highly modular. Different capabilities can be provided bythe appropriate selection of modules as seen in Table 7. The standard ensures anymodule can be replaced with the same module from another manufacturer. A mainchassis holds a processor card, a communications module, a field I/O unit and apower supply. A NEMA interface with A, B, C and D connectors can be used toretrofit 2070s into NEMA TS-1 cabinets. An SDLC module can be included tointerface with NEMA TS-2 cabinets. Tables 2 and 3 present the different modulesand configurations defined by Caltrans for the 2070. As with the 170, Caltransmaintains a QPL for 2070 controllers and modules.
A VME bus chassis can be added to accommodate the installation of multiple fielddevices in a single controller. VME stands for Versa-Module Europe, and is basedon the old Motorola VersaBus design, as standardized by the Institute of Electricaland Electronic Engineers (IEEE). Siemens uses an additional processor toimplement the RHODES adaptive signal control software. Originally, thatadditional processor was based on an Intel Pentium, which meant that the Motorola68360 chip and the Pentium were able to share the same memory and otherresources. An additional processor might also be used for video detection, forexample. However, the VME bus chassis is an expensive component, adding asmuch as $1000 to the cost of the controller as it also requires a more powerful(2070-1A) primary processor and power supply (2070-4A). Because its applicationis limited to multiprocessing, it is an option in the 2070 specification. A 2070without the VME bus chassis is called a 2070 Lite, or 2070L. The variety ofcontroller configurations is listed in Table 6.

Newport News Signal System Feasibility Study
April 2006 Page 52 of 125
Figure 11 - 2070 Chassis Front and Rear View (Source: TEES, August 16, 2002)

Newport News Signal System Feasibility Study
April 2006 Page 53 of 125
Table 6 - 2070 ATC Varieties (Source: Caltrans 2002 TEES)Unit Version Description2070V With VME Chassis. Mates to 170 and ITS cabinets2070L LITE Unit. Mates to 170 and ITS cabinets2070LC LITE Unit. Mates to ITS cabinets only2070V N1 With VME Chassis. Mates to TS-1 cabinets2070V N2 With VME Chassis. Mates to TS-2 Type 1 cabinets2070L N1 LITE Unit. Mates to TS-1 cabinets2070L N2 LITE Unit. Mates to TS-2 Type 1 cabinets
Table 7 - 2070 ATC Controller Configurations (Source: Caltrans 2002 TEES)
Module Description
2070
V
2070
L
2070
LC
2070
(V/L
) N1
2070
(V/L
) N2
Unit Chassis X X X X X2070-1A Two Board CPU X Xa Xa
2070-1B One Board CPU X X Xa Xa
2070-2A Field I/O for 170 Cabinet X Xb
2070-2B Field I/O for ITS Cabinet/NEMA TS-2 Xb X X2070-N Field I/O Module X2070-3A 4x40 Front Panel Display X2070-3B 8x40 Front Panel Display X X X2070-3C Blank Front Panel X X2070-4A 10 Amp Power Supply X Xc Xc
2070-4B 3.5 Amp Power Supply Xc Xc
2070-4N (A or B) NEMA TS-1/TS-2 Power Supply X X2070-5 VME Cage Assembly X Xd Xd
2070-8 Field I/O Module Xa - 2070V N1 and N2 have the 2070-1A CPU Module, 2070L N1 and N2 have the 2070-1B CPU Moduleb - 2070L has 2070-2A if mated with 170 cabinet, 2070-2B if mated with ITS or NEMA cabinetc - 2070-4B if mated with ITS cabinetd - 2070-5 VME Cage Assembly needed for 2070V N1 or N2
One criticism of the 2070 specification is that it is still undergoing modification.However, it appears to have stabilized over the past several years and earlyadopters have worked out some of the problems with different vendorinterpretations of unspecified portions of the standard. Currently, the latest-referenced Caltrans specification is the August 16, 2002 TEES available on thefollowing website: http://www.dot.ca.gov/hq/traffops/elecsys/reports/TEES.pdf.
An ITS cabinet has been developed for the 2070 and future Advanced TrafficController (ATC), which is planned to be its successor when the standard iscompleted. While the ATC and corresponding application programming interface(API) specifications are still in the early development stage, the ITS cabinet is inuse in a few jurisdictions. Though the ITS cabinet standard may yet undergo

Newport News Signal System Feasibility Study
April 2006 Page 54 of 125
changes before it is finalized, the Caltrans TEES has a specification for it andCaltrans lists two vendors on the QPL. The ITS cabinet combines the diagnosticand serial bus features of the TS-2 cabinet with the rack-mount structure of 170-style 33x cabinets. It comes in three different sizes at present, the largest of whichis as tall as a 33x cabinet, but twice as wide with two racks side-by-side.
The following figures show the 2070 in various configurations. Figure 12 showsthe empty main chassis, with optional VME chassis inside. Figure 13 shows the2070 with NEMA interface for mating with a TS-1 cabinet. As can be seen in thepicture on the right, the chassis gets its power from the NEMA “A” connector via aduplex receptacle mounted on the NEMA module. Note also the connectionbetween the NEMA interface and the 2070-2B Field I/O Module. Figure 14 showsthe 2070 without the NEMA interface. This variation has a VME bus as indicatedby the inclusion of the more powerful 2070-1A VME processor. It also is designedto interface with a 170-style cabinet as indicated by a 2070-2A Field I/O module.
Figure 12 - Empty 2070 with VME chassis (rear view)

Newport News Signal System Feasibility Study
April 2006 Page 55 of 125
Figure 13 - 2070L N1, front (Left) and rear (Right) view
Figure 14 - 2070 with VME bus, front (Left) and rear (Right) view

Newport News Signal System Feasibility Study
April 2006 Page 56 of 125
6.2.5 Platform ComparisonTable 8 below compares and contrasts key features of the previously describedcabinet and controller equipment. All prices are budgetary in nature and arepresented primarily for comparison purposes.
Table 8 - Comparison of Controller Platform Features
NEMA TS-1 Model 170Shelf-mounted components Rack-mounted componentsController hardware and software bundled Controller hardware and software separateLatitude in specifications allows manufacturerinnovation (e.g., menu driven LCD displays)
Rigid hardware specification including 8 bitprocessor
A, B, and C connector pins definedConflict monitorEnvironmental specifications of cabinet andequipment specified
Environmental specifications of cabinet andequipment specified
Cabinets delivered preconfigured to customerordered phasing and actuation requirements
Cabinet hardware modular
Inputs and outputs hardwired Cabinet inputs and hardware configured insoftware
Controller: $1,200-$1,400 Controller (including software): $1,000-$1,300Cabinet: $4,800-$7,600 Cabinet: $4,500-$7,000NEMA TS-2 2070Shelf-mounted components, rack-mounteddetectors
Rack-mounted components
Controller hardware and software bundled Controller hardware and software separateLatitude in specifications allows manufacturerinnovation (e.g., menu driven LCD displays)
Rigid hardware specification including 32 bitprocessor
Serial communications via SDLC port Communications adaptable to cabinet selectedMalfunction Management UnitEnvironmental specifications of cabinet andequipment specified
Environmental specifications of cabinet andequipment specified
Cabinet hardware modular Cabinet hardware depends on cabinet selectedInputs and outputs configured in software Inputs and outputs depend on cabinet selectedController:$1,400-$1,800 (Type 2)$1,500-$1,800 (Type 1)
Controller (including software):$3,000-$4,000 (Lite)$4,500-$7,000 (Full)
Cabinet/Controller: $5,500-$8,200 ITS Cabinet: $10,000 (ITS)

Newport News Signal System Feasibility Study
April 2006 Page 57 of 125
Planning Cost EstimatesPlatform Controller CabinetNEMA TS-1 $1,200-$1,400 $4,800-$7,600Model 170 $1,000-$1,300 $4,500-$7,000
NEMA TS-2 $1,400-$1,800 (Type 2)$1,500-$1,800 (Type 1) $5,500-$8,200
2070 $3,000-$4,000 (Lite)$4,500-$7,000 (Full)
See above$10,000 (ITS)
6.3 Other ITS TechnologiesIn addition to controller technologies, other Intelligent Transportation Systems(ITS) technologies are sometimes used for arterial traffic control. Thesetechnologies can be used to provide traveler information or to support real-timetraffic operations. Unlike freeway ITS applications, traffic signal operators havemuch more ability to influence traffic patterns to respond to incidents and non-recurrent congestion. Some of the more commonly used ITS technologies areClosed Circuit Television (CCTV) cameras, Dynamic Message Signs (DMS) andtraffic sensors used as “system detectors” in traffic control parlance.
6.3.1 Closed Circuit Television (CCTV) CamerasField equipment for a CCTV installation generally consists of a camera, motorizedzoom lens, environmental enclosure, pan/tilt mechanism, local camera controllerfor field control, encoder, pole or other mounting structure, lightning and surgesuppression devices, and a cabinet to house the ground-mounted equipment.Cameras on the market today include the lens, enclosure, and pan/tilt mechanismin a single unit.
CCTV components housed in the cabinet generally include the following:
• Camera Control Receiver (CCR): In cameras on the market today, CCRs areintegrated into the pan-tilt-zoom unit. However, for some older cameras, CCRsare designed to be installed in the cabinet and can be rack mounted or shelfmounted. Under both circumstances the central system hardware and softwaremust be compatible to communicate using the same protocol.
• Communication device: A device is needed to convert the video signal andpan-tilt-zoom control commands for transmission over communications lines.Clearly, this depends on the communications architecture. Typicalcommunication devices are a modem for wire type communications, a videooptical transceiver for analog communications over fiber, a wireless modem forradio control applications, or an Internet Protocol (IP) video encoder forEthernet communications to the cabinet.
• Cabinet grounding system• Backup power system/Uninterruptible Power Supplies• Power service interface

Newport News Signal System Feasibility Study
April 2006 Page 58 of 125
• Surge and lightning protection for all conductors entering the cabinet includingelectric service, communications, video and control signals.
• Transformers (if required) may also reside in the cabinet in order to convert tovoltages required for the CCTV equipment.
Figure 15 shows a photo of a sample cabinet with a local camera controller. The170E controller and input cards above are for two loop detectors and are unrelatedto the camera. The local camera controller is the black box. Below that is thepower interface and below that is the fiber interface.
Figure 15 - A sample 170 cabinet with local camera controller.

Newport News Signal System Feasibility Study
April 2006 Page 59 of 125
Three prominent manufacturers of CCTV cameras for traffic monitoring are Cohu,Pelco, and Vicon. These three vendors have supplied cameras to major trafficmanagement centers nationwide including VDOT Northern Virginia District,Minnesota Guidestar, and San Antonio Transguide, just to name a few. Due to thecompetitive nature of the marketplace, the main features of their latest vendorofferings are very comparable. Each of these manufacturers offers the capability tocommunicate via a competitor’s proprietary protocol, either by setting a Dual In-line Package (DIP) switch on the camera or with an optional translator card. Thisdiscussion of features draws heavily from what is currently on the market. Anycamera that meets or exceeds these specifications is acceptable:
• Digital signal processing (DSP) technology• 22x optical zoom and 10x digital zoom, with automatic or manual focus• Resolution of 470 Horizontal Television Lines (HTVL)• Ability to see in low light conditions• Positioning to 0.1° accuracy• 360° continuous rotation• Up to 64 user-defined preset positions, each with a 24-character title• Eight programmable tours with 32 steps per tour• Programmable privacy zones• NEMA-TS2 temperature and power compliance• Multi-manufacturer protocol control
Until a few years ago, most cameras were analog, producing good quality imagesat an affordable price. However, the introduction of Digital Signal Processing(DSP) has increased both the flexibility of using cameras while enhancing thequality of the color images produced. At the heart of DSP lies computermicrochips, or “chip sets” which have replaced the conventional integrated circuitsin the camera head. This enables DSP camera manufacturers to offer installerfriendly, feature-rich products. DSP cameras generally offer more consistentpicture quality than their analog counterparts, operating over a wider range oflighting conditions. They also may include features such as remote set-up andcontrol using a serial data link, built-in character generator and on-screen menus.
For transportation applications, enclosures are typically sealed and pressurizedwith dry nitrogen to keep moisture and contaminants out of the housing andprevent condensation from appearing on the lens and interior of the housingfaceplate. Many cameras have built-in pressure sensors that can generate alerts ifthe pressure falls below a certain threshold. Other optional environmental featuresof cameras are internal heaters to keep the window clear and free fromcondensation or ice, sunshields to keep sun glare, rain, and snow off the enclosureface plate, and wipers to clear the lens of moisture.
Cameras can be dome or barrel style as seen in Figure 16. Dome cameras enclosethe pan/tilt/zoom mechanism and camera inside a sealed and pressurized domeenclosure. This provides greater protection from the elements and fewer moving

Newport News Signal System Feasibility Study
April 2006 Page 60 of 125
parts but limits the field of vision, i.e., they can not look up. For freewayapplications, this is rarely an issue, but may be a consideration where sitelimitations require a low mounting height and the need to monitor a high flyover.Domes can be surface mounted or pendant mounted. Surface mounted domes canbe mounted on the underside of structures while pendant mounted domes (shownbelow) can be mounted on a pole or vertical surface. Barrel style cameras can bemounted atop a horizontal mounting surface (or a pole) or off of a verticalmounting surface.
Figure 16 - Dome and Barrel Style Cameras
The pan/tilt mechanism on the barrel style camera, though separate from thecamera itself, is typically sold with the camera as a single unit.
The selection of camera is not dependent on the communications infrastructure.Any camera, whether analog or DSP, interfaces with the communicationsinfrastructure via an interface device in the cabinet. For an Ethernet IP-basedcommunications infrastructure, for example, this would be an IP video encoder.While the marketplace is trending toward cameras with embedded encoders, mostcameras on the market today leave the encoder as a separate device. Benefits tokeeping the encoder separate from the camera are:
• It makes the camera simpler and easier to troubleshoot• Encoding/decoding technology is changing far more quickly than camera
technology.• Although video compression technologies conform to standards (e.g., MPEG-
2, MPEG-4), compatibility problems may arise between differentencoder/decoder manufacturers. If this happens, it is easier to swap out anencoder than an entire camera.
• It takes a point of failure out of the camera and puts it on the ground where it iseasier to service.
Compatibility with the National Transportation Communications for ITS Protocol(NTCIP) is available as an option with cameras on the market today, though ittypically requires additional hardware or a custom order with a more powerfulchip. Chips that can handle the overhead that accompanies NTCIP will likely bestandard be with the next generation of cameras set to be introduced in the next

Newport News Signal System Feasibility Study
April 2006 Page 61 of 125
year. That being said, cameras on the market today are able to communicate usingcompetitors’ protocols using translators. As a result, the benefits of vendorinterchangeability promised by NTCIP are already realized.
6.3.2 Dynamic Message Signs (DMS)For DMS, light-emitting diode (LED) display technology has become the industrystandard for new installations. These displays have good visibility, dimmingcapabilities, are reliable and have few moving parts, which reduces the amount ofmaintenance needed. There are three typical types of matrix displays: character,line, and full. Figure 17 shows the differences between the matrix types. Incharacter matrix displays, each character is displayed in its own distinct space in agrid format. Line matrix displays have no physical separation between characterswithin a line of text, but each line is distinct. This allows a narrower font to beused to fit additional characters on a line, if needed, though this reducesreadability. Full matrix displays have no physical separations between individualcharacters or lines in the message. A message can be shown at any size andlocation as long as it is within the display space. In addition, full matrix displayscan show icons or graphics for enhanced readability. Figure 18 shows twoexamples of full-matrix displays. However, these are typically larger signs andmore suitable for freeways where speeds are higher as opposed to arterials.
Figure 17 - DMS Matrix Display Types(Source: Wisconsin DOT ITS Design Manual)
Figure 18 - Examples of full-matrix displays with graphics
In terms of maintenance, walk-in enclosures help protect technicians from theelements. A DMS of this type, designed for freeway applications, can costanywhere from $105,000 to $165,000 depending on the complexities of thelocation, specific characteristics of the sign, and type of installation. Signs forarterials could be cheaper as they typically have fewer lines and smaller text size.

Newport News Signal System Feasibility Study
April 2006 Page 62 of 125
6.3.3 System detector technologiesThere are a number of different types of detector technologies that could be used ina traffic signal system as system detectors. While inductive loop detectors havebeen the dominant type for many years, they are slowly giving way to non-intrusive detectors, which are loosely defined as detectors that cause minimaldisruption to traffic and installation can be done more safely than normalconventional methods. Given the ubiquity of loops, vendors of non-intrusivedetectors invariably offer loop emulators as options. As the name implies, theseconvert the measurements of the detector to the contact closure type interface usedby loops, enabling them to mate with any controller or cabinet.
Historically, the most common type of sensor has been the inductive loop detectorthough this is rapidly changing as technology progresses. A loop refers to a copperwire embedded in the pavement with a current that creates a magnetic field in thespace above the loop so that when a large metal object (i.e., a vehicle) occupiesthis field, a change in the inductance in the wire signifies a vehicle is present. Theloop resides in a rectangular or circular saw cut, typically wound three times toboost signal strength, covered by a sealant to keep out moisture. Loops aretypically 6 feet square and one is required for each lane. Loops can measureoccupancy (the percentage of time the space inside the loop is occupied by avehicle) and volume. If two loops are placed adjacently in the same lane in a “trap”configuration, they can also measure speed. Single loop configurations can notmeasure speed directly, but if an average vehicle length is assumed, speed can beestimated. For locations still installing loops, paired-loop configurations arestandard.
An inductive loop detector site includes the following:
In the ground:• Loops• Junction/pull box• Conduit• Lead-in cable.On the roadside:• Cabinet• Loop detector amplifiers• Controller• ModemA schematic of a typical loop detector site is shown in Figure 19.

Newport News Signal System Feasibility Study
April 2006 Page 63 of 125
Figure 19 - Loop detector schematic
Loop detectors have well-known problems, most notably a short life span. Loopstypically only last three to four years. Pavement freeze-thaw cycles can wreakhavoc on loops, especially when they are not installed properly and moisture isallowed to infiltrate the seal. In addition, resurfacing always requires loopreplacement and maintenance requires a lane closure. Loops also shorten the life ofthe pavement in which they are installed. Despite these problems, they are still themost common form of vehicle detection because they are a mature technology,they are a known quantity for transportation departments, and they work well wheninstalled properly.
In the past ten years or so, non-intrusive detectors have slowly gained traction inthe marketplace as technology has matured. While they present their own set ofdifficulties, they solve some of the most pressing problems that plague loops. Theyare not destroyed during repaving, require minimal disruption to traffic to install orservice, and last longer. Non-intrusive detectors are typically mounted on a pole oroverpass, either in a side fire configuration where one detector can cover multiplelanes, or in a straight-on configuration where each lane requires its own device.Except in tunnels or other locations where space is constrained, devices that cancover multiple lanes are preferable because of the cost savings. Though loops arestill far more common at intersections, non-intrusive detection is the current stateof the practice for new freeway installations.

Newport News Signal System Feasibility Study
April 2006 Page 64 of 125
Examples of non-intrusive detection technology include:• Passive Infrared• Active Infrared• Magnetic• Microwave• Passive Acoustic• Ultrasonic• Passive Infrared / Ultrasonic• Passive Infrared / Ultrasonic / Doppler Radar• VideoWhile it is not possible to provide a detailed assessment of each of thesetechnologies in this document, extensive field evaluations have been donecomparing each of these. As of this writing, the best reference is NIT Phase II:Evaluation of Non-Intrusive Technologies for Traffic Detection, a comprehensivestudy done by the Minnesota Department of Transportation and completed inSeptember 2002. It is freely downloadable from the following web site:http://www.dot.state.mn.us/guidestar/projects/nitd.html. In the State of Virginia,Trichord is using non-intrusive detection systems that operation on wirelesstechnologies with solar energy and battery back-up power.
A typical non-intrusive detector site would include the following components:• Sensor• Mounting bracket• Pole• RS-232/422/485 cable from sensor to cabinet• Pole-mounted cabinet with transformer• Fiber modemA sample schematic of a pole-mounted non-intrusive detector is shown in Figure20. Figure 21 shows pictures of two sensors currently on VDOT right of way.

Newport News Signal System Feasibility Study
April 2006 Page 65 of 125
Figure 20 - Sample Non-intrusive Detector (RTMS Microwave Radar)
Figure 21 - SmarTek SAS-1 Acoustic Sensor (left) and SpeedInfo DVSS-100Doppler Sensor (right)

Newport News Signal System Feasibility Study
April 2006 Page 66 of 125
6.4 Central system alternativesIn the world of traffic signal systems, there is a great deal of similarity betweenvendors in terms of the features offered. This is largely due to the nature of the bidprocess, which is often low-bid. As a result, vendors add missing features as theyappear in RFPs in order to meet the requirements. In order to save costs, agencieswill typically tend toward non-customized system software, which leads them toselect from available known features. The combination of these factors leads to aconvergence of feature sets across the vendors that compete widely for signalprojects. The major software packages on the market today are:
• Siemens Actra• Siemens i2TMS• Naztec Streetwise• Econolite icons• Econolite Pyramids• PB Farradyne MIST• Kimley-Horn KITS
It is often difficult to separate the capabilities of the central system with that of thecontrollers. Central systems are distributed in nature, which means that thecontrollers are self sufficient and run internally stored timing plans— they do notneed the central system to operate normally. Rather, in addition to polling thecontrollers for logs and detector data, displaying real-time status information uponrequest and enabling upload and download of controller parameters, they performsuch central traffic control functions as traffic-responsive timing plan selection andtraffic adaptive algorithms.
That being said, the main differences in system software are in the hardware theysupport. Therefore, as stated at the outset, the first and most important decision isthe selection of cabinet/controller architecture. With that decided, there are centralsoftware options within each subset. These options are presented in Table 9.

Newport News Signal System Feasibility Study
April 2006 Page 67 of 125
Table 9 - Pairing of Central Software with Cabinet/Controller Architecture
Controller Platform Central Software Controller Software
NEMA (TS-2)
Siemens ActraEconolite iconsNaztec StreetwisePB Farradyne MIST
Corresponding vendorfirmware
170
Siemens i2TMSEconolite PyramidsPB Farradyne MISTKimley-Horn KITS
WapitiWapitiBI Tran, WapitiBI Tran, Wapiti
2070
Siemens ActraSiemens i2TMSEconolite iconsEconolite PyramidsNaztec Streetwise
SEPACNextPhaseASCOASISApogee
Appendix F provides a table comparing the features of each of the major softwarepackages.
6.5 Peer ATMS ReviewThe purpose of the peer review was to gain insight and knowledge into state-of-practice for implementing new signal system components and technologies. Thepeer review enables the City of Newport News to learn lessons from peers on theirrecent deployments.
From an initial list of six (6) agencies, the City of Newport News chose thefollowing four (4) peer agencies who had recently implemented new signalsystems to interview:
• The Cities of Burlington-Graham, North Carolina• The City of Charlotte, North Carolina• The City of Clarksville, Tennessee• The County of Okaloosa, Florida
A signal system questionnaire was developed for each agency to complete. (SeeAppendix A for a copy of the questionnaire.) The questionnaire asked for generalinformation and contained questions in five (5) categories: System Information,System Operation, On-Street Features, Management and Maintenance. A copy ofthe completed questionnaire from each agency is included in Appendix C, alongwith a table summarizing the answers. Table 10 below highlights answers toseveral of the key questions.

Newport News Signal System Feasibility Study
April 2006 Page 68 of 125
Table 10 - Summary of Peer Review Questions
Question Burlington-Graham, NC
Charlotte, NC Clarksville, TN Okaloosa Co., FL
Number ofSignals
165 650Approximately 175 signals on thecentralized system. It wasoriginally just the CBD Center CityArea. There are an additional 35remote dial-up closed looplocations that are being broughtinto the centralized system as fiberoptic cable projects are completed.
84 103 signals56 school beacons24 flashing beacons7 emergency signals
Number of Staff 2 Engineers4 Technicians
4 Engineers3 Technicians
1 Engineer6 Technicians
1 Engineer5 Technicians
ControllerType(s)
2070L170
Traconex 390 controllers in TS-1cabinets for most of the dial-uparterials. Econolite ASC/2 2100controllers in TS-2 for CBD area.In the process of replacingTraconex controllers with Eagle2070 controllers using NextPhasefirmware in TS-2 cabinets.
Eagle (M52) 2070 lite controller2070L and 2070LNcontrollersPeek 3000 NEMA

Newport News Signal System Feasibility Study
April 2006 Page 69 of 125
Question Burlington-Graham, NC
Charlotte, NC Clarksville, TN Okaloosa Co., FL
CommunicationSystem
Single ModeFiber w/IFSmodems
A mixture. The majority of it is stillserial communications on twistedpair copper cable. Use time-division multiplexing in the CBDto the controllers from the centralcommunications server. In theprocess of adding fiber optic cableall the way back to the commservers. The dial-up arterials arealso a mix. The older ones usecopper and the newer ones havefiber. Both are serialcommunication. Just aboutcomplete with a system that willuse Ethernet communications onfiber, but have not connected thisyet.
Fiber (GigabitEthernet)
Fiber
Software System Actra Siemens ITS I2 software for thecentralized system and Traconetsoftware for the dial-up arterials
Actra BiTrans QuicNet/4

Newport News Signal System Feasibility Study
April 2006 Page 70 of 125
Question Burlington-Graham, NC
Charlotte, NC Clarksville, TN Okaloosa Co., FL
ITS Elements CCTV - 10 No DMS signs. Now have 50 to 60CCTV cameras in the field. Thehurdles were getting the fiberinstalled, learning the equipmentand maintaining the equipment.
No ITS elements CCTV and VMS – they arestand alone systems.
Remote Control Yes, via laptops We have the ability to access ourarterials remotely since they aredial-up. We currently do not haveremote access to our central systemexcept from our systemsworkroom.
Yes, but do not use it The system has the capability,but hasn’t been implemented.
Coordinationwith others
Neighboring city,Graham has read-only centralsoftware accessand full CCTVaccess
The main TMC has recently beenexpanded to allow the Police tohave an area with their own consoleand video monitors. Worked on thisproject jointly and now share onelarge video switcher. All of ourcameras as well as theirs go to oneplace and are available to eachother. This video is sent to the LawEnforcement Center, our officesand the NCDOT IncidentManagement Control Center . Wealso receive video feeds fromNCDOT.
Do not coordinatewith otherjurisdictions.
Okaloosa does the O&M for allthe cities in the county exceptone, which will come onlinesoon. FDOT has the capabilityto view and make changes tothe system as well.

Newport News Signal System Feasibility Study
April 2006 Page 71 of 125
Question Burlington-Graham, NC
Charlotte, NC Clarksville, TN Okaloosa Co., FL
Problems withSystem
CCTV softwareproblems, somelightning surgeproblems, andremotecommunicationswith signalmonitors isintermittent atbest
Had many problems in the pastwith lightning damage, and thenchanged our installation proceduresfor grounding to be much moreaggressive. Still have somedamage, but not like in the past.Have not had a problem withsoftware crashes.
Experienced somehardware failuresthat caused thesystem to crash inthe beginning, butsince then, therehave been no realproblems.
There are problems with thecontroller firmware: noconditional left-turn function,no TOD exclusive ped function,lagging left turns are notfunctional, in mainline green aprotected left-turn call will notbe recognized unless a sidestreet call exists. Centralsoftware references the oldaddressing of 170programming. There is no helpto speak of, and the windowsdevelopment is not a true GUI.

Newport News Signal System Feasibility Study
April 2006 Page 72 of 125
The peer ATMS review revealed valuable information from four agencies whorecently implemented new signal systems. Although each system differed in scopeand technology, several concepts were linear across the responses. The followingis a summary of the information that is most relevant to the City of Newport News.
The agencies interviewed implemented systems ranging from 84 to 650 signals.Approach to system management varied slightly with most employing 1-2engineers and 4-6 technicians directly involved with system operation. Systemsize did not have a direct correlation to staffing numbers however the largersystems staffed more engineers and fewer technicians.
A wide variety of controllers including NEMA and 2070 equipment were used bythe localities. Three of the four agencies are currently running with mixed fieldequipment including Okaloosa County and Charlotte which are operating bothNEMA and 2070 systems. The availability of spare parts was indicated as a majorweakness when running mixed equipment. Traffic adaptive technologies were notused by any of the agencies, and with Charlotte was the only locality implementinglimited traffic responsive systems.
Fiber was indicated as the predominant and preferred communications medium.Underground and overhead fiber was specified with Clarksville using leased lines.The City of Charlotte is currently working with a mixed communication systemincluding 25 year old twisted pair copper interconnect, and recently deployed fibercable. Fiber provided high reliability for all agencies, but damage due toconstruction and degrading fiber splices noted as the top maintenance concerns.
Siemens was the predominant supplier of central system software. Burlington andClarksville are running Actra while Charlotte uses ITS I2. Siemens was indicatedas having a positive track record, ability to adapt to shifting technology, andsufficient staff. Burlington indicated that Actra provided proven field softwarethat matched well with the central system. Okaloosa County is running BiTransQuicNet, which address 170 programming (i.e. backward compatibility). TheCounty indicated that the system does not operate on a true graphical user interface(GUI).
The limitations of system procurement under low bid state regulations was listedas a concern by agencies interviewed. Three of the four agencies used low bidmethods to secure their systems, and Burlington was the only locality going overbudget. Frustration was indicated in terms of lengthy decision making due to stateand federal approval. Charlotte had a piecemeal implementation with controllers,central servers, and fiber being installed by different projects. Sole source and allinclusive procurement were listed as methods to improve system procurement.
ITS elements were implemented by three agencies with CCTV being the firstpriority followed by DMS. Okaloosa indicated that these systems were standalone. Charlotte experienced issues with learning and maintaining the equipment,
Newport News Signal System Feasibility Study
April 2006 Page 73 of 125
which included approximately 60 CCTV cameras. Additional cameras were listedas potential expansion priorities for two of the interviewed agencies.
Most agencies responded that they coordinate with State DOTs for informationsharing particularly video images. Sharing system data with law enforcement wasalso indicated. Coordinating signal timings across jurisdictional boundaries wasnot done in the two independent cities interviewed (Charlotte and Clarksville).
Remote access capabilities are available on all four systems, but limited use wasindicated. Burlington provides each engineer and technician with a laptopequipped to remotely access the system.
System problems were minimal for most agencies. Lightning surges were listed byboth Burlington and Charlotte as their top concerns. Revised groundingprocedures reduced the level of damage experienced during surges. Okaloosaindicated controller firmware problems with the 2070L and 2070LN controllersincluding conditional left-turn functions and pedestrian functions. Limitedtechnical support was provided by the vendor to correct these problems. CCTVissues included learning curves for operation and maintenance as well as softwareintegration and configuration problems.
The four agencies interviewed successfully implemented new signal systems withvarying size and complexity. Although the technologies differed, the desiredfunctionality was achieved in each locality.
Based on the inputs received from the Peer Review the following policies arerecommended to be considered for the City of Newport News.
• Select a Citywide cabinet and controller. While this limits the city’s ability tonegotiate equipment cost, it will provide a greater flexibility for procuringand/or acquiring spare parts and allow easier maintenance for the Operationsstaff on a daily basis.
• Consider an alternative design / construction procedure, which would allowthe city to procure the equipment from a sole source. This alternative suggeststhat a minimum of three vendors develop a test bed environment and allow thecity to have a hands on evaluation process, prior to selecting a particularhardware/software platform

Newport News Signal System Feasibility Study
April 2006 Page 74 of 125
6.6 Preliminary Technology Recommendations
6.6.1 A Note Regarding On-Street Master ControllersCurrently, Newport News has 27 on-street master controllers for its deployment of250+ intersection controllers. Master controllers serve to monitor groups ofintersections providing status monitoring, data collection, time synchronizationand traffic-responsive control for the intersections in the group.
Central systems on the market today serve the same purposes as the on-streetmasters. However, in addition to the obvious user interface benefits of PC-basedsoftware, central systems offer flexibility in how intersections are assigned togroups since it is done in software and independent of communications channels.This allows system boundaries to be changed by time of day to adapt to prevailingtraffic conditions. In addition, the quantity of field equipment is reduced byeliminating on-street masters thereby reducing capital and operating costs.Therefore, provided all intersections have communications with the central system,on-street masters will not be required as part of the ATMS.
6.6.2 A Note Regarding InterchangeabilityInterchangeability has largely been an elusive goal for the traffic signal industry.NEMA controllers have long had proprietary features to set them apart fromcompetitors and have communicated using proprietary protocols. As a result,vendors were able to lock-in customers to their products. This has also been truewith central software packages used to manage signal systems. With fewexceptions, these software packages require controllers by the same vendor torealize their full functionality. The 170 and 2070 standards have separatedcontroller software from the controller hardware, but the central software vendorstill needs to be paired with the controller software vendor for full functionality.
The National Transportation Communications for ITS Protocol (NTCIP) effortsought to provide true interchangeability. The hope of the NTCIP was to ensure allNEMA controllers were interchangeable, helping agencies to avoid the vendorlock-in that was common in the industry. However, the development of the NTCIPhas been rife with challenges and to date, even with a second version approved inMarch 2005, only a subset of controller features are mandatory by the protocol, thecommunications overhead stretches the limits of low bandwidth deployments, andmany in the industry believe it has not yet achieved the objectives for which it wasdeveloped. For a new system, it is far better to pair controllers and software thatcan realize all the features of the controllers. For the most part, this means pairingcontrollers and software from the same manufacturer, although there are somecentral systems that work with multiple controller types. These include Siemens’Actra and PB Farradyne’s MIST system, which can be paired with Eagle andEconolite controllers without the NTCIP.

Newport News Signal System Feasibility Study
April 2006 Page 75 of 125
6.6.3 Scenario A: Retain Existing Cabinets and Upgrade ControllersAll of the cabinets and controllers in Newport News are NEMA TS-1, a standardwhich was succeeded by the TS-2 in 1992 for the reasons mentioned previously.The cheapest and simplest option for Newport News would be to retain all existingcabinets and upgrade the TS-1 controllers to TS-2 Type 2 models. This optionwould afford some of the benefits of the TS-2 standard, including the redundancyand monitoring capabilities of the MMU, but the phasing assignments are hard-wired in the cabinet. From a maintenance standpoint, technicians are familiar withthe existing TS-1 cabinets, but future cabinets would have to be TS-2, whichwould create a heterogeneous system. Not only would this require technicians tobe able to troubleshoot both types of cabinets, spare parts for both cabinet typeswould be needed.
Based on an estimate of 275 controllers at $1,800 each, the total hardware cost forthis option is $495,000. The pros and cons of this approach are summarized inTable 11. The costs are listed inTable 12.
Table 11 - Scenario A Pros and Cons
Pros ConsSignificant cost savings Intersection phasing assignments are
hard-wired in the cabinetAllows gradual migration to TS-2 More difficult to diagnose problems than
TS-2Some benefits of TS-2 could be realized(use of MMU for redundancy)
Future intersections would have TS-2cabinets, which would introduce twodifferent cabinet configurations and theproblems this introduces (moremaintenance expertise needed, largerspare parts inventory, etc.)The TS-1 standard is already out of dateGrowth/expansion for other ITS (CCTV,etc.) limited by the cabinet size
Table 12 - Scenario A Estimated Costs
Count UnitCost Cost
Controllers 275 $1,800 $495,000
Cabinets 0 - -
Total $495,000
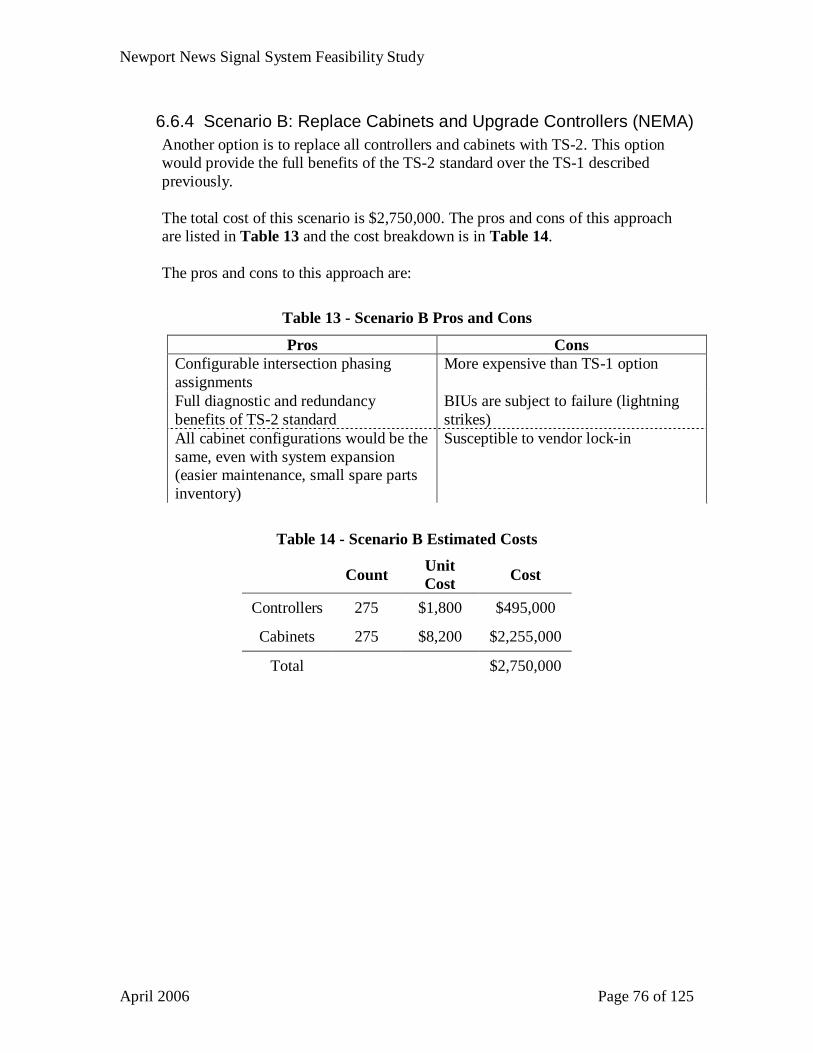
Newport News Signal System Feasibility Study
April 2006 Page 76 of 125
6.6.4 Scenario B: Replace Cabinets and Upgrade Controllers (NEMA)Another option is to replace all controllers and cabinets with TS-2. This optionwould provide the full benefits of the TS-2 standard over the TS-1 describedpreviously.
The total cost of this scenario is $2,750,000. The pros and cons of this approachare listed in Table 13 and the cost breakdown is in Table 14.
The pros and cons to this approach are:
Table 13 - Scenario B Pros and Cons
Pros ConsConfigurable intersection phasingassignments
More expensive than TS-1 option
Full diagnostic and redundancybenefits of TS-2 standard
BIUs are subject to failure (lightningstrikes)
All cabinet configurations would be thesame, even with system expansion(easier maintenance, small spare partsinventory)
Susceptible to vendor lock-in
Table 14 - Scenario B Estimated Costs
Count UnitCost Cost
Controllers 275 $1,800 $495,000
Cabinets 275 $8,200 $2,255,000
Total $2,750,000

Newport News Signal System Feasibility Study
April 2006 Page 77 of 125
6.6.5 Scenario C: Replace Cabinets and Upgrade Controllers (2070L)A third option, presented as Scenario C, is to upgrade the controllers to 2070L andcabinets to TS-2. While the 2070 standard had initial problems, the specificationappears to be stabilizing and a number of agencies have successfully deployedthem. With the most processing power and interchangeability between vendors,2070s afford the most versatility and expandability for the future. Its operatingsystem can multitask allowing multiple applications to run on the same controller,if needed. For traffic control applications, 2070L types are sufficient as a VME busis not needed. While the 2070 can interface with any cabinet, it is recommendedthat the cabinets be upgraded to TS-2. Other cabinet options that could be selectedfor the 2070 controller, such as the 33x or ITS cabinet, are not recommended overNEMA TS-2 since they would require a costly adapter to mount on existingNEMA concrete bases.
The total cost of this scenario is $3,217,500. The pros and cons of this approachare listed in Table 15 and the cost breakdown is in Table 16.
Table 15 - Scenario C Pros and Cons
Pros ConsOpen architecture hardware can bepurchased competitively apart fromsoftware
Most expensive option
The controller/cabinet can be used forcontrol of other ITS devices (CCTV, DMS)
2070 standard may be succeeded inthe future by a new ATC controllernow in development
Multiple vendors available for hardwareand software
Table 16 - Scenario C Estimated Costs
Count UnitCost Cost
Controllers 275 $3,500 $962,500
Cabinets 275 $8,200 $2,255,000
Total $3,217,500
Newport News Signal System Feasibility Study
April 2006 Page 78 of 125
6.7 Technology Evaluation SummaryTraffic control strategies range from “flashing” to “traffic adaptive”. The city iscurrently employing several different traffic control strategies and has a clearvision to include further use of traffic responsive strategies, which are not nearly ascomplex as traffic adaptive, but offer significant improvements over simple time-of-day strategies. Furthermore, the complexity and the shear volume of systemdetectors required to properly operate and maintain a viable traffic adaptive systemfar exceeds the benefits. Traffic responsive can achieve comparable results whencoupled with routinely updating traffic counts and timing plans.
Traffic signal controller and cabinet options present a comparison between thecity’s existing TS-1 platform, and other platforms including TS-2, 170-based, and2070-based. The biggest investment that will be made with respect to technologyupgrades falls within the cabinet choice. There are several advantages to migratingthe city’s platform up to either a 2070 controller or a TS-2 controller. However,both can be accommodated within a TS-2 cabinet environment. The 2070 platformdoes afford more flexibility to procure the central software and the controllerfirmware separately from a low-bid environment for the controllers. Many vendorshave ported TS-2 firmware to the 2070 controllers to provide compatibility andmarketability on new installation bids nationwide. However, the cost of thehardware is still higher than the equivalent TS-2 systems on the market and 2070controllers cannot be deployed within the city’s existing TS-1 cabinets.Recognizing that either controller choice (2070L or TS-2) are both viable options,to afford the most flexibility and build upon the in-house NEMA experience, it isrecommended that Scenario B (upgrading all cabinets to TS-2 along with new TS-2 controllers) be deployed for the City of Newport News.
ITS technologies including cameras, variable message signs, and system detectorsare explored for use in the City of Newport News. These technologies can providemore effective tools for managing local and regional incidents throughout theboundaries of the city. DSP-based cameras with external digital video encoders arerecommended for use at key locations to be identified throughout the city as a partof the ITS Masterplan. While freeways typically strive for 100% coverage usingCCTV, it is recommended that key arterial intersections be the first focus ofcoverage, particularly at known high accident locations. On a corridor basis, theJefferson Avenue and Warwick Boulevard corridors are recommended to belargely covered as they are primary alternate routes when diversions from I-64occur. Likewise, strategically placed portable VMS are recommended to be stagedat key decision points with the ability to relocate them to other parts of the cityduring an extended incident management situation. Non-intrusive system detectorsare recommended for overall deployment of actuated signals throughout the city.

Newport News Signal System Feasibility Study
April 2006 Page 79 of 125
7.0 Communication Media and InfrastructureEvaluation
The objective of this section is to compile and document relevant communication mediatechnologies and infrastructure options that can be used for subsequent alternativesanalysis within the ITS Master Plan.
7.1 Communication Media EvaluationThere are three primary candidate communications modes applicable for use inATMS applications: leased telephone lines, wireless media, and fiber optic cables.Fiber optic cables are recognized industry-wide to provide the highest capacityalong with the most flexibility to deploy multiple ITS applications/devices.However, fiber deployments, particularly underground installations, cansometimes be cost prohibitive. This section reviews the technical and costimplications of these communication media options for potential use in the City ofNewport News’ ATMS plans. Each media is evaluated based upon attributes suchas: scalability, interoperability, security, and cost.
Definitions for common telecommunication terms can be found in Appendix D toassist with understanding concepts presented in this section.
7.1.1 Leased Telephone LinesThe use of existing public telephone networks to carry traffic control informationresults in low initial capital costs, but there are recurring monthly charges for thisservice. Accordingly, the installation of a leased telephone line consists of bothnon-recurring and recurring costs. Non-recurring costs include the one-time chargefor installing the service (e.g. a hookup fee). Recurring costs consist of terminationcharges, distance charges, and optional charges such as line conditioning. As withother lease costs (vehicles, for instance), these recurring monthly costs must beaccounted for in an agency’s operating budget. The fact that a third party isresponsible for operating and maintaining the network is both an advantage and adisadvantage. On the positive side, the telephone service provider providestechnical staff, spare equipment, and 24-hour/7-days-a-week monitoring. However,agencies are constrained by their contract agreement with the service providerwhen problems do occur. If it is a long-term contract, this means that an agencycannot terminate service without paying a penalty for early withdrawal from acontract. If the contract does not stipulate the response times (e.g. 4 hours or less)during outages, then an agency may go without service for an extended period ifthe service provider has a higher priority. The monthly costs of leased linetelephone services can increase unpredictably. Accordingly, long-term contractscan be structured to control the escalation of monthly costs. Member agencies mayalso be able to use State contracts and negotiate better rates than currentlyavailable through standard public tariffs.

Newport News Signal System Feasibility Study
April 2006 Page 80 of 125
There are a host of services available through service providers in the HamptonRoads region. Some of these services and typical monthly costs (withoutgovernment discounted rates) are described below.
• Analog Plain Old Telephone Service (POTS): Low bandwidth analog servicesfor standard voice telecommunications and dial-up modem circuits. Theseservices are the same as typical residential telephone service, which providesupport for analog dial-up modem throughput up to a maximum of 56kbpsprovided the end-user equipment (i.e. traffic controllers) can also support thatdata rate. Typical dial-up phone service in the region is approximately$30/month.
• DSL(Digital Subscriber Line): There are different variations of DSL includingAsynchronous DSL (ADSL), Synchronous DSL (SDSL), and Rate AdaptiveDSL (RADSL), to name a few. As a service category, these will be collectivelyreferred to as xDSL. xDSL provides medium bandwidth data services, which istypically offered for Internet access with relatively high download data rates(768 kbps) and a moderate upload rate (384 kbps). xDSL circuits are generallyless expensive than T-1s but are limited to a three-mile range from the nearesttelecommunications provider Central Office (CO). Typical business class DSLcircuits rated for 768kbps (bi-directional throughput) average around $150 permonth.
• T-1/DS-1: Medium bandwidth services offered for point-to-pointtelecommunications up to 1.544 Mbps. T-1s can be constructed to deliver 24voice channels, all data, or a mixture of voice and date between two or morefacilities. Unlike DSL, T-1s are not distance limited, but providers charge usersfor extended mileage (i.e. it costs more for a T-1 from Newport News to NewYork than for one from Newport News to Hampton). The average cost for atypical T-1 circuit in the local area is approximately $500 to $700 per month.The disadvantage with point-to-point circuits is that redundancy can only beachieved by procuring a second T-1 circuit to an alternate location (i.e. one forOperations Center, and one for City Hall), which becomes very expensive tomaintain across multiple sites. For this reason, point-to-point T-1s are notenvisioned for the Newport News ATMS.
• T-3/DS-3: High bandwidth services for up to 44.736 Mbps or 28 T-1 circuits.Service providers generally combine multiple T-1 circuits from severallocations into a single T-3 for delivery to a headquarters location instead ofterminating multiple sets of T-1s. The average cost for a typical frame-relay T-3 circuit in the local area is approximately $3,000 to $4,000 per monthdepending on the desired/allocated bandwidth from the service provider.Unless the city chooses to deploy a large number of cameras on frame-relay orATM circuits (see below), then T-3 circuits will not likely be warranted for theATMS.
• Frame Relay: A packet technology designed specifically for delivering dataservices between multiple (geographically separate) locations over a commoncircuit. Frame Relay services generally use T-1, T-3, or fractions thereof, toprovide WAN connectivity between routers on a private corporate/government

Newport News Signal System Feasibility Study
April 2006 Page 81 of 125
network. Unlike point-to-point T-1s, frame-relay circuits can have “virtualcircuit” connections to multiple destinations thereby increasing thereliability/redundancy without paying for additional circuits to alternatedestinations. Frame Relay circuits are generally less expensive thanconventional T-1/T-3 circuits. The average cost for a typical frame-relay T-1circuit (768k to 1.5Mbps) in the local area is approximately $450 to $600 permonth. Frame-relay services can be provided with a private network address(i.e. City Internet Protocol (IP) addresses) accessible only by the city, or with apublic IP address accessible over the Internet.
• Asynchronous Transfer Mode (ATM): This is similar to Frame Relay in that itrelies upon T-1 and T-3 circuits for physical transport. ATM uses much smallerpackets called cells and has Quality of Service (QoS) standards that create areal-time environment for voice and video telecommunications. While datatransmissions do not have the same real-time requirements as voice and video,QoS can also, for example, be applied to protect mission-critical applicationsfrom Internet traffic. ATM circuits are generally more expensive than FrameRelay and conventional T-1/T-3 circuits. The average cost for a typical ATMT-1 circuit (768k to 1.5Mbps) in the local area is approximately $600 to $800per month.
Table 17 provides a comparative summary of advantages and disadvantages for leasedline communications. Leased-line technologies share the following attributes:
• Scalability and Backward Compatibility: This is an advantage of leased linenetworks because additional telephone lines can always be added. The publictelephone network is designed for scalability from analog telephone lines(Digital Signal 0 (DS-0)) to DS-1, DS-3, on up to and above Optical Carrier-48(OC-48) channels. As new telephone standards have been established, such asSONET, they have typically maintained the ability to interconnect withprevious standards (i.e. T-1, T-3, etc.). With leased lines, agencies operate on a“pay-as-you-go” mindset. Agencies can use analog dial-up lines for a fewyears until a need for higher bandwidth need (i.e. camera video) warrantsupgrading to a T-1/DS-1 or above.
• Interoperability: Historically, this is an advantage of the public telephonenetwork since different carriers must work together.
• Security: The traditional T-3, T-1, and DS-0 (standard telephone line) lineofferings are highly secure because they are dedicated to, and only accessibleby, the leasing agency. However, other types of services like frame relay anddial-up analog lines can potentially be intercepted/breached, particularly thelatter where an errant telephone connection by a would-be hacker couldpotentially endanger a portion of the system.
• Cost: Initial installation cost of leased lines is low. As discussed above, therecurring operating costs are high and would need to be accounted for in thecity’s operating budget for portions of the system using this communicationsmedia.

Newport News Signal System Feasibility Study
April 2006 Page 82 of 125
Table 17:Advantages and Disadvantages of Leased Lines
Advantages Disadvantagesn Low capital cost to deploy n Recurring monthly operating fees
n Limited obligation; use for temporaryinstallations and disconnect when done n Available bandwidth usually limited
n Low maintenance because it ismaintained by the telephone company
n Dependent upon telephone companyfor maintaining service (longer timeto repair than for agency-ownedsystem)
n Extensive trenching is not required. n High-bandwidth services notavailable in all locations.
n Line-of-sight is not required.
7.1.2 Wireless ModesWireless telecommunications is an alternative for the design of regionaltelecommunications networks. Wireless data transmission does not requiretrenching, attaching, or boring to install conduit for fiber optic or twisted-paircable. This can be advantageous in rugged terrain, over bodies of water, inenvironmentally sensitive areas, where the cost of right-of-way (ROW) acquisitionis high, where there is a lack of ROW, or in temporary installations. Wirelesstelecommunications can be described in terms of low bandwidth multi-pointsystems and high bandwidth point-to-point systems. Multi-point systems have theability to communicate with multiple locations/devices from a single mastermodem, similar to the fiber ring topology. Point-to-point systems can onlycommunicate with one location/device from a signal modem.
Regional data networks often demand high bandwidth and bi-directionaltelecommunications, which places limits on the wireless telecommunicationsformat selected. For instance, low-frequency radio systems cannot effectively carryfull-motion video over extended distances. Such a wireless signal would not beexpected to be sent more than a few miles over a low-power, unlicensed mediumwithout a reduction in bandwidth capacity along with an increase in potentialinterference.
In cases where security, exclusivity, and long-term reliability are an issue, alicensed radio system is the preferred type of radio system. The owner receives afrequency by the Federal Communications Commission (FCC) and theoreticallyshould never experience problems with radio emissions from other systems. Thedownsides of the licensed format are acquisition and study costs, as well as alengthy licensing process. Frequency searches must be performed, and preliminarynotices filed before the FCC license is issued. However, licensed wireless systemshave a long history of success. For years, point-to-point microwave systems have

Newport News Signal System Feasibility Study
April 2006 Page 83 of 125
been the medium of choice for phone companies, cable TV companies, utilities,railways, paging companies and public sector agencies, and they will continue tobe an important part of the national telecommunications infrastructure.
There are several key wireless technologies available for consideration for the CitySmart Traffic Center (STC) communications. These technologies include:• Microwave: Microwave systems offer capacity up to 622 Mbps, though
systems above 155 Mbps are generally much more costly. The largest expenseof wireless systems has traditionally been the network of towers required toestablish a line-of-sight between the various destinations. Microwave range isdependent upon radio frequency and signal strength and typically varies fromapproximately 1 to 25 miles under ideal conditions. Adverse weatherconditions can have a significant affect on system performance, particularly ifthe system was designed for ideal conditions. Microwave network architecturesinclude daisy-chain/repeater, ring, and central hub/relay configurations.Microwave equipment is available in both licensed and unlicensed frequencybands.
• Spread-Spectrum Radio (SSR) for low-speed data: Several unlicensedfrequency bands (902-928 MHz, 2.4-2.4835 Gigahertz (GHz), and 5.725-5.85GHz) are available in the United States for general public usage. Many of thesefrequencies have become quite overcrowded, making them unsuitable for high-capacity connections. SSR applications are commonly used in remote areas.Yet, system operators’ experience has shown that even in remote areas andwith close proximity between the antennas, interference can still be a problem.The advantage of the SSR system is that no license is required, and there are nofees; therefore the system may go online immediately. Lower bands of SSR areless susceptible to weather attenuation than the higher bands. Conservativedistance limits are recommended to be used in order to compensate for adverseweather.
• Wireless LAN: IEEE (Institute of Electrical and Electronic Engineers)standards 802.11a, 802.11b, and 802.11g, aka Wi-Fi, address wireless LANtechnologies over the 5.8 GHz and 2.4 GHz license-free bands, respectively.Table 18 shows the available bandwidth and relative transmission rangecomparisons between the three bands. The 5.8 GHz band generally experiencesless conflict/interference.
Table 18 – Wireless Local Area Networks – ISM Bands
915-MHz Band 2.4-GHz Band 5.8-GHz Band
Available FrequencyRange 26 MHz 83.5 MHz 125 MHz
Approximate Throughput(Bandwidth) 11 Mbps 36 Mbps 54 Mbps
Transmission Range Longest (powerdependent) 95% of 915 MHz 80% of 915 MHz
(with antenna gain)

Newport News Signal System Feasibility Study
April 2006 Page 84 of 125
Although the distance from the access point at which wireless networks canoperate is limited, wireless signals can be received at distances of several hundredfeet beyond the physical perimeter of a facility. This presents a security concernbecause unauthorized users outside of the facility have the opportunity tocompromise network security and gain access to the network, which warrantsadditional measures to secure wireless LANs (WLANs). One key issue whendeveloping a WLAN is the difficulty presented by the wired equivalency protocol(WEP). To overcome this issue, security standards were developed by IEEEgiving detailed specifications to enhance the security features provided in WLANsystems.
The original 802.11 specification was developed using Service Set Identifier(SSID), Media Access Control (MAC) Address Filtering, and WEP to protect theWLAN. The SSID is a broadcast that identifies/distinguishes each WLAN. Oncethe network is configured, the SSID broadcast can be turned off to prevent itspresences from being widely known. MAC is the technology that restricts WLANaccess to only specified computers. WEP is an encryption scheme, with knownsecurity flaws, that provides minimal protection of WLAN data streams betweenclients and access points specified by the 802.11 standards.
The IEEE 802.11i, implemented in June 2004, is the security standard for Wi-Finetworks that upgrades former wireless network security standards (i.e. WEP). Thenewest standard features 128-bit Advanced Encryption Standard (AES) for dataencryption, along with other enhancements. Unfortunately 802.11i has generatedreports stating that WEP was easily “cracked” by those with the right tools andenough patience, while being rather hard to implement. Therefore many users,particularly residential users, do not turn on the security feature.
In 2002, during the time 802.11i was being developed, the industry consortiumWi-Fi Alliance of manufacturers introduced Wi-Fi Protected Access (WPA) as aninterim security improvement over WEP. WPA is a subset of the abilities of802.11i said to include better encryption and an easier setup. WPA comes in twopackages, one for the home user and one for enterprises. Most vendors are nowincluding WPA as a standard feature in WLAN products, or at least making itavailable for download.
Since Wi-Fi/WLAN uses the same frequency bands as unlicensed spread-spectrumradios, the same susceptibility to weather attenuation and interference from othersystems applies.
Worldwide Interoperability for Microwave Access (WiMAX) is the IEEE standardfor wireless broadband access for both portable/mobile and fixed point-to-pointand point-to-multipoint applications. IEEE 802.16 was originally specified for thefrequency range between 10 to 60 GHz (see Millimeter Band discussion), but waslater modified to support frequencies from 2 to 11 GHz in version 802.16a.

Newport News Signal System Feasibility Study
April 2006 Page 85 of 125
WiMAX provides better security and increased bandwidth in comparison with Wi-Fi standards. While the standards also call for provisions for non-line-of-sightconditions, particularly for the 5 to 6 GHz band, the performance of links underthose conditions is not yet well known.
WiMAX systems can deliver up to 75 Mbps per channel for fixed and portableaccess applications. Current market trends reflect that WiMAX technology willbegin showing up in new laptops and personal digital assistants (PDAs) as early as2006. Wireless service providers are already in the planning and design stages forestablishing wireless broadband overlay networks using existing cellular towers.
• Millimeter Band: The existing 60 GHz band as well as the pending bands in the71-76, 81-85, and 92-95 GHz ranges support applications such as high-speedLAN connections, broadband Internet access, point-to-pointtelecommunications, and point-to-multipoint telecommunications. These bandsallow many broadband users to establish metropolitan area networks (MANs)with little risk of interference due to the narrow beam width of this spectrum.Millimeter band transceivers have a nominal range from 0.6 miles up to onemile with a clear line-of-sight, which already compensates for weatherattenuation. Due to this distance limit between transceivers, millimeterequipment is generally not as cost effective as microwave for establishing aWAN over long distances, nor is it cost effective for distribution.
There are many benefits and factors that make the use of a spectrum in the 60GHz range for unlicensed wireless communication very appealing. Although,wireless systems at this frequency have been used by the intelligence andmilitary community, this spectrum has yet to be used for commercial wirelessapplications on a wide scale basis. In addition to this opportunity, benefits tothe usage of this spectrum include high security, high frequency re-use, andlow interference, particularly with 60GHz links.
The oxygen absorption at 60 GHz occurs at a greater degree than at lowerfrequencies such as 2.4 GHz and 5.8 GHz. Therefore, the transmitted signalfrom one link to its destination will drop down at much shorter distances than alink operating at a lower frequency. Most designers plan for distances nogreater than one mile between transceivers.Frequencies used in other unlicensed wireless systems, 2.4 GHz and 5.8 GHz,which are not affected as greatly by oxygen absorption will continue on for agreater distance, interfering with other signals at the same frequency.Operating at 60 GHz will result in a narrower beam width and more focusedantennae than at lower frequencies. The beam width is inversely proportionateto the frequency. Compared to the degrees of radiation at the 2.4 GHz (117degrees) and 24 GHz (12 degrees) links, the 60 GHz (4.7 degrees) isexceptionally small and precise. The limited range and beam width of the 60GHz links reduces the concern of interference or security implications.

Newport News Signal System Feasibility Study
April 2006 Page 86 of 125
Table 19 provides a comparative summary of advantages and disadvantages forwireless communications. Wireless technologies share the following attributes:• Scalability and Backward Compatibility: Wireless networks are not generally
scalable. The equipment/transceivers are configured for a specific bandwidthcapacity and application and rarely allow for upgrades other than replacement.Capacity-wise, the allocated spectrum in the unlicensed bands variesdramatically, which heavily impacts the scalability of a wireless network. The2.4GHz band can realistically provide 10Mbps capacity on most links, for5.8GHz and 24GHz it is closer to 100Mbps, whereas the 60GHz band canprovide upwards of 1.25 Gbps. Any consideration for wireless as a backbone isrecommended to be focused on using the 60 GHz band.
• Interoperability in the WLAN environment is well established through IEEEstandards-based equipment. However, in the backbone environment,microwave and millimeter band equipment is largely proprietary over thewireless interface, which currently requires each link to be configured withmatching equipment. This situation is anticipated to be addressed by the Wi-Max standards, but equipment is not widely available at present.
• Security: WLAN wireless telecommunications is not very secure due to thewide availability of Ethernet monitoring tools and wireless WLANtransceivers. On the other hand, security of microwave and millimeter bandtransmissions is high because they are much more directional, requiresophisticated equipment, and require a direct line-of-sight to intercepttransmissions.
• Cost: Initial installation cost of spread-spectrum low-speed data networks isfairly low in comparison to fiber and leased lines, averaging about $3,000 to$5,000 per link. Installation cost of microwave and millimeter link are high andlargely depend upon the associated cost of towers in specific locations toachieve line-of-sight. Millimeter equipment (without poles/towers) is currentlyranging between $20,000 and $30,000 per pair. Recurring costs for wirelessnetworks are moderate, as they require more frequent maintenance than fiberoptics.

Newport News Signal System Feasibility Study
April 2006 Page 87 of 125
Table 19 - Advantages and Disadvantages of Wireless
Advantages Disadvantagesn Can transmit data and a limited number
of full motion video channels n Higher lifecycle cost to deploy
n Can use both analog and digitaltransmission standards
n Requires line-of-sight for millimeterand microwave backbone
n More economical than undergroundinfrastructure for rural/remoteapplications
n Some jurisdictions may havedifficulty gaining approval for newtowers where line-of-sight is limitedby vertical obstructions (i.e. trees,buildings, etc.)
n Rapid deploymentn Susceptibility to security breaches,
particularly for omni-directional Wi-Fi systems
n No land line interconnect required n Susceptibility to weather andEMI/RFI interference
n Potential for short-range connections oftraffic control system applications to abackbone (i.e. fiber, leased line)
n Backbone would require 60GHzequipment to serve the videobandwidth needs of the city
n May prove effective for temporary orinterim installations
n Backbone is not scalable withoutsignificant equipment replacement
n Unprotected channel space/sharedwith other users
n Requires more sophisticatedequipment and specializedtechnicians to operate and maintainthe system
7.1.3 Fiber Optic Communication SystemsFiber optic cables coupled with fiber optic transceivers provide digital high-speedcapability for voice, data, and video transmission. There are two primary factors toconsider when choosing fiber optic systems: 1) the type of cable (single-mode vs.multi-mode) and 2) the technology/optical equipment that will be used with thecable.
7.1.3.1 Fiber Optic CablesTwo types of cables are generally used for fiber optic applications: single-mode and multi-mode. Single mode fiber has significantly less signalattenuation, which permits transmission over greater distances. It does not havea bandwidth distance attenuation characteristic compared to multi-mode fiber,which means the bandwidth decreases the further it is transmitted (SeeAppendix D for further definition of single-mode and multi-mode). Because ofthese factors, single-mode fiber has greater opportunity for expansion. The

Newport News Signal System Feasibility Study
April 2006 Page 88 of 125
benefit of single-mode fiber versus multi-mode fiber is that it is two to fivetimes less expensive. The optical modems and fiber connections are moreexpensive for single-mode, but the fiber cable cost savings generally negatethis difference. For example, over a two-mile span of 12-fiber cable, a single-mode cable costs approximately $0.60/foot plus $2,500 for each opticalmodem (spaced one mile apart), totaling approximately $11,500. Incomparison, a multi-mode cable costs about $1.80/foot and $1,500 for eachoptical modem, totaling approximately $22,000 for the same two-mileinstallation. The capacity (both bandwidth and distance) and flexibilityprovided by fiber optic cables far exceeds the slightly higher cost of installingfiber optic cable versus other media (e.g. copper twisted-pair).
7.1.3.2 Fiber Optic TechnologiesOnce the physical cable is installed, there are several fiber optic technologiessuitable for the City Hall STC to manage information transfers over the cable.These technologies vary in the way they manage the use of the cable, as well asthe method for packaging/transferring the information between the fieldcabinet and the STC. These technologies include Synchronous OpticalNetworks (SONET), Wave Division Multiplexing (WDM), Gigabit/10 GigabitEthernet (GigE and 10GigE), and Passive Optical Networks (PONs).
• SONET defines interface standards at the physical layer of the OpenSystem Interconnection (OSI) seven-layer model. SONET was designed toreplace its twisted-pair predecessors with much more capacity, increasedflexibility to administer changes, and increased capability to manage thenetwork from one location. SONET standards provide both forward-compatibility with future equipment as well as backward-compatibilitywith existing telephone carrier equipment, protecting long-term capitalinvestment. The standard defines a hierarchy of interface rates that allowdata streams at different rates to be multiplexed. SONET establishesOptical Carrier (OC) levels from 51.8 Mbps (about the same as a T-3 line)to 10 Gbps. SONET architectures are capable of efficiently handling largeamounts of bandwidth for multiple carriers and customers. SONET’sbandwidth characteristics are described in terms of optical carriers (e.g.OC-X) with capacities as shown in Table 20.
When higher capacity SONET equipment is introduced to the market, theopportunity to upgrade is always available by either swapping out modulesor adding new optical shelves to increase the system capacity. Theincreased availability of wave division multiplexing (WDM) furtherprotects fiber investment by providing virtually unlimited capacity ifutilized in a regional network). WDMs provide the ability to multiplexmultiple optical signals across one fiber without degrading the transporteddata.
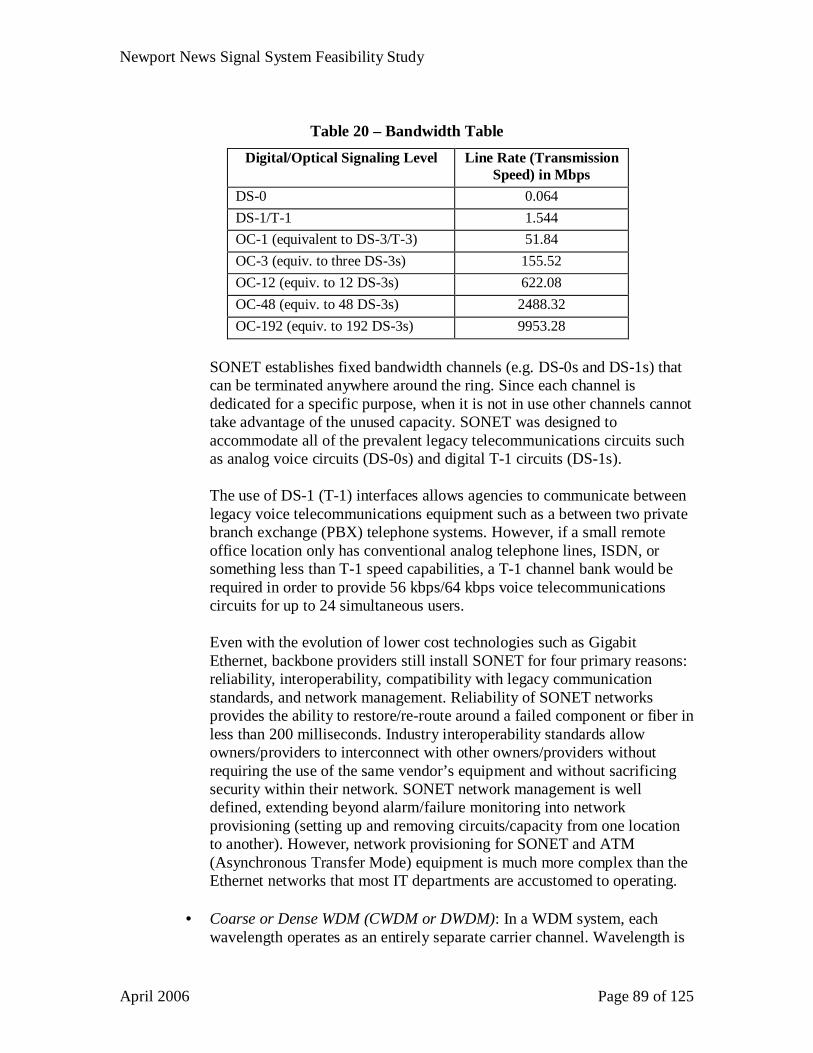
Newport News Signal System Feasibility Study
April 2006 Page 89 of 125
Table 20 – Bandwidth TableDigital/Optical Signaling Level Line Rate (Transmission
Speed) in MbpsDS-0 0.064DS-1/T-1 1.544OC-1 (equivalent to DS-3/T-3) 51.84OC-3 (equiv. to three DS-3s) 155.52OC-12 (equiv. to 12 DS-3s) 622.08OC-48 (equiv. to 48 DS-3s) 2488.32OC-192 (equiv. to 192 DS-3s) 9953.28
SONET establishes fixed bandwidth channels (e.g. DS-0s and DS-1s) thatcan be terminated anywhere around the ring. Since each channel isdedicated for a specific purpose, when it is not in use other channels cannottake advantage of the unused capacity. SONET was designed toaccommodate all of the prevalent legacy telecommunications circuits suchas analog voice circuits (DS-0s) and digital T-1 circuits (DS-1s).
The use of DS-1 (T-1) interfaces allows agencies to communicate betweenlegacy voice telecommunications equipment such as a between two privatebranch exchange (PBX) telephone systems. However, if a small remoteoffice location only has conventional analog telephone lines, ISDN, orsomething less than T-1 speed capabilities, a T-1 channel bank would berequired in order to provide 56 kbps/64 kbps voice telecommunicationscircuits for up to 24 simultaneous users.
Even with the evolution of lower cost technologies such as GigabitEthernet, backbone providers still install SONET for four primary reasons:reliability, interoperability, compatibility with legacy communicationstandards, and network management. Reliability of SONET networksprovides the ability to restore/re-route around a failed component or fiber inless than 200 milliseconds. Industry interoperability standards allowowners/providers to interconnect with other owners/providers withoutrequiring the use of the same vendor’s equipment and without sacrificingsecurity within their network. SONET network management is welldefined, extending beyond alarm/failure monitoring into networkprovisioning (setting up and removing circuits/capacity from one locationto another). However, network provisioning for SONET and ATM(Asynchronous Transfer Mode) equipment is much more complex than theEthernet networks that most IT departments are accustomed to operating.
• Coarse or Dense WDM (CWDM or DWDM): In a WDM system, eachwavelength operates as an entirely separate carrier channel. Wavelength is

Newport News Signal System Feasibility Study
April 2006 Page 90 of 125
the inverse of frequency, and WDM is, in essence, the optical equivalent toFrequency Division Multiplexing (FDM). Each wavelength can run at adifferent rate than the others. In the recent past, there were two primaryways to increase backbone capacity. The first was to replace the opticalcarrier equipment with higher capacity equipment or optical transceivers(e.g. OC-12 to OC-48). The second involved using more fibers to run aseparate ring and distribute the load across two or more networks. CWDMand DWDM allow the latter to occur without any additional fiber strandson the backbone.
WDM systems can transmit SONET OC-48 on some wavelengths, whileothers are simultaneously transmitting one or 10 Gigabit Ethernet, or evenproprietary/ specialty multiplexers without interference betweenchannels/wavelengths.
WDM uses tunable lasers that emit light at different wavelengths. Eachwavelength is transmitted through a separate window onto a single opticalfiber. Light detectors at the receiving end detect their respectivewavelength. International Telegraphic Union (ITU) has adopted a standardset of grid wavelengths to allow the industry to produce standard opticalamplifiers instead of proprietary amplifiers specific to each WDMmanufacturer. ITU Grid-compliance also enables the use of small-formfactor optical add/drop filters to be inserted into the network withoutrequiring a complete multiplexer if only one type of service (i.e. data) isrequired at a given drop location.
• DWDM contains a dense amount of wavelengths and therefore requiresprecise temperature control of transmitter lasers to prevent "drift" off a verynarrow center wavelength. CWDM systems require less precision inregards to the transmitter lasers due to a less dense amount of wavelengthson the fiber. As of 2003, CWDM devices have dropped in price to the pointwhere they are similar in price to end-user equipment such as Ethernetswitches. DWDM systems are significantly more expensive than CWDMbecause the laser transmitters need to be significantly more stable thanthose needed for CWDM. DWDM systems are better suited forapplications needing a fast connection over longer distances (i.e. long-distance telephone carriers).
WDM can be deployed in a star, mesh, or even a ring-based topology. Starand mesh configurations generally require a separate pair of WDMs foreach link. A detailed discussion on network topologies andcommunications is presented in the ITS Master Plan. If one site needs tocommunicate with three others, three separate WDM pairs would berequired. On the other hand, in a ring configuration, it is necessary tointroduce an additional function known as optical add/drop multiplexing(OADM) commonly found in SONET equipment. This functionality allows

Newport News Signal System Feasibility Study
April 2006 Page 91 of 125
the optical network to use a single multiplexer to receive from one path andtransmit/forward to the next path without dropping all wavelengths andregenerating every carrier signal.
In terms of cost, an eight lambda (i.e. eight wavelengths) WDM systemwith add/drop functionality and 14 DS-1 circuits, two Gigabit Ethernetuplinks, and one OC-48 SONET uplink would range between $90,000 to$120,000, depending upon manufacturer and other configuration options.The cost continues to grow as additional wavelengths are used and opticalinterface cards are incorporated.
• Passive Optical Network (PON) is an optical system that has activeelectronics only at the endpoints: an office, traffic operations center or fieldcabinet/device. Between endpoints, the network consists only of passivecomponents including fiber optic cabling, optical splitters/combiners, andsplice enclosures. There are no active electronics or metalcomponents/connectors to power, corrode, degrade from heat, orweaken/fail over time.
A PON generally consists of one or two shared optical fibers connecting aservice provider (or head-end) to a fan-out device located near customers orfield devices, along with dedicated optical fibers between the fan-outdevice and each field device. For a PON serving N field devices or droplocations, the fan-out device is either a 1-to-N optical power splitter or a 1-to-N wavelength-division demultiplexer (or a combination of both). Thisresults in a 1-to-N (or N-to-1 for the return path) topology over an opticalpath as shown in Figure 22. It is "transparent" to bit rate, modulationformat (e.g., digital or analog), and protocol (e.g., SONET, AsynchronousTransfer Mode (ATM), Ethernet), which allows services to be mixed oreconomically upgraded in the future as needed. New services and/or fielddevices can be added by changing equipment only at the ends of thenetwork and only for the affected field devices rather than visiting allcabinets on a daisy-chain or fiber ring. Such flexibility is not generally thecase in most of today's other network architectures.

Newport News Signal System Feasibility Study
April 2006 Page 92 of 125
Figure 22 - Typical PON Topology
The PON technology uses a passive splitter between the head-end’s opticalline terminal (OLT) and the optical network units (ONU) at the remote end.The splitter divides the downstream signal from the OLT into severalidentical signals that are broadcast to the ONUs. Each ONU is responsiblefor determining what data is intended for it and ignoring everything else.Upstream signals are handled by time-division multiplexing (TDM) inwhich ONU transmitters operate in burst mode. The main obstacle forreducing the deployment cost is due to the ONU at the remote end, whichtypically would be associated with a residence or business. Industryanalysts have targeted ONU costs of $1,000 per ONU for wide-scaledeployment. ONU manufacturers are developing efficiencies within theproduction environment and working with researchers to lower the ONUcosts over the next several years.
There are currently three prominent varieties of PON: ATM PON(APON), Ethernet PON (EPON), and Gigabit PON (GPON). In its currentstate, PON is not the most favorable technology to deploy for the City ofNewport News when compared to the other alternatives mentioned in thisdocument. This is because the deployment of an entirely new OLT,passive splitters and ONU is required to increase the speed of a subscriberterminal from 155 Mbps to 622 Mbps. 155Mbps is not anticipated to beadequate to serve the long-range camera deployment plans for the city. Inaddition, connections between the OLT and ONU are not compatible withequipment compliant with the IEEE 802.3 Ethernet standard and fewvendors currently offer products supporting Gigabit PON.

Newport News Signal System Feasibility Study
April 2006 Page 93 of 125
It should be noted that this technology is recommended considered as aviable alternative to pursue should fiber demands exceed the currenttechnology offerings at the time. This technology shows a lot of promisefor potential field distribution upgrades in the future, particularly fordistributing data networks such as Gigabit Ethernet, 10 Gigabit Ethernet,and ATM directly to field devices using relatively few fibers.
• Gigabit and 10-Gig Ethernet (GigE) Gigabit Ethernet is an extension of the10 Mbps (10Base-T) Ethernet and 100 Mbps (100Base-T) Fast Ethernetstandards for network connectivity. Ethernet itself is a local area network(LAN) protocol standardized to allow multiple users to access a common alogical bus structure. IEEE approved the Gigabit version of the Ethernetstandard, 802.3z, in June 1998.
In the past, one potential issue in dealing with Ethernet has been thedeployment of video/multimedia applications, whereby few guaranteescould be made for the quality of image transmission because it was treatedthe same way as any other Ethernet data connection. Standards bodies havesince addressed these concerns and issues by adapting Quality of Service(QoS) priorities for use in managing voice and video traffic. Video andvoice services are classified with the highest QoS priority since theyrequire real-time transmission characteristics. Data, on the other hand, canbe characterized to obtain the remaining available bandwidth as thenetwork permits. Video and voice traffic require encoding devices toconvert analog inputs to digital streams for transmission across thenetwork. A typical MPEG2/MPEG4 video codec would cost approximately$2,000 to $4,000 each for a standalone device that can be remotelymanaged. For a typical signal system application, each field cabinet’scommunication equipment would be comprised of an Ethernet switch withoptical and copper connections, an Ethernet video codec (only at cameralocations), and a serial port terminal server (only for signal controllers orother devices that do not currently support Ethernet communications).
Gigabit Ethernet has a transmission range of 5 km (3.1 miles) over single-mode fibers using standard transceivers; although some manufacturers havemanaged to exceed the standard by an increased transmission range of 10km (6.2 miles). Extended range transceivers are available from mostmanufacturers upwards of 70 km (43.5 miles). However, they must beclosely matched to ensure both ends maintain equivalent optical linkcharacteristics. The distance that single-mode transceivers can obtain isequivalent to Gigabit Ethernet (GigE) at 5 km (3.1 miles). In June of 2002,10 Gigabit Ethernet (10GigE) was ratified as the IEEE 802.3 standard.10GigE combines multigigabit bandwidth and intelligent services toachieve scaled, intelligent, multigigabit networks with network links thatrange from 10 Mbps to 10,000 Mbps. With this technology, Ethernet willrun at 10 Gigabits per second, serve as a LAN connection, work in

Newport News Signal System Feasibility Study
April 2006 Page 94 of 125
metropolitan-area networks (MANs) and wide-area networks (WANs). Onebig advantage to 10GigE is that it can fit neatly within (map directly to) aSONET OC-192 channel with little waste, whereas GigE wastes 60% of anOC-48 channel and is 40 percent larger than an OC-12.
With both GigE and 10GigE standards, ring-based, mesh-based, or startopologies can be deployed, provided that some form of Equal CostMultipath Routing (ECMR) is used to effectively manage the redundantlinks. Ethernet is a well-known standard among Information Technologydepartments and companies. Therefore, it is easier to identify resourcesequipped to configure, administer, and troubleshoot networks designedaround Ethernet standards.
Gigabit Ethernet backbone solutions are much less expensive for dataapplications than SONET or WDM. A typical Open System Interconnect(OSI) layer 3 router/switch with redundant power, 32 ports of 10/100Ethernet, and two Gigabit Ethernet fiber ports, can range from $10,000 fora fixed configuration up to $60,000 for a modular configuration. Two fibersare required for each Gigabit Ethernet backbone link unless WDMtechnologies are used in conjunction with the Ethernet platform. WDMadds approximately $80,000 per network link that provides 8 wavelengthsof additional capacity (e.g. 8 Gbps).
7.1.4 Other Networking TechnologiesThe following technologies are not immediately worth considering for the City ofNewport News, but may have future value as the system expands and thesestandards mature.• IEEE 802.17 Resilient Packet Ring (RPR) over Gigabit and 10 Gigabit
Ethernet: RPR and the earlier proprietary Cisco implementation Spatial ReuseProtocol (SRP) provide metropolitan area networks with the reliability,management, and real-time voice/video benefits of SONET, with the loweroverhead and provisioning flexibility of Ethernet. Future upgrades to thestandard include different physical layers and elegant ways of bridgingbetween rings. Due to rings not being multivendor, interoperability is notcurrently a key issue with RPR. However, in the future it is possibleinteroperability will enable service providers to extend functionality from onering to another. RPR appears to be a technology worth following for futureimplementation, but in its current form this technology is not an ideal solutionfor the intentions of this project due to the proprietary nature of the currentlyavailable equipment.
• Hot Standby Router Protocol (HSRP): This proprietary protocol is designedfor use over a Cisco-based multi-access, multicast or broadcast capable LANs(e.g., Ethernet). Using HSRP, a set of routers work in concert to present theillusion of a single virtual router to the hosts on the LAN. This set is known asan HSRP group or a standby group. A single router elected from the group isresponsible for forwarding the packets that hosts send to the virtual router.

Newport News Signal System Feasibility Study
April 2006 Page 95 of 125
This router is known as the active router. Another router is elected as thestandby router. In the event that the active router fails, the standby assumes thepacket forwarding duties of the active router. Although an arbitrary number ofrouters may run HSRP, only the active router forwards the packets sent to thevirtual router. To minimize network traffic, only the active and the standbyrouters send periodic HSRP messages once the protocol has completed theelection process. If the active router fails, the standby router takes over as theactive router. If the standby router becomes the active router, another router iselected as the standby router. This reduces the impact of a single componentfailure dramatically affecting the rest of the network/system.
• Virtual Router Redundancy Protocol (VRRP): This open standard protocoleliminates the single point of failure inherent in the static defaultLAN/WAN/MAN routed environments by specifying an election protocol thatdynamically assigns responsibility for a virtual router to one of the VPN(Virtual Private Network) concentrators on a network. The functionality isequivalent to Cisco’s proprietary HSRP. The concentrator that controls the IPaddress(es) associated with a virtual router is called the Master, and forwardspackets sent to those IP addresses. When the Master becomes unavailable, abackup concentrator takes the place of the Master. The advantage gained fromusing VRRP is a higher availability default path without requiringconfiguration of dynamic routing or router discovery protocols on every end-host.
7.1.5 Attributes of Fiber Optic TechnologiesFiber optic technologies share the following attributes:• Scalability and Backward Compatibility: These are salient features of fiber
optic networks because single mode fibers have yet to reach a quantifiablelimit in bandwidth capacity. Standards such as SONET and Ethernet continueto migrate to higher bandwidths while maintaining backward compatibility.Likewise, CWDM and DWDM manufacturers continue to increase the numberof wavelengths that can be carried over a single pair of fibers.
• Interoperability: The backbone environment is available for fiber opticnetworking equipment. Multi-manufacturer interoperability tests have beenperformed in independent labs for SONET and Ethernet equipment. Basicnetwork management is accommodated between multiple vendors, butconfiguration and circuit provisioning generally must be performed using eachvendor’s proprietary tools.
• Security: In general, fiber optic telecommunications is highly secure. However,the level of security depends largely upon the technologies deployed on thefiber optic cable network (i.e. SONET is inherently more secure than Ethernetdue to the dedicated bandwidth/channels allocated to each user group, as wellas the out-of-band administration of those channel assignments).
• Cost: Initial installation cost of agency-owned fiber networks is moderate, butthe recurring operating costs are relatively low. Typical fiber optic cabledeployments range from $100,000 per mile for aerial cable routes, to $150,000
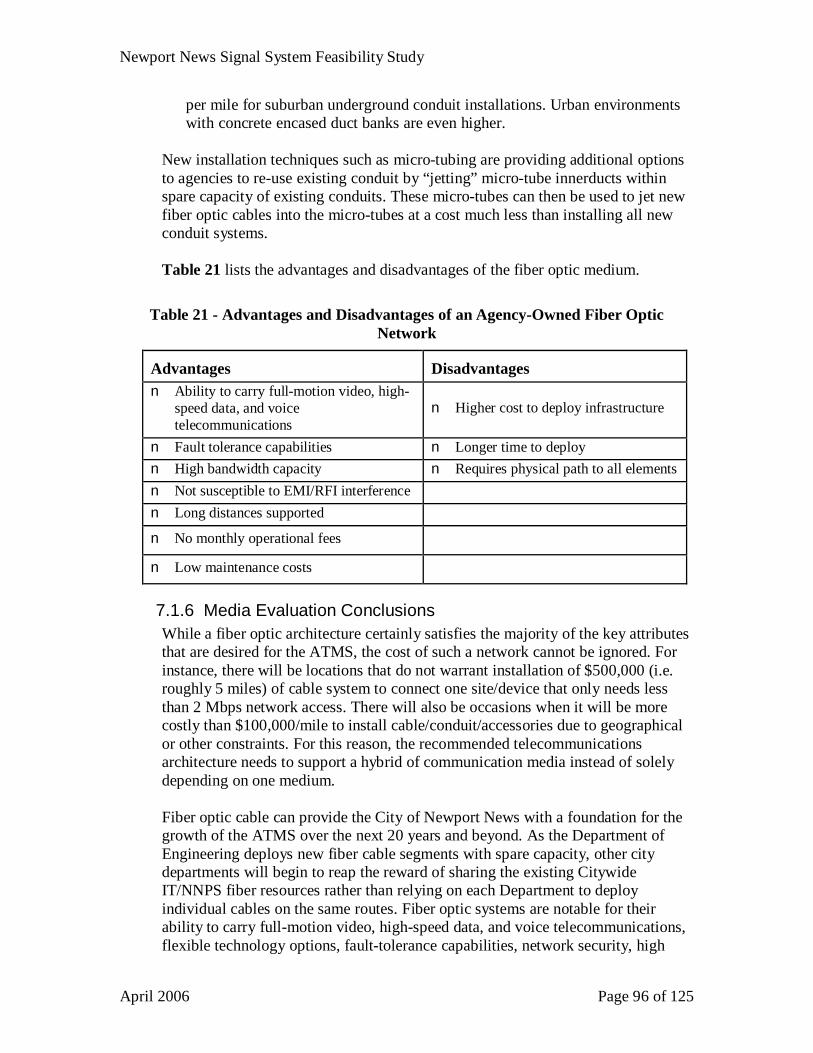
Newport News Signal System Feasibility Study
April 2006 Page 96 of 125
per mile for suburban underground conduit installations. Urban environmentswith concrete encased duct banks are even higher.
New installation techniques such as micro-tubing are providing additional optionsto agencies to re-use existing conduit by “jetting” micro-tube innerducts withinspare capacity of existing conduits. These micro-tubes can then be used to jet newfiber optic cables into the micro-tubes at a cost much less than installing all newconduit systems.
Table 21 lists the advantages and disadvantages of the fiber optic medium.
Table 21 - Advantages and Disadvantages of an Agency-Owned Fiber OpticNetwork
Advantages Disadvantagesn Ability to carry full-motion video, high-
speed data, and voicetelecommunications
n Higher cost to deploy infrastructure
n Fault tolerance capabilities n Longer time to deployn High bandwidth capacity n Requires physical path to all elementsn Not susceptible to EMI/RFI interferencen Long distances supported
n No monthly operational fees
n Low maintenance costs
7.1.6 Media Evaluation ConclusionsWhile a fiber optic architecture certainly satisfies the majority of the key attributesthat are desired for the ATMS, the cost of such a network cannot be ignored. Forinstance, there will be locations that do not warrant installation of $500,000 (i.e.roughly 5 miles) of cable system to connect one site/device that only needs lessthan 2 Mbps network access. There will also be occasions when it will be morecostly than $100,000/mile to install cable/conduit/accessories due to geographicalor other constraints. For this reason, the recommended telecommunicationsarchitecture needs to support a hybrid of communication media instead of solelydepending on one medium.
Fiber optic cable can provide the City of Newport News with a foundation for thegrowth of the ATMS over the next 20 years and beyond. As the Department ofEngineering deploys new fiber cable segments with spare capacity, other citydepartments will begin to reap the reward of sharing the existing CitywideIT/NNPS fiber resources rather than relying on each Department to deployindividual cables on the same routes. Fiber optic systems are notable for theirability to carry full-motion video, high-speed data, and voice telecommunications,flexible technology options, fault-tolerance capabilities, network security, high

Newport News Signal System Feasibility Study
April 2006 Page 97 of 125
bandwidth capacity, the lack of susceptibility to electromagnetic and radiofrequency (EMI/RFI) interference, and the scalability for future applications.However, fiber systems due require a longer time to deploy along with a higherinitial capital cost than leased lines and wireless systems. The fiber optic mediumis still the recognized as the best medium that the communications industrycurrently has to offer, particularly for a network backbone.
Leased lines and wireless alternatives will still play an important part in the city’sproposed ATMS upgrades. Wireless is not a likely candidate for the city’scommunication backbone due to its higher lifecycle cost (compared with fiberoptics), and the current lack of widely available vendors with interoperablebroadband wireless equipment. Additionally, the line-of-sight requirements forsuch a backbone would require a network of towers that may be difficult to gainapproval from other City staff and the public constituents. However, there is apotential for short-range connections of traffic control system applications to abackbone (i.e. fiber, leased line) using spread-spectrum technologies in theunlicensed frequency bands. Such systems can be deployed rapidly for areas wherefiber optic expansion would be cost prohibitive, or simply for connectingtemporary traffic signals or cameras to a nearby backbone.
Likewise, leased lines such as frame-relay T-1s can be considered for isolatedcamera locations that cannot be served effectively by fiber optics or wirelessmedia. Traffic signal locations that are too far from the backbone, may be betterserved by a dial-up telephone line for occasional/periodic communications with thecentral system, or a dedicated leased line such as DSL or a low-speed frame-relayservice for nearly constant communications.
By establishing technology standards that support all three media types, deviceswith disparate bandwidth needs (low, moderate, high) and different densities ofdevices (1 or 2/mile vs. 6 to 10/mile) can better utilize their resources to gainaccess to the aggregation hubs of the Citywide IT, Newport News Public Schools,and/or Department of Engineering fiber network. Low device densities may bebetter suited to wireless and/or leased line installations, while higher densityinstallations will be able to spread the cost of the infrastructure across manydevices/sites. It is recommended that the city’s communications network fortransportation be based on Ethernet standards (IEEE 802 set of standards), which isthe most effective set of technology standards achieving availability across allthree media types.
Newport News Signal System Feasibility Study
April 2006 Page 98 of 125
7.2 Existing Infrastructure ResourcesThe objective of this section is to compile and document relevant infrastructureopportunities for use by the proposed ATMS to achieve reduced cost, systemredundancy, and/or integration with other transportation operations centers.
7.2.1 Newport News Public Schools (NNPS) and Citywide IT
7.2.1.1 Current/Existing ResourcesThe City of Newport News Public School (NNPS) system has a fiber opticsystem with approximately 300+/- fibers in use for connecting schools, and amajority of the police and fire/rescue facilities. When surveyed they did notspecify how many, if any, spare fibers they currently have or if they would bewilling to share/trade with other departments such as Transportation. Currently,Citywide IT has a total of 96 total fibers on the NNPS fiber optic system, andhave indicated they have 30 spare fibers and are interested in sharing/tradingfibers with other Departments (i.e. Transportation and Traffic Operations) tocreate redundancy. The Citywide IT network connects the majority of police,fire, and rescue facilities, as well as several satellite offices throughout theCity.
The NNPS cables form three rings within the City using Jefferson Avenue andWarwick Avenue as the primary north/south routes, and cross-connectingroutes near City Hall to the south, J. Clyde Morris Boulevard, BlandBoulevard, and Yorktown Road. Citywide IT has access to 48 fibers on two ofthe three rings for a total of 96 fibers. Fire Station #8 located at J. Clyde Morrisand Kingstowne Drive is the primary access point for the Citywide IT portionof the infrastructure. Gigabit Ethernet optical equipment is currently being usedby both Citywide IT and NNPS to light their respective fibers.
The entire NNPS cabling infrastructure is run through underground conduitwith splice vaults located approximately 2,000-3,000 feet apart. Spare conduitswere not installed. The NNPS data center (Warwick/Wellesley) is thetermination for all three of the fiber rings. As new facilities (schools,police/fire stations, etc.) have been spliced into the backbone, the cost of eachconnection is averaging $5,000 to $10,000 per location. Most connections todate have been within 300 feet of existing routes.NNPS also indicated a regional collaboration effort is currently under way toestablish connectivity between all of the Hampton Roads School Districts forremote classroom distance-learning initiatives. NNPS expressed interest incollaboration of fiber infrastructure for connecting with the City of Hampton aswell as VDOT in support of this initiative.
Citywide IT access points are shown in Table 22. Figure 23 shows the majorNNPS fiber routes within the City.

Newport News Signal System Feasibility Study
April 2006 Page 99 of 125
Table 22: Citywide IT Fiber Network Access Points
• City Hall (Washington Avenue/25th Street)• City Center (Jefferson Avenue/Thimble Shoals Boulevard)• City Warehouse Facilities (Jefferson Avenue/Briarfield Road)• Operations Center (Jefferson Avenue/Operations Drive)• Emergency Operations Center (Jefferson Avenue/Operations Drive)• Newport News Waterworks (Warwick Boulevard/Industrial Park
Drive)• Commissioner of the Revenue Satellite Office (Jefferson
Avenue/Richneck Road)• Main Street Library/Fire Station #3 (Warwick Boulevard/Main
Street)• Fire Station #5 (Warwick Boulevard/Curtis Drive)• Fire Station #8 (J. Clyde Morris Boulevard/Kingstowne Drive)• Grisom Library/Fire Station #9/Police Station (Warwick
Boulevard/Denbigh Boulevard)• Future Proposed City Police Headquarters (Jefferson
Avenue/Woodfin Road)
During steering committee meetings and subsequent follow-up with Citywide IT, itwas also determined that the City is deploying 802.11 wireless (Wi-Fi) hot spots.Approximately 20 hot spots have been installed thus far. These 20 sites arededicated for City staff to access internal City networks as well as the Internetthrough the City’s firewall. Table 23 illustrates the general locations where Wi-Fihot spots have been deployed to date. There are requests from Parks andRecreation, Codes Compliance, and Engineering to make more hot spots availableat other city facilities such as fire stations, park facilities, police station locations,and satellite City Offices, such as the City Center. Each hot spot has approximatelya 300 foot radius of accessibility. Network authentication keys are used to preventunauthorized access.
Table 23: Wi-Fi Hot Spots
• City Hall - Second through the tenth floors• City Center - Second and fourth floors• City Center - One mounted on the roof• Inside Fire Station #8• Outside the Waterworks Lee Hall complex• Inside the EOC Operations Room• Inside and outside the Radio Shop at the Operations
Center (Operations Drive at Jefferson)

Newport News Signal System Feasibility Study
April 2006 Page 100 of 125
7.2.1.2 Potential UsesPotential uses for the existing IT fiber infrastructure involve:
• By using the City access points there will be a cost reduction in thebackbone/trunk communications. In addition, Transportation and TrafficOperations can connect signal system distribution cables to the nearest ITaccess point in Table 22 to build distribution from these points and offerredundancy to Citywide IT along alternate paths. Two of the City’s 30spare fibers could be used to establish a backbone dedicated for theAdvanced Traffic Management System (ATMS), two additional fibers (for atotal of four) would be desirable to provide separate distribution strands toconnect field equipment and support redundant paths along some routes.This would allow Engineering to separate distribution to ATMS elementsfrom the general Citywide IT network. With the use of a small fraction ofthe 30 fibers, additional access points could be established along JeffersonAvenue and Warwick Boulevard for distribution to field cabinets alongthese two critical corridors.
• Wireless remote access from Citywide Wi-Fi hotspots would reduce traveland cellular phone charges by allowing Transportion and Operations staffto remotely connect to the proposed ATMS central system servers fromvarious existing hot spots around the City (Table 23) as well asfuture/planned locations. Available data transfer rates would be muchhigher with Wi-Fi than with cellular remote access connections.
• System monitoring access and digital video distribution to/from all of theIT access points throughout the City.
An existing maintenance agreement is in place with the NNPS fiber cableinstaller. This agreement provides a menu of options for varying responsetimes. With the redundant network topology that is envisioned for thisinitiative, a rapid response times is not anticipated to be necessary for themajority of fiber-cut events that would typically occur.Resource sharing agreements will need to be established to clearly define thetime to respond to network outages, shared funding conditions (i.e. tradingfibers one for one on different routes vs. a set cost for shared usage), andmaintenance responsibilities of both groups.
7.2.2 City of Hampton Traffic Engineering Infrastructure
7.2.2.1 Current/Existing ResourcesThe City of Hampton has fiber optic systems in use for traffic operation andhas indicated an interest in sharing/trading fibers for redundancy with otheragencies, particularly Newport News, due to a number of major arterials thatare influenced by two separate signal systems. The City of Hampton hasconduit links to the Newport News city line along Mercury Boulevard and

Newport News Signal System Feasibility Study
April 2006 Page 101 of 125
Hampton Roads Center Parkway. In addition, along Mercury Boulevardtwisted pair copper is in place between the two nearest signal cabinets. TheCity of Hampton has overhead (aerial) fiber optic cables on Pembroke Avenueand Todds Lane. Although there is no conduit along these routes, the city hasidentified these as good opportunities to tie-in with the Newport News Systemalong 39th Street and Main Street /Willow Drive, respectively. The City ofHampton is willing to sit down with the City of Newport News to map outpotential paths for communications sharing.
The City of Hampton has a coordinated signal system and remote operatingcapabilities to control timing plans, as well as emergency incident managementplans that can be shared for regional coordination. Hampton’s current systemhas limited capabilities to communicate with other vendor platforms. The Cityof Hampton has an Arterial ITS Master plan which includes CCTV cameras,arterial changeable message signs, system detectors/count stations, parkingmanagement systems, emergency vehicle priority corridors, and transit vehiclepriority corridors. They are willing, and intend, to share video images withother agencies in the region.
7.2.2.2 Potential UsesPotential uses for the City of Hampton infrastructure involves:
• Signal coordination/connection along the 39th Street / Pembroke Avenuecorridor by interconnecting both agencies’ systems.
• Signal coordination/connection along the Main Street / Todds Lanecorridor by interconnecting both agencies’ systems.
• Signal coordination/connection along the Mercury Boulevard corridor byinterconnecting both agencies’ systems.
• Signal coordination/connection along the Harpersville Road / HamptonRoads Center Parkway corridor by interconnecting both agencies’systems.
• Potential mutual redundancy for creating a fiber ring from J. Clyde MorrisBoulevard to Harpersville Road/Saunders Road which connect toHampton’s proposed Commander Shepard Boulevard Extension toMagruder Boulevard to Hampton Roads Center Parkway and then back toHarpersville Road /Jefferson Avenue to J. Clyde Morris Boulevard. Thislinkage would also afford direct center-to-center communications as well.
• Potential mutual redundancy by connecting Briarfield Avenue toAberdeen Road to Pembroke Avenue and then interconnect with proposedNewport News infrastructure along 39th Street and Chestnut Avenue tocomplete a ring.
• Potential mutual redundancy along the Main Street/ Todds Lane corridorusing Newport News infrastructure on Jefferson Avenue to connect withHarpersville Road, and Hampton infrastructure from Hampton RoadsCenter Parkway to Big Bethel Road back to Todds Lane.

Newport News Signal System Feasibility Study
April 2006 Page 102 of 125
Approximately 2 fibers would be needed by each agency to complete eachring. Resource sharing agreements will need to be established to clearly definethe time to respond to network outages, shared funding conditions (i.e. tradingfibers one for one on different routes vs. a set cost for shared usage), andmaintenance responsibilities of both Cities. The possible connections with theCity of Hampton for redundant fiber routes are depicted in Figure 23.
7.2.3 Virginia Department of Transportation (VDOT) Hampton RoadsSmart Traffic Center Infrastructure
7.2.3.1 Current/Existing ResourcesThe VDOT Hampton Roads Smart Traffic Center (HRSTC) has fibers, whichhave been set aside for the City of Newport News Engineering, originatingfrom J. Clyde Morris Boulevard at an arterial changeable message sign(ACMS). There are eight fibers in total; four (4) fibers that traverse west, andfour (4) fibers that traverse east. This connection route is depicted in Figure23.
Additionally, there is currently a microwave link between the Newport NewsCity Hall and the VDOT HRSTC. This covers a line-of-sight distance ofapproximately 20 miles. The Proxim Tsunami wireless link provides up to 100Mbps (full-duplex) for Ethernet using the unlicensed 5.3-5.8 GHz frequencyband, in addition to T-1 connections for voice or data. This wireless bridge hasthe ability to provide point-to-point communications from less than 1 mile tomore than 15 miles. At the VDOT HRSTC, the wireless bridge is connected toa Cisco Ethernet switch, via single-mode fiber optic cable. In turn, this switchis connected to the VDOT internal network switch, the iMPath MPEG VideoEncoder chassis, and in turn the analog video switch. At the Newport NewsCity Hall location, the wireless bridge is connected to another Cisco Ethernetswitch along with an iMPath Video Decoder Chassis and a Dell workstation.This workstation is a remote computer on the VDOT HRSTC networkallowing access to incident and traffic information, along with video selectionvia the attached encoder/decoder pairs. The decoders at City Hall are attachedto large-screen plasma monitors for visual traffic monitoring of VDOTcameras along the interstates and the bridge-tunnels.

Newport News Signal System Feasibility Study
April 2006 Page 103 of 125
Figure 23 - Inter-Agency Connection and Proposed Fiber Expansion Map

Newport News Signal System Feasibility Study
April 2006 Page 104 of 125
7.2.4 Potential UsesPotential uses for the VDOT STC fiber infrastructure involve:
• Communication redundancy for the Jefferson Avenue corridor between J.Clyde Morris Boulevard and Ft. Eustis Boulevard.
• Secondary access to VDOT over fiber infrastructure instead of, or in additionto, the current wireless connection with City Hall.
• Connect with other municipalities across the regional multi-modal system(RMMS) portion of the VDOT backbone via the Ft. Eustis VDOT STCcommunication hub.
• Potential use of RMMS, or trading fibers with VDOT, to provide redundancybetween the city’s two operations locations (Operations Drive and City Hall)by way of the VDOT Ft. Eustis and the 664/23rd Street communication hubs.VDOT could benefit from redundancy along the I-664 and I-64 corridor, froma City constructed fiber route along Jefferson Avenue.
• Accessing the RMMS also provides the City with access to real-timeBridge/Tunnel information, interstate diversion plan alerts, and other freewayincident notifications.
Resource sharing agreements will need to be established if the city and VDOTdecide to trade fibers, along with the maintenance responsibilities of infrastructureprovided by both groups.
7.2.5 Other Service ProvidersThere are incumbent and competitive local exchange carriers (ILEC and CLECs)that have existing fiber networks or are continually expanding/upgrading thesenetworks. Verizon, Cox Communications, and KMC Telecommunications, amongothers, were contacted regarding opportunities to share a fiber network installment.These three entities have already installed the majority of their infrastructureswithin the City of Newport News and do not see substantial opportunities in theforeseeable future.
While Verizon, the area wide ILEC, has a standing policy against the approach ofselling dark fibers, CLECs have a proven track record of partnering withmunicipalities to offer fibers in exchange for right-of-way. This affords the abilityto share the installation cost of such a communication network deployment by twoor more entities. However, such an endeavor requires a set of ground rules to beestablished between all parties involved. If the opportunity arises when approachedby a CLEC or other fiber optic installation group, the following rules/guidelinesshould include at a minimum:
• Department/entity responsible for maintaining the fibers• Department/entity responsible for operating and maintaining any associated
network equipment• Department/entity responsible for making repairs to damaged facilities• Leasing/purchasing arrangements for the fiber facilities• Number of fibers available to each department or firm

Newport News Signal System Feasibility Study
April 2006 Page 105 of 125
• Department/entity responsible for performing any necessary splices orconnectivity modifications
7.3 Communications Expansion RoutesBased on the assumption that agreements are being formalized between theNewport News Department of Engineering and the Citywide IT/ Newport NewsPublic Schools (NNPS), this arrangement will allow for communicationinfrastructure sharing along, or parallel to, the key corridors of Jefferson Avenueand Warwick Boulevard will be achieved by the existing infrastructure. Thequantity of fibers that are made available for use by the Department of Engineeringwill have an impact on the types of technologies that can be deployed withoutinstalling all new cable infrastructure in parallel to the NNPS systems.
To improve the reliability of the entire system as well as to expand thecommunication coverage beyond these two primary corridors, additional fiberoptic communication routes are recommended. These proposed communicationroutes will provide greater resistance to failure (fault tolerance) and provide thenecessary bandwidth required to effectively handle proposed video surveillance aswell as resource sharing with other Newport News agencies and adjacentjurisdictions (i.e. City of Hampton, VDOT, etc.). The routes that have beenidentified typically correspond to high accident locations as well as interstatediversion routes/corridors. The following list identifies the locations of theproposed communication routes that are shown on Figure 23 as dashed lines. Inorder to gain the most benefit from these expansion corridors, the routes arerecommended to be grouped to establish physical rings as follows. The groups arenot in order of priority.
For redundancy along the northern Jefferson/Warwick corridors• Along Fort Eustis Blvd., between Warwick Blvd. and Jefferson Ave.• Along Warwick/Yorktown Rd., between Curtis Drive. and Jefferson Ave.
For redundancy in the Central Business District• Along Oyster Point/Victory, from Jefferson Ave. to City Limits• Along Thimble Shoals Blvd., between Jefferson Ave. and Diligence Dr.
For redundancy in the Central Business District and connection with Hampton andYork County (VDOT)• Along J. Clyde Morris Blvd., between Jefferson Ave. and Woods Rd.• Along J. Clyde Morris Blvd., between Interstate 64 overpass and City Limits
For interconnection with Hampton• Along Harpersville Rd., from J. Clyde Morris Blvd. to Saunders Rd.• Along Saunders Rd., from Harpersville Rd. to City Limits• Along Hampton Roads Center Pkwy., between Harpersville Rd. and City
Limits

Newport News Signal System Feasibility Study
April 2006 Page 106 of 125
For redundancy in the Mercury/Briarfield area east of Jefferson• Along Mercury Blvd., between the James River Bridge and Roanoke Ave.• Along Briarfield Rd., between Marshall Ave. and City Limits• Along Chestnut Ave., between City Limits and Briarfield Rd.
For redundancy east of Jefferson between Briarfield and 41st
• Along Chestnut Ave., between Briarfield Rd. and 41st St.
For redundancy east of Jefferson between 48th and 40th
• Along Jefferson Ave. between 48th and 40th
For redundancy east of Jefferson between 25th and 16th
• Along 25th St., between Jefferson Ave. and Madison Ave.• Along Jefferson Ave., between 25th St. and 19th St.• Along Chestnut Ave., between 18th St. and 16th St.
For resource sharing initiatives and interconnection with Hampton• Along 25th St., between Chestnut Ave. and City Limits• Along 39th St., between Chestnut Ave. and City Limits• Along Briarfield Rd., between Chestnut Ave. and City Limits

Newport News Signal System Feasibility Study
April 2006 Page 107 of 125
8.0 Proposed System Functional RequirementsThe objective of this section is to present the system functional requirements foruse by the proposed ATMS to achieve the desired software, hardware,communication, and the remaining associated system upgrades.
8.1 Platform/Architecture & System AdministrationRequirements
8.1.1 High Level System DescriptionThese requirements describe an arterial traffic management system that purchasedas part of the ATMS following the preparation of design plans and specifications.It includes the necessary central system hardware and software to monitor andcontrol approximately 500 traffic signal controllers, 500 system detectors, 50closed circuit television (CCTV) surveillance cameras, and 20 portable dynamicmessage signs (DMS) in an Ethernet network over city-owned fiber optic cables.Newport News will have two fully functional traffic management center locationshaving the same functionality— one at the Operations Center and one at City Hall.The system shall be sufficiently stable to run continuously (i.e. 24/7) andunattended outside of standard hours.
The proposed system shall have a central architecture, where the central systemwill communicate directly with each local traffic signal to provide signal controllerupload and download database capabilities (i.e. no field master locations). Thesystem shall be designed for a turn-key implementation in which a singlecontractor will supply, construct, install, fully integrate all hardware, software, andother equipment, and provide training for a complete and operational ATMS.
The system shall have a client-server architecture and be Microsoft Windows-based, with an intuitive graphical user interface (GUI), mapping and displayfunctionality, and seamless cutting and pasting between standard Windowsapplications such as Microsoft Office Word and Excel. All system informationshall be stored in a centralized multi-user database. It shall monitor systemcomponents and alert operators of unexpected conditions, log all importantactivity, provide device status displays on command, and allow the creation of avariety of reports to help operators manage system performance.The system shall include centralized traffic control functionality such as trafficresponsive plan selection, and allow intersections to dynamically move from onecontrol group to another. However, control should be distributed and should anintersection lose communications with the central system, it should revert to itslocal time base coordination plan. The system shall accommodate the futureapplication of transit vehicle priority and existing and future emergency vehiclepreemption.
The system shall support polling, viewing, and controlling CCTV cameras. It shallalso support polling portable DMS, viewing the current message, and updatingmessages. It shall also send alarms for predetermine weather sensor thresholds.

Newport News Signal System Feasibility Study
April 2006 Page 108 of 125
During the construction phase of the system upgrades, field controller locationsshall be upgraded on a “closed-loop system” by “closed-loop system” basis tominimize system downtime. The existing primary system servers are located in theOperations Center off of Operations Drive. The location of the proposed primaryservers will be initially located at City Hall. As new controllers/systems aretransitioned to the proposed system they will then be released from/no longermonitored by the existing central system. Fiber optic communication upgrades willneed to be established to each associated “closed-loop system” group ofintersections prior to each transition. Once all existing intersections have beentransitioned to the proposed system, a backup set of servers can be deployed in theOperations Center.
8.1.2 System ArchitectureModern traffic management systems are typically designed around a computercluster acting as server(s) to a constellation of operator workstations acting asclient(s). This is typically described as a “client-server” architecture. The server(s)manage field communications (center to field device), and collect and process fielddevice data into traffic information. The system provides traffic information tohuman operators through the operator workstations. It also makes availablehistorical information through reports generated from a database. The system shallhave a client-server architecture that accommodates multiple concurrent users.
8.1.2.1 Operating System (OS)The operating system for servers shall be Microsoft Windows 2003 ServerStandard Edition (or the equivalent of a later version if available). Theoperating system for client workstations and laptops shall be MicrosoftWindows XP Professional (or the equivalent version of Vista if available).
8.1.2.2 Local Area Network (LAN)The LAN shall be gigabit Ethernet. Hardware shall be provided to connectservers, workstations, printers and other devices. A switch shall be provided ateach field cabinet, traffic management center, and access point locations thatcan accommodate all LAN devices with 25% spare capacity. The network shallbe based on a Gigabit Ethernet platform over single-mode fiber optic cablingconfigured in a ring topology to field devices. Where possible based uponavailable diversified cable routes, physical rings shall be established to providereliable communications between field devices and the central system. TheATMS Gigabit Ethernet network shall be segmented so that it is not a part ofthe Citywide IT network in order to minimize data latency and bandwidthconflicts associated with distributing digital video across the ATMS network.
A multi-point serial concentrator shall be provided for connectivity to dial-upremote access modems or a video wall controller.
Layer-3 network switches shall be provided to connect LANs at the OperationsCenter and Newport News City Hall traffic management center locations aswell as field device locations.

Newport News Signal System Feasibility Study
April 2006 Page 109 of 125
Firewalls shall be provided and be appropriately configured for proper securityfor interfaces with other City departments, external organizations, and/or theInternet.
8.1.2.3 Servers and WorkstationsPerformance of server and workstation hardware is a continual and rapidlychanging environment. The following section provides general guidelines forthe performance of proposed servers and workstations to support the NewportNews ATMS deployment. These guidelines should be re-visited prior to finalprocurement of central system equipment to provide the City with the optimumconfigurations that are on the market at the time of purchase.
• Application/file/database serverAn application server shall be provided to run the central system software,house the database and be a central storage location for system files. It shallmeet the following minimum requirements:§ Rack-mount server configuration consuming no more than 3 rack units
(RU) (5.25”H x 19”W x 24”D)§ Support for dual processors (i.e. 32-bit Intel processors at 3.0 GHz/2
MB Cache, 800 MHz FSB (or performance equivalent)§ At least three 10,000 rpm hard drives configured in a RAID 5
operation mode with sufficient capacity (see Section 8.2: SystemCapacity), and 100% spare storage capacity.
§ 4 GB of Double-Data Rate (DDR2) Synchronous Dynamic RandomAccess Memory (SDRAM)
§ Dual-port 10/100/1000 Mbps Ethernet network interface adapter§ DVD+/-RW burner and CD/DVD-ROM reader combination drive§ Redundant power supplies§ Redundant cooling fans§ 1RU rack-mount keyboard, monitor, and mouse drawer equipped with
a 15” LCD monitor rated for a minimum of 1024x768 pixel resolution§ Keyboard/video/mouse (KVM) switch accommodating at inputs from
at least 8 servers/workstations, and at least two outputs including thekeyboard, monitor, and mouse drawer
The servers shall come with the following software installed:§ Microsoft Windows 2003 Server Standard Edition Operating System§ Standard database formats (i.e. SQL, Oracle, etc.)
For system redundancy, primary servers shall be installed at City Hall with astandby backup set of servers installed at the Operations Center. The serversshall support file synchronization/mirroring at least once a day to minimizedata loss in the event of primary server outage. Engineering/IT will backupserver data from the existing IT Network Attached Storage (NAS) devices.

Newport News Signal System Feasibility Study
April 2006 Page 110 of 125
• Port serverA port server shall be provided to manage communications with field devices.It shall have the same specifications as the application/file/database server. Thesystem shall be configured to have the port server automatically take over forthe application/file/database server should communications with the primaryserver fail for a user-specified number of attempts.
• WorkstationsEight (8) client workstations shall be provided for operators to use the system.Two (2) shall be located at the Operations Center, five (5) at City Hall and one(1) at the Emergency Operations Center (EOC). They shall have identicalspecifications and shall meet the following minimum requirements:§ 32-bit processor system (i.e. Intel Pentium D processor at 3.0 GHz/2
MB Cache, 800 MHz FSB (or performance equivalent)§ 2 GB DDR2-SDRAM§ 120 GB hard drive§ 10/100/1000 Mbps Ethernet network adapter§ DVD+/-RW burner and CD/DVD-ROM reader combination drive§ Dual 19” LCD flat panel monitors, 1280x1024 pixel resolution§ Keyboard, mouse
The workstations shall come with the following other software installed:§ Microsoft Windows XP Professional SP2 Operating System (or the
equivalent version of Vista if available)§ Microsoft Office 2003 Standard Edition (or equivalent if a newer
version is available)
• LaptopsSeven (7) laptops shall be provided to access the system remotely or from thefield. Four (4) shall be for field technicians, two (2) shall be for city trafficengineers, and one (1) shall be for a technician at City Hall. They shall haveidentical specifications and shall meet the following minimum requirements:§ 32-bit processor system (i.e. Pentium M processor at 2.0 GHz (or
performance equivalent)§ 1 GB DDR2-SDRAM§ 60 GB hard drive§ DVD+/-RW burner and CD/DVD-ROM reader combination drive§ Internal 56k dial-up modem§ 802.11a/b/g wireless networking card§ Secondary battery§ Carrying case
The laptops shall come with the following other software installed:§ Microsoft Windows XP Professional SP2 Operating System (or the
equivalent version of Vista if available)

Newport News Signal System Feasibility Study
April 2006 Page 111 of 125
§ Microsoft Office 2003 Standard Edition (or equivalent if a newerversion is available)
Five licenses of Synchro Professional (version 6.0 or the most current versionat the time the equipment is purchased) shall be provided for installation onfive of the laptops or workstations.
Optional cellular/PCS PC cards and service plans can be shared for use by oneor more technician laptops to augment City Wi-Fi and Internet remote access.
8.1.3 GPS ClockA Network Time Protocol (NTP) clock using Global Positioning Systems (GPS) tomaintain accurate time shall be provided. It shall be the NTP server on the LANfrom which all devices obtain their time. A secondary/backup time server shall beestablished for the system using either publicly available NTP servers over theInternet, or via the City’s intranet.
8.1.4 Video Wall DisplayThe video system shall support the display of simultaneous video streams on eitherthe workstation monitor or video wall displays at the Traffic Operations STC andCity Hall STC. The video wall display system shall support the receipt of Ethernetencapsulated MPEG-2 and MPEG-4 video stream formats from video encoderslocated in field cabinets. The network switches at both centers will provide accessto the remote digital video streams, and providing distribution to the workstationsand central display monitors. The video system shall allow the users/operators toselect the video streams to be displayed and then display simultaneous videostreams on either the workstation monitors or wall monitors. Up to 10simultaneous video streams shall be displayed on each monitor. The video systemshall provide drag-and-drop camera selection, user management, and pan/tilt/zoomcontrol of field cameras using NTCIP or compatible camera-vendor protocolsthrough a GUI.
8.1.5 Printers and PlottersTwo identical color laser printers, one for each traffic management center, shall beprovided that are networked to the LAN and meet the following minimumrequirements:
§ 10/100 Ethernet interface port§ 15 pages per minute§ 600 x 600 dpi§ 350 sheet paper tray§ Support 11”x17” (Tabloid), 8-½”x11” (Letter), and 8-½”x14” (Legal)
paper trays
Two color plotters, one for each traffic management center, shall be provided thatare networked on the LAN and that meet the following minimum requirements:

Newport News Signal System Feasibility Study
April 2006 Page 112 of 125
§ 10/100 Ethernet port§ Support 42”W paper rolls§ 1200 x 600 dpi
8.1.6 Uninterruptible Power Supplies (UPS)Uninterruptible Power Supplies shall be included that can support all centralsystem components— including workstations— running without disruption for atleast the first 30 minutes of a power outage. The UPS shall initiate an orderlyshutdown of all operating systems prior to loss of UPS power. At least two rack-mount UPS’ shall be provided for the central servers. Each UPS shall be no largerthan 3RU high and shall have the server loads distributed between them. Dualpower supply cords from each server shall be divided between two UPS devices.UPS power management software shall be provided for connected servers to failover to the secondary UPS in the event the other UPS fails or is taken off-line formaintenance, exchanging batteries, etc. The software shall provide thefunctionality to automatically shut-down the attached servers only if both of theUPS devices lose primary power.
8.1.7 Multiple Site AccessThe system shall allow multiple users from one or more locations (i.e. both trafficmanagement centers, field network locations, etc.) to access the systemconcurrently over an Ethernet-attached network interface, virtual private network(VPN) over the Internet, or via dial-up remote access telephone lines.
8.1.8 Data BackupsHard drive images for each server and workstation shall be provided on DVD thatcan restore all computers to their settings at system acceptance, i.e., including allinstalled software and all database configurations.Engineering/IT will backup the ATMS server(s) from City Hall as part of normalbackup routines for remaining IT application servers.
8.2 System CapacityThe system shall accommodate at least 500 controllers.The system shall accommodate at least 100 ITS field devices.
The system shall accommodate at least 50 control groups (i.e. coordinatedsystems).
The system shall accommodate at least 500 system detectors.The system shall accommodate at least 10 concurrent users, including remoteusers.
Newport News Signal System Feasibility Study
April 2006 Page 113 of 125
8.3 Security/Reliability
8.3.1 Start-up and ShutdownAt initial startup, the system shall begin normal operation with no prior stateinformation.
The system shall save all data and end all processes in an orderly manner at user-initiated system shutdown.
The system shall save all data and end all processes in an orderly manner uponshutdown of the operating system.
Startup and shutdown operations shall be logged and/or initiate a user-definedalarm, where possible.
8.3.2 User Access PermissionsThe system shall recognize different levels of user permissions that allow user-configurable read and/or write access to various system functions. Threepermissions levels to which users can be assigned shall be pre-configured:
• Administrator (full access)• User (full access with the exception of low-level OS and system administration
functions not needed on a daily basis such as setting user permissions, addingor removing system devices, etc.)
• Limited user (read-only access)
All login and logout activity shall be logged.
8.3.3 Remote AccessUsers shall be able to access the system remotely via dial-up or VPN over theInternet. Web browser-based remote access shall also be supported.
8.3.4 PagingThe system shall have the ability to send pages. The system shall be configurableto page numbers at user-defined alarm conditions. The system shall allow the userto configure which number(s) are paged for different alarm conditions. The systemshall be configurable to page different numbers at different times of day and day ofthe week.
8.3.5 Clock SynchronizationThe system shall be able to broadcast time to servers, workstations, fieldcontrollers, and field devices at user defined intervals. Servers shall keep theirsystem time synchronized with the NTP server at all times. Workstations shallsynchronize their clocks to the NTP server at login.

Newport News Signal System Feasibility Study
April 2006 Page 114 of 125
8.4 System Feature Requirements
8.4.1 Graphical User InterfaceThe graphical user interface (GUI) shall be the primary means to access systemfeatures and displays. It shall conform to Microsoft Windows standards and beconsistent, intuitive and easy-to-navigate. It shall make use of menus, dialog boxesand icons, to minimize reliance on a manual for most tasks.
Keyboard shortcuts shall be provided for common system functions.The system shall use traffic engineering terminology throughout.
Displays shall not affect system performance.
8.4.2 System MapThe system shall support the display of a system map of the City of Newport Newswith icons denoting system devices and various status levels for different devices.The map will be dynamic in nature such that the background can be updatedwithout reconfiguring the system device icons.System maps shall support a variety of vector and raster graphics formats as thebackground. Supported vector formats shall include:
• ESRI shape files• CAD drawings (.dwg, .dxf, .dgn)• Spatial database engine (SDE) layers
Supported raster file formats shall include:
• Bitmap (.bmp)• JPEG (.jpg)• Tagged Image File Format (TIFF) (.tif)
8.4.3 Panning, Zooming, and LayersThe system map shall support panning and zooming.
The system map shall support multiple layers so that different types of backgroundinformation can be turned on and off as desired. Panning and zooming shall notcause layers to misalign. For ESRI shape file layers, the user shall have the abilityto change colors, fonts and line weights. The user shall be able to re-order layerswithout removing and re-adding.The user shall be able to set a minimum zoom level for each layer and systemdevice on the map. This shall be the zoom level beyond which the layer or deviceis not viewable. This controls the level of detail/information shown when viewinga wide geographic area.Map icons shall be user-selectable and change in size commensurate with thezoom level.

Newport News Signal System Feasibility Study
April 2006 Page 115 of 125
The system shall allow the user to define saved map views that can be selectedlater. For instance, users should be able to select a saved map view to quicklyzoom to a particular control group or geographic area of the city.
8.4.4 Adding and Modifying Devices or ObjectsThese devices shall be selectable from the map so the user can view status andproperties, or edit parameters or settings. These icons shall update in real-time at arefresh rate of once per second to show high-level status such as the mode ofoperation at an intersection.The user shall be able to assign system detectors to directional links to showcongestion levels based on the measurements of those system detectors and user-defined thresholds. Link congestion status shall be updated a minimum of once persecond.The map GUI shall provide a straightforward means to add devices to the map,remove devices from the map, or move devices on the map.The map shall support display of a user-editable legend defining icons.
The user shall be able to assign hyperlinks to icons on the map so that clicking onthe hyperlink automatically opens a web browser window to the specified URL(e.g. Intranet/Internet address).
8.5 Intersection MonitoringThe system shall provide the user the ability to monitor individual intersections toview their operation and status in real-time.
8.5.1 Intersection MapsThe system shall provide the ability to view static and dynamic intersectioninformation in real-time. At a minimum, static information shall includeintersection geometry (number of lanes, turn lane lengths, cabinet locations, polelocations, detector locations/zones, and ITS devices). Dynamic information shallinclude current plan, phase status, coordination status, alarm status (if any),pedestrian activity, and preemption/priority status. The refresh rate shall be onceper second.
8.5.2 Time-Space DiagramsThe system shall include a time-space diagram viewer for a selected series ofintersections that shows “green bands” for coordinated phase green times andoffsets. The time-space diagrams shall also show the actual green usage for theprevious cycle.
8.6 Traffic Control
8.6.1 Distributed ControlThe system shall be distributed. The central software shall make the most use ofthe memory, processing and programming capabilities of the local controllers,

Newport News Signal System Feasibility Study
April 2006 Page 116 of 125
storing timing plans and parameters in the local controller to the extent possible.However, the system shall have centralized traffic control functions, effectivelyacting as a master controller over multiple groups of intersections, where thosegroup assignments can be changed by time-of-day or other traffic responsivethresholds.
8.6.2 Manual ControlThe system shall allow the user to manually override the current program in effectfor any intersection or group. The manual override should be programmable toallow for override for a specified time period.
8.6.3 Central FlashThe system shall allow the user to place an intersection or control group in flashmode by time-of-day and day-of-week.
8.6.4 Time-Based ControlThe system shall include a scheduler that allows the user to program time-of-day,day-of-week, and day-of-year schedules for each control group. Keeping with theprinciple of distributed control, the timing plans should be stored locally to theextent possible.
8.6.5 Traffic-Responsive Plan SelectionThe system shall provide a traffic-responsive plan selection (TRPS) algorithm thatcan initiate transition to a new timing plan based on user-defined thresholds ofsystem detector measurements over a user-defined interval. The thresholds shouldallow for various inputs by time-of-day and evaluate data in increments of 10 for15 minute intervals.
The TRPS algorithm shall limit the amount of switching between plans that isallowed.
8.6.6 Dynamic GroupingThe system shall be able to dynamically move intersections from one group toanother by time of day, TRPS, or operator intervention.
8.6.7 Transit Vehicle Priority/Emergency Vehicle PreemptionTo accommodate future needs, the system shall be able to interface with local buspriority and emergency vehicle preemption functions. All priority and preemptionactivity shall be logged and easily reportable.
8.7 Database FeaturesAll system data shall be stored in a database management system (DBMS) back-end. The DBMS shall support common data exchanges with other databases usingOpen Database Connectivity (ODBC) or similar open exchange formats. AllDBMS entries shall be checked for data type and allowable range to ensure dataintegrity.

Newport News Signal System Feasibility Study
April 2006 Page 117 of 125
8.7.1 Intersection Controller DataUsers with appropriate access permissions shall be able to upload or downloadeach controller’s database to the DBMS. Uploads and downloads shall notinterrupt normal operation of the controller, unless a download involves changesthat require the controller to reinitialize. The system shall ensure an upload ordownload is done in full or not at all.The system shall allow the local controller database to be compared with theDBMS with discrepancies logged. The user shall be able to select which databaseto apply to resolve the discrepancy. A system-wide discrepancy report will begenerated on a daily basis and automatically stored on the primary system servers.The system shall allow a user to make a copy of a controller database whileremoving site specific information (e.g., cross streets, identification number).
8.7.2 Import/Export of Timing Plans in Synchro File FormatThe system shall allow the user to import and export timing plans to Synchro 6.0or the most current version at the time the equipment is purchased.
8.7.3 System Detector DataThe system shall be able to download and store system detector data for off-lineanalysis. It shall store all data up to a user-specified time, overwriting older data.
8.8 Status MonitoringThe system shall monitor all field devices and log activity such as:
• Communication errors• Controller failure• Flash condition• Local and system detector status• Cabinet door open• Conflict monitor status• Pedestrian actuation• Conflicting local controller and system data• Local preemption• Local manual control
8.8.1 Status DisplaysThe system shall provide real-time status displays, refreshed once per second, withdetailed information on the following:
• Controller status (e.g., mode, green phase(s), ring status)• Coordination status• Preemption status• Time base status• Detector status• Malfunction Management Unit (MMU) status (for TS-2 Type 1 cabinets)

Newport News Signal System Feasibility Study
April 2006 Page 118 of 125
• Group status
8.8.2 Alarms/PagingThe system shall be configurable to page numbers at user-defined alarmconditions. The system shall allow the user to configure which number(s) arepaged for different alarm conditions. The system shall be configurable to pagedifferent numbers at different times of day and day of the week. The system shallsupport distribution to at least 50 different paging numbers, or provide an email-to-paging interface.
8.9 Reporting
8.9.1 Predefined ReportsThe system shall produce a variety of predefined reports to help users managesystem performance. Reports shall include a high level of detail and beprofessional in appearance in order to not require substantial formatting beforebeing distributed to stakeholders. Predefined reports shall include, at a minimum,for either intersections or control groups:
• Measures of effectiveness• Intersection detector volumes• System detector volume and occupancy• Communication faults• Detector faults• Local alarms• MMU faults• Group reports• Group traffic-responsive plan changes• Traffic-responsive system detector parameters and threshold comparisons
8.9.2 Custom ReportsThe system shall allow users to define custom reports from any database entryeither from scratch or based on a predefined report.
8.9.3 Event LogAn event log shall record system activity by date and time. It shall be viewable,sortable, filterable and printable.
8.10 Other ITS Devices
8.10.1 CCTV SubsystemThe system shall support a closed-circuit television (CCTV) camera interface.
• The CCTV subsystem shall be able to support 50 cameras (36 planned withroom for future expansion).

Newport News Signal System Feasibility Study
April 2006 Page 119 of 125
• The CCTV video distribution system shall be digital, with field encoders andcentral office decoders. It shall support MPEG-2 and MPEG-4 videocompression standards.
• The CCTV subsystem shall share the same user interface as, and be integratedwith, the central system software.
• The CCTV subsystem shall allow the user to view 10 full-motion video feedssimultaneously.
• Video and control shall be shared between the Newport News OperationsCenter, Newport News City Hall, the Emergency Operations Center (EOC)the VDOT Hampton Roads Smart Traffic Center, and shall provide room forexpansion.
• The CCTV subsystem shall include logic for a control hierarchy. Higherpriority users (based on login identification) shall be able to assumepan/tilt/zoom control over a lower priority user. Once assuming control of acamera, a user should be able to lock out lower priority users. After a user-configurable length of time of inactivity, the lock should end allowing anyuser to assume control. The interface shall indicate which login has control.After a predetermined period of inactivity, the CCTV subsystem shall supportautomatically returning to a default preset position.
8.10.2 DMS SubsystemThe system shall support a dynamic message sign (DMS) subsystem.
• The system shall be able to support the use of 20 portable DMS simultaneouslythat will communicate with the central system via a cellular modem.
• The signs shall support NTCIP standard.• The central software shall communicate with the signs via NTCIP standard.• The DMS subsystem shall share the same user interface as, and be integrated
with, the central system software.• The user interface shall show the current message as shown on the sign and
allow the user to select a message from a library for a given sign.• The system shall poll for status and diagnostic information per the NTCIP
standard and log errors and raise system alarms.
8.11 Local Intersection Functional RequirementsThis section describes local intersection requirements, which are based on theTechnology Review portion of the feasibility study. The Newport News trafficsignal system may have some combination of intersections with:
• NEMA TS-1 cabinets (re-use existing) and NEMA TS-2 Type 2 controllers(new)
• NEMA TS-2 cabinets (new) and NEMA TS-2 Type 1 controllers (new)
All existing cabinets are TS-1. The majority, if not all, will be upgraded to TS-2,with the possible exception of a number of pole-mounted cabinets in the

Newport News Signal System Feasibility Study
April 2006 Page 120 of 125
downtown and southeast community. The functional requirements listed belowapply to all controllers.
Controllers shall be fully actuated. They shall be fully compatible with the centralsoftware and allow block upload and download of all timing plan parameters. Theyshall meet the minimum specifications described below.
8.12 Hardware• Shall meet NEMA TS-2 standards for traffic controllers.• Shall have a front panel multi-line alphanumeric backlit display to show all
operational parameters and states.• Shall have an alphanumeric keypad to allow the controller to be programmed
without requiring a laptop.• Shall store all timing and control parameters in flash memory. Settings shall not
be lost during power outages.• Surge protection shall be provided for all hardware.
8.13 Communications• The software shall be updatable from a computer or laptop via serial or Ethernet
connections.• Built-in 10-Base T Ethernet and Infrared ports.• Shall be able to receive time broadcasts from the central system software or a
Network Time Protocol (NTP) server to update internal clocks.
8.14 Traffic Control Features• 16 Vehicle Phases• 16 Pedestrian Phases• 4 Timing Rings• 16 Overlaps• 64 Detectors• 16 System Detectors, each with up to 10 different traffic response thresholds• 120 coordination plans, each with its own cycle length, offset and split
8.15 Time-Base Control• 200 Events• 99 Day Programs• 10 Week Programs• 36 Exception Day Programs that can override normal day programs
8.16 Preemption/Priority• 6 Preemption Routines• 6 Priority Routines

Newport News Signal System Feasibility Study
April 2006 Page 121 of 125
8.17 Logs• Local Alarm Log• Communications Fault Log• Detector Fault Log• System Detector Log• Measures of Effectiveness (MOE) Log• Detector Volume Count Log• Cycle MOE Log• Malfunction Management Unit (MMU) Fault Log (for NEMA TS-2 cabinets)
8.18 Diagnostics & Status Displays• Monitor Compatibility Diagnostics• Monitor Field Status Diagnostics• Cycling Diagnostics• Detector Diagnostics• Port Message and Communication Status Displays• Hardware I/O Status Display• MMU Status Display
8.19 Communications
8.19.1 Communications with On-Street EquipmentThe system shall communicate with all on-street equipment at a minimum of once-per-minute to monitor status. Should communication between the central systemand a controller fail, the controller shall revert to its local TBC settings.
8.19.2 MediaThe system shall support Ethernet communications with field devices over fiberoptic cable or twisted pair copper wire.
8.19.3 NTCIP ComplianceThe system shall comply with the following National Communications for ITSProtocol (NTCIP) standards (including all applicable base standards referencedtherein):
• NTCIP 1202: Object Definitions for Actuated Signal Control (ASC)• NTCIP 1203: Object Definitions for Dynamic Message Signs (DMS)
8.19.4 Traveler Information InterfacesIn support of regional traffic/incident management and information sharingbetween agencies, the City’s upgraded ATMS platform will enable better use ofavailable staff by automating the distribution/delivery of information to otherpartnering traffic management agencies.

Newport News Signal System Feasibility Study
April 2006 Page 122 of 125
VDOT’s primary traveler information system is centered on the VirginiaOperational Information System (VOIS) and the 511 telephone system. VDOT’sVOIS platform is undergoing major upgrades, which are slated to be completed inlate 2006. Many of these upgrades have not been sufficiently documented to alevel that will allow for the City of Newport News to define an interface withVDOT and the City’s proposed ATMS platform. Therefore, once both systems(e.g. the City’s ATMS and VDOT’s VOIS2) are operational a formal interfacespecification should be developed for sharing information, or directly enteringinformation, between the two agencies. At a minimum, the selected ATMSplatform shall provide:
• The ability to store and catalog video image snapshots for each City cameralocation on a periodic basis (i.e. once per minute) for the purpose of sharingwith regional traveler information systems.
• The ability to track and update local construction, lane closures, and plannedspecial event schedules to supplement 511 and other traveler informationservices.
• The ability to track and update local detours (traffic or weather/flood related).• Exchangeable data formats (i.e. XML, GIS shape files, etc.)

Newport News Signal System Feasibility Study
April 2006 Page 123 of 125
9.0 Summary
9.1 Framework for the Future PoliciesWithin the City of Newport News’ Framework for the Future, there are 8 key goalswithin the Transportation section (Chapter 4). These goals are as follows:GOAL 1 Plan and develop a balanced transportation system to reduce congestion and support
the city's future growth and development.
GOAL 2 Improve bus service in the city.
GOAL 3 Improve the city's streets to accommodate existing and projected traffic.
GOAL 4 Reduce the impact of traffic on residential neighborhoods.
GOAL 5 Increase public awareness and involvement in transportation planning.
GOAL 6 Obtain alternative funding sources for transportation projects and improvements.
GOAL 7 Reduce the number of vehicle trips with special emphasis on reducing singleoccupancy trips by car.
GOAL 8 Develop the city's Airport and Seaport as quality facilities.
This section sets forth the following recommendations for additional goals,policies, strategies, and implementation for the advanced traffic managementsystem in order to enhance the existing Framework for the Future.
Transportation GOAL 9: Plan and implement a “responsive” advancedtraffic management system to optimize the efficiency of traffic flowalong City streets.
POLICY 9.1: Develop an advanced traffic management system that can beimplemented with a “phased” approach of compatible modular components.
Strategy 9.1.1: Consider alternative procurement processes for advanced trafficmanagement system to allow for integration of components.Strategy 9.1.2: Clearly define and hold firm the requirements that the system is tobe maintainable, flexible to accept component modifications and constructiblewithin funding schedules.
IMPLEMENTATION 9.1:9.1.1: City to define their needs through development of a “Signal SystemFeasibility Study” and an Intelligent Transportation System (ITS) “MasterPlan”.9.1.2: Provide the opportunity for system equipment vendors to develop a“test-bed” environment allowing competitive evaluation and bidding processprior to the selection of the traffic signal controller hardware and software.

Newport News Signal System Feasibility Study
April 2006 Page 124 of 125
POLICY 9.2: Develop a system that is capable of being expanded through thetraditional signal system life cycle and can incorporate new technologies.
Strategy 9.2.1: Provide for system expansion with new development androadway improvement projects including fiber, ITS field devices, signal upgrades,etc.
Strategy 9.2.2: Review current transportation management technologies on aregular basis to determine system benefits of upgrade.
IMPLEMENTATION 9.2:9.2.1: Facilitate staff evaluation of new hardware and software and fieldtechnologies and update the “Signal System Feasibility Study” and IntelligentTransportation “Master Plan” as needed for phased implementation.
POLICY 9.3: Evaluate reliable communications alternatives and develop aninfrastructure capable of linking traffic signals components (field and central)and intelligent transportation systems as integrated components.
Strategy 9.3.1: Develop a comprehensive communications backbone (City-owned not leased) to be accessible by other City departments.Strategy 9.3.2: Provide supporting resources to troubleshoot and maintain theintegrity/reliability of a responsive communication infrastructure.
IMPLEMENTATION 9.3:9.3.1: Coordinate the resources of Newport News Public Schools and theCity’s Department of Information Technology for strategic use of existingfiber infrastructure and expansion routes to minimize deployment costs.9.3.2: The Signal System Feasibility Study will be formatted to considercommunications alternatives to evaluate the cost-effectiveness of expandingthe City’s existing traffic management capabilities and communicationresources.
POLICY 9.4: Provide Intelligent Transportation System devices at keyintersection, along with programmable traffic signal control to allow formonitoring, responding, and information dissemination.
Strategy 9.4.1: Regionally coordinate coverage locations with adjacenttransportation management agencies to minimize unnecessary overlap and allowfor sharing information with other agencies.
Strategy 9.4.2: Develop Memorandum of Understanding (MOU) with VirginiaDepartment of Transportation Smart Traffic Center for regional traffic incidentmanagement support.

Newport News Signal System Feasibility Study
April 2006 Page 125 of 125
IMPLEMENTATION 9.4:9.4.1: Install cameras for remotely monitoring traffic conditions, verificationof incidents, and for support of regional incident management strategies.9.4.2: Procure and deploy portable dynamic message signs for use in alertingmotorists to short- and long-term road/lane closures, special event routing, andextended diversion routes.
9.4.3: Develop prioritized deployment list based on locations recommended inthe ITS Master Plan.
9.4.4: Procure and deploy over-height vehicle detection/warning systems,flood detection/warning systems, and other devices to provide safer travelconditions for motorists.
Transportation GOAL 10: Provide for interagency coordination via theATMS to optimize efficiency and enhance capabilities of emergencyoperations center (EOC).
POLICY 10.1: Develop standard procedures for coordinating informationbetween the ATMS and the EOC.
Strategy 10.1: Develop data sharing guidelines and MOUs for conveying andreceiving emergency situations.
IMPLEMENTATION 10.1:10.1.1: Identify specific data to share with EOC.
10.1.2: Code data in readable format and identify events that requireimplementation plans.
10.1.3: Develop action plan for responding to data received between EOC andDepartment of Engineering.
10.1.4: Develop action plan for automated data sharing associated withemergency information for 511 traveler information.
10.1.5: Develop an action plan to integrate the City’s EOC with the regionalevacuation and emergency response systems.