Embed Size (px)
Citation preview
Page 1 of 13
767 Fifth Avenue
New York, NY 10153
News Contact:
Investor Relations:
Dennis D’Andrea (212) 572-4384
Media Relations:
Alexandra Trower (212) 572-4430
THE ESTÉE LAUDER COMPANIES REPORTS STRONG SALES AND EARNINGS
GROWTH IN FISCAL 2017 THIRD QUARTER
– Reported Net Sales Rose 8%, Constant Currency Net Sales Increased 9% –
– Reported EPS $.80, Adjusted EPS $.91 –
– Company On Track To Deliver Strong Full-Year Results –
New York, NY, May 3, 2017 - The Estée Lauder Companies Inc. (NYSE: EL) today reported net
sales of $2.86 billion for its third quarter ended March 31, 2017, an 8% increase compared with
$2.66 billion in the prior-year quarter. Incremental sales from the Company’s recent acquisitions
of Too Faced and BECCA contributed approximately half the reported sales growth.
Net earnings increased 12% to $298 million, compared with $265 million last year. Diluted net
earnings per common share increased 13% to $.80, including the effect of restructuring and other
charges, compared with $.71 in the prior year.
Excluding the impact of foreign currency translation, net sales increased 9%. For the quarter, the
negative impact of foreign currency translation on diluted net earnings per common share was
$.02. Adjusting for restructuring and other charges, diluted net earnings per common share for the
three months ended March 31, 2017 were $.91, and in constant currency rose 28% to $.93.
Fabrizio Freda, President and Chief Executive Officer, said, “We delivered an excellent third
quarter performance. Sales accelerated across every geographic region and in our three largest
product categories, reflecting the range and strength of our brand portfolio and product offerings.
Our business in global travel retail and in China was exceptionally strong, driven by strong sales
gains in virtually every brand. Our mid-sized and luxury brands, as well as online and specialty-
multi retail channels, also led growth. Additionally, our recent acquisitions of Too Faced and
BECCA performed above expectations. These elements contributed to stronger-than-expected
constant currency sales growth that, combined with disciplined expense management, resulted in
sharply higher earnings per share.
“By further penetrating the specialty-multi channel globally and selectively opening freestanding
stores in some key international markets, our brands made great progress reaching new consumers.
Our strategy and financial performance continue to be powered by our ability to deploy our diverse
brand portfolio into fast-growing channels and consumer segments.
Page 2 of 13
“We will continue to seize opportunities in the most promising areas of prestige beauty and expect
our sales growth to continue to accelerate in our fourth quarter, capping another strong fiscal year.
In our fiscal fourth quarter, we plan to increase targeted investment spending behind the greatest
opportunities to further our momentum into fiscal 2018. We are confident in our ability to achieve
our previously stated fiscal 2017 sales growth goal of 6% to 7% in constant currency, which
includes approximately 2% of incremental sales from our recent acquisitions. We are also
reiterating our constant currency earnings per share growth expectation of 8% to 9%, before
charges, which reflects $.07 of dilution related to acquisitions.”
During the fiscal 2017 third quarter, the Company recorded restructuring and other charges of $62
million ($42 million after tax), equal to $.11 per diluted share, in connection with its previously
announced Leading Beauty Forward initiative. During the fiscal 2016 third quarter, the Company
recorded charges of $15 million ($10 million after tax), equal to $.02 per share, in connection with
its initiative to transform its global technology infrastructure. See table on page 10.
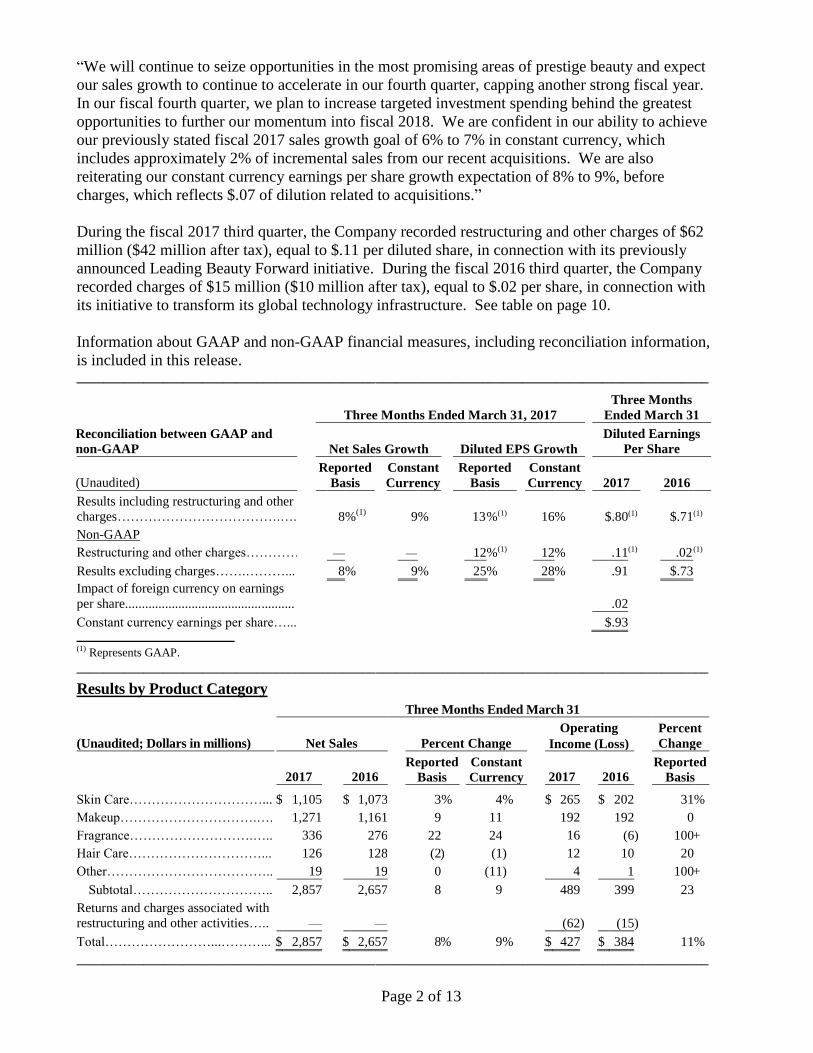
Information about GAAP and non-GAAP financial measures, including reconciliation information,
is included in this release. _______________________________________________________________________________________________
Reconciliation between GAAP and
non-GAAP
Three Months Ended March 31, 2017
Three Months
Ended March 31
Net Sales Growth
Diluted EPS Growth
Diluted Earnings
Per Share
(Unaudited) Reported
Basis
Constant
Currency
Reported
Basis
Constant
Currency
2017 2016
Results including restructuring and other
charges……………………………….….
8 %(1)
9 % 13 %(1) 16 %
$.80 (1) $.71 (1)
Non-GAAP
Restructuring and other charges………………....
— —
12 %(1) 12 % .11 (1) .02 (1)
Results excluding charges…….………...
8 % 9 %
25 % 28 % .91 $.73
Impact of foreign currency on earnings
per share...................................................
.02
Constant currency earnings per share…... $.93
(1) Represents GAAP.
_______________________________________________________________________________________________
Results by Product Category
Three Months Ended March 31
(Unaudited; Dollars in millions) Net Sales Percent Change
Operating
Income (Loss)
Percent
Change
2017 2016
Reported
Basis
Constant
Currency 2017 2016
Reported
Basis
Skin Care…………………………... $ 1,105 $ 1,073 3 % 4 % $ 265 $ 202 31 %
Makeup………………………….…. 1,271 1,161 9 11 192 192 0
Fragrance……………………….….. 336 276 22 24 16 (6 ) 100 +
Hair Care…………………………... 126 128 (2 ) (1 ) 12 10 20
Other……………………………….. 19 19 0 (11 ) 4 1 100 +
Subtotal………………………….. 2,857 2,657 8 9 489 399 23
Returns and charges associated with
restructuring and other activities…..
— —
(62 ) (15 )
Total……………………...………... $ 2,857 $ 2,657 8 % 9 % $ 427 $ 384 11 %
_______________________________________________________________________________________________
Page 3 of 13
Net sales and operating income in the Company’s major product categories were unfavorably
impacted by the strength of the U.S. dollar in relation to most currencies. Total operating income in
constant currency, before charges, increased 25%.
Skin Care
Net sales increased, with sharp double-digit gains from La Mer, driven by the success of new
and existing products, as well as targeted expanded consumer reach.
The Estée Lauder brand delivered solid sales growth primarily in travel retail and China, due,
in part, to gains in the Advanced Night Repair and Revitalizing Supreme lines of products.
Strong double-digit sales growth from GLAMGLOW reflected additional product
assortments and targeted expanded consumer reach.
These increases were partially offset by lower skin care sales from Clinique. The lower sales
reflected sales gains in the Americas being more than offset by lower sales in the other
regions.
Operating income increased sharply, primarily from Estée Lauder and La Mer, reflecting
higher sales. Estée Lauder also benefitted from a favorable comparison to higher spending
behind launches in the prior-year period.
Makeup
Makeup sales increased, primarily driven by incremental sales from the Company’s fiscal
2017 second quarter acquisitions of Too Faced and BECCA, strong double-digit increases
from Tom Ford in every region, double-digit gains from Smashbox and La Mer, and solid
growth from Estée Lauder.
The increased sales in Tom Ford were driven primarily by its lip color franchises, including
new product offerings such as the Tom Ford Soleil Color Collection. Sales gains at
Smashbox reflect the strength of the makeup category in specialty-multi. La Mer’s sales
increase reflected the continued success of the Skin Color Collection. At Estée Lauder,
higher sales were fueled by the Double Wear and Pure Color Envy product lines.
The overall increase in makeup sales also resulted from MAC growth internationally, as
well as our brands’ new product offerings, and selectively increasing their presence in high-
growth channels like travel retail and specialty-multi, to reach new consumers.
These increases were partially offset by lower makeup sales, primarily from Clinique and
MAC in the United States, due to slow foot traffic in U.S. brick-and-mortar stores,
particularly in certain U.S. tourist-driven stores.
Makeup operating income was flat. Tom Ford, Estée Lauder and Bobbi Brown posted
increased operating income, primarily due to higher sales. These increases were offset by
declines from MAC and Clinique, primarily reflecting their lower sales in the U.S.
Fragrance
Net sales increased, primarily due to strong double-digit gains from luxury brands Jo Malone
London, Tom Ford and Le Labo, and incremental sales from the recent acquisition of By
Kilian.
Jo Malone delivered outstanding double-digit sales increases in every region, reflecting strong
growth from existing fragrances and brand expansion and the recent launch of Cologne
Intense Myrrh & Tonka.
Increased sales from Tom Ford reflect, in part, the continued success and growth of existing
fragrances, as well as new product launches.
Le Labo benefitted from new and existing launches and targeted expanded consumer reach.
Page 4 of 13
The recent launches of Tory Burch Love Relentlessly and Michael Kors Wonderlust also
contributed to fragrance sales growth.
Fragrance operating income increased sharply, primarily due to higher sales from our
luxury brands noted above, as well as higher sales of certain designer fragrances.
Hair Care
Hair care sales decreased slightly, primarily due to a difficult comparison with several product
launches in the prior year.
Hair care operating income increased, reflecting effective expense management. _______________________________________________________________________________________________
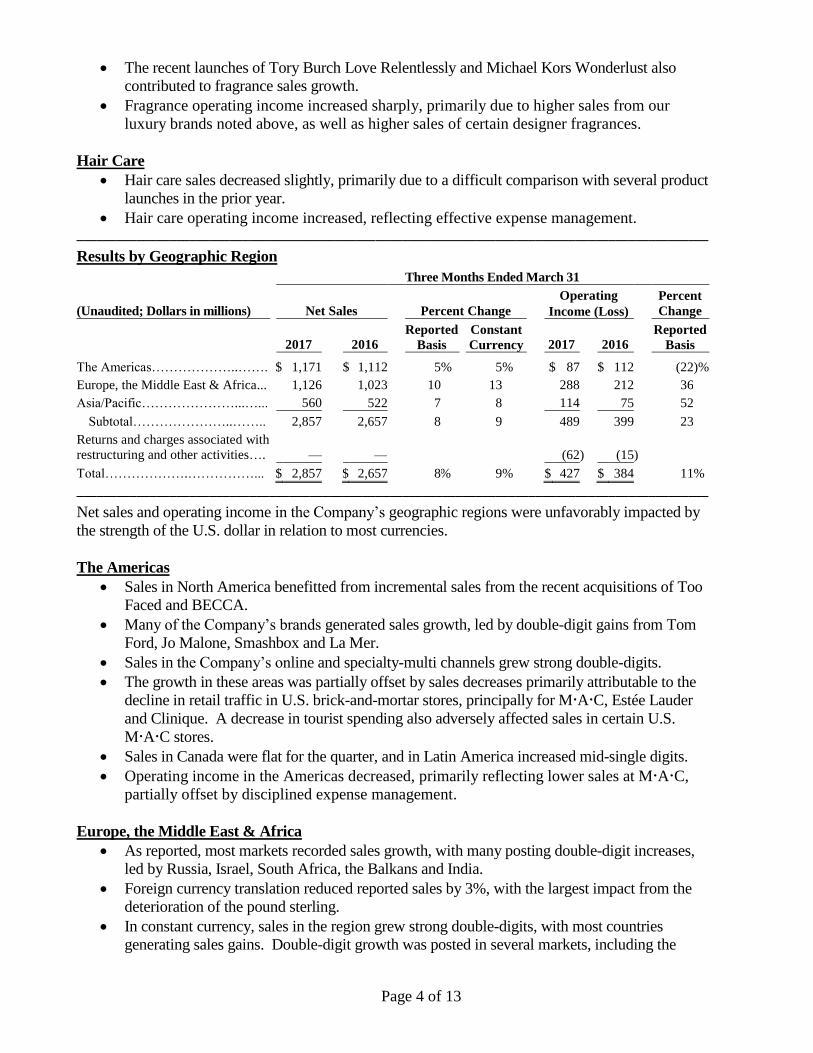
Results by Geographic Region
Three Months Ended March 31
(Unaudited; Dollars in millions) Net Sales Percent Change
Operating
Income (Loss)
Percent
Change
2017 2016
Reported
Basis
Constant
Currency 2017 2016
Reported
Basis
The Americas………………..……. $ 1,171 $ 1,112 5 % 5 % $ 87 $ 112 (22 )%
Europe, the Middle East & Africa... 1,126 1,023 10 13 288 212 36
Asia/Pacific…………………...…... 560 522 7 8 114 75 52
Subtotal…………………..…….. 2,857 2,657 8 9 489 399 23
Returns and charges associated with
restructuring and other activities….
— —
(62 ) (15 )
Total……………….……………... $ 2,857 $ 2,657 8 % 9 % $ 427 $ 384 11 %
_______________________________________________________________________________________________
Net sales and operating income in the Company’s geographic regions were unfavorably impacted by
the strength of the U.S. dollar in relation to most currencies.
The Americas
Sales in North America benefitted from incremental sales from the recent acquisitions of Too
Faced and BECCA.
Many of the Company’s brands generated sales growth, led by double-digit gains from Tom
Ford, Jo Malone, Smashbox and La Mer.
Sales in the Company’s online and specialty-multi channels grew strong double-digits.
The growth in these areas was partially offset by sales decreases primarily attributable to the
decline in retail traffic in U.S. brick-and-mortar stores, principally for MAC, Estée Lauder
and Clinique. A decrease in tourist spending also adversely affected sales in certain U.S.
MAC stores.
Sales in Canada were flat for the quarter, and in Latin America increased mid-single digits.
Operating income in the Americas decreased, primarily reflecting lower sales at MAC,
partially offset by disciplined expense management.
Europe, the Middle East & Africa
As reported, most markets recorded sales growth, with many posting double-digit increases,
led by Russia, Israel, South Africa, the Balkans and India.
Foreign currency translation reduced reported sales by 3%, with the largest impact from the
deterioration of the pound sterling.
In constant currency, sales in the region grew strong double-digits, with most countries
generating sales gains. Double-digit growth was posted in several markets, including the
Page 5 of 13
Balkans, Central Europe, Israel, Russia and Nordic, as well as strong growth in the U.K. and
Italy.
In travel retail, exceptionally strong double-digit sales growth was generated across brands,
led by Tom Ford, Jo Malone, La Mer, MAC and Estée Lauder. This increase, combined
with global airline passenger traffic growth, solid new launch initiatives, and targeted
expanded consumer reach, contributed sharply to the sales gains.
In constant currency, lower sales were posted in the Middle East, driven by retailer inventory
rebalancing, reflecting the impact of the macro-environment on consumer purchases.
Operating income increased, led by strong double-digit operating results in travel retail and
the U.K.
Asia/Pacific
On a reported basis and in constant currency, sales increased, led by strong double-digit
growth in China. The higher sales in China reflected strong double-digit gains in most brands
and in the online, freestanding store and department store channels.
Reported sales in Taiwan also grew double-digits, while in constant currency, Malaysia
generated strong sales gains. The Company’s business in Hong Kong continues to stabilize.
Tom Ford, Jo Malone, La Mer and MAC each grew strong double-digits.
These increases were partially offset by slightly lower sales in Indonesia and the Philippines.
In Asia/Pacific, operating income increased, primarily due to higher results in China and
Singapore.
Nine-Month Results
For the nine months ended March 31, 2017, the Company reported net sales of $8.93
billion, a 4% increase compared with $8.62 billion in the comparable prior-year period.
Net earnings were $1.02 billion, compared with $1.02 billion in the same period last year.
Diluted net earnings per common share increased 1% to $2.74, including the effect of
restructuring and other charges, compared with $2.71 reported in the prior-year period.
Excluding the impact of foreign currency translation, net sales increased 5%. For the nine
months ended March 31, 2017, the negative impact of foreign currency translation on
diluted net earnings per common share was $.10. Adjusting for restructuring and other
charges, diluted net earnings per common share for the nine months ended March 31, 2017
were $2.97, and in constant currency rose 11% to $3.07.
During the nine-months ended March 31, 2017, the Company recorded restructuring and
other charges of $134 million ($88 million after tax), equal to $.24 per diluted share, in
connection with its previously announced Leading Beauty Forward initiative.
The prior-period nine-month results include charges of $34 million ($22 million after tax),
equal to $.06 per share in connection with the Company’s initiative to transform its global
technology infrastructure.
Cash Flows from Operating Activities
For the nine months ended March 31, 2017, net cash flows provided by operating activities
were $1.25 billion, compared with $1.32 billion in the prior year.
The change primarily resulted from unfavorable changes in certain working capital
components.
Page 6 of 13
Outlook for Fiscal 2017 Full Year
Global prestige beauty remains a vibrant industry estimated to grow approximately 4% to 5%.
There are risks related to social and political issues, terrorism, currency volatility and economic
challenges affecting consumer behavior in certain countries. We are also cautious of the decline in
retail traffic, primarily related to brick-and-mortar stores and certain tourist-driven doors in the
United States. The Company’s annual growth has consistently outpaced global prestige beauty
and, despite these global issues, is expected to continue to grow at least one percentage point
ahead of the industry for the fiscal year, which is our strategic goal.
The Company expects sales growth to continue to progressively accelerate during its fiscal fourth
quarter driven by strong innovation programs, greater outreach to target consumers for our fast-
growing brands in winning channels, regular price increases, organic growth, easier comparisons
in certain markets, improvement in Hong Kong, and accelerating incremental sales from recent
acquisitions.
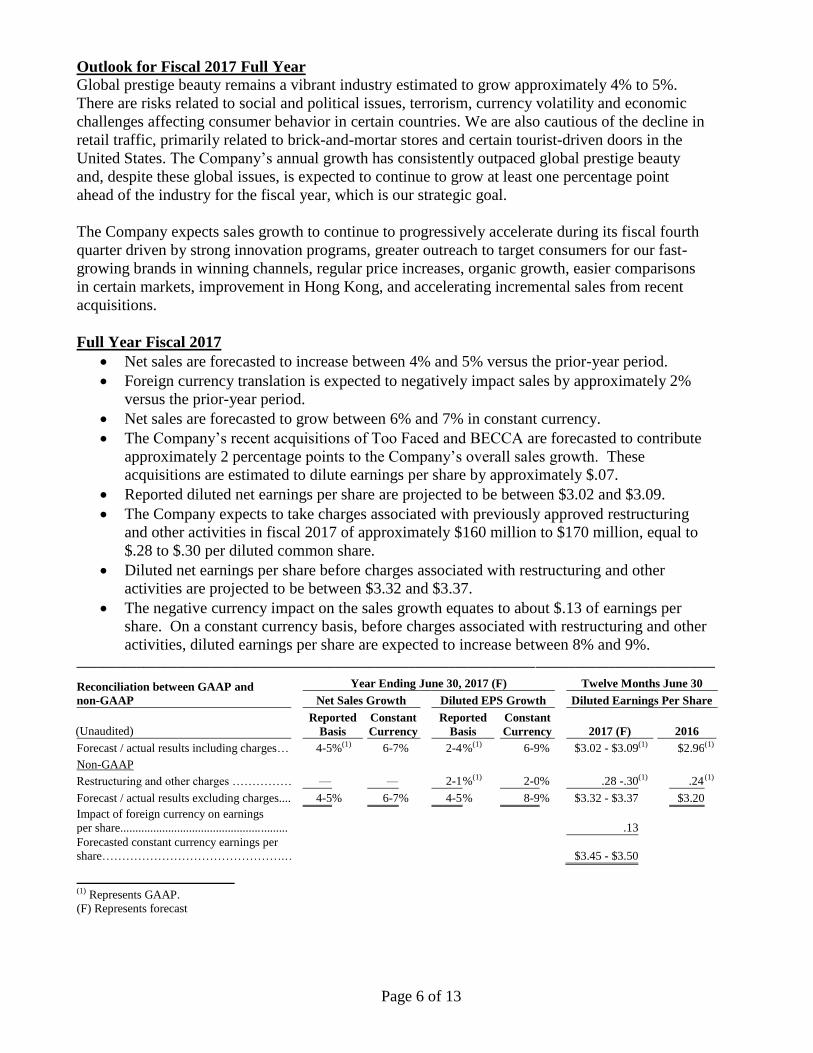
Full Year Fiscal 2017
Net sales are forecasted to increase between 4% and 5% versus the prior-year period.
Foreign currency translation is expected to negatively impact sales by approximately 2%
versus the prior-year period.
Net sales are forecasted to grow between 6% and 7% in constant currency.
The Company’s recent acquisitions of Too Faced and BECCA are forecasted to contribute
approximately 2 percentage points to the Company’s overall sales growth. These
acquisitions are estimated to dilute earnings per share by approximately $.07.
Reported diluted net earnings per share are projected to be between $3.02 and $3.09.
The Company expects to take charges associated with previously approved restructuring
and other activities in fiscal 2017 of approximately $160 million to $170 million, equal to
$.28 to $.30 per diluted common share.
Diluted net earnings per share before charges associated with restructuring and other
activities are projected to be between $3.32 and $3.37.
The negative currency impact on the sales growth equates to about $.13 of earnings per
share. On a constant currency basis, before charges associated with restructuring and other
activities, diluted earnings per share are expected to increase between 8% and 9%. ________________________________________________________________________________________________
Reconciliation between GAAP and
non-GAAP
Year Ending June 30, 2017 (F) Twelve Months June 30
Net Sales Growth
Diluted EPS Growth Diluted Earnings Per Share
(Unaudited) Reported
Basis
Constant
Currency
Reported
Basis
Constant
Currency
2017 (F) 2016
Forecast / actual results including charges… 4-5 %(1) 6-7 % 2-4 %(1) 6-9 % $3.02 - $3.09 (1) $2.96 (1)
Non-GAAP
Restructuring and other charges …………….…... — —
2-1 %(1) 2-0 % .28 -.30 (1) .24 (1)
Forecast / actual results excluding charges.... 4-5 % 6-7 % 4-5 % 8-9 % $3.32 - $3.37 $3.20
Impact of foreign currency on earnings
per share........................................................
.13
Forecasted constant currency earnings per
share……………………………………….…
$3.45 - $3.50
(1) Represents GAAP.
(F) Represents forecast
Page 7 of 13
Conference Call
The Estée Lauder Companies will host a conference call at 9:30 a.m. (ET) today, May 3, 2017 to
discuss its results. The dial-in number for the call is 888-294-4716 in the U.S. or 706-902-0101
internationally (conference ID number: 9981045). The call will also be webcast live at
http://www.elcompanies.com/investors/events-and-presentations.
Cautionary Note Regarding Forward-Looking Statements The forward-looking statements in this press release, including those containing words like “expect,” “plans,” “may,”
“could,” “anticipate,” “estimate,” “projected,” “forecasted,” those in Mr. Freda’s remarks and those in the “Outlook
for Fiscal 2017 Full Year” section involve risks and uncertainties. Factors that could cause actual results to differ
materially from those forward-looking statements include the following:
(1) increased competitive activity from companies in the skin care, makeup, fragrance and hair care businesses;
(2) the Company’s ability to develop, produce and market new products on which future operating results may
depend and to successfully address challenges in the Company’s business;
(3) consolidations, restructurings, bankruptcies and reorganizations in the retail industry, and other factors
causing a decrease in the number of stores that sell the Company’s products, an increase in the ownership
concentration within the retail industry, ownership of retailers by the Company’s competitors or ownership
of competitors by the Company’s customers that are retailers and our inability to collect receivables;
(4) destocking and tighter working capital management by retailers;
(5) the success, or changes in timing or scope, of new product launches and the success, or changes in the
timing or the scope, of advertising, sampling and merchandising programs;
(6) shifts in the preferences of consumers as to where and how they shop for the types of products and services
the Company sells;
(7) social, political and economic risks to the Company’s foreign or domestic manufacturing, distribution and
retail operations, including changes in foreign investment and trade policies and regulations of the host
countries and of the United States;
(8) changes in the laws, regulations and policies (including the interpretations and enforcement thereof) that
affect, or will affect, the Company’s business, including those relating to its products or distribution
networks, changes in accounting standards, tax laws and regulations, environmental or climate change laws,
regulations or accords, trade rules and customs regulations, and the outcome and expense of legal or
regulatory proceedings, and any action the Company may take as a result;
(9) foreign currency fluctuations affecting the Company’s results of operations and the value of its foreign
assets, the relative prices at which the Company and its foreign competitors sell products in the same
markets and the Company’s operating and manufacturing costs outside of the United States;
(10) changes in global or local conditions, including those due to the volatility in the global credit and equity
markets, natural or man-made disasters, real or perceived epidemics, or energy costs, that could affect
consumer purchasing, the willingness or ability of consumers to travel and/or purchase the Company’s
products while traveling, the financial strength of the Company’s customers, suppliers or other contract
counterparties, the Company’s operations, the cost and availability of capital which the Company may need
for new equipment, facilities or acquisitions, the returns that the Company is able to generate on its pension
assets and the resulting impact on its funding obligations, the cost and availability of raw materials and the
assumptions underlying the Company’s critical accounting estimates;
(11) shipment delays, commodity pricing, depletion of inventory and increased production costs resulting from
disruptions of operations at any of the facilities that manufacture nearly all of the Company’s supply of a
particular type of product (i.e. focus factories) or at the Company’s distribution or inventory centers,
including disruptions that may be caused by the implementation of information technology initiatives or by
restructurings;
(12) real estate rates and availability, which may affect the Company’s ability to increase or maintain the number
of retail locations at which the Company sells its products and the costs associated with the Company’s
other facilities;
(13) changes in product mix to products which are less profitable;
(14) the Company’s ability to acquire, develop or implement new information and distribution technologies and
initiatives on a timely basis and within the Company’s cost estimates and the Company’s ability to maintain
continuous operations of such systems and the security of data and other information that may be stored in
such systems or other systems or media;
Page 8 of 13
(15) the Company’s ability to capitalize on opportunities for improved efficiency, such as publicly-announced
strategies and restructuring and cost-savings initiatives, and to integrate acquired businesses and realize
value therefrom;
(16) consequences attributable to local or international conflicts around the world, as well as from any terrorist
attack, retaliation or similar threats;
(17) the timing and impact of acquisitions, investments and divestitures; and
(18) additional factors as described in the Company’s filings with the Securities and Exchange Commission,
including its Annual Report on Form 10-K for the fiscal year ended June 30, 2016.
The Company assumes no responsibility to update forward-looking statements made herein or otherwise.
The Estée Lauder Companies Inc. is one of the world’s leading manufacturers and marketers of
quality skin care, makeup, fragrance and hair care products. The Company’s products are sold in
over 150 countries and territories under brand names including: Estée Lauder, Aramis, Clinique,
Prescriptives, Lab Series, Origins, Tommy Hilfiger, M•A•C, Kiton, La Mer, Bobbi Brown, Donna
Karan New York, DKNY, Aveda, Jo Malone London, Bumble and bumble, Michael Kors,
Darphin, Tom Ford, Smashbox, Ermenegildo Zegna, AERIN, Tory Burch, RODIN olio lusso, Le
Labo, Editions de Parfums Frédéric Malle, GLAMGLOW, By Kilian, BECCA and Too Faced.
An electronic version of this release can be found at the Company’s website, www.elcompanies.com.
ELC-F
ELC-E
Page 9 of 13
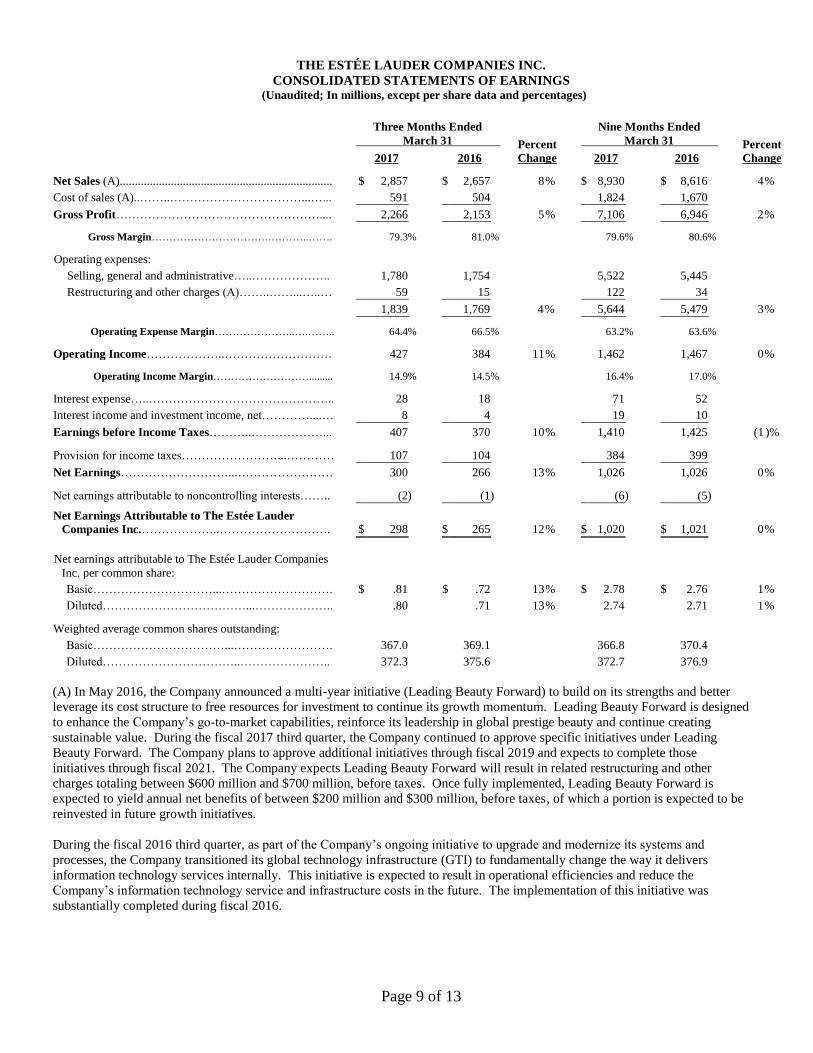
THE ESTÉE LAUDER COMPANIES INC.
CONSOLIDATED STATEMENTS OF EARNINGS (Unaudited; In millions, except per share data and percentages)
Three Months Ended
March 31
Percent
Change
Nine Months Ended
March 31
Percent
Change 2017 2016 2017 2016
Net Sales (A)....................................................................... $ 2,857 $ 2,657 8 % $ 8,930 $ 8,616 4 %
Cost of sales (A)..……..……………………………...…... 591 504 1,824 1,670
Gross Profit…………………………………………….... 2,266 2,153 5 % 7,106 6,946 2 %
Gross Margin…………………………….………..……. 79.3 % 81.0 % 79.6 % 80.6 %
Operating expenses:
Selling, general and administrative…..……………….. 1,780 1,754 5,522 5,445
Restructuring and other charges (A)……..……...…..… 59 15 122 34
1,839 1,769 4 % 5,644 5,479 3 %
Operating Expense Margin…………………..….…….. 64.4 % 66.5 % 63.2 % 63.6 %
Operating Income………………..……………………… 427 384 11 % 1,462 1,467 0 %
Operating Income Margin………………………......... 14.9 % 14.5 % 16.4 % 17.0 %
Interest expense…..……………………………………….. 28 18 71 52
Interest income and investment income, net…………....… 8 4 19 10
Earnings before Income Taxes………..………………... 407 370 10 % 1,410 1,425 (1 )%
Provision for income taxes……………………...………… 107 104 384 399
Net Earnings………………………...…………………… 300 266 13 % 1,026 1,026 0 %
Net earnings attributable to noncontrolling interests…….. (2 ) (1 ) (6 ) (5 )
Net Earnings Attributable to The Estée Lauder
Companies Inc.………………..……………………….
$ 298
$ 265
12 %
$ 1,020
$ 1,021
0 %
Net earnings attributable to The Estée Lauder Companies
Inc. per common share:
Basic…………………………...………………………. $ .81 $ .72 13 % $ 2.78 $ 2.76 1 %
Diluted………………………………...……………….. .80 .71 13 % 2.74 2.71 1 %
Weighted average common shares outstanding:
Basic……………………………...……………………. 367.0 369.1 366.8 370.4
Diluted……………………………..………………….. 372.3 375.6 372.7 376.9
(A) In May 2016, the Company announced a multi-year initiative (Leading Beauty Forward) to build on its strengths and better
leverage its cost structure to free resources for investment to continue its growth momentum. Leading Beauty Forward is designed
to enhance the Company’s go-to-market capabilities, reinforce its leadership in global prestige beauty and continue creating
sustainable value. During the fiscal 2017 third quarter, the Company continued to approve specific initiatives under Leading
Beauty Forward. The Company plans to approve additional initiatives through fiscal 2019 and expects to complete those
initiatives through fiscal 2021. The Company expects Leading Beauty Forward will result in related restructuring and other
charges totaling between $600 million and $700 million, before taxes. Once fully implemented, Leading Beauty Forward is
expected to yield annual net benefits of between $200 million and $300 million, before taxes, of which a portion is expected to be
reinvested in future growth initiatives.
During the fiscal 2016 third quarter, as part of the Company’s ongoing initiative to upgrade and modernize its systems and
processes, the Company transitioned its global technology infrastructure (GTI) to fundamentally change the way it delivers
information technology services internally. This initiative is expected to result in operational efficiencies and reduce the
Company’s information technology service and infrastructure costs in the future. The implementation of this initiative was
substantially completed during fiscal 2016.
Page 10 of 13
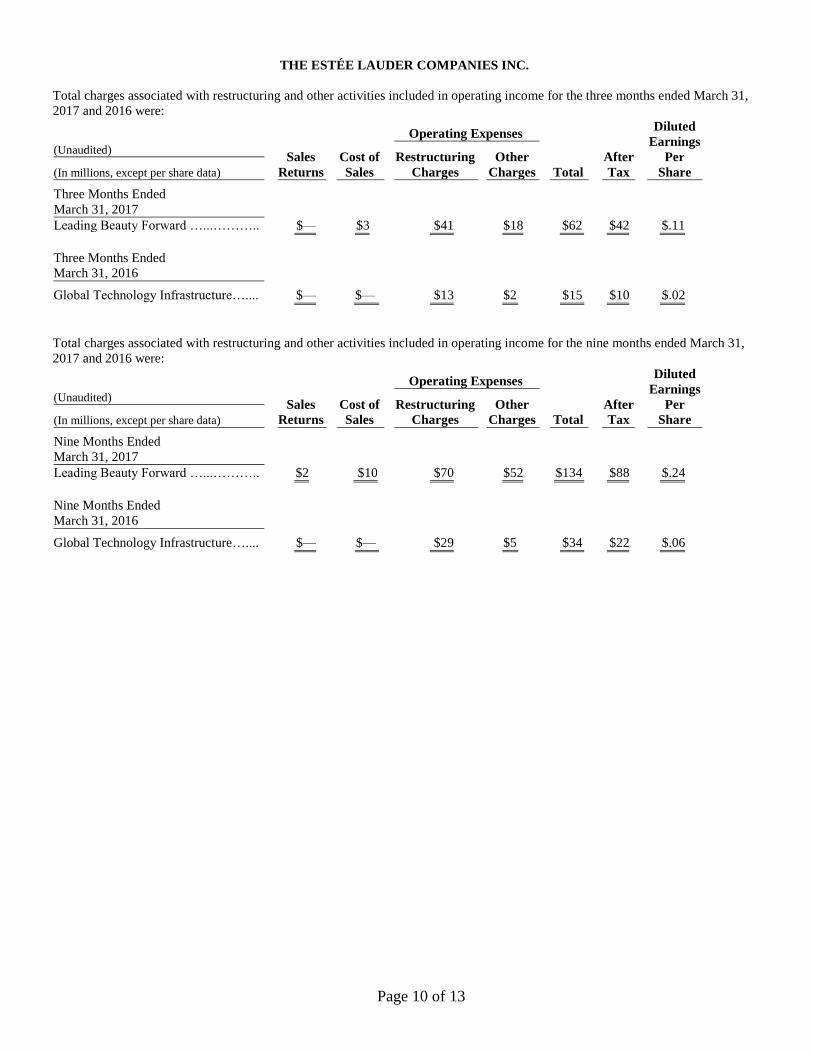
THE ESTÉE LAUDER COMPANIES INC.
Total charges associated with restructuring and other activities included in operating income for the three months ended March 31,
2017 and 2016 were:
Sales
Returns
Cost of
Sales
Operating Expenses
Total
After
Tax
Diluted
Earnings
Per
Share
(Unaudited) Restructuring
Charges
Other
Charges (In millions, except per share data)
Three Months Ended
March 31, 2017
Leading Beauty Forward …...……….. $— $3 $41 $18 $62 $42 $.11
Three Months Ended
March 31, 2016
Global Technology Infrastructure….... $— $— $13 $2 $15 $10 $.02
Total charges associated with restructuring and other activities included in operating income for the nine months ended March 31,
2017 and 2016 were:
Sales
Returns
Cost of
Sales
Operating Expenses
Total
After
Tax
Diluted
Earnings
Per
Share
(Unaudited) Restructuring
Charges
Other
Charges (In millions, except per share data)
Nine Months Ended
March 31, 2017
Leading Beauty Forward …...……….. $2 $10 $70 $52 $134 $88 $.24
Nine Months Ended
March 31, 2016
Global Technology Infrastructure….... $— $— $29 $5 $34 $22 $.06
Page 11 of 13
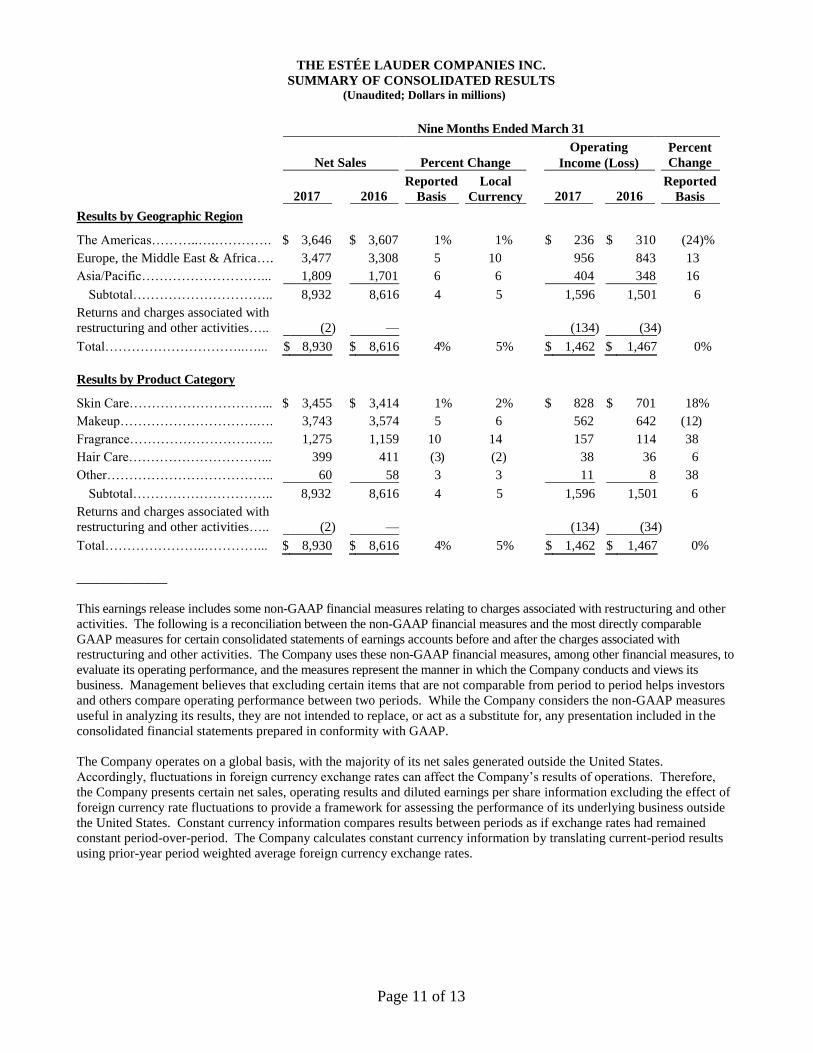
THE ESTÉE LAUDER COMPANIES INC.
SUMMARY OF CONSOLIDATED RESULTS (Unaudited; Dollars in millions)
Nine Months Ended March 31
Net Sales Percent Change
Operating
Income (Loss)
Percent
Change
2017 2016
Reported
Basis
Local
Currency 2017 2016
Reported
Basis
Results by Geographic Region
The Americas………..….…………. $ 3,646 $ 3,607 1 % 1 % $ 236 $ 310 (24 )%
Europe, the Middle East & Africa…. 3,477 3,308 5 10 956 843 13
Asia/Pacific………………………... 1,809 1,701 6 6 404 348 16
Subtotal………………………….. 8,932 8,616 4 5 1,596 1,501 6
Returns and charges associated with
restructuring and other activities…..
(2 ) —
(134 ) (34 )
Total…………………………..…... $ 8,930 $ 8,616 4 % 5 % $ 1,462 $ 1,467 0 %
Results by Product Category
Skin Care…………………………... $ 3,455 $ 3,414 1 % 2 % $ 828 $ 701 18 %
Makeup………………………….…. 3,743 3,574 5 6 562 642 (12 )
Fragrance……………………….….. 1,275 1,159 10 14 157 114 38
Hair Care…………………………... 399 411 (3 ) (2 ) 38 36 6
Other……………………………….. 60 58 3 3 11 8 38
Subtotal………………………….. 8,932 8,616 4 5 1,596 1,501 6
Returns and charges associated with
restructuring and other activities…..
(2 ) —
(134 ) (34 )
Total…………………..…………... $ 8,930 $ 8,616 4 % 5 % $ 1,462 $ 1,467 0 %
______________
This earnings release includes some non-GAAP financial measures relating to charges associated with restructuring and other
activities. The following is a reconciliation between the non-GAAP financial measures and the most directly comparable
GAAP measures for certain consolidated statements of earnings accounts before and after the charges associated with
restructuring and other activities. The Company uses these non-GAAP financial measures, among other financial measures, to
evaluate its operating performance, and the measures represent the manner in which the Company conducts and views its
business. Management believes that excluding certain items that are not comparable from period to period helps investors
and others compare operating performance between two periods. While the Company considers the non-GAAP measures
useful in analyzing its results, they are not intended to replace, or act as a substitute for, any presentation included in the
consolidated financial statements prepared in conformity with GAAP.
The Company operates on a global basis, with the majority of its net sales generated outside the United States.
Accordingly, fluctuations in foreign currency exchange rates can affect the Company’s results of operations. Therefore,
the Company presents certain net sales, operating results and diluted earnings per share information excluding the effect of
foreign currency rate fluctuations to provide a framework for assessing the performance of its underlying business outside
the United States. Constant currency information compares results between periods as if exchange rates had remained
constant period-over-period. The Company calculates constant currency information by translating current-period results
using prior-year period weighted average foreign currency exchange rates.
Page 12 of 13
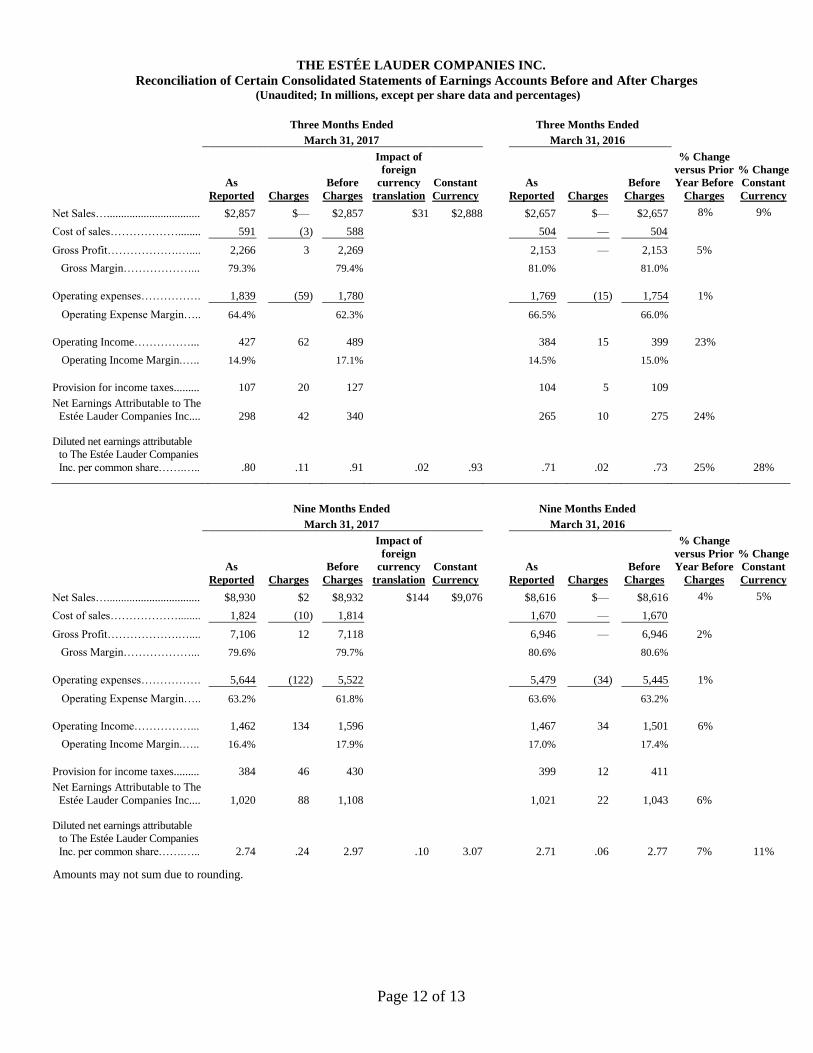
THE ESTÉE LAUDER COMPANIES INC.
Reconciliation of Certain Consolidated Statements of Earnings Accounts Before and After Charges (Unaudited; In millions, except per share data and percentages)
Three Months Ended
March 31, 2017
Three Months Ended
March 31, 2016
As
Reported Charges
Before
Charges
Impact of
foreign
currency
translation
Constant
Currency
As
Reported Charges
Before
Charges
% Change
versus Prior
Year Before
Charges
% Change
Constant
Currency
Net Sales…................................. $2,857 $— $2,857 $31 $2,888 $2,657 $— $2,657 8% 9%
Cost of sales………………........ 591 (3 ) 588 504 — 504
Gross Profit……………….….... 2,266 3 2,269 2,153 — 2,153 5%
Gross Margin………………... 79.3% 79.4% 81.0% 81.0%
Operating expenses……………. 1,839 (59 ) 1,780 1,769 (15 ) 1,754 1%
Operating Expense Margin….. 64.4% 62.3% 66.5% 66.0%
Operating Income……………... 427 62 489 384 15 399 23%
Operating Income Margin.….. 14.9% 17.1% 14.5% 15.0%
Provision for income taxes......... 107 20 127 104 5 109
Net Earnings Attributable to The
Estée Lauder Companies Inc.... 298 42 340 265 10 275
24%
Diluted net earnings attributable
to The Estée Lauder Companies
Inc. per common share…….….. .80 .11 .91
.02 .93 .71 .02 .73
25% 28%
Nine Months Ended
March 31, 2017
Nine Months Ended
March 31, 2016
As
Reported Charges
Before
Charges
Impact of
foreign
currency
translation
Constant
Currency
As
Reported Charges
Before
Charges
% Change
versus Prior
Year Before
Charges
% Change
Constant
Currency
Net Sales…................................. $8,930 $2 $8,932 $144 $9,076 $8,616 $— $8,616 4% 5%
Cost of sales………………........ 1,824 (10 ) 1,814 1,670 — 1,670
Gross Profit……………….….... 7,106 12 7,118 6,946 — 6,946 2%
Gross Margin………………... 79.6% 79.7% 80.6% 80.6%
Operating expenses……………. 5,644 (122 ) 5,522 5,479 (34 ) 5,445 1%
Operating Expense Margin….. 63.2% 61.8% 63.6% 63.2%
Operating Income……………... 1,462 134 1,596 1,467 34 1,501 6%
Operating Income Margin.….. 16.4% 17.9% 17.0% 17.4%
Provision for income taxes......... 384 46 430 399 12 411
Net Earnings Attributable to The
Estée Lauder Companies Inc.... 1,020 88 1,108 1,021 22 1,043
6%
Diluted net earnings attributable
to The Estée Lauder Companies
Inc. per common share…….….. 2.74 .24 2.97
.10 3.07 2.71 .06 2.77
7% 11%
Amounts may not sum due to rounding.
Page 13 of 13
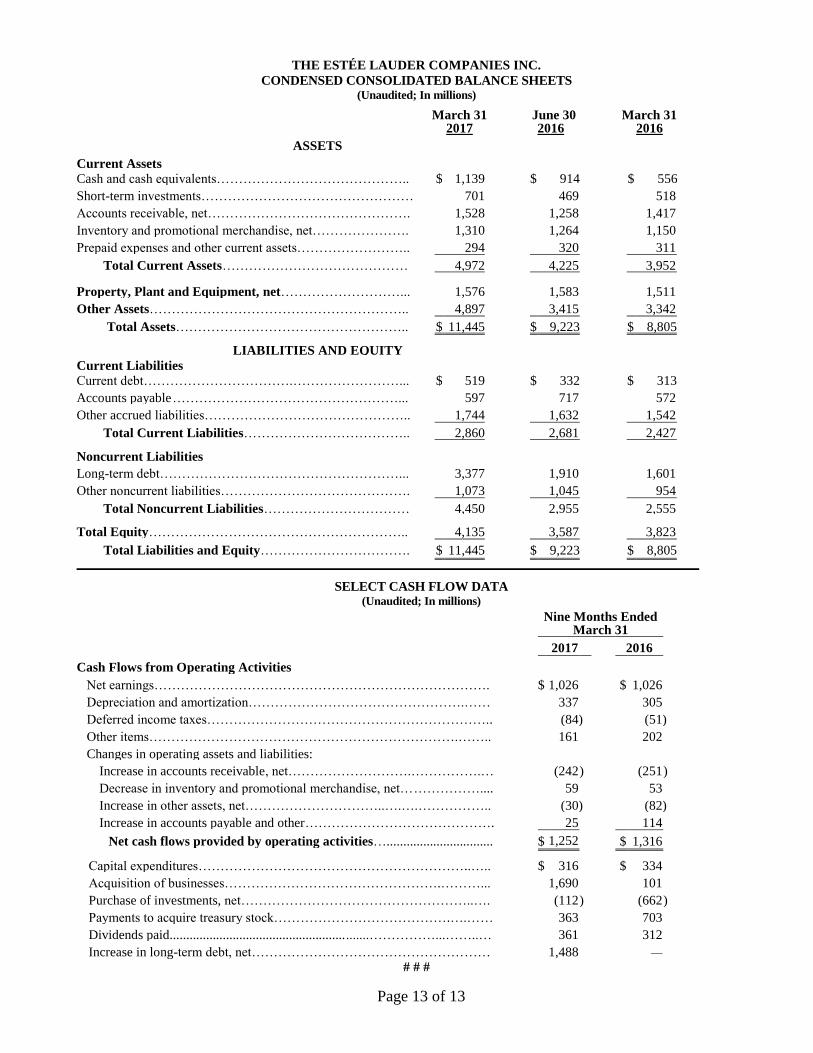
THE ESTÉE LAUDER COMPANIES INC.
CONDENSED CONSOLIDATED BALANCE SHEETS (Unaudited; In millions)
March 31
2017
June 30 2016
March 31 2016
ASSETS
Current Assets
Cash and cash equivalents…………………………………….. $ 1,139 $ 914 $ 556
Short-term investments…………………………………………
ntsinvestments………………………………………..................
....................
701 469 518
Accounts receivable, net………………………………………. 1,528 1,258 1,417
Inventory and promotional merchandise, net…………………. 1,310 1,264
1,150
Prepaid expenses and other current assets…………………….. 294 320 311
Total Current Assets…………………………………… 4,972 4,225 3,952
Property, Plant and Equipment, net………………………... 1,576 1,583 1,511
Other Assets………………………………………………….. 4,897 3,415 3,342
Total Assets…………………………………………….. $ 11,445 $ 9,223 $ 8,805
LIABILITIES AND EQUITY
Current Liabilities
Current debt…………………………….……………………... $ 519 $ 332 $ 313
Accounts payable ……………………………………………... 597 717 572
Other accrued liabilities……………………………………….. 1,744 1,632 1,542
Total Current Liabilities……………………………….. 2,860 2,681 2,427
Noncurrent Liabilities
Long-term debt………………………………………………... 3,377 1,910 1,601
Other noncurrent liabilities……………………………………. 1,073 1,045 954
Total Noncurrent Liabilities…………………………… 4,450 2,955 2,555
Total Equity………………………………………………….. 4,135 3,587 3,823
Total Liabilities and Equity……………………………. $ 11,445 $ 9,223 $ 8,805
SELECT CASH FLOW DATA (Unaudited; In millions)
Nine Months Ended
March 31
2017 2016
Cash Flows from Operating Activities
Net earnings…………………………………………………………………. $ 1,026
726
$ 1,026
Depreciation and amortization………………………………………….…… 337 305
Deferred income taxes………………………………………………………..
taxes…………………………………………………………
remeasurement………………………………………….
taxes………………………………………………….……
(84 ) (51 )
Other items…………………………………………………………….……..
161 202
Changes in operating assets and liabilities:
Increase in accounts receivable, net……………………….…………….…
(242 ) (251 )
Decrease in inventory and promotional merchandise, net………………....
………………..
59 53
Increase in other assets, net…………………………..….….……………..
(30 ) (82 )
Increase in accounts payable and other…………………………………….
………………..……………....…
25 114
Net cash flows provided by operating activities…................................ $ 1,252
824 $ 1,316
Capital expenditures……………………………………………………..….. $ 316 $ 334
Acquisition of businesses………………………………………….………...
1,690 101
Purchase of investments, net……………………………………………..….
net…………………………………….
(112 ) (662 )
Payments to acquire treasury stock………………………………….….……
363 703
Dividends paid............................................................……………...……..…
361 312
Increase in long-term debt, net………………………………………………
net............................................................……………...……..…
1,488 — # # #