Embed Size (px)
Citation preview

News for GLY102
• Due to the weather conditions last week, the due date for homework number 2 has been moved to February 12th BUT a new homework will still be handed out on Thursday !
• There is now a website at http://www.geology.buffalo.edu/courses/gly102/

World Population
• The estimated world population today at 15:13 GMT (10:13 EST) is 6,203,643,941
• http://www.census.gov/main/www/popclock.html
• The estimated population of the USA is 286,395,732

http://www.popexpo.net/eMain.html
• Every second five people are born and two people die, a net gain of three people.
• At this rate, the world population is doubling every 40 years and would be: – 12 billion in 40 years
• However the United Nations estimate that we will only be 12 billion in 120 years. (i.e. the rate will change significantly)
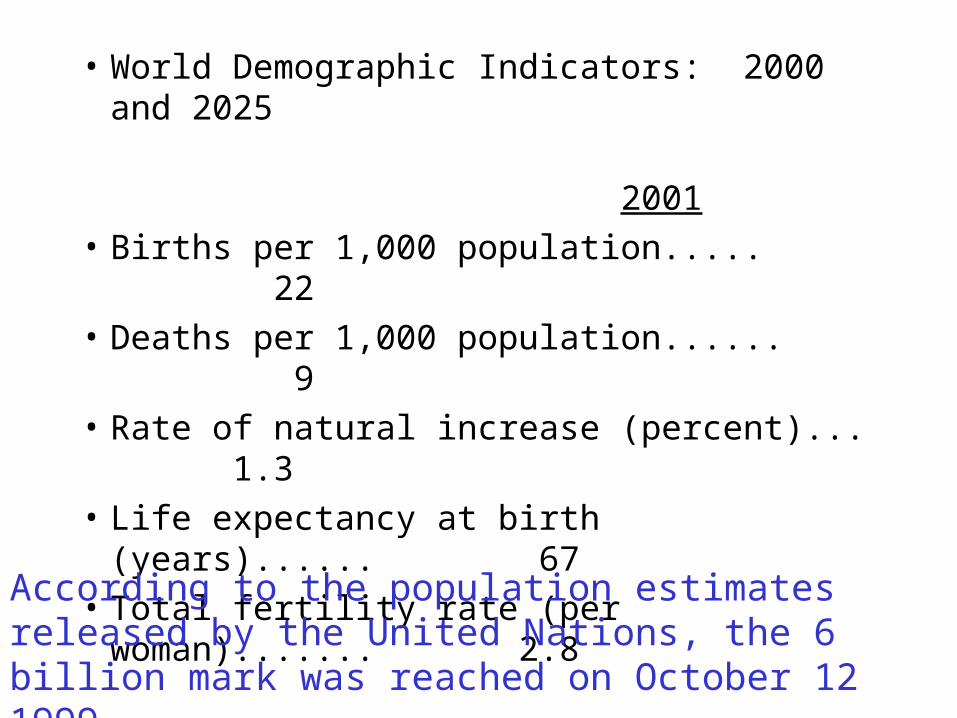
• World Demographic Indicators: 2000 and 2025
2001
• Births per 1,000 population..... 22
• Deaths per 1,000 population...... 9
• Rate of natural increase (percent)... 1.3
• Life expectancy at birth (years)...... 67
• Total fertility rate (per woman)....... 2.8
According to the population estimates released by the United Nations, the 6 billion mark was reached on October 12 1999.

• USA Demographic Indicators: 2000 and 2025
2000 2025• Births per 1,000 population..... 14 14• Deaths per 1,000 population...... 9 9• Rate of natural increase (percent)... 0.6 0.5• Annual rate of growth (percent)...... 0.9 0.8• Life expectancy at birth (years)...... 77.1 80.6• Infant deaths per 1,000 live births... 7 5• Total fertility rate (per woman)....... 2.1 2.2

Copyright © The McGraw-Hill Companies, Inc. Permission required for reproduction or display.
World population historyFigure 4.3
4-2

Copyright © The McGraw-Hill Companies, Inc. Permission required for reproduction or display.
Population graphBox Figure 4.1
4-6 Source: World Resources Institute, World Resources 1998-99.
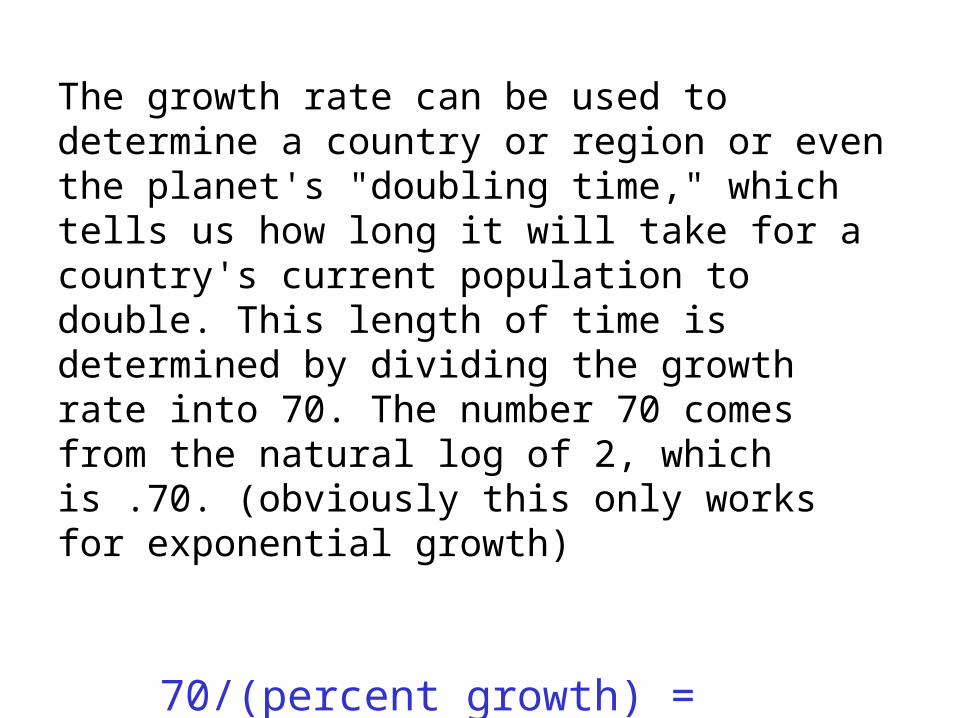
The growth rate can be used to determine a country or region or even the planet's "doubling time," which tells us how long it will take for a country's current population to double. This length of time is determined by dividing the growth rate into 70. The number 70 comes from the natural log of 2, which is .70. (obviously this only works for exponential growth)
70/(percent growth) = doubling time in years
70/0.9% = 77.8 years for the US
70/2.7% = 25.9 years for Nigeria

Copyright © The McGraw-Hill Companies, Inc. Permission required for reproduction or display.
Population growth and doubling
4-1

Limits to Growth
• Malthusian view - argued that population increases exponentially but food production can only grow slowly (i.e. growth will be limited by resource scarcity)
• Marxist view - social justice will redress inequalities and thereby reduce population growth (didn’t directly address the issue of population growth)

Copyright © The McGraw-Hill Companies, Inc. Permission required for reproduction or display.
Malthus (population growth)Figure 4.4a
4-3
Leeds inevitably to Zero-Population Growth
the population will increase until the limits of capacity to produce food are reached - ZPG - wars, rationing, increased poverty

Copyright © The McGraw-Hill Companies, Inc. Permission required for reproduction or display.
Marx (population growth)Figure 4.4b
4-4
Elimination of oppression will solve population problems - natural reduction - technological advance

Worldviews
1. We are headed for a population crisis where the world population can not be supported by the available recourses
2. More people will be beneficial - more work can be done, more geniuses born, and technology can overcome any limits
3. There are potentially enough resources but they are not being equitably distributed - social justice

Copyright © The McGraw-Hill Companies, Inc. Permission required for reproduction or display.
Estimated population growthFigure 4.5
4-5
Two demographic worlds

“3rd World” “1st World”
• poor• young (avg. age 15)• growing rapidly - doubling time 23 years
• Africa, Asia, Latin America - represent 80% of the worlds population
• wealth • old (avg. age 40)• slow or even negative
growth
• North America, Western Europe, Japan, Australia and New Zealand

Copyright © The McGraw-Hill Companies, Inc. Permission required for reproduction or display.
Ten most populous countries
4-8
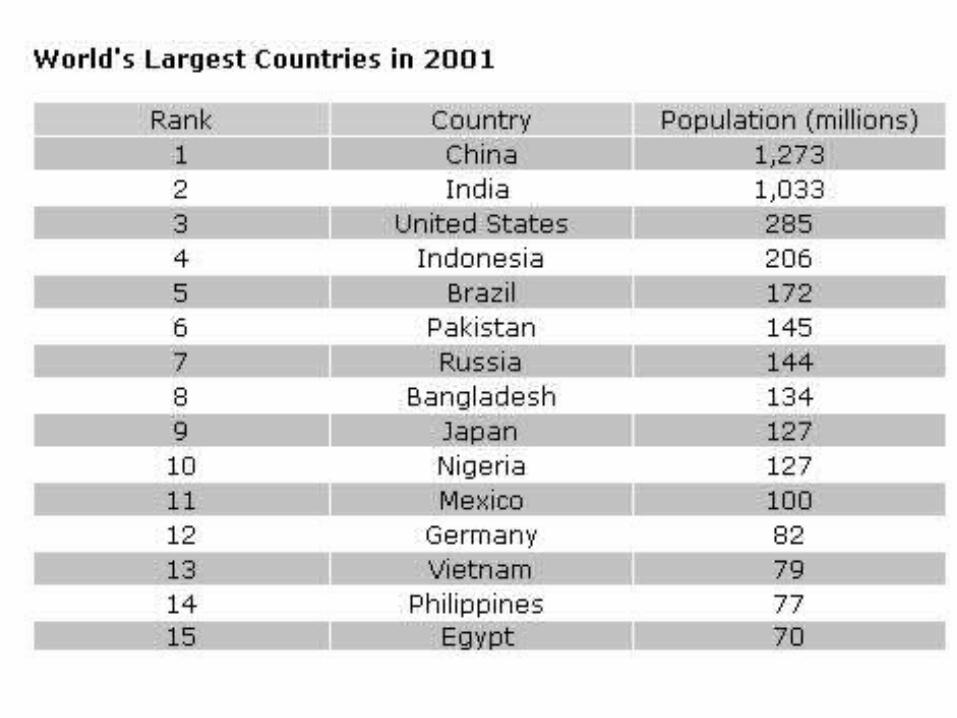


Nearly all of the world's population growth continues to occur in less developed countries. World population increases by about 83 million annually — 99 percent of this increase occurs in the less developed countries of Africa, Asia, Latin America and the Caribbean, and Oceania. According to current population projections, only three of the more developed countries, the United States, Russia, and Japan, are expected to remain among the world's most populous by 2025. The United States is expected to remain in third place, but Russia will drop from seventh to ninth, Japan will drop from ninth to eleventh, and Germany will no longer be in the top fifteen.

Copyright © The McGraw-Hill Companies, Inc. Permission required for reproduction or display.
World population densityFigure 4.6
4-9

Population ChangePopulation Change
1. Fertility and Birth Rate – crude birth rate is # births per thousand
persons per year– total fertility is # children born during a
woman's life

Copyright © The McGraw-Hill Companies, Inc. Permission required for reproduction or display.
Declines in fertility ratesFigure 4.7
4-10 Source: Data from World Health Organization, World Health Report 1999.
2. Mortality and Death Rates -
– crude death rate is # of deaths per thousand people per year
– Declining mortality is the primary cause of population growth in the past 300 years
3. Life Expectancy
• has increased from about 40 in the 1900s to about 65.5 in the 2000s

Copyright © The McGraw-Hill Companies, Inc. Permission required for reproduction or display.
Life expectancy at birth
4-11

Copyright © The McGraw-Hill Companies, Inc. Permission required for reproduction or display.
Life expectancy and GNPFigure 4.9
4-12 Source: The World Bank, World Development Indicators 1997, the World Bank, Washington, D.C., 1997.

Copyright © The McGraw-Hill Companies, Inc. Permission required for reproduction or display.
RAPID GROWTH SLOW GROWTHFigure 4.10
4-13 Sources: Data from the U.S. Bureau of the Census, the United Nations, and the Population Reference Bureau.

Copyright © The McGraw-Hill Companies, Inc. Permission required for reproduction or display.
Changing age structureFigure 4.11
4-14

Copyright © The McGraw-Hill Companies, Inc. Permission required for reproduction or display.
U.S. birth ratesFigure 4.13
4-15 Sources: Data from Population Reference Bureau, Inc., and U.S. Bureau of the Census.

Copyright © The McGraw-Hill Companies, Inc. Permission required for reproduction or display.
Birth, death, and populationFigure 4.14
4-16

Copyright © The McGraw-Hill Companies, Inc. Permission required for reproduction or display.
Child mortality rateFigure 4.16
4-17 Source: World Resources Institute, World Resources 1998-99.

Copyright © The McGraw-Hill Companies, Inc. Permission required for reproduction or display.
Population projectionsFigure 4.18
4-18 Source: Data from United Nations Population Division, World Population Prospects, 1996.

Copyright © The McGraw-Hill Companies, Inc. Permission required for reproduction or display.
Contraceptives (Africa)Figure 4.19a
4-19 Source: Data from United Nations Family Planning Agency, 1995.

Copyright © The McGraw-Hill Companies, Inc. Permission required for reproduction or display.
Contraceptives (Latin America)Figure 4.19b
4-20 Source: Data from United Nations Family Planning Agency, 1995.

Copyright © The McGraw-Hill Companies, Inc. Permission required for reproduction or display.
Contraceptives (East Asia)Figure 4.19c
4-21 Source: Data from United Nations Family Planning Agency, 1995.