Embed Size (px)
Citation preview
Xerox Reports Fourth-Quarter 2011 Earnings
• Q4 GAAP earnings per share of 26 cents; adjusted EPS of 33 cents, up 14 percent
• Full-year 2011 GAAP EPS of 90 cents; adjusted EPS of $1.08, up 15 percent • Q4 total revenue was flat; up 2 percent pro-forma for full-year 2011 • Q4 operating cash flow of $1.3 billion; $2 billion for full-year 2011 • Q4 stock repurchase of $392 million, $700 million for full-year 2011
NORWALK, Conn., Jan. 25, 2012 – Xerox Corporation (NYSE: XRX) announced today fourth-quarter 2011 results that include adjusted earnings per share of 33 cents, up 14 percent from fourth-quarter 2010, and $1.3 billion in operating cash flow. Adjusted EPS excludes 7 cents related to amortization of intangibles, resulting in GAAP EPS of 26 cents. The company ended 2011 with full-year adjusted EPS up 15 percent, pro-forma revenue up 2 percent and operating cash flow of $2 billion. “Our performance reflects Xerox’s operational discipline in delivering strong bottom-line results while scaling our services business and maintaining our leadership in document technology,” said Ursula Burns, Xerox chairman and chief executive officer. In the fourth quarter, total revenue of $6 billion was flat; revenue from the company’s services business was up 6 percent, and revenue from its technology business was down 5 percent. Growth in services was driven by an 8 percent increase in both business process outsourcing and document outsourcing. Technology revenue, which represents the sale of document systems, supplies, technical service and financing of products, was significantly impacted by economic weakness in Europe. “While operating in a challenging economic environment, we’ve grown our global market share for equipment revenue, further strengthening our industry leadership. Installs of Xerox equipment increased 8 percent in the fourth quarter. And, our managed print services are proving not only to be the industry standard but also an engine of growth for our business,” said Burns. “Signings for our diverse services offerings were up 15 percent in the fourth quarter,” Burns added. “Our services portfolio remains a competitive advantage -- providing clients cost-efficient ways to run more productive enterprises and benefitting our business for the long term through a healthy base of recurring revenue.” The increase in services signings continues to put near-term pressure on gross margins as Xerox makes initial investments to implement new contracts. Fourth-quarter gross margin was 32.2 percent, and selling, administrative and general expenses improved to 19.3 percent of revenue. Fourth-quarter 2011 results include 2 cents from a curtailment gain net of restructuring expenses. Operating margin of 10 percent was down 0.4 points from fourth-quarter 2010.
News from Xerox
For Immediate Release
Xerox Corporation 45 Glover Avenue P.O. Box 4505 Norwalk, CT 06856-4505 tel +1-203-968-3000
2
Full-year 2011 results include: • Net income of $1.3 billion, adjusted net income of $1.6 billion, up 21 percent • Total revenue of $22.6 billion, up 5 percent, 2 percent pro-forma • Operating margin of 9.8 percent, up 0.3 points pro-forma • Operating cash flow of $2 billion • $700 million in share repurchase
The company expects first-quarter 2012 GAAP earnings of 17 to 20 cents per share. First-quarter adjusted EPS is expected to be 21 to 24 cents per share. Full-year 2012 GAAP earnings are expected to be 97 cents to $1.03 per share. Full-year adjusted earnings are expected to be $1.12 to $1.18 per share, including restructuring. The company also expects $2 billion to $2.3 billion in cash flow from operations for 2012. The Xerox board of directors recently increased the company’s share repurchase authorization by $500 million to more than $1.3 billion. With this authorization, the company expects to repurchase between $900 million and $1.1 billion in Xerox shares during 2012. About Xerox With sales approaching $23 billion, Xerox Corporation (NYSE: XRX) is the world’s leading enterprise for business process and document management. Its technology, expertise and services enable workplaces – from small businesses to large global enterprises – to simplify the way work gets done so they operate more effectively and focus more on what matters most: their real business. Headquartered in Norwalk, Conn., Xerox offers business process outsourcing and IT outsourcing services, including data processing, healthcare solutions, HR benefits management, finance support, transportation solutions, and customer relationship management services for commercial and government organizations worldwide. The company also provides extensive leading-edge document technology, services, software and genuine Xerox supplies for graphic communication and office printing environments of any size. The 140,000 people of Xerox serve clients in more than 160 countries. For more information, visit http://www.xerox.com, http://news.xerox.com or http://www.realbusiness.com. For investor information, visit http://www.xerox.com/investor. Non-GAAP Measures This release refers to the following non-GAAP financial measures: • Adjusted EPS (earnings per share) for the fourth quarter and full year 2011 and for the first
quarter and full year 2012 guidance that excludes several discrete items. • Operating margin for the fourth quarter and full year 2011 that excludes certain expenses. • Pro-forma revenue and operating margin growth, with ACS included in the company’s 2010
results for the comparable 2011 period.
Refer to the “Non-GAAP Financial Measures” section of this release for a discussion of these non-GAAP measures and their reconciliation to the reported GAAP measure. Forward-Looking Statements This release contains "forward-looking statements" as defined in the Private Securities Litigation Reform Act of 1995. The words “anticipate,” “believe,” “estimate,” “expect,” “intend,” “will,” “should” and similar expressions, as they relate to us, are intended to identify forward-looking statements. These statements reflect management’s current beliefs, assumptions and expectations and are subject to a number of factors that may cause actual results to differ
3
materially. These factors include but are not limited to: the unprecedented volatility in the global economy; the risk that unexpected costs will be incurred; the outcome of litigation and regulatory proceedings to which we may be a party; actions of competitors; changes and developments affecting our industry; quarterly or cyclical variations in financial results; development of new products and services; interest rates and cost of borrowing; our ability to protect our intellectual property rights; our ability to maintain and improve cost efficiency of operations, including savings from restructuring actions; changes in foreign currency exchange rates; changes in economic conditions, political conditions, trade protection measures, licensing requirements and tax matters in the foreign countries in which we do business; reliance on third parties for manufacturing of products and provision of services; the risk that we will not realize all of the anticipated benefits from the acquisition of Affiliated Computer Services, Inc.; our ability to recover capital investments; the risk that subcontractors, software vendors and utility and network providers will not perform in a timely, quality manner; the risk that multi-year contracts with governmental entities could be terminated prior to the end of the contract term; the risk that individually identifiable information of customers, clients and employees could be inadvertently disclosed or disclosed as a result of a breach of our security; and other factors that are set forth in the “Risk Factors” section, the “Legal Proceedings” section, the “Management’s Discussion and Analysis of Financial Condition and Results of Operations” section and other sections of our Quarterly Reports on Form 10-Q for the quarters ended March 31, 2011, June 30, 2011 and September 30, 2011, and our 2010 Annual Report on Form 10-K filed with the Securities and Exchange Commission. The Company assumes no obligation to update any forward-looking statements as a result of new information or future events or developments, except as required by law.
-XXX-
Media Contacts: Karen Arena, Xerox Corporation, +1-203-849-5521, [email protected] Ken Ericson, Xerox Corporation, +1-410-571-0161, [email protected] Note: To receive RSS news feeds, visit http://news.xerox.com/pr/xerox/rss.aspx. For open commentary, industry perspectives and views from events visit http://twitter.com/xeroxcorp, http://twitter.com/xeroxoffice, http://twitter.com/xeroxproduction, http://twitter.com/servicesatxerox, http://twitter.com/xeroxevents, http://www.xerox.com/blogs, http://www.xerox.com/podcasts. XEROX®, XEROX and Design® are trademarks of Xerox Corporation in the United States and/or other countries.
4
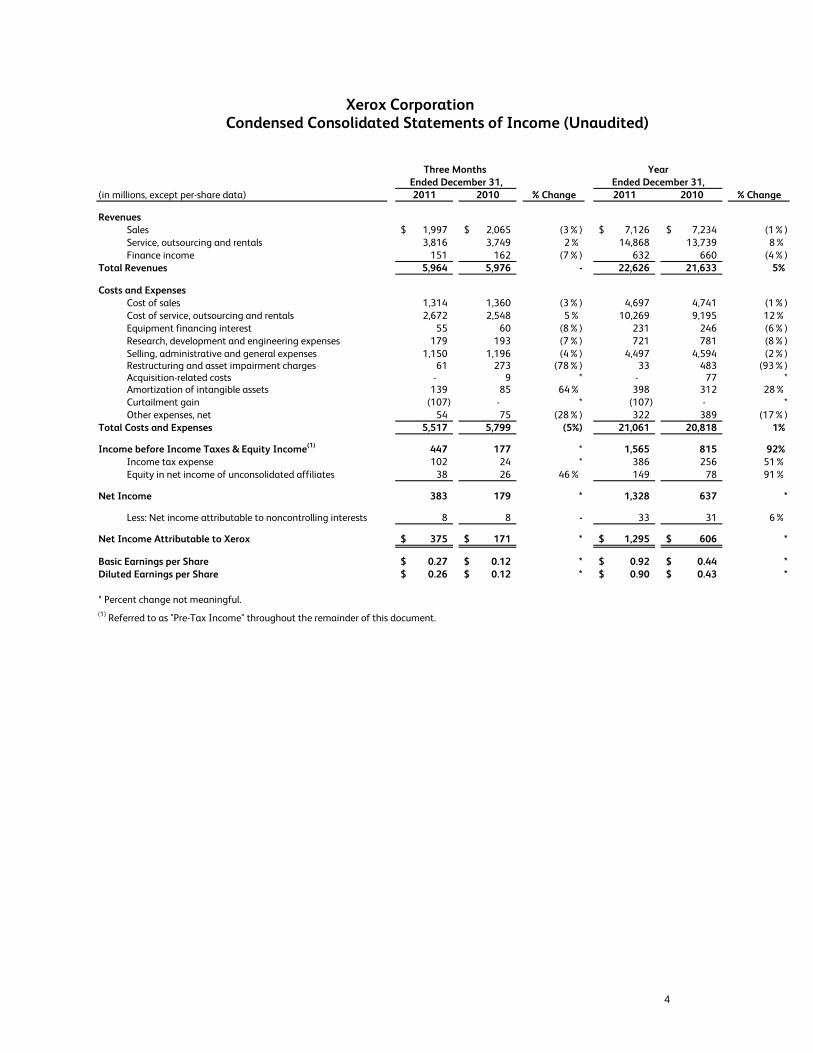
Xerox Corporation Condensed Consolidated Statements of Income (Unaudited)
(in millions, except per-share data) 2011 2010 % Change 2011 2010 % Change
RevenuesSales 1,997$ 2,065$ (3%) 7,126$ 7,234$ (1%)Service, outsourcing and rentals 3,816 3,749 2% 14,868 13,739 8% Finance income 151 162 (7%) 632 660 (4%)
Total Revenues 5,964 5,976 - 22,626 21,633 5%
Costs and ExpensesCost of sales 1,314 1,360 (3%) 4,697 4,741 (1%)Cost of service, outsourcing and rentals 2,672 2,548 5% 10,269 9,195 12% Equipment financing interest 55 60 (8%) 231 246 (6%)Research, development and engineering expenses 179 193 (7%) 721 781 (8%)Selling, administrative and general expenses 1,150 1,196 (4%) 4,497 4,594 (2%)Restructuring and asset impairment charges 61 273 (78%) 33 483 (93%)Acquisition-related costs - 9 * - 77 *Amortization of intangible assets 139 85 64% 398 312 28% Curtailment gain (107) - * (107) - *Other expenses, net 54 75 (28%) 322 389 (17%)
Total Costs and Expenses 5,517 5,799 (5%) 21,061 20,818 1%
447 177 * 1,565 815 92% Income tax expense 102 24 * 386 256 51% Equity in net income of unconsolidated affiliates 38 26 46% 149 78 91%
Net Income 383 179 * 1,328 637 *
Less: Net income attributable to noncontrolling interests 8 8 - 33 31 6%
Net Income Attributable to Xerox 375$ 171$ * 1,295$ 606$ *
Basic Earnings per Share 0.27$ 0.12$ * 0.92$ 0.44$ *Diluted Earnings per Share 0.26$ 0.12$ * 0.90$ 0.43$ *
* Percent change not meaningful.(1) Referred to as "Pre-Tax Income" throughout the remainder of this document.
Three Months Ended December 31,
Income before Income Taxes & Equity Income(1)
YearEnded December 31,
5
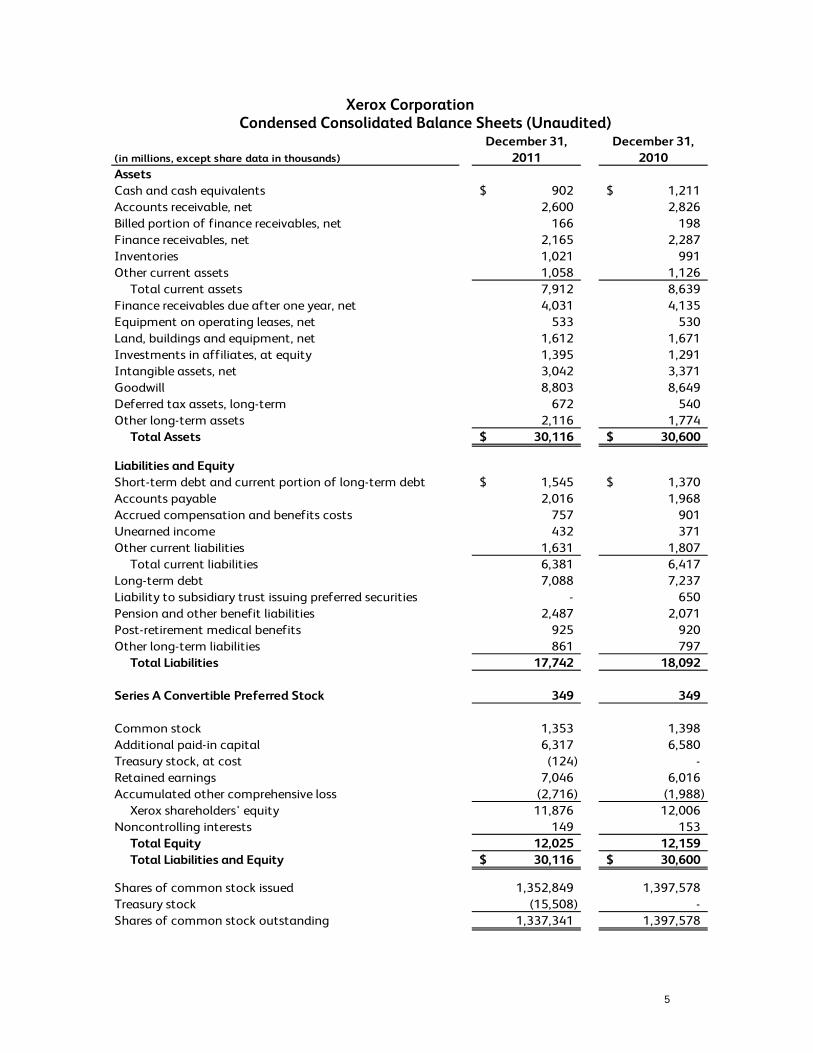
Xerox Corporation Condensed Consolidated Balance Sheets (Unaudited)
December 31, December 31,(in millions, except share data in thousands) 2011 2010AssetsCash and cash equivalents 902$ 1,211$ Accounts receivable, net 2,600 2,826 Billed portion of finance receivables, net 166 198 Finance receivables, net 2,165 2,287 Inventories 1,021 991 Other current assets 1,058 1,126 Total current assets 7,912 8,639 Finance receivables due after one year, net 4,031 4,135 Equipment on operating leases, net 533 530 Land, buildings and equipment, net 1,612 1,671 Investments in affiliates, at equity 1,395 1,291 Intangible assets, net 3,042 3,371 Goodwill 8,803 8,649 Deferred tax assets, long-term 672 540 Other long-term assets 2,116 1,774 Total Assets 30,116$ 30,600$ Liabilities and Equity Short-term debt and current portion of long-term debt 1,545$ 1,370$ Accounts payable 2,016 1,968 Accrued compensation and benefits costs 757 901 Unearned income 432 371 Other current liabilities 1,631 1,807 Total current liabilities 6,381 6,417 Long-term debt 7,088 7,237 Liability to subsidiary trust issuing preferred securities - 650 Pension and other benefit liabilities 2,487 2,071 Post-retirement medical benefits 925 920 Other long-term liabilities 861 797 Total Liabilities 17,742 18,092
Series A Convertible Preferred Stock 349 349
Common stock 1,353 1,398 Additional paid-in capital 6,317 6,580 Treasury stock, at cost (124) - Retained earnings 7,046 6,016 Accumulated other comprehensive loss (2,716) (1,988) Xerox shareholders' equity 11,876 12,006 Noncontrolling interests 149 153 Total Equity 12,025 12,159 Total Liabilities and Equity 30,116$ 30,600$
Shares of common stock issued 1,352,849 1,397,578 Treasury stock (15,508) - Shares of common stock outstanding 1,337,341 1,397,578
6
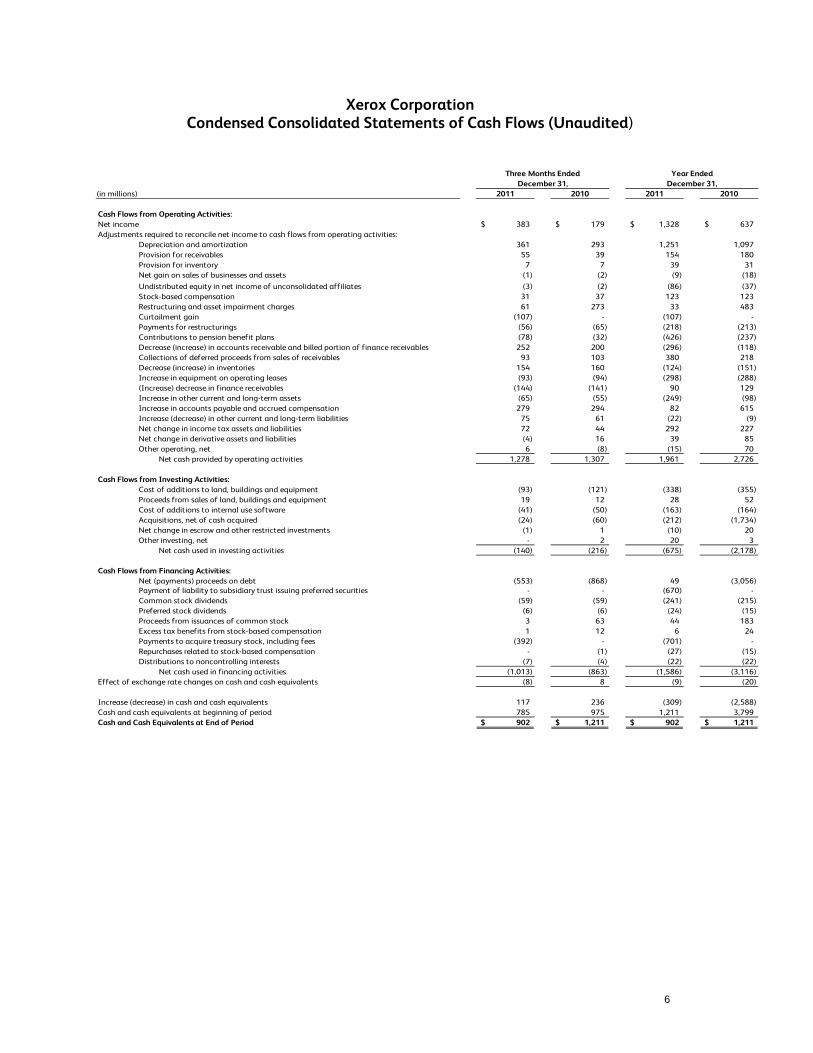
Xerox Corporation Condensed Consolidated Statements of Cash Flows (Unaudited)
Three Months Ended Year EndedDecember 31, December 31,
(in millions) 2011 2010 2011 2010
Cash Flows from Operating Activities:Net income 383$ 179$ 1,328$ 637$ Adjustments required to reconcile net income to cash flows from operating activities:
Depreciation and amortization 361 293 1,251 1,097 Provision for receivables 55 39 154 180 Provision for inventory 7 7 39 31 Net gain on sales of businesses and assets (1) (2) (9) (18) Undistributed equity in net income of unconsolidated affiliates (3) (2) (86) (37) Stock-based compensation 31 37 123 123 Restructuring and asset impairment charges 61 273 33 483 Curtailment gain (107) - (107) - Payments for restructurings (56) (65) (218) (213) Contributions to pension benefit plans (78) (32) (426) (237) Decrease (increase) in accounts receivable and billed portion of finance receivables 252 200 (296) (118) Collections of deferred proceeds from sales of receivables 93 103 380 218 Decrease (increase) in inventories 154 160 (124) (151) Increase in equipment on operating leases (93) (94) (298) (288) (Increase) decrease in finance receivables (144) (141) 90 129 Increase in other current and long-term assets (65) (55) (249) (98) Increase in accounts payable and accrued compensation 279 294 82 615 Increase (decrease) in other current and long-term liabilities 75 61 (22) (9) Net change in income tax assets and liabilities 72 44 292 227 Net change in derivative assets and liabilities (4) 16 39 85 Other operating, net 6 (8) (15) 70
Net cash provided by operating activities 1,278 1,307 1,961 2,726
Cash Flows from Investing Activities:Cost of additions to land, buildings and equipment (93) (121) (338) (355) Proceeds from sales of land, buildings and equipment 19 12 28 52 Cost of additions to internal use software (41) (50) (163) (164) Acquisitions, net of cash acquired (24) (60) (212) (1,734) Net change in escrow and other restricted investments (1) 1 (10) 20 Other investing, net - 2 20 3
Net cash used in investing activities (140) (216) (675) (2,178)
Cash Flows from Financing Activities:Net (payments) proceeds on debt (553) (868) 49 (3,056) Payment of liability to subsidiary trust issuing preferred securities - - (670) - Common stock dividends (59) (59) (241) (215) Preferred stock dividends (6) (6) (24) (15) Proceeds from issuances of common stock 3 63 44 183 Excess tax benefits from stock-based compensation 1 12 6 24 Payments to acquire treasury stock, including fees (392) - (701) - Repurchases related to stock-based compensation - (1) (27) (15) Distributions to noncontrolling interests (7) (4) (22) (22)
Net cash used in financing activities (1,013) (863) (1,586) (3,116) Effect of exchange rate changes on cash and cash equivalents (8) 8 (9) (20)
Increase (decrease) in cash and cash equivalents 117 236 (309) (2,588) Cash and cash equivalents at beginning of period 785 975 1,211 3,799 Cash and Cash Equivalents at End of Period 902$ 1,211$ 902$ 1,211$
7
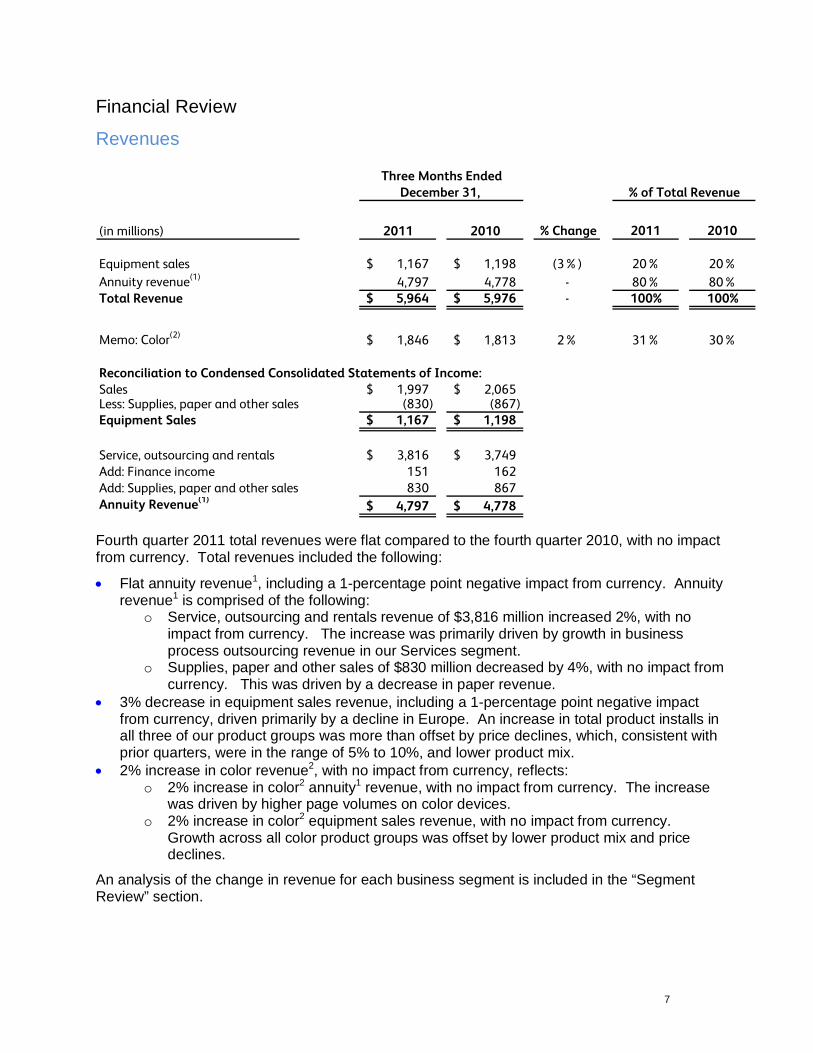
Financial Review Revenues
(in millions) 2011 2010 % Change 2011 2010
Equipment sales 1,167$ 1,198$ (3%) 20% 20%Annuity revenue(1) 4,797 4,778 - 80% 80%Total Revenue 5,964$ 5,976$ - 100% 100%
Memo: Color(2) 1,846$ 1,813$ 2% 31% 30%
Reconciliation to Condensed Consolidated Statements of Income:Sales 1,997$ 2,065$ Less: Supplies, paper and other sales (830) (867) Equipment Sales 1,167$ 1,198$
Service, outsourcing and rentals 3,816$ 3,749$ Add: Finance income 151 162 Add: Supplies, paper and other sales 830 867 Annuity Revenue(1) 4,797$ 4,778$
Three Months EndedDecember 31, % of Total Revenue
Fourth quarter 2011 total revenues were flat compared to the fourth quarter 2010, with no impact from currency. Total revenues included the following: • Flat annuity revenue1, including a 1-percentage point negative impact from currency. Annuity
revenue1 is comprised of the following: o Service, outsourcing and rentals revenue of $3,816 million increased 2%, with no
impact from currency. The increase was primarily driven by growth in business process outsourcing revenue in our Services segment.
o Supplies, paper and other sales of $830 million decreased by 4%, with no impact from currency. This was driven by a decrease in paper revenue.
• 3% decrease in equipment sales revenue, including a 1-percentage point negative impact from currency, driven primarily by a decline in Europe. An increase in total product installs in all three of our product groups was more than offset by price declines, which, consistent with prior quarters, were in the range of 5% to 10%, and lower product mix.
• 2% increase in color revenue2, with no impact from currency, reflects: o 2% increase in color2 annuity1 revenue, with no impact from currency. The increase
was driven by higher page volumes on color devices. o 2% increase in color2 equipment sales revenue, with no impact from currency.
Growth across all color product groups was offset by lower product mix and price declines.
An analysis of the change in revenue for each business segment is included in the “Segment Review” section.
8
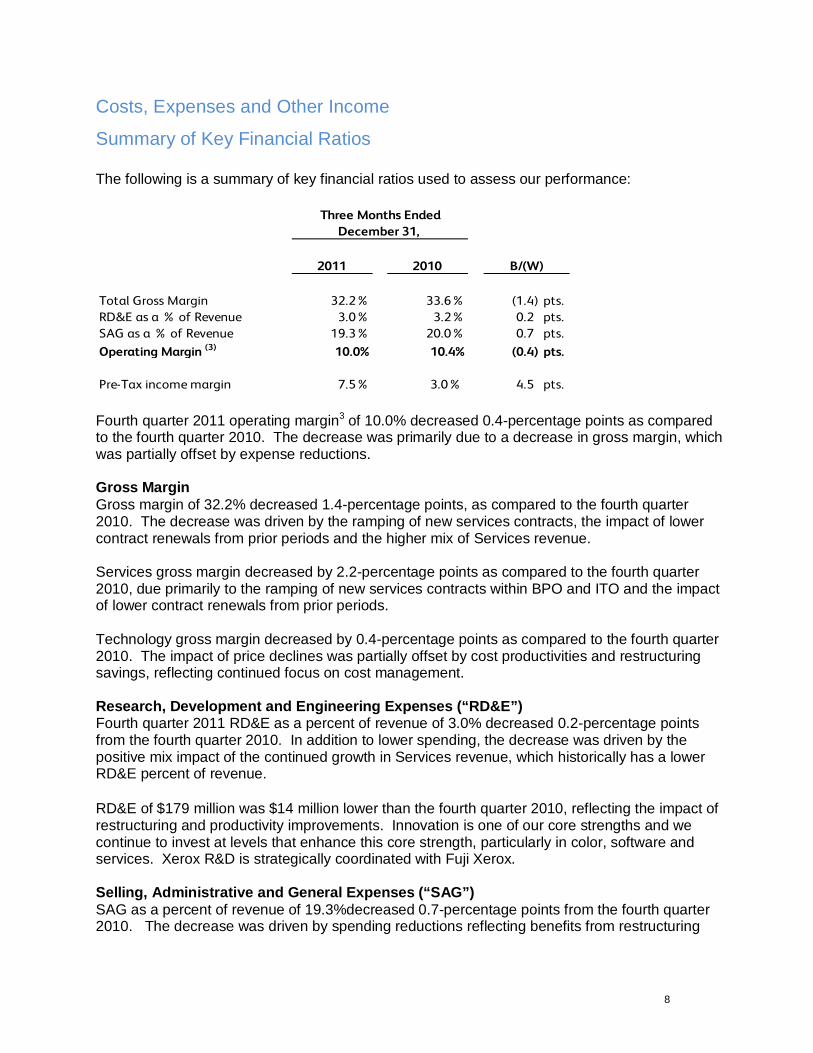
Costs, Expenses and Other Income Summary of Key Financial Ratios The following is a summary of key financial ratios used to assess our performance:
2011 2010
Total Gross Margin 32.2% 33.6% (1.4) pts.RD&E as a % of Revenue 3.0% 3.2% 0.2 pts.SAG as a % of Revenue 19.3% 20.0% 0.7 pts.Operating Margin (3) 10.0% 10.4% (0.4) pts.
Pre-Tax income margin 7.5% 3.0% 4.5 pts.
B/(W)
Three Months EndedDecember 31,
Fourth quarter 2011 operating margin3 of 10.0% decreased 0.4-percentage points as compared to the fourth quarter 2010. The decrease was primarily due to a decrease in gross margin, which was partially offset by expense reductions. Gross Margin Gross margin of 32.2% decreased 1.4-percentage points, as compared to the fourth quarter 2010. The decrease was driven by the ramping of new services contracts, the impact of lower contract renewals from prior periods and the higher mix of Services revenue. Services gross margin decreased by 2.2-percentage points as compared to the fourth quarter 2010, due primarily to the ramping of new services contracts within BPO and ITO and the impact of lower contract renewals from prior periods. Technology gross margin decreased by 0.4-percentage points as compared to the fourth quarter 2010. The impact of price declines was partially offset by cost productivities and restructuring savings, reflecting continued focus on cost management. Research, Development and Engineering Expenses (“RD&E”) Fourth quarter 2011 RD&E as a percent of revenue of 3.0% decreased 0.2-percentage points from the fourth quarter 2010. In addition to lower spending, the decrease was driven by the positive mix impact of the continued growth in Services revenue, which historically has a lower RD&E percent of revenue. RD&E of $179 million was $14 million lower than the fourth quarter 2010, reflecting the impact of restructuring and productivity improvements. Innovation is one of our core strengths and we continue to invest at levels that enhance this core strength, particularly in color, software and services. Xerox R&D is strategically coordinated with Fuji Xerox. Selling, Administrative and General Expenses (“SAG”) SAG as a percent of revenue of 19.3%decreased 0.7-percentage points from the fourth quarter 2010. The decrease was driven by spending reductions reflecting benefits from restructuring
9
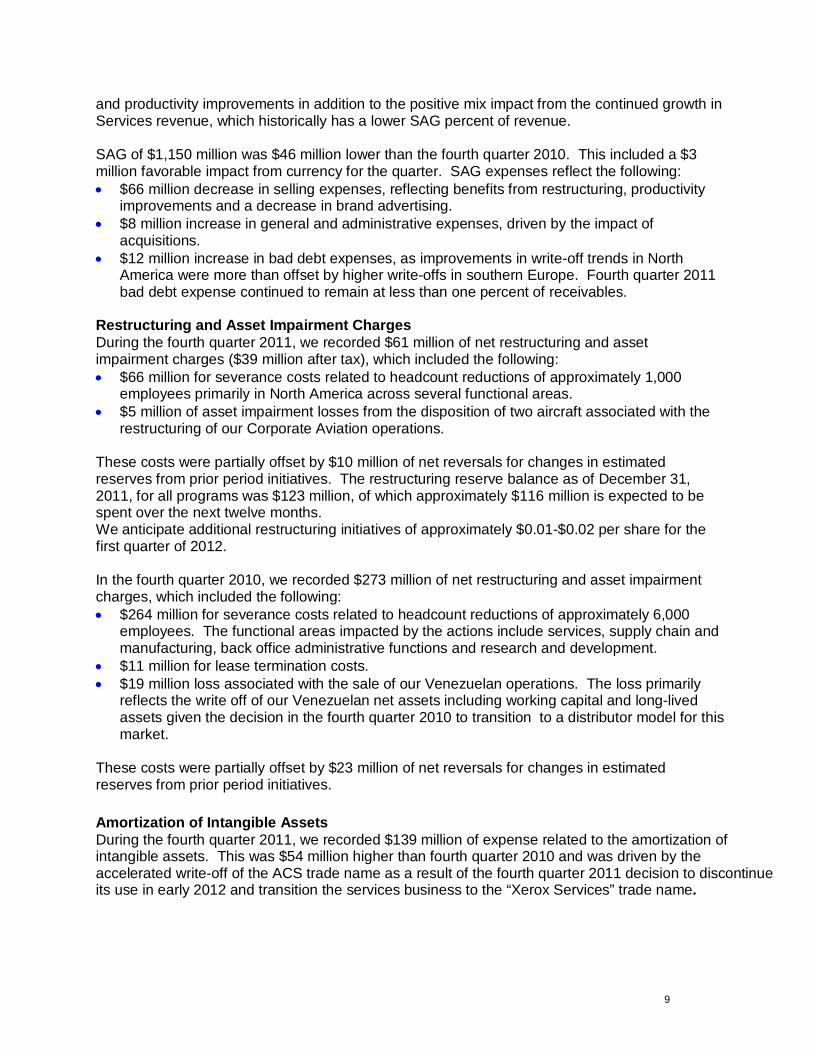
and productivity improvements in addition to the positive mix impact from the continued growth in Services revenue, which historically has a lower SAG percent of revenue. SAG of $1,150 million was $46 million lower than the fourth quarter 2010. This included a $3 million favorable impact from currency for the quarter. SAG expenses reflect the following: • $66 million decrease in selling expenses, reflecting benefits from restructuring, productivity
improvements and a decrease in brand advertising. • $8 million increase in general and administrative expenses, driven by the impact of
acquisitions. • $12 million increase in bad debt expenses, as improvements in write-off trends in North
America were more than offset by higher write-offs in southern Europe. Fourth quarter 2011 bad debt expense continued to remain at less than one percent of receivables.
Restructuring and Asset Impairment Charges During the fourth quarter 2011, we recorded $61 million of net restructuring and asset impairment charges ($39 million after tax), which included the following: • $66 million for severance costs related to headcount reductions of approximately 1,000
employees primarily in North America across several functional areas. • $5 million of asset impairment losses from the disposition of two aircraft associated with the
restructuring of our Corporate Aviation operations.
These costs were partially offset by $10 million of net reversals for changes in estimated reserves from prior period initiatives. The restructuring reserve balance as of December 31, 2011, for all programs was $123 million, of which approximately $116 million is expected to be spent over the next twelve months. We anticipate additional restructuring initiatives of approximately $0.01-$0.02 per share for the first quarter of 2012. In the fourth quarter 2010, we recorded $273 million of net restructuring and asset impairment charges, which included the following: • $264 million for severance costs related to headcount reductions of approximately 6,000
employees. The functional areas impacted by the actions include services, supply chain and manufacturing, back office administrative functions and research and development.
• $11 million for lease termination costs. • $19 million loss associated with the sale of our Venezuelan operations. The loss primarily
reflects the write off of our Venezuelan net assets including working capital and long-lived assets given the decision in the fourth quarter 2010 to transition to a distributor model for this market.
These costs were partially offset by $23 million of net reversals for changes in estimated reserves from prior period initiatives. Amortization of Intangible Assets During the fourth quarter 2011, we recorded $139 million of expense related to the amortization of intangible assets. This was $54 million higher than fourth quarter 2010 and was driven by the accelerated write-off of the ACS trade name as a result of the fourth quarter 2011 decision to discontinue its use in early 2012 and transition the services business to the “Xerox Services” trade name.
10
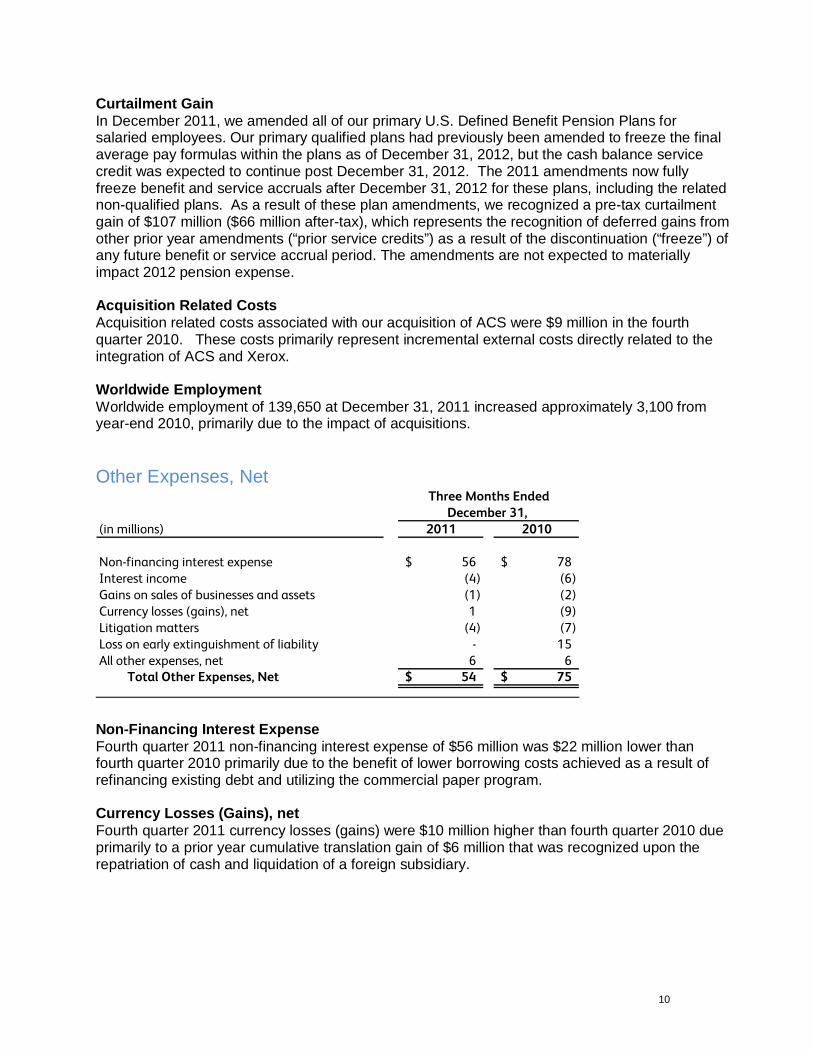
Curtailment Gain In December 2011, we amended all of our primary U.S. Defined Benefit Pension Plans for salaried employees. Our primary qualified plans had previously been amended to freeze the final average pay formulas within the plans as of December 31, 2012, but the cash balance service credit was expected to continue post December 31, 2012. The 2011 amendments now fully freeze benefit and service accruals after December 31, 2012 for these plans, including the related non-qualified plans. As a result of these plan amendments, we recognized a pre-tax curtailment gain of $107 million ($66 million after-tax), which represents the recognition of deferred gains from other prior year amendments (“prior service credits”) as a result of the discontinuation (“freeze”) of any future benefit or service accrual period. The amendments are not expected to materially impact 2012 pension expense. Acquisition Related Costs Acquisition related costs associated with our acquisition of ACS were $9 million in the fourth quarter 2010. These costs primarily represent incremental external costs directly related to the integration of ACS and Xerox. Worldwide Employment Worldwide employment of 139,650 at December 31, 2011 increased approximately 3,100 from year-end 2010, primarily due to the impact of acquisitions. Other Expenses, Net
(in millions) 2011 2010
Non-financing interest expense 56$ 78$ Interest income (4) (6) Gains on sales of businesses and assets (1) (2) Currency losses (gains), net 1 (9) Litigation matters (4) (7) Loss on early extinguishment of liability - 15 All other expenses, net 6 6
Total Other Expenses, Net 54$ 75$
Three Months EndedDecember 31,
Non-Financing Interest Expense Fourth quarter 2011 non-financing interest expense of $56 million was $22 million lower than fourth quarter 2010 primarily due to the benefit of lower borrowing costs achieved as a result of refinancing existing debt and utilizing the commercial paper program. Currency Losses (Gains), net Fourth quarter 2011 currency losses (gains) were $10 million higher than fourth quarter 2010 due primarily to a prior year cumulative translation gain of $6 million that was recognized upon the repatriation of cash and liquidation of a foreign subsidiary.
11
Loss on Early Extinguishment of Liability Fourth quarter 2010 loss on early extinguishment of liability of $15 million represents the loss associated with the redemption of senior and medium-term notes in the fourth quarter 2010 and reflects a call premium and the write-off of unamortized debt costs. Income Taxes Fourth quarter 2011 effective tax rate was 22.8%. On an adjusted basis3, fourth quarter 2011 tax rate was 26.3%, which was lower than the U.S. statutory tax rate primarily due to geographical mix of profits as well as a higher foreign tax credit benefit as a result of our decision to repatriate current year income from certain non U.S. subsidiaries. Fourth quarter 2010 effective tax rate was 13.6%. On an adjusted basis3, fourth quarter 2010 tax rate was 29.5%, which was lower than the U.S. statutory tax rate primarily due to geographical mix of profits and tax law changes. Xerox operations are widely dispersed. The statutory tax rate in most non U.S. jurisdictions is lower than the combined U.S. and state tax rate. The amount of income subject to these lower foreign rates relative to the amount of U.S. income will impact our effective tax rate. However, no one country outside of the U.S. is a significant factor to our overall effective tax rate. Certain foreign income is subject to U.S. tax net of any available foreign tax credits. Our full year effective tax rate includes a benefit of approximately 10 percentage points from these non U.S. operations, which is comparable to 2010. Our effective tax rate is based on nonrecurring events as well as recurring factors, including the taxation of foreign income. In addition, our effective tax rate will change based on discrete or other nonrecurring events that may not be predictable. We anticipate that our effective tax rate for 2012 will be approximately 29%, excluding the effects of intangibles amortization and discrete events. Equity in Net Income of Unconsolidated Affiliates Equity in net income of unconsolidated affiliates, which primarily reflects our 25% share of Fuji Xerox net income, was $38 million, an increase of $12 million compared to fourth quarter 2010. Fourth quarter 2011 equity income includes charges of $3 million related to our share of Fuji Xerox after-tax restructuring compared to $5 million of charges for the fourth quarter 2010.
Net Income Fourth quarter 2011 net income attributable to Xerox was $375 million, or $0.26 per diluted share. On an adjusted basis3, net income attributable to Xerox was $462 million, or $0.33 per diluted share. Fourth quarter 2011 adjustments to net income include amortization of intangible assets. Fourth quarter 2010 net income attributable to Xerox was $171 million, or $0.12 per diluted share. On an adjusted basis3, net income attributable to Xerox was $417 million, or $0.29 per diluted share.
12
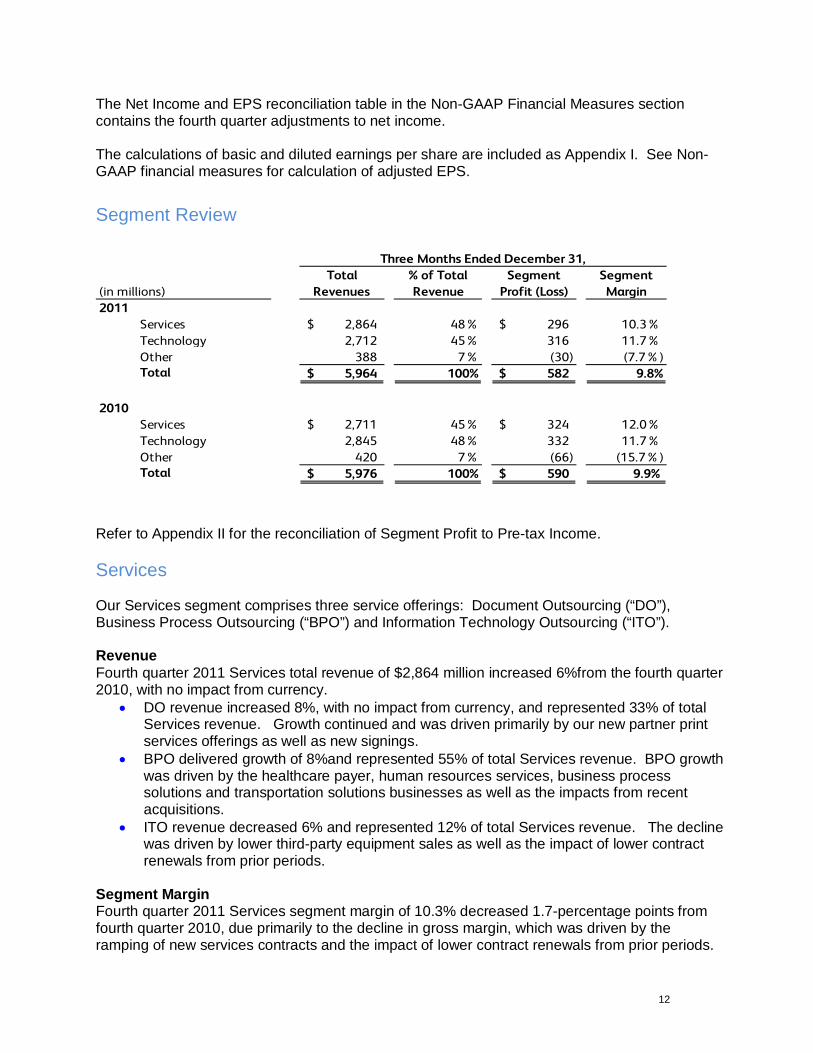
The Net Income and EPS reconciliation table in the Non-GAAP Financial Measures section contains the fourth quarter adjustments to net income. The calculations of basic and diluted earnings per share are included as Appendix I. See Non-GAAP financial measures for calculation of adjusted EPS. Segment Review
(in millions)Total
Revenues% of Total Revenue
Segment Profit (Loss)
Segment Margin
2011Services 2,864$ 48% 296$ 10.3% Technology 2,712 45% 316 11.7% Other 388 7% (30) (7.7%)Total 5,964$ 100% 582$ 9.8%
2010Services 2,711$ 45% 324$ 12.0% Technology 2,845 48% 332 11.7% Other 420 7% (66) (15.7%)Total 5,976$ 100% 590$ 9.9%
Three Months Ended December 31,
Refer to Appendix II for the reconciliation of Segment Profit to Pre-tax Income. Services Our Services segment comprises three service offerings: Document Outsourcing (“DO”), Business Process Outsourcing (“BPO”) and Information Technology Outsourcing (“ITO”). Revenue Fourth quarter 2011 Services total revenue of $2,864 million increased 6%from the fourth quarter 2010, with no impact from currency.
• DO revenue increased 8%, with no impact from currency, and represented 33% of total Services revenue. Growth continued and was driven primarily by our new partner print services offerings as well as new signings.
• BPO delivered growth of 8%and represented 55% of total Services revenue. BPO growth was driven by the healthcare payer, human resources services, business process solutions and transportation solutions businesses as well as the impacts from recent acquisitions.
• ITO revenue decreased 6% and represented 12% of total Services revenue. The decline was driven by lower third-party equipment sales as well as the impact of lower contract renewals from prior periods.
Segment Margin Fourth quarter 2011 Services segment margin of 10.3% decreased 1.7-percentage points from fourth quarter 2010, due primarily to the decline in gross margin, which was driven by the ramping of new services contracts and the impact of lower contract renewals from prior periods.
13
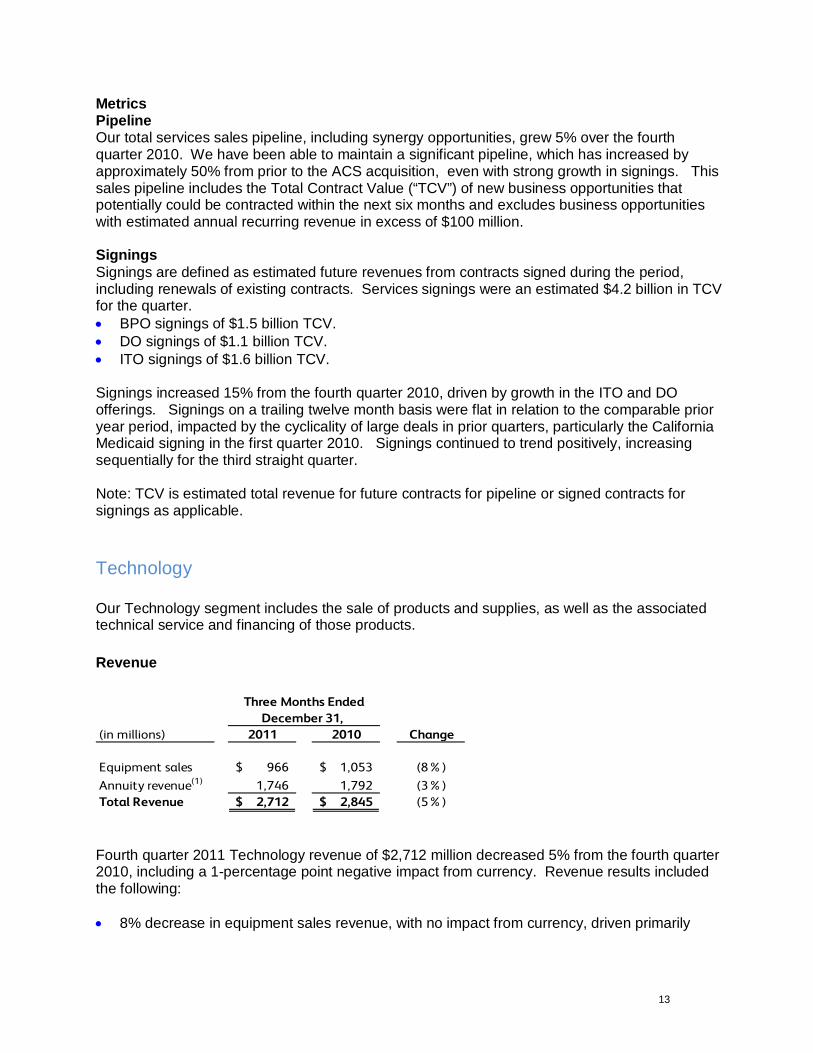
Metrics Pipeline Our total services sales pipeline, including synergy opportunities, grew 5% over the fourth quarter 2010. We have been able to maintain a significant pipeline, which has increased by approximately 50% from prior to the ACS acquisition, even with strong growth in signings. This sales pipeline includes the Total Contract Value (“TCV”) of new business opportunities that potentially could be contracted within the next six months and excludes business opportunities with estimated annual recurring revenue in excess of $100 million. Signings Signings are defined as estimated future revenues from contracts signed during the period, including renewals of existing contracts. Services signings were an estimated $4.2 billion in TCV for the quarter. • BPO signings of $1.5 billion TCV. • DO signings of $1.1 billion TCV. • ITO signings of $1.6 billion TCV. Signings increased 15% from the fourth quarter 2010, driven by growth in the ITO and DO offerings. Signings on a trailing twelve month basis were flat in relation to the comparable prior year period, impacted by the cyclicality of large deals in prior quarters, particularly the California Medicaid signing in the first quarter 2010. Signings continued to trend positively, increasing sequentially for the third straight quarter. Note: TCV is estimated total revenue for future contracts for pipeline or signed contracts for signings as applicable. Technology Our Technology segment includes the sale of products and supplies, as well as the associated technical service and financing of those products. Revenue
(in millions) 2011 2010 Change
Equipment sales 966$ 1,053$ (8%)Annuity revenue(1) 1,746 1,792 (3%)Total Revenue 2,712$ 2,845$ (5%)
Three Months EndedDecember 31,
Fourth quarter 2011 Technology revenue of $2,712 million decreased 5% from the fourth quarter 2010, including a 1-percentage point negative impact from currency. Revenue results included the following: • 8% decrease in equipment sales revenue, with no impact from currency, driven primarily
14
by a decline in Europe reflecting the economic conditions in the Euro zone. An increase in total product installs in all three of our product groups was more than offset by price declines and product mix. Consistent with prior quarters, price declines were in the range of 5% to 10%. Technology revenue excludes increasing revenues in our document outsourcing offerings.
• 3% decrease in annuity revenue1 with a 1-percentage point negative impact from currency. An increase in supplies revenue was offset by a decline in pages, while revenue per page continued to increase.
• Technology revenue mix was 21% entry, 57% mid-range and 22% high-end. Segment Margin Fourth quarter 2011 Technology segment margin of 11.7% was flat compared to the fourth quarter 2010. Lower cost and expense from restructuring savings was offset by a decline in gross margin. Installs Entry • 6% increase in total black-and-white and color multifunction devices and color printers driven
by demand for recent product introductions such as the WorkCentre® 3045 and the WorkCentre® 6015.
Mid-Range • 27% increase in installs of mid-range color devices driven by strong demand for new products
such as the WorkCentre® 7530/7535 and the Xerox Color 550/560 across all geographies. This growth has enabled market share gains in the fastest growing and most profitable segment of the office color market.
• 6% increase in installs of mid-range black-and-white devices driven by strong demand for the recently launched WorkCentre® 5325/5330/5335 product.
High-End • 15% increase in installs of high-end color systems driven primarily by strong demand for the
recently launched Xerox Color 770 and the DocuColorTM 8080. These products have improved our offerings in the Entry Production Color product category. In addition, installs of our market-leading Xerox Color 800 and 1000 continued to grow from the fourth quarter 2010.
• 11% decrease in installs of high-end black-and-white systems. Note: Install activity percentages include installations for Document Outsourcing and the Xerox-branded products shipped to GIS. “Entry”, “Mid-Range” and “High-End” are defined in Appendix II. Other Revenue Fourth quarter 2011 Other revenue of $388 million decreased 8%, with no impact from currency, due to a decline in paper sales, wide format systems and other supplies partially offset by an increase in revenue from patent sales and licensing (see below). Paper comprised approximately 54% of the fourth quarter 2011 Other segment revenue. In the fourth quarter of 2011, we entered into an agreement with another company that included, among other items, the sale of certain patents and a cross-licensing of certain patents of each
15
party, pursuant to which we received an up-front payment with the remaining amount payable in two equal annual installment payments. Consistent with our accounting policy for these transactions, revenue associated with this agreement will be recorded as earned and only to the extent of cash received. During the fourth quarter 2011, the Other segment included revenue and pre-tax income/segment profit of approximately $32 million and $26 million ($16 million after-tax), respectively, which is net of certain expenses paid in connection with this agreement. We expect to recognize additional revenue and pre-tax income/segment profit of approximately $12 million and $8 million ($5 million after-tax), respectively, in each of the next two years in the Other Segment related to this agreement. Segment Margin Fourth quarter 2011 Other segment loss of $30 million decreased $36 million from the fourth quarter 2010, primarily driven by the increase from the patent sale and licensing as well as lower non-financing interest expense. Notes: (1) Annuity revenue = Service, outsourcing and rentals + Supplies, paper and other sales +
Finance income.
(2)Represents revenues from color devices and is a subset of total revenues and excludes Global Imaging Systems (“GIS”) revenues.
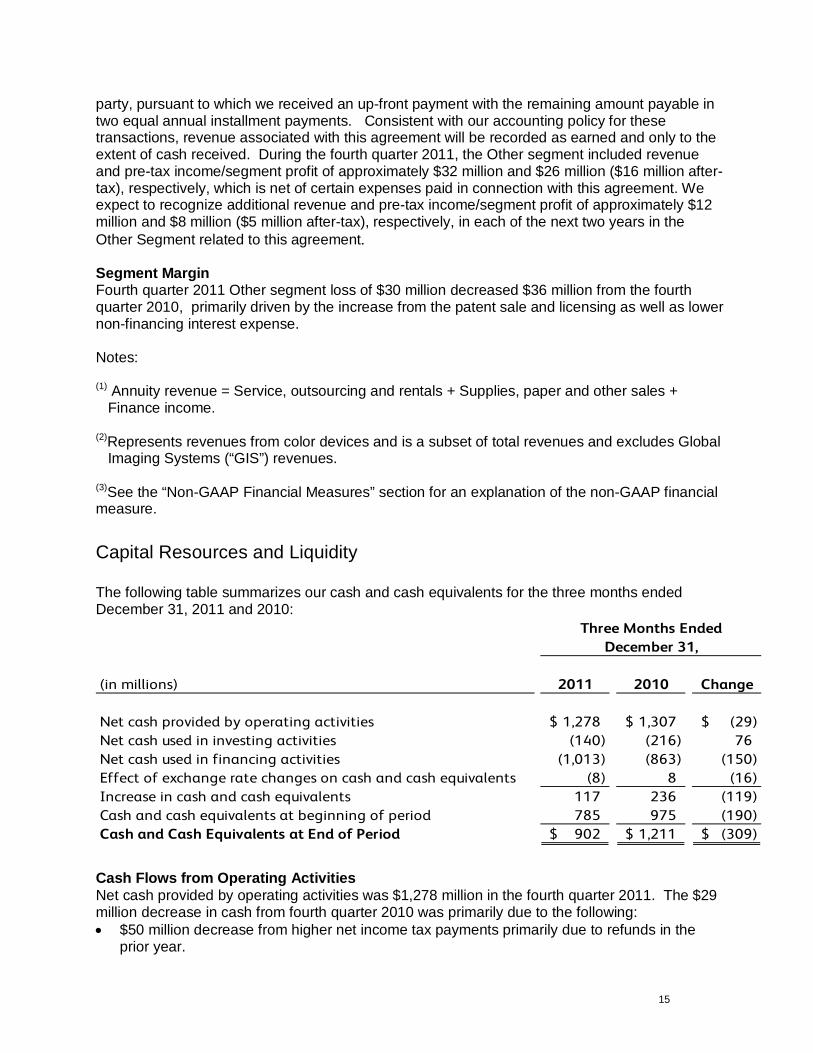
(3)See the “Non-GAAP Financial Measures” section for an explanation of the non-GAAP financial measure. Capital Resources and Liquidity The following table summarizes our cash and cash equivalents for the three months ended December 31, 2011 and 2010:
(in millions) 2011 2010 Change
Net cash provided by operating activities 1,278$ 1,307$ (29)$ Net cash used in investing activities (140) (216) 76 Net cash used in financing activities (1,013) (863) (150)
(8) 8 (16) Increase in cash and cash equivalents 117 236 (119) Cash and cash equivalents at beginning of period 785 975 (190) Cash and Cash Equivalents at End of Period 902$ 1,211$ (309)$
December 31,
Effect of exchange rate changes on cash and cash equivalents
Three Months Ended
Cash Flows from Operating Activities Net cash provided by operating activities was $1,278 million in the fourth quarter 2011. The $29 million decrease in cash from fourth quarter 2010 was primarily due to the following: • $50 million decrease from higher net income tax payments primarily due to refunds in the
prior year.
16
• $46 million decrease due to higher contributions to our defined pension benefit plans. • $42 million increase due to lower net accounts receivable reflecting improved collections in
the quarter. • $19 million increase in pre-tax income before depreciation and amortization, restructuring
and curtailment.
Cash Flows from Investing Activities Net cash used in investing activities was $140 million in the fourth quarter 2011. The $76 million decrease in the use of cash from fourth quarter 2010 was primarily due to the following: • $37 million decrease due to lower capital expenditures (including internal use software). • $36 million decrease in acquisitions. 2011 acquisitions include MBM for $42 million and
Breakaway Group for $18 million as well as a net cash receipt of $35 million for Symcor. 2010 acquisitions include TMS Health for $48 million and Spur Information Solutions for $12 million.
Cash Flows from Financing Activities Net cash used in financing activities was $1,013 million in the fourth quarter 2011. The $150 million increase in the use of cash from fourth quarter 2010 was primarily due to the following: • $392 million increase resulting from the resumption of our share repurchase program. • $60 million increase due to lower proceeds from the issuances of common stock under our
stock option plans. • $315 million decrease from net debt activity. Fourth quarter 2011 reflects net payments of
$551 million on Commercial Paper and net payments of $2 million on other debt. Fourth quarter 2010 reflects net payments of $602 million on the Credit Facility, $550 million early redemption of the 2013 Senior Notes and $16 million on other debt partially offset by net proceeds of $300 million from Commercial Paper.
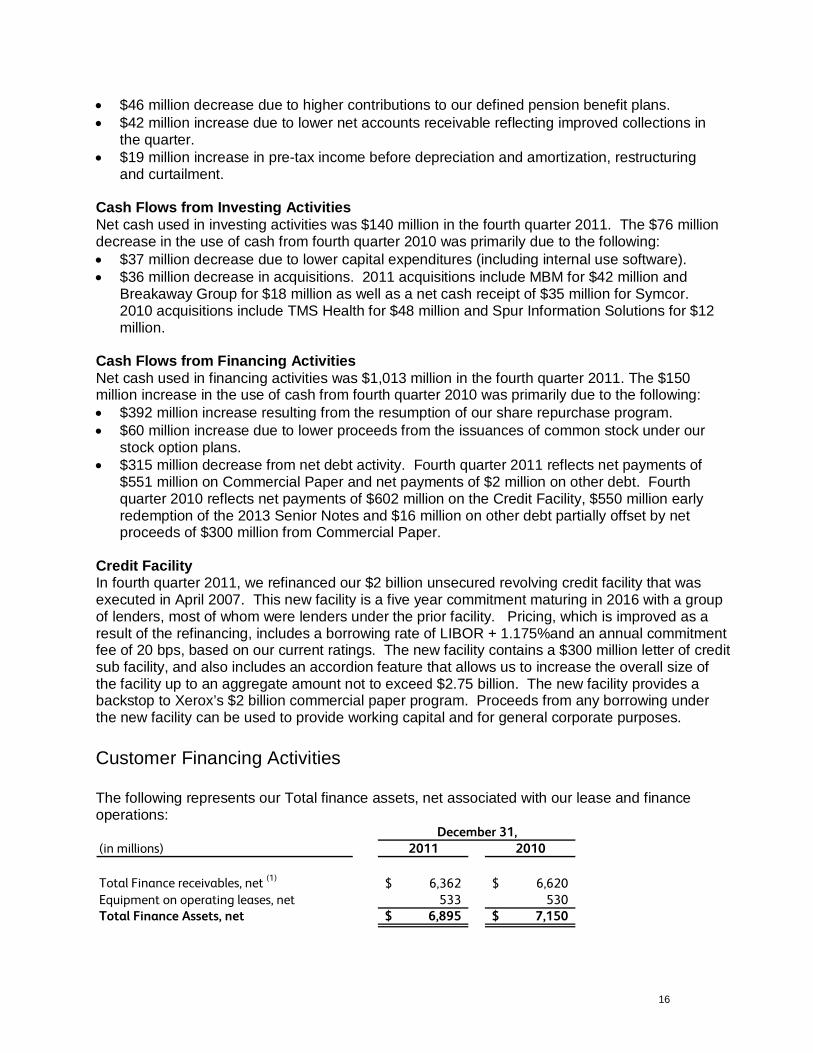
Credit Facility In fourth quarter 2011, we refinanced our $2 billion unsecured revolving credit facility that was executed in April 2007. This new facility is a five year commitment maturing in 2016 with a group of lenders, most of whom were lenders under the prior facility. Pricing, which is improved as a result of the refinancing, includes a borrowing rate of LIBOR + 1.175%and an annual commitment fee of 20 bps, based on our current ratings. The new facility contains a $300 million letter of credit sub facility, and also includes an accordion feature that allows us to increase the overall size of the facility up to an aggregate amount not to exceed $2.75 billion. The new facility provides a backstop to Xerox’s $2 billion commercial paper program. Proceeds from any borrowing under the new facility can be used to provide working capital and for general corporate purposes. Customer Financing Activities The following represents our Total finance assets, net associated with our lease and finance operations:
(in millions) 2011 2010
Total Finance receivables, net (1) 6,362$ 6,620$ Equipment on operating leases, net 533 530Total Finance Assets, net 6,895$ 7,150$
December 31,
17
(1) Includes (i) billed portion of finance receivables, net, (ii) finance receivables, net and (iii) finance receivables due after one year, net as included in our Condensed Consolidated Balance Sheets.
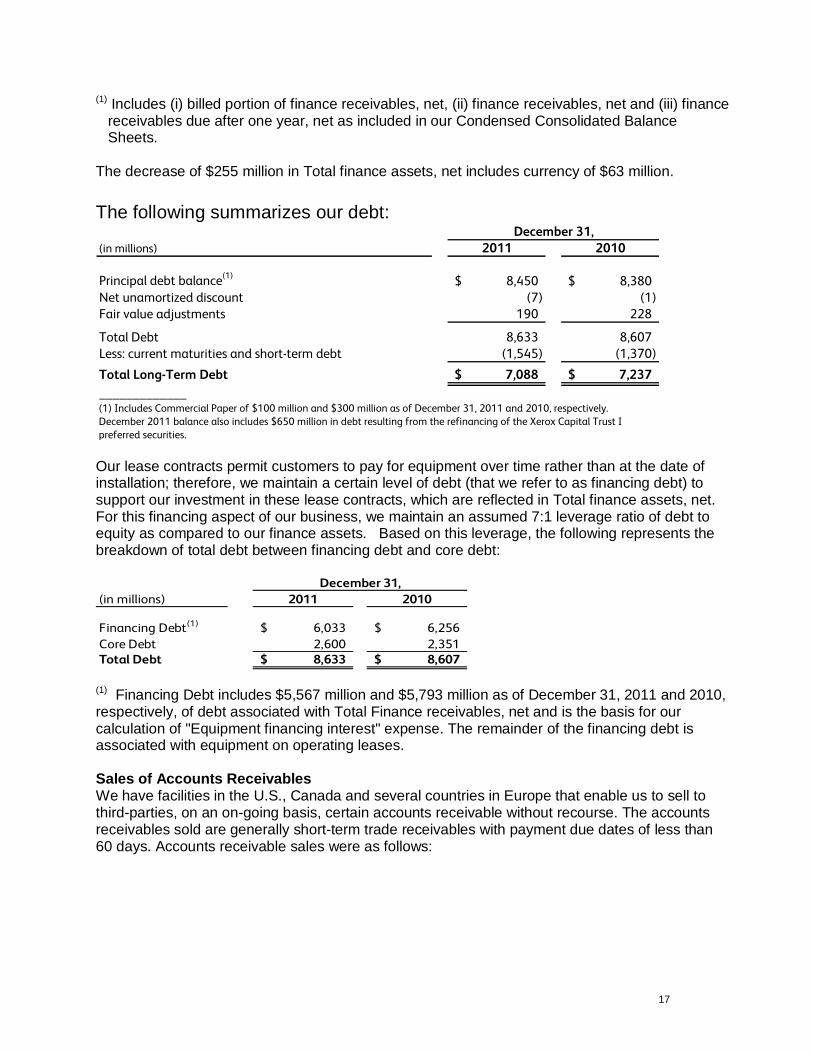
The decrease of $255 million in Total finance assets, net includes currency of $63 million. The following summarizes our debt:
(in millions) 2011 2010
Principal debt balance(1) 8,450$ 8,380$ Net unamortized discount (7) (1) Fair value adjustments 190 228
Total Debt 8,633 8,607 Less: current maturities and short-term debt (1,545) (1,370)
Total Long-Term Debt 7,088$ 7,237$ _____________(1) Includes Commercial Paper of $100 million and $300 million as of December 31, 2011 and 2010, respectively. December 2011 balance also includes $650 million in debt resulting from the refinancing of the Xerox Capital Trust I preferred securities.
December 31,
Our lease contracts permit customers to pay for equipment over time rather than at the date of installation; therefore, we maintain a certain level of debt (that we refer to as financing debt) to support our investment in these lease contracts, which are reflected in Total finance assets, net. For this financing aspect of our business, we maintain an assumed 7:1 leverage ratio of debt to equity as compared to our finance assets. Based on this leverage, the following represents the breakdown of total debt between financing debt and core debt:
(in millions) 2011 2010
Financing Debt(1) 6,033$ 6,256$ Core Debt 2,600 2,351 Total Debt 8,633$ 8,607$
December 31,
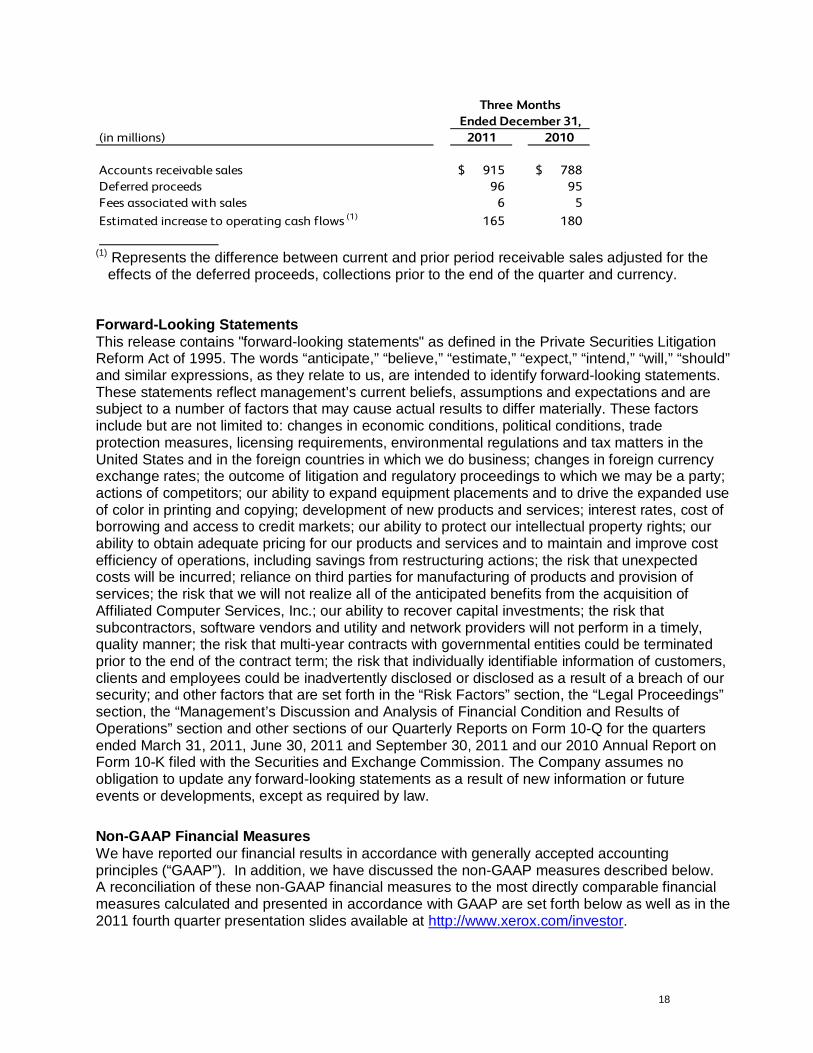
(1) Financing Debt includes $5,567 million and $5,793 million as of December 31, 2011 and 2010, respectively, of debt associated with Total Finance receivables, net and is the basis for our calculation of "Equipment financing interest" expense. The remainder of the financing debt is associated with equipment on operating leases. Sales of Accounts Receivables We have facilities in the U.S., Canada and several countries in Europe that enable us to sell to third-parties, on an on-going basis, certain accounts receivable without recourse. The accounts receivables sold are generally short-term trade receivables with payment due dates of less than 60 days. Accounts receivable sales were as follows:
18
(in millions) 2011 2010
Accounts receivable sales 915$ 788$ Deferred proceeds 96 95 Fees associated with sales 6 5 Estimated increase to operating cash flows (1) 165 180
Ended December 31,Three Months
(1) Represents the difference between current and prior period receivable sales adjusted for the
effects of the deferred proceeds, collections prior to the end of the quarter and currency. Forward-Looking Statements This release contains "forward-looking statements" as defined in the Private Securities Litigation Reform Act of 1995. The words “anticipate,” “believe,” “estimate,” “expect,” “intend,” “will,” “should” and similar expressions, as they relate to us, are intended to identify forward-looking statements. These statements reflect management’s current beliefs, assumptions and expectations and are subject to a number of factors that may cause actual results to differ materially. These factors include but are not limited to: changes in economic conditions, political conditions, trade protection measures, licensing requirements, environmental regulations and tax matters in the United States and in the foreign countries in which we do business; changes in foreign currency exchange rates; the outcome of litigation and regulatory proceedings to which we may be a party; actions of competitors; our ability to expand equipment placements and to drive the expanded use of color in printing and copying; development of new products and services; interest rates, cost of borrowing and access to credit markets; our ability to protect our intellectual property rights; our ability to obtain adequate pricing for our products and services and to maintain and improve cost efficiency of operations, including savings from restructuring actions; the risk that unexpected costs will be incurred; reliance on third parties for manufacturing of products and provision of services; the risk that we will not realize all of the anticipated benefits from the acquisition of Affiliated Computer Services, Inc.; our ability to recover capital investments; the risk that subcontractors, software vendors and utility and network providers will not perform in a timely, quality manner; the risk that multi-year contracts with governmental entities could be terminated prior to the end of the contract term; the risk that individually identifiable information of customers, clients and employees could be inadvertently disclosed or disclosed as a result of a breach of our security; and other factors that are set forth in the “Risk Factors” section, the “Legal Proceedings” section, the “Management’s Discussion and Analysis of Financial Condition and Results of Operations” section and other sections of our Quarterly Reports on Form 10-Q for the quarters ended March 31, 2011, June 30, 2011 and September 30, 2011 and our 2010 Annual Report on Form 10-K filed with the Securities and Exchange Commission. The Company assumes no obligation to update any forward-looking statements as a result of new information or future events or developments, except as required by law. Non-GAAP Financial Measures We have reported our financial results in accordance with generally accepted accounting principles (“GAAP”). In addition, we have discussed the non-GAAP measures described below. A reconciliation of these non-GAAP financial measures to the most directly comparable financial measures calculated and presented in accordance with GAAP are set forth below as well as in the 2011 fourth quarter presentation slides available at http://www.xerox.com/investor.
19
These non-GAAP financial measures should be viewed in addition to, and not as a substitute for, the Company’s reported results prepared in accordance with GAAP. Adjusted Earnings Measures To better understand the trends in our business and the impact of the ACS acquisition, we believe it is necessary to adjust the following amounts determined in accordance with GAAP to exclude the effects of the certain items as well as their related income tax effects. Note: In 2011, adjustments were limited to the amortization of intangible assets and the loss on the early extinguishment of a liability. • Net income and Earnings per share (“EPS”) • Effective tax rate • Operating income and margin
The above have been adjusted for the following items: • Restructuring and asset impairment charges (including those incurred by Fuji Xerox)
(2010 only): Restructuring and asset impairment charges consist of costs primarily related to severance and benefits for employees terminated pursuant to formal restructuring and workforce reduction plans. We exclude these charges because we believe that these historical costs do not reflect expected future operating expenses and do not contribute to a meaningful evaluation of our current or past operating performance. In addition, such charges are inconsistent in amount and frequency. Such charges are expected to yield future benefits and savings with respect to our operational performance.
• Acquisition related costs (2010 only): We incurred significant expenses in connection with our acquisition of ACS which we generally would not have otherwise incurred in the periods presented as a part of our continuing operations. Acquisition related costs include transaction and integration costs, which represent external incremental costs directly related to completing the acquisition and the integration of ACS and Xerox. We believe it is useful for investors to understand the effects of these costs on our total operating expenses.
• Amortization of intangible assets: The amortization of intangible assets is driven by our acquisition activity which can vary in size, nature and timing as compared to other companies within our industry and from period to period. Accordingly, due to the incomparability of acquisition activity among companies and from period to period, we believe exclusion of the amortization associated with intangible assets acquired through our acquisitions allows investors to better compare and understand our results. The use of intangible assets contributed to our revenues earned during the periods presented and will contribute to our future period revenues as well. Amortization of intangible assets will recur in future periods. In addition, in the fourth quarter 2011, the total amortization of intangible assets included the accelerated write-off of the ACS trade name as a result of the fourth quarter 2011 decision to discontinue its use in early 2012 and transition the services business to the “Xerox Services” trade name.
• Other discrete, unusual or infrequent costs and expenses: In addition, we have also excluded the following items given the discrete, unusual or infrequent nature of the item on our results of operations for the period: 1) Loss on early extinguishment of liability (Q4 2010, FY 2011 and FY2010); 2) ACS shareholders litigation settlement (FY 2010); 3) Venezuela devaluation costs (FY 2010); and 4) Medicare subsidy tax law change (income tax effect only) (FY 2010). We believe exclusion of these items allow investors to better understand and analyze the results for the period as compared to prior periods as well as expected trends in our business.
20
In addition to the above excluded items, operating income and margin also exclude other expenses, net. Other expenses, net is primarily composed of non-financing interest expense. Pro-forma Basis To better understand the trends in our business, we discussed our year-to-date total revenue by comparing it against the adjusted year-to-date 2010 results, which included ACS historical results for the comparable period. Accordingly, we have included ACS’s 2010 estimated total revenue results for the period January 1 through February 5, 2010 in our reported 2010 results in order to provide a full-year comparison of results for 2011 and 2010. We refer to the comparison against this adjusted 2010 result as “pro-forma” based comparison. Constant Currency To better understand trends in our business, we believe that it is helpful to adjust revenue to exclude the impact of changes in the translation of foreign currencies into U.S. dollars. We refer to this adjusted revenue as “constant currency.” Currencies for developing market countries (Latin America, Brazil, Middle East, India, Eurasia and Central-Eastern Europe) that we operate in are reported at actual exchange rates for both actual and constant revenue growth rates because (1) these countries historically have had volatile currency and inflationary environments and (2) our subsidiaries in these countries have historically taken pricing actions to mitigate the impact of inflation and devaluation. Management believes the constant currency measure provides investors an additional perspective on revenue trends. Currency impact can be determined as the difference between actual growth rates and constant currency growth rates. Management believes that these non-GAAP financial measures provide an additional means of analyzing the current periods’ results against the corresponding prior periods’ results. However, these non-GAAP financial measures should be viewed in addition to, and not as a substitute for, the Company’s reported results prepared in accordance with GAAP. Our non-GAAP financial measures are not meant to be considered in isolation or as a substitute for comparable GAAP measures and should be read only in conjunction with our consolidated financial statements prepared in accordance with GAAP. Our management regularly uses our supplemental non-GAAP financial measures internally to understand, manage and evaluate our business and make operating decisions. These non-GAAP measures are among the primary factors management uses in planning for and forecasting future periods. Compensation of our executives is based in part on the performance of our business based on these non-GAAP measures. A reconciliation of these non-GAAP financial measures and the most directly comparable measures calculated and presented in accordance with GAAP are set forth on the following tables:
21
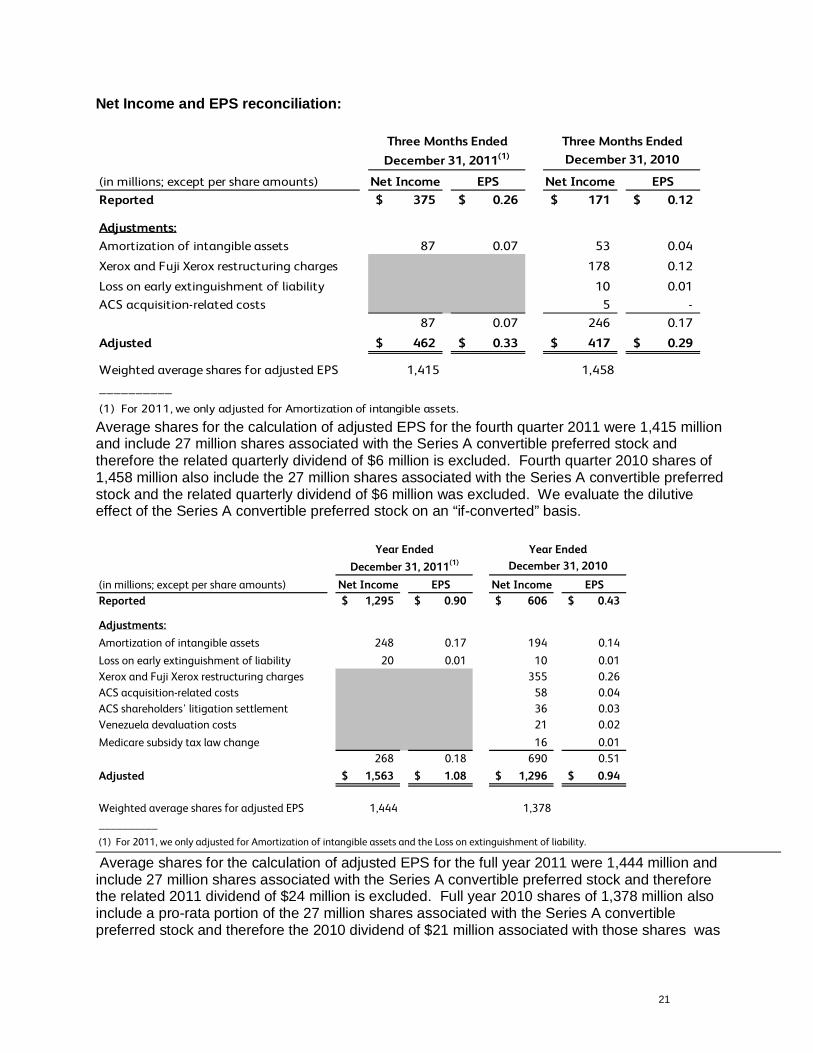
Net Income and EPS reconciliation:
(in millions; except per share amounts) Net Income EPS Net Income EPSReported 375$ 0.26$ 171$ 0.12$
Adjustments:Amortization of intangible assets 87 0.07 53 0.04
Xerox and Fuji Xerox restructuring charges 178 0.12
Loss on early extinguishment of liability 10 0.01 ACS acquisition-related costs 5 -
87 0.07 246 0.17
Adjusted 462$ 0.33$ 417$ 0.29$
Weighted average shares for adjusted EPS 1,415 1,458__________
(1) For 2011, we only adjusted for Amortization of intangible assets.
Three Months EndedDecember 31, 2011(1)
Three Months EndedDecember 31, 2010
Average shares for the calculation of adjusted EPS for the fourth quarter 2011 were 1,415 million and include 27 million shares associated with the Series A convertible preferred stock and therefore the related quarterly dividend of $6 million is excluded. Fourth quarter 2010 shares of 1,458 million also include the 27 million shares associated with the Series A convertible preferred stock and the related quarterly dividend of $6 million was excluded. We evaluate the dilutive effect of the Series A convertible preferred stock on an “if-converted” basis.
(in millions; except per share amounts) Net Income EPS Net Income EPSReported 1,295$ 0.90$ 606$ 0.43$
Adjustments:Amortization of intangible assets 248 0.17 194 0.14 Loss on early extinguishment of liability 20 0.01 10 0.01 Xerox and Fuji Xerox restructuring charges 355 0.26 ACS acquisition-related costs 58 0.04 ACS shareholders' litigation settlement 36 0.03 Venezuela devaluation costs 21 0.02 Medicare subsidy tax law change 16 0.01
268 0.18 690 0.51 Adjusted 1,563$ 1.08$ 1,296$ 0.94$
Weighted average shares for adjusted EPS 1,444 1,378__________(1) For 2011, we only adjusted for Amortization of intangible assets and the Loss on extinguishment of liability.
December 31, 2011(1)Year Ended Year Ended
December 31, 2010
Average shares for the calculation of adjusted EPS for the full year 2011 were 1,444 million and include 27 million shares associated with the Series A convertible preferred stock and therefore the related 2011 dividend of $24 million is excluded. Full year 2010 shares of 1,378 million also include a pro-rata portion of the 27 million shares associated with the Series A convertible preferred stock and therefore the 2010 dividend of $21 million associated with those shares was
22
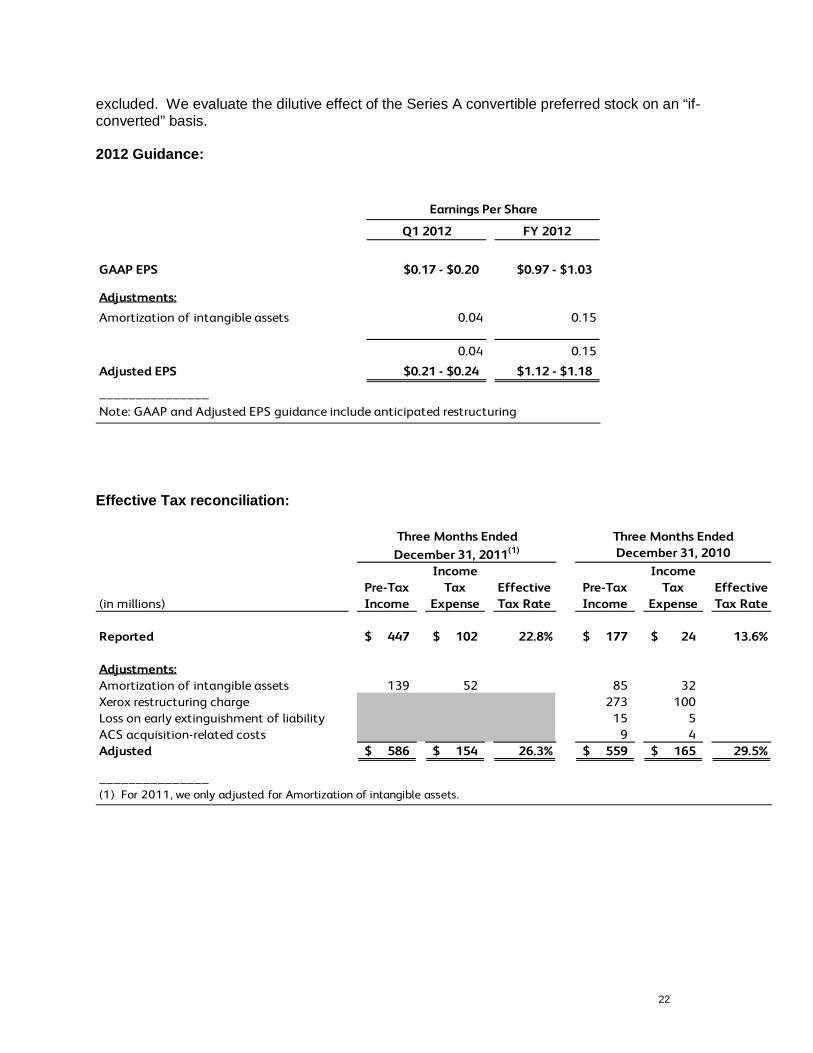
excluded. We evaluate the dilutive effect of the Series A convertible preferred stock on an “if-converted” basis. 2012 Guidance:
Q1 2012 FY 2012
GAAP EPS $0.17 - $0.20 $0.97 - $1.03
Adjustments:
Amortization of intangible assets 0.04 0.15
0.04 0.15
Adjusted EPS $0.21 - $0.24 $1.12 - $1.18
_______________Note: GAAP and Adjusted EPS guidance include anticipated restructuring
Earnings Per Share
Effective Tax reconciliation:
Three Months Ended Three Months Ended
(in millions)Pre-Tax Income
Income Tax
ExpenseEffective Tax Rate
Pre-Tax Income
Income Tax
ExpenseEffective Tax Rate
Reported 447$ 102$ 22.8% 177$ 24$ 13.6%
Adjustments:Amortization of intangible assets 139 52 85 32 Xerox restructuring charge 273 100 Loss on early extinguishment of liability 15 5 ACS acquisition-related costs 9 4 Adjusted 586$ 154$ 26.3% 559$ 165$ 29.5%
_______________(1) For 2011, we only adjusted for Amortization of intangible assets.
December 31, 2011(1) December 31, 2010
23
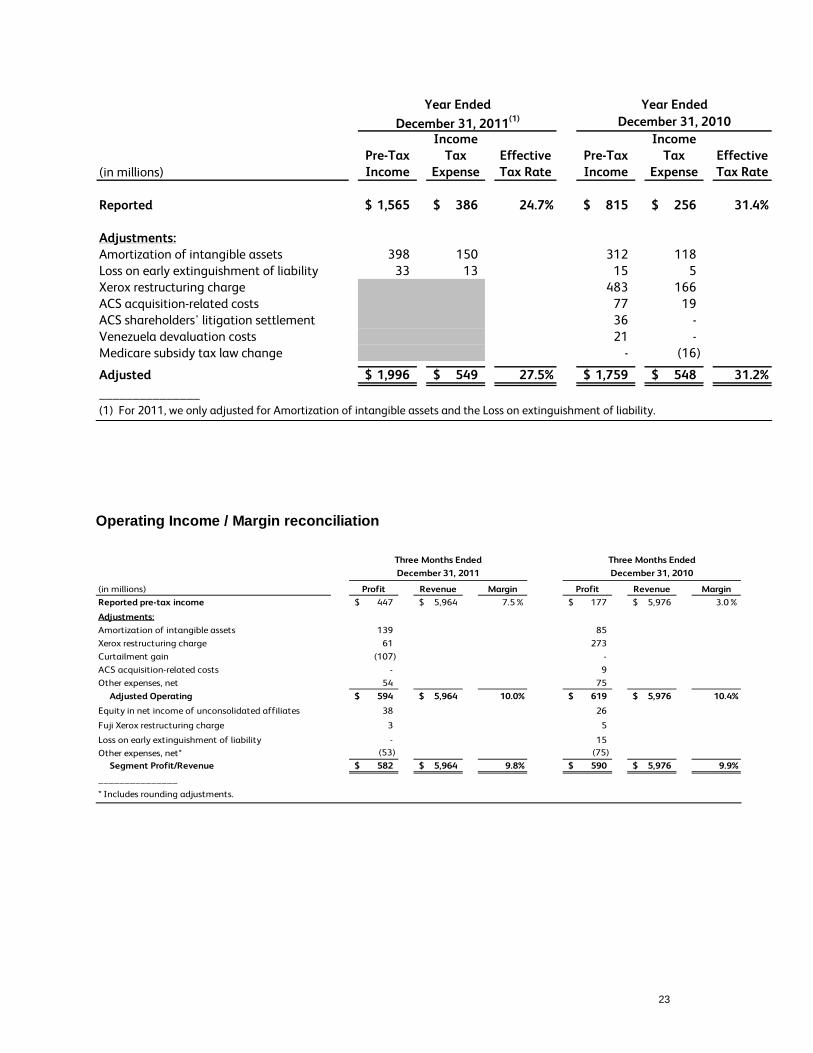
(in millions)Pre-Tax Income
Income Tax
ExpenseEffective Tax Rate
Pre-Tax Income
Income Tax
ExpenseEffective Tax Rate
Reported 1,565$ 386$ 24.7% 815$ 256$ 31.4%
Adjustments:Amortization of intangible assets 398 150 312 118 Loss on early extinguishment of liability 33 13 15 5 Xerox restructuring charge 483 166 ACS acquisition-related costs 77 19 ACS shareholders' litigation settlement 36 - Venezuela devaluation costs 21 - Medicare subsidy tax law change - (16)
Adjusted 1,996$ 549$ 27.5% 1,759$ 548$ 31.2%_______________(1) For 2011, we only adjusted for Amortization of intangible assets and the Loss on extinguishment of liability.
December 31, 2011(1) December 31, 2010Year Ended Year Ended
Operating Income / Margin reconciliation
(in millions) Profit Revenue Margin Profit Revenue MarginReported pre-tax income 447$ 5,964$ 7.5% 177$ 5,976$ 3.0%
Adjustments:Amortization of intangible assets 139 85 Xerox restructuring charge 61 273 Curtailment gain (107) - ACS acquisition-related costs - 9 Other expenses, net 54 75 Adjusted Operating 594$ 5,964$ 10.0% 619$ 5,976$ 10.4%
Equity in net income of unconsolidated affiliates 38 26
Fuji Xerox restructuring charge 3 5
Loss on early extinguishment of liability - 15 Other expenses, net* (53) (75) Segment Profit/Revenue 582$ 5,964$ 9.8% 590$ 5,976$ 9.9%_______________
* Includes rounding adjustments.
Three Months Ended Three Months EndedDecember 31, 2011 December 31, 2010
24
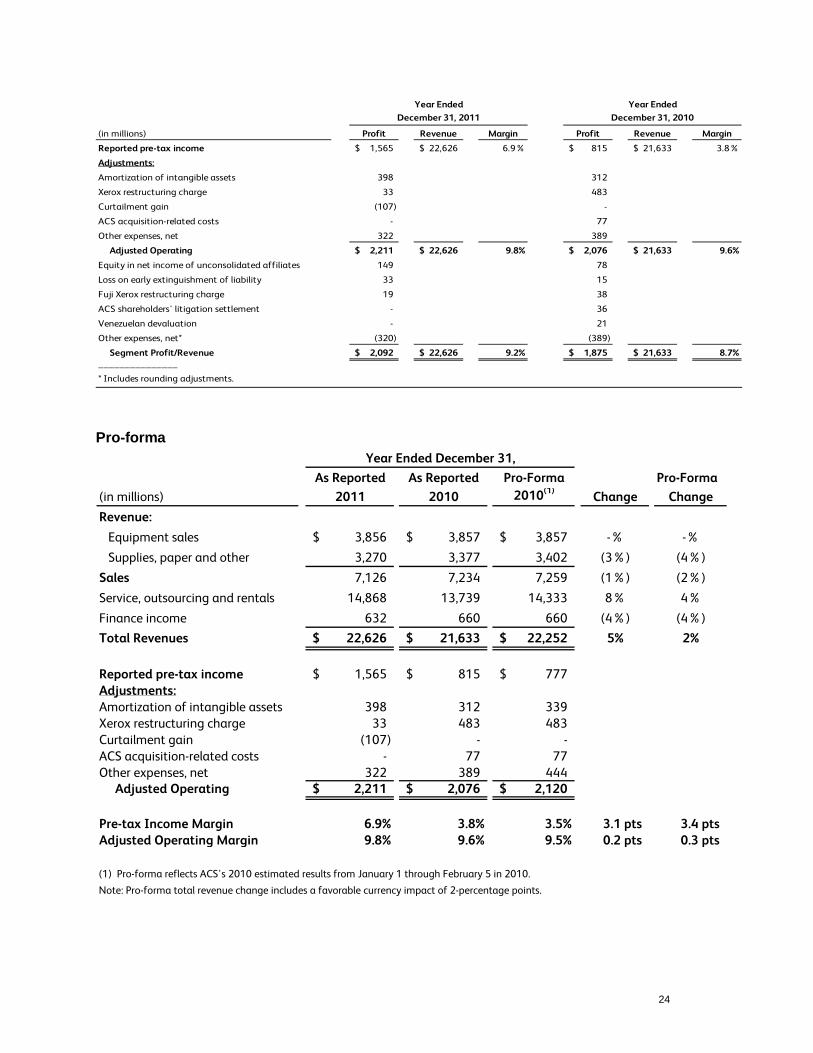
(in millions) Profit Revenue Margin Profit Revenue Margin
Reported pre-tax income 1,565$ 22,626$ 6.9% 815$ 21,633$ 3.8%
Adjustments:
Amortization of intangible assets 398 312
Xerox restructuring charge 33 483
Curtailment gain (107) -
ACS acquisition-related costs - 77
Other expenses, net 322 389
Adjusted Operating 2,211$ 22,626$ 9.8% 2,076$ 21,633$ 9.6%
Equity in net income of unconsolidated affiliates 149 78
Loss on early extinguishment of liability 33 15
Fuji Xerox restructuring charge 19 38
ACS shareholders' litigation settlement - 36
Venezuelan devaluation - 21
Other expenses, net* (320) (389)
Segment Profit/Revenue 2,092$ 22,626$ 9.2% 1,875$ 21,633$ 8.7%_______________
* Includes rounding adjustments.
December 31, 2011 December 31, 2010Year Ended Year Ended
Pro-forma
As Reported As Reported Pro-Forma Pro-Forma(in millions) 2011 2010 2010(1) Change ChangeRevenue: Equipment sales 3,856$ 3,857$ 3,857$ -% -% Supplies, paper and other 3,270 3,377 3,402 (3%) (4%)Sales 7,126 7,234 7,259 (1%) (2%)Service, outsourcing and rentals 14,868 13,739 14,333 8% 4%Finance income 632 660 660 (4%) (4%)Total Revenues 22,626$ 21,633$ 22,252$ 5% 2%
Reported pre-tax income 1,565$ 815$ 777$ Adjustments:Amortization of intangible assets 398 312 339 Xerox restructuring charge 33 483 483 Curtailment gain (107) - - ACS acquisition-related costs - 77 77 Other expenses, net 322 389 444 Adjusted Operating 2,211$ 2,076$ 2,120$
Pre-tax Income Margin 6.9% 3.8% 3.5% 3.1 pts 3.4 ptsAdjusted Operating Margin 9.8% 9.6% 9.5% 0.2 pts 0.3 pts
(1) Pro-forma reflects ACS's 2010 estimated results from January 1 through February 5 in 2010.
Note: Pro-forma total revenue change includes a favorable currency impact of 2-percentage points.
Year Ended December 31,
25
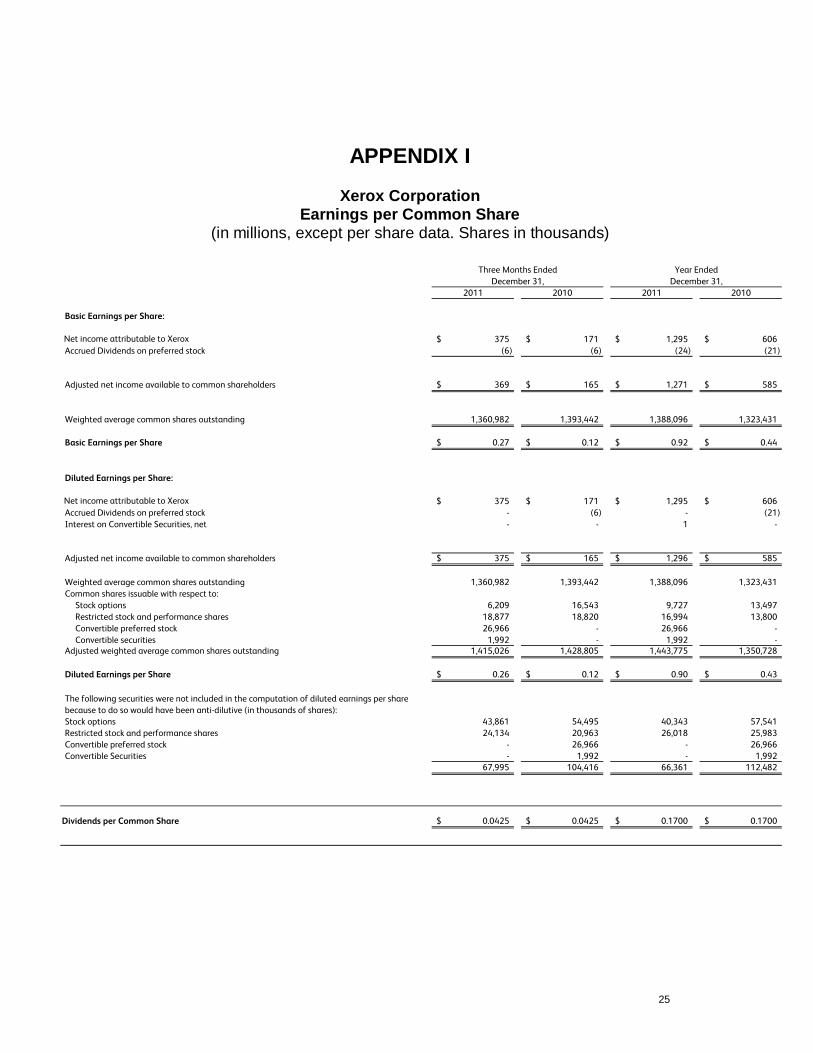
APPENDIX I
Xerox Corporation Earnings per Common Share
(in millions, except per share data. Shares in thousands)
2011 2010 2011 2010
Basic Earnings per Share:
Net income attributable to Xerox 375$ 171$ 1,295$ 606$ Accrued Dividends on preferred stock (6) (6) (24) (21)
Adjusted net income available to common shareholders 369$ 165$ 1,271$ 585$
Weighted average common shares outstanding 1,360,982 1,393,442 1,388,096 1,323,431
Basic Earnings per Share 0.27$ 0.12$ 0.92$ 0.44$
Diluted Earnings per Share:
Net income attributable to Xerox 375$ 171$ 1,295$ 606$ Accrued Dividends on preferred stock - (6) - (21) Interest on Convertible Securities, net - - 1 -
Adjusted net income available to common shareholders 375$ 165$ 1,296$ 585$
Weighted average common shares outstanding 1,360,982 1,393,442 1,388,096 1,323,431 Common shares issuable with respect to: Stock options 6,209 16,543 9,727 13,497 Restricted stock and performance shares 18,877 18,820 16,994 13,800 Convertible preferred stock 26,966 - 26,966 - Convertible securities 1,992 - 1,992 - Adjusted weighted average common shares outstanding 1,415,026 1,428,805 1,443,775 1,350,728
Diluted Earnings per Share 0.26$ 0.12$ 0.90$ 0.43$
The following securities were not included in the computation of diluted earnings per share because to do so would have been anti-dilutive (in thousands of shares):Stock options 43,861 54,495 40,343 57,541 Restricted stock and performance shares 24,134 20,963 26,018 25,983 Convertible preferred stock - 26,966 - 26,966 Convertible Securities - 1,992 - 1,992
67,995 104,416 66,361 112,482
Dividends per Common Share 0.0425$ 0.0425$ 0.1700$ 0.1700$
December 31, December 31,Three Months Ended Year Ended
26
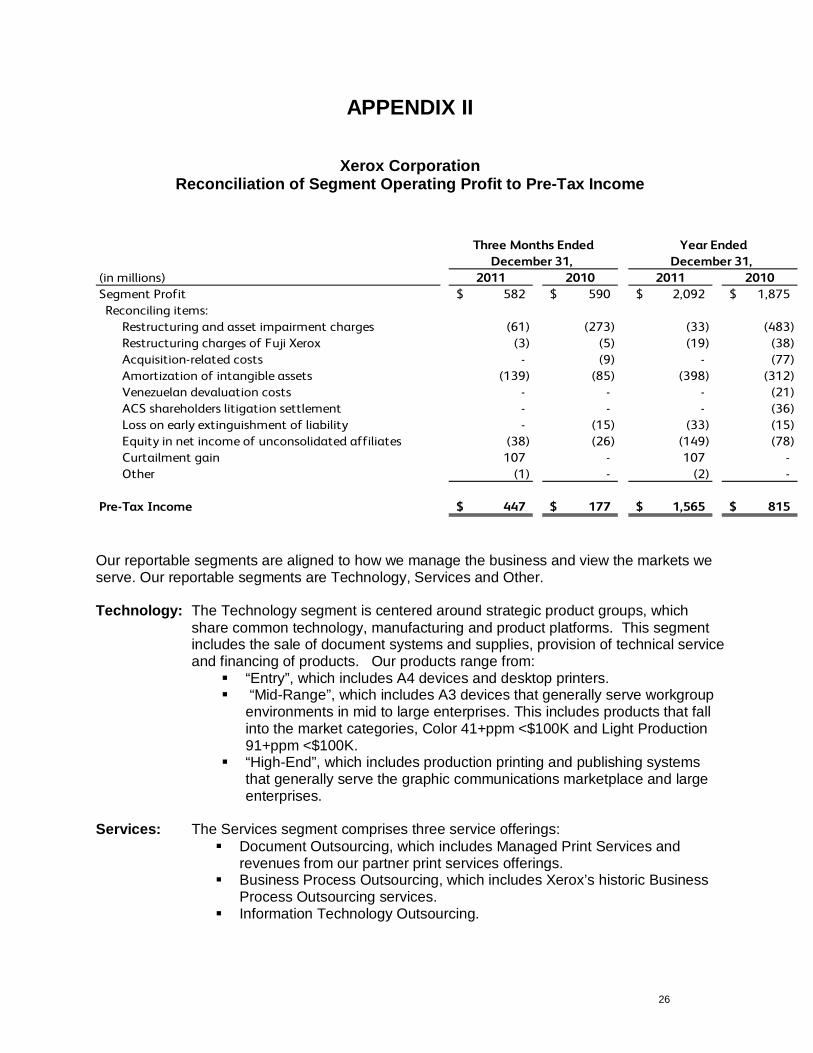
APPENDIX II
Xerox Corporation Reconciliation of Segment Operating Profit to Pre-Tax Income
(in millions) 2011 2010 2011 2010Segment Profit 582$ 590$ 2,092$ 1,875$ Reconciling items:
Restructuring and asset impairment charges (61) (273) (33) (483) Restructuring charges of Fuji Xerox (3) (5) (19) (38) Acquisition-related costs - (9) - (77) Amortization of intangible assets (139) (85) (398) (312) Venezuelan devaluation costs - - - (21) ACS shareholders litigation settlement - - - (36) Loss on early extinguishment of liability - (15) (33) (15) Equity in net income of unconsolidated affiliates (38) (26) (149) (78) Curtailment gain 107 - 107 - Other (1) - (2) -
Pre-Tax Income 447$ 177$ 1,565$ 815$
Three Months Ended Year EndedDecember 31, December 31,
Our reportable segments are aligned to how we manage the business and view the markets we serve. Our reportable segments are Technology, Services and Other. Technology: The Technology segment is centered around strategic product groups, which
share common technology, manufacturing and product platforms. This segment includes the sale of document systems and supplies, provision of technical service and financing of products. Our products range from:
“Entry”, which includes A4 devices and desktop printers. “Mid-Range”, which includes A3 devices that generally serve workgroup
environments in mid to large enterprises. This includes products that fall into the market categories, Color 41+ppm <$100K and Light Production 91+ppm <$100K.
“High-End”, which includes production printing and publishing systems that generally serve the graphic communications marketplace and large enterprises.
Services: The Services segment comprises three service offerings:
Document Outsourcing, which includes Managed Print Services and revenues from our partner print services offerings.
Business Process Outsourcing, which includes Xerox’s historic Business Process Outsourcing services.
Information Technology Outsourcing.

27
Other: The Other segment includes Xerox Supplies Business Group (“XSBG”) (predominantly paper), Wide Format Systems, licensing revenue, GIS network integration solutions and electronic presentation systems, and non-allocated corporate items.