Embed Size (px)
Citation preview

News Release
1
FOR IMMEDIATE RELEASE
August 3, 2017
SM ENERGY REPORTS SECOND QUARTER OF 2017 RESULTS
FOCUS ON CAPITAL EFFICIENCY DRIVING VALUE
PRODUCTION BEATS, RAISING GUIDANCE
• Production beats expectations: 11.3 MMBoe, exceeding guidance due to well performance
◦ 11% growth from retained assets compared with the second quarter of 2016
◦ Full year 2017 production guidance increased by 0.8 MMBoe at the mid-point to 44.5-46.5
MMBoe
◦ Guidance reflects expected significant oil growth in the second half of 2017
• Capital efficiency drives value: First half of 2017 exceeds plan expectations for well performance
and revenue at lower than expected drilling and completion costs
• Well tests continue to confirm RockStar acreage to east: Viper well peak 24-hour IP rate of 1,316
Boe/d, 91% oil
• Balance sheet remains strong: $1.5 B in liquidity
Denver, Colorado August 3, 2017 - SM Energy Company ("SM Energy" or the “Company”) (NYSE: SM)
announced today financial results and operations highlights from the second quarter of 2017. The Company
has revised its quarterly reporting format to include posting both an investor presentation and pre-recorded
call in conjunction with this release. Please visit the Company’s website at sm-energy.com to access this
additional second quarter detail. The Company will host a webcast and conference call at 8:00 a.m.
Mountain Time (10:00 a.m. Eastern Time) tomorrow, August 4, 2017, to answer questions. Further
information on the earnings webcast and conference call can be found below.
MANAGEMENT COMMENTARY
President and Chief Executive Officer Jay Ottoson comments: “Our team continues to meet or exceed our
operational objectives year-to-date. Our relentless pursuit of improved well performance and detailed
approach to cost management have delivered high levels of efficiency in our capital investment program.
As a result, year-to-date we have generated more production than we expected with less capital investment
than we planned, and we are further increasing 2017 production guidance to reflect our projections for
continued outperformance.”

2
SECOND QUARTER 2017 RESULTS
PRODUCTION - SEQUENTIAL COMPARISON:
COMPANY PRODUCTION
Second Quarter 2017
First Quarter 2017 % Change
Total Company (MMBoe) 11.3 12.1
Assets sold (MMBoe) — (1.5 )
Retained Assets (MMBoe) 11.3 10.6
By commodity
Oil (MMBbls) 2.9 3.0 (4 )%
Natural gas (Bcf) 34.0 30.8 10 %
NGLs (MMBbls) 2.8 2.4 13 %
Retained Assets (MMBoe) 11.3 10.6 7 % By region (MMBoe)
Eagle Ford (operated) 8.0 7.3 10 %
Permian Basin 2.3 2.1 8 %
Rocky Mountain 1.1 1.2 (12 )%
Retained Assets (MMBoe) 11.3 10.6 7 %
• Total Company production includes production from assets sold (through the closing date)
• Eagle Ford (operated) includes nominal other production from the region
Second quarter production of 11.3 MMBoe is up 7% sequentially and up 11% compared with the second
quarter of 2016, on a retained asset basis. Production in the second quarter of 2017 reflects the
acceleration of 11 well completions in the Eagle Ford (as announced on June 6, 2017), and further exceeds
guidance due to continued production outperformance from new wells in both the Permian Basin and Eagle
Ford. As a result of second quarter production outperformance, the Company is raising full year production
guidance by 0.8 MMBoe. For the first six months of 2017, production was 23.4 MMBoe.
In the second quarter of 2017, the average realized price per Boe before the effects of commodity hedges
was $25.13 and after the effects of commodity hedges was $26.57. Cash production costs totaled $10.98
per Boe, down sequentially from $11.42 per Boe in the first quarter of 2017 and up from $10.38 per Boe in
the second quarter of 2016. The Company is updating its guidance for the second half of 2017 to reflect
modified LOE and transportation costs associated with retaining its Divide County, North Dakota assets.
Please see guidance below.
Net loss for the second quarter of 2017 was $119.9 million, or $1.08 per diluted common share, compared
with a net loss of $168.7 million, or $2.48 per diluted common share, in the second quarter of 2016. Net
loss in the second quarter of 2017 reflects a 43% increase in the Company’s pre-hedge cash operating
margin per Boe from the prior year period. The 2017 period also includes a reduction in DD&A expense
per Boe from $14.75 to $13.52, a loss on divestiture activity of $167.1 million and a non-cash derivative
gain of $38.9 million. Net cash provided by operating activities in the second quarter of 2017 was $107.1

3
million. For the first six months of 2017, net loss was $45.5 million, or $0.41 per diluted common share,
and net cash provided by operating activities was $242.1 million.
As discussed below, adjusted EBITDAX, adjusted net income (loss) and adjusted net income (loss)
per diluted common share are non-GAAP measures. Please reference the reconciliations to the
most directly comparable GAAP financial measures at the end of this release.
Adjusted EBITDAX for the second quarter of 2017 was $154.1 million, compared with $217.1 million in the
prior year period. While the pre-hedge operating margin was significantly higher in the second quarter of
2017, the prior year period benefited from a $101.7 million derivative settlement gain. For the first six
months of 2017, adjusted EBITDAX was $326.3 million.
Adjusted net loss for the second quarter was $35.5 million, or $0.32 per diluted common share, compared
with an adjusted net loss of $30.2 million, or $0.44 per diluted common share, in the second quarter of
2016. For the first six months of 2017, adjusted net loss was $55.2 million, or $0.50 per diluted common
share. The calculation of adjusted net loss excludes non-recurring items and items difficult to estimate in
order to present results that can be more consistently compared with prior periods and peer results.
FINANCIAL POSITION AND LIQUIDITY
At June 30, 2017, the outstanding principal balance on the Company’s long-term debt included $2.8 billion
in senior notes plus $172.5 million in senior convertible notes, with zero drawn on the Company’s senior
secured credit facility. At quarter-end, the Company had a cash balance of $559.5 million, providing for net
debt of $2.4 billion. The Company’s undrawn credit facility plus cash on hand provide $1.5 billion in liquidity.
CAPITAL ACTIVITY AND OPERATIONS
Costs incurred for the second quarter of 2017 were $258.0 million, which included $15.7 million of primarily
unproved property acquisitions. Second quarter total capital spend (see below for GAAP reconciliation)
was $237.3 million. During the quarter, the Company drilled or participated in 30 net wells and completed
or participated in 25 net wells. For the first six months of 2017, costs incurred were $515.0 million and total
capital spend was $430.2 million.
Please refer to the Total Capital Spend Reconciliation at the end of this release for a reconciliation
to Costs Incurred in oil and gas activities (GAAP).
PERMIAN BASIN
In the second quarter of 2017, production from the Company’s Midland Basin assets was 2.3 MMBoe and
was 75% oil. The Company is currently running seven horizontal rigs in the basin, with two in the Sweetie
Peck area and five in the RockStar area. The Company recently converted the single vertical rig operating
in the RockStar area to horizontal drilling, and is currently running three completion crews. During the
second quarter, the Company drilled 23 net operated wells and had nine net flowing completions. The
second quarter production margin for this area was $28.75 per Boe.
Subsequent to quarter-end, the Viper well, located in the northern portion of the Company’s RockStar
acreage, reached a 24-hour peak initial production rate of 1,316 Boe/d. The Viper well is drilled into the

4
Wolfcamp A with a 10,400 foot lateral. Similar to peer wells in the area, the Viper well demonstrates a lower
peak rate combined with a flatter production profile. In combination with nearby peer wells, the area now
supports economic wells in the Wolfcamp A (SM, Sabalo), Wolfcamp B (Apache) and Lower Spraberry
(Sabalo).
The Company remains focused on optimizing drilling and completion operations across the basin in order
to identify the appropriate number of wells per section and optimize production performance in preparation
for increased development activity in 2018. Over the past year, the Company has collected approximately
3,500 feet of core to better understand the entire Spraberry through Wolfcamp column, gather
geomechanical rock properties necessary to support reservoir simulation efforts, and evaluate untested
intervals. Efforts to drive capital efficiency and optimization also include drilling longer laterals and pad
drilling. The Company has just completed the first 10,000 foot laterals at Sweetie Peck and has just
completed the first six well pad at RockStar that co-develops the Lower Spraberry and Wolfcamp A.
The Company currently has approximately 89,000 net acres in the Midland Basin, which includes
approximately 5,400 additional net acres acquired year-to-date through acreage trades and other
transactions.
EAGLE FORD
In the second quarter of 2017, production from the Company’s operated Eagle Ford assets was 8.0 MMBoe
and included 62% natural gas, 34% NGLs, and 4% oil. Production was up 9.5% sequentially as the
Company accelerated activity in the area. The Company is currently running one horizontal rig with plans
to add a second horizontal rig during the third quarter in the Eagle Ford. During the second quarter, the
Company drilled six and completed 14 net wells, including acceleration of 11 completions into the second
quarter.
The Company’s focus on drilling and completion optimization continues to drive better results in the Eagle
Ford where completions year-to-date are exceeding type curve expectations and driving higher production.
For example in the North Area, pad completions in the first half of 2017 included tighter stage and cluster
spacing with increased fluid. The Company's current drilling plan co-develops the lower and upper Eagle
Ford (see associated investor presentation for graph). In the East Area, pad completions included higher
sand loadings and tighter stage spacing. Wells are downspaced to 625 feet (from 900 feet) and continue
to outperform the 900 foot spacing type curve.
The Company operates approximately 167,500 net acres in its Eagle Ford program.
ROCKY MOUNTAIN
In the Powder River Basin, the Company is working with a third party to test newer generation drilling and
completion techniques in the Shannon and Frontier zones. To-date, well results are very positive and the
Company anticipates continuing its relationship with the third party into 2018.
During the second quarter, the Company decided to retain its Divide County assets (previously held for
sale) rather than sell the assets due to market conditions.

5
GUIDANCE
Full year 2017 guidance is revised as follows:
• Total capital spend (before acquisitions) ($MM) $875 (unchanged)
• Total production (MMBoe) 44.5-46.5
◦ Increased 0.8 MMBoe at the mid-point
◦ Oil percent near 30% of commodity mix, full year average
• LOE including ad valorem ($/Boe) $4.30-4.60
◦ Increased to include retention of Divide County
• Transportation ($/Boe) $5.40-5.65
◦ Reduced $0.10 at the midpoint
• Production taxes ($/Boe/percent of pre-hedge revenue) ~$1.10/4.0-4.5%
• G&A ($MM) $115-125
◦ Reduced $5 MM at the mid-point
◦ Includes approximately $20 MM non-cash, stock-based compensation expense
• Capitalized overhead/Exploration before dry hole expenses ($MM) $65-70 (unchanged)
◦ This amount is a component of capital guidance
• DD&A ($/Boe) $12.00-14.00
Third quarter of 2017 production is expected to range between 10.8 and 11.2 MMBoe, which will vary
depending upon the ultimate timing of capital activity, at approximately 29-30% oil in the commodity mix.
Total capital spend (before acquisitions) is a non-GAAP measure. The Company is unable to
present a quantitative reconciliation of this forward-looking non-GAAP financial measure without
unreasonable effort because acquisition costs are inherently unpredictable.
6
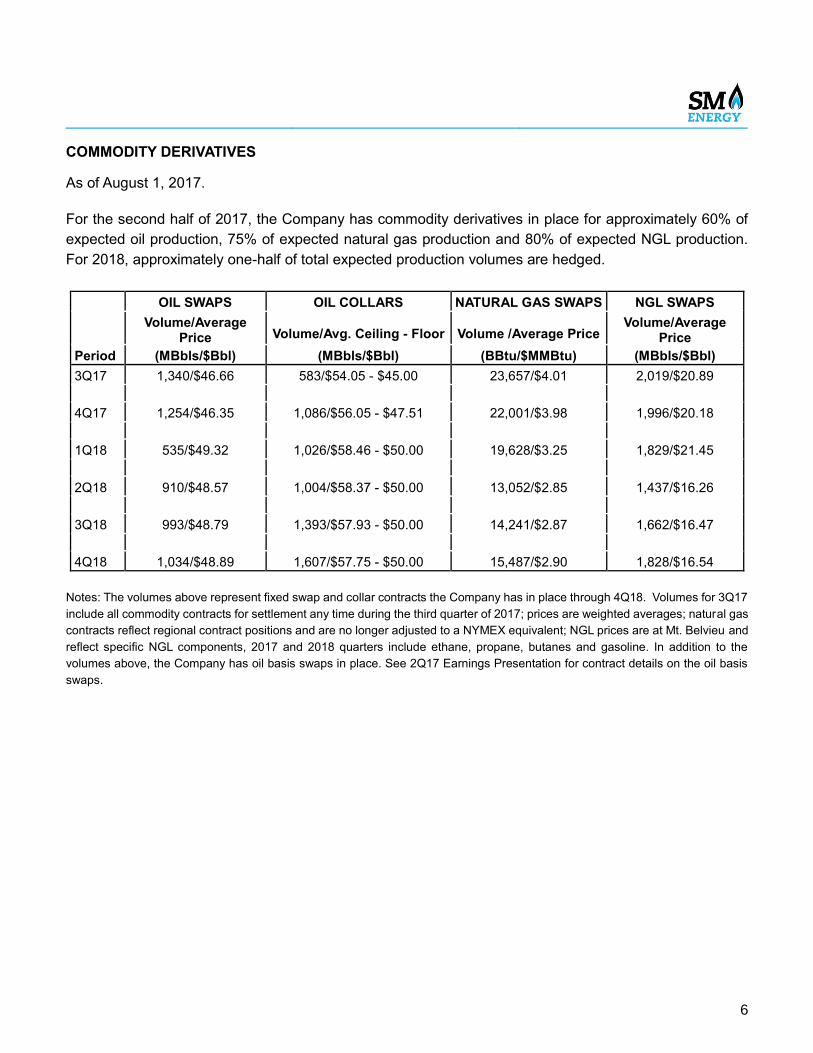
COMMODITY DERIVATIVES
As of August 1, 2017.
For the second half of 2017, the Company has commodity derivatives in place for approximately 60% of
expected oil production, 75% of expected natural gas production and 80% of expected NGL production.
For 2018, approximately one-half of total expected production volumes are hedged.
OIL SWAPS OIL COLLARS NATURAL GAS SWAPS NGL SWAPS
Volume/Average
Price Volume/Avg. Ceiling - Floor Volume /Average Price Volume/Average
Price
Period (MBbls/$Bbl) (MBbls/$Bbl) (BBtu/$MMBtu) (MBbls/$Bbl)
3Q17 1,340/$46.66 583/$54.05 - $45.00 23,657/$4.01 2,019/$20.89
4Q17 1,254/$46.35 1,086/$56.05 - $47.51 22,001/$3.98 1,996/$20.18
1Q18 535/$49.32 1,026/$58.46 - $50.00 19,628/$3.25 1,829/$21.45
2Q18 910/$48.57 1,004/$58.37 - $50.00 13,052/$2.85 1,437/$16.26
3Q18 993/$48.79 1,393/$57.93 - $50.00 14,241/$2.87 1,662/$16.47
4Q18 1,034/$48.89 1,607/$57.75 - $50.00 15,487/$2.90 1,828/$16.54
Notes: The volumes above represent fixed swap and collar contracts the Company has in place through 4Q18. Volumes for 3Q17
include all commodity contracts for settlement any time during the third quarter of 2017; prices are weighted averages; natural gas
contracts reflect regional contract positions and are no longer adjusted to a NYMEX equivalent; NGL prices are at Mt. Belvieu and
reflect specific NGL components, 2017 and 2018 quarters include ethane, propane, butanes and gasoline. In addition to the
volumes above, the Company has oil basis swaps in place. See 2Q17 Earnings Presentation for contract details on the oil basis
swaps.

7
UPCOMING EVENTS
EARNINGS WEBCAST AND CALL
As previously announced, SM Energy is posting a pre-recorded discussion and presentation in conjunction
with this earnings release. Please look for the additional detail on our website at www.sm-energy.com.
Tomorrow morning, the Company will host a second quarter financial and operating results Q&A session
via webcast and conference call. Please join management at 8:00 a.m. Mountain Time/10:00 a.m. Eastern
Time August 4, 2017. Join us via webcast at www.sm-energy.com or by telephone 877-870-4263 (toll free)
or 412-317-0790 (international), and indicate SM Energy earnings call. The webcast and call will also be
available for replay. The dial-in replay number is 877-344-7529 (toll free).
UPCOMING CONFERENCE PARTICIPATION
• August 15, 2017 - Enercom: The Oil and Gas Conference 22. President and Chief Executive Officer
Jay Ottoson will present at 10:05 a.m. Mountain time. This event will be webcast. An investor
presentation for this event will be posted to the Company’s website on August 14, 2017.
• September 6, 2017 - Barclays CEO Energy-Power Conference. President and Chief Executive
Officer Jay Ottoson will present at 11:45 a.m. Eastern time. This event will be webcast. An investor
presentation for this event will be posted to the Company’s website on September 5, 2017.
FORWARD LOOKING STATEMENTS
This release contains forward-looking statements within the meaning of securities laws. These statements
involve known and unknown risks, which may cause SM Energy's actual results to differ materially from
results expressed or implied by the forward-looking statements. Forward-looking statements in this release
include, among other things, guidance estimates for the third quarter and full year 2017. General risk factors
include the availability, proximity and capacity of gathering, processing and transportation facilities; the
volatility and level of oil, natural gas, and natural gas liquids prices, including any impact on the Company’s
asset carrying values or reserves arising from price declines; uncertainties inherent in projecting future
rates of production or other results from drilling and completion activities; the imprecise nature of estimating
oil and gas reserves; uncertainties inherent in projecting future drilling and completion activities, costs or
results; the uncertain nature of divestiture, joint venture, farm down or similar efforts and the ability to
complete any such transactions; the uncertain nature of expected benefits from the actual or expected
divestiture, joint venture, farm down or similar efforts; the availability of additional economically attractive
exploration, development, and acquisition opportunities for future growth and any necessary financings;
unexpected drilling conditions and results; unsuccessful exploration and development drilling results; the
availability of drilling, completion, and operating equipment and services; the risks associated with the
Company's commodity price risk management strategy; uncertainty regarding the ultimate impact of
potentially dilutive securities; and other such matters discussed in the “Risk Factors” section of SM Energy's
2016 Annual Report on Form 10-K, as such risk factors may be updated from time to time in the Company's
other periodic reports filed with the Securities and Exchange Commission. The forward-looking statements
contained herein speak as of the date of this announcement. Although SM Energy may from time to time

8
voluntarily update its prior forward-looking statements, it disclaims any commitment to do so except as
required by securities laws.
ABOUT THE COMPANY
SM Energy Company is an independent energy company engaged in the acquisition, exploration,
development, and production of crude oil, natural gas, and natural gas liquids in onshore North America.
SM Energy routinely posts important information about the Company on its website. For more information
about SM Energy, please visit its website at www.SM-Energy.com.
SM ENERGY CONTACTS
INVESTORS: Jennifer Martin Samuels, [email protected], 303-864-2507

9
SM ENERGY COMPANY
FINANCIAL HIGHLIGHTS (UNAUDITED)
June 30, 2017
For the Three Months Ended
June 30, For the Six Months Ended
June 30,
Production Data 2017 2016 Percent Change 2017 2016
Percent Change
Average realized sales price, before the effects of derivative settlements:
Oil (per Bbl) $ 44.30 $ 39.38 12 % $ 46.08 $ 32.51 42 %
Gas (per Mcf) 2.99 1.79 67 % 2.99 1.83 63 %
NGLs (per Bbl) 19.71 16.12 22 % 20.92 14.05 49 %
Equivalent (per BOE) $ 25.13 $ 20.35 23 % $ 26.38 $ 18.14 45 %
Average realized sales price, including the effects of derivative settlements:
Oil (per Bbl) $ 43.36 $ 56.97 (24 )% $ 44.24 $ 53.45 (17 )%
Gas (per Mcf) 3.63 2.60 40 % 3.56 2.80 27 %
NGLs (per Bbl) 18.73 15.61 20 % 18.96 14.63 30 %
Equivalent (per BOE) $ 26.57 $ 27.45 (3 )% $ 27.08 $ 27.11 — %
Production:
Oil (MMBbl) 2.9 4.1 (29 )% 6.4 8.2 (22 )%
Gas (Bcf) 34.0 39.0 (13 )% 67.9 74.7 (9 )%
NGLs (MMBbl) 2.8 3.7 (26 )% 5.7 7.1 (20 )%
MMBOE (6:1) 11.3 14.3 (21 )% 23.4 27.7 (15 )%
Average daily production:
Oil (MBbl/d) 32.0 45.1 (29 )% 35.5 45.2 (21 )%
Gas (MMcf/d) 374.1 428.2 (13 )% 375.3 410.2 (9 )%
NGLs (MBbl/d) 30.3 40.8 (26 )% 31.4 38.8 (19 )%
MBOE/d (6:1) 124.6 157.2 (21 )% 129.5 152.4 (15 )%
Per BOE data:
Realized price, before the effects of derivative settlements $ 25.13
$ 20.35
23 % $ 26.38
$ 18.14
45 %
Lease operating expense 4.11 3.31 24 % 3.96 3.54 12 %
Transportation costs 5.71 5.95 (4 )% 5.79 6.00 (4 )%
Production taxes 1.00 0.93 8 % 1.09 0.80 36 %
Ad valorem tax expense 0.16 0.19 (16 )% 0.36 0.23 57 %
General and administrative (excluding stock-compensation) 2.21
1.60
38 % 2.15
1.80
19 %
Net, before the effects of derivative settlements $ 11.94 $ 8.37 43 % $ 13.03 $ 5.77 126 %
Derivative settlement gain 1.44 7.10 (80 )% 0.70 8.97 (92 )%
Margin, including the effects of derivative settlements $ 13.38 $ 15.47 (14 )% $ 13.73 $ 14.74 (7 )%
Depletion, depreciation, amortization, and asset retirement obligation liability accretion $ 13.52
$ 14.75
(8 )% $ 12.42
$ 15.34
(19 )%

10
SM ENERGY COMPANY
FINANCIAL HIGHLIGHTS (UNAUDITED)
June 30, 2017
Condensed Consolidated Balance Sheets
(in thousands, except share amounts) June 30, December 31,
ASSETS 2017 2016
Current assets:
Cash and cash equivalents $ 559,521 $ 9,372
Accounts receivable 105,713 151,950
Derivative asset 85,962 54,521
Prepaid expenses and other 18,121 8,799
Total current assets 769,317 224,642
Property and equipment (successful efforts method):
Total property and equipment, net 5,346,411 6,081,354
Noncurrent assets:
Derivative asset 82,194 67,575
Other noncurrent assets 14,683 19,940
Total other noncurrent assets 96,877 87,515
Total Assets $ 6,212,605 $ 6,393,511
LIABILITIES AND STOCKHOLDERS’ EQUITY
Current liabilities:
Accounts payable and accrued expenses $ 311,476 $ 299,708
Derivative liability 36,296 115,464
Total current liabilities 347,772 415,172
Noncurrent liabilities:
Revolving credit facility — —
Senior Notes, net of unamortized deferred financing costs 2,767,030 2,766,719
Senior Convertible Notes, net of unamortized discount and deferred financing costs 134,918 130,856
Asset retirement obligation 100,304 96,134
Asset retirement obligation associated with oil and gas properties held for sale 234 26,241
Deferred income taxes 245,506 315,672
Derivative liability 69,915 98,340
Other noncurrent liabilities 45,098 47,244
Total noncurrent liabilities 3,363,005 3,481,206
Stockholders’ equity:
Common stock, $0.01 par value - authorized: 200,000,000 shares; issued and outstanding: 111,453,476 and 111,257,500 shares, respectively 1,115
1,113
Additional paid-in capital 1,729,104 1,716,556
Retained earnings 786,608 794,020
Accumulated other comprehensive loss (14,999 ) (14,556 )
Total stockholders’ equity 2,501,828 2,497,133
Total Liabilities and Stockholders’ Equity $ 6,212,605 $ 6,393,511

11
SM ENERGY COMPANY
FINANCIAL HIGHLIGHTS (UNAUDITED)
June 30, 2017
Condensed Consolidated Statements of Operations
(in thousands, except per share amounts) For the Three Months Ended
June 30, For the Six Months Ended
June 30,
2017 2016 2017 2016
Operating revenues and other income: Oil, gas, and NGL production revenue $ 284,939 $ 291,142 $ 618,137 $ 502,965
Net gain (loss) on divestiture activity (167,133 ) 50,046 (129,670 ) (18,975 )
Other operating revenues 2,915 626 4,992 900
Total operating revenues and other income 120,721 341,814 493,459 484,890
Operating expenses:
Oil, gas, and NGL production expense 124,376 148,591 262,422 293,134
Depletion, depreciation, amortization, and asset retirement obligation liability accretion 153,232
211,020
291,044
425,227
Exploration 13,072 13,187 25,050 28,460
Impairment of proved properties 3,806 — 3,806 269,785
Abandonment and impairment of unproved properties 157
38
157
2,349
General and administrative 28,460 28,200 57,684 60,438
Net derivative (gain) loss (55,189 ) 163,351 (169,963 ) 149,123
Other operating expenses 445 7,976 5,304 13,648
Total operating expenses 268,359 572,363 475,504 1,242,164
Income (loss) from operations (147,638 ) (230,549 ) 17,955 (757,274 )
Non-operating income (expense):
Interest expense (44,595 ) (34,035 ) (91,548 ) (65,123 )
Gain (loss) on extinguishment of debt — — (35 ) 15,722
Other, net 1,265 5 1,600 11
Loss before income taxes (190,968 ) (264,579 ) (72,028 ) (806,664 )
Income tax benefit 71,061 95,898 26,555 290,773
Net loss $ (119,907 ) $ (168,681 ) $ (45,473 ) $ (515,891 )
Basic weighted-average common shares outstanding 111,277 68,102 111,274 68,090
Diluted weighted-average common shares outstanding 111,277 68,102 111,274 68,090
Basic net loss per common share $ (1.08 ) $ (2.48 ) $ (0.41 ) $ (7.58 )
Diluted net loss per common share $ (1.08 ) $ (2.48 ) $ (0.41 ) $ (7.58 )
(1) Non-cash stock-based compensation component included in:
Exploration expense $ 995 $ 1,785 $ 2,403 $ 3,447
G&A expense $ 3,363 $ 5,262 $ 7,410 $ 10,468
(2) The net derivative (gain) loss line item consists of the following:
Settlement gain $ (16,303 ) $ (101,710 ) $ (16,310 ) $ (248,738 )
(Gain) loss on fair value changes $ (38,886 ) $ 265,061 $ (153,653 ) $ 397,861
Total net derivative (gain) loss $ (55,189 ) $ 163,351 $ (169,963 ) $ 149,123

12
SM ENERGY COMPANY
FINANCIAL HIGHLIGHTS (UNAUDITED)
June 30, 2017
Condensed Consolidated Statement of Stockholders' Equity
(in thousands, except share amounts)
Additional
Paid-in Capital
Accumulated Other
Comprehensive Loss
Total
Stockholders’ Equity
Common Stock Retained Earnings
Shares Amount
Balances, December 31, 2016 111,257,500 $ 1,113 $ 1,716,556 $ 794,020 $ (14,556 ) $ 2,497,133
Net loss — — — (45,473 ) — (45,473 )
Other comprehensive loss — — — — (443 ) (443 )
Cash dividends, $ 0.05 per share — — — (5,563 ) — (5,563 )
Issuance of common stock under Employee Stock Purchase Plan
123,678 1
1,737
—
—
1,738
Issuance of common stock upon vesting of restricted stock units, net of shares used for tax withholdings 725
—
(11 ) —
—
(11 )
Stock-based compensation expense 71,573 1 9,812 — — 9,813
Cumulative effect of accounting change — — 1,108 43,624 — 44,732
Other — — (98 ) — — (98 )
Balances, June 30, 2017 111,453,476 $ 1,115 $ 1,729,104 $ 786,608 $ (14,999 ) $ 2,501,828

13
SM ENERGY COMPANY
FINANCIAL HIGHLIGHTS (UNAUDITED)
June 30, 2017
Condensed Consolidated Statements of Cash Flows
(in thousands) For the Three Months Ended June 30,
For the Six Months Ended June 30,
2017 2016 2017 2016
Cash flows from operating activities: Net loss $ (119,907 ) $ (168,681 ) $ (45,473 ) $ (515,891 )
Adjustments to reconcile net loss to net cash provided by operating activities:
Net (gain) loss on divestiture activity 167,133 (50,046 ) 129,670 18,975
Depletion, depreciation, amortization, and asset retirement obligation liability accretion
153,232
211,020
291,044
425,227
Impairment of proved properties 3,806 — 3,806 269,785
Abandonment and impairment of unproved properties 157 38 157 2,349
Stock-based compensation expense 4,358 7,047 9,813 13,915
Net derivative (gain) loss (55,189 ) 163,351 (169,963 ) 149,123
Derivative settlement gain 16,303 101,710 16,310 248,738
Amortization of debt discount and deferred financing costs 3,733 2,850 8,679 1,930
Non-cash (gain) loss on extinguishment of debt, net — — 22 (15,722 )
Deferred income taxes (64,015 ) (95,975 ) (30,790 ) (291,014 )
Plugging and abandonment (418 ) (2,112 ) (1,609 ) (2,716 )
Other, net (2,300 ) 3,668 2,267 2,517
Changes in current assets and liabilities:
Accounts receivable 16,586 (38,142 ) 46,993 (11,220 )
Prepaid expenses and other (9,499 ) 3,503 (9,321 ) 8,487
Accounts payable and accrued expenses (3,476 ) (9,433 ) (8,973 ) (61,727 )
Accrued derivative settlements (3,355 ) 9,799 (517 ) 14,117
Net cash provided by operating activities 107,149 138,597 242,115 256,873
Cash flows from investing activities:
Net proceeds from the sale of oil and gas properties 21,914 11,761 766,247 12,967
Capital expenditures (212,342 ) (169,200 ) (366,743 ) (345,570 )
Acquisition of proved and unproved oil and gas properties (13,035 ) (2,707 ) (88,140 ) (17,751 )
Other, net 514 (1,785 ) 3,000 (900 )
Net cash provided by (used in) investing activities (202,949 ) (161,931 ) 314,364 (351,254 )
Cash flows from financing activities:
Proceeds from credit facility 8,500 268,000 406,000 585,000
Repayment of credit facility (8,500 ) (230,500 ) (406,000 ) (456,500 )
Debt issuance costs related to credit facility — (3,132 ) — (3,132 )
Cash paid to repurchase Senior Notes — (9,987 ) (2,344 ) (29,904 )
Net proceeds from sale of common stock 1,738 2,354 1,738 2,354
Dividends paid (5,563 ) (3,404 ) (5,563 ) (3,404 )
Other, net (1 ) (30 ) (161 ) (33 )
Net cash provided by (used in) financing activities (3,826 ) 23,301 (6,330 ) 94,381
Net change in cash and cash equivalents (99,626 ) (33 ) 550,149 —
Cash and cash equivalents at beginning of period 659,147 51 9,372 18
Cash and cash equivalents at end of period $ 559,521 $ 18 $ 559,521 $ 18

14
SM ENERGY COMPANY
FINANCIAL HIGHLIGHTS (UNAUDITED)
June 30, 2017
Adjusted EBITDAX(1) (in thousands)
Reconciliation of net loss (GAAP) to adjusted EBITDAX (Non-GAAP) to net cash provided by operating activities (GAAP)
For the Three Months Ended June 30,
For the Six Months Ended June 30,
2017 2016 2017 2016
Net loss (GAAP) $ (119,907 ) $ (168,681 ) $ (45,473 ) $ (515,891 )
Interest expense 44,595 34,035 91,548 65,123
Other non-operating income, net (1,265 ) (5 ) (1,600 ) (11 )
Income tax benefit (71,061 ) (95,898 ) (26,555 ) (290,773 )
Depletion, depreciation, amortization, and asset retirement obligation liability accretion
153,232 211,020
291,044
425,227
Exploration(2) 12,077 11,402 22,647 25,013
Impairment of proved properties 3,806 — 3,806 269,785
Abandonment and impairment of unproved properties 157 38 157 2,349
Stock-based compensation expense 4,358 7,047 9,813 13,915
Net derivative (gain) loss (55,189 ) 163,351 (169,963 ) 149,123
Derivative settlement gain 16,303 101,710 16,310 248,738
Net (gain) loss on divestiture activity 167,133 (50,046 ) 129,670 18,975
(Gain) loss on extinguishment of debt — — 35 (15,722 )
Other (151 ) 3,125 4,835 3,557
Adjusted EBITDAX (Non-GAAP) $ 154,088 $ 217,098 $ 326,274 $ 399,408
Interest expense (44,595 ) (34,035 ) (91,548 ) (65,123 )
Other non-operating income, net 1,265 5 1,600 11
Income tax benefit 71,061 95,898 26,555 290,773
Exploration(2) (12,077 ) (11,402 ) (22,647 ) (25,013 )
Amortization of debt discount and deferred financing costs 3,733 2,850 8,679 1,930
Deferred income taxes (64,015 ) (95,975 ) (30,790 ) (291,014 )
Plugging and abandonment (418 ) (2,112 ) (1,609 ) (2,716 )
Other, net (2,149 ) 543 (2,581 ) (1,040 )
Changes in current assets and liabilities 256 (34,273 ) 28,182 (50,343 )
Net cash provided by operating activities (GAAP) $ 107,149 $ 138,597 $ 242,115 $ 256,873
(1) Adjusted EBITDAX represents net income (loss) before interest expense, other non-operating income and expense, income taxes, depletion, depreciation, amortization and asset retirement obligation liability accretion expense, exploration expense, property impairments, non-cash stock-based compensation expense, derivative gains and losses net of settlements, change in the Net Profits Plan liability, gains and losses on divestitures, gains and losses on extinguishment of debt, and materials inventory impairments and losses on sale. Adjusted EBITDAX excludes certain items that we believe affect the comparability of operating results and can exclude items that are generally one-time in nature or whose timing and/or amount cannot be reasonably estimated. Adjusted EBITDAX is a non-GAAP measure that we present because we believe it provides useful additional information to investors and analysts, as a performance measure, for analysis of our ability to internally generate funds for exploration, development, acquisitions, and to service debt. We are also subject to financial covenants under our Credit Agreement based on adjusted EBITDAX ratios. In addition, adjusted EBITDAX is widely used by professional research analysts and others in the valuation, comparison, and investment recommendations of companies in the oil and gas exploration and production industry, and many investors use the published research of industry research analysts in making investment decisions. Adjusted EBITDAX should not be considered in isolation or as a substitute for net income (loss), income (loss) from operations, net cash provided by operating activities, or profitability or liquidity measures prepared under GAAP. Because adjusted EBITDAX excludes some, but not all items that affect net income (loss) and may vary among companies, the adjusted EBITDAX amounts presented may not be comparable to similar metrics of other companies. Our credit facility provides a material source of liquidity for us. Under the terms of our Credit Agreement, if we failed to comply with the covenants that establish a maximum permitted ratio of senior secured debt to adjusted EBITDAX and a minimum permitted ratio of adjusted EBITDAX to interest, we would be in default, an event that would prevent us from borrowing under our credit facility and would therefore materially limit our sources of liquidity. In addition, if we are in default under our credit facility and are unable to obtain a waiver of that default from our lenders, lenders under that facility and under the indentures governing our outstanding Senior Notes and Senior Convertible Notes would be entitled to exercise all of their remedies for default.
(2) Stock-based compensation expense is a component of exploration expense and general and administrative expense on the accompanying statements of operations. Therefore, the exploration line items shown in the reconciliation above will vary from the amount shown on the Company's condensed consolidated statements of operations for the component of stock-based compensation expense recorded to exploration expense.

15
SM ENERGY COMPANY
FINANCIAL HIGHLIGHTS (UNAUDITED)
June 30, 2017
Adjusted Net Loss (Non-GAAP)
(in thousands, except per share data)
For the Three Months Ended
June 30,
For the Six Months Ended
June 30,
2017 2016 2017 2016
Net loss (GAAP) $ (119,907 ) $ (168,681 ) $ (45,473 ) $ (515,891 )
Net derivative (gain) loss (55,189 ) 163,351 (169,963 ) 149,123
Derivative settlement gain 16,303 101,710 16,310 248,738
Net (gain) loss on divestiture activity 167,133 (50,046 ) 129,670 18,975
Impairment of proved properties 3,806 — 3,806 269,785
Abandonment and impairment of unproved properties 157
38
157
2,349
(Gain) loss on extinguishment of debt — — 35 (15,722 )
Other, net(2) (151 ) 3,091 4,835 2,583
Tax effect of adjustments(1) (47,673 ) (79,622 ) 5,469 (246,678 )
Adjusted net loss (Non-GAAP)(3) $ (35,521 ) $ (30,159 ) $ (55,154 ) $ (86,738 )
Diluted net loss per common share (GAAP) $ (1.08 ) $ (2.48 ) $ (0.41 ) $ (7.58 )
Net derivative gain (0.50 ) 2.40 (1.53 ) 2.19
Derivative settlement gain 0.15 1.49 0.15 3.65
Net (gain) loss on divestiture activity 1.50 (0.73 ) 1.17 0.28
Impairment of proved properties 0.03 — 0.03 3.96
Abandonment and impairment of unproved properties —
—
—
0.03
(Gain) loss on extinguishment of debt — — — (0.23 )
Other, net(2) — 0.05 0.04 0.04
Tax effect of adjustments(1) (0.42 ) (1.17 ) 0.05 (3.61 )
Adjusted net loss per diluted common share (Non-GAAP)(4) $ (0.32 ) $ (0.44 ) $ (0.50 ) $ (1.27 )
Basic weighted-average common shares outstanding (GAAP) 111,277
68,102
111,274
68,090
(1) The tax effect of adjustments is calculated using a tax rate of 36.1% for the three-month and six-month periods ended June 30, 2017, and a tax rate of 36.5% for the three-month and six-month periods ended June 30, 2016. These rates approximate the Company's statutory tax rate for the respective periods, as adjusted for ordinary permanent differences.
(2) For the three-month and six-month periods ended June 30, 2017, the adjustment is related to the change in Net Profits Plan liability. Additionally, for the six-month period ended June 30, 2017, an adjustment related to materials inventory loss is included. For the three-month and six-month periods ended June 30, 2016, the adjustment relates to the change in Net Profits Plan liability, impairment of materials inventory, and an adjustment relating to claims on royalties on certain Federal and Indian leases. These items are included in other operating expenses on the Company's condensed consolidated statements of operations.
(3) Adjusted net loss excludes certain items that the Company believes affect the comparability of operating results. Items excluded generally are non-recurring items or are items whose timing and/or amount cannot be reasonably estimated. These items include non-cash and other adjustments, such as derivative gains and losses net of settlements, impairments, net (gain) loss on divestiture activity, materials inventory loss, and gains or losses on extinguishment of debt. The non-GAAP measure of adjusted net income (loss) is presented because management believes it provides useful additional information to investors for analysis of SM Energy's fundamental business on a recurring basis. In addition, management believes that adjusted net income (loss) is widely used by professional research analysts and others in the valuation, comparison, and investment recommendations of companies in the oil and gas exploration and production industry, and many investors use the published research of industry research analysts in making investment decisions. Adjusted net income (loss) should not be considered in isolation or as a substitute for net income (loss), income (loss) from operations, cash provided by operating activities, or other income, profitability, cash flow, or liquidity measures prepared under GAAP. Since adjusted net income (loss) excludes some, but not all, items that affect net income (loss) and may vary among companies, the adjusted net income (loss) amounts presented may not be comparable to similarly titled measures of other companies. (4) For periods where the Company reports adjusted net loss, basic weighted-average common shares outstanding are used in the calculation of adjusted net loss per diluted common share.

16
SM ENERGY COMPANY
FINANCIAL HIGHLIGHTS (UNAUDITED)
June 30, 2017
Total Capital Spend Reconciliation
(in millions)
Reconciliation of costs incurred in oil & gas activities (GAAP) to total capital spend (Non-GAAP)(1)(3)
For the Three Months Ended June 30,
For the Six Months Ended June 30,
2017 2017
Costs incurred in oil and gas activities (GAAP): $ 258.0 $ 515.0
Less:
Asset retirement obligation (0.5 ) (1.4 )
Capitalized interest (2.9 ) (5.1 )
Proved property acquisitions(2) 0.8 (1.4 )
Unproved property acquisitions (16.5 ) (75.6 )
Other (1.6 ) (1.3 )
Total capital spend (Non-GAAP): $ 237.3 $ 430.2
(1) The non-GAAP measure of total capital spend is presented because management believes it provides useful information to investors for analysis of SM Energy's fundamental business on a recurring basis. In addition, management believes that total capital spend is widely used by professional research analysts and others in the valuation, comparison, and investment recommendations of companies in the oil and gas exploration and production industry, and many investors use the published research of industry research analysts in making investment decisions. Total capital spend should not be considered in isolation or as a substitute for Costs Incurred or other capital spending measures prepared under GAAP. The total capital spend amounts presented may not be comparable to similarly titled measures of other companies.
(2) Includes approximately $76,000 and $887,000 of ARO associated with proved property acquisitions for the three and six months ended June 30, 2017, respectively.
(3) The Company completed several primarily non-monetary acreage trades in the Midland Basin during the first half of 2017 totaling $279.8 million of value attributed to the properties surrendered. This non-monetary consideration is not reflected in the costs incurred or capital spend amounts presented above.


![Untitled-2 [perforatordirectory.api.org]perforatordirectory.api.org/links/5928_1.pdf · 0.41 0.41 0.02 No 21 Truda Stevens - QSD Third Party Self ... Untitled-2 Author: chris.pool](https://img.pdfslide.net/doc/110x75/5ac5a9f27f8b9a2b5c8dbfe5/untitled-2-041-002-no-21-truda-stevens-qsd-third-party-self-untitled-2.jpg)


![Cyclosporine oral solution [MODIFIED] diluted with orange](https://img.pdfslide.net/doc/110x75/61c6faa1af22391b7f5175cd/cyclosporine-oral-solution-modified-diluted-with-orange-.jpg)