Embed Size (px)
Citation preview

news release
-More-
TENNECO REPORTS FOURTH QUARTER AND FULL-YEAR 2019 RESULTS
Full-year revenue performance continues to outpace light vehicle industry production
Reviewing and considering strategic alternatives to maximize shareholder value while pursuing separation plan
Executing 2-year cost reduction program expected to deliver $200 million in annual run rate savings
On February 18, the company announced it amended the terms of its debt covenant to provide increased
flexibility
Lake Forest, Illinois, Feb. 20, 2020 – Tenneco Inc. (NYSE: TEN) reported fourth quarter 2019 revenue of $4.1 billion,
versus $4.3 billion a year ago. On a constant currency pro forma basis, total revenue decreased 2% versus last year,
while light vehicle industry production* declined 5% in the quarter. Value-add revenue for the fourth quarter was $3.4
billion. Value-add revenue comparisons include a negative $88 million impact due to a work stoppage at the
company’s largest customer.
Including non-cash, non-recurring items of approximately $230 million, the company reported a net loss for fourth
quarter 2019 of $293 million, or $(3.62) per diluted share, compared with a fourth quarter net loss of $109 million, or
$(1.35) per diluted share in 2018. Fourth quarter 2019 adjusted net income was $23 million, or $0.28 per diluted share,
compared with $105 million, or $1.30 per diluted share last year.
Fourth quarter EBIT (earnings before interest, taxes and noncontrolling interests) was a loss of $117 million, versus a
loss of $23 million last year. EBIT as a percent of revenue was -2.8% versus -0.5% last year. Earnings comparisons
include a negative $27 million impact due to a work stoppage at the company’s largest customer. Fourth quarter
adjusted EBITDA was $314 million versus $407 million last year. Adjusted EBITDA as a percent of value-add
revenue was 9.3% versus 11.2% last year. Cash generated from operations was $380 million.
“Continued execution on cost reduction initiatives and operating improvements enabled us to deliver on our fourth
quarter guidance, despite challenging economic and business conditions,” said Brian Kesseler, Tenneco CEO. “We
are executing our Accelerate program to drive additional cost savings, strengthen cash flow performance, and reduce
leverage to drive value and better position both the DRiV and New Tenneco divisions for the planned separation.”
The Accelerate program is modeled after the company’s successful approach to capturing acquisition synergies.
Compared to year-end 2019, this 2-year program includes opportunities expected to deliver the following:
Annual run rate cost savings of $200 million
Working capital improvement of $250 million
Capital expenditure improvements of $100 million
The company expects to incur approximately $250 million in one-time costs over the 2-year program.
“The Accelerate program is at the core of our operating plans for 2020 and 2021 as we work to improve capital
efficiency and reduce leverage to better position both divisions for the planned separation,” Kesseler added. “In
addition to streamlining our leadership structure, we are working to lower SG&A costs and evaluating multiple
strategic options, ranging from the sale of individual product lines to complete divisions. The Board and management
team are committed to taking purposeful and proactive action to better position Tenneco to succeed in today’s
operating environment and enhance value for all shareholders.”

-2- Full-Year Results
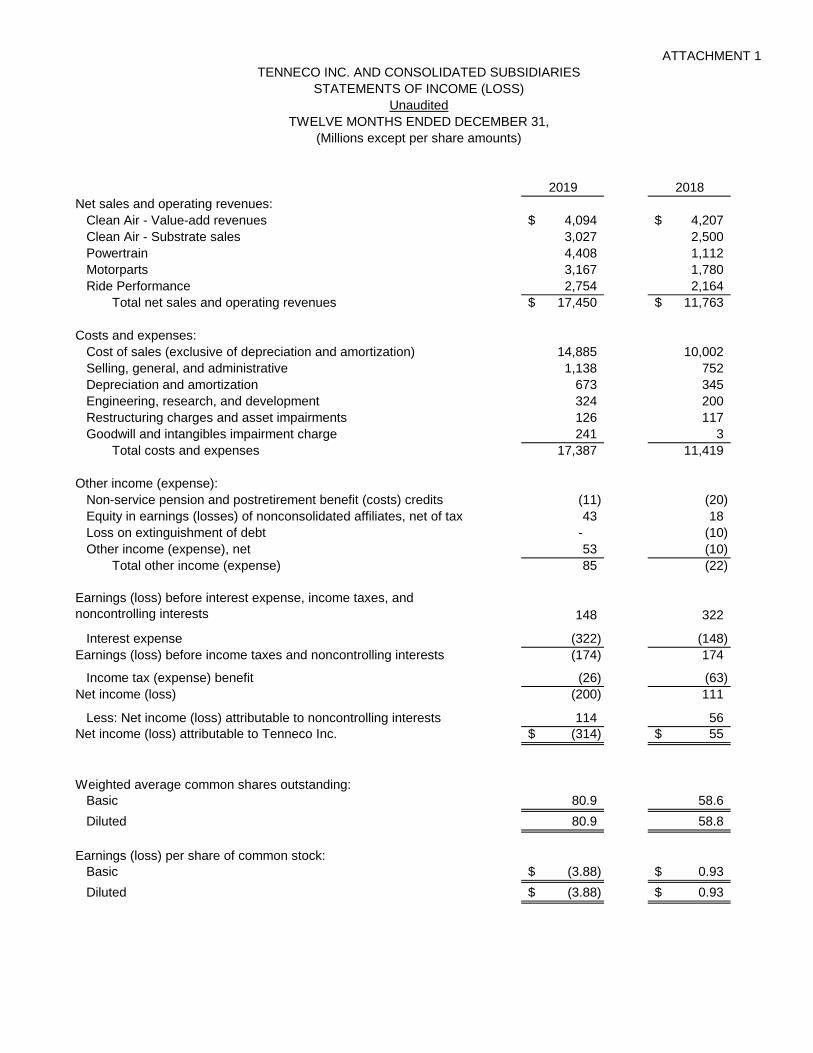
For the full year, total revenue was a record high $17.45 billion, up 48%, which includes the first full year of Federal-
Mogul revenues. Full-year EBIT was $148 million, versus EBIT of $322 million a year ago. Adjusted EBITDA was
$1,442 million, versus $1,062 million a year ago. Cash generated by operations for the full year was $444 million,
compared with $439 million last year.
OUTLOOK
Full year 2020
We are continuing to monitor the effects of the COVID-19 virus, which is impacting the China automotive industry.
The uncertainty of the full impact of the COVID-19 virus results in a wider full year outlook range for revenue and
EBITDA than customary. This outlook assumes that the equivalent of four full weeks of production would be lost in
China in the first quarter, which would represent a negative impact of approximately $150 million on value-add
revenue, and $50 million on EBITDA.
2020 revenue is expected in the range of $16.7 billion to $17.1 billion. Global light vehicle production* is forecast to
be down 4% in 2020. We anticipate currency to have a 1% unfavorable year-over-year impact on 2020 revenue.
2020 Financial Outlook Summary
Revenue $16.7 - 17.1B
Value-add revenue $13.7 - 14.1B
Adjusted EBITDA $1,300 - 1,450M
Capital expenditures(1) $610 - 650M
Adjusted depreciation and amortization ~$660M
Adjusted interest expense(2) $310 - 330M
Adjusted effective tax rate 29 - 31%
Cash taxes $160 - 180M
Adjusted noncontrolling interest expense $60 - 70M
Adjusted free cash flow(3) $100 - 200M
(1) Includes expenditures for software, consistent with cash payments for property, plant and equipment on cash flow statement.
(2) Before one-time fees related to the February 2020 covenant amendment.
(3) Adjusted free cash flow is cash from operations plus reclassified factoring proceeds less capital expenditures.
First Quarter 2020
As referenced in the full year outlook, we expect the COVID-19 virus to negatively impact value-add revenue, and
EBITDA in the first quarter. The company expects total revenue in the range of $3.95 billion to $4.15 billion, value-
add revenue in the range of $3.2 billion to $3.4 billion, and adjusted EBITDA in the range of $240 million to $280
million in the first quarter 2020.
*Source: IHS Markit January 2020 global light vehicle production forecast and Tenneco estimates.
See “About Revenue and Other Guidance” below for further information about revenue guidance and forecasted
performance measures.
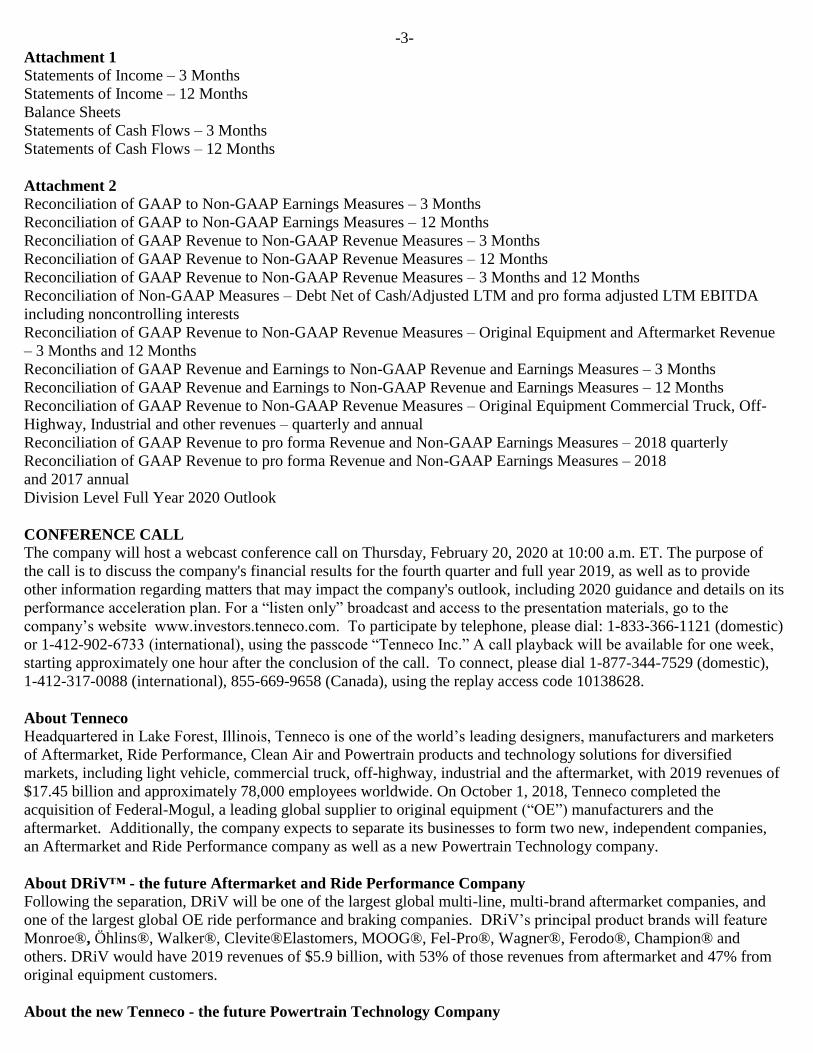
-3- Attachment 1
Statements of Income – 3 Months
Statements of Income – 12 Months
Balance Sheets
Statements of Cash Flows – 3 Months
Statements of Cash Flows – 12 Months
Attachment 2
Reconciliation of GAAP to Non-GAAP Earnings Measures – 3 Months
Reconciliation of GAAP to Non-GAAP Earnings Measures – 12 Months
Reconciliation of GAAP Revenue to Non-GAAP Revenue Measures – 3 Months
Reconciliation of GAAP Revenue to Non-GAAP Revenue Measures – 12 Months
Reconciliation of GAAP Revenue to Non-GAAP Revenue Measures – 3 Months and 12 Months
Reconciliation of Non-GAAP Measures – Debt Net of Cash/Adjusted LTM and pro forma adjusted LTM EBITDA
including noncontrolling interests
Reconciliation of GAAP Revenue to Non-GAAP Revenue Measures – Original Equipment and Aftermarket Revenue
– 3 Months and 12 Months
Reconciliation of GAAP Revenue and Earnings to Non-GAAP Revenue and Earnings Measures – 3 Months
Reconciliation of GAAP Revenue and Earnings to Non-GAAP Revenue and Earnings Measures – 12 Months
Reconciliation of GAAP Revenue to Non-GAAP Revenue Measures – Original Equipment Commercial Truck, Off-
Highway, Industrial and other revenues – quarterly and annual
Reconciliation of GAAP Revenue to pro forma Revenue and Non-GAAP Earnings Measures – 2018 quarterly
Reconciliation of GAAP Revenue to pro forma Revenue and Non-GAAP Earnings Measures – 2018
and 2017 annual
Division Level Full Year 2020 Outlook
CONFERENCE CALL
The company will host a webcast conference call on Thursday, February 20, 2020 at 10:00 a.m. ET. The purpose of
the call is to discuss the company's financial results for the fourth quarter and full year 2019, as well as to provide
other information regarding matters that may impact the company's outlook, including 2020 guidance and details on its
performance acceleration plan. For a “listen only” broadcast and access to the presentation materials, go to the
company’s website www.investors.tenneco.com. To participate by telephone, please dial: 1-833-366-1121 (domestic)
or 1-412-902-6733 (international), using the passcode “Tenneco Inc.” A call playback will be available for one week,
starting approximately one hour after the conclusion of the call. To connect, please dial 1-877-344-7529 (domestic),
1-412-317-0088 (international), 855-669-9658 (Canada), using the replay access code 10138628.
About Tenneco
Headquartered in Lake Forest, Illinois, Tenneco is one of the world’s leading designers, manufacturers and marketers
of Aftermarket, Ride Performance, Clean Air and Powertrain products and technology solutions for diversified
markets, including light vehicle, commercial truck, off-highway, industrial and the aftermarket, with 2019 revenues of
$17.45 billion and approximately 78,000 employees worldwide. On October 1, 2018, Tenneco completed the
acquisition of Federal-Mogul, a leading global supplier to original equipment (“OE”) manufacturers and the
aftermarket. Additionally, the company expects to separate its businesses to form two new, independent companies,
an Aftermarket and Ride Performance company as well as a new Powertrain Technology company.
About DRiV™ - the future Aftermarket and Ride Performance Company
Following the separation, DRiV will be one of the largest global multi-line, multi-brand aftermarket companies, and
one of the largest global OE ride performance and braking companies. DRiV’s principal product brands will feature
Monroe®, Öhlins®, Walker®, Clevite®Elastomers, MOOG®, Fel-Pro®, Wagner®, Ferodo®, Champion® and
others. DRiV would have 2019 revenues of $5.9 billion, with 53% of those revenues from aftermarket and 47% from
original equipment customers.
About the new Tenneco - the future Powertrain Technology Company

-4- Following the separation, the new Tenneco will be one of the world’s largest pure-play powertrain companies serving
OE markets worldwide with engineered solutions addressing fuel economy, power output, and criteria pollution
requirements for gasoline, diesel and electrified powertrains. The new Tenneco would have 2019 revenues of $11.5
billion, serving light vehicle, commercial truck, off-highway and industrial markets.
About Revenue and Other Guidance Revenue estimates and other forecasted information in this release are based on OE manufacturers’
programs that have been formally awarded to the company; programs where Tenneco is highly confident
that it will be awarded business based on informal customer indications consistent with past practices; and
Tenneco’s status as supplier for the existing program and its relationship with the customer. This
information is also based on anticipated vehicle production levels and pricing, including precious metals
pricing and the impact of material cost changes. Unless otherwise indicated, our methodology does not
attempt to forecast currency fluctuations, and accordingly, reflects constant currency. Certain elements of
the restructuring and related expenses, legal settlements and other unusual charges we incur from time to
time cannot be forecasted accurately. In this respect, we are not able to reconcile forecasted EBITDA (and
the related margins), effective tax rate, depreciation and amortization, interest expense, noncontrolling
interest expense and adjusted free cash flow on a forward-looking basis without unreasonable efforts on
account of these factors and other factors not in our control. For certain additional assumptions upon
which these estimates are based, see the slides accompanying the February 20, 2020 webcast, which will be
available on the financial section of the Tenneco website at www.investors.tenneco.com.
This press release contains forward-looking statements. The words “will,” “would,” “could,” “plan,” “expect,”
“anticipate,” “estimate,” “opportunities,” and similar expressions (and variations thereof), identify these forward-
looking statements. These forward-looking statements are based on the current expectations of the company (including
its subsidiaries). Because these statements involve risks and uncertainties, actual results may differ materially from
the expectations expressed in the forward-looking statements. Important factors that could cause actual results to
differ materially from the expectations reflected in the forward-looking statements include:
• general economic, business and market conditions;
• our ability to successfully execute cost reduction and other performance improvement plans, including the
Accelerate program, and to realize the anticipated benefits from these plans;
• our ability to source and procure needed materials, components and other products and services in
accordance with customer demand and at competitive prices;
• the cost and outcome of existing and any future claims, legal proceedings or investigations, including, but not
limited to, any of the foregoing arising in connection with the ongoing global antitrust investigation, product
performance, product safety or intellectual property rights;
• changes in consumer demand for our OE or aftermarket products or aftermarket products, prices and our
ability to have our products included on top selling vehicles, including any shifts in consumer preferences
away from historically higher margin products for our customers and us, to other lower margin vehicles, for
which we may or may not have supply arrangements;
• the cyclical nature of the global vehicle industry, including the performance of the global aftermarket sector
and the impact of vehicle parts' longer product lives;
• changes in automotive and commercial vehicle manufacturers’ production rates and their actual and
forecasted requirements for our products, due to difficult economic conditions and/or regulatory or legal
changes affecting internal combustion engines and/or aftermarket products;
• our dependence on certain large customers, including the loss of any of our large OE manufacturer customers
(on whom we depend for a significant portion of our revenues), or the loss of market shares by these customers
if we are unable to achieve increased sales to other OE customers or any change in customer demand due to
delays in the adoption or enforcement of worldwide emissions regulations;
• new technologies that reduce the demand for certain of our products or otherwise render them obsolete;
• our ability to introduce new products and technologies that satisfy customers' needs in a timely fashion;

-5- • the overall highly competitive nature of the automotive and commercial vehicle parts industries, and any
resultant inability to realize the sales represented by our awarded book of business (which is based on
anticipated pricing and volumes over the life of the applicable program);
• changes in capital availability or costs, including increases in our cost of borrowing (i.e., interest rate
increases), the amount of our debt, our ability to access capital markets at favorable rates, and the credit
ratings of our debt;
• our ability to comply with the covenants contained in our debt instruments;
• our working capital requirements;
• risks inherent in operating a multi-national company, including economic conditions, such as currency
exchange and inflation rates, political conditions in the countries where we operate or sell our products,
adverse changes in trade agreements, tariffs, immigration policies, political instability, and tax and other laws,
and potential disruptions of production and supply;
• increasing competition from lower cost, private-label products;
• damage to the reputation of one or more of our leading brands;
• the impact of improvements in automotive parts on aftermarket demand for some of our products;
• industry-wide strikes, labor disruptions at our facilities or any labor or other economic disruptions at any of
our significant customers or suppliers or any of our customers’ other suppliers;
• developments relating to our intellectual property, including our ability to changes in technology;
• costs related to product warranties and other customer satisfaction actions;
• the failure or breach of our information technology systems, including the consequences of any
misappropriation, exposure or corruption of sensitive information stored on such systems and the interruption
to our business that such failure or breach may cause;
• the impact of consolidation among vehicle parts suppliers and customers on our ability to compete in the
highly competitive automotive and commercial vehicle supplier industry;
• changes in distribution channels or competitive conditions in the markets and countries where we operate;
• the evolution towards autonomous vehicles and car and ride sharing;
• customer acceptance of new products;
• our ability to successfully integrate, and benefit from, any acquisitions that we complete;
• our ability to effectively manage our joint ventures and other third-party relationships;
• the potential impairment in the carrying value of our long-lived assets and goodwill or our deferred tax assets;
• the negative impact of fuel price volatility on transportation and logistics costs, raw material costs,
discretionary purchases of vehicles or aftermarket products and demand for off-highway equipment;
• increases in the costs of raw materials or components, including our ability to successfully reduce the impact
of any such cost increases through materials substitutions, cost reduction initiatives, customer recovery and
other methods;
• changes by the Financial Accounting Standards Board (“FASB”) or the Securities and Exchange Commission
(“SEC”) of generally accepted accounting principles or other authoritative guidance;
• changes in accounting estimates and assumptions, including changes based on additional information;
• any changes by the International Organization for Standardization (“ISO”) or other such committees in their
certification protocols for processes and products, which may have the effect of delaying or hindering our
ability to bring new products to market;
• the impact of the extensive, increasing and changing laws and regulations to which we are subject, including
environmental laws and regulations, which may result in our incurrence of environmental liabilities in excess
of the amount reserved or increased costs or loss of revenues relating to products subject to changing
regulation;
• potential volatility in our effective tax rate;

-6- • disasters, local and global public health emergencies or other catastrophic events, such as fires, earthquakes,
and flooding, pandemics or epidemics, where we or other customers do business, and any resultant disruptions
in the supply or production of goods or services to us or by us, in demand by our customers or in the operation
of our system, disaster recovery capabilities or business continuity capabilities;
• acts of war and/or terrorism, as well as actions taken or to be taken by the United States and other
governments as a result of further acts or threats of terrorism, and the impact of these acts on economic,
financial and social conditions in the countries where we operate;
• pension obligations and other postretirement benefits;
• our hedging activities to address commodity price fluctuations; and
• the timing and occurrence (or non-occurrence) of other transactions, events and circumstances which may be
beyond our control.
In addition, this release includes forward-looking statements regarding the Company’s ongoing review of strategic
alternatives and the planned separation of the Company into a powertrain technology company and an aftermarket
and ride performance company. Important factors that could cause actual results to differ materially from the
expectations reflected in the forward-looking statements, include:
• the ability to identify and consummate strategic alternatives that yield additional value for shareholders;
• the timing, benefits and outcome of the Company’s strategic review process;
• the structure, terms and specific risk and uncertainties associated with any potential strategic alternative;
• potential disruptions in our business and stock price as a result of our exploration, review and pursuit of any
strategic alternatives;
• the risk that the company may not complete a separation of its powertrain technology business and its
aftermarket and ride performance business;
• the risk that the combined company and each separate company following the separation will underperform
relative to our expectations;
• the ongoing transaction costs and risk that we may incur greater costs following the separation of the
businesses;
• the risk the spin-off is determined to be a taxable transaction;
• the risk the benefits of the separation may not be fully realized or may take longer to realize than expected;
• the risk the separation may not advance our business strategy; and
• the risk the transaction may have an adverse effect on existing arrangements with us, including those related to
transition, manufacturing and supply services and tax matters; our ability to retain and hire key personnel; or
our ability to maintain relationships with customers, suppliers or other business partners.
The risks included here are not exhaustive. The Company undertakes no obligation to update any forward-looking
statement to reflect events or circumstances after the date of this press release. Additional information regarding these
risk factors and uncertainties is, and will be, detailed from time to time in the company's SEC filings, including but not
limited to its annual report on Form 10-K for the year ended December 31, 2018 and the Form 10-Q for the quarter
ended September 30, 2019.
###
Investor inquiries:
Linae Golla
847-482-5162
Rich Kwas
248-849-1340

ATTACHMENT 1
2019 2018
Net sales and operating revenues:
Clean Air - Value-add revenues 974$ 1,024$
Clean Air - Substrate sales 769 631
Powertrain 1,018 1,112
Motorparts 741 827
Ride Performance 641 684
Total net sales and operating revenues 4,143$ 4,278$
Costs and expenses:
Cost of sales (exclusive of depreciation and amortization) 3,554 3,673
Selling, general, and administrative 276 309
Depreciation and amortization 170 165
Engineering, research, and development 76 82
Restructuring charges and asset impairments 28 60
Goodwill and intangibles impairment charge 172 3
Total costs and expenses 4,276 4,292
Other income (expense):
Non-service pension and other postretirement benefit (costs) credits (3) (10)
Equity in earnings (losses) of nonconsolidated affiliates, net of tax 9 18
Loss on extinguishment of debt - (10)
Other income (expense), net 10 (7)
Total other income (expense) 16 (9)
Earnings (loss) before interest expense, income taxes, and
noncontrolling interests (117) (23)
Interest expense (80) (79)
Earnings (loss) before income taxes and noncontrolling interests (197) (102)
Income tax (expense) benefit (21) 10
Net income (loss) (218) (92)
Less: Net income (loss) attributable to noncontrolling interests 75 17
Net income (loss) attributable to Tenneco Inc. (293)$ (109)$
Weighted average common shares outstanding:
Basic 80.9 80.7
Diluted 80.9 80.7
Earnings (loss) per share of common stock:
Basic (3.62)$ (1.35)$
Diluted (3.62)$ (1.35)$
TENNECO INC. AND CONSOLIDATED SUBSIDIARIES
STATEMENTS OF INCOME (LOSS)
(Millions except per share amounts)
Unaudited
THREE MONTHS ENDED DECEMBER 31,
ATTACHMENT 1
2019 2018
Net sales and operating revenues:
Clean Air - Value-add revenues 4,094$ 4,207$
Clean Air - Substrate sales 3,027 2,500
Powertrain 4,408 1,112
Motorparts 3,167 1,780
Ride Performance 2,754 2,164
Total net sales and operating revenues 17,450$ 11,763$
Costs and expenses:
Cost of sales (exclusive of depreciation and amortization) 14,885 10,002
Selling, general, and administrative 1,138 752
Depreciation and amortization 673 345
Engineering, research, and development 324 200
Restructuring charges and asset impairments 126 117
Goodwill and intangibles impairment charge 241 3
Total costs and expenses 17,387 11,419
Other income (expense):
Non-service pension and postretirement benefit (costs) credits (11) (20)
Equity in earnings (losses) of nonconsolidated affiliates, net of tax 43 18
Loss on extinguishment of debt - (10)
Other income (expense), net 53 (10)
Total other income (expense) 85 (22)
Earnings (loss) before interest expense, income taxes, and
noncontrolling interests 148 322
Interest expense (322) (148)
Earnings (loss) before income taxes and noncontrolling interests (174) 174
Income tax (expense) benefit (26) (63)
Net income (loss) (200) 111
Less: Net income (loss) attributable to noncontrolling interests 114 56
Net income (loss) attributable to Tenneco Inc. (314)$ 55$
Weighted average common shares outstanding:
Basic 80.9 58.6
Diluted 80.9 58.8
Earnings (loss) per share of common stock:
Basic (3.88)$ 0.93$
Diluted (3.88)$ 0.93$
TENNECO INC. AND CONSOLIDATED SUBSIDIARIES
STATEMENTS OF INCOME (LOSS)
Unaudited
TWELVE MONTHS ENDED DECEMBER 31,
(Millions except per share amounts)

ATTACHMENT 1
December 31, 2019 December 31, 2018
Assets
Cash and cash equivalents 564$ 697$
Restricted cash 2 5
Receivables, net 2,538 (a) 2,572 (a)
Inventories 2,026 2,245
Prepayments and other current assets 632 590
Other noncurrent assets 3,857 3,622
Property, plant and equipment, net 3,627 3,501
Total assets 13,246$ 13,232$
Liabilities and Shareholders' Equity
Short-term debt, including current maturities of long-term debt 185$ 153$
Accounts payable 2,647 2,759
Accrued compensation and employee benefits 325 343
Accrued income taxes 72 64
Accrued expenses and other current liabilities 1,070 1,001
Long-term debt 5,371 (b) 5,340 (b)
Deferred income taxes 106 88
Pension and postretirement benefits 1,145 1,167
Deferred credits and other liabilities 490 263
Redeemable noncontrolling interests 196 138
Tenneco Inc. shareholders' equity 1,445 1,726
Noncontrolling interests 194 190
Total liabilities, redeemable
noncontrolling interests, and equity 13,246$ 13,232$
December 31, 2019 December 31, 2018
(a) Accounts receivable net of:
Accounts receivable outstanding and derecognized 1,037$ 1,011$
December 31, 2019 December 31, 2018
(b) Long-term debt composed of:
Revolver Borrowings 183$ -$
LIBOR plus 1.75% Term Loan A due 2019 through 2023 1,608 1,691
LIBOR plus 3.00% Term Loan B due 2019 through 2025 1,623 1,629
$225 million of 5.375% Senior Notes due 2024 222 222
$500 million of 5.000% Senior Notes due 2026 494 493
€415 million 4.875% Euro Fixed Rate Notes due 2022 479 496
€300 million of Euribor plus 4.875% Euro Floating Rate Notes due 2024 340 349
€350 million of 5.000% Euro Fixed Rate Notes due 2024 413 427
Other Debt, primarily foreign instruments 13 44
5,375 5,351
Less: maturities classified as current 4 11
Total long-term debt 5,371$ 5,340$
TENNECO INC. AND CONSOLIDATED SUBSIDIARIES
BALANCE SHEETS
Unaudited
(Millions)

ATTACHMENT 1
Three Months Ended December 31,
2019 2018
Operating Activities
Net income (loss) (218)$ (92)$
Adjustments to reconcile net income (loss) to cash provided (used) by operating activities:
Goodwill and intangible impairment charge 172 3
Depreciation and amortization 170 165
Deferred income taxes (29) (44)
Stock-based compensation 5 2
Restructuring charges and asset impairments, net of cash paid (1) 41
Change in pension and other postretirement benefit plans (8) (11)
Equity in earnings of nonconsolidated affiliates (9) (18)
Cash dividends received from nonconsolidated affiliates 8 2
Changes in operating assets and liabilities:
Receivables 232 86
Inventories 145 142
Payables and accrued expenses (165) 137
Accrued interest and income taxes 15 (14)
Other assets and liabilities 63 3
Net cash provided (used) by operating activities 380 402
Investing Activities
Acquisitions, net of cash acquired - (2,194)
Proceeds from sale of assets 12 3
Proceeds from sale of investment in nonconsolidated affiliates 2 -
Cash payments for property, plant and equipment (203) (252)
Proceeds from deferred purchase price of factored receivables 47 72
Other 2 6
Net cash provided (used) by investing activities (140) (2,365)
Financing Activities
Proceeds from term loans and notes 29 3,414
Repayments of term loans and notes (63) (418)
Borrowings on revolving lines of credit 2,316 1,098
Payments on revolving lines of credit (2,336) (1,331)
Issuance of common shares - 1
Cash dividends - (20)
Debt issuance cost of long-term debt - (95)
Net decrease in bank overdrafts (1) -
Acquisition of additional ownership interest in consolidated affiliates (10) -
Distributions to noncontrolling interest partners (23) (7)
Other (2) (178)
Net cash provided (used) by financing activities (90) 2,464
Effect of foreign exchange rate changes on cash, cash equivalents and restricted cash 21 (2)
Increase (decrease) in cash, cash equivalents and restricted cash 171 499
Cash, cash equivalents and restricted cash, beginning of period 395 203
Cash, cash equivalents and restricted cash, end of period 566$ 702$
Supplemental Cash Flow Information
Cash paid during the period for interest 54$ 78$
Cash paid during the period for income taxes, net of refunds 38 34
Non-cash Investing and Financing Activities
Period end balance of trade payables for property, plant and equipment 134$ 135$
Deferred purchase price of receivables factored in the period 28 49
Stock issued for acquisition of Federal-Mogul - (1,236)
Stock transferred for acquisition of Federal-Mogul - 1,236
Redeemable noncontrolling interest transaction with owner 53 -
TENNECO INC. AND CONSOLIDATED SUBSIDIARIES
STATEMENTS OF CASH FLOWS
Unaudited
(Millions)

ATTACHMENT 1
Twelve Months Ended December 31,
2019 2018
Operating Activities
Net income (loss) (200)$ 111$
Adjustments to reconcile net income (loss) to cash provided (used) by operating activities:
Goodwill and intangible impairment charge 241 3
Depreciation and amortization 673 345
Deferred income taxes (144) (65)
Stock-based compensation 25 14
Restructuring charges and asset impairments, net of cash paid 11 49
Change in pension and other postretirement benefit plans (57) (8)
Equity in earnings of nonconsolidated affiliates (43) (18)
Cash dividends received from nonconsolidated affiliates 53 2
Changes in operating assets and liabilities:
Receivables (225) (174)
Inventories 257 27
Payables and accrued expenses (66) 291
Accrued interest and income taxes 3 (19)
Other assets and liabilities (84) (119)
Net cash provided (used) by operating activities 444 439
Investing Activities
Acquisitions, net of cash acquired (158) (2,194)
Proceeds from sale of assets 20 9
Net proceeds from sale of business 22 -
Proceeds from sale of investment in nonconsolidated affiliates 2 -
Cash payments for property, plant and equipment (744) (507)
Proceeds from deferred purchase price of factored receivables 250 174
Other 2 4
Net cash provided (used) by investing activities (606) (2,514)
Financing Activities
Proceeds from term loans and notes 200 3,426
Repayments of term loans and notes (341) (453)
Borrowings on revolving lines of credit 9,120 5,149
Payments on revolving lines of credit (8,884) (5,405)
Repurchase of common shares (2) (1)
Cash dividends (20) (59)
Debt issuance cost of long-term debt - (95)
Net decrease in bank overdrafts (13) (5)
Acquisition of additional ownership interest in consolidated affiliates (10) -
Distributions to noncontrolling interest partners (43) (51)
Other (4) (30)
Net cash provided (used) by financing activities 3 2,476
Effect of foreign exchange rate changes on cash, cash equivalents and restricted cash 23 (17)
Increase (decrease) in cash, cash equivalents and restricted cash (136) 384
Cash, cash equivalents and restricted cash, beginning of period 702 318
Cash, cash equivalents and restricted cash, end of period 566$ 702$
Supplemental Cash Flow Information
Cash paid during the period for interest 284$ 143$
Cash paid during the period for income taxes, net of refunds 177 113
Non-cash Investing and Financing Activities
Period end balance of trade payables for property, plant and equipment 134$ 135$
Deferred purchase price of receivables factored in the period in investing 236 154
Stock issued for acquisition of Federal-Mogul - (1,236)
Stock transferred for acquisition of Federal-Mogul - 1,236
Redeemable noncontrolling interest transaction with owner 53 -
TENNECO INC. AND CONSOLIDATED SUBSIDIARIES
STATEMENTS OF CASH FLOWS
Unaudited
(Millions)

ATTACHMENT 2
Net income
(loss)
attributable
to Tenneco
Inc. Per Share
Net income
(loss)
attributable to
noncontrolling
interests
Income tax
(expense)
benefit EBIT EBITDA (3)
Net income
(loss)
attributable to
Tenneco Inc. Per Share
Net income
(loss)
attributable to
noncontrolling
interests
Income tax
(expense)
benefit EBIT EBITDA (3)
(293)$ (3.62)$ 75$ (21)$ (117)$ 53$ (109)$ (1.35)$ 17$ 10$ (23)$ 142$
Adjustments:
Restructuring and related expenses (5)
34 0.41 1 (7) 42 36 15 0.18 1 (4) 20 17
Cost reduction initiatives (6)
- - - 1 (1) (1) 6 0.08 - (2) 8 8
Acquisition and separation costs (7)
28 0.36 - (2) 30 30 41 0.50 - (12) 53 53
Costs to achieve synergies (8)
7 0.09 - (1) 8 8 44 0.54 - (5) 49 49
Purchase accounting charges (9)
4 0.05 - 2 2 2 88 1.09 - (18) 106 106
Goodwill and intangible impairment charge (10)
172 2.13 - - 172 172 3 0.04 - - 3 3
Process harmonization (11)
14 0.17 - (2) 16 16 - - - - - -
Noncontrolling interests adjustments (12)
58 0.71 (58) - - - - - - - - -
Pension charges/adjustments (13)
(1) (0.02) - 1 (2) (2) 2 0.03 - (1) 3 3
Anti-dumping duty charge (14)
- - - - - - 12 0.15 - (4) 16 16
Loss on debt modification (15)
- - - - - - 8 0.10 - (2) 10 10
Net tax adjustments - - - - - - (5) (0.06) - (5) - -
Adjusted Net income, EPS, NCI, Tax, EBIT, and EBITDA (4)
23$ 0.28$ 18$ (29)$ 150$ 314$ 105$ 1.30$ 18$ (43)$ 245$ 407$
Clean Air Powertrain Motorparts
Ride
Performance Total Corporate Total
Net income (loss) attributable to Tenneco Inc. (293)$
Net income (loss) attributable to noncontrolling interests 75
Net income (loss) (218)
Income tax expense (benefit) (21)
Interest expense (80)
(117)
Depreciation and amortization 170
Total EBITDA including noncontrolling interests (3)
130$ 60$ (57)$ 7$ 140$ (87)$ 53$
Restructuring and related expenses (5)
3 2 - 23 28 8 36
Cost reduction initiatives (6)
- - - - - (1) (1)
Acquisition and separation costs (7)
- - - - - 30 30
Costs to achieve synergies (8)
1 - 2 - 3 5 8
Purchase accounting charges (9)
- 2 - - 2 - 2
Goodwill and intangible impairment charge (10)
- 18 154 - 172 - 172
Process harmonization (11)
8 - 4 4 16 - 16
Pension adjustments (13)
- - - - - (2) (2)
Adjusted EBITDA (4)
142$ 82$ 103$ 34$ 361$ (47)$ (16)
314$
Clean Air Powertrain Motorparts
Ride
Performance Total Corporate Total
Net income (loss) attributable to Tenneco Inc. (109)$
Net income (loss) attributable to noncontrolling interests 17
Net income (loss) (92)
Income tax expense (benefit) 10
Interest expense (79)
(23)
Depreciation and amortization 165
Total EBITDA including noncontrolling interests (3)
156$ 93$ 8$ 11$ 268$ (126)$ 142$
Restructuring and related expenses (5)
(2) (2) 2 19 17 - 17
Cost reduction initiatives (6)
- - - - - 8 8
Acquisition and separation costs (7)
- - - - - 53 53
Costs to achieve synergies (8)
(3) - 35 10 42 7 49
Purchase accounting charges (9)
- 44 57 5 106 - 106
Goodwill impairment charge (10)
- - - 3 3 - 3
Pension charges (13)
- - - 3 3 - 3
Anti-dumping duty charge (14)
- - 16 - 16 - 16
Loss on debt modification (15)
- - - - - 10 10
Adjusted EBITDA (4)
151$ 135$ 118$ 51$ 455$ (48)$ 407$
(1) U.S. Generally Accepted Accounting Principles.
(16) Corporate costs for each division are $21 million for New Tenneco and $26 million for DRiV.
(3) EBITDA including noncontrolling interests represents income before interest expense, income taxes, noncontrolling interests and depreciation and amortization. EBITDA including noncontrolling
interests is not a calculation based upon GAAP. The amounts included in the EBITDA including noncontrolling interests calculation, however, are derived from amounts included in the historical
statements of income data. In addition, EBITDA including noncontrolling interests should not be considered as an alternative to net income attributable to Tenneco Inc. or operating income as an
indicator of the company's operating performance, or as an alternative to operating cash flows as a measure of liquidity. Tenneco has presented EBITDA including noncontrolling interests because it
regularly reviews EBITDA including noncontrolling interests as a measure of the company's performance. In addition, Tenneco believes its investors utilize and analyze the company's EBITDA
including noncontrolling interests for similar purposes. Tenneco also believes EBITDA including noncontrolling interests assists investors in comparing a company's performance on a consistent basis
without regard to depreciation and amortization, which can vary significantly depending upon many factors. However, the EBITDA including noncontrolling interests measure presented may not always
be comparable to similarly titled measures reported by other companies due to differences in the components of the calculation.
(6) Costs related to cost reduction initiatives.
(9) This primarily relates to a non-cash charge to cost of sales for the amortization of the inventory fair value step-up recorded as part of the Acquisitions.
(15) Loss on debt modification related to Federal-Mogul acquisition.
(2) Tenneco presents the above reconciliation of GAAP to non-GAAP earnings measures primarily to reflect the results in a manner that allows a better understanding of the results of operational
activities separate from the financial impact of decisions made for the long-term benefit of the company and other items impacting comparability between the periods. Adjustments similar to the ones
reflected above have been recorded in earlier periods, and similar types of adjustments can reasonably be expected to be recorded in future periods. Using only the non-GAAP earnings measures to
analyze earnings would have material limitations because its calculation is based on the subjective determinations of management regarding the nature and classification of events and circumstances
that investors may find material. Management compensates for these limitations by utilizing both GAAP and non-GAAP earnings measures reflected above to understand and analyze the results of
the business. The company believes investors find the non-GAAP information helpful in understanding the ongoing performance of operations separate from items that may have a disproportionate
positive or negative impact on the company's financial results in any particular period.
Global Segments
Q4 2019
(10) Non-cash asset impairment charge related to goodwill and intangibles.
(14) Charge due to retroactive application of anti-dumping duty on a supplier's products.
(8) Costs to achieve synergies related to Federal-Mogul acquisition.
(13) Charges related to pension derisking and other adjustments.
(11) Charge due to process harmonization.
(12) Amount relates to adjustments made to mark certain redeemable noncontrolling interests to their redemption values.
(7) Costs related to acquisitions and costs related to expected separation.
(5) Q4 2019 includes $6 million and Q4 2018 includes $3 million of accelerated depreciation related to plant closures.
(4) Adjusted results are presented in order to reflect the results in a manner that allows a better understanding of operational activities separate from the financial impact of decisions made for the long
term benefit of the company and other items impacting comparability between periods. Similar adjustments have been recorded in earlier periods and similar types of adjustments can reasonably be
expected to be recorded in future periods. The company believes investors find the non-GAAP information helpful in understanding the ongoing performance of operations separate from items that
may have a disproportionate positive or negative impact on the company’s financial results in any particular period.
Earnings (Loss) Measures
EBIT, Earnings (Loss) before interest expense, income taxes
and noncontrolling interests
EBIT, Earnings (Loss) before interest expense, income taxes
and noncontrolling interests
Global Segments
Q4 2018
Q4 2018Q4 2019
TENNECO INC.
RECONCILIATION OF GAAP(1)
TO NON-GAAP EARNINGS MEASURES(2)
Unaudited
(Millions except per share amounts)

ATTACHMENT 2
Net income
(loss)
attributable
to Tenneco
Inc. Per Share
Net income
(loss)
attributable to
noncontrolling
interests
Income tax
(expense)
benefit EBIT EBITDA (3)
Net income
(loss)
attributable to
Tenneco Inc. Per Share
Net income
(loss)
attributable to
noncontrolling
interests
Income tax
(expense)
benefit EBIT EBITDA (3)
(314)$ (3.88)$ 114$ (26)$ 148$ 821$ 55$ 0.93$ 56$ (63)$ 322$ 667$
Adjustments:
Restructuring and related expenses (5)
116 1.43 6 (31) 153 138 46 0.76 8 (11) 65 62
Cost reduction initiatives (6)
12 0.15 - (3) 15 15 13 0.24 - (5) 18 18
Acquisition and separation costs (7)
102 1.27 - (25) 127 127 74 1.26 - (22) 96 96
Costs to achieve synergies (8)
23 0.29 - (6) 29 29 53 0.90 - (9) 62 62
Purchase accounting charges (9)
49 0.61 - (8) 57 57 88 1.50 - (18) 106 106
Goodwill and intangible impairment charge (10)
241 2.98 - - 241 241 3 0.05 - - 3 3
Process harmonization (11)
21 0.26 - (5) 26 26 - - - - - -
Warranty charge (12)
6 0.07 - (2) 8 8 4 0.06 - (1) 5 5
Antitrust reserve change in estimate (13)
(7) (0.09) - 2 (9) (9) - - - - - -
Brazil tax credit (14)
(14) (0.18) - 8 (22) (22) - - - - - -
Out of period adjustment (15)
4 0.05 1 - 5 5 - - - - - -
Impairment of assets held for sale 6 0.07 - (2) 8 8 - - - - - -
Noncontrolling interests adjustments (16)
58 0.71 (58) - - - - - - - - -
Pension charges/adjustments (17)
(1) (0.02) - 1 (2) (2) 2 0.04 - (1) 3 3
Litigation settlement accrual - - - - - - 8 0.13 - (2) 10 10
Anti-dumping duty charge (18)
- - - - - - 12 0.21 - (4) 16 16
Environmental charge (19)
- - - - - - 3 0.06 - (1) 4 4
Loss on debt modification (20)
- - - - - - 8 0.14 - (2) 10 10
Net tax adjustments (41) (0.50) - (41) - - - - - - - -
Adjusted Net income, EPS, NCI, Tax, EBIT, and EBITDA (4)
261$ 3.22$ 63$ (138)$ 784$ 1,442$ 369$ 6.28$ 64$ (139)$ 720$ 1,062$
Clean Air Powertrain Motorparts
Ride
Performance Total Corporate Total
Net income (loss) attributable to Tenneco Inc. (314)$
Net income (loss) attributable to noncontrolling interests 114
Net income (loss) (200)
Income tax expense (benefit) (26)
Interest expense (322)
148
Depreciation and amortization 673
Total EBITDA including noncontrolling interests (3)
582$ 363$ 211$ 8$ 1,164$ (343)$ 821$
Restructuring and related expenses (5)
24 30 4 71 129 9 138
Cost reduction initiatives (6)
- - - - - 15 15
Acquisition and separation costs (7)
- - 1 - 1 126 127
Costs to achieve synergies (8)
6 2 11 2 21 8 29
Purchase accounting charges (9)
- 12 41 4 57 - 57
Goodwill and intangible impairment charge (10)
- 18 154 69 241 - 241
Process harmonization (11)
13 - 9 4 26 - 26
Warranty charge (12)
- - 8 - 8 - 8
Antitrust reserve change in estimate (13)
(9) - - - (9) - (9)
Brazil tax credit (14)
(9) - (7) (6) (22) - (22)
Out of period adjustment (15)
- - - 5 5 - 5
Impairment of assets held for sale - - 8 - 8 - 8
Pension adjustments (17)
- - - - - (2) (2)
Adjusted EBITDA (4)
607$ 425$ 440$ 157$ 1,629$ (187)$ (21)
1,442$
Clean Air Powertrain Motorparts
Ride
Performance Total Corporate Total
Net income (loss) attributable to Tenneco Inc. 55$
Net income (loss) attributable to noncontrolling interests 56
Net income (loss) 111
Income tax expense (benefit) (63)
Interest expense (148)
322
Depreciation and amortization 345
Total EBITDA including noncontrolling interests (3)
599$ 93$ 161$ 69$ 922$ (255)$ 667$
Restructuring and related expenses (5)
11 (2) 7 46 62 - 62
Cost reduction initiatives (6)
- - - 10 10 8 18
Acquisition and separation costs (7)
- - - - - 96 96
Costs to achieve synergies (8)
3 - 36 11 50 12 62
Purchase accounting charges (9)
- 44 57 5 106 - 106
Goodwill impairment charge (10)
- - - 3 3 - 3
Warranty charge (12)
- - - 5 5 - 5
Pension charges (17)
- - - 3 3 - 3
Litigation settlement accrual - - - 9 9 1 10
Anti-dumping duty charge (18)
- - 16 - 16 - 16
Environmental charge (19)
- - - - - 4 4
Loss on debt modification (20)
- - - - - 10 10
Adjusted EBITDA (4)
613$ 135$ 277$ 161$ 1,186$ (124)$ 1,062$
(1) U.S. Generally Accepted Accounting Principles.
(16) Amount relates to adjustments made to mark certain redeemable noncontrolling interests to their redemption values.
Global Segments
YTD 2018
(18) Charge due to retroactive application of anti-dumping duty on a supplier's products.
(6) Costs related to cost reduction initiatives.
(4) Adjusted results are presented in order to reflect the results in a manner that allows a better understanding of operational activities separate from the financial impact of decisions made for the
long term benefit of the company and other items impacting comparability between periods. Similar adjustments have been recorded in earlier periods and similar types of adjustments can
reasonably be expected to be recorded in future periods. The company believes investors find the non-GAAP information helpful in understanding the ongoing performance of operations separate
from items that may have a disproportionate positive or negative impact on the company’s financial results in any particular period.
YTD 2019 YTD 2018
TENNECO INC.
RECONCILIATION OF GAAP(1)
TO NON-GAAP EARNINGS MEASURES(2)
Unaudited
(Millions except per share amounts)
Earnings (Loss) Measures
YTD 2019
Global Segments
EBIT, Earnings (Loss) before interest expense, income
taxes and noncontrolling interests
EBIT, Earnings (Loss) before interest expense, income
taxes and noncontrolling interests
(20) Loss on debt modification related to Federal-Mogul acquisition.
(19) Environmental charge related to an acquired site whereby an indemnification reverted back to the Company resulting from a 2009 bankruptcy filing of Mark IV Industries.
(2) Tenneco presents the above reconciliation of GAAP to non-GAAP earnings measures primarily to reflect the results in a manner that allows a better understanding of the results of operational
activities separate from the financial impact of decisions made for the long-term benefit of the company and other items impacting comparability between the periods. Adjustments similar to the
ones reflected above have been recorded in earlier periods, and similar types of adjustments can reasonably be expected to be recorded in future periods. Using only the non-GAAP earnings
measures to analyze earnings would have material limitations because its calculation is based on the subjective determinations of management regarding the nature and classification of events and
circumstances that investors may find material. Management compensates for these limitations by utilizing both GAAP and non-GAAP earnings measures reflected above to understand and
analyze the results of the business. The company believes investors find the non-GAAP information helpful in understanding the ongoing performance of operations separate from items that may
have a disproportionate positive or negative impact on the company's financial results in any particular period.
(3) EBITDA including noncontrolling interests represents income before interest expense, income taxes, noncontrolling interests and depreciation and amortization. EBITDA including noncontrolling
interests is not a calculation based upon GAAP. The amounts included in the EBITDA including noncontrolling interests calculation, however, are derived from amounts included in the historical
statements of income data. In addition, EBITDA including noncontrolling interests should not be considered as an alternative to net income attributable to Tenneco Inc. or operating income as an
indicator of the company's operating performance, or as an alternative to operating cash flows as a measure of liquidity. Tenneco has presented EBITDA including noncontrolling interests because
it regularly reviews EBITDA including noncontrolling interests as a measure of the company's performance. In addition, Tenneco believes its investors utilize and analyze the company's EBITDA
including noncontrolling interests for similar purposes. Tenneco also believes EBITDA including noncontrolling interests assists investors in comparing a company's performance on a consistent
basis without regard to depreciation and amortization, which can vary significantly depending upon many factors. However, the EBITDA including noncontrolling interests measure presented may
not always be comparable to similarly titled measures reported by other companies due to differences in the components of the calculation.
(5) FY 2019 includes $15 million and FY 2018 includes $3 million of accelerated depreciation related to plant closures.
(17) Charges related to pension derisking and other adjustments.
(7) Costs related to acquisitions and costs related to expected separation.
(8) Costs to achieve synergies related to Federal-Mogul acquisition.
(9) This primarily relates to a non-cash charge to cost of sales for the amortization of the inventory fair value step-up recorded as part of the Acquisitions.
(10) Non-cash asset impairment charge related to goodwill and intangibles.
(11) Charge due to process harmonization.
(12) Charge related to warranty. Although Tenneco regularly incurs warranty costs, this specific charge is of an unusual nature in the period incurred.
(13) Reduction in estimated antitrust accrual.
(14) Recovery of value-added tax in a foreign jurisdiction.
(15) Inventory losses attributable to prior periods.

(21) Corporate costs for each division are $85 million for New Tenneco and $102 million for DRiV.

ATTACHMENT 2
Currency Value-add
Impact on Revenues
Substrate Value-add Value-add excluding
Revenues Sales Revenues Revenues Currency
Clean Air 1,743$ 769$ 974$ (11)$ 985$
Powertrain 1,018 - 1,018 (12) 1,030
Motorparts 741 - 741 (9) 750
Ride Performance 641 - 641 (10) 651
Total Tenneco Inc. 4,143$ 769$ 3,374$ (42)$ 3,416$
Currency Value-add
Impact on Revenues
Substrate Value-add Value-add excluding
Revenues Sales Revenues Revenues Currency
Clean Air 1,655$ 631$ 1,024$ -$ 1,024$
Powertrain 1,112 - 1,112 - 1,112
Motorparts 827 - 827 - 827
Ride Performance 684 - 684 - 684
Total Tenneco Inc. 4,278$ 631$ 3,647$ -$ 3,647$
(1) U.S. Generally Accepted Accounting Principles.
(2) Tenneco presents the above reconciliation of revenues in order to reflect value-add revenues separately from the effects of
doing business in currencies other than the U.S. dollar. Additionally, substrate sales include precious metals pricing, which may
be volatile. Substrate sales occur when, at the direction of its OE customers, Tenneco purchases catalytic converters or
components thereof from suppliers, uses them in its manufacturing processes and sells them as part of the completed system.
While Tenneco original equipment customers assume the risk of this volatility, it impacts reported revenue. Excluding substrate
sales removes this impact. Tenneco uses this information to analyze the trend in revenues before these factors. Tenneco
believes investors find this information useful in understanding period to period comparisons in the company's revenues.
TENNECO INC.
RECONCILIATION OF GAAP (1)
REVENUE TO NON-GAAP REVENUE MEASURES (2)
Unaudited
(Millions)
Q4 2019
Q4 2018

ATTACHMENT 2
Currency Value-add
Impact on Revenues
Substrate Value-add Value-add excluding
Revenues Sales Revenues Revenues Currency
Clean Air 7,121$ 3,027$ 4,094$ (113)$ 4,207$
Powertrain 4,408 - 4,408 (12) 4,420
Motorparts 3,167 - 3,167 (42) 3,209
Ride Performance 2,754 - 2,754 (75) 2,829
Total Tenneco Inc. 17,450$ 3,027$ 14,423$ (242)$ 14,665$
Currency Value-add
Impact on Revenues
Substrate Value-add Value-add excluding
Revenues Sales Revenues Revenues Currency
Clean Air 6,707$ 2,500$ 4,207$ -$ 4,207$
Powertrain 1,112 - 1,112 - 1,112
Motorparts 1,780 - 1,780 - 1,780
Ride Performance 2,164 - 2,164 - 2,164
Total Tenneco Inc. 11,763$ 2,500$ 9,263$ -$ 9,263$
(1) U.S. Generally Accepted Accounting Principles.
(2) Tenneco presents the above reconciliation of revenues in order to reflect value-add revenues separately from the effects of
doing business in currencies other than the U.S. dollar. Additionally, substrate sales include precious metals pricing, which may
be volatile. Substrate sales occur when, at the direction of its OE customers, Tenneco purchases catalytic converters or
components thereof from suppliers, uses them in its manufacturing processes and sells them as part of the completed system.
While Tenneco original equipment customers assume the risk of this volatility, it impacts reported revenue. Excluding substrate
sales removes this impact. Tenneco uses this information to analyze the trend in revenues before these factors. Tenneco
believes investors find this information useful in understanding period to period comparisons in the company's revenues.
TENNECO INC.
RECONCILIATION OF GAAP (1)
REVENUE TO NON-GAAP REVENUE MEASURES (2)
Unaudited
(Millions)
YTD 2019
YTD 2018

ATTACHMENT 2
TENNECO INC.
RECONCILIATION OF GAAP (1)
REVENUE TO NON-GAAP REVENUE MEASURES
Unaudited
Revenues % Change
Value-add
Revenues
Excluding
Currency % Change
Clean Air 88$ 5% (39)$ (4%)
Powertrain (94) (8%) (82) (7%)
Motorparts (86) (10%) (77) (9%)
Ride Performance (43) (6%) (33) (5%)
Total Tenneco Inc. (135)$ (3%) (231)$ (6%)
Revenues % Change
Value-add
Revenues
Excluding
Currency % Change
Clean Air 414$ 6% -$ -
Powertrain 3,296 296% 3,308 297%
Motorparts 1,387 78% 1,429 80%
Ride Performance 590 27% 665 31%
Total Tenneco Inc. 5,687$ 48% 5,402$ 58%
(1) U.S. Generally Accepted Accounting Principles.
(Millions except percents)
YTD Q4 2019 vs. YTD Q4 2018 $ Change and % Change Increase (Decrease)
Q4 2019 vs. Q4 2018 $ Change and % Change Increase (Decrease)

ATTACHMENT 2
December 31, 2019 December 31, 2018
Total debt 5,556$ 5,493$
Total cash, cash equivalents and restricted cash (total cash) 566 702
Debt net of total cash balances (1)
4,990$ 4,791$
Adjusted LTM and Pro forma Adjusted LTM EBITDA
including noncontrolling interests (2) (3) (5)
1,442$ 1,627$
3.5x 2.9x
Q1 18* Q2 18* Q3 18* Q4 18 Q1 19 Q2 19 Q3 19 Q4 19
Net income (loss) attributable to Tenneco Inc. 60$ 47$ 57$ (109)$ (117)$ 26$ 70$ (293)$
Net income (loss) attributable to noncontrolling interests 14 16 9 17 12 19 8 75
Net income (loss) 74 63 66 (92) (105) 45 78 (218)
Income tax (expense) benefit (25) (26) (22) 10 - (14) 9 (21)
Interest expense (23) (22) (24) (79) (81) (82) (79) (80)
EBIT, Earnings (Loss) before interest expense, income
taxes and noncontrolling interests 122 111 112 (23) (24) 141 148 (117)
Depreciation and amortization 60 60 60 165 169 169 165 170
Total EBITDA including noncontrolling interests (2)
182$ 171$ 172$ 142$ 145$ 310$ 313$ 53$
Adjustments:
Restructuring and related expenses 12 21 12 17 17 57 28 36
Cost reduction initiatives (6)
- 10 - 8 8 2 6 (1)
Acquisition and separation costs (7)
13 18 12 53 40 27 30 30
Warranty charge (8)
5 - - - - 7 1 -
Costs to achieve synergies (9)
- 9 4 49 7 7 7 8
Purchase accounting charges (10)
- - - 106 41 3 11 2
Goodwill and intangible impairment charge (11)
- - - 3 60 - 9 172
Process harmonization (12)
- - - - 9 1 - 16
Anti-dumping duty charge (13)
- - - 16 - - - -
Antitrust reserve change in estimate (14)
- - - - - - (9) -
Brazil tax credit (15)
- - - - - - (22) -
Out of period adjustment (16)
- - - - - - 5 -
Impairment of assets held for sale - - - - - - 8 -
Environmental charge (17)
- 4 - - - - - -
Litigation settlement accrual - - 10 - - - - -
Loss on debt modification (18)
- - - 10 - - - -
Pension charges/adjustments (19)
- - - 3 - - - (2)
Total Adjusted EBITDA including noncontrolling interests (3)
212$ 233$ 210$ 407$ 327$ 414$ 387$ 314$
Q1 18 Q2 18 Q3 18
Net income attributable to Federal-Mogul 26$ 25$ 35$
Net income (loss) attributable to noncontrolling interests 3 3 1
Net income (loss) 29 28 36
Income tax (expense) benefit (15) (13) (16)
Interest expense (48) (52) (49)
92 93 101
Depreciation and amortization 100 96 99
Total EBITDA including noncontrolling interests (2)
192$ 189$ 200$
Adjustments:
Restructuring charges and asset impairments, net - - 15
Purchase price contingency 5 - -
Transaction related costs 1 13 -
Cost to exit a multiemployer pension plan - 5 -
Gain (loss) on sale of assets - - (65)
Charge for extinguishment of dissenting shareholders shares - - 5
Other 2 2 1
Total Adjusted EBITDA including noncontrolling interests (3)
200$ 209$ 156$
Q1 18* Q2 18* Q3 18* Q4 18 Q1 19 Q2 19 Q3 19 Q4 19
Adjusted EBITDA and Pro forma Adjusted EBITDA
including noncontrolling interests (2) (3) (5)
412$ 442$ 366$ 407$ 327$ 414$ 387$ 314$
Q4 2018 Pro forma Adjusted LTM EBITDA including
noncontrolling interests (2) (3) (5)
1,627$
Q4 2019 Adjusted LTM EBITDA including noncontrolling
interests (2) (3)
1,442$
(7) Costs related to acquisitions and costs related to expected separation.
(8) Charge related to warranty. Although Tenneco regularly incurs warranty costs, this specific charge is of an unusual nature in the period incurred.
(13) Charge due to retroactive application of anti-dumping duty on a supplier's products.
(17) Environmental charge related to an acquired site whereby an indemnification reverted back to the Company resulting from a 2009 bankruptcy filing of Mark IV Industries.
(18) Loss on debt modification.
(19) Charges related to pension derisking and other adjustments.
(9) Costs to achieve synergies related to Federal-Mogul acquisition.
(10) This primarily relates to a non-cash charge to cost of goods sold for the amortization of the inventory fair value step-up recorded as part of the Acquisitions.
(11) Non-cash asset impairment charge related to goodwill and intangibles.
(12) Charge due to process harmonization.
(14) Reduction in estimated antitrust accrual.
(15) Recovery of value-added tax in a foreign jurisdiction.
(16) Inventory losses attributable to prior periods.
(3) Adjusted EBITDA including noncontrolling interests is presented in order to reflect the results in a manner that allows a better understanding of operational activities separate from the financial impact of decisions made for the long term benefit of the
company and other items impacting comparability between the periods. Similar adjustments to EBITDA including noncontrolling interests have been recorded in earlier periods, and similar types of adjustments can reasonably be expected to be
recorded in future periods. The company believes investors find the non-GAAP information helpful in understanding the ongoing performance of operations separate from items that may have a disproportionate positive or negative impact on the
company's financial results in any particular period.
(4) Tenneco presents the above reconciliation of the ratio of debt net of total cash to LTM Adjusted EBITDA including noncontrolling interests to show trends that investors may find useful in understanding the company's ability to service its debt. For
purposes of this calculation, Adjusted LTM and Pro Forma adjusted LTM EBITDA including noncontrolling interests is used as an indicator of the company's performance and debt net of total cash is presented as an indicator of the company's credit
position and progress toward reducing the company's financial leverage. This reconciliation is provided as supplemental information and not intended to replace the company's existing covenant ratios or any other financial measures that investors may
find useful in describing the company's financial position. See notes (1), (2) and (3) for a description of the limitations of using debt net of total cash, EBITDA including noncontrolling interests and Adjusted EBITDA including noncontrolling interests.
(6) Costs related to cost reduction initiatives.
Ratio of debt net of total cash balances and Pro forma ratio of debt net of
total cash balances to Adjusted LTM and Pro forma Adjusted LTM EBITDA
including noncontrolling interests (4) (5)
(1) Tenneco presents debt net of total cash balances because management believes it is a useful measure of Tenneco's credit position and progress toward reducing leverage. The calculation is limited in that the company may not always be able to use
cash to repay debt on a dollar-for-dollar basis.
(2) EBITDA including noncontrolling interests represents income before interest expense, income taxes, noncontrolling interests and depreciation and amortization. EBITDA including noncontrolling interests is not a calculation based upon GAAP. The
amounts included in the EBITDA including noncontrolling interests calculation, however, are derived from amounts included in the historical statements of income data. In addition, EBITDA including noncontrolling interests should not be considered as
an alternative to net income (loss) attributable to Tenneco Inc. or operating income as an indicator of the company's operating performance, or as an alternative to operating cash flows as a measure of liquidity. Tenneco has presented EBITDA including
noncontrolling interests because it regularly reviews EBITDA including noncontrolling interests as a measure of the company's performance. In addition, Tenneco believes its investors utilize and analyze the company's EBITDA including noncontrolling
interests for similar purposes. Tenneco also believes EBITDA including noncontrolling interests assists investors in comparing a company's performance on a consistent basis without regard to depreciation and amortization, which can vary significantly
depending upon many factors. However, the EBITDA including noncontrolling interests measure presented may not always be comparable to similarly titled measures reported by other companies due to differences in the components of the calculation.
Legacy Federal-Mogul Reconciliation of Non-GAAP earnings measures
EBIT, Earnings before interest expense, income taxes and noncontrolling
interests
(5) Tenneco is providing Pro Forma Adjusted LTM EBITDA and the ratio of debt net of cash balances to Pro Forma Adjusted LTM EBITDA to show the company’s Adjusted LTM EBITDA as if Federal-Mogul had been consolidated with Tenneco for the
entirety of 2018 (and the resultant impact on the net debt ratio). Tenneco believes this supplemental information is useful to investors who are trying to understand the results of the entire enterprise, including Federal-Mogul, for 2018 and 2019 and the
ability of the company to service its debt.
* Financial results for the first three quarters of 2018 have been revised for certain immaterial adjustments as discussed in Tenneco’s Form 10-K for the year ended December 31, 2018.
TENNECO INC.
RECONCILIATION OF NON-GAAP MEASURES
Debt net of total cash / Adjusted LTM and Pro Forma Adjusted LTM EBITDA including noncontrolling interests
Unaudited
(Millions except ratios)

ATTACHMENT 2
Revenues Currency
Revenues
Excluding
Currency
Substrate Sales
Excluding
Currency
Value-add
Revenues
Excluding
Currency
Original equipment light vehicle revenues 2,635$ 3$ 2,632$ 663$ 1,969$
Original equipment commercial truck, off-highway, industrial and other revenues 767 (48) 815 118 697
Aftermarket revenues 741 (9) 750 - 750
Net sales and operating revenues 4,143$ (54)$ 4,197$ 781$ 3,416$
Revenues Currency
Revenues
Excluding
Currency
Substrate Sales
Excluding
Currency
Value-add
Revenues
Excluding
Currency
Original equipment light vehicle revenues 2,647$ -$ 2,647$ 531$ 2,116$
Original equipment commercial truck, off-highway, industrial and other revenues 804 - 804 100 704
Aftermarket revenues 827 - 827 - 827
Net sales and operating revenues 4,278$ -$ 4,278$ 631$ 3,647$
Revenues Currency
Revenues
Excluding
Currency
Substrate Sales
Excluding
Currency
Value-add
Revenues
Excluding
Currency
Original equipment light vehicle revenues 11,001$ (180)$ 11,181$ 2,644$ 8,537$
Original equipment commercial truck, off-highway, industrial and other revenues 3,282 (88) 3,370 451 2,919
Aftermarket revenues 3,167 (42) 3,209 - 3,209
Net sales and operating revenues 17,450$ (310)$ 17,760$ 3,095$ 14,665$
Revenues Currency
Revenues
Excluding
Currency
Substrate Sales
Excluding
Currency
Value-add
Revenues
Excluding
Currency
Original equipment light vehicle revenues 8,104$ -$ 8,104$ 2,092$ 6,012$
Original equipment commercial truck, off-highway, industrial and other revenues 1,879 - 1,879 408 1,471
Aftermarket revenues 1,780 - 1,780 - 1,780
Net sales and operating revenues 11,763$ -$ 11,763$ 2,500$ 9,263$
(1) U.S. Generally Accepted Accounting Principles.
YTD 2018
(2) Tenneco presents the above reconciliation of revenues in order to reflect value-add revenues separately from the effects of doing business in currencies other than the U.S.
dollar. Additionally, substrate sales include precious metals pricing, which may be volatile. Substrate sales occur when, at the direction of its OE customers, Tenneco purchases
catalytic converters or components thereof from suppliers, uses them in its manufacturing processes and sells them as part of the completed system. While Tenneco original
equipment customers assume the risk of this volatility, it impacts reported revenue. Excluding substrate sales removes this impact. Tenneco uses this information to analyze the
trend in revenues before these factors. Tenneco believes investors find this information useful in understanding period to period comparisons in the company's revenues.
TENNECO INC.
RECONCILIATION OF GAAP (1)
REVENUE TO NON-GAAP REVENUE MEASURES (2)
Unaudited
(Millions)
Q4 2019
Q4 2018
YTD 2019

ATTACHMENT 2
Clean Air Powertrain Motorparts
Ride
Performance Total Corporate Total
1,743$ 1,018$ 741$ 641$ 4,143$ -$ 4,143$
Less: Substrate sales 769 - - - 769 - 769
Value-add revenues 974$ 1,018$ 741$ 641$ 3,374$ -$ 3,374$
EBITDA 130$ 60$ (57)$ 7$ 140$ (87)$ 53$
EBITDA as a % of revenue 7.5% 5.9% -7.7% 1.1% 3.4% 1.3%
EBITDA as a % of value-add revenue 13.3% 5.9% -7.7% 1.1% 4.1% 1.6%
Adjusted EBITDA 142$ 82$ 103$ 34$ 361$ (47)$ 314$
Adjusted EBITDA as a % of revenue 8.1% 8.1% 13.9% 5.3% 8.7% 7.6%
Adjusted EBITDA as a % of value-add revenue 14.6% 8.1% 13.9% 5.3% 10.7% 9.3%
Clean Air Powertrain Motorparts
Ride
Performance Total Corporate Total
1,655$ 1,112$ 827$ 684$ 4,278$ -$ 4,278$
Less: Substrate sales 631 - - - 631 - 631
Value-add revenues 1,024$ 1,112$ 827$ 684$ 3,647$ -$ 3,647$
EBITDA 156$ 93$ 8$ 11$ 268$ (126)$ 142$
EBITDA as a % of revenue 9.4% 8.4% 1.0% 1.6% 6.3% 3.3%
EBITDA as a % of value-add revenue 15.2% 8.4% 1.0% 1.6% 7.3% 3.9%
Adjusted EBITDA 151$ 135$ 118$ 51$ 455$ (48)$ 407$
Adjusted EBITDA as a % of revenue 9.1% 12.1% 14.3% 7.5% 10.6% 9.5%
Adjusted EBITDA as a % of value-add revenue 14.7% 12.1% 14.3% 7.5% 12.5% 11.2%
(1) U.S. Generally Accepted Accounting Principles.
Net sales and operating revenues
(2) Tenneco presents the above reconciliation of revenues in order to reflect EBITDA and adjusted EBITDA as a percent of both total revenues and value-add revenues. Substrate sales include precious
metals pricing, which may be volatile. Substrate sales occur when, at the direction of its OE customers, Tenneco purchases catalytic converters or components thereof from suppliers, uses them in its
manufacturing processes and sells them as part of the completed system. While Tenneco original equipment customers assume the risk of this volatility, it impacts reported revenue. Excluding substrate
sales removes this impact. Further, presenting EBITDA and adjusted EBITDA as a percent of value-add revenue assists investors in evaluating the company's operational performance without the impact
of such substrate sales. See prior pages for a discussion of EBITDA and adjusted EBITDA.
Net sales and operating revenues
Q4 2018
Global Segments
Global Segments
TENNECO INC.
RECONCILIATION OF GAAP (1)
REVENUE AND EARNINGS TO NON-GAAP REVENUE AND EARNINGS MEASURES (2)
Unaudited
(Millions except percents)
Q4 2019

ATTACHMENT 2
Clean Air Powertrain Motorparts
Ride
Performance Total Corporate Total
7,121$ 4,408$ 3,167$ 2,754$ 17,450$ -$ 17,450$
Less: Substrate sales 3,027 - - - 3,027 - 3,027
Value-add revenues 4,094$ 4,408$ 3,167$ 2,754$ 14,423$ -$ 14,423$
EBITDA 582$ 363$ 211$ 8$ 1,164$ (343)$ 821$
EBITDA as a % of revenue 8.2% 8.2% 6.7% 0.3% 6.7% 4.7%
EBITDA as a % of value-add revenue 14.2% 8.2% 6.7% 0.3% 8.1% 5.7%
Adjusted EBITDA 607$ 425$ 440$ 157$ 1,629$ (187)$ 1,442$
Adjusted EBITDA as a % of revenue 8.5% 9.6% 13.9% 5.7% 9.3% 8.3%
Adjusted EBITDA as a % of value-add revenue 14.8% 9.6% 13.9% 5.7% 11.3% 10.0%
Clean Air Powertrain Motorparts
Ride
Performance Total Corporate Total
6,707$ 1,112$ 1,780$ 2,164$ 11,763$ -$ 11,763$
Less: Substrate sales 2,500 - - - 2,500 - 2,500
Value-add revenues 4,207$ 1,112$ 1,780$ 2,164$ 9,263$ -$ 9,263$
EBITDA 599$ 93$ 161$ 69$ 922$ (255)$ 667$
EBITDA as a % of revenue 8.9% 8.4% 9.0% 3.2% 7.8% 5.7%
EBITDA as a % of value-add revenue 14.2% 8.4% 9.0% 3.2% 10.0% 7.2%
Adjusted EBITDA 613$ 135$ 277$ 161$ 1,186$ (124)$ 1,062$
Adjusted EBITDA as a % of revenue 9.1% 12.1% 15.6% 7.4% 10.1% 9.0%
Adjusted EBITDA as a % of value-add revenue 14.6% 12.1% 15.6% 7.4% 12.8% 11.5%
(1) U.S. Generally Accepted Accounting Principles.
Global Segments
TENNECO INC.
RECONCILIATION OF GAAP (1)
REVENUE AND EARNINGS TO NON-GAAP REVENUE AND EARNINGS MEASURES (2)
Unaudited
(Millions except percents)
YTD 2019
Net sales and operating revenues
YTD 2018
Net sales and operating revenues
(2) Tenneco presents the above reconciliation of revenues in order to reflect EBITDA and adjusted EBITDA as a percent of both total revenues and value-add revenues. Substrate sales include precious
metals pricing, which may be volatile. Substrate sales occur when, at the direction of its OE customers, Tenneco purchases catalytic converters or components thereof from suppliers, uses them in its
manufacturing processes and sells them as part of the completed system. While Tenneco original equipment customers assume the risk of this volatility, it impacts reported revenue. Excluding substrate
sales removes this impact. Further, presenting EBITDA and adjusted EBITDA as a percent of value-add revenue assists investors in evaluating the company's operational performance without the impact
of such substrate sales. See prior pages for a discussion of EBITDA and adjusted EBITDA.
Global Segments

ATTACHMENT 2
Substrate Value-add Substrate Value-add Substrate Value-add Substrate Value-add Substrate Value-add
Revenues Sales Revenues Revenues Sales Revenues Revenues Sales Revenues Revenues Sales Revenues Revenues Sales Revenues
Clean Air 319$ 115$ 204$ 300$ 110$ 190$ 271$ 99$ 172$ 277$ 115$ 162$ 1,167$ 439$ 728$
Powertrain 426 - 426 401 - 401 385 - 385 379 - 379 1,591 - 1,591
Ride Performance 150 - 150 136 - 136 127 - 127 111 - 111 524 - 524
Total Tenneco Inc. 895$ 115$ 780$ 837$ 110$ 727$ 783$ 99$ 684$ 767$ 115$ 652$ 3,282$ 439$ 2,843$
Substrate Value-add Substrate Value-add Substrate Value-add Substrate Value-add Substrate Value-add
Revenues Sales Revenues Revenues Sales Revenues Revenues Sales Revenues Revenues Sales Revenues Revenues Sales Revenues
Clean Air 307$ 109$ 198$ 290$ 101$ 189$ 273$ 98$ 175$ 273$ 100$ 173$ 1,143$ 408$ 735$
Powertrain - - - - - - - - - 420 - 420 420 - 420
Ride Performance 69 - 69 69 - 69 67 - 67 111 - 111 316 - 316
Total Tenneco Inc. 376$ 109$ 267$ 359$ 101$ 258$ 340$ 98$ 242$ 804$ 100$ 704$ 1,879$ 408$ 1,471$
(1) U.S. Generally Accepted Accounting Principles.
(2) Tenneco presents the above reconciliation of revenues in order to reflect value-add revenues separately from substrate sales which include precious metals pricing, which may be volatile. Substrate sales occur when, at the direction of its OE
customers, Tenneco purchases catalytic converters or components thereof from suppliers, uses them in its manufacturing processes and sells them as part of the completed system. While Tenneco original equipment customers assume the risk of this
volatility, it impacts reported revenue. Excluding substrate sales removes this impact. Tenneco uses this information to analyze the trend in revenues before these factors. Tenneco believes investors find this information useful in understanding period
to period comparisons in the company's revenues.
YTD
YTD
2019
2018
TENNECO INC.
RECONCILIATION OF GAAP (1)
REVENUE TO NON-GAAP REVENUE MEASURES (2)
- Original equipment commercial truck, off-highway, industrial and other revenues
Unaudited
(Millions)
Q2 Q3
Q1 Q2 Q3
Q1
Q4
Q4

ATTACHMENT 2
Clean Air Powertrain
Corporate -
New
Tenneco
New
Tenneco Motorparts
Ride
Performance
Corporate -
DRiV DRiV Other/Elim
Total Pro
forma
Tenneco
Net sales and operating revenues 1,756$ 1,260$ -$ 3,016$ 903$ 761$ -$ 1,664$ -$ 4,680$
Less: Substrate sales 652 - - 652 - - - - - 652
Value-add revenues (3)
1,104 1,260 - 2,364 903 761 - 1,664 - 4,028
EBIT, Earnings (Loss) before interest expense, income taxes and noncontrolling interests 119 60 - 179 96 (18) - 78 (51) 206
Depreciation and amortization 37 61 - 98 24 38 - 62 - 160
Total EBITDA including noncontrolling interests (4)
156 121 - 277 120 20 - 140 (51) 366
Financing charges on sale of receivables reclass 1 1 1 3 5 - - 5 - 8
Segment change impact 2 12 (16) (2) (19) 17 (32) (34) 36 -
Total EBITDA including noncontrolling interests after reclass and segment change (4)
159 134 (15) 278 106 37 (32) 111 (15) 374
Adjustments:
Restructuring and related expenses 1 - - 1 2 7 - 9 - 10
Cost reduction initiatives - - - - - 2 - 2 - 2
Acquisition and separation costs - - - - - - - - 13 13
Warranty charge - - - - - 5 - 5 - 5
Purchase price contingency - 5 - 5 - - - - - 5
Transaction related costs - - - - - - - - 1 1
Other - 1 - 1 - - - - 1 2
Adjusted EBITDA (5)
160$ 140$ (15)$ 285$ 108$ 51$ (32)$ 127$ -$ 412$
Adjusted EBITDA as a percent of value-add revenue (6)
14.5% 11.1% 12.1% 12.0% 6.7% 7.6% 10.2%
Clean Air Powertrain
Corporate -
New
Tenneco
New
Tenneco Motorparts
Ride
Performance
Corporate -
DRiV DRiV Other/Elim
Total Pro
forma
Tenneco
Net sales and operating revenues 1,694$ 1,243$ -$ 2,937$ 930$ 753$ -$ 1,683$ -$ 4,620$
Less: Substrate sales 621 - - 621 - - - - - 621
Value-add revenues (3)
1,073 1,243 - 2,316 930 753 - 1,683 - 3,999
EBIT, Earnings (Loss) before interest expense, income taxes and noncontrolling interests 103 70 - 173 109 (19) - 90 (65) 198
Depreciation and amortization 39 61 - 100 21 34 - 55 1 156
Total EBITDA including noncontrolling interests (4)
142 131 - 273 130 15 - 145 (64) 354
Financing charges on sale of receivables reclass - - 1 1 5 - - 5 - 6
Segment change impact 3 13 (16) - (17) 14 (24) (27) 27 -
Total EBITDA including noncontrolling interests after reclass and segment change (4)
145 144 (15) 274 118 29 (24) 123 (37) 360
Adjustments:
Restructuring and related expenses 11 1 - 12 1 10 - 11 - 23
Cost reduction initiatives - - - - - 8 - 8 - 8
Acquisition and separation costs - - - - - - - - 18 18
Costs to achieve synergies 6 - - 6 1 - - 1 2 9
Environmental charge - - - - - - - - 4 4
Transaction related costs - - - - - - - - 13 13
Cost to exit a multiemployer pension plan - 5 - 5 - - - - - 5
Other - (2) - (2) 5 (1) - 4 - 2
Adjusted EBITDA (5)
162$ 148$ (15)$ 295$ 125$ 46$ (24)$ 147$ -$ 442$
Adjusted EBITDA as a percent of value-add revenue (6)
15.1% 11.9% 12.7% 13.4% 6.1% 8.7% 11.1%
Clean Air Powertrain
Corporate -
New
Tenneco
New
Tenneco Motorparts
Ride
Performance
Corporate -
DRiV DRiV Other/Elim
Total Pro
forma
Tenneco
Net sales and operating revenues 1,602$ 1,122$ -$ 2,724$ 867$ 690$ -$ 1,557$ -$ 4,281$
Less: Substrate sales 596 - - 596 - - - - - 596
Value-add revenues (3)
1,006 1,122 - 2,128 867 690 - 1,557 - 3,685
EBIT, Earnings (Loss) before interest expense, income taxes and noncontrolling interests 105 21 - 126 102 28 - 130 (51) 205
Depreciation and amortization 38 62 - 100 22 35 - 57 2 159
Total EBITDA including noncontrolling interests (4)
143 83 - 226 124 63 - 187 (49) 364
Financing charges on sale of receivables reclass 1 1 1 3 5 - - 5 - 8
Segment change impact 4 13 (18) (1) (16) 16 (28) (28) 29 -
Total EBITDA including noncontrolling interests after reclass and segment change (4)
148 97 (17) 228 113 79 (28) 164 (20) 372
Adjustments:
Restructuring and related expenses 1 8 - 9 8 10 - 18 - 27
Acquisition and separation costs - - - - - - - - 12 12
Costs to achieve synergies - - - - - 1 - 1 3 4
Litigation settlement accrual - - - - - 9 - 9 1 10
Gain (loss) on sale of assets - - - - - (65) - (65) - (65)
Charge for extinguishment of dissenting shareholders shares - - - - - - - - 5 5
Other - 4 - 4 (3) 1 - (2) (1) 1
Adjusted EBITDA (5)
149$ 109$ (17)$ 241$ 118$ 35$ (28)$ 125$ -$ 366$
Adjusted EBITDA as a percent of value-add revenue (6)
14.8% 9.7% 11.3% 13.6% 5.1% 8.0% 9.9%
Clean Air Powertrain
Corporate -
New
Tenneco
New
Tenneco Motorparts
Ride
Performance
Corporate -
DRiV DRiV Other/Elim
Total Pro
forma
Tenneco
Net sales and operating revenues 1,655$ 1,112$ -$ 2,767$ 827$ 684$ -$ 1,511$ -$ 4,278$
Less: Substrate sales 631 - - 631 - - - - - 631
Value-add revenues (3)
1,024 1,112 - 2,136 827 684 - 1,511 - 3,647
EBIT, Earnings (Loss) before interest expense, income taxes and noncontrolling interests 116 33 - 149 (31) (47) - (78) (102) (31)
Depreciation and amortization 40 59 - 99 29 37 - 66 - 165
Total EBITDA including noncontrolling interests (4)
156 92 - 248 (2) (10) - (12) (102) 134
Financing charges on sale of receivables reclass - - 1 1 6 1 - 7 - 8
Segment change impact 3 1 (4) - (17) 12 (19) (24) 24 -
Total EBITDA including noncontrolling interests after reclass and segment change (4)
159 93 (3) 249 (13) 3 (19) (29) (78) 142
Adjustments:
Restructuring and related expenses (2) (2) - (4) 2 19 - 21 - 17
Cost reduction initiatives - - - - - - - - 8 8
Acquisition and separation costs - - - - - - - - 53 53
Costs to achieve synergies (3) - - (3) 35 10 - 45 7 49
Purchase accounting adjustments - 44 - 44 57 5 - 62 - 106
Anti-dumping duty charge - - - - 16 - - 16 - 16
Loss on debt modification - - - - - - - - 10 10
Pension charges - - - - - 3 - 3 - 3
Goodwill impairment charge - - - - - 3 - 3 - 3
Adjusted EBITDA (5)
154$ 135$ (3)$ 286$ 97$ 43$ (19)$ 121$ -$ 407$
Adjusted EBITDA as a percent of value-add revenue (6)
15.0% 12.1% 13.4% 11.7% 6.3% 8.0% 11.2%
Pro forma New Tenneco Pro forma DRiV
TENNECO INC.
RECONCILIATION OF GAAP (1)
REVENUE TO PRO FORMA (2)
REVENUE AND NON-GAAP EARNINGS MEASURES - 2018 Quarterly
Unaudited
(Millions except percents)
Q1 2018
Q2 2018
Pro forma New Tenneco Pro forma DRiV
Q3 2018
Pro forma New Tenneco Pro forma DRiV
(4) EBITDA including noncontrolling interests represents income before interest expense, income taxes, noncontrolling interests and depreciation and amortization. We have also presented EBITDA including noncontrolling interests to give
effect to the reclassification of financing charges on sale of receivables that took place in the first quarter 2019 and to give effective to the impact of the segment changes that occurred in the first quarter of 2019. EBITDA including noncontrolling
interests is not a calculation based upon GAAP. The amounts included in the EBITDA including noncontrolling interests calculation, however, are derived from amounts included in the historical statements of income data. In addition, EBITDA
including noncontrolling interests should not be considered as an alternative to net income (loss) attributable to Tenneco Inc. or operating income as an indicator of the company's operating performance, or as an alternative to operating cash
flows as a measure of liquidity. Tenneco has presented EBITDA including noncontrolling interests because it regularly reviews EBITDA including noncontrolling interests as a measure of the company's performance. In addition, Tenneco
believes its investors utilize and analyze the company's EBITDA including noncontrolling interests for similar purposes. Tenneco also believes EBITDA including noncontrolling interests assists investors in comparing a company's performance
on a consistent basis without regard to depreciation and amortization, which can vary significantly depending upon many factors. However, the EBITDA including noncontrolling interests measure presented may not always be comparable to
similarly titled measures reported by other companies due to differences in the components of the calculation.
(5) “Adjusted EBITDA” is EBITDA including noncontrolling interests (after giving effect to the reclassification and segment change described above) and is presented in order to reflect the results in a manner that allows a better understanding of
operational activities separate from the financial impact of decisions made for the long term benefit of the company and other items impacting comparability between the periods. Similar adjustments to EBITDA including noncontrolling interests
have been recorded in earlier periods, and similar types of adjustments can reasonably be expected to be recorded in future periods. The company believes investors find the non-GAAP information helpful in understanding the ongoing
performance of operations separate from items that may have a disproportionate positive or negative impact on the company's financial results in any particular period.
(6) Tenneco presents the above reconciliation in order to reflect Adjusted EBITDA as a percent of both value-add revenues. Presenting Adjusted EBITDA as a percent of value-add revenue assists investors in evaluating the company's
operational performance without the impact of substrate sales, which can be volatile.
Q4 2018
Pro forma New Tenneco Pro forma DRiV
(1) U.S. Generally Accepted Accounting Principles.
(2) Tenneco presents pro forma revenues and earnings measures to show what the company’s performance would have been had Federal-Mogul been consolidated with Tenneco for each quarter of 2018. We believe this supplemental
information is useful to investors who are trying to understand the results of the entire enterprise, including Federal-Mogul. The Motorparts segment reflects the company’s historical Aftermarket segment plus the Motorparts aftermarket
business acquired in the Federal-Mogul acquisition. The Ride Performance segment reflects the company’s historical Ride Performance segment plus the Motorparts OE business acquired in the Federal-Mogul acquisition.
(3) Tenneco presents the above reconciliation of revenues in order to reflect value-add revenues separately from substrate sales. Substrate sales include precious metals pricing, which may be volatile. Substrate sales occur when, at the
direction of its OE customers, Tenneco purchases catalytic converters or components thereof from suppliers, uses them in its manufacturing processes and sells them as part of the completed system. While Tenneco original equipment
customers assume the risk of this volatility, it impacts reported revenue. Excluding substrate sales removes this impact. Tenneco uses this information to analyze the trend in revenues before these factors. Tenneco believes investors find this
information useful in understanding period to period comparisons in the company's revenues.

ATTACHMENT 2
Clean Air Powertrain
Corporate -
New
Tenneco
New
Tenneco Motorparts
Ride
Performance
Corporate -
DRiV DRiV Other/Elim
Total Pro
forma
Tenneco
Net sales and operating revenues 6,707$ 4,737$ -$ 11,444$ 3,527$ 2,888$ -$ 6,415$ -$ 17,859$
Less: Substrate sales 2,500 - - 2,500 - - - - - 2,500
Value-add revenues (3)
4,207 4,737 - 8,944 3,527 2,888 - 6,415 - 15,359
EBIT, Earnings (Loss) before interest expense, income taxes and noncontrolling interests 443 184 - 627 276 (56) - 220 (269) 578
Depreciation and amortization 154 243 - 397 96 144 - 240 3 640
Total EBITDA including noncontrolling interests (4)
597 427 - 1,024 372 88 - 460 (266) 1,218
Financing charges on sale of receivables reclass 2 2 4 8 21 1 - 22 - 30
Segment change impact 12 39 (54) (3) (69) 59 (103) (113) 116 -
Total EBITDA including noncontrolling interests after reclass and segment change (4)
611 468 (50) 1,029 324 148 (103) 369 (150) 1,248
Adjustments:
Restructuring and related expenses 11 7 - 18 13 46 - 59 - 77
Cost reduction initiatives - - - - - 10 - 10 8 18
Acquisition and separation costs - - - - - - - - 96 96
Costs to achieve synergies 3 - - 3 36 11 - 47 12 62
Purchase accounting adjustments - 44 - 44 57 5 - 62 - 106
Anti-dumping duty charge - - - - 16 - - 16 - 16
Environmental charge - - - - - - - - 4 4
Warranty charge - - - - - 5 - 5 - 5
Litigation settlement accrual - - - - - 9 - 9 1 10
Loss on debt modification - - - - - - - - 10 10
Pension charges - - - - - 3 - 3 - 3
Goodwill impairment charge - - - - - 3 - 3 - 3
Purchase price contingency - 5 - 5 - - - - - 5
Transaction related costs - - - - - - - - 14 14
Cost to exit a multiemployer pension plan - 5 - 5 - - - - - 5
Gain (loss) on sale of assets - - - - - (65) - (65) - (65)
Charge for extinguishment of dissenting shareholders shares - - - - - - - - 5 5
Other - 3 - 3 2 - - 2 - 5
Adjusted EBITDA (5)
625$ 532$ (50)$ 1,107$ 448$ 175$ (103)$ 520$ -$ 1,627$
Adjusted EBITDA as a percent of value-add revenue (6)
14.9% 11.2% 12.4% 12.7% 6.1% 8.1% 10.6%
Clean Air Powertrain
Corporate -
New
Tenneco
New
Tenneco Motorparts
Ride
Performance
Corporate -
DRiV DRiV Other/Elim
Total Pro
forma
Tenneco
Net sales and operating revenues 6,216$ 4,573$ -$ 10,789$ 3,678$ 2,686$ -$ 6,364$ -$ 17,153$
Less: Substrate sales 2,187 - - 2,187 - - - - - 2,187
Value-add revenues (3)
4,029 4,573 - 8,602 3,678 2,686 - 6,364 - 14,966
EBIT, Earnings (Loss) before interest expense, income taxes and noncontrolling interests 420 234 - 654 394 (42) - 352 (272) 734
Depreciation and amortization 142 254 - 396 92 132 - 224 4 624
Total EBITDA including noncontrolling interests (4)
562 488 - 1,050 486 90 - 576 (268) 1,358
Financing charges on sale of receivables reclass 2 2 - 4 16 1 - 17 - 21
Segment change impact 7 54 (71) (10) (67) 75 (114) (106) 116 -
Total EBITDA including noncontrolling interests after reclass and segment change (4)
571 544 (71) 1,044 435 166 (114) 487 (152) 1,379
Adjustments:
Restructuring and related expenses 23 16 - 39 21 23 - 44 1 84
Cost reduction initiatives 4 - - 4 3 12 - 15 3 22
Loss on debt modification - - - - - - - - 5 5
Pension charges / Stock vesting - - - - - - - - 13 13
Goodwill impairment charge - 11 - 11 4 7 - 11 - 22
Antitrust settlement accrual - - - - - - - - 132 132
Warranty settlement - - - - - 7 - 7 - 7
Gain on sale of unconsolidated JV - - - - - - - - (5) (5)
Gain from termination of customer contract - - - - - (6) - (6) - (6)
Warranty release - - - - (4) - - (4) - (4)
Release of deferred purchase price payment - - - - - (3) - (3) - (3)
EBITDA contribution of pending asset sales - (2) - (2) - - - - - (2)
Transaction related costs - 3 - 3 1 - - 1 3 7
Gain (loss) on sale of business - (3) - (3) - - - - - (3)
Gain (loss) on sale of nonconsolidated affiliates - - - - 2 - - 2 - 2
Gain (loss) on sale of assets - (6) - (6) - (1) - (1) - (7)
Adjusted EBITDA (5)
598$ 563$ (71)$ 1,090$ 462$ 205$ (114)$ 553$ -$ 1,643$
Adjusted EBITDA as a percent of value-add revenue (6)
14.8% 12.3% 12.7% 12.6% 7.6% 8.7% 11.0%
Pro forma New Tenneco Pro forma DRiV
TENNECO INC.
RECONCILIATION OF GAAP (1)
REVENUE TO PRO FORMA (2)
REVENUE AND NON-GAAP EARNINGS MEASURES - 2018 and 2017 Annual
Unaudited
(Millions except percents)
FY 2018
(4) EBITDA including noncontrolling interests represents income before interest expense, income taxes, noncontrolling interests and depreciation and amortization. We have also presented EBITDA including noncontrolling interests to give effect to
the reclassification of financing charges on sale of receivables that took place in the first quarter 2019 and to give effective to the impact of the segment changes that occurred in the first quarter of 2019. EBITDA including noncontrolling interests is
not a calculation based upon GAAP. The amounts included in the EBITDA including noncontrolling interests calculation, however, are derived from amounts included in the historical statements of income data. In addition, EBITDA including
noncontrolling interests should not be considered as an alternative to net income (loss) attributable to Tenneco Inc. or operating income as an indicator of the company's operating performance, or as an alternative to operating cash flows as a
measure of liquidity. Tenneco has presented EBITDA including noncontrolling interests because it regularly reviews EBITDA including noncontrolling interests as a measure of the company's performance. In addition, Tenneco believes its investors
utilize and analyze the company's EBITDA including noncontrolling interests for similar purposes. Tenneco also believes EBITDA including noncontrolling interests assists investors in comparing a company's performance on a consistent basis
without regard to depreciation and amortization, which can vary significantly depending upon many factors. However, the EBITDA including noncontrolling interests measure presented may not always be comparable to similarly titled measures
reported by other companies due to differences in the components of the calculation.
(5) “Adjusted EBITDA” is EBITDA including noncontrolling interests (after giving effect to the reclassification and segment change described above) and is presented in order to reflect the results in a manner that allows a better understanding of
operational activities separate from the financial impact of decisions made for the long term benefit of the company and other items impacting comparability between the periods. Similar adjustments to EBITDA including noncontrolling interests
have been recorded in earlier periods, and similar types of adjustments can reasonably be expected to be recorded in future periods. The company believes investors find the non-GAAP information helpful in understanding the ongoing performance
of operations separate from items that may have a disproportionate positive or negative impact on the company's financial results in any particular period.
(6) Tenneco presents the above reconciliation in order to reflect Adjusted EBITDA as a percent of both value-add revenues. Presenting Adjusted EBITDA as a percent of value-add revenue assists investors in evaluating the company's operational
performance without the impact of substrate sales, which can be volatile.
FY 2017
Pro forma New Tenneco Pro forma DRiV
(1) U.S. Generally Accepted Accounting Principles.
(2) Tenneco presents pro forma revenues and earnings measures to show what the company’s performance would have been had Federal-Mogul been consolidated with Tenneco for the entirety of 2017 and 2018. We believe this supplemental
information is useful to investors who are trying to understand the results of the entire enterprise, including Federal-Mogul. The Motorparts segment reflects the company’s historical Aftermarket segment plus the Motorparts aftermarket business
acquired in the Federal-Mogul acquisition. The Ride Performance segment reflects the company’s historical Ride Performance segment plus the Motorparts OE business acquired in the Federal-Mogul acquisition.
(3) Tenneco presents the above reconciliation of revenues in order to reflect value-add revenues separately from substrate sales. Substrate sales include precious metals pricing, which may be volatile. Substrate sales occur when, at the direction
of its OE customers, Tenneco purchases catalytic converters or components thereof from suppliers, uses them in its manufacturing processes and sells them as part of the completed system. While Tenneco original equipment customers assume
the risk of this volatility, it impacts reported revenue. Excluding substrate sales removes this impact. Tenneco uses this information to analyze the trend in revenues before these factors. Tenneco believes investors find this information useful in
understanding period to period comparisons in the company's revenues.

ATTACHMENT 2
New Tenneco 2020 Outlook
VA Revenue $8.05 billion to $8.3 billion
Adjusted EBITDA between $850 million to $915 million
DRiV™ 2020 Outlook
Revenue $5.65 billion to $5.8 billion
Adjusted EBITDA between $450 million to $535 million
TENNECO INC.
Division Level FY 2020 Outlook
Unaudited