Embed Size (px)
Citation preview

July � December 2006 ONLY
NewShoes Student Manual © 2006 Interpretive Software, Inc.
Introduction...................................................................................................................................... 1
The Athletic Shoe Industry ................................................................................................. 1 Marketing and NewShoes ................................................................................................... 2 Getting Started with NewShoes .......................................................................................... 5 Structure of the NewSHOES Manual ................................................................................. 7
Section 1: The NewShoes Case � Current Situation....................................................................... 9 NewShoes Decisions......................................................................................................... 10
Distribution .......................................................................................................... 10 Product ................................................................................................................. 11 Price and Cost ...................................................................................................... 12 Promotion ............................................................................................................ 14 Contract Bids ....................................................................................................... 15 Market Research .................................................................................................. 15 Summary of Decision Variables .......................................................................... 16
Obtaining Results for a Period of NewShoes Competition............................................... 17 Section 2: NewShoes Operations Guide ....................................................................................... 19
Getting Started and Login................................................................................................. 19 Detail of Menu Choices .................................................................................................... 21
Documentation..................................................................................................... 22 Market Data ......................................................................................................... 23 Enter Decisions .................................................................................................... 25 Decision Aids....................................................................................................... 27
Section 3: Strategy and Tactics..................................................................................................... 33 Strategic Planning in General ........................................................................................... 33 Decision-Making Process ................................................................................................. 33 Models as Decision Aids .................................................................................................. 35 Types of Decisions and Response Functions.................................................................... 36
Section 4: Decision Aids and Assignments .................................................................................. 39 Overall Income Statement................................................................................................. 40 Income Statement by Region ............................................................................................ 43 Return on Sales ................................................................................................................. 46 Market Share Calculations................................................................................................ 47 Breakeven Analysis .......................................................................................................... 48 Bid Analysis...................................................................................................................... 50 Estimating Response Functions ........................................................................................ 53 Strategic Planning ............................................................................................................. 57 Forecasting........................................................................................................................ 57 Brand Name Selection ...................................................................................................... 58 Advertising Development ................................................................................................. 59 Market Research and Other NewShoes Assignments....................................................... 59
Appendix A: Regional Market Descriptions................................................................................. 61 Appendix B: NewShoes Forms and Assignments ........................................................................ 63 Appendix C: NewShoes Glossary of Terms ................................................................................. 85 NewShoes Index ............................................................................................................................ 87


July � December 2006 ONLY
Introduction The Athletic Shoe Industry
The athletic shoe industry is a dynamic and exciting industry with sales of over $30 billion worldwide. Although initial increases in product demand were fueled by health and physical fitness trends, now athletic shoes are common and designed to meet many different consumer needs.
When the jogging and fitness craze began in the mid-1970s, athletic shoe manufacturers were dubbed �Adidas and the Seven Dwarfs� because of the success of West Germany's Adidas company. But the early dominance of Adidas was no guarantee of future success. In the mid-1970s, Adidas not only underestimated the amount of growth that was about to occur in the athletic shoe market but also the aggressiveness of other manufacturers, such as Nike in the United States.
The rise of Nike in the athletic shoe industry is a Cinderella story. A university runner (Phil Knight) and his former coach (Bill Bowerman of the University of Oregon) went into business distributing Japan's Tiger running shoes in the United States. In 1971, they developed their own shoe and named it Nike. Fiddling with a waffle iron and some urethane rubber led Bowerman to develop the �Waffle� sole. This product improvement gave Nike its initial impetus. On the marketing side, the now famous "swoosh" trademark on the shoes was developed by an art student at a cost to the company of a mere $35!
Nike experienced phenomenal sales growth from $14 million in 1976 to $920 million in 1984. Although Adidas remained �number one� outside the United States, fast-rising Nike dominated the domestic market by the early 1980s. In the mid-1980s, Nike had several problems to contend with, including a peak in demand in the athletic shoe industry, quality control difficulties, and a loose and a paternalistic management style that appeared inadequate for a billion-dollar firm. As Nike faltered, a new player, Reebok, surged.
Beginning its life in the United States as a subsidiary of a British firm, Reebok became a publicly held firm that now owns its former parent. Reebok's revenues zoomed from $4 million
Introduction - Page 1

in 1982 to $900 million in 1986. Although Nike lost its position as number one in market share to Reebok in 1986, it regained it through astute changes in its management style, improved marketing strategies, and product development. During the 90's, Adidas dropped to fifth place in United States market share. But ever the competitor, Adidas has come back and now battles with Reebok for the number two market share position, behind Nike.
Other competitors also entered the scene, such as L.A. Gear, whose sales skyrocketed in the early 1990s driven by a focus on fashion athletic footwear. In the late 90's, Italian-based Fila surged to third place behind Nike and Reebok in United States athletic shoe sales. New Balance has also done well, pulling into the number four market share position on occasion, focusing on serious athletes and unique products that come in varying widths. Keds, Skechers, Asics, and Converse brands play more niche roles, but make the market interesting and competitive. Today, the athletic shoe industry in the United States generates approximately $15 billion at retail annually, whereas worldwide sales are approximately double that number.
As can be seen in this brief history of the athletic shoe industry, it is a competitive market with changing market trends and fads that result in a dynamic business environment. The NewShoes simulation will allow you to experience this same competition, excitement, and dynamism. Now You're in Charge! You have just been hired as the new marketing management team for your company. Remember you are part of a team. To achieve success in the world of NewShoes, every member of the team must contribute expertise, knowledge, and ideas. Every member of the management team has specific skills and special knowledge that will contribute to the overall success of the team. Marketing and NewShoes
Marketers operate and make decisions on the boundary between the organization for which they work and the market they are trying to serve. They work as facilitators of exchange between their organization and its customers or clients. These exchanges can be for consumer products, which are products that end users use for personal non-business purposes, and/or industrial products, which are products that organizations use for resale, as components for manufacturing, or as items needed to conduct their business. The products involved in these exchanges can either be goods or services. Goods are tangible items that can be seen and felt. Services are more intangible than goods and include such things as professional services (legal, medical, etc.) and completely intangible items like ideas (using seatbelts, quitting smoking, etc.). Often, services and goods can be bundled together, such as the parts and service involved in an automobile repair. The exchanges marketers facilitate can be pursued by for-profit or non-profit organizations. Marketing concepts apply and marketing decisions are made in each of these
NewShoes User�s Manual - Page 2

July � December 2006 ONLY
exchange situations. Figure 1.1 displays the various categories of organization activity to which marketing applies and the various combinations possible of these activities.
Figure 1.1: Marketing Application Matrix.
Intangible
Tangible
Profit Non-profit Consumer Industrial
In the world of NewShoes you will apply marketing concepts and make marketing decisions for a profit-seeking organization selling a tangible good (athletic shoes) to the consumer market. Some industrial sales of your athletic shoes may be possible at later stages in the competition. While you are competing in NewShoes, consider the application of the concepts you are using and the decisions you are making to the other categories of exchanges to which marketing applies, as presented in Figure 1.1.
Marketing decisions are generally made in four broad areas known as the marketing mix or the "4Ps". The marketing mix involves decisions dealing with product, price, promotion, and place (distribution). In NewShoes you will be making decisions for each of these components of the marketing mix as you manage your company.
Product. You are employees of an athletic shoe company that sells one basic shoe. This is your only product. The decision you face regarding the product, as a member of a NewShoes company team, is how much your firm should invest in new product development.
Price. You must establish a selling price to the consumer for your athletic shoes. As will be seen under �Distribution,� this decision must be made and might vary for each of the regions in which you operate.
Introduction - Page 3

Promotion. In NewShoes, several decisions need to be made regarding promotion. With regard to promotions aimed at consumers you must decide how much to invest in consumer advertising and consumer sales promotions (cents-off coupons, sweepstakes, etc.). With regard to promotions aimed at distributors of athletic shoes, you must decide how many salespeople you wish to employ as well as how much to invest in dealer sales promotions (quantity discounts, display assistance, etc.). All four of these promotion decisions must be made and might vary for each market region in which you operate.
Place (distribution). You must decide in which of three markets (home, domestic, and/or foreign) you wish to sell your athletic shoes. Decisions regarding prices and promotions must be made separately for each region in which you choose to do business. New product development investment is made for the company in general and is not specific to a region.
Along with the decisions in the four major marketing decision areas discussed above, NewShoes gives you experience in collecting market research, which is a vital function of the effective marketing manager. You can purchase this information, which consists of several industry-wide averages (price, number of salespeople, etc.). These industry-wide averages can be purchased for any or all of the three available markets (home, domestic, and/or foreign). Working with several basic business decision aids is also part of NewShoes.
The final decision you will face as a NewShoes manager deals with industrial sales. At the discretion of the NewShoes simulation administrator, price bids will be sought from the competing NewShoes companies for sales of large quantities of shoes to a major retailer. The decision you face is: �Should we bid on the contract?� and if �yes,� �How much should our bid be?�
This has been a brief overview of what you and your team will experience in the world of NewShoes. Even though NewShoes is a simplification of reality, it offers an excellent chance to make marketing decisions and to experience the exhilaration of competition in the marketplace. Consider the simulation an opportunity to apply the marketing concepts you have studied or will study this term. Thoughtful decisions will go far to achieving success in NewShoes. As is true in the real business world, luck can also play a role in business success. But as is also true in the real business world, relying solely on luck and not sound business decisions is a high-risk strategy.
Good Luck!
NewShoes User�s Manual - Page 4

July � December 2006 ONLY
Getting Started with NewShoes In order to benefit most from the NewShoes experience, we recommend the following approach:
Read the NewShoes Case
Section 1 of this manual presents a description of the market and the industry�s current situation. A thorough understanding of the your company, potential markets, and decision variables will help your group decision-making process.
Section 2 (Operations Guide) provides information on how to use the simulation, as well as a detailed description of each menu option. In order to quickly learn the functions of the menu commands and become familiar with operating the program, it will be helpful to have access to your simulation game as you work through this section.
Learn How to Operate the Program
Use Reports to Analyze the Current Situation
Reports on your company, market, and competitors are available by clicking on links on the left side of the web browser window under �Market Data�. Additional reports and tools are available from the �Decision Aids� menu and provide information on income, market share, sales and product development. All of these menu choices provide information about industry performance, product development, sales, pricing, distribution, marketing, and customer satisfaction. From this information, you will devise and implement an appropriate marketing plan. Just as in real life, however, some information and reports will prove more useful than others. Part of your decision process will include deciding which information is most useful to your firm.
After reviewing information about your company and the market, you will decide how to manage your firm in terms of price, promotion, distribution, and product development. Make sure you allow sufficient time to analyze your resources thoroughly and make well-planned decisions. This process requires an average of 2 hours each period, although your team should allow extra time at first to get acclimated to the simulation.
Make Decisions
Introduction - Page 5

Use the Decision Aids menu options to run a financial check on your input decisions. These options include a breakeven analysis and cost of goods sold calculation based on your assumptions. Once you have reviewed these Decision Aids, you may want to go back and change some of your decisions.
Use the Decision Aids
Advance to the Next Period
Decisions are always saved to the web, so once you are satisfied with your decisions, you are done.
Your simulation administrator will use your decisions along with those of your competitors to advance the simulation to the next year. He or she will then update the website, and your firm will have access to the updated results.
Once the simulation has been advanced, just login again to view the updated results. Review the results in the market before making decisions for the next year. The simulation does not specifically tell which strategies worked and which did not. Instead, you must compare your results with those of the entire industry and consider how well your strategy is working.
Review Results
Repeat the decision-making process until all periods have been completed. At the end of the simulation, you will be able to see how your firm performed over the entire game.
Repeat
You may find it helpful to print out some reports and step back from the computer from time to time. Analyzing information and determining an integrated business plan is a complex task. It is important to take time and reflect on the information, especially when working in groups. You may also find it useful to refer to sections 3 and 4 of the manual to help design a framework for analyzing the environment and making decisions. For many of you, using NewShoes will be a unique learning experience. From the simulation, you will gain a practical understanding of business strategy and how various factors interact and affect one another in a marketing organization. By analyzing information, making decisions, and observing the results, you will experience first-hand the challenges and rewards of strategic marketing.
NewShoes User�s Manual - Page 6

July � December 2006 ONLY
The NewShoes Student Manual The remainder of this manual is divided into the sections described below. Understanding and success in NewShoes will be greatly enhanced by reading this manual before you begin the simulation. The sections listed below will answer most of the questions students typically have during the simulation experience, and reading them have the added benefit of improving your competitiveness. Finally, most of this documentation is also available on-line in the simulation web-browser software. Section 1, �The NewShoes Case -- Current Situation,� provides details of the decision variables that you will set over the course of the experience. A summary table of all the decisions you will face in NewShoes is also included. You may also wish to refer back to the Introduction, which contains the overview of the simulation and a brief history of the athletic shoe industry. Section 2, �NewShoes Operations Guide,� describes the NewShoes web software, including decision entry and the browser interface. This section also provides details on using the on-line decision aids. Section 3, �Strategy and Tactics,� presents a general discussion of how to make decisions, the strategic planning process, and an introduction on how to analyze the effectiveness of different decisions variables. Section 4, �Decision Aids and Assignments,� explains the NewShoes decision aids and assignments, including operating details of the worksheets and reports that are found in the NewShoes web software. This section provides more detailed approaches that support the theory described in earlier sections. Appendix A provides copies of the NewShoes decision aids/assignments. Please feel free to make copies of these forms for use throughout the competition. The Participant Evaluation form at the end of this appendix allows you to assess the contribution to the activities of your company of each team member. Appendix B is a glossary of marketing terms that are used in the simulation.
Introduction - Page 7

NewShoes User�s Manual - Page 8

July � December 2006 ONLY
Section 1: The NewShoes Case � Current Situation The previous marketing management team for your NewShoes firm was unable to generate much success in the marketplace. In period 1, the management team lost almost $2.5 million, and though performance improved in period 2 to a loss of $500 thousand, your parent company decided that anyone with even basic marketing knowledge could do a better job than they did. So they gave you the opportunity! Your team takes charge of the company starting with Period 3. A "period" in the world of NewShoes can be viewed as a month or quarter of operations. It is simply a period of company operation and of competition with the other NewShoes company teams. Detailed results for the first two periods are shown in the table below: Table 1.1: Periods 1 & 2 Results. Period 1 Home Region Domestic Region Foreign Region Price $90.00 Did Not Enter Did Not Enter Consumer Advertising $1,000,000 Consumer Sales Promotion $2,000,000 Personal Selling (5) $400,000 (# of Salespeople X $80,000) Dealer Sales Promotions $1,000,000 Product Development $800,000 Contractor Bid None Profit -$2,404,180 Sales Home Region (Units) 102,000 Cost of Goods (per unit) $62.59 Total Revenue (TR) (units sold X selling price in each region) = $9,180,000 Total Expenditures (TE) (all expenses in all regions) = $5,200,000 Total Cost of Goods (TCOG) (all units sold X cost of goods) = $6,384,180 TR � (TE + TCOG) = Profit or Loss Period 1 Loss = -$2,404,180 Period 2 Home Region Domestic Region Foreign Region Price $110.00 $90.00 Did Not Enter Consumer Advertising $1,500,000 $2,000,000 Consumer Sales Promotion $2,500,000 $1,500,000 Personal Selling (7) $560,000 (7) $560,000 (# of Salespeople X $80,000) Dealer Sales Promotions $1,200,000 $1,000,000 Product Development $900,000 Contractor Bid None Sales Home Region (Units) 67,600 Sales Domestic Region (Units) 130,400 Cost of Goods (per unit) $40.00 Total Revenue (TR) (units sold X selling price in each region) = $19,172,000 Total Expenditures (TE) (all expenses in all regions) = $11,720,000 Total Cost of Goods (TCOG) (all units sold X cost of goods) = $7,920,000 TR � (TE + TCOG) = Profit or Loss Period 2 Loss = -$468,000
New Shoes Operations Guide - Page 9
As the new management team of a NewShoes company, several challenging decisions demand immediate attention. First, your parent company expects continued top line growth, but more importantly, a turnaround in profits in the near future. From a profit perspective, the cost of goods per unit (a pair of athletic shoes) was $62.59 in Period 1 and $40.00 in Period 2, showing the impact of increased sales volume on variable costs. If these cost trends continue and you are able to achieve positive revenue growth, the bottom line should improve significantly. It is also important to invest in the business. One key future decision you will have to make is how much to invest in product development to improve your market offering. You will also want to spend some time considering how best to support your product. The detailed results show the current expenditures the prior management made on the four important marketing mix variables (product, price, promotion, and distribution). All of those expenditures, however, can be changed going forward. Your parent company noted with some sarcasm that previous management thought they could make decisions without any market research. You will undoubtedly want to consider investing in market research. Finally, your parent company (in conjunction with your simulation administrator) may consider two other possible areas for strategic expansion. One is market entry into the foreign region and the other is contract bids. Take a few moments to examine the information regarding the two prior periods of operation to obtain all the information from them that you can. Make sure you understand the relationship among revenues, total expenditures, and cost of goods sold. Remember, the basic profit (or loss) formula is:
TR - (TE + TCOG) = Profit (or Loss) Where: TR = Total Revenue (units sold x selling price in each region) , TE = Total Expenditures (all expenses in all regions) and, TCOG = Total Cost of Goods (all units sold x cost of goods) .
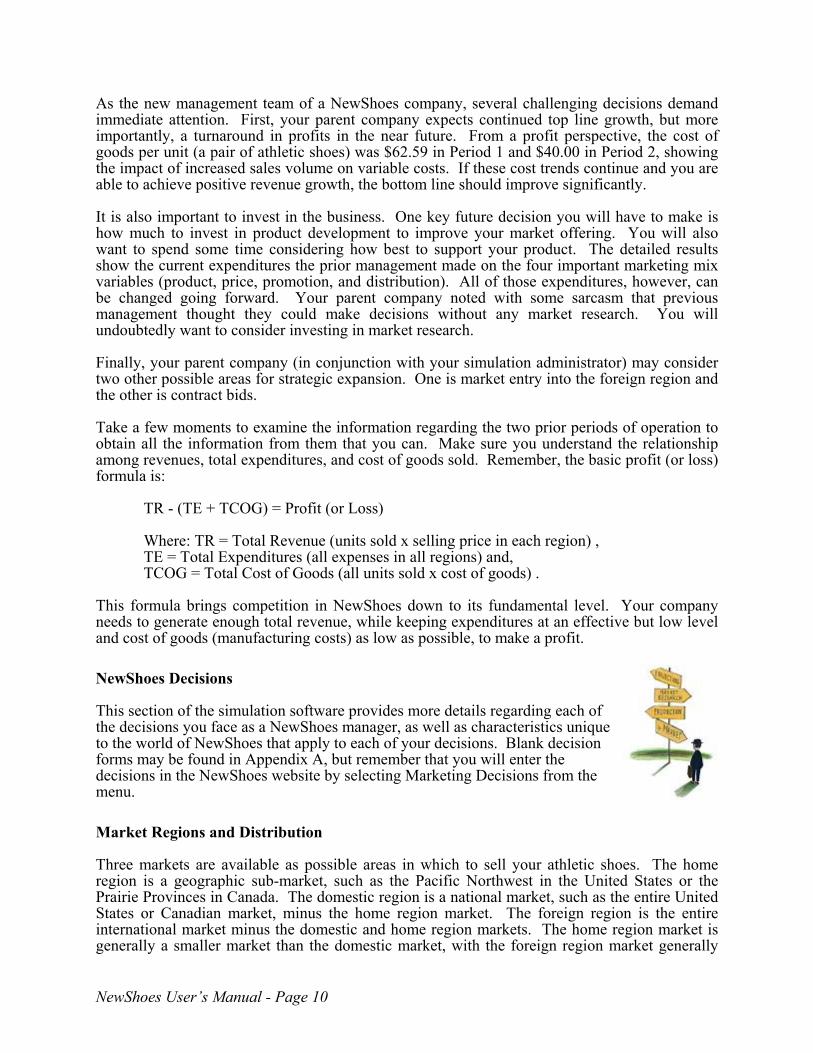
This formula brings competition in NewShoes down to its fundamental level. Your company needs to generate enough total revenue, while keeping expenditures at an effective but low level and cost of goods (manufacturing costs) as low as possible, to make a profit. NewShoes Decisions This section of the simulation software provides more details regarding each of the decisions you face as a NewShoes manager, as well as characteristics unique to the world of NewShoes that apply to each of your decisions. Blank decision forms may be found in Appendix A, but remember that you will enter the decisions in the NewShoes website by selecting Marketing Decisions from the menu. Market Regions and Distribution Three markets are available as possible areas in which to sell your athletic shoes. The home region is a geographic sub-market, such as the Pacific Northwest in the United States or the Prairie Provinces in Canada. The domestic region is a national market, such as the entire United States or Canadian market, minus the home region market. The foreign region is the entire international market minus the domestic and home region markets. The home region market is generally a smaller market than the domestic market, with the foreign region market generally
NewShoes User�s Manual - Page 10

July � December 2006 ONLY
being the smallest market of the three. Please see Appendix A for a more complete description of the three market regions. During Period 2, the period prior to your management team taking over the marketing function for your NewShoes company, your company was doing business in the home and domestic region markets. You may enter and leave market regions as you choose. There is no charge for leaving a region. There is, however, a $750,000 start-up charge each time you enter or re-enter a region. All you have to do to enter or re-enter a region is to record a selling price in the decision entry for the appropriate region. Of course, you will also have to make decisions and record them for the other NewShoes variables available in each region to produce an effective marketing program. To leave a market region, just leave all the decision variables for that region blank. Remember, it costs $750,000 to enter a new market or re-enter a market you previously left. In the Industry News for NewShoes there will be sales by region along with forecast growth for each market for the upcoming period of the NewShoes competition. The growth forecasts usually take the form of an adjective describing what to expect for each market region. For example, the forecast might show �slight growth� which would indicate growth of 1-5% for the coming period. This is important information to consider when making your decisions for the period. You can expect the consumers and distributors, that is to say the market, to respond differently depending on the region in which you are operating. The levels you choose for the different marketing mix variables (price, amount spent on consumer advertising, number of salespeople, etc.) are likely to generate different types of responses from the marketplace in each of the three market regions (home, domestic, and foreign). Product All companies begin with the �basic version� of athletic shoes and the same version is always sold in all regions. The amount and regularity of investment in new product development can lead to new or improved versions of your athletic shoes. However, new product development expenditures beyond $2 million in one period have a diminishing effect on attaining a new version of the product. As is true in the athletic shoe industry, there is some uncertainty as to when the next breakthrough shoe development will occur. Many new or improved versions of your NewShoes product can be obtained up through �Version 10.� It is unlikely that Version 10 will be attained in a NewShoes competition. Version 3 or 4 is usually the highest version that is attained after 8 to 10 decisions. The Product Development Indicator in your software indicates the current version you are selling as well as estimating how close your team is to attaining a new version of the product. Each new or improved version of the product that your company attains has a positive effect on your company�s sales. Each region in which you do business receives approximately the same positive effect on sales of new versions of your product. The positive effects of new or improved versions of your shoes on sales and profits will occur during the period following the indication on your results display that you have attained the new version. Production does not have to be scheduled in NewShoes because your company manufactures its athletic shoes to meet demand. This simplification of reality means that you do not have to be concerned about inventory control if you over-produce or about missed sales and employee overtime expenses if you under-produce.
New Shoes Operations Guide - Page 11
Price and Cost Different selling prices can be used in each region in which you are operating. Decisions on selling price are in dollars and cents, as opposed to the other NewShoes variables, which are entered in whole dollars (or numbers) only. The decision you make on selling price is very important and has a major effect on your company's profitability. A word of caution: prices over $150 can cause a rapid decrease in sales. Obviously an important consideration when establishing a selling price is the cost to produce your product. In NewShoes, your average manufacturing cost per unit (a pair of athletic shoes) is continually decreasing, as you can see from the data from periods 1 and 2. The cost of goods (COG) per unit was $62.59 in Period 1 and $40.00 in Period 2. A learning/experience curve effect is reducing your company's COG as you become more proficient at purchasing component materials, engineering, and producing additional units of your product. This learning/experience curve effect is such that with each doubling of cumulative production you can expect your manufacturing costs to go down by 25 percent. (This is actually known as a 75 percent learning/experience curve, indicating the slope of the manufacturing cost line). Cumulative production is simply the number of units of your product that have been produced by your company during its history. At the point where you take over the company � that is, after the results of Period 2 � your company has a cumulative production of 300,000 units (pairs of athletic shoes). These cumulative units can be determined by adding up all sales in all regions plus any contact bids obtained for Period 1 and Period 2 (see Table 1). Your company's average manufacturing cost at 300,000 units is $40 per pair of athletic shoes. This is the COG used for Period 2. This average manufacturing cost of $40 per unit will decline continually with each additional pair of athletic shoes you produce due to the effect of the learning/experience curve. In keeping with the learning/experience curve effect, if cumulative production doubles to 600,000 units, average cost of manufacturing will decrease by 25 percent to $30.00 per unit, and so forth for future cumulative production levels. A graph of the learning/experience curve on manufacturing costs is provided on the following page as a visual representation of how costs decrease with cumulative production. Each graph begins at 300,000 units on the horizontal axis. This is the point where you take over the company. By examining the graph, you see that your average manufacturing cost is continually decreasing. It will cost slightly less to manufacture your 300,00lst pair of athletic shoes than the $40 it cost to manufacture the 300,000th unit at which you start the simulation. Your average manufacturing cost will decrease continually throughout the competition because of the learning/experience curve effect of greater company proficiency and efficiency. Costs for a period can be estimated by first projecting your anticipated unit sales for a period, including any contract bids you are likely to win, then adding these units to the previous total for cumulative units produced. This results in a figure of new cumulative units produced that can be charted on the horizontal axis. Drawing a perpendicular line up from the horizontal units axis to the curve and then another perpendicular line over to the vertical cost axis yields an estimate of unit costs for the upcoming period. In addition to using the graph to estimate future costs, you may also use the decision aid option in the NewShoes software to plug in a number for cumulative production and receive a calculated value for cost of goods at that production level.
NewShoes User�s Manual - Page 12

July � December 2006 ONLY
Figure 1.2: Short-term Learning/Experience Curve.
0
5
10
15
20
25
30
35
40
45
3 5 7 9 11 13 15 17 19 21 23 25 27 29 31 33 35 37 39
Ave
rage
Cos
t Per
Uni
t ($)
Cumulative Productdion Units (00000)Cumulative Production Units (000,000s)
Figure 1.3: Long-term Learning/Experience Curve.
0
5
10
15
20
25
30
35
40
45
3 9 15 21 27 33 39 45 51 57 63 69 75 81 87 93 99 105 111
Ave
rage
Cos
t Per
Uni
t ($)
Cumulative Productdion Units (00000)Cumulative Production Units (000,000s)New Shoes Operations Guide - Page 13

Promotion Promotion is often divided into two general categories: consumer promotion (e.g. promotion targeting consumers/end-users) and channel or dealer promotion (e.g. promotion targeting the distribution channel). In NewShoes there are two consumer-oriented decisions and two channel promotion decisions to be made in each region. The following are brief descriptions and some guidelines regarding expenditure levels for the four different types of promotion in NewShoes. Consumer Promotion Decision Variables:
Consumer Advertising ($) is money invested in promotion presented through the media (television, radio, newspapers, magazines, websites etc.) that targets the consumers of your product. Expenditures per period over $2 million in any market region will have little effect of generating additional sales. Consumer Sales Promotion ($) is money invested in promotional items aimed at the consumer, such as rebates, contests, and premiums. Expenditures per period over $1 million in any market region will have little effect on generating additional sales.
Channel or Dealer Promotion Variables:
Personal Selling (#) is how many sales staff you hire. The sales force calls on middle-people in your distribution channel and does not deal with consumers or end users of your product. Expenditures per period involving hiring more than 10 salespersons in any market region will have little effect on generating additional sales. Each salesperson's salary, commission, benefits, support, travel, and other expenses cost your company $80,000 each period. Salespeople may be hired or fired any time with no training or separation expense. Simply change the number in your decision input. Dealer Sales Promotion ($) is the money invested in a variety of promotional items aimed at the middle-person in your distribution channel. These items include sales assistance and training, contests, and free displays. Expenditures per period over $1 million in any market region will have little effect on generating additional sales.
All four promotion variables can be adjusted separately in each of the three market regions and have a primary effect on sales in the period in which money is allocated to them. There is little carryover into the following periods. The amount spent in any of these areas of promotion can be changed as much as desired during any period. Simply change the number in your decision input.
NewShoes User�s Manual - Page 14

July � December 2006 ONLY
Contract Bids The primary exposure you will have in NewShoes to the industrial market is through the submission of bids. At the discretion of the simulation administrator, bids will be solicited, on behalf of a large retailer, for a contract for large numbers of pairs of athletic shoes for purchase in an upcoming period of the NewShoes competition. The shoes for which bids are solicited are for store brands of athletic shoes. This means the purchaser of the product will put its own brand name on the product, and your brand name will not appear on the shoes. Price is the only criterion used by the purchaser as a determinant of which company will receive the contract. You may choose to bid or not to bid on these contracts. Bids are submitted in dollars and cents per pair of shoes. The company submitting the lowest bid wins the contract and sells the requested amount of shoes in the period indicated. If tie bids are received, the number of units for which bids were solicited will be split equally between the companies submitting the winning bids. Determining a bid price is an important decision if you choose to bid on a contract. Estimating your manufacturing costs plays a big role in choosing your bid price. Reading the discussion presented earlier on price and costs should aid in this regard, as will the bid analysis decision aid in the software. An important point to consider when examining costs is the effect of submitting the winning bid on your manufacturing costs. Winning a contract bid can have a positive effect on the profitability of your regular business in the market regions. This is a result of the impact of the units sold for the contract on manufacturing costs through the learning/experience curve effect. As a result, your cost to produce shoes will be lower with the contract than without it because the contract bid units move you to lower costs on the learning/experience curve. Market Research Six market research information items can be purchased in each of the three NewShoes market regions. Each item of research requested costs either $10,000 (for industry averages or range only) or $25,000 (for detailed competitive research). The availability of the range and detailed research is decided by your instructor, but at a minimum you will have the ability to purchase information on industry averages. The averages are computed based on the levels set for the examined variables by all the companies competing in a market region. Therefore, the level you set for a variable is included in the calculated average when research information is requested for a region in which your company is competing. You will have to decide which marketing research is important in your decision-making process and whether or not it is worth the cost. The research available is fairly straightforward, basically summarizing competitive decisions. The one exception is the customer satisfaction rating. This rating gives you an indication of whether or not customers are happy with your product, as well as a general benchmark as to expectations in the marketplace with regard to price/performance trade-offs. The reported market research averages are for the period in which they are requested. The items for which research averages may be purchased are: average price, average expenditures on consumer advertising, average expenditures on consumer sales promotions, average number of salespeople, average expenditures on dealer sales promotions, and customer satisfaction.
New Shoes Operations Guide - Page 15
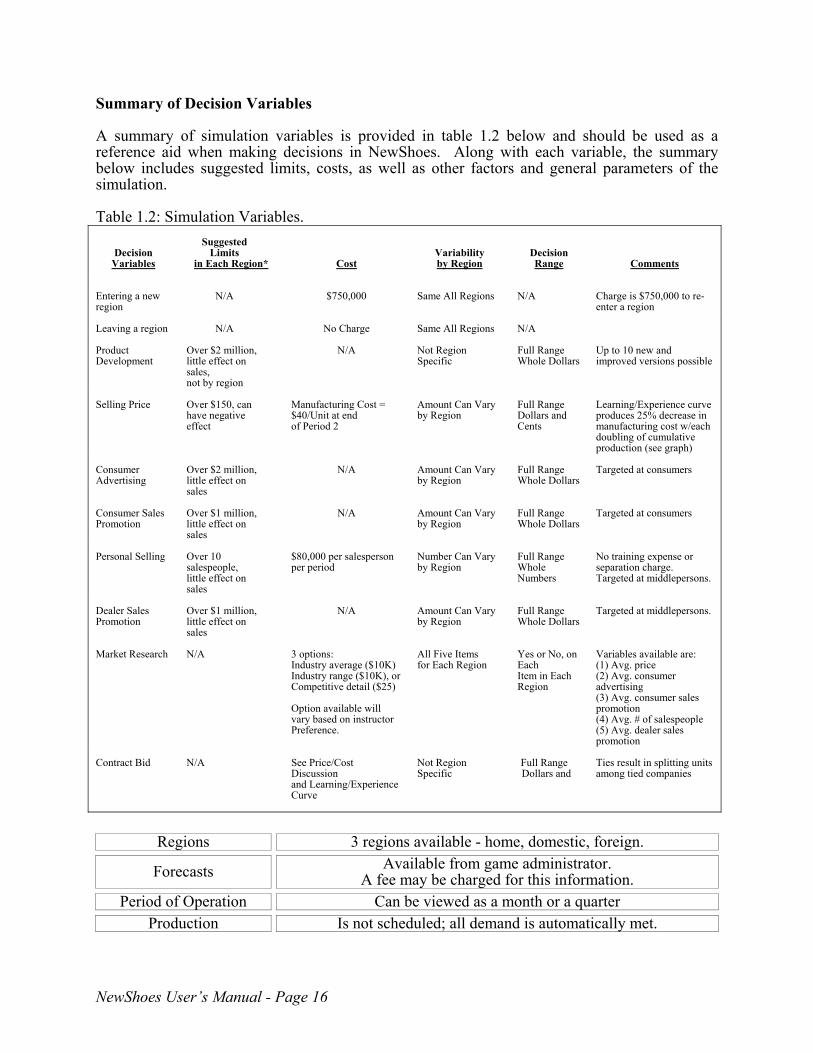
Summary of Decision Variables A summary of simulation variables is provided in table 1.2 below and should be used as a reference aid when making decisions in NewShoes. Along with each variable, the summary below includes suggested limits, costs, as well as other factors and general parameters of the simulation. Table 1.2: Simulation Variables.
Decision Variables
Suggested
Limits in Each Region*
Cost
Variability by Region
Decision Range
Comments
Entering a new region
N/A
$750,000
Same All Regions
N/A
Charge is $750,000 to re-enter a region
Leaving a region
N/A
No Charge
Same All Regions
N/A
Product Development
Over $2 million, little effect on sales, not by region
N/A
Not Region Specific
Full Range Whole Dollars
Up to 10 new and improved versions possible
Selling Price
Over $150, can have negative effect
Manufacturing Cost = $40/Unit at end of Period 2
Amount Can Vary by Region
Full Range Dollars and Cents
Learning/Experience curve produces 25% decrease in manufacturing cost w/each doubling of cumulative production (see graph)
Consumer Advertising
Over $2 million, little effect on sales
N/A
Amount Can Vary by Region
Full Range Whole Dollars
Targeted at consumers
Consumer Sales Promotion
Over $1 million, little effect on sales
N/A
Amount Can Vary by Region
Full Range Whole Dollars
Targeted at consumers
Personal Selling
Over 10 salespeople, little effect on sales
$80,000 per salesperson per period
Number Can Vary by Region
Full Range Whole Numbers
No training expense or separation charge. Targeted at middlepersons.
Dealer Sales Promotion
Over $1 million, little effect on sales
N/A
Amount Can Vary by Region
Full Range Whole Dollars
Targeted at middlepersons.
Market Research
N/A
3 options: Industry average ($10K) Industry range ($10K), or Competitive detail ($25) Option available will vary based on instructor Preference.
All Five Items for Each Region
Yes or No, on Each Item in Each Region
Variables available are: (1) Avg. price (2) Avg. consumer advertising (3) Avg. consumer sales promotion (4) Avg. # of salespeople (5) Avg. dealer sales promotion
Contract Bid
N/A
See Price/Cost Discussion and Learning/Experience Curve
Not Region Specific
Full Range Dollars and
Ties result in splitting units among tied companies
Regions 3 regions available - home, domestic, foreign.
Forecasts Available from game administrator. A fee may be charged for this information.
Period of Operation Can be viewed as a month or a quarter Production Is not scheduled; all demand is automatically met.
NewShoes User�s Manual - Page 16

July � December 2006 ONLY
Obtaining Results for a Period of NewShoes Competition Once all firms have entered their decisions into browser interface before the deadline, the simulation take all the team decisions as well as changes in the environment and create a new set of results. These results will be available on the website once the simulation advance process is complete. All firms will have access to updated results and the process will begin again. Start by reviewing the industry news for major changes in the market and several benchmark performance measures. Use the market research and tools to help understand why results have changed. Is it because of changes in overall demand? Is it due to changes in your price relative to others? Is it due to relative changes in expenditure levels? There are no simple answers to these questions, and this is the type of complex analysis that marketers face daily. By navigating the waters in the boundary area between the customer and the firm, you will learn how many of the key decisions are made that ultimately decide whether a firm and its shareholders are successful or not.
New Shoes Operations Guide - Page 17

NewShoes User�s Manual - Page 18
July � December 2006 ONLY
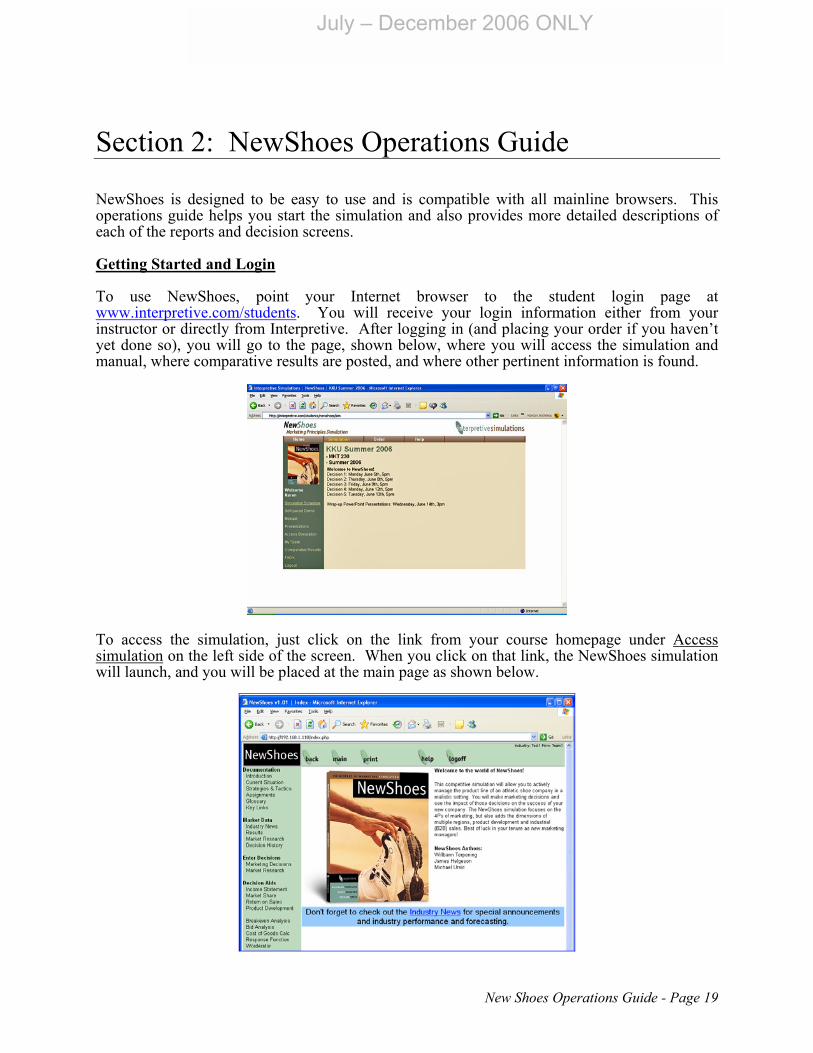
Section 2: NewShoes Operations Guide NewShoes is designed to be easy to use and is compatible with all mainline browsers. This operations guide helps you start the simulation and also provides more detailed descriptions of each of the reports and decision screens. Getting Started and Login
To use NewShoes, point your Internet browser to the student login page at www.interpretive.com/students. You will receive your login information either from your instructor or directly from Interpretive. After logging in (and placing your order if you haven�t yet done so), you will go to the page, shown below, where you will access the simulation and manual, where comparative results are posted, and where other pertinent information is found.
To access the simulation, just click on the link from your course homepage under Access simulation on the left side of the screen. When you click on that link, the NewShoes simulation will launch, and you will be placed at the main page as shown below.
New Shoes Operations Guide - Page 19
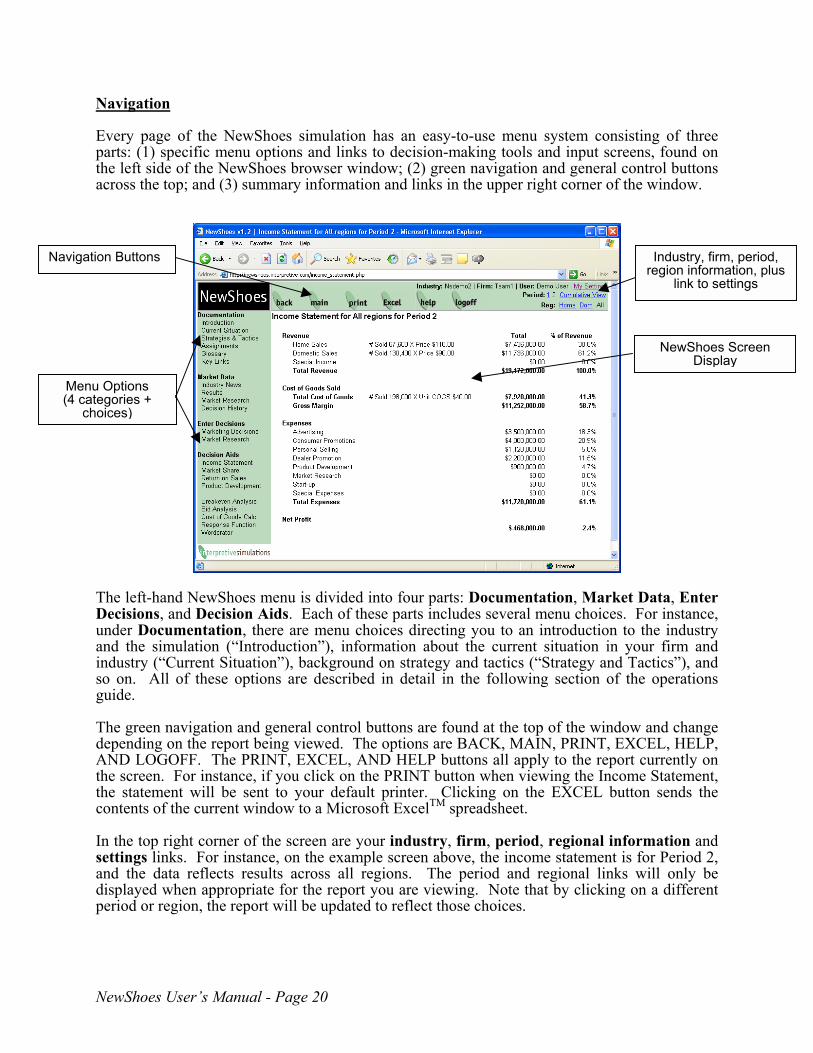
Navigation Every page of the NewShoes simulation has an easy-to-use menu system consisting of three parts: (1) specific menu options and links to decision-making tools and input screens, found on the left side of the NewShoes browser window; (2) green navigation and general control buttons across the top; and (3) summary information and links in the upper right corner of the window.
Navigation Buttons Industry, firm, period, region information, plus
link to settings
Menu Options (4 categories +
choices)
The left-hand NewShoes menu is divided into four parts: Documentation, Market DaDecisions, and Decision Aids. Each of these parts includes several menu choices. Founder Documentation, there are menu choices directing you to an introduction to thand the simulation (�Introduction�), information about the current situation in yourindustry (�Current Situation�), background on strategy and tactics (�Strategy and Tactso on. All of these options are described in detail in the following section of the oguide. The green navigation and general control buttons are found at the top of the window adepending on the report being viewed. The options are BACK, MAIN, PRINT, EXCEAND LOGOFF. The PRINT, EXCEL, AND HELP buttons all apply to the report cuthe screen. For instance, if you click on the PRINT button when viewing the Income Sthe statement will be sent to your default printer. Clicking on the EXCEL button contents of the current window to a Microsoft ExcelTM spreadsheet. In the top right corner of the screen are your industry, firm, period, regional informsettings links. For instance, on the example screen above, the income statement is forand the data reflects results across all regions. The period and regional links wildisplayed when appropriate for the report you are viewing. Note that by clicking on aperiod or region, the report will be updated to reflect those choices.
NewShoes User�s Manual - Page 20
NewShoes Screen Display
ta, Enter r instance, e industry firm and ics�), and perations
nd change L, HELP, rrently on tatement, sends the
ation and Period 2, l only be different

July � December 2006 ONLY
Settings Click on My Settings in the upper right hand corner to check your settings, including username, email address, screen style and team name. If you are a team leader, you can choose and save your team�s name here.
Detail of Menu Choices The links on the left side of the NewShoes window lead to all the information and tools you will need to analyze your current position, plan a strategy, and input your decisions. These links are divided into four categories: Documentation, Market Data, Enter Decisions, and Decision Aids. One of the easiest ways to find out more about an option is just to try it out. If you need more information, use the on-screen HELP button or consult this manual.
New Shoes Operations Guide - Page 21
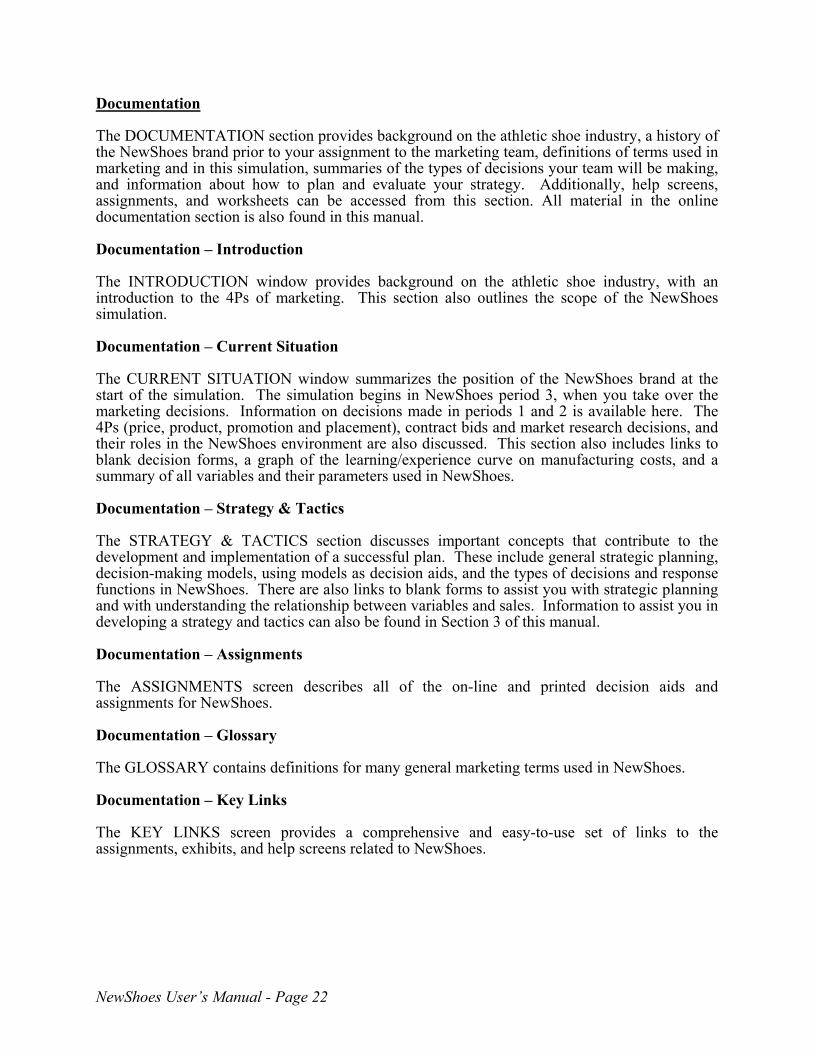
Documentation The DOCUMENTATION section provides background on the athletic shoe industry, a history of the NewShoes brand prior to your assignment to the marketing team, definitions of terms used in marketing and in this simulation, summaries of the types of decisions your team will be making, and information about how to plan and evaluate your strategy. Additionally, help screens, assignments, and worksheets can be accessed from this section. All material in the online documentation section is also found in this manual. Documentation � Introduction The INTRODUCTION window provides background on the athletic shoe industry, with an introduction to the 4Ps of marketing. This section also outlines the scope of the NewShoes simulation. Documentation � Current Situation The CURRENT SITUATION window summarizes the position of the NewShoes brand at the start of the simulation. The simulation begins in NewShoes period 3, when you take over the marketing decisions. Information on decisions made in periods 1 and 2 is available here. The 4Ps (price, product, promotion and placement), contract bids and market research decisions, and their roles in the NewShoes environment are also discussed. This section also includes links to blank decision forms, a graph of the learning/experience curve on manufacturing costs, and a summary of all variables and their parameters used in NewShoes. Documentation � Strategy & Tactics The STRATEGY & TACTICS section discusses important concepts that contribute to the development and implementation of a successful plan. These include general strategic planning, decision-making models, using models as decision aids, and the types of decisions and response functions in NewShoes. There are also links to blank forms to assist you with strategic planning and with understanding the relationship between variables and sales. Information to assist you in developing a strategy and tactics can also be found in Section 3 of this manual. Documentation � Assignments The ASSIGNMENTS screen describes all of the on-line and printed decision aids and assignments for NewShoes. Documentation � Glossary The GLOSSARY contains definitions for many general marketing terms used in NewShoes. Documentation � Key Links The KEY LINKS screen provides a comprehensive and easy-to-use set of links to the assignments, exhibits, and help screens related to NewShoes.
NewShoes User�s Manual - Page 22
July � December 2006 ONLY
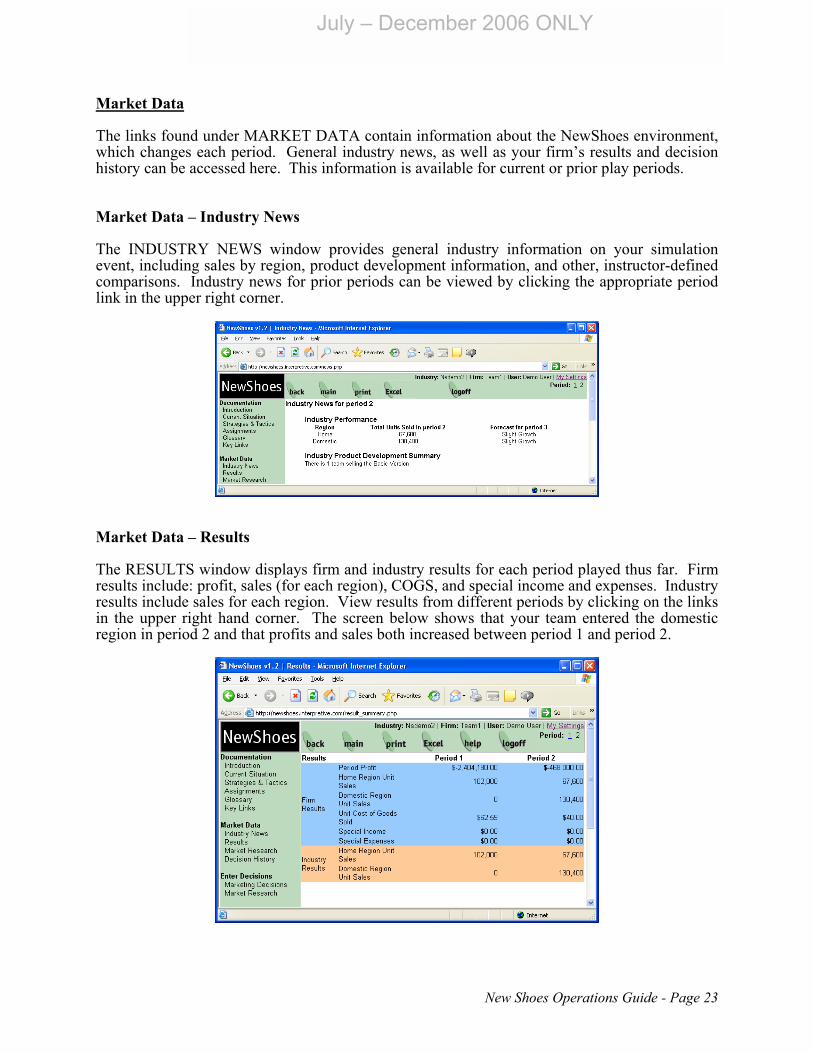
Market Data The links found under MARKET DATA contain information about the NewShoes environment, which changes each period. General industry news, as well as your firm�s results and decision history can be accessed here. This information is available for current or prior play periods. Market Data � Industry News The INDUSTRY NEWS window provides general industry information on your simulation event, including sales by region, product development information, and other, instructor-defined comparisons. Industry news for prior periods can be viewed by clicking the appropriate period link in the upper right corner.
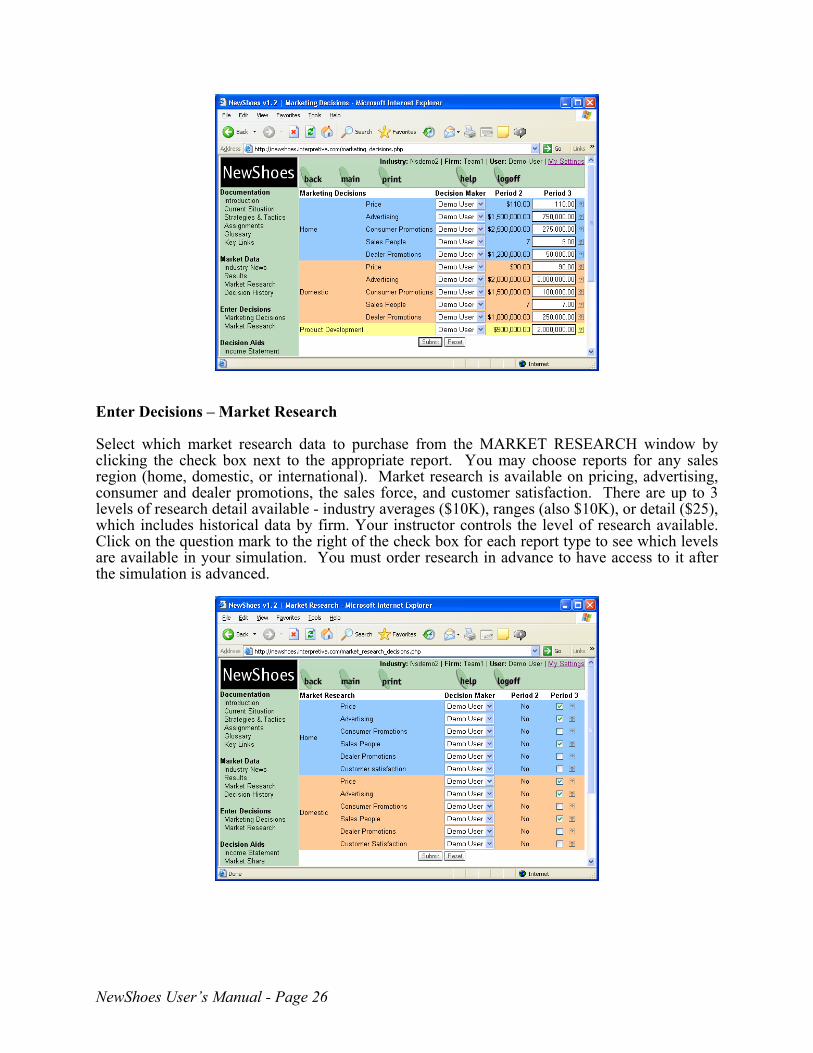
Market Data � Results The RESULTS window displays firm and industry results for each period played thus far. Firm results include: profit, sales (for each region), COGS, and special income and expenses. Industry results include sales for each region. View results from different periods by clicking on the links in the upper right hand corner. The screen below shows that your team entered the domestic region in period 2 and that profits and sales both increased between period 1 and period 2.
New Shoes Operations Guide - Page 23

Market Data � Market Research The MARKET RESEARCH screen summarizes which research reports were ordered in each play period. There are 6 reports available for each sales region � Price, Advertising, Consumer Promotions, Sales People, Dealer Promotions and Customer Satisfaction. You must order market research in the decision process to receive it. When the research is ordered, a link will be available after the simulation is advanced that will allow you to view the appropriate competitive information. Additionally, there are up to 3 levels of research detail available - industry averages, ranges, or detail, which includes historical data by firm. Your instructor has control over the level of research available, so you may not have access to all of these levels. Industry Averages ($10K): Allows you to see the average price, expenditure or customer
satisfaction level in a particular region. Industry Ranges ($10K): Allows you to see the high and low prices, expenditures or
customer satisfaction levels in a particular region. Detail ($25K): Provides each competitor�s price, expenditure or customer
satisfaction for a particular region.
All of the values except for customer satisfaction correspond directly to the competitive decisions made. Customer satisfaction is a measure of what people think about your product quality (as measured by the version release) and pricing. As your price and product quality improve relative to customer expectations and competitive positioning, your customer satisfaction scores will improve. This is an important measure to follow in NewShoes.
NewShoes User�s Manual - Page 24

July � December 2006 ONLY
Market Data � Decision History The DECISION HISTORY choice will display all previous decisions as well as the current period set of decisions for your firm. You can consider this screen a historical record of your decisions. It may be helpful to compare your decisions with your results and try to understand what drove the results. Was it a change in your advertising? Was it a change in the overall environment (demand)? Was it something one of your competitors did? Although this screen only shows your decisions, your decisions are an important driver of results.
Enter Decisions After you have formulated or revised your strategic plan and analyzed your previous results and the current state of the industry, enter your marketing and research decisions for the current period using the links in this section. Enter Decisions � Marketing Decisions Use the MARKETING DECISIONS screen to enter your decision variables for each sales region, every period. You must set a price and set budgets for advertising and promotions. You must also decide how many sales people to use in each sector. If you are the team leader, you will have the ability to delegate particular decisions to team members through the pop-up menu. Get advice about each variable by clicking on the question mark next to its input box. Decisions will be remembered but not finalized until the submit button is activated. You may change your decisions at any time prior to clicking on the submit button. Once you and all your competitors have entered decisions, the simulation will be advanced and new results will be generated.
New Shoes Operations Guide - Page 25
Enter Decisions � Market Research Select which market research data to purchase from the MARKET RESEARCH window by clicking the check box next to the appropriate report. You may choose reports for any sales region (home, domestic, or international). Market research is available on pricing, advertising, consumer and dealer promotions, the sales force, and customer satisfaction. There are up to 3 levels of research detail available - industry averages ($10K), ranges (also $10K), or detail ($25), which includes historical data by firm. Your instructor controls the level of research available. Click on the question mark to the right of the check box for each report type to see which levels are available in your simulation. You must order research in advance to have access to it after the simulation is advanced.
NewShoes User�s Manual - Page 26
July � December 2006 ONLY
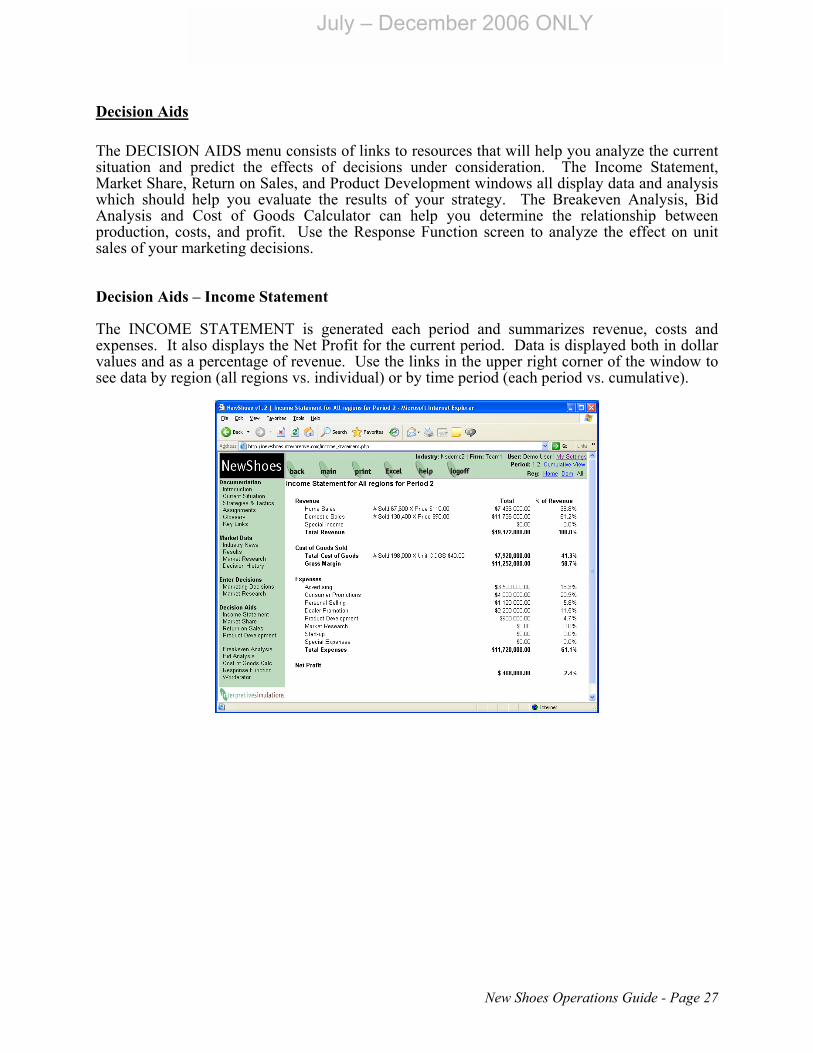
Decision Aids The DECISION AIDS menu consists of links to resources that will help you analyze the current situation and predict the effects of decisions under consideration. The Income Statement, Market Share, Return on Sales, and Product Development windows all display data and analysis which should help you evaluate the results of your strategy. The Breakeven Analysis, Bid Analysis and Cost of Goods Calculator can help you determine the relationship between production, costs, and profit. Use the Response Function screen to analyze the effect on unit sales of your marketing decisions. Decision Aids � Income Statement The INCOME STATEMENT is generated each period and summarizes revenue, costs and expenses. It also displays the Net Profit for the current period. Data is displayed both in dollar values and as a percentage of revenue. Use the links in the upper right corner of the window to see data by region (all regions vs. individual) or by time period (each period vs. cumulative).
New Shoes Operations Guide - Page 27
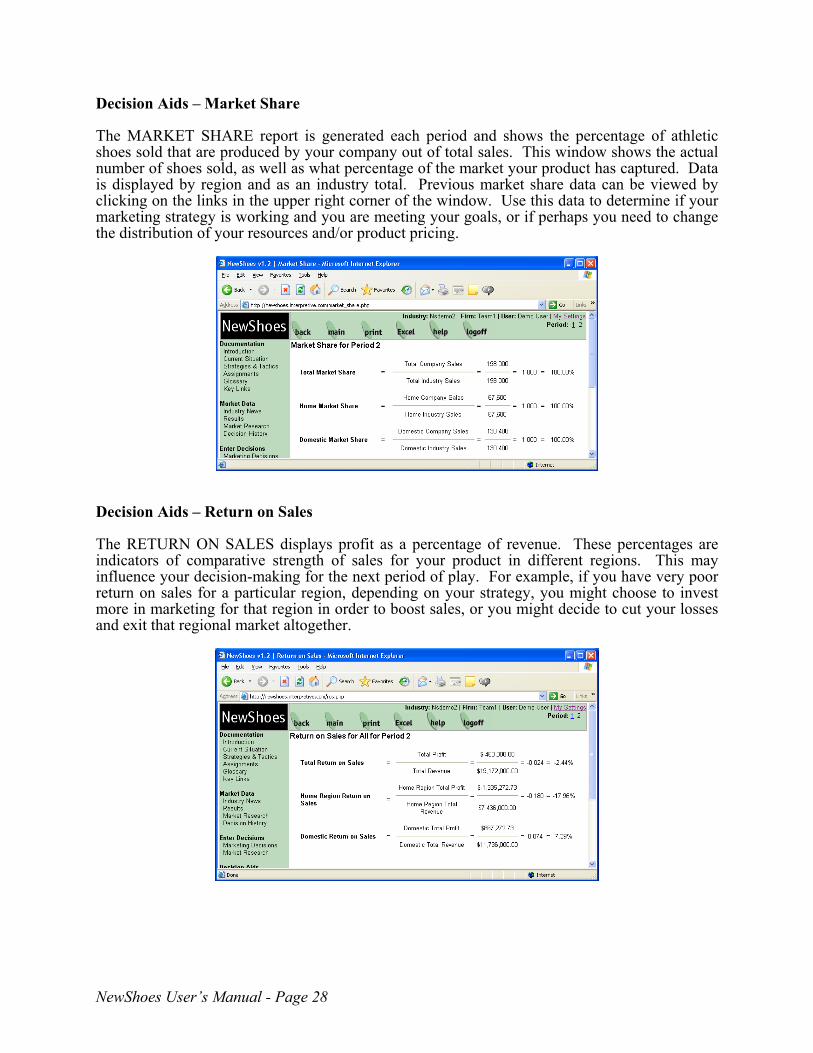
Decision Aids � Market Share The MARKET SHARE report is generated each period and shows the percentage of athletic shoes sold that are produced by your company out of total sales. This window shows the actual number of shoes sold, as well as what percentage of the market your product has captured. Data is displayed by region and as an industry total. Previous market share data can be viewed by clicking on the links in the upper right corner of the window. Use this data to determine if your marketing strategy is working and you are meeting your goals, or if perhaps you need to change the distribution of your resources and/or product pricing.
Decision Aids � Return on Sales The RETURN ON SALES displays profit as a percentage of revenue. These percentages are indicators of comparative strength of sales for your product in different regions. This may influence your decision-making for the next period of play. For example, if you have very poor return on sales for a particular region, depending on your strategy, you might choose to invest more in marketing for that region in order to boost sales, or you might decide to cut your losses and exit that regional market altogether.
NewShoes User�s Manual - Page 28

July � December 2006 ONLY
Decision Aids � Product Development The PRODUCT DEVELOPMENT screen shows which athletic shoe version your company is currently selling, and how close it is to launching a new and improved product.
Decision Aids � Breakeven Analysis Use the BREAKEVEN ANALYSIS screen to enter your assumptions about the future � anticipated sales, costs, and expenditures. This analysis will calculate the �breakeven price� � the price at which your revenues will balance expenses if every unit is sold. Use this calculation to help set your product price for the next period. If you set it too low, your company will lose money. If you set it too high, consumers may decide your product is over-priced and choose a different product. This analysis can help you balance many factors, and show you how your assumptions about the future effect and relate to the breakeven price point.
New Shoes Operations Guide - Page 29
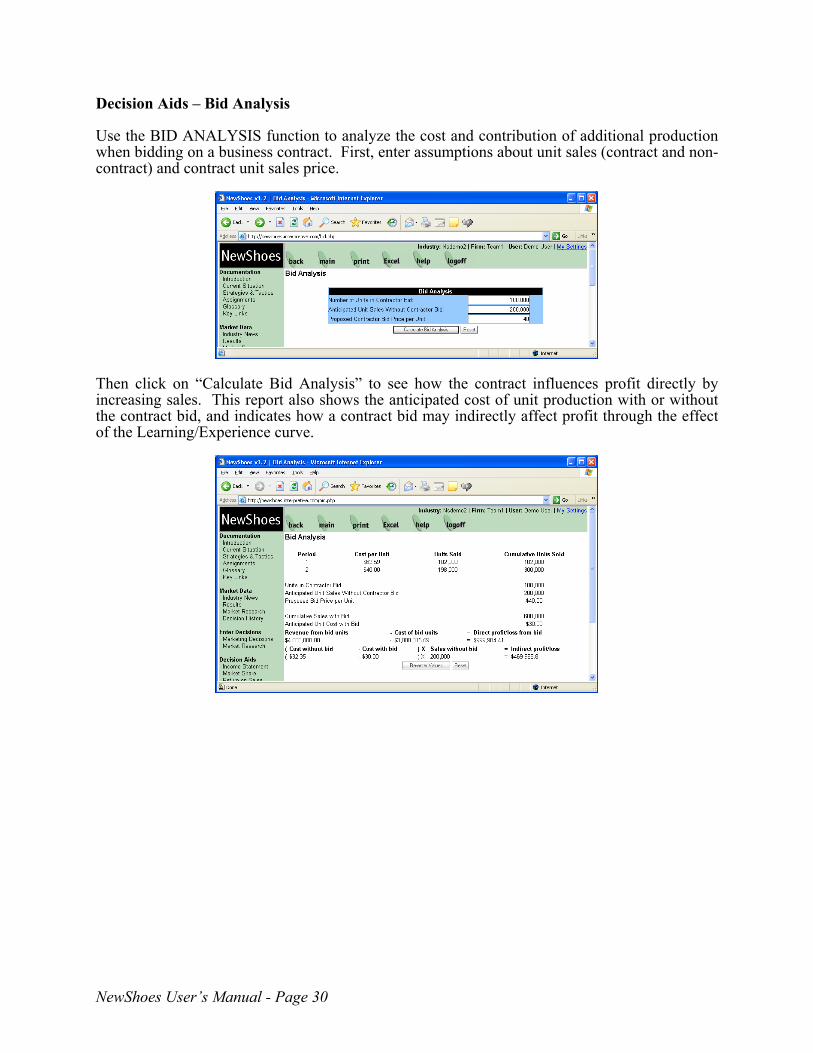
Decision Aids � Bid Analysis Use the BID ANALYSIS function to analyze the cost and contribution of additional production when bidding on a business contract. First, enter assumptions about unit sales (contract and non-contract) and contract unit sales price.
Then click on �Calculate Bid Analysis� to see how the contract influences profit directly by increasing sales. This report also shows the anticipated cost of unit production with or without the contract bid, and indicates how a contract bid may indirectly affect profit through the effect of the Learning/Experience curve.
NewShoes User�s Manual - Page 30

July � December 2006 ONLY
Decision Aids � Cost of Goods Calculator The COST OF GOODS CALCULATOR analyzes the affect of the Learning/Experience curve on unit production cost. Remember that as more shoes are produced, the unit cost of production decreases because of improvements in efficiencies. Each period, enter the anticipated cumulative production of your product (remember to include units made in all prior periods), and the current production cost will be calculated. Use this information to help set an appropriate selling price.
Decision Aids � Response Function Use the RESPONSE FUNCTION window to graph the relationship between unit sales and a selected marketing variable (price, advertising, salespeople, consumer promotion, or dealer promotion). Choose the region (home, domestic, or foreign) you wish to analyze, then click on �Plot Graph� to see the data for all periods played thus far.
New Shoes Operations Guide - Page 31
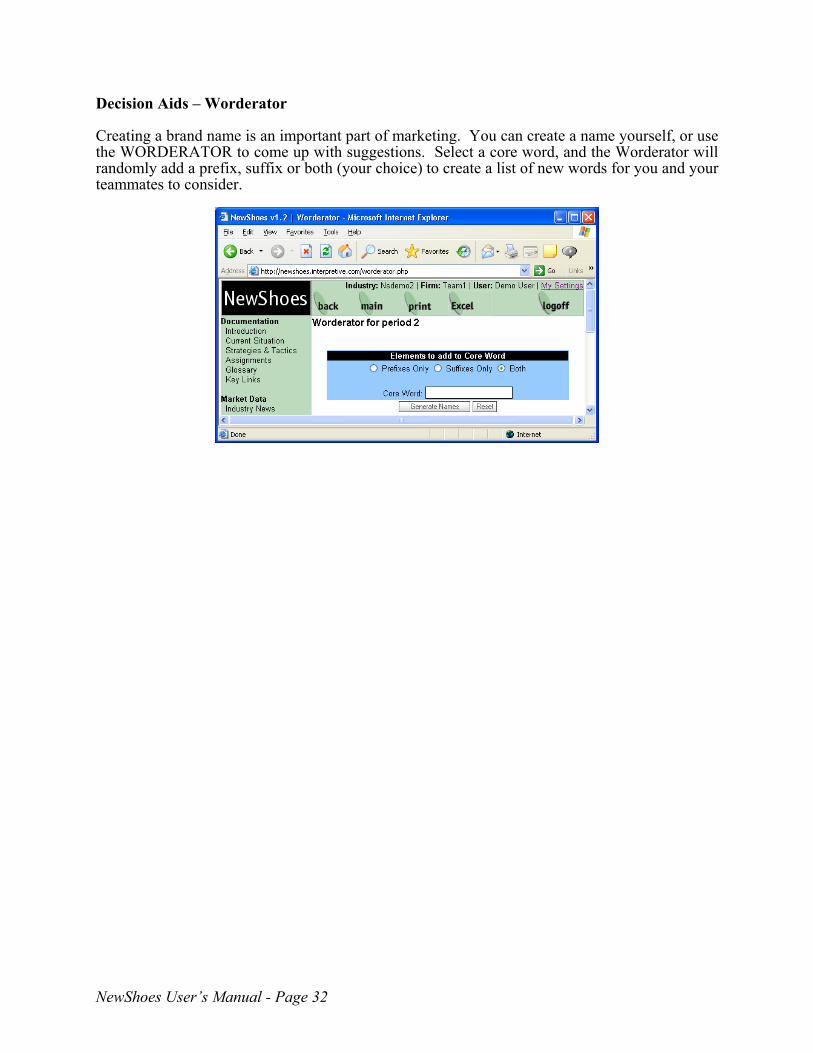
Decision Aids � Worderator Creating a brand name is an important part of marketing. You can create a name yourself, or use the WORDERATOR to come up with suggestions. Select a core word, and the Worderator will randomly add a prefix, suffix or both (your choice) to create a list of new words for you and your teammates to consider.
NewShoes User�s Manual - Page 32
July � December 2006 ONLY
Section 3: Strategy and Tactics This section is designed to assist you with your decision-making process in NewShoes and developing a marketing strategy. Strategic decision-making is a difficult skill to master because it is so dependent on context. A strategy or specific decision that is successful in one industry situation may not be successful in a different context. It is always essential to study the business environment, improve the understanding of customers, and monitor the competition. While it is easy to get caught up in the excitement of selling more than the competition, don�t forget about the bottom line - your profitability. If your business doesn't make money long-term, your strategy isn't viable and needs to be redesigned. Strategic Planning in General The term strategy has its origin in the Greek term �strategia� which means the �art of the general.� Generals operate at the level of large-scale military operations. Thus, at the strategic planning level a business decision-maker deals with the broad picture, or, from the general's point of view, the �grand battle plan.� At the other end of the planning spectrum are tactics, which can be described as the day-to-day maneuvers in a military context, or from a business perspective, the day-to-day use of resources already committed by the strategy. It is important to consider a strategic plan before you delve into the day-to-day tactics of making decisions for each period of competition in NewShoes. The Initial Strategic Planning Form (see Appendix II) will guide you through a strategic planning exercise. In this assignment you are asked to define your company�s mission (its reason for being), its objectives and goals (where the company is headed, including some quantifiable measures as benchmarks), and a strategy (how you are going to attain the objectives and goals set out). Finally, you should provide some specifics about what you plan to do from a strategic perspective with regard to target market and marketing mix decisions to put the plan into action. It is essential to create this strategic framework before making the more detailed decisions, as tactical choices should flow from the strategy, rather being a disjointed set of reactions to market and competitive dynamics. The follow-up Revision of Strategic Plan asks if your team has had to reconsider some components of its strategic plan. This is something your company may have to do or want to do after several periods of competition. Decision-Making Process Making a decision is not just a single act that occurs at a point in time, but is a process of steps, as depicted below.
Identify the Problem
Search for Information
Develop Alternatives
Evaluate Alternatives
Make Choice
EvaluateResults
These are the steps that decision-makers go through, whether they are consumers trying to decide on what to buy for dinner or businesspeople trying to set a price for a product. The first step of the process is problem identification. You know you have a problem when the actual
Strategy and Tactics - Page 33
state of affairs does not equal the ideal state of affairs. (Your product needs a price, for example, but it does not have one.) The second step is to search for information. This search can be both internal, within the mind of the decision-maker, and external, from sources outside the person. For example, a manager might search his/her memory for past experiences in setting a price on a product (internal search) and might also do some market research to aid in setting the price (external search). The third and fourth steps in the decision process are interrelated. The search for information can develop alternatives (various possible solutions to the problem) that must then be evaluated. Thus, the businessperson might develop several price alternatives and then evaluate those options. An important consideration in NewShoes, and business decision-making in general, is to put together complete alternatives. The point here is to include all the NewShoes decisions that need to be made as a decision alternative package. This alternative package should work within the strategic plan discussed earlier. The evaluation step is very important in the decision-making process. To complete this evaluation, the decision-maker will need a set of criteria on which to evaluate each of the developed alternatives. These criteria differ from problem to problem. For example, the criteria used by a consumer when trying to decide what to buy for dinner might include things like speed of preparation, ingredients, expected taste, cost, and so forth. The criteria used by the businessperson trying to evaluate different price alternatives for a product might include profit potential, psychological effect of the price, and the price elasticity of demand. As you can see, different criteria must be considered, depending on the problem being solved. The decision-makers must identify the important criteria for solving their particular problem. The fifth step in the process is to make a choice. Based on the alternative evaluation stage, a particular alternative must be selected as the choice for solving the problem. In the discussion above regarding the criteria used to evaluate alternatives, the orientation was that of a rational, analytical decision process. In actuality, the final choice is likely to be affected by intuition and emotion along with the analytical aspects of the human mind. Consider the effects of intuition and creativity when making your NewShoes decisions. Creativity may be most applicable in the alternative generation phase of the decision process. The sixth and last step in the decision process is the evaluation of the results of your choice. This provides a feedback mechanism. The results of your decisions are evaluated to assess the effectiveness of your choices. This feedback will hopefully make similar decisions in the future easier and faster to make and result in better decisions. Regarding the pricing example used above, the business decision-maker could, for example, see how sales, profit, and other factors responded to the chosen price and use this as feedback to aid in future decision-making. The evaluation of results of decisions will more than likely be considered during an internal search for information when making similar decisions in the future. However, besides the internal, perhaps more intuitive, use of this feedback information, a useful activity to enhance NewShoes decision-making would be to keep written records of decisions. These records could include the details of the alternatives generated and their evaluation, including criteria for the evaluation. The results that follow from the alternative chosen in the decision can then be recorded. Results can be in the form of profit, market share, contract bid results, new versions of the product available for sale, and so forth. Monitoring decisions, their rationale, and their results can be a basis for improvement of NewShoes decision-making.
NewShoes User�s Manual - Page 34
July � December 2006 ONLY
Models as Decision Aids Models are common tools we use every day to help us interact with the world in which we live. You have an internal model of how to get from the school you attend to the place where you live. You have a model in mind of how to get the grade you would like from the courses in which you are enrolled. A model is a set of variables and their interrelationships that represents reality. Models are useful tools to aid in business decision-making and can be useful in making your decisions in NewShoes. Models can be part of the information search in the decision process, as described earlier, as well as an aid in the generation and evaluation of decision alternatives. As a NewShoes decision-maker, you will want to consider three primary types of models: verbal, graphical, and mathematical models. You have encountered these various types of models in different courses you have taken. Many models are encountered in the study of marketing. Verbal models are verbal descriptions of a phenomenon. A statement such as �In some markets, as price is increased, consumers will make a price-quality link with an accompanying increase in demand to a certain point, beyond which increases in price will result in a decrease in demand,� is an example of a verbal model. Note that most graphical and mathematical models can be expressed as verbal models. These and other verbal models can be developed for the variables and their interrelationships in NewShoes. If the model is applicable to the situation at hand, it can provide �items to consider� when making decisions. It is important to remember that models provide �items to consider� when making decisions, but they do not provide answers. Thus, the best way to view models and other decision aids is as tools that provide advice but not necessarily answers. Models also usually do not capture much, if any, of the intuitive or emotional aspects of decision-making mentioned in the previous section. Examples of graphical models mentioned in most basic marketing textbooks are the Product Life Cycle (PLC) and the market growth/market share matrix, sometimes designated as the Boston Consulting Group (BCG) growth/share matrix. The assessed position of a product on the PLC graph provides �items to consider� when facing a marketing decision. For example, classification of a product as being in the maturity phase of the PLC may indicate a highly competitive business environment, reduced profits, and more price dealing. �Star� classification in the BCG growth/share matrix indicates, for example, low or negative profits and a high demand on resources. These and other graphical models in your marketing courses or textbooks should be considered when making decisions in NewShoes. Remember that these models give you �items to consider� and not answers. You must generate the answers as a NewShoes management team. The final type of model is the mathematical model. As noted earlier, a model can be represented in more than one format. For example, mathematical models often can also be represented as a verbal and/or graphical model. Typical mathematical models presented in marketing courses and textbooks include the Break-Even analysis in price setting, the effect of learning/experience curves on costs, and Economic Order Quantities. All of these models, and other mathematical models, can be represented in equation form. The learning/experience curve effect is an example of a mathematical model that is considered in the NewShoes simulation. The idea that cost of goods produced decreases by 25 percent with each doubling of cumulative production can be put into equation form. The equation for this 25 percent effect of the learning/experience curve model has been programmed for you as part of the contract bidding decision aid in the NewShoes software. The learning/experience curve equation is also in the cost of goods estimation decision aid in the software.
Strategy and Tactics - Page 35

Again, as with verbal and graphical models, mathematical models give you �items to consider� in your decision-making but do not generate answers to decisions. The final choice in the decision-making process is up to your NewShoes management team. Types of Decisions and Response Functions There are two broad categories of decision alternatives that business decision-makers face and that you will face in making decisions for your NewShoes company team. They are �course of action� decisions and �how much� decisions. The category of decisions termed �course of action� (or discrete) decisions includes such marketing decisions as type of promotions to use (a decision in NewShoes), which medium to use for an advertising campaign, which markets to enter (also a decision in NewShoes), whether or not to bid on a contract or invest in product development (two other NewShoes decisions), and which segments to pursue. These are all decisions that involve selecting an alternative. In addition to the earlier discussion regarding the generation and evaluation of alternatives in the decision process, a few other points should be noted when making �course of action� decisions. First, be aware of the possibility that the best alternative may not yet have been generated. Alternative generation involves creativity and may require a fair portion of the intuitive or emotional aspects of decision-making discussed earlier. Second, the alternatives that are generated need not necessarily be such that adopting one eliminates adopting another alternative. It may be possible and advisable to adopt multiple alternatives at the same time to solve the problem. Third, decision processes involving marketing problems should be based on the strategic plan discussed earlier in this section. This will result in complete alternatives that deal with the target market and the entire marketing mix, not just the specific variable that seems to be the primary problem. Finally, remember that there are intuitive or emotional aspects to the generation and evaluation of alternatives as well as rational, analytical aspects. The category of decisions termed �how much� (or continuous) decisions includes all the marketing and NewShoes decisions that involve setting a level for a decision variable. In NewShoes, all the pricing decisions, including the amount of the bid price, are �how much� type decisions. The amount your team decides to spend on any of the NewShoes promotion variables (consumer advertising, dealer sales promotion, etc.) and the number of salespeople to employ are all �how much� decisions, as is the amount of investment in product development. By way of comparing the two types of decisions that have been presented here, the decision of whether or not to bid on a contract is a �course of action� type decision. Once you decide to bid on the contract, the price that your NewShoes team decides to bid is a �how much� type decision. This example illustrates the interrelationship between the two types of decisions. An important step in setting levels for �how much� type of decisions is to estimate the sales response function for the variable for which the decision must be made. A sales response function for marketing variables, such as those in NewShoes, is the relationship between the level of that variable and the unit sales of your product. To visualize the relationship here, picture trying to determine the slope, direction of slope, and shape of a line on a graph of unit sales (the vertical axis) as changes occur in the level of a marketing variable (the horizontal axis). Unit sales (the vertical, Y, axis) are �responding� to changes in the level set (how much) for a particular marketing variable (the horizontal, X, axis), such as selling price, consumer advertising, and so forth. A decision-maker would like an idea of how the market might respond to different levels of these �how much� type marketing variables. That is a response function. One of the NewShoes decision aids/assignments allows you to examine and potentially estimate the response functions for the NewShoes variables.
NewShoes User�s Manual - Page 36

July � December 2006 ONLY
For �how much� type decisions, which are the dominant type of decisions in NewShoes, estimating this relationship is an important decision-making step. Estimating sales response functions accurately is possibly the most difficult task in marketing decision-making. For �how much� decisions such as expenditure levels, marketing decision-makers have no choice but to make these estimates. Again, there may be both intuitive and analytical aspects and approaches to making these estimates. Some decision-makers may have been in a particular business long enough to be able to estimate on an intuitive level what will happen to unit sales as a marketing decision variable moves from one level to another. When considering estimating sales response functions from an analytical approach, one can see why estimating these functions is a difficult process. To produce an accurate estimate of a response function for a particular variable, such as advertising expenditures, one would have to conduct business with several different levels of the variable in actual use in different geographic areas or at different times. While using these different advertising expenditure levels, the decision-maker would have to keep all other marketing variables stable because changing them will also affect the unit sales you are measuring. Besides these difficulties, any actions your competitors take in the market place will affect your results. In addition, a change in the general business climate will also affect any response function estimates. Thus, response function estimation is a difficult, albeit necessary, task for a marketing manager. The Relationship Graphs and the web-based analysis tool will aid you in this process. This section has presented many aspects of good decision-making in general and, in particular, in the context of your NewShoes company team decisions. When making your NewShoes decisions, refer back to the ideas in this section and the decision-making assistance that can be obtained from the decision aids/assignments discussed in the next part of the documentation.
Strategy and Tactics - Page 37

NewShoes User�s Manual - Page 38

July � December 2006 ONLY
Section 4: Decision Aids and Assignments This section describes the decision aids and assignments that accompany the NewShoes simulation. The assignments are designed to help you realize the full learning potential of NewShoes. Do each of the assignments that the NewShoes instructor provides carefully and use the information to make better competitive decisions. Ignore the temptation to do the assignments just to �get them over with� and �ignore the results.� Like any real-life situation, success in New Shoes depends on your level of involvement. The team with the best performance at the end of the competition will often be the one that has used these decision aids/assignments most successfully. The most important decision aids/assignments are available in the NewShoes software. The sections that follow in this guide present instructions for completion of all the decision aids/assignments, including those available in the software. Understanding the printed version of these aids is essential to effective use of the interactive version by improving your understanding of the relationships between variables. Along with discussing the technical aspects of each aid/assignment, the sections that follow show how the results can be used to make better decisions. In the following list, the decision aids/assignments are presented in groups and in the order in which they are discussed in the remainder of this section. The first two groups of aids/assignments relate most directly to making effective NewShoes decisions. These first two groups are explained in depth, especially those aids that can be done using the NewShoes software as well as the printed versions. Less time is spent discussing the final two groups of assignments. NewShoes Interactive and Printed Aids/Assignments
(1) Income Statement (Overall) (2) Income Statement (By Region) (3) Return on Sales Calculations (4) Market Share Calculations (5) Breakeven Analysis (and learning/experience curve estimator) (6) Contract Bid Analysis (Learning/experience curve effect) (7) Response Function Estimation
Printed Decision Aids/Assignments:
(8) Strategic Planning (9) Forecasting
NewShoes Related Assignments: (10) Brand-name Formulation (11) Advertising Development Other NewShoes Assignments: (12) Use of Market Research (13) Reevaluation of Strategic Plan (14) New Product Development (15) Philosophy Toward Risk (16) Team Decision-making
Decision Aids and Assignments - Page 39

Please feel free to print out and/or make multiple copies of any of the forms provided online in pdf format. An in-depth description of each assignment follows. Your instructor may ask you to complete only a subset of these assignments, but all may be helpful for improving your decision-making process. Overall Income Statement The income statement provides a summary of your team�s revenue and expenses so that you can determine the nature of your profits for a particular period of competition. This form may be completed to produce an overall income statement for all the activities of your NewShoes company. Let's go through the process using the information in figure 4.1 on the next page. Following the steps below, your company can complete an income statement using results from any period. There is a blank Income Statement form provided in the appendix. The first step in completing the form is to compute your company's revenue by region. First, take the selling price in each region multiplied by the number of units of company sales in that region. nThe selling price in the Home region was $80 per unit. Multiplying the company unit sales in the Home region of 140,793 units by the selling price in that region of $80 yields revenue of $11,263,440. This computation is made for all the regions in which your company sold its product. Thus, in the sample data, the selling price in the Domestic region, also $80 per unit, multiplied by 129,948 units equals revenue of $10,395,840. Since the Foreign market was not entered, there are no computations needed for that region. Next, the revenue from any contract bid awards the company received must be included. In the sample results, the company sold 50,000 units from a contract bid award. This is multiplied by the $21 contract bid price for revenue of $1,050,000. Finally, sum the revenue from all sources. In this example, the sources of revenue are the Home and Domestic region markets and a contract bid award. This total equals $22,709,280. The second step in completing the overall income statement is to determine the cost of goods sold. This is the manufacturing cost for all of your products sold during the period for which the income statement is being completed. Using the sample results, we see that total company sales consisted of 320,741 units and that the manufacturing cost per unit was $22.32. Multiplying these two figures together gives a total cost of goods sold of $7,158,939.12. The third step in completion of the income statement is to compute expenses for the period. To do this, first add up the expenditures in all regions. In the example, consumer advertising expenses are $900,000 in the Home region plus $1,600,000 in the Domestic region, for a total of $2,500,000. Compute consumer sales promotions in a similar fashion. The total obtained is $1,750,000. In the example, the total number of salespeople employed is 7. Multiplying this figure by the $80,000 cost per salesperson results in an expense of $560,000. The dealer sales promotions total is $850,000. Product development is an expense that needs to be included but that is not specific to a particular region. In the example, this expense equals $2,000,000. No new regions were entered for the period being examined, so start-up costs are $0. As you recall, market research costs $25,000 for each item requested. Three items of market research were requested, so the expenditure for this period is $75,000. The sum of the aforementioned expenses is $7,735,000. The fourth step in the completion of the income statement is to compute total profits (or loss). The total revenue computed of $22,709,280 minus the cost of goods sold $7,158,939.12 and total expenses $7,735,000 yields a profit of $7,815,340.88, which matches the profit on the results
NewShoes User�s Manual - Page 40

July � December 2006 ONLY
printout. The completed Overall Income Statement (Fig. 4:2) shows how you will present these figures for evaluation. Figure 4.1: Summary of Key Information Gathered From Different Reports
Profit and Cost Summary Profit Special Income Unit Cost $7,815,340.88 $.00 $22.32
Sales Summary Home Domestic Foreign Contractor Total Region Region Region Sales Sales Company 140,793 129,948 0 50,000 320,741 Industry 303,562 537,993 50,870 50,000 942,425
Market Research Information
Home Region Domestic Region Foreign Region Avg. Price $67.56 Avg. Advertising Avg. Consumer Promotions $1,200,534 Avg. No. of Salespeople 8 Avg. Dealer Promotions You are now selling Version 2 ***********************************Bulletin******************************** Decisions for Period 4 are due by 5:00 PM PST on Tuesday March 11. The forecasts for Period 6 are similar to those for Period 5. Home Region: Stable to up slightly Domestic Region: Stable Foreign Region: Poor
***************** ********************************************************** Input Decisions for Period 5
Company Decisions Home Region Domestic Region Foreign Region Price $80.00 $80.00 $.00 Consumer Advertising $900,000.00 $1,600,000.00 $.00 Consumer Promotions $1,000,000.00 $750,000.00 $.00 No. of Salespeople 2 5 0 Dealer Promotions $100,000.00 $750,000.00 $.00 Product Development $2,000,000.00 Contractor Bid $21.00
Market Research Requests Home Region Domestic Region Foreign Region Average Price YES Avg Advertising Avg Consumer Promotions YES Avg No. of Salespeople YES Avg Dealer Promotions
Decision Aids and Assignments - Page 41
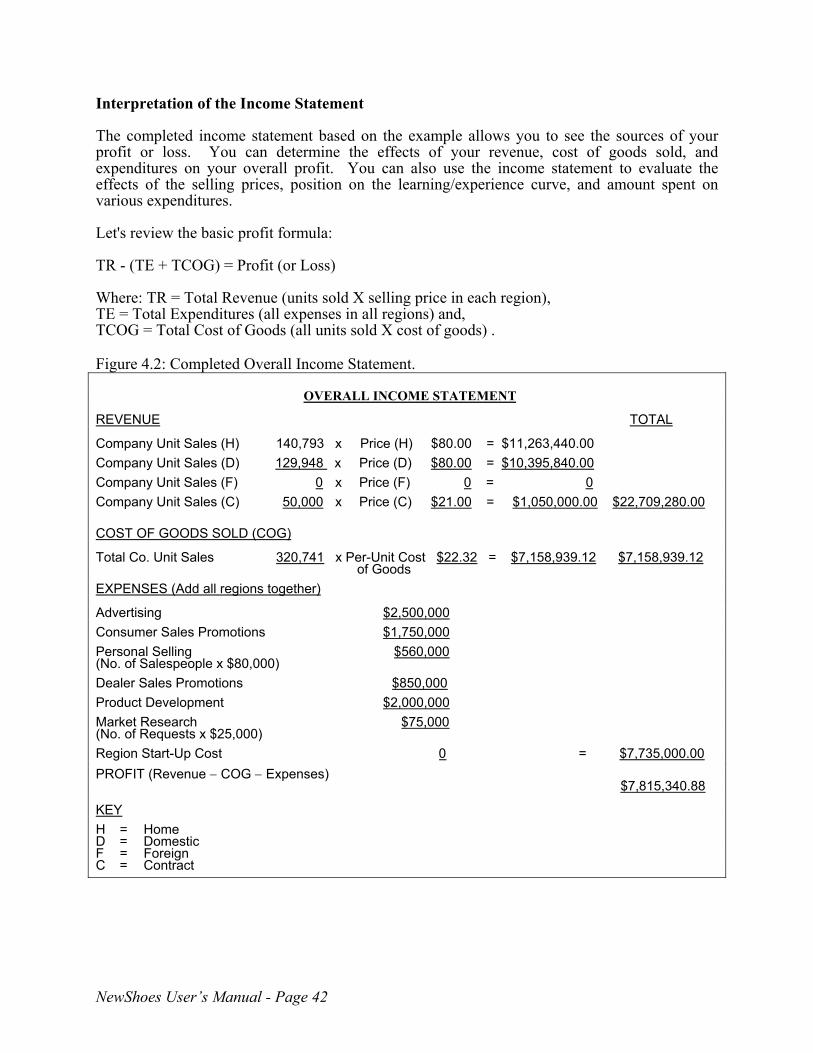
Interpretation of the Income Statement The completed income statement based on the example allows you to see the sources of your profit or loss. You can determine the effects of your revenue, cost of goods sold, and expenditures on your overall profit. You can also use the income statement to evaluate the effects of the selling prices, position on the learning/experience curve, and amount spent on various expenditures. Let's review the basic profit formula: TR - (TE + TCOG) = Profit (or Loss)
Where: TR = Total Revenue (units sold X selling price in each region), TE = Total Expenditures (all expenses in all regions) and, TCOG = Total Cost of Goods (all units sold X cost of goods) . Figure 4.2: Completed Overall Income Statement.
OVERALL INCOME STATEMENT REVENUE TOTAL C ompany Unit Sales (H) 140,793 x Price (H) $80.00 = $11,263,440.00 C ompany Unit Sales (D) 129,948 x Price (D) $80.00 = $10,395,840.00 C ompany Unit Sales (F) 0 x Price (F) 0 = 0 C ompany Unit Sales (C) 50,000 x Price (C) $21.00 = $1,050,000.00 $22,709,280.00 COST OF GOODS SOLD (COG) Total Co. Unit Sales 320,741 x Per-Unit Cost $22.32 = $7,158,939.12 $7,158,939.12 of Go ods EXPENSES (Add all regions together) A dvertising $2,500,000 Consumer Sales Promotions $1,750,000 Personal Selling $560,000 ( No. of Salespeople x $80,000) D ealer Sales Promotions $850,000 P roduct Development $2,000,000 Market Research $75,000 ( No. of Requests x $25,000) R egion Start-Up Cost 0 = $7,735,000.00 PROFIT (Revenue − COG − Expenses) $7,815,340.88 K EY H = Home D = Domestic F = Foreign C = Contract
NewShoes User�s Manual - Page 42

July � December 2006 ONLY
This formula presents an income statement in its most rudimentary form and brings competition in NewShoes down to its fundamental level. As noted in previous readings, your company needs to generate enough total revenue, while keeping expenditures at an effective but low level and cost of goods (manufacturing costs) as low as possible, to make a profit. Another way to utilize the income statement is to compute the ratio of cost of goods sold and each expenditure item (consumer advertising, number of salespeople, etc.) to total revenue. You can then monitor these percentages (or ratios) as the course of the NewShoes competition proceeds. One application of examining these ratios would be to identify cost items that may be increasing too rapidly. Means of controlling these cost items can then be considered. Other ratios can also be examined. For example, you can determine whether a high consumer advertising to personal selling expenditure ratio results in higher profits. You can then use this information to decide whether to increase or decrease your spending on a certain marketing variable. Finally, an income statement for the current period is available by using the menu option, �Income Statement� under the �Decision Aids� menu on the left side of your NewShoes screen. Income Statement by Region An income statement by region tells you the profitability of each region in which your company team is operating. This enables you to make strategic decisions about whether to continue to market in a particular region. It also enables you to see when the marketing mix variables need to be adjusted in a particular region. It is a good idea to do a regional income statement every period for each region in which you sell your product. We can illustrate the income statement calculations for the Home and Domestic regions using the same sample company period results as in the previous example. The steps in completing a regional income statement follow those presented for completing an overall income statement. Start with a blank Income Statement by Region form and fill out the region name (Home, Domestic, or Foreign) and period number for which it is being completed. This eliminates confusion when completing multiple income statements. As with the overall income statement, the first step is to calculate the total regional revenue. This is just a simplification of the procedure undertaken for your overall company income statement in that just the Home region information needs to be considered. To calculate Home region revenue, take the total units sold in the region, 140,793, and multiply this number by the selling price in the region, $80. This equals $11,263,440. Next, compute the cost of goods sold for the region. To determine this figure, take the total units sold in that region times the unit cost. This should equal $3,142,499.76. Complete the expense portion of the income statement next. Enter the expenses for the region from the sample results printout. Don�t forget the market research requests that apply to the region on which you are working. Note that the product development expenses need to be pro-rated in some fashion since these expenses help sales in all regions. Pro-rating in this case means to assign a portion of the expense to each of the regions in which your company is doing business. The best way to pro-rate this expense is to compute the percentage of unit sales in a particular region of the total company unit sales. (Note that we do not include the sales for contract bids because product development does not influence receiving these contracts.)
Decision Aids and Assignments - Page 43

In our example, the pro-rated percentage for the Home region is .52 (140,793 divided by 270,741). Multiplying this percentage times the product development expenditure results in an allocation of $1,040,000 to the Home region. After this final calculation, summing all the expenses results in total expenses of $3,225,000. Completion of the regional income statement involves subtracting cost of goods sold and total expenditures from the total revenue to yield a total profit of $4,895,940.24 for the Home region. Figure 4.3: Completed Home Region Income Statement.
INCOME STATEMENTS BY REGION Region Home Revenue 140,793 x $80 = $11,263,440.00 Units Sold Price Cost of Goods Sold 140,793 x $22.32 = $3,142,499.76 (CGS) Units Sold Unit Cost of Goods EXPENSES Advertising $900,000 Consumer Sales Promotions $1,000,000 Personal Selling (# of salespeople @ $80,000) $160,000 Dealer Sales Promotions $100,000 Product Development $1,040,000 (pro-rated, see below)* Market Research $25,000 (# of requests x $25,000) Region Start-Up Costs $0 = $3,225,000.00 Profit (Revenue − COG − Expenses) = $4,895,940.24 * * * * * * * * * * * * * * * * * * * * * * * * * * * * * * * * * * * * * * * * * * * * * * * * * * * * * * * * * * * * * * * * * * * * * *
To Pro-Rate Product Development 1) 140,793 ÷ 270,741 = .52 Sales in Region (Units) Total Company Sales (Units) Pro-Rate Percentage .52 x $2,000,000 = $1,040,000 Pro-Rate Percentage Total Product Development Product Development Expenditure Expense for this Region The procedure described here can be repeated for the Domestic and Foreign regions. Using the data in the sample company results to complete the Domestic region income statement, we find a total profit of $2,985,400.64 for the Domestic region. Check your work by viewing the completed worksheet as shown on the following page.
NewShoes User�s Manual - Page 44

July � December 2006 ONLY
Figure 4.4: Completed Domestic Region Income Statement.
INCOME STATEMENTS BY REGION Region Domestic Revenue 129,948 x $80 = $10,395,840 Units Sold Price Cost of Goods Sold 129,948 x $22.32 = $2,900,439.36 (COG) Units Sold Unit Cost of Goods EXPENSES Advertising $1,600,000 Consumer Sales Promotions $750,000 Personal Selling (# of salespeople @ $80,000) $400,000 Dealer Sales Promotions $750,000 Product Development $960,000 (pro-rated, see below)* Market Research $50,000 (# of requests x $25,000) Region Start-Up Costs $0.00 = $4,510,000 Profit (Revenue − COG − Expenses) = $2,985,400.64 * * * * * * * * * * * * * * * * * * * * * * * * * * * * * * * * * * * * * * * * * * * * * * * * * * * * * * * * * * * * * * * * * * * * * *
To Pro-Rate Product Development 1) 129,948 ÷ 270,741 = .48 Sales in Region (Units) Total Company Sales (Units) Pro-Rate Percentage .48 x $2,000,000 = $960,000 Pro-Rate Percentage Total Product Development Product Development Expenditure Expense for this Region Be sure to compute the profit or loss from any contract bid received when completing the income statement by region. The formula for doing this is:
Unit Cost Units Awarded Profit or Loss Bid Price - of Goods x from Contract = from Contract
To go through this calculation for the sample data in Figure 2, we see that the bid price was $21.00 per unit. Subtracting the unit cost of $22.32 from this bid price equals $1.32 per unit loss. Multiplying this profit (or loss) times the 50,000 units awarded on the contract results in a loss of $66,000. Add the total profits (or losses) from all regional income statements to the contract bid profit (or loss) to check your figures. This will equal the total profit in the sample company results report.
Decision Aids and Assignments - Page 45
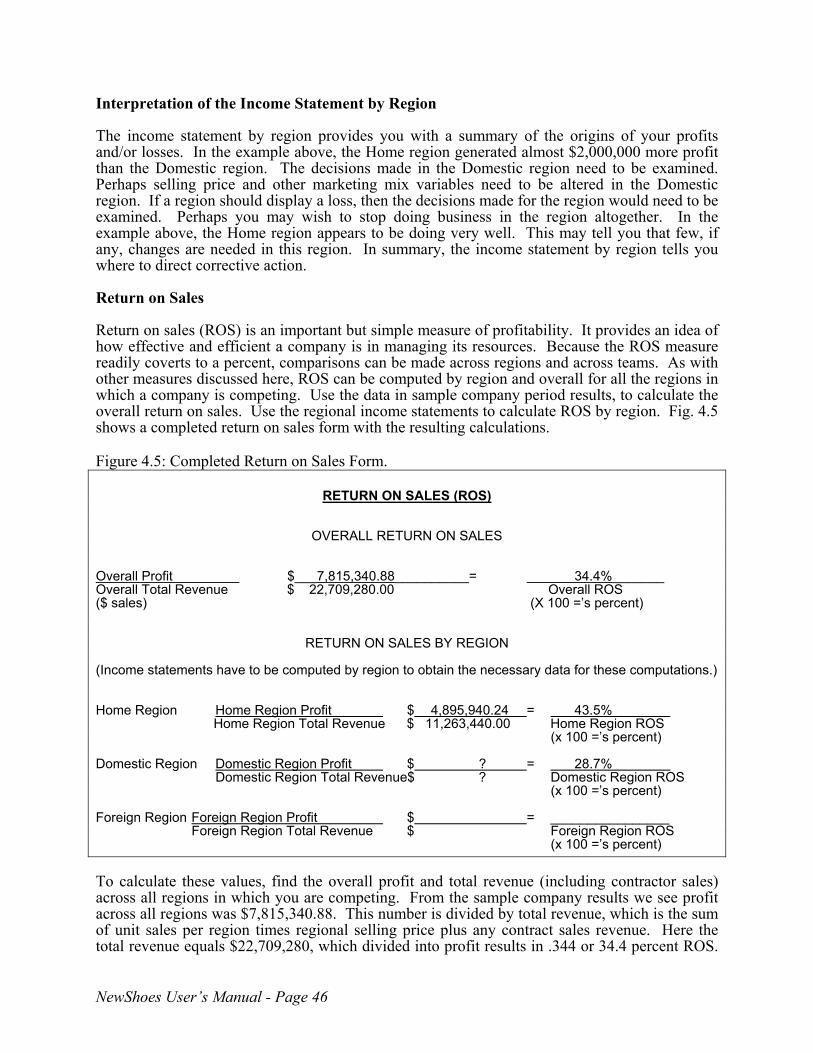
Interpretation of the Income Statement by Region The income statement by region provides you with a summary of the origins of your profits and/or losses. In the example above, the Home region generated almost $2,000,000 more profit than the Domestic region. The decisions made in the Domestic region need to be examined. Perhaps selling price and other marketing mix variables need to be altered in the Domestic region. If a region should display a loss, then the decisions made for the region would need to be examined. Perhaps you may wish to stop doing business in the region altogether. In the example above, the Home region appears to be doing very well. This may tell you that few, if any, changes are needed in this region. In summary, the income statement by region tells you where to direct corrective action. Return on Sales Return on sales (ROS) is an important but simple measure of profitability. It provides an idea of how effective and efficient a company is in managing its resources. Because the ROS measure readily coverts to a percent, comparisons can be made across regions and across teams. As with other measures discussed here, ROS can be computed by region and overall for all the regions in which a company is competing. Use the data in sample company period results, to calculate the overall return on sales. Use the regional income statements to calculate ROS by region. Fig. 4.5 shows a completed return on sales form with the resulting calculations. Figure 4.5: Completed Return on Sales Form.
RETURN ON SALES (ROS)
OVERALL RETURN ON SALES Overall Profit $___7,815,340.88__________= 34.4%_______ Overall Total Revenue $ 22,709,280.00 Overall ROS ($ sales) (X 100 =�s percent)
RETURN ON SALES BY REGION
(Income statements have to be computed by region to obtain the necessary data for these computations.)
Home Region Home Region Profit $ 4,895,940.24 = 43.5% Home Region Total Revenue $ 11,263,440.00 Home Region ROS (x 100 =�s percent) Domestic Region Domestic Region Profit $ ? = 28.7% Domestic Region Total Revenue$ ? Domestic Region ROS (x 100 =�s percent) Foreign Region Foreign Region Profit $ = ________________ Foreign Region Total Revenue $ Foreign Region ROS (x 100 =�s percent) To calculate these values, find the overall profit and total revenue (including contractor sales) across all regions in which you are competing. From the sample company results we see profit across all regions was $7,815,340.88. This number is divided by total revenue, which is the sum of unit sales per region times regional selling price plus any contract sales revenue. Here the total revenue equals $22,709,280, which divided into profit results in .344 or 34.4 percent ROS.
NewShoes User�s Manual - Page 46
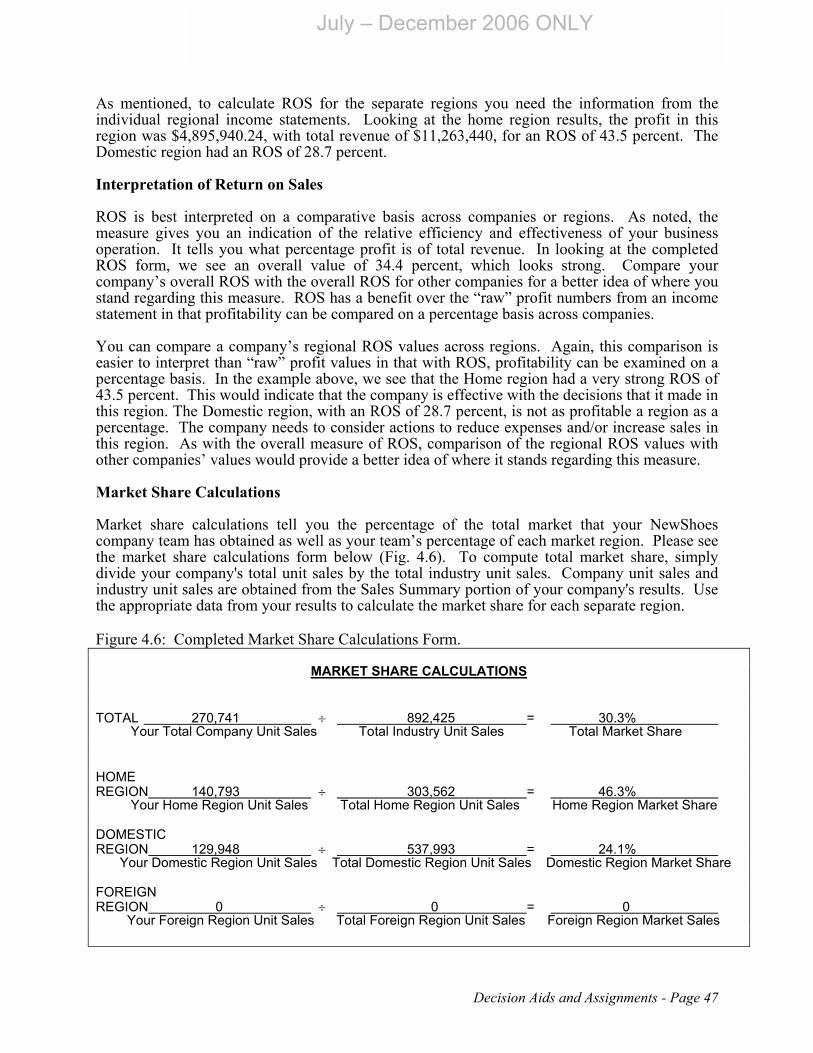
July � December 2006 ONLY
As mentioned, to calculate ROS for the separate regions you need the information from the individual regional income statements. Looking at the home region results, the profit in this region was $4,895,940.24, with total revenue of $11,263,440, for an ROS of 43.5 percent. The Domestic region had an ROS of 28.7 percent. Interpretation of Return on Sales ROS is best interpreted on a comparative basis across companies or regions. As noted, the measure gives you an indication of the relative efficiency and effectiveness of your business operation. It tells you what percentage profit is of total revenue. In looking at the completed ROS form, we see an overall value of 34.4 percent, which looks strong. Compare your company�s overall ROS with the overall ROS for other companies for a better idea of where you stand regarding this measure. ROS has a benefit over the �raw� profit numbers from an income statement in that profitability can be compared on a percentage basis across companies. You can compare a company�s regional ROS values across regions. Again, this comparison is easier to interpret than �raw� profit values in that with ROS, profitability can be examined on a percentage basis. In the example above, we see that the Home region had a very strong ROS of 43.5 percent. This would indicate that the company is effective with the decisions that it made in this region. The Domestic region, with an ROS of 28.7 percent, is not as profitable a region as a percentage. The company needs to consider actions to reduce expenses and/or increase sales in this region. As with the overall measure of ROS, comparison of the regional ROS values with other companies� values would provide a better idea of where it stands regarding this measure. Market Share Calculations Market share calculations tell you the percentage of the total market that your NewShoes company team has obtained as well as your team�s percentage of each market region. Please see the market share calculations form below (Fig. 4.6). To compute total market share, simply divide your company's total unit sales by the total industry unit sales. Company unit sales and industry unit sales are obtained from the Sales Summary portion of your company's results. Use the appropriate data from your results to calculate the market share for each separate region. Figure 4.6: Completed Market Share Calculations Form.
MARKET SHARE CALCULATIONS TOTAL 270,741 ÷ 892,425 = 30.3% Your Total Company Unit Sales Total Industry Unit Sales Total Market Share HOME REGION 140,793 ÷ 303,562 = 46.3% Your Home Region Unit Sales Total Home Region Unit Sales Home Region Market Share DOMESTIC REGION 129,948 ÷ 537,993 = 24.1% Your Domestic Region Unit Sales Total Domestic Region Unit Sales Domestic Region Market Share FOREIGN REGION 0 ÷ 0 = 0 Your Foreign Region Unit Sales Total Foreign Region Unit Sales Foreign Region Market Sales
Decision Aids and Assignments - Page 47

You should calculate your market share for the total industry and then for each region where your company operates. It is very important that you have a standard against which you can compare your company's market share. This standard is the average market share for all competitors in the NewShoes competition. Compute this figure as follows:
There are three teams competing in the sample simulation results that have been used in this section. Thus, according to the formula above, the average market share is 1/3 or 33 percent. This average market share is used as the standard against which to compare your company's market share figure. Using the data in Figure 2 and entering the appropriate values into the market share calculations form, we find that the total market share for the sample company is 30.3 percent. By comparing this figure to the industry average of 33 percent, we see that the company seems to be a little below average in total market share. Note: If a contract bid has been won, as is the case for the team in this example, these units need to be subtracted from your total unit sales to obtain the correct value for the market share calculation. Follow the same calculation procedures for each region in which your company team competes. Note that company teams may enter and leave the three regions and that this can affect the average market share against which you will be comparing your figures. This may make an accurate average regional market share difficult to determine. There are three teams in the Home and Domestic regions in our sample data. From the regional calculations, we see that the company has 46.3 percent of the Home region market, which is well above average, and 24.2 percent in the Domestic region, which is below average. Interpretation of Market Share Market share tells you how your unit sales, in total and by region, compare with the other competing teams. Note that market share does not necessarily have to relate directly to profit. For example, a company can set a very low price on its product, relative to its competitors, and �buy� market share. The company�s market share may be very high, but they may be operating at a loss because of the low price they are charging. Market share is important to profits in the long run. Above-average market share means above-average unit sales. This tells you that your company's costs are decreasing faster than your competitors' due to the learning/experience curve effect. You may thus want to sacrifice short-term profits for a high market share because your costs may be lower than your competitors and thus your profits higher than your competitors in the long run. Examining the sample company results and comparing regional profit to regional market share, we see that there are high profits and high market share in the Home region. This is a very strong region for the company. In the Domestic region, for the sample company, there were good profits but relatively low market share. In this region, the company should be wary of possible dominance that may be developing on the part of one of its competitors. Breakeven Analysis A breakeven analysis can be performed to help determine the lowest level at which to set a selling price in a region and still break even. Performing this analysis can help to avoid costly mistakes, such as pricing too low and thus losing a large amount of money. The Breakeven
NewShoes User�s Manual - Page 48

July � December 2006 ONLY
Analysis form will help you perform these calculations. The top of the form (Fig. 4.7) presents the formula to be used in this analysis, and the bottom of the form provides a worksheet area. This analysis is done separately for each region and should be completed before you make your period decisions. The key variables are entered in the worksheet portion of the form and then transferred to the formula portion of the form. First, obtain the anticipated sales by forecasting your company�s unit sales for the region being analyzed (see the upcoming section regarding forecasting). Next, obtain the anticipated unit cost of goods by adding your company�s cumulative unit sales to date, plus forecasted unit sales for the period being examined for all regions, plus any contract sales you expect to obtain in the period. Take the resulting number and consult the learning/experience curve graph or use the NewShoes software. Figure 4.7: Breakeven Analysis Form.
SELLING PRICE
BREAKEVEN ANALYSIS
REGION Home
FORMULA Anticipated Expenses (in Total Dollars) Breakeven Price = Anticipated Sales + Anticipated Unit (in Units) Cost of Goods * * * * * * * * * * * * * * * * * * * * * * * * * * * * * * * * * * * * * * * * * * * * * * * * * * * * * * * * * * * * * * * * * * * * * *
WORKSHEET Anticipated Sales (Forecast for Region in Units) 170,000 (Forecast for Total Company Sales
for all regions, in units) 300,000 Anticipated Unit Costs of Goods (From Learning/Experience Curve -- consult graph) $21.00 Anticipated Expenses Region Expenses $1,100,000 Advertising $1,200,000 Consumer Sales Promotion $240,000 Personal Selling (# of salespeople x salary) $400,000 Dealer Sales Promotion $680,000 Product Development (pro-rated) (Regional sales ÷ total sales) x product development of $1.2M $100,000 Market Research (# of reports in region x cost of report) $0 Region Start-Up Cost (Total) $3,720,000
Decision Aids and Assignments - Page 49
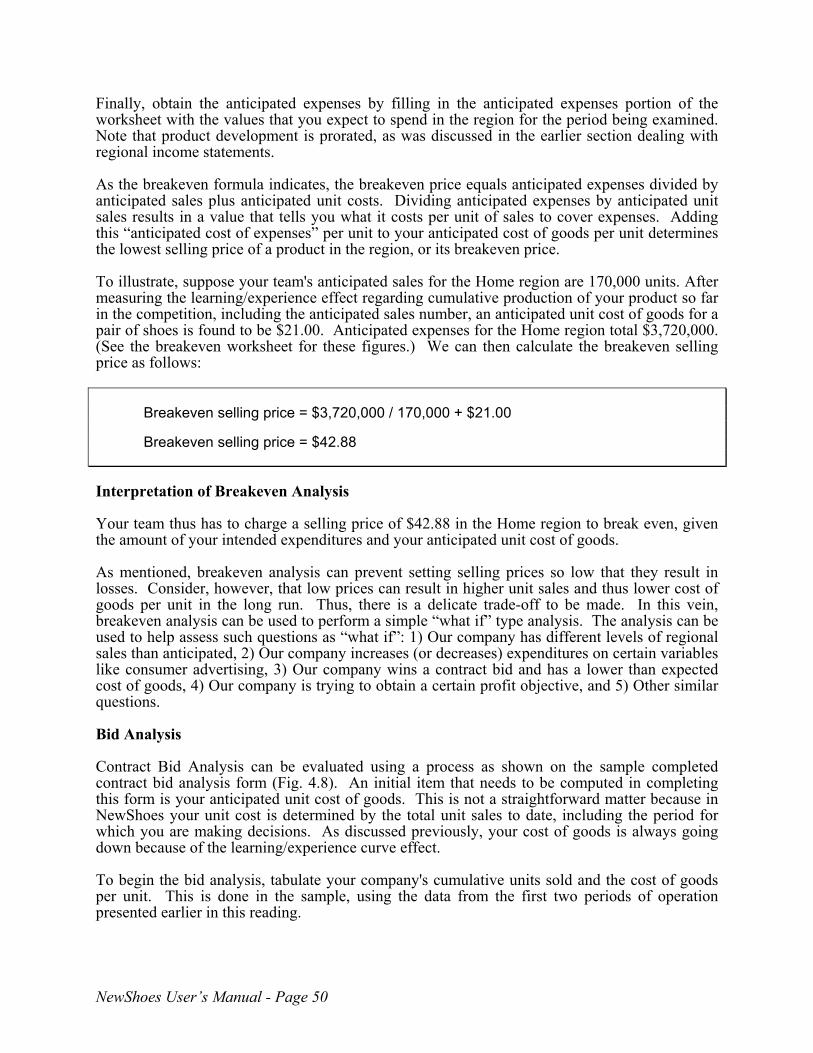
Finally, obtain the anticipated expenses by filling in the anticipated expenses portion of the worksheet with the values that you expect to spend in the region for the period being examined. Note that product development is prorated, as was discussed in the earlier section dealing with regional income statements. As the breakeven formula indicates, the breakeven price equals anticipated expenses divided by anticipated sales plus anticipated unit costs. Dividing anticipated expenses by anticipated unit sales results in a value that tells you what it costs per unit of sales to cover expenses. Adding this �anticipated cost of expenses� per unit to your anticipated cost of goods per unit determines the lowest selling price of a product in the region, or its breakeven price. To illustrate, suppose your team's anticipated sales for the Home region are 170,000 units. After measuring the learning/experience effect regarding cumulative production of your product so far in the competition, including the anticipated sales number, an anticipated unit cost of goods for a pair of shoes is found to be $21.00. Anticipated expenses for the Home region total $3,720,000. (See the breakeven worksheet for these figures.) We can then calculate the breakeven selling price as follows: Breakeven selling price = $3,720,000 / 170,000 + $21.00 Breakeven selling price = $42.88 Interpretation of Breakeven Analysis Your team thus has to charge a selling price of $42.88 in the Home region to break even, given the amount of your intended expenditures and your anticipated unit cost of goods. As mentioned, breakeven analysis can prevent setting selling prices so low that they result in losses. Consider, however, that low prices can result in higher unit sales and thus lower cost of goods per unit in the long run. Thus, there is a delicate trade-off to be made. In this vein, breakeven analysis can be used to perform a simple �what if� type analysis. The analysis can be used to help assess such questions as �what if�: 1) Our company has different levels of regional sales than anticipated, 2) Our company increases (or decreases) expenditures on certain variables like consumer advertising, 3) Our company wins a contract bid and has a lower than expected cost of goods, 4) Our company is trying to obtain a certain profit objective, and 5) Other similar questions. Bid Analysis Contract Bid Analysis can be evaluated using a process as shown on the sample completed contract bid analysis form (Fig. 4.8). An initial item that needs to be computed in completing this form is your anticipated unit cost of goods. This is not a straightforward matter because in NewShoes your unit cost is determined by the total unit sales to date, including the period for which you are making decisions. As discussed previously, your cost of goods is always going down because of the learning/experience curve effect. To begin the bid analysis, tabulate your company's cumulative units sold and the cost of goods per unit. This is done in the sample, using the data from the first two periods of operation presented earlier in this reading.
NewShoes User�s Manual - Page 50
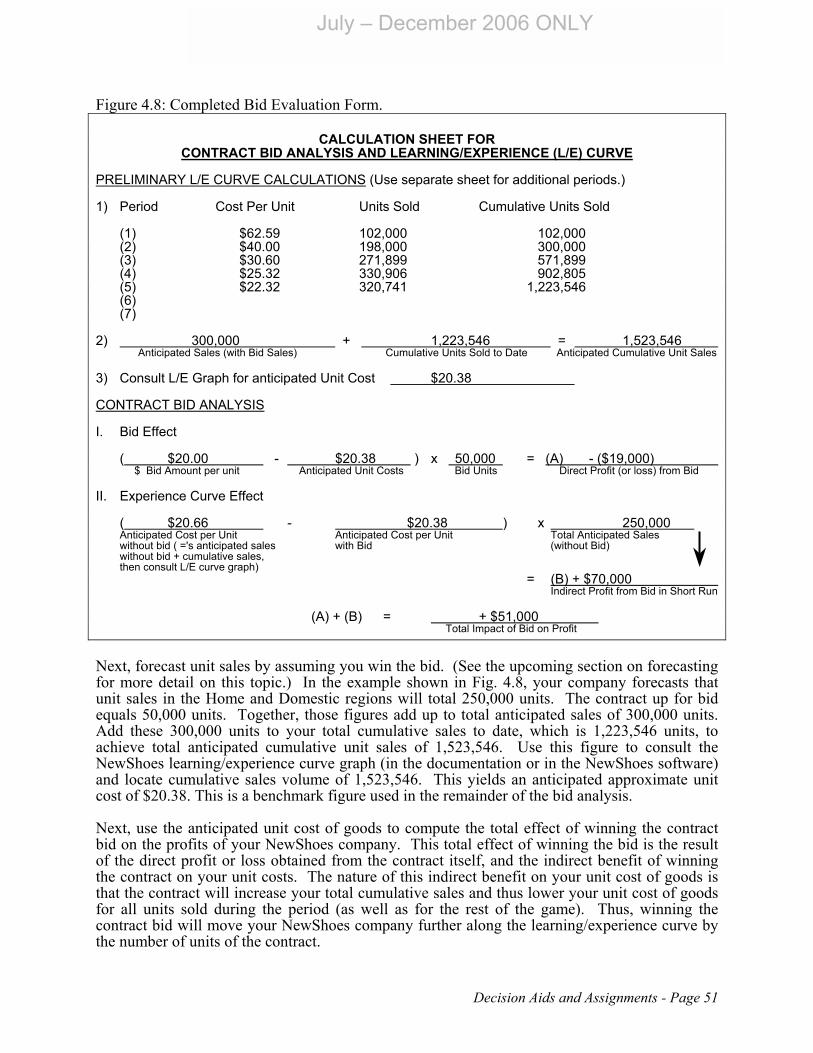
July � December 2006 ONLY
Figure 4.8: Completed Bid Evaluation Form.
CALCULATION SHEET FOR CONTRACT BID ANALYSIS AND LEARNING/EXPERIENCE (L/E) CURVE
PRELIMINARY L/E CURVE CALCULATIONS (Use separate sheet for additional periods.) 1) Period Cost Per Unit Units Sold Cumulative Units Sold (1) $62.59 102,000 102,000 (2) $40.00 198,000 300,000 (3) $30.60 271,899 571,899 (4) $25.32 330,906 902,805 (5) $22.32 320,741 1,223,546 (6) (7) 2) 300,000 + 1,223,546 = 1,523,546 Anticipated Sales (with Bid Sales) Cumulative Units Sold to Date Anticipated Cumulative Unit Sales 3) Consult L/E Graph for anticipated Unit Cost $20.38 CONTRACT BID ANALYSIS I. Bid Effect ( $20.00 - $20.38 ) x 50,000 = (A) - ($19,000) $ Bid Amount per unit Anticipated Unit Costs Bid Units Direct Profit (or loss) from Bid II. Experience Curve Effect ( $20.66 - $20.38 ) x 250,000
Anticipated Cost per Unit Anticipated Cost per Unit Total Anticipated Sales without bid ( ='s anticipated sales with Bid (without Bid) without bid + cumulative sales, then consult L/E curve graph) = (B) + $70,000 Indirect Profit from Bid in Short Run (A) + (B) = + $51,000 Total Impact of Bid on Profit
Next, forecast unit sales by assuming you win the bid. (See the upcoming section on forecasting for more detail on this topic.) In the example shown in Fig. 4.8, your company forecasts that unit sales in the Home and Domestic regions will total 250,000 units. The contract up for bid equals 50,000 units. Together, those figures add up to total anticipated sales of 300,000 units. Add these 300,000 units to your total cumulative sales to date, which is 1,223,546 units, to achieve total anticipated cumulative unit sales of 1,523,546. Use this figure to consult the NewShoes learning/experience curve graph (in the documentation or in the NewShoes software) and locate cumulative sales volume of 1,523,546. This yields an anticipated approximate unit cost of $20.38. This is a benchmark figure used in the remainder of the bid analysis. Next, use the anticipated unit cost of goods to compute the total effect of winning the contract bid on the profits of your NewShoes company. This total effect of winning the bid is the result of the direct profit or loss obtained from the contract itself, and the indirect benefit of winning the contract on your unit costs. The nature of this indirect benefit on your unit cost of goods is that the contract will increase your total cumulative sales and thus lower your unit cost of goods for all units sold during the period (as well as for the rest of the game). Thus, winning the contract bid will move your NewShoes company further along the learning/experience curve by the number of units of the contract.
Decision Aids and Assignments - Page 51

It may be to your advantage to take a loss on the bid contract, because the additional lowering of the unit cost will more than make up for this short term loss. A company must thus balance these competing factors. Complete the lower portion of the sample contract bid analysis form to determine the effect of winning the contract. First, select a bid figure that will likely be lower than the competing bids, and thus win your team the contract. This bid amount should be based on: (1) the number of teams that are likely to submit contract bids (the more teams submitting bids the more intense the competition); (2) the probability of receiving the contract at a particular bid price (for example, a bid of $100 per pair of shoes would probably have a very low probability of winning the contract, and a bid of $5 a very high probability of winning the contract); and (3) past experience (what have the winning bids been in the past?). Based on the above criteria, let us say you think that a $20.00 bid will win the contract. Enter your $20.00 bid price on the appropriate line under �Bid Effect� on the Contract Bid Analysis form. Next, subtract your anticipated unit costs of $20.38 from the bid amount of $20.00. This results in a -$0.38 loss on each unit sold on the contract. Multiplying this loss per unit times the number of units (50,000) on the contract results in a direct loss on the contract of -$19,000, should it be awarded to your team. The next item on the Contract Bid Analysis form allows you to compute the learning/experience curve benefit to the rest of the business your NewShoes company does in the regular markets. To determine the effect of winning the contract on your regular business, compute your unit cost of goods assuming your company does not win the contract bid. This simply requires you to add your anticipated unit sales, without the contract, to your cumulative unit sales thus far. As can be seen on the completed contract bid analysis form, the 250,000 units of anticipated sales, plus cumulative unit sales thus far of 1,223,546 units, results in a total cumulative anticipated sales without the contract of 1,473,546 units. Now consult the learning/experience curve graph or use the cost of goods calculator in the software and you will find a unit cost of about $20.66 for 1,473,546 cumulative units produced. Your anticipated unit cost of goods sold with the contract, $20.38, is then subtracted from the $20.66 to obtain the total per unit cost of goods savings due to the learning/experience curve effect that you will enjoy on all units sold if you win the contract bid. The $0.28 difference between these two cost figures represents the per-unit saving in cost of goods that result from winning the contract. Multiplying this figure by your total forecasted unit sales without the bid of 250,000 units results in the amount of $70,000. This is the indirect additional profit from your regular, non-contract, business your NewShoes company can expect if it won the contract bid. Finally, sum the direct and indirect profit impact information to determine a total profit impact of $51,000 in our example. This assumes your forecasts are correct and that you win the contract bid at the price specified with no splitting of the contract due to tie bids. Notice that the total effect of winning the contract bid is positive even though your team lost money on the contract itself because you bid below your expected unit costs. Interpretation of Bid Analysis To use the bid analysis decision aid effectively, go through the procedure above for several different forecasted unit sales levels and bid price levels. This will give you a range of results to examine before determining your bid.
NewShoes User�s Manual - Page 52

July � December 2006 ONLY
The following formula can help you systematically evaluate various bid prices:
Lowest bid that will
break even =
Anticipated Unit Cost
with Contract -
Indirect Profit from
Contract Bid Units This formula does not consider different forecasts for unit sales, just different bid prices using one forecast. To work through this formula with figures from the above example, we see that anticipated unit cost of goods, if we get the contract bid, is $20.38. If we divide the amount of indirect profit we expect if we win the contract bid by the number of units in the contract, the result is a figure that tells us how much less per unit we can bid before we break even. By doing this analysis, we see how much lower we can bid before we have eaten up all the indirect profit we would make in our regular business and thus break even for the period. In the example, the indirect profit from the bid, which is $70,000, divided by the contract bid units, which are 50,000 units equals $1.40. If you subtract this number from the anticipated unit cost with the contract bid of $20.38, the result is $18.98. This is the lowest price the team can bid and break even on company operations for the period. Analyze the market and past bidding history to find out how much higher you can bid over $18.98 and still have a chance to receive the contract sales. Careful analysis of the bid in this fashion can help you avoid two mistakes. One is bidding needlessly high and never benefiting from the potential unit cost of goods reduction due to the effect of contract sales on the learning/experience curve. The other mistake is bidding too low and losing money. Both mistakes are especially costly when the number of units for contract sales is very high. There are limitations to the bid analysis exercise that you should consider. First, winning a contract bid will lower your unit costs for the rest of the game, and not just the present period. Thus, you may want to consider going even lower than your breakeven point on the bid. In a sense what you are doing is buying your way down the learning/experience curve. Also, consider that the benefit of moving further down the learning/experience curve is reduced later in the game as the learning/experience curve flattens out. Another point to consider is that the bid analysis is based on anticipated sales, which you estimate and provide. Estimating Response Functions The previous section (�Strategy and Tactics�) discussed the importance of estimating response functions when dealing with �how much� type decisions. As you may recall, one can estimate the response functions for the marketing mix variables in NewShoes by plotting the relationship between levels of these variables, set in prior decisions, and unit sales. This will help you determine the optimal level at which to set each NewShoes decision variable. The more data you have, that is, the more decisions you have made using different levels of the NewShoes variables, the more information you will derive from this exercise. You may want to revisit the strategy and tactics discussion again regarding the importance and difficulty of estimating response functions. Sample functional relationship graphs (See Fig. 4.9) can aid in estimating the response functions for the NewShoes variables. The horizontal axis on each graph indicates these variables. As you can see, response functions can be estimated for consumer advertising, consumer sales promotion, number of salespeople, dealer sales promotion, and price.
Decision Aids and Assignments - Page 53

You will need your results for as many periods of NewShoes decisions as you have available to perform response function estimation. As noted above, the more data you use in making these estimates, the better the information that can be obtained. If you like, you can include the data from Periods 1 and 2, the periods before you assumed control of your NewShoes company. These initial two periods of NewShoes, which occurred before you took over your NewShoes company, are included in the software-generated version of this decision aid. Figure 4.9: Response Function Form with Sample Data. FUNCTIONAL RELATIONSHIPS GRAPHS REGION HOME Plot your company's sales response functions for the variable in the graphs below. You should prepare these graphs for each region in which you are operating.
0
20,000
40,000
60,000
80,000
100,000
120,000
140,000
160,000
$0 $500,000 $1,000,000 $1,500,000 $2,000,000Consumer Advertising
Uni
t Sal
es
0
20,000
40,000
60,000
80,000
100,000
120,000
140,000
160,000
180,000
$0 $500,000 $1,000,000 $1,500,000
Consumer Sales Promotion
Uni
t Sal
es
5 5
0 20,000 40,000 60,000 80,000
100,000 120,000 140,000 160,000 180,000 200,000
0 1 2 3 4 5 6 7 8 9 10Number of Salespeople
Uni
t Sal
es
0
20,000
40,000
60,000
80,000
100,000
120,000
140,000
160,000
180,000
200,000
$0 $500,000 $1,000,000 $1,500,000DealerSales Promotion
Uni
t Sal
es
5 5
0
20,000 40,000
60,000
80,000 100,000 120,000 140,000
$0 $10 $20 $30 $40 $50 $60 $70 $80 $90 $100 $110 $120 $130Price
Uni
t Sal
es
5
NewShoes User�s Manual - Page 54

July � December 2006 ONLY
It is important to note that Response Function Estimation forms should be completed separately for each region. Each NewShoes market region is likely to have a unique response to the different marketing mix variables. Keeping the data from the different NewShoes regions separate will enable a more accurate estimate of each market region�s response functions. Let's use the data from the sample company result to complete the response function estimation form. Other data in the example is hypothetical. To begin the response function estimation process, identify the market region you will be working with. In this example, we will use the Home region. Note the number of units sold in the period for that region. In this case, 140,793 units were sold in the Home region during Period 5. These 140,793 units will be the reference point on the vertical axis for all the Home region Period 5 data that will be used to estimate response functions. Now find the amount that was spent on consumer advertising for Period 5 in the Home region. This was $900,000 and can be found on the horizontal axis of the appropriate graph. Find the consumer advertising graph and plot the point where 140,793 units intersect with $900,000 in expenditures. Put a dot on the graph at this point. This point has been identified with a number 5 on the appropriate graph. The same procedure can be performed for consumer sales promotion, where Period 5 unit sales were again 140,793 units for the Home region and expenditures for consumer sales promotion were $1,000,000. You can find this point plotted on the consumer sales promotion portion of the response function graphs. Repeat this same procedure for the rest of the marketing mix variables. Note that for salespeople the horizontal axis is number of people instead of dollars. You have now completed one period worth of data for response function estimation for the Home region. Next, take the results from the other periods to be included in the analysis and plot them on the graph. As mentioned, data from Periods 1 and 2 can be incorporated into the graph, if desired. When you have plotted all the periods of results that you choose to use, you have completed the data collection for the Home region. Repeat this entire procedure for the Domestic and Foreign regions if you are operating in those markets. Plot your company's sales response functions for each variable in the Functional Relationship Graphs form found in the appendix. You should prepare these graphs for each region in which you are operating. Interpretation of Response Function Estimation Let�s review the sample functional relationships graphs for the home region in figure 4.9. The data are plotted for five periods. The first step is to try to fit a line through the points. This is NOT connecting the dots in order of period number or from left to right or in any other fashion. This is trying to determine a pattern that the points seem to display. We are trying to fit a line through the data points as might be done in a regression analysis. Even in the software version of this decision aid, the line must be fitted by hand through the data points. The line can be curved or straight, depending on which best fits the data points. The lines that seem to fit the sample Home region data have been drawn. If a variable for which you are trying to estimate the response function did not vary much over the periods that you use for data, this estimation technique will not tell you much. For example, if your company�s selling price in the Home region was $80 for all periods examined, the straight vertical line that would fit the data does not say anything about the effect of different levels of price on unit sales. Note, the more variability in the levels of the NewShoes marketing mix variables used as data in this response function estimation procedure, the more useful the resulting information will be.
Decision Aids and Assignments - Page 55

Be aware that changes that you make in the marketing mix variables, other than the one that you may be currently examining, will influence the data plots used in response function estimation. The actions of your competitors will also influence these data plots. If it is difficult to fit a line through the data plots used to estimate the response function for a variable, or the determined pattern does not make a lot of sense, then the two influences just discussed may be operating. The following is an interpretation of what the patterns in the sample functional relationship graphs seem to convey. Again, the data are hypothetical so the interpretations that follow should be viewed as hypothetical. Concerning consumer advertising, it appears that expenditures up to $2,000,000 show a moderate upward trend in unit sales. Thus, in this example, as far as the data go, there appears to be a moderate positive relationship between units sold and consumer advertising. Increased consumer sales promotion expenditures yielded a strong increase in unit sales. Thus you might want to spend the maximum recommended amount of $1,000,000 on such promotion. For the salespeople response function, there appears to be a �V� shaped curve for the Home region. That is, both a low and a high number of salespeople resulted in increased units sold. A moderate number of salespeople resulted in a decline in units sold. If this graph is accurate, then a moderate number of salespeople should be avoided. In this example, dealer sales promotion showed a moderate increase in units sold as expenditures increased. It appears to be a similar response to that found for consumer advertising, only perhaps �flatter� (less responsive). Because of how moderate the response to dealer sales promotion in the Home region seems from this graph, spending on this activity should be kept at an effective minimum. The topic later in this section of market research and its relationship to market share might also be useful to examine regarding this promotion item. Units sold seem to display an inverted �U� shaped response to selling price. That is, a selling price of less than or more than about $85 appears to result in decreased unit sales in this data for the Home region. Perhaps low prices result in reduced unit sales due to a poor image generated by such a price. Higher prices might make the shoes too expensive, in that consumers may not feel they are getting value for their dollar. Thus, setting the selling price at about $85 in the Home region, in this example, would be the optimum decision. Again, these interpretations are hypothetical. Interpretation of the response function graphs requires intuitive skill and is probably one of the more difficult tasks in NewShoes. Essentially, look for the point on the fitted line beyond which the level set for a NewShoes variable seems to have little effect on unit sales. This would then be the optimal level for that NewShoes variable in a particular region. It makes no sense to spend more on a promotion variable or to set a price other than at the optimal point because such expenditures and prices have little additional effect on unit sales and only serve to waste or lose money. To use this decision aid effectively, consider the comments in strategy and tactics readings regarding response functions!! Graphing the relationship between unit sales and the various NewShoes marketing mix variables can be a good guide to making decisions. It would be advantageous to experiment with various levels of the NewShoes variables early in the competition in order to determine the best levels to use later on. It would also be to your benefit to update these graphs as the competition progresses.
NewShoes User�s Manual - Page 56

July � December 2006 ONLY
Completion of Printed Decision Aids/Assignments Strategic Planning Strategic planning should be an early activity of your NewShoes team. The prior discussion in the strategy and tactics documentation provides initial exposure to this topic and introduces the Strategic Planning form. The first step in the strategic planning process is to develop a mission statement. For example, the mission of your NewShoes company might be to be first in cumulative profit among all the competing teams. Or your mission might say something about providing the market with the most advanced product possible, which indicates a research and development emphasis. Because of its broad generic nature, your team's mission should not have to be changed during the competition. Next, identify your objectives and goals. These will help your company identify where it is going, which actually is the initial step in deciding how to get there. Objectives and goals are the specific items that need to be accomplished in order to achieve your mission. They are benchmarks against which you can evaluate the activities of your firm. Goals and objectives can include comments about such things as profit, return on sales, market share, unit cost of goods, and so forth. Next, the specifics of the strategy that you adopt should directly aid in attaining the objectives and goals your team has set. Determining your target market may involve comments regarding the markets available in NewShoes, such as the regions in which you will compete, those you plan to dominate, timing of entry into these market regions, and so forth. In this section of your strategic plan, you may also want to say something about which price/quality end of the consumer market you might be pursuing. For example, you could say your company is going to pursue the low end of the market, where people want inexpensive shoes, or the high end of the market, where people want more expensive, prestigious shoes. Another component of the strategy your team adopts is to determine what you plan to do with regard to each element of the marketing mix (price, place, promotion, and product). Considering what your team anticipates doing in each region regarding these variables is an important part of your NewShoes strategy and should be specified as early as possible in the competition. Note, a region in NewShoes can be considered as both the target market and as the place component of the marketing mix. Continue to evaluate the strategic plan your team has laid out as the competition progresses. If you are not attaining the established objectives and goals, the specifics of your plan might need to be reworked. Forecasting Forecasting is predicting your total unit sales for the next period as well as the unit sales for each region. This can be helpful in determining your potential profits as well as an aid in determining any contract bids your team wishes to submit (see the earlier discussion of bid analysis). There are a variety of methods available to forecast sales. A variety of forecasting approaches are likely to be presented in your textbook and/or lectures. The simplest forecasting approach is to compute a moving average, which is an average of a specified number of prior periods� sales. For example, assume your unit sales figures for Periods 1, 2, and 3 are:
Decision Aids and Assignments - Page 57

Period 1 102,000 Period 2 198,000 Period 3 233,760
To get a rough sales forecast, simply take the average of the three periods, which equals 177,920 units. You might want to adjust this figure upward or downward, considering the following items:
a. Trend: This is the general direction sales seem to be moving. In the example above, the overall direction of change in sales is upward, so you may want to adjust the sales forecast upward.
b. Entering or leaving a region: If you enter the foreign market, for example, sales will
increase. Leaving a region will have the opposite effect. c. Price: Changing the selling price in a region will affect sales. A response function
relating unit sales to price can help in making this adjustment. See the previous section on estimating response functions.
d. Other market mix variables: Changing the amount spent on consumer advertising,
and other variables, will have an effect on next period sales. Again, consider the shape of the response function for each of these variables, for each region.
e. Region forecasts: For example, a region predicted to grow would be likely to display
an increase in sales. Consider the overall effect of the regional forecasts that you might be given by the simulation administrator.
Forecasting, as mentioned earlier, can be an important decision-making tool. If your forecasted unit sales are low, you might want to adjust your marketing mix to increase sales. Forecasting can also help to determine unit cost of goods. Take your total unit sales to date and add your forecasted unit sales and any contract bid sales you expect to obtain. This will give you your predicted total cumulative unit sales volume. Then consult the learning/experience curve graph to determine your anticipated unit cost of goods for the next period. Completing NewShoes Related Assignments There are two other assignments that can be performed which do not directly relate to decision-making, but which link to the NewShoes competition in an interesting fashion. These assignments help illustrate some of the concepts that you learned from your textbook and lectures. Brand Name Selection Early in the NewShoes competition, your company team might be given the assignment of developing a brand name for your particular shoes. This brand name may also serve as your team's company name. The Brand Name Selection Form will help your NewShoes team to develop a brand identity.
NewShoes User�s Manual - Page 58

July � December 2006 ONLY
The first step in using the brand name form is to brainstorm among your team�s members and come up with ten possible brand names. You may want to eliminate brand names that are inappropriate, but it is advised that you not be overly critical at this stage in the process. Next, each team member should rate each brand name on a scale of 1 to 5 on each of the listed criteria and then provide an overall rating for the name. As noted on the form, a rating of 1 means terrible and a rating of 5 means superior. After tabulating the results, team members can discuss the final name selection and justify it in a paragraph or two at the bottom of the brand name selection form. Some basic criteria for a good brand name are presented in this assignment. As noted, the name each team develops might be used as its company name throughout the remainder of the competition. Advertising Development Using the brand name developed above, your NewShoes team may be asked to develop a sample magazine advertisement for your athletic shoes. A brief description of this assignment can be found in Appendix II. To do this assignment, first determine the target audience you wish to reach, then develop the theme for the advertisement. Remember that a good advertisement contains the following elements:
1) Copy the written portion of the ad 2) Illustration the pictures in the ad 3) Signature the identification of the sponsor
To aid in performing this assignment, it would be useful to cut out from magazines several advertisements that you find to be particularly effective. Analyze these ads and try to incorporate the positive features you find in them into the ad that your team develops. At the end of the assignment you are asked to answer several questions, such as the magazines in which the ad would appear, why the ad is a good ad, and so forth. Along with this assignment, your instructor may have you complete a form on which to evaluate each of the competing teams� magazine ads on several criteria. These evaluations might then be tabulated later, and awards of some type made to the team judged by their peers to have created the best advertisement. Completing Other NewShoes Assignments There are several additional assignments that take the general form of asking you to answer questions about what your team has been doing in NewShoes and how your team has been approaching the competition. Here are a few brief comments regarding these assignments. Market Research The Use of Market Research assignment asks you to describe your NewShoes company's orientation toward market research. The questions here are whether you invested a lot or a little in market research, how consistent you were with these expenditures, and whether you think the investment was worth it.
Decision Aids and Assignments - Page 59
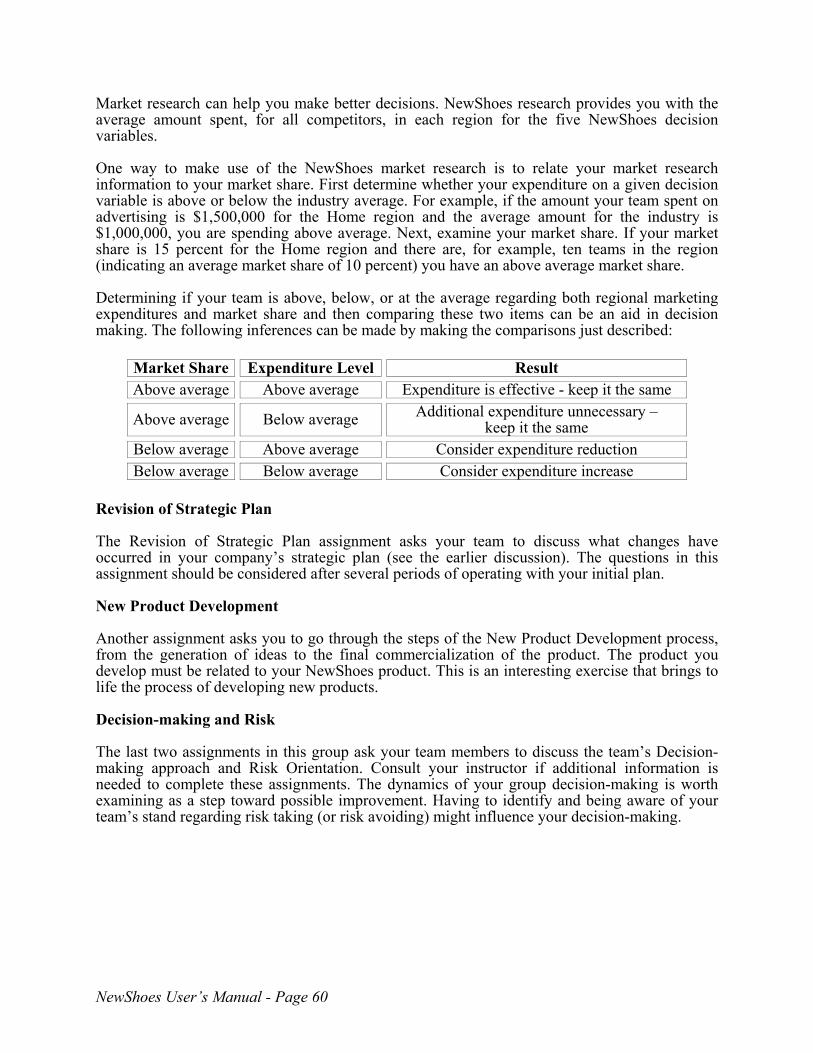
Market research can help you make better decisions. NewShoes research provides you with the average amount spent, for all competitors, in each region for the five NewShoes decision variables. One way to make use of the NewShoes market research is to relate your market research information to your market share. First determine whether your expenditure on a given decision variable is above or below the industry average. For example, if the amount your team spent on advertising is $1,500,000 for the Home region and the average amount for the industry is $1,000,000, you are spending above average. Next, examine your market share. If your market share is 15 percent for the Home region and there are, for example, ten teams in the region (indicating an average market share of 10 percent) you have an above average market share. Determining if your team is above, below, or at the average regarding both regional marketing expenditures and market share and then comparing these two items can be an aid in decision making. The following inferences can be made by making the comparisons just described:
Market Share Expenditure Level Result Above average Above average Expenditure is effective - keep it the same
Above average Below average Additional expenditure unnecessary � keep it the same
Below average Above average Consider expenditure reduction Below average Below average Consider expenditure increase
Revision of Strategic Plan The Revision of Strategic Plan assignment asks your team to discuss what changes have occurred in your company�s strategic plan (see the earlier discussion). The questions in this assignment should be considered after several periods of operating with your initial plan. New Product Development Another assignment asks you to go through the steps of the New Product Development process, from the generation of ideas to the final commercialization of the product. The product you develop must be related to your NewShoes product. This is an interesting exercise that brings to life the process of developing new products. Decision-making and Risk The last two assignments in this group ask your team members to discuss the team�s Decision-making approach and Risk Orientation. Consult your instructor if additional information is needed to complete these assignments. The dynamics of your group decision-making is worth examining as a step toward possible improvement. Having to identify and being aware of your team�s stand regarding risk taking (or risk avoiding) might influence your decision-making.
NewShoes User�s Manual - Page 60
July � December 2006 ONLY ddd
Appendix A: R Thanks to Ted Mitchell of providing the original writhe teaches.
In marketing managementto a marketing mix. If two they respond differently instance, the optimal price When a group of customerare identified, they are gSometimes these labels refthe products they tend to bbe misleading as to the automobile marketers findlittle explanatory power. Ithey focus on the kinds of have asked them to sell. T�benefits� a customer desir The Wall Street Journal complex business strategidesignation. Such is the cthe three markets do not needs, seeks different benethe marketing mix. The Home Region This was the first market twho want a high performashows that product perforFirms that fail to maintamarket, and in the other tware used by professionals reflects the wearer�s commchips in the heels of baskewith these consumers andsuperior performance of aprice point that reflects thperformance and quality thshoes as specialty goods. Rfirm�s brand. In that this fairly well established.
Make Copppies As Needeiieess AAss NNeeeeddeeMMaakkee CCoo
egional Market Descriptions
the University of Nevada-Reno for suggesting this appendix as well as e-up. Professor Mitchell developed this as an add-on for the courses
, a market is a group of final customers who respond in a similar way customers are defined as being in different markets, then by definition to different levels of advertising, sales promotion, price, etc. For and levels of promotion expense will be different in different markets.
s with similar response patterns and with sufficient purchasing power iven identifying labels such as Home Region or Foreign Region. lect the customer needs or benefits sought and sometimes they reflect uy or where they buy them. The labels used to identify markets may reasons why customers buy a product or service. For example,
popular labels such as the �sports car� or �SUV� market carry very t is well understood that marketers can design better strategies when �holes� that customers want than on the kinds of �drills� the engineers hese �holes� can be thought of as the entire marketing mix and all the es from a product.
is full of examples of marketers using popular labels to describe es to non-marketers. Sometimes these labels are just a short hand ase in NewShoes. The three labels used in the simulation to identify carry much explanatory power. However each market has different fits, and responds differently to different levels of marketing effort in
he NewShoes firm entered. It is characterized as a group of customers nce shoe such as those used by sports professionals. Market research mance is the most important element in the customer�s satisfaction. in a competitive level of product development are doomed in this o NewShoes regions for that matter. The fact that the signature shoes and have a distinctive style gives the wearer a mark of prestige and itment to his or her sport. Design gimmicks such as embedding wood tball shoes do not work in the Home Region. Advertising �registers� ad copy used in this market links the shoe�s performance to the super star(s). The market prefers a moderately elite product with a is position. Customers in the Home Region expect to pay for the ey demand. Customers in this regional market tend to shop for athletic etailers who specialize in high performance equipment seek out your
was the first market the firm entered, the channels of distribution are
NewShoes Appendix A - Page 61

The Domestic Region The success of the firm in providing high performance shoes for professional athletes also indicated a strong national demand for high quality shoes with a distinctive �professional� style. The Domestic Region market has a stronger need for demonstrated value and a lesser need for extreme performance than the Home Region. The customers in the Domestic Region are broader demographically than the Home Region. The Domestic Region wants a high quality shoe but shops for bargains and is sensitive to special deals and sales promotion. Advertising copy used in this region focuses on the shoe�s superior performance and highlights specific features such as better fit and more cushioning. However, this region is dubious, and fairly hesitant in responding, to advertising claims. Because there are many suppliers of marquee footwear that claim to have high quality, it is more difficult to get adequate distribution in the Domestic Region than in the Home Region. Generally speaking the Domestic Region falls between the Home and the Foreign Region in its responsiveness to some marketing mix variables. The Foreign Region Inexpensive running shoes and sandals are manufactured all over the world. For most people in foreign countries, buying an imported American running shoe would be seen as an extreme luxury or a waste of money. However, there is a need for athletic shoes with professional performance. There is also the need to be seen as wearing the type of shoes that only a successful professional would wear. These needs are felt by a significant number of affluent people in foreign markets and wearing an American made signature shoe provides special prestige to customers in what the NewShoes firm calls its Foreign Region. The firm presents an elite product in this regional market with an �If you have to ask, you can�t afford it� type of appeal. Advertising coverage and consumer promotion is spotty, inconsistent, and generates weak response in the Foreign Region. Research shows that customers in the Foreign Region have a very strong correlation between price and performance. However, the problems in getting distribution to the Foreign Region are considerable. The firm�s sales people make many repeat-calls and sales promotion is used to convince retailers that expensive American-made athletic shoes offer high potential profits. Selling the shoe�s extreme performance is a difficult sales presentation to traditional distributors who see shoes as a basic commodity.
NewShoes User�s Manual - Page 62

July � December 2006 ONLY ddd
Appendix B: N There are a variety of formaccessed and downloadedleft side of the NewShoes i Company Decisions Overall Income Statement Income Statements by RegReturn on Sales Market Share CalculationsBreakeven Analysis Selling Price Calculation Sheet for ContFunctional Relationship GrForecasting Exercise Initial Strategic Planning FRevision of Strategic Plan Brand Name Selection Advertisement DevelopmeBrand Name and AdvertisiNew Product Design Company Decision MakingUse of Market Research Risk Orientation New Shoes Participant Eva Copies of these forms are a
Make Copppies As Needeiieess AAss NNeeeeddeeMMaakkee CCoo
ewShoes Forms and Assignments s and assignments associated with NewShoes. These forms can be
using the DOCUMENTATION � KEY LINKS menu option on the nterface.
ion
ract Bid Analysis and Learning/Experience (L/E) Curve aphs
orm
nt Exercise ng Evaluation Form
luation
lso presented in the subsequent pages of this appendix.
NewShoes Appendix A - Page 63

NewShoes
Class________________ Company_____________ Company No.__________ Period No._____________
COMPANY DECISIONS
(Use whole numbers except where indicated) Home Domestic Foreign Region Region Region Price (dollars and cents) __________ _________ ________ Consumer Advertising __________ _________ ________ Consumer Sales Promotions ___________ _________ ________ # of Salespeople ___________ _________ ________ Dealer Sales Promotions ___________ _________ ________ Product Development _________________ Contract Bid (Dollars & Cents) _________________
MARKET RESEARCH REQUESTS (Cost $10,000 or $25,000 each. Mark A for average, R for range, D for detail.) Home Domestic Foreign Region Region Region Average Price __________ _________ ________ Average Advertising __________ _________ ________ Average Consumer __________ _________ ________ Sales Promotions Average # of Salespeople __________ _________ ________ Average Dealer Sales Promotions __________ _________ ________
NewShoes User�s Manual - Page 64

July � December 2006 ONLY
NewShoes Class________________ Company_____________ Company No._________ Period No.____________
OVERALL INCOME STATEMENT REVENUE TOTAL Company Unit Sales (H) _______ x Price (H) _______ = _______ Company Unit Sales (D) _______ x Price (D) _______ = _______ Company Unit Sales (F) _______ x Price (F) _______ = _______ Company Unit Sales (C) _______ x Price (C) _______ = _______ __________ COST OF GOODS SOLD (COG) Total Co. Unit Sales _________ x Per-Unit Cost ______ = _______ ___________ of Goods EXPENSES (Add all regions together) Advertising _________ Consumer Sales Promotions _________ Personal Selling _________ (No. of Salespeople x $80,000) Dealer Sales Promotions _________ Product Development _________ Market Research _________ (No. of Requests x $10,000 or $25,000) Region Start-Up Costs _________ = ___________ PROFIT (Revenue − COG − Expenses) ___________ KEY H = Home D = Domestic F = Foreign C = Contract
NewShoes Appendix A - Page 65

NewShoes Class________________ Company_____________ Company No._________ Period No.____________
INCOME STATEMENTS BY REGION
Region ____________________________________________________ Revenue ________________________ x _______________________ = _____________ Units Sold Price Cost of Goods Sold _______________ x _______________________ = _____________ (COG) Units Sold Unit Cost of Goods EXPENSES Advertising _______________ Consumer Sales Promotions _______________ Personal Selling (# of salespeople @ $80,000) _______________ Dealer Sales Promotions _______________ Product Development _______________ (pro-rated, see below)* Market Research _______________ (# of requests x $10K or $25K) Region Start-Up Costs _______________ = _____________ Profit (Revenue − COG − Expenses) = _____________ * * * * * * * * * * * * * * * * * * * * * * * * * * * * * * * * * * * * * * * * * * * * * * * * * * * * * * * * * * * * * * * * *To Pro-Rate Product Development 1) ______________________ ÷________________________ = ______________________ Sales in Region (Units) Total Company Sales (Units) Pro-Rate Percentage _______________________ x ________________________ = ____________________ Pro-Rate Percentage Total Product Development Product Development Expenditure Expense for this Region
NewShoes User�s Manual - Page 66
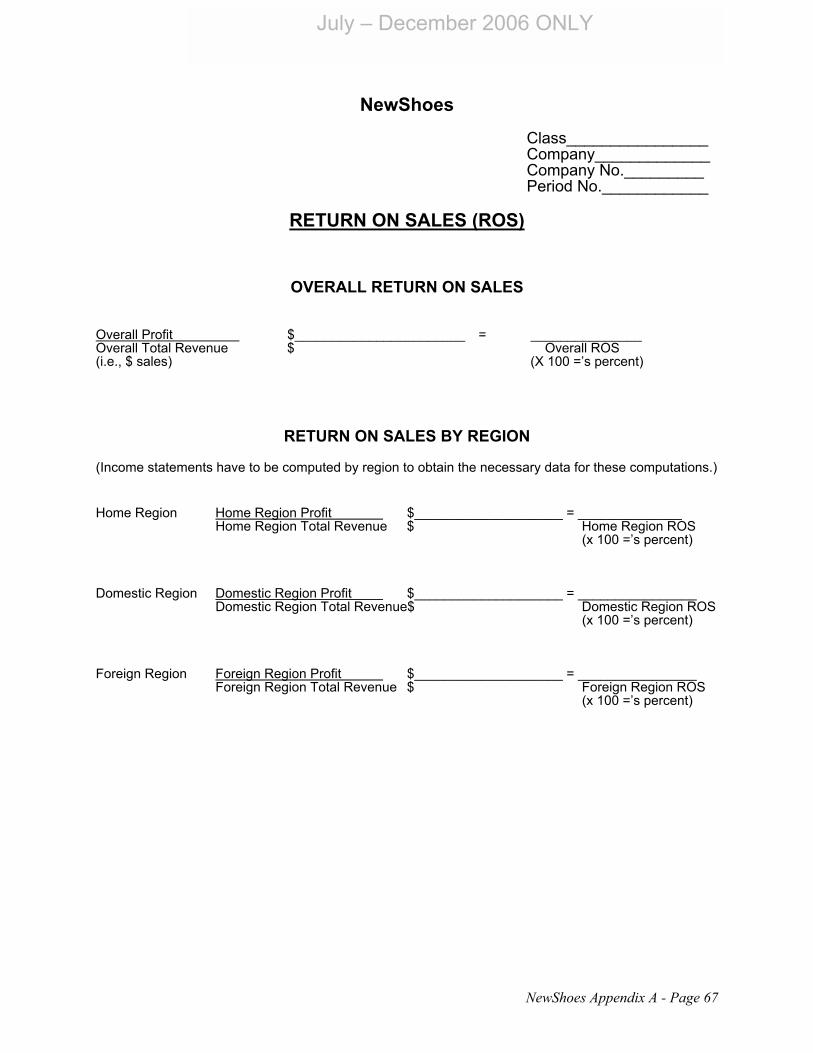
July � December 2006 ONLY
NewShoes Class________________ Company_____________ Company No._________ Period No.____________
RETURN ON SALES (ROS)
OVERALL RETURN ON SALES
Overall Profit $_______________________ = _______________ Overall Total Revenue $ Overall ROS (i.e., $ sales) (X 100 =�s percent)
RETURN ON SALES BY REGION
(Income statements have to be computed by region to obtain the necessary data for these computations.)
Home Region Home Region Profit $____________________ = ______________ Home Region Total Revenue $ Home Region ROS (x 100 =�s percent) Domestic Region Domestic Region Profit $____________________ = ________________ Domestic Region Total Revenue$ Domestic Region ROS (x 100 =�s percent) Foreign Region Foreign Region Profit $____________________ = ________________ Foreign Region Total Revenue $ Foreign Region ROS (x 100 =�s percent)
NewShoes Appendix A - Page 67
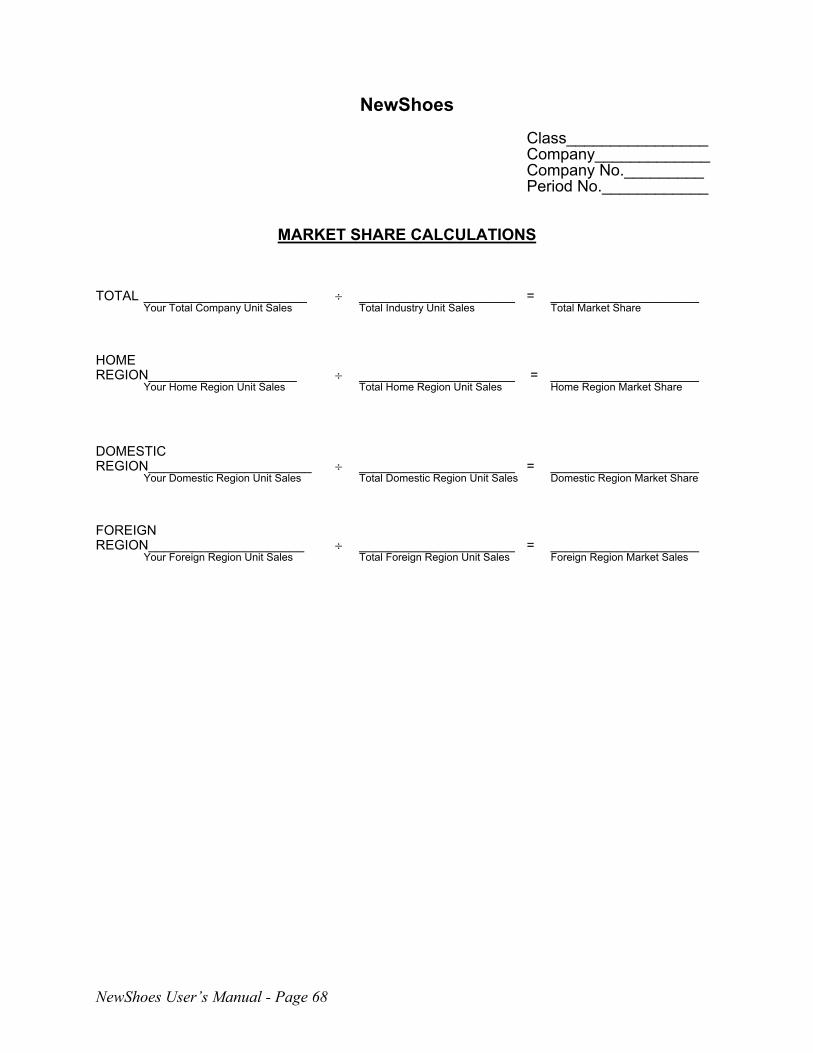
NewShoes Class________________ Company_____________ Company No._________ Period No.____________
MARKET SHARE CALCULATIONS TOTAL ______________________ ÷ _____________________ = ____________________ Your Total Company Unit Sales Total Industry Unit Sales Total Market Share HOME REGION____________________ ÷ _____________________ = ____________________ Your Home Region Unit Sales Total Home Region Unit Sales Home Region Market Share DOMESTIC REGION______________________ ÷ _____________________ = ____________________ Your Domestic Region Unit Sales Total Domestic Region Unit Sales Domestic Region Market Share FOREIGN REGION_____________________ ÷ _____________________ = ____________________ Your Foreign Region Unit Sales Total Foreign Region Unit Sales Foreign Region Market Sales
NewShoes User�s Manual - Page 68

July � December 2006 ONLY
NewShoes Class________________ Company_____________ Company No._________ Period No.____________
BREAKEVEN ANALYSIS
1. Perform a breakeven analysis using the next price you plan to use. (See Breakeven
Calculation Sheet on the back of these questions.) 2. How does your firm establish the price for which it sells its product? 3. Are you satisfied with this approach? Why or why not?
NewShoes Appendix A - Page 69

NewShoes Class________________ Company_____________ Company No._________ Period No.____________
SELLING PRICE
BREAKEVEN ANALYSIS
REGION ______________________________________
FORMULA
Anticipated Expenses (in Total Dollars) Breakeven Price = Anticipated Sales + Anticipated Unit (in Units) Cost of Goods * * * * * * * * * * * * * * * * * * * * * * * * * * * * * * * * * * * * * * * * * * * * * * * * * * * * * * * * * * * * * * * *
WORKSHEET Anticipated Sales (Forecast for Region in Units) _________________________ (Forecast for Total Company Sales for all regions, in units) Anticipated Unit Costs of Goods (From Learning/Experience Curve -- consult graph) _________________________ Anticipated Expenses Region Expenses __________________ Advertising __________________ Consumer Sales Promotion __________________ Personal Selling (# of salespeople x salary) __________________ Dealer Sales Promotion __________________ Product Development (pro-rated) (regional sales ÷ total sales) x product development __________________ Market Research (# of reports in region x cost of reports) __________________ Region Start-Up Cost (Total)_______________________
NewShoes User�s Manual - Page 70
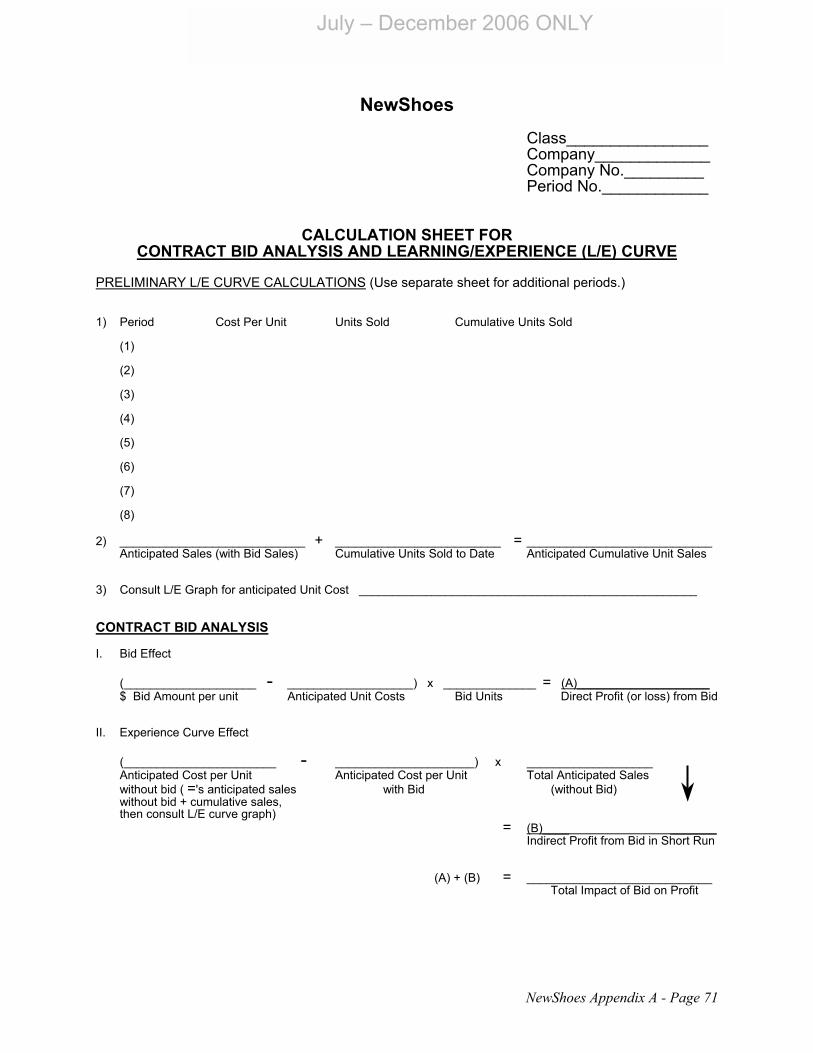
July � December 2006 ONLY
NewShoes Class________________ Company_____________ Company No._________ Period No.____________
CALCULATION SHEET FOR CONTRACT BID ANALYSIS AND LEARNING/EXPERIENCE (L/E) CURVE
PRELIMINARY L/E CURVE CALCULATIONS (Use separate sheet for additional periods.) 1) Period Cost Per Unit Units Sold Cumulative Units Sold (1) (2) (3) (4) (5) (6) (7) (8) 2) ____________________________ + _________________________ = ____________________________ Anticipated Sales (with Bid Sales) Cumulative Units Sold to Date Anticipated Cumulative Unit Sales 3) Consult L/E Graph for anticipated Unit Cost ___________________________________________________ CONTRACT BID ANALYSIS I. Bid Effect (____________________ - ___________________) x ______________ = (A)____________________ $ Bid Amount per unit Anticipated Unit Costs Bid Units Direct Profit (or loss) from Bid II. Experience Curve Effect (_______________________ - _____________________) x ___________________ Anticipated Cost per Unit Anticipated Cost per Unit Total Anticipated Sales without bid ( ='s anticipated sales with Bid (without Bid) without bid + cumulative sales, then consult L/E curve graph) = (B)____ _______ Indirect Profit from Bid in Short Run
(A) + (B) = ____________________________ Total Impact of Bid on Profit
NewShoes Appendix A - Page 71

NewShoes Class Company Company No. ____________ Period No. ____________
FUNCTIONAL RELATIONSHIP GRAPHS REGION_________________________
Plot your company's sales response functions for the variable in the graphs below. You should prepare these graphs for each region in which you are operating.
0 20,000 40,000 60,000 80,000
100,000 120,000 140,000 160,000
$0 $500,000 $1,000,000 $1,500,000 $2,000,000Consumer Advertising
Uni
t Sal
es
0
20,000
40,000
60,000
80,000
100,000
120,000
140,000
160,000
180,000
$0 $500,000 $1,000,000 $1,500,000
Consumer Sales Promotion
Uni
t Sal
es
0 20,000 40,000 60,000 80,000
100,000 120,000 140,000 160,000 180,000 200,000
0 1 2 3 4 5 6 7 8 9 10Number of Salespeople
Uni
t Sal
es
0
20,000
40,000
60,000
80,000
100,000
120,000
140,000
160,000
180,000
200,000
$0 $500,000 $1,000,000 $1,500,000DealerSales Promotion
Uni
t Sal
es
0 20,000 40,000 60,000
80,000 100,000 120,000 140,000
$0 $10 $20 $30 $40 $50 $60 $70 $80 $90 $100 $110 $120 $130Price
Uni
t Sal
es
NewShoes User�s Manual - Page 72

July � December 2006 ONLY
NewShoes Class________________ Company_____________ Company No._________ Period No.____________
FORECASTING EXERCISE
1. Forecast your unit sales for the upcoming period in each region in which you are
operating. 2. What does this forecast tell you? 3. Develop a graph of a forecast for monthly unit sales for a year. (Figures need not be exact
here.) 4. What does this forecast graph tell you?
NewShoes Appendix A - Page 73

NewShoes Class________________ Company_____________ Company No._________ Period No.____________
INITIAL STRATEGIC PLANNING FORM
Mission
Objectives and Goals
Strategy
Target Market Marketing Mix Product Price Promotion Place
NewShoes User�s Manual - Page 74

July � December 2006 ONLY
NewShoes Class________________ Company_____________ Company No._________ Period No.____________
REVISION OF STRATEGIC PLAN
1. Have you had to revise your mission statement? 2. If so, why? 3. If so, how? 4. How effective was your firm in attaining the goals it initially established for itself? 5. Have you made any changes in your objectives and goals? 6. Have you made any changes in your strategy? 7. Have you made any changes in your tactics? 8. At what level of your strategic plan did most of your changes take place? 9. At which level did the changes make the most substantial impact on your strategic plan?
NewShoes Appendix A - Page 75

NewShoes Class________________ Company_____________ Company No.__________ Period No._____________
BRAND NAME SELECTION
1. Generate 10 possible brand names for your shoes. a. ____________________________ f. _________________________ b. ____________________________ g. _________________________ c. ____________________________ h. _________________________ d. ____________________________ i. _________________________ e. ____________________________ j. _________________________ 2. Rate each brand name on the criteria below from 1 to 5, with 1 being terrible and 5 being superior. Appropriate Suggest Short and Brand Image Product's Easy to Name (Consistent)? Benefits? Remember? Distinctive? Overall? (a) 1 2 3 4 5 1 2 3 4 5 1 2 3 4 5 1 2 3 4 5 1 2 3 4 5 (b) 1 2 3 4 5 1 2 3 4 5 1 2 3 4 5 1 2 3 4 5 1 2 3 4 5 (c) 1 2 3 4 5 1 2 3 4 5 1 2 3 4 5 1 2 3 4 5 1 2 3 4 5 (d) 1 2 3 4 5 1 2 3 4 5 1 2 3 4 5 1 2 3 4 5 1 2 3 4 5 (e) 1 2 3 4 5 1 2 3 4 5 1 2 3 4 5 1 2 3 4 5 1 2 3 4 5 (f) 1 2 3 4 5 1 2 3 4 5 1 2 3 4 5 1 2 3 4 5 1 2 3 4 5 (g) 1 2 3 4 5 1 2 3 4 5 1 2 3 4 5 1 2 3 4 5 1 2 3 4 5 (h) 1 2 3 4 5 1 2 3 4 5 1 2 3 4 5 1 2 3 4 5 1 2 3 4 5 (i) 1 2 3 4 5 1 2 3 4 5 1 2 3 4 5 1 2 3 4 5 1 2 3 4 5 (j) 1 2 3 4 5 1 2 3 4 5 1 2 3 4 5 1 2 3 4 5 1 2 3 4 5 3. Which brand name did you choose? Why?
NewShoes User�s Manual - Page 76

July � December 2006 ONLY
NewShoes Class________________ Company_____________ Company No._________ Period No.____________
ADVERTISEMENT DEVELOPMENT EXERCISE
1. Using your brand name (and with consideration of your target market and position), develop
a mock one-page magazine advertisement for your product. Provide copies of this ad for all members of the class.
2. On a separate sheet of paper, provide the administrator with: a. the brand name support; b. the target market at which you aimed (besides NewShoes variables, consider socio/-
economic, demographic, geographic, etc. criteria here also); c. position in the marketplace for which you are striving; d. why this is a good ad; and e. what magazines you would run your ad in and how often (schedule).
NewShoes Appendix A - Page 77

NewShoes
BRAND NAME AND ADVERTISING EVALUATION FORM
COMPANY TEAM NO. ________ BRAND NAME______________________ Very Very Poor Poor Average Good Good Effectiveness of brand name 1 2 3 4 5 6 7 8 9 (i.e., memorable, unique, easy to pronounce, conveys a benefit, etc.) Effectiveness of advertisement 1 2 3 4 5 6 7 8 9 (i.e., gets attention, memorable, will generate sales, proper magazines used, etc.) Consistency(i.e., are brand name 1 2 3 4 5 6 7 8 9 and advertisement consistent with other mix variables, with the bases for consistency the target toward which they are aiming and image (position) for which they are striving? COMPANY TEAM NO. ________ BRAND NAME______________________ Very Very Poor Poor Average Good Good Effectiveness of brand name 1 2 3 4 5 6 7 8 9 (i.e., memorable, unique, easy to pronounce, conveys a benefit, etc.) Effectiveness of advertisement 1 2 3 4 5 6 7 8 9 (i.e., gets attention, memorable, will generate sales, proper magazines used, etc.) Consistency(i.e., are brand name 1 2 3 4 5 6 7 8 9 and advertisement consistent with other mix variables, with the bases for consistency the target toward which they are aiming and image (position) for which they are striving? COMPANY TEAM NO. ________ BRAND NAME______________________ Very Very Poor Poor Average Good Good Effectiveness of brand name 1 2 3 4 5 6 7 8 9 (i.e., memorable, unique, easy to pronounce, conveys a benefit, etc.) Effectiveness of advertisement 1 2 3 4 5 6 7 8 9 (i.e., gets attention, memorable, will generate sales, proper magazines used, etc.) Consistency(i.e., are brand name 1 2 3 4 5 6 7 8 9 and advertisement consistent with other mix variables, with the bases for consistency the target toward which they are aiming and image (position) for which they are striving?
NewShoes User�s Manual - Page 78

July � December 2006 ONLY
NewShoes Class________________ Company_____________ Company No._________ Period No.____________
NEW PRODUCT DESIGN
Please complete the following: I. GENERATION OF NEW PRODUCT IDEAS: a. Please list below all new product ideas that your company considered (minimum of 5, maximum
of 10). These should be related in some way (i.e., same materials, same distribution structure, etc.) to the NewShoes product you are producing.
(1) _________________________________ (6) _________________________________
(2) _________________________________ (7) _________________________________
(3) _________________________________ (8) _________________________________
(4) _________________________________ (9) _________________________________
(5) _________________________________ (10) _________________________________ b. What method(s) did your company use in generating new product ideas? ___________________________________________________________________________
___________________________________________________________________________
___________________________________________________________________________
___________________________________________________________________________ II. SCREENING AND ANALYSIS: Describe below the procedure your company used in eliminating new
product ideas from further consideration and how you arrived at the new product idea your chose.
______________________________________________________________________________
______________________________________________________________________________
______________________________________________________________________________
______________________________________________________________________________ PRODUCT IDEA SELECTED FOR FURTHER DEVELOPMENT:
______________________________________________________________________________
______________________________________________________________________________
______________________________________________________________________________
______________________________________________________________________________ III. PRODUCT DEVELOPMENT: Explain the reasons for your choices of product features and describe
the product attributes, engineering, packaging, and name, etc. ______________________________________________________________________________
NewShoes Appendix A - Page 79
______________________________________________________________________________
______________________________________________________________________________
______________________________________________________________________________
______________________________________________________________________________
______________________________________________________________________________
______________________________________________________________________________
______________________________________________________________________________ IV. TEST MARKETING: Explain how you would test market your new product. ______________________________________________________________________________
______________________________________________________________________________
______________________________________________________________________________
______________________________________________________________________________ V. COMMERCIALIZATION: Describe how your company would schedule the commercial introduction
of your new product. What market segments did you consider? What marketing mix did you use? Be specific and detailed here.
______________________________________________________________________________
______________________________________________________________________________
______________________________________________________________________________
______________________________________________________________________________
______________________________________________________________________________
______________________________________________________________________________
______________________________________________________________________________
______________________________________________________________________________
NewShoes User�s Manual - Page 80

July � December 2006 ONLY
NewShoes Class________________ Company_____________ Company No._________ Period No.____________
COMPANY DECISION-MAKING
1. Provide an example of the typical way your NewShoes company goes through the
decision-making process. 2. What would you call this type of decision-making? 3. What are the strengths and weaknesses of this decision-making technique?
NewShoes Appendix A - Page 81
NewShoes Class________________ Company_____________ Company No._________ Period No.____________
USE OF MARKET RESEARCH
1. What has your firm's orientation been toward market research? 2. Do you think that this orientation was the best approach? 3. Why?
NewShoes User�s Manual - Page 82

July � December 2006 ONLY
NewShoes Class________________ Company_____________ Company No._________ Period No.____________
RISK ORIENTATION
1. What has your NewShoes company's philosophy been toward risk taking? 2. Why did you adopt this philosophy? 3. Was it appropriate?
NewShoes Appendix A - Page 83
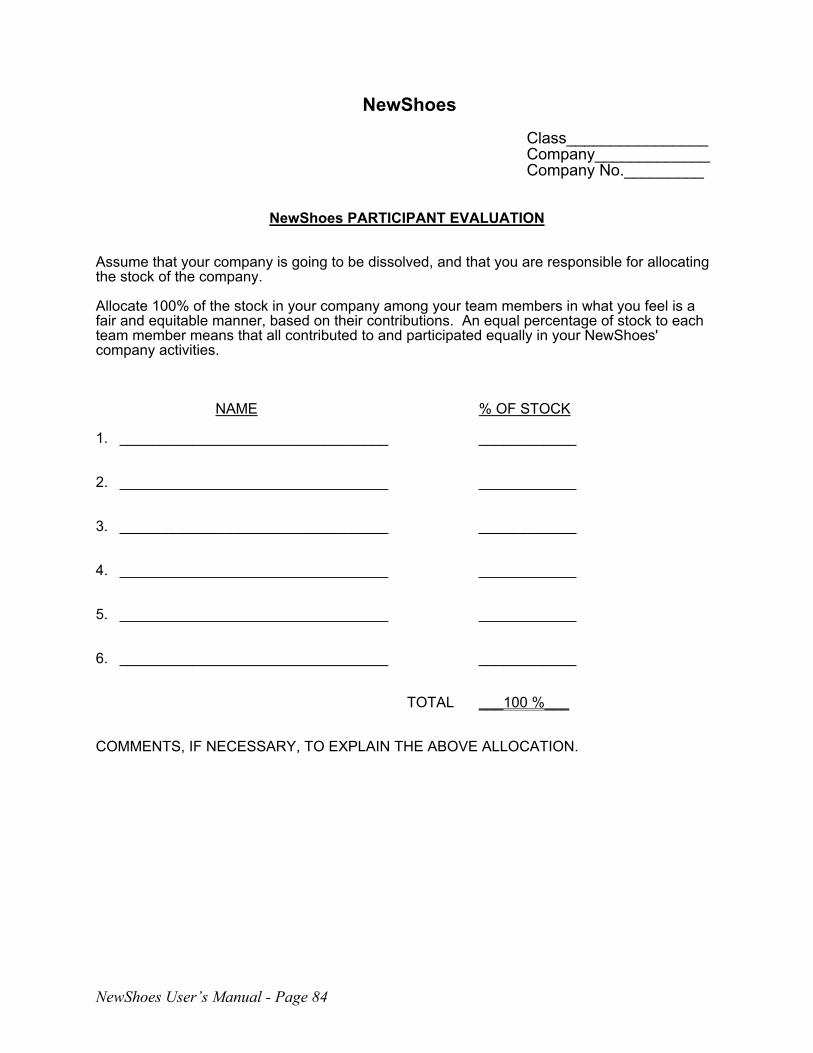
NewShoes Class________________ Company_____________ Company No._________
NewShoes PARTICIPANT EVALUATION Assume that your company is going to be dissolved, and that you are responsible for allocating the stock of the company. Allocate 100% of the stock in your company among your team members in what you feel is a fair and equitable manner, based on their contributions. An equal percentage of stock to each team member means that all contributed to and participated equally in your NewShoes' company activities. NAME % OF STOCK 1. _________________________________ ____________ 2. _________________________________ ____________ 3. _________________________________ ____________ 4. _________________________________ ____________ 5. _________________________________ ____________ 6. _________________________________ ____________ TOTAL ___100 %___ COMMENTS, IF NECESSARY, TO EXPLAIN THE ABOVE ALLOCATION.
NewShoes User�s Manual - Page 84
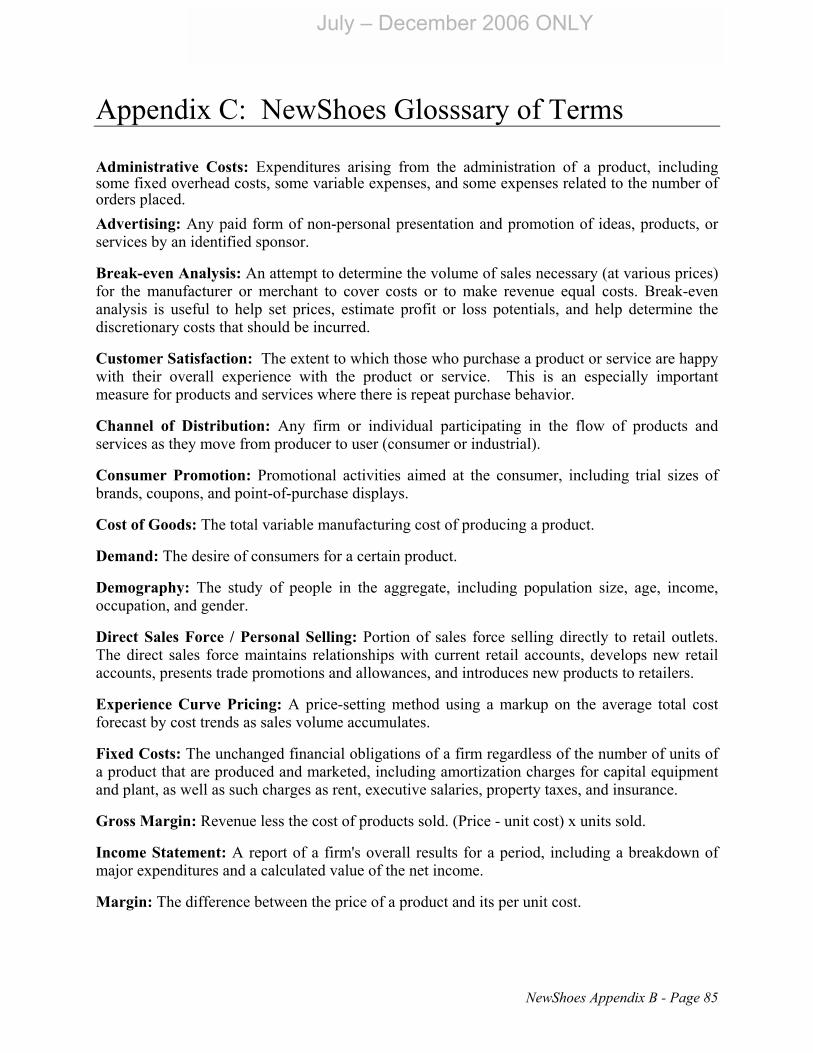
July � December 2006 ONLY
Appendix C: NewShoes Glosssary of Terms Administrative Costs: Expenditures arising from the administration of a product, including some fixed overhead costs, some variable expenses, and some expenses related to the number of orders placed. Advertising: Any paid form of non-personal presentation and promotion of ideas, products, or services by an identified sponsor.
Break-even Analysis: An attempt to determine the volume of sales necessary (at various prices) for the manufacturer or merchant to cover costs or to make revenue equal costs. Break-even analysis is useful to help set prices, estimate profit or loss potentials, and help determine the discretionary costs that should be incurred.
Customer Satisfaction: The extent to which those who purchase a product or service are happy with their overall experience with the product or service. This is an especially important measure for products and services where there is repeat purchase behavior.
Channel of Distribution: Any firm or individual participating in the flow of products and services as they move from producer to user (consumer or industrial).
Consumer Promotion: Promotional activities aimed at the consumer, including trial sizes of brands, coupons, and point-of-purchase displays.
Cost of Goods: The total variable manufacturing cost of producing a product.
Demand: The desire of consumers for a certain product.
Demography: The study of people in the aggregate, including population size, age, income, occupation, and gender.
Direct Sales Force / Personal Selling: Portion of sales force selling directly to retail outlets. The direct sales force maintains relationships with current retail accounts, develops new retail accounts, presents trade promotions and allowances, and introduces new products to retailers.
Experience Curve Pricing: A price-setting method using a markup on the average total cost forecast by cost trends as sales volume accumulates.
Fixed Costs: The unchanged financial obligations of a firm regardless of the number of units of a product that are produced and marketed, including amortization charges for capital equipment and plant, as well as such charges as rent, executive salaries, property taxes, and insurance.
Gross Margin: Revenue less the cost of products sold. (Price - unit cost) x units sold.
Income Statement: A report of a firm's overall results for a period, including a breakdown of major expenditures and a calculated value of the net income.
Margin: The difference between the price of a product and its per unit cost.
NewShoes Appendix B - Page 85

Market: People or businesses with the potential interest, purchasing power, and willingness to buy a product or service that satisfies a need.
Market Share: The percentage of sales of a product in a market in relation to other products in that market (i.e. Brand X / Total sales in market).
Marketing: The process of planning and executing the conception, pricing, promotion, and distribution of ideas, products, and services to create exchanges that satisfy individual and organizational needs or wants.
Marketing Research: The systematic and objective approach to the development and provision of information for marketing decision-making.
Markup Pricing: A price-setting method common in wholesaling and retailing that adds a markup to average total or variable cost.
Net Income: The profit remaining after all costs are subtracted from revenues.
Point-of-Purchase Promotion (POP): Special displays, racks, signs, banners, and exhibits placed in a retail store to support the sales of a brand.
Price: The amount of money a seller requires to provide products or service to a customer.
Product Life Cycle: The stages that a product goes through during its time on the market, including introduction, growth, maturity, and decline.
Promotion: The communication mechanism of marketing designed to inform and persuade consumers to purchase.
Research and Development: A portion of a firm designated to research, analyze, and design products to meet consumer and market needs.
Retailer: A merchant whose main business is selling directly to consumers for personal, non-business use.
Salespeople: Employees hired to promote and sell a manufacturer's product through direct or indirect channels.
Segmentation: The process of dividing large heterogeneous markets into smaller homogeneous segments of people or businesses with similar needs and/or responses to marketing mix offerings.
Trade Promotions: Sales promotion activities directed at wholesalers and retailers, including promotional allowances and co-op advertising.
Unit Sales: The total volume of units sold by a manufacturer in a market.
Variable Costs: Costs tied directly to production, including direct labor and raw materials charges.
NewShoes User�s Manual - Page 86
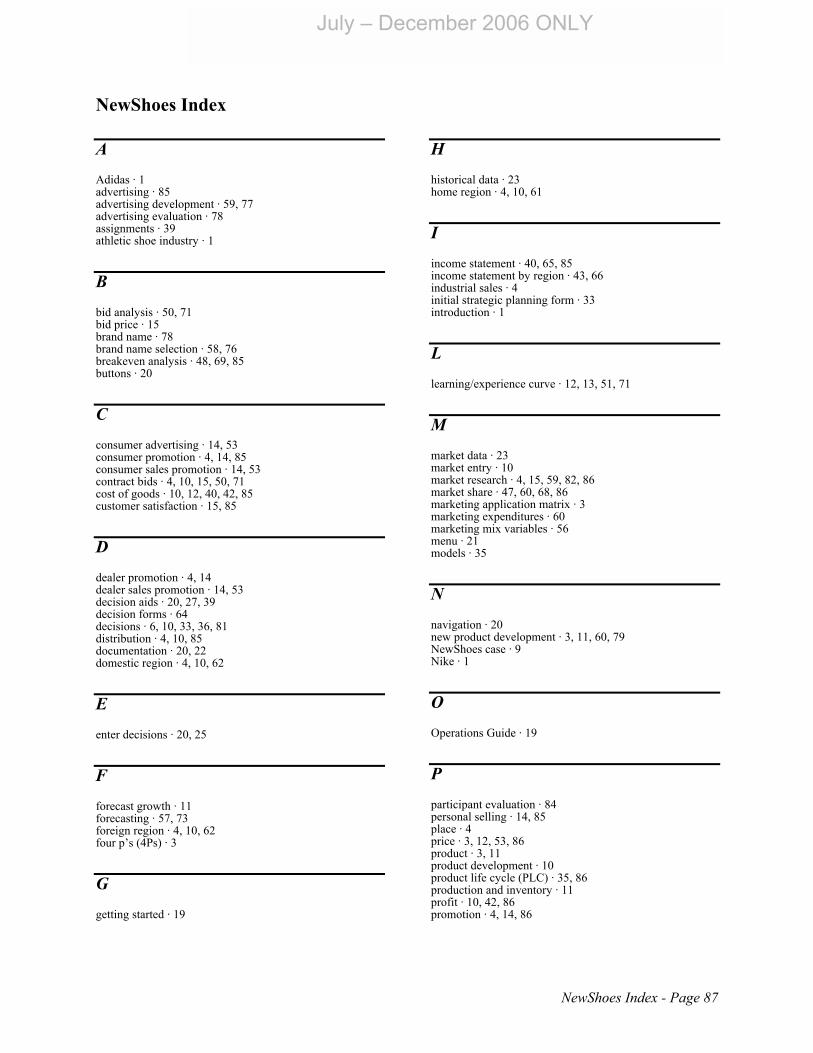
July � December 2006 ONLY
NewShoes Index
A
Adidas · 1 advertising · 85 advertising development · 59, 77 advertising evaluation · 78 assignments · 39 athletic shoe industry · 1
B
bid analysis · 50, 71 bid price · 15 brand name · 78 brand name selection · 58, 76 breakeven analysis · 48, 69, 85 buttons · 20
C
consumer advertising · 14, 53 consumer promotion · 4, 14, 85 consumer sales promotion · 14, 53 contract bids · 4, 10, 15, 50, 71 cost of goods · 10, 12, 40, 42, 85 customer satisfaction · 15, 85
D
dealer promotion · 4, 14 dealer sales promotion · 14, 53 decision aids · 20, 27, 39 decision forms · 64 decisions · 6, 10, 33, 36, 81 distribution · 4, 10, 85 documentation · 20, 22 domestic region · 4, 10, 62
E
enter decisions · 20, 25
F
forecast growth · 11 forecasting · 57, 73 foreign region · 4, 10, 62 four p�s (4Ps) · 3
G
getting started · 19
H
historical data · 23 home region · 4, 10, 61
I
income statement · 40, 65, 85 income statement by region · 43, 66 industrial sales · 4 initial strategic planning form · 33 introduction · 1
L
learning/experience curve · 12, 13, 51, 71
M
market data · 23 market entry · 10 market research · 4, 15, 59, 82, 86 market share · 47, 60, 68, 86 marketing application matrix · 3 marketing expenditures · 60 marketing mix variables · 56 menu · 21 models · 35
N
navigation · 20 new product development · 3, 11, 60, 79 NewShoes case · 9 Nike · 1
O
Operations Guide · 19
P
participant evaluation · 84 personal selling · 14, 85 place · 4 price · 3, 12, 53, 86 product · 3, 11 product development · 10 product life cycle (PLC) · 35, 86 production and inventory · 11 profit · 10, 42, 86 promotion · 4, 14, 86
NewShoes Index - Page 87
R
ratios · 43 Reebok · 1 regions · 4, 43, 61 relationship graphs · 37, 53, 72 response function · 36, 53 results · 9, 17, 54 retailer · 15, 86 return on sales · 46, 67 revision of strategic plan · 33, 60, 75 risk orientation · 60, 83
S
salespeople · 53, 86 start-up charge · 11 strategic plan · 57, 74 strategy and tactics · 33 summary of decision variables · 16
T
total expenditures · 10 total revenues · 10, 42 trade promotion · 86
V
version (product) · 11
NewShoes User�s Manual - Page 88

July � December 2006 ONLY
NewShoes Appendix - Page 1