Embed Size (px)
Citation preview

Australian Centre for Geomechanics | December 2013 Newsletter 1Continued page 2
A u s t r a l i a n C e n t r e f o r G e o m e c h a n i c s | V o l u m e N o 4 6 | D e c e m b e r 2 0 1 7
IN THIS VOLUME1 Rock mechanics tools for mining in high
stress ground conditions at Nickel Rim South Mine
9 Re-entry analysis optimising and comparing different methodologies
12 Recent advances in structural modelling capabilities
14 ACG celebrates 25 years of mining geomechanics excellence
16 The geomechanical conundrum are surface observations reflecting rock mass behaviour at depth
20 Stope reconciliation23 Effects of polymer treatment on
geotechnical properties of a low-plasticity slurry
28 ACG event schedule
Rock mechanics tools for mining in high stress ground conditions at Nickel Rim South Mineby Ali Jalbout Goldcorp Inc Canada and Brad Simser Sudbury Integrated Nickel Operations A Glencore Company CanadaThe ACG Online Repository provides
the mining geomechanics fraternity with open access to peer-reviewed conference
proceedings that may assist readers to maintain and develop their skills
knowledge and capabilities in the fields of underground and open pit mining paste and thickened tailings and mine closure
Setting an industry standard for technology transfer and accessibility this
valuable online resource will continue to develop and grow with future ACG
mining and geomechanical events
papersacguwaeduau
AccessingGeomechanical
Excellence
Newsletter
IntroductionNickel Rim South Mine (NRS) of
Sudbury INO is located along the northeast limb of the Sudbury Basin The deposit was discovered in 2001 and the mining method is sublevel open stoping with cemented hydraulic tailings fill at a production rate of 125 m t per annum
Contact zoneContact mineralisation consists of
massive and semi massive nickel bearing sulphides Access to the steeply dipping zone (~70deg ) is from the hanging wall Rock units are summarised in Table 1 Access development is within norites (DNOR and FNOR) with crosscuts coming through breccia units into the sulphides The hanging wall ore contact is grade driven with a low grade disseminated sulphide halo while the footwall tends to have a sharp contact
Footwall zoneAt NRS two types of mineralisation
merge together at around 1320 m depth and are only separated by a few tens of metres below that horizon Mineralisation is closely associated with a zone of Sudbury Breccia (SDBX) and the footwall development is in a Felsic Gneiss unit (FGN) The copper sulphides occur in an erratic assemblage of veins ranging from a few centimetres to several metres thick Overall they lie within a steeply dipping (70deg) mineralised envelop which is also mined using blasthole stoping A large strength contrast exists between the complex copper veins and the host rock (Table 1) with the veins fracturing and deforming preferentially The footwall zones generate much more seismic activity relative to the nickel ore (Simser amp Pritchard 2010)
Underground structural mapping
The mine has used in-cycle fibre reinforced shotcrete for a large portion of the development (mesh is also used
UNDERGROUND
Australian Centre for Geomechanics | December 2017 Newsletter2
in some areas) Jointing lithology and structure are all mapped using tablet computers and a structural interpretation is conducted supplemented by diamond drill core information The joint data is routinely used for wedge analysis and the stability graph method for stope design (Simser et al 2014)
FaultsThe 3D structural model contains
three orientations of brittle faults To date no ductile shear zones have been encountered The brittle fault orientations are
bull Northndashsouth trending steeply dipping faults (fault set 1)
bull Low angle gently dipping faults (fault set 2)
bull Northeast and southeast striking steeply dipping faults associated with narrow (1-5 cm thick) aplite dykes (fault set 3)All three fault orientations are
associated with chloritic alteration bornite mineralisation (when in proximity to sulphide mineralisation) and quartz carbonate veining
The faulting has clearly impacted observed seismicity by both fault slip type events and by acting as a stress channel It is often observed that increased seismicity occurs in the ground between an open stope and a major fault plane The faults effectively funnel the stress flow into a smaller volume Drillhole notching or raisebore breakouts often show stress directions parallel to the local faults
The mine-wide modelling takes this into account by including the fault surfaces and calibrating the model results with the observed seismicity (Beck et al 2012) The seismic response to stoping is often asymmetric and can only be mimicked by the model if fault movement is considered
Diabase dykesNRS diabase dykes are generally fine
grained and very strong (isolated samples have been tested to 415 MPa unconfined
compressive strength (UCS)) They have been associated with some strainbursting and are considered a long-term risk due to the fact that a very high mining-induced stress may be required to drive them to failure (as the overall extraction increases these dykes may cause more bursting problems in the future) Most of the dykes occur as brecciated fragments (highly variable size 10s of cm to 10s of m) predominantly in the footwall of the orebody
Figure 1 Longitudinal view of the mining areas with mined stopes shown by blue 5 times 55 m development tunnels seismicity over a one year period shown by small coloured spheres and the fault model shown by translucent pseudo planar surfaces
UCS (MPa) Rock quality tunnelling index Q typical range
Rock type Point Core RQD Jn Jr Ja Jw
Felsic Gneiss FGN 178 250ndash340 75ndash100 6ndash9 1ndash3 1 1
Felsic Norite FNOR 263 215ndash296 75ndash100 6ndash9 1ndash3 1 1
Late Granite 190 206ndash340 75ndash100 6ndash9 1ndash3 1 1
Sudbury Breccia 200 240ndash360 75ndash100 6ndash9 1ndash3 1 1
Semi Massive 153 196 75ndash100 6ndash9 05ndash3 1 1
Massive Sulphide Ni 84 80ndash120 75ndash100 6ndash9 05ndash3 1ndash3 1
High Grade Copper 49 28ndash150 50ndash75 6ndash9 05ndash3 1ndash3 1
Dark Norite Breccia 229 160ndash270 75ndash100 6ndash9 05ndash3 1ndash3 1
Diabase 290 375ndash475 75ndash100 6ndash9 1ndash3 1 1
Dark Norite 234 160ndash210 75ndash100 6ndash9 1ndash3 1 1
Grand Norite 240 226 75ndash100 6ndash9 1ndash3 1 1
Table 1 Typical rock mass parameters Rock units are common to several Sudbury mines but differences in overall character are sometimes noted in different portions of the basin despite having the same mapping name
copy Copyright 2017 Australian Centre for Geomechanics (ACG) The University of Western Australia (UWA) All rights reserved No part of this newsletter may be reproduced stored or transmitted in any form without the prior written permission of the Australian Centre for Geomechanics The University of Western Australia
The information contained in this newsletter is for general educational and informative purposes only Except to the extent required by law UWA and the ACG make no representations or warranties express or implied as to the accuracy reliability or completeness of the information contained therein To the extent permitted by law UWA and the ACG exclude all liability for loss or damage of any kind at all (including indirect or consequential loss or damage) arising from the information in this newsletter or use of such information You acknowledge that the information provided in this newsletter is to assist you with undertaking your own enquiries and analyses and that you should seek independent professional advice before acting in reliance on the information contained therein
The views expressed in this newsletter are those of the authors and may not necessarily reflect those of the Australian Centre for Geomechanics
UNDERGROUND
Australian Centre for Geomechanics | December 2017 Newsletter 3
Geotechnical datain situ stress
Rock strength data has been obtained from both UCS (including some triaxial testing) and point load testing of diamond drill core Typical rock strength values and rock mass ratings for the mine are summarised in Table 1
Stress measurements have been conducted with both overcoring (CSIRO HI cell tests) and the acoustic emission technique (AE) More recently borehole breakout analyses of multiple acoustic televiewer surveys have helped quantify stress direction more precisely In general σ1 is sub-horizontal with azimuth of 020deg from mine grid north (orebody strike is mine grid east and dipping ~700) and about 16σvertical σ2 is also sub-horizontal with mine grid azimuth of about 290deg (sub parallel to strike) and about 13 σvertical and σ3 = is close to σvertical = weight of overburden (0026 MPametre depth) Local stress rotations have been noted near geological structure (overbreak profiles and borehole breakouts)
Stope design and sequencingContact zone stope and sequence design
The contact or nickel zone above 1320L is laid out as a primarysecondarytertiary sequence with the primaries being 15 m wide Tertiary stopes were originally designed at 10 m width and the secondaries 15 m wide However a change was made to 125 m widths for both secondary and tertiary stopes to improve ground integrity of the tertiary stopes
Footwall zone stope designThe footwall (or copper) zone stopes
were originally laid out as a primarysecondary 1-5-9 sequence allowing every other primary stope to be mined concurrently (Figure 3) Strike length is 125 m and the number of panels in the transverse direction is determined by orebody thickness and stability graph design guidelines The orebody is 1ndash4 panels wide in the transverse direction with typical panel length of 25ndash45 m The last two sublevels approaching the sill pillars were switched to a restricted 1-3-5 sequence to avoid 3 times 125 m squat pillar areas Local empirical experience is that longslender secondary pillars (WHlt23) will yield without large magnitude seismicity All secondary development is planned as just-in-time so that access tunnels are not subjected to excessive stress changes and are primarily developed in failedstress shadowed ground
Seismic monitoringA high resolution seismic monitoring
system was initiated and more details
are available in the full paper available from papersacguwaeduaup1410_11_Jalbout
The seismicity shown in Figure 4 is a
record of the abutments to the stope yielding These areas eventually become secondary stopes which are mined after two lifts of primaries on both sides have
Figure 2 Contact zone stope layout (a) and the 1-4-7 sequence (b) The 1-4-7 refers to arbitrary crosscut line numbers and means the 1st 4th and 7th crosscut lines can be mined independently and concurrently
(a) (b)
Figure 3 Footwall zone stope layout (a) and sequence (b)
(a)
(b)
Figure 4 (a) Seismic response to the first panel blast (bottom 13 of 30 m long 125 mm blastholes fired around a 12 m diameter raisebore) (b) Area highlighted in yellow corresponds to the exact blasted area The panel strike length is 125 m (left to right in the figure)
(b)(a)
UNDERGROUND
Australian Centre for Geomechanics | December 2017 Newsletter4
been extracted By the time the secondary stoping line (or pillar) is mined the local rock mass has yielded and emits no further seismicity except for recorded blasts
Just-in-time developmentIt is critical for the type of layout
shown in Figure 5 not to develop tunnels into the secondary pillar until it has yielded (just-in-time development) The yielding process would badly damage the crosscut and more importantly on the scale of 125 m stopes the primary stope blastholes would be too close to the secondary access and likely punch through into the crosscut The preferred panel firing sequence is to take the stope in two blasts the first as per Figure 4 to establish void and then a final shot (larger stopes may require three blasts) This reduces worker exposure and having to deal with redrills caused by holes pluggingsqueezing A 125 m wide secondary would by design only have a 35ndash375 m rib between the 5 m wide crosscut and the filled primary stope In the yielded state this equates to a lower quality rock mass and gravity loading only Seismicity is reduced to far field event shake damage with no local strain energy coming into effect
Rock mechanics challengesSill pillars
Sill pillars or converging mining fronts are often a necessary mine design decision to ensure independent mining fronts and the early ramp up of production In the longer term the resulting sill pillar area can be difficult to extract with increased seismicity and the risk of rockbursting The two planned sill pillars at NRS have been a main focus of the ground control program since mining started The extraction strategy is essentially a centre out chevron front with early breaching of the lower sill pillar The upper sill is offset in time to delay having two main production horizons in an elevated stress state (Figure 6)
The stoping strategy in the last tier of mining (the sill pillar) is to mine under backfill to create an overcut in a stress shadowed state The first tier stopes were filled using cemented tailings with 8 binder in the first 7 m and 5 for the remaining stope pour The overcut is driven using in-cycle shotcrete mesh and Swellex style bolting The undercut area is still in an elevated stress state enhanced ground support is used while developing and then remote control equipment for mucking
Geology (complex fault system)There are numerous examples of
asymmetric seismicity or in the case of Figure 7 abnormally high seismicity that can only be explained when considering the faulting The fault slip risk is similar to most mines in that it is both a function of overall driving stresses (increasing with
Figure 5 Over time the secondary stopes show up as seismic gaps (shown by thin arrows) The activity in these volumes of rock is associated with primary stope mining on either side (Figure 7) but after the secondary is fully formed no more seismicity is recorded even at the moment magnitude -2 level (indicative of rock mass yielding) The wider arrow highlights seismicity following a mapped fault plane
Figure 6 Yearly seismicity around the stoping areas showing the lower sill area with elevated microseismicity and the upper sill area having little interaction between the two mining blocks at this stage of the extraction sequence (a) May 2013 to May 2014 (b) May 2012 to May 2013
(b)(a)
Figure 7 Seismic response from a copper zone primary stope surrounded by faults
UNDERGROUND
Australian Centre for Geomechanics | December 2017 Newsletter 5
overall extraction) and fault mobility Fault mobility increases as more stopes pierce the structure andor de-clamp portions of it
Narrow rib pillars (rockbursting) and ground support strategy
An artefact of narrow transverse stoping layouts is the creation of relatively thin rib pillars in the draw points During the primary mining the pillar between stope accesses is nominally 20 m for the 125 strike length stopes Once the secondary access is driven this pillar is bisected With 5 m wide accesses the pillar becomes 2 times 75 m ribs On the sill
elevation where horizontal stresses wrap around the mining front near vertical loading conditions persist The rib pillar has an effective width to height ratio of 575 which is a relatively squat pillar that can store energy
The mine started off as an in-cycle shotcrete operation with 50 mm of fibrecrete and 22 mm rebar as primary support In burst-prone areas mesh is now systematically applied over the shotcrete Currently a strategy of restricted access and enhanced ground support is being used
Evolution of ground support practice
Shotcrete performance at NRS generally has been very good however shotcrete is a fundamentally brittle material that cannot sustain high deformation The overall rock mass quality is good to very good so the initial in-cycle shotcrete reinforces natural weaknesses in the rock mass During the development phase and even some of the stoping induced changes (both stress and blast vibration) the overall deformation around the drives is typically only a few centimetres still within the bandwidth of high quality fibrecrete However when higher stresses such as sill pillar areas andor repeated loading from nearby stopes is taken into account the deformation around the skin of the stope accesses can exceed the capacity of fibrecrete (Figure 8)
The evolution of damage over time is shown in Figure 8 Depending on the local mine layout this type of damage can be managed with non-entry andor enhanced ground support For narrower portions of the orebody when the previous tierrsquos overcut becomes the next tierrsquos undercut there may not be any personnel-entry requirements A remote procedure is used to attach the raisebore reamer bit for the slot drilling all other blastholes are drilled top down and remote mucking can be used In wider portions of the orebody where multiple panels per crosscut line are required enhanced support is used
Enhanced support is primary weld mesh over shotcrete the shotcrete still keeps key blocks in place and limits overall rock mass dilation The mesh takes over ifwhen deformation limits for shotcrete are exceeded Incremental improvements are ongoing for example a switch to 57 mm diameter weld mesh versus 49 mm (4 gauge from 6 gauge) is being trialled with denser bolting (09 m spacing versus 11 m) instead of the shotcretemesh combination The blast vibrations from the adjacent stope are analogous to a series of large magnitude events occurring nearby The seismic system measures the shots as moment magnitude ~10 for the initial blast timing around the raise and about magnitude 15 for the slash holes afterwards With the 125 m stope spacing the adjacent primary crosscut can see several episodes of high blast vibration (albeit at higher frequency than seismic events so not directly comparable)
There are certain types of tools to tackle rock mechanics challenges Read more about the below tools in the full paper
bull Mine designbull Geohazmapbull Modelling
Figure 9 Photo of secondary stope access The water inflow is from hydraulic backfill vertically above The water makes its way through the fractured ground andor mine-wide faults This is an indication of rock mass failure primary stopes have no process or groundwater inflow unless they intersect an ungrouted diamond drillhole
Figure 8 Top left ndash 23000 microseismic events over a 15 month period (scale bar is 200 m long section view) Bottom left seismic response after final blast in stope 3 Top right ndash crosscut 1 still in reasonable condition after stope 2 mined Bottom right ndash fatigue blast vibration from stope 3 dislodged the fractured wall on top of stope 2 backfill Photos are both in crosscut 1 numbers refer to mining step
1 Fracture zone develops around stope crosscut 2 Mine stope below 3 Blast stope 125 m away
UNDERGROUND
Australian Centre for Geomechanics | December 2017 Newsletter6
Tools to tackle the rock mechanics challengesMine design
The primarysecondary stoping method has evolved from shallower mining layouts which used the sequence to create independent mining fronts for productivity reasons In the deep mine context allowing approximately half of the stopes to yield out and not store local strain energy is a good way to manage rockbursting It is important to ensure the pillars are slender enough so they do not fail too violently The rule of thumb used at NRS is to keep the widthheight ratio less than 23 This has been verified by
numerical modelling seismic monitoring and field observations which show the secondaries are yielded and didnrsquot yield with excessive magnitude seismicity
The yielded blocks of ground change from a potential rockburst risk to a deadweight and fall of ground risk Generally this is easier to manage with respect to ground support design and monitoring capabilities The gravity risk increases as mining progresses For example a second tier secondary stope will have a backfill foundation Multiple panel crosscuts develop into secondary stopes surrounded by cemented backfill on all sides except the footwall The diving board must have a foundation to transfer
some of the load The thin ribs between the stope crosscut and the primary panel need to stay relatively intact to transfer some of the dead weight The retaining wall effect of the backfill on the stope walls also accounts for some of the load carrying capacity In some cases topping up the backfill into the overcut is required This has to be removed or re-developed over top when the next tier mining utilises the excavation as a mucking horizon (undercut) The overall mine design particularly stope sequencing remains the most important consideration for safe mining in the deep context A centre out overall sequence is used the lower reserves are mined top down under the first levelsrsquo backfill (1660 m below surface) to avoid creating another sill pillar Narrow ends of the orebody are planned as an end slicing pillarless sequence (avoiding squat secondary pillars)
Geohazmap (forecasting strainburst hazard)
Three fundamentally different risk forecasting tools are being used to varying degrees at Nickel Rim South geohazmap non-linear numerical modelling and mXrap (Australian Centre for Geomechanics 2014) advanced seismic analysis The geohazmap tool was developed in conjunction with Centre for Excellence in Mining Innovation (CEMI) Mira Geoscience (McGaughey 2014) and several Sudbury mines including Glencorersquos historic Craig mine The risk forecasting approach is important for the operation to prioritise ground support upgrades implement seismic re-entry protocols by pre-defining potential areas impacted by a specific stope blast and for more reliable operations planning The geohazmap approach involves building a sophisticated block model of the mine including geological information (lithology structure) geotechnical variables such as RQD core disking microseismic data including source parameter information
(a)
Figure 10 (a) Core disking in red and high fracture frequency in blue from Craig Mine historic data (b) Core disking contoured onto mine surfaces for Nickel Rim South Mine The core disking areas at NRS are usually associated with weak copper veins rather than abnormally high stress In the Craig Mine case the disking occurred in very strong granitic rock indicative of high stress anomalies
(b)
Criteria W+ W- Contrast Studentised contrast
fall of ground
Note
Proximity to dykes 085489 -115636 201125 5354 791 Within 30 m of a dyke
Event (seismic) density 075657 -076366 152023 642 683 Near microseismic data cluster (previous 6 months)
Depth 079944 -066653 146597 462 633 Deeper than 1521
Pre-mining disking 069557 -052238 121795 393 578 Near disking
Pre-mining rock quality 052122 -090029 142151 383 782 RQD lower than 399
Lithology 066358 -052662 119021 382 Within LGBX
Intersection 049116 -058561 107677 330 672 Within 12 m of a drift intersection
Proximity to fault 015915 -182243 198158 212 972 Within 37 m of a fault
Microseismic source properties
072863 -009895 082757 201 167 Near microseismic data with relatively high EsEp
Table 2 Example results from the geohazmap analysis
Figure 11 Left ndash lower mine development with interpolated colour hazard rating Blue spheres indicate historic strainburst locations or training points for the model Right ndash close up of a high risk area
UNDERGROUND
Australian Centre for Geomechanics | December 2017 Newsletter 7
numerical modelling results or extraction ratio proxies for stress increase and whatever other types of spatial information that are deemed important (ground support groundwater etc) A positive spin-off of the approach is being able to block model geotechnical data rather than using our historic approach of linking geotechnical data to 3D diamond drillhole data (Figure 10(a))
The general objective of Geohazmap Workflow is to quantitatively forecast geotechnical hazard within a mine by combining a set of spatially modelled normalised and weighted hazard criteria Different hazards can be assessed but in the Nickel Rim South case strain and rockburst case histories were used as training data (for an expert system approach) The different parameters built into the spatial model such as distance to faulting can be assessed in a statistical and objective manner to determine their relative importance with respect to the hazard
Hazard = f (geology stress geometry rock quality microseismicity other variables)
A hazard rating system can then be determined and the mine excavations contoured accordingly This provides useful
guidance for support planning purposes for example where to install mesh over the original fibrecrete and rebar support system
The hazard score as shown for rockbursts is a combination of the following criteria in decreasing order of importance appropriately weighted and summed as determined by the statistical analysis (depth proximity to dykes proximity to pre-mining disking as indicated from the geotechnical drillhole database low RQD microseismic event density over previous six month window proximity to drift intersections locally high EsEp in microseismic data within LGBX rock type proximity to faulting)
The training data used largely consisted of relatively small strainbursts (18 data points) As mining progresses more data can be used to help improve the calibration of the model
Advanced analyse of seismic data (mXrap)
The mXrap software suite developed by the Australian Centre for Geomechanics allows for rapid assessment of seismic source parameter information as well as seismic hazard assessment (Hudyma 2005) The example from Figure 12 follows mine
seismology principles developed in the early 1990s (van Aswegen amp Butler 1993 Mendecki 1993) The 2014 twist is simple high resolution seismic data The left hand figure shows a cluster of seismicity in a 125 m wide secondary pillar This implies accurate seismic locations or the analysis could be mixing mechanisms for example failing rock in the pillar versus high stress abutment loading only a few metres away The right hand side of the figure is a stressndashstrain analogy The green plot is cumulative apparent volume where the slope is indicative of seismic strain rate The steep jumps in the plot correspond to the primary stope mining before the secondary pillar is fully formed (high strain rate) The flat plateau at the end of the plot corresponds to no seismicity when the pillar has failed The blue curve is an energy index plot the inference is high stress areas are clamped and do not facilitate high deformation This translates to relatively high seismic energy (high stress) and low seismic moment (low deformation) Although the parameter can be spiky in nature it is clear that an overall load shedding trend exists corresponding to the pillar failing
A great deal more functionality exists within the mXrap software and work
Figure 12 Example of data analysis from mXrap (Australian Centre for Geomechanics 2014)
Figure 13 (a) Contours of clustered seismicity after stope blast (b) Model forecast prior to blasting the same stope The contours represent expected high energy release
(a) (b)
UNDERGROUND
Australian Centre for Geomechanics | December 2017 Newsletter8
is ongoing with collaborative research However it is clear that some of the existing mine seismology principles can be revisited with the high spatial resolution data
ModellingSome in-house numerical modelling is
routinely done with 3D boundary element elastic tools and 2D non-linear codes However the mine has relatively complex geology especially the faulting and is contained within a relatively compact volume (roughly 375 m strike 350 m dip direction 585 m vertical) Significant volumetric rock mass fracturing (inelastic deformation) and mining front interaction have occurred relatively early in the overall sequence 3D non-linear models are outsourced to Beck Engineering who provide some interpretation of the results as well as the results files for local mine site engineers to assess The main calibration tool has been clustered seismicity which is related to commutative plastic strain in the
model (Beck et al 2012) The output is used in short-term and long-term planning prioritising enhanced support installation location of non-entry zones after stope blasting and to focus efforts where alternate sequencing may alleviate some potential ground control problems To date there has been good correlation with model forecasts and observed seismicitydamage underground
The models take into account fault deformation as well as rock mass fracturingdilation Future work will look at some physical deformation monitoring to help fine-tune the calibration process To date the high energy release has corresponded well with clustered seismicity after blasting More work is required to quantify the potential magnitude range of the release however high event rates tend to have higher probability of large events (power law relationship or so-called GutenbergndashRichter relation)
The modelled fault interaction from mining implies relatively far field affects For example the modelled step in Figure 14 has a stope extracted from the lower mining block and reaction in the upper mining block This follows observed seismicity where occasionally rogue type events (real events with accurate location) appear in a mining block that canrsquot be accounted for by local stope extraction
ConclusionsNRS has achieved its annual
production targets and maintained an excellent safety record The recognition of relatively deep conditions in a structurally complex environment has led to a continuous improvement approach to ground control In particular the mines seismic array has been an extremely valuable tool to gauge rock mass response to mining Based on the results achieved (accurate locations with good quality source parameter information) Sudbury Integrated Nickel Operations are re-evaluating how to deploy seismic arrays for future projects
The seismic monitoring data also clearly shows the impact of the major faulting on how the mine responds The use of realistic forecasting tools must take the faults into account To date the non-linear modelling has been able to
make reasonably reliable forecasts for planned ground support enhancements and proactive seismic re-entry protocols (by determining the expected zone of influence of a particular stope blast) Other advanced tools such as Geohazmap and mXrap are being used to evaluate geological and seismic risk The relatively compact orebody with two converging mining fronts (sill pillars) will provide rock mechanics challenges Ongoing work to improve these analysis techniques remains a key part of the mines ground control program
The mine design is still considered the most important aspect of maintaining reliable and safe production The concept of primarysecondary mining at depth has been used elsewhere and is being successfully implemented at NRS In essence more than half of the mines reserves are being mined in a stress shadowed state with low local rockburst potential Just-in-time development is a key component to this success as are the mines ground support strategies
The full paper is available from the online repository at papersacguwaeduaup1410_11_Jalbout
(a)
(b)
Figure 14 Output from non-linear model showing fault displacements (a) and energy release on faults (b)
Ali Jalbout
Goldcorp Inc Canada
Brad Simser
Sudbury Integrated Nickel Operations A Glencore Company Canada
Merry Christmas from all of us at the ACG
Our office will be closed over the holiday period from 23 December 2017 to 7 January 2018 inclusive
We look forward to working with you in the new year
UNDERGROUND
Australian Centre for Geomechanics | December 2017 Newsletter 9
Re-entry analysis optimising and comparing different methodologiesby Stuart Tierney Australian Centre for Geomechanics Australia
The hazard posed by large seismic events is often high enough to warrant the exclusion or evacuation of personnel from underground workings A period of exclusion is often defined following blasts or large events due to the increased risk The period of exclusion until re-entry occurs is a decision for site geotechnical engineers and mine management that must balance the potential risk to personnel with lost production time and associated costs Improvement in the design of re-entry protocols would result in reduced risk to personnel from an early re-entry or reduced production loss from unnecessary exclusions
Current practicesThere is currently no widely accepted
method for determining re-entry times and mine sites typically develop their own rules for exclusions after blasts and large events Much of the re-entry analysis done onsite involves the subjective interpretation of trends in seismic data without specific rules The analysis is generally limited to considering the decay in the frequency of events following blasts or large events and re-entry is permitted when the activity rate
has dropped to normal levels Some sites may also incorporate event size in their re-entry analysis with parameters such as seismic energy or displacement Mines often rely on decision-making based on rules of thumb experience or common sense but this type of judgement can often lead to severe and systematic errors due to various types of interpretive and motivational bias
Vallejos and McKinnon methodSpecific re-entry analysis techniques
are sparsely documented in literature but one of the few examples is the Vallejos and McKinnon (2009 2010) method This method compares the current seismic response to a historical database of responses probabilistically Historical responses are represented by the modified Omori law (MOL) (Omori 1894 Utsu 1961) and a Monte Carlo simulation is used to estimate the probabilistic distribution of the anticipated seismic response in terms of activity rate decay over time
The technique documented by Vallejos and McKinnon only described general principles and stopped short of specific rules or thresholds for re-entry A small
number of examples were discussed but there was no back-analysis conducted to estimate the success of implementing this technique onsite in terms of reducing exposure to large events and minimising unnecessary exclusion time If re-entry analysis techniques cannot be back-analysed a review of controls cannot be done and the risk management design process cannot be closed
Morkel (2017) investigated the practical implementation of the Vallejos and McKinnon methodology and devised stricter quantitative rules to define re-entry This facilitated the systematic back-analysis of the approach to assess its efficacy
Optimisation processResponse modelling
Woodward (2015) developed a robust method for identifying and delineating seismic responses both spatially and temporally This method can create a database of responses modelled with the MOL that can then be assessed with probabilistic techniques like the method described by Vallejos and McKinnon
A total of 1606 seismic responses
Figure 1 Evaluating the success of re-entry analysis methods comparing real-time techniques to blanket rules Better methods will capture more large events and shorter average exclusion times
UNDERGROUND
Australian Centre for Geomechanics | December 2017 Newsletter10
were modelled with the MOL using the Woodward technique at three underground hardrock mines in Australia and Canada For the back-analysis process it was assumed that an exclusion was placed at the start of each response and re-entry was not permitted until certain conditions were met The MOL parameters were the basis for the probabilistic framework in the Vallejos and McKinnon method but the modelling results were not used in any other areas of the back-analysis
Four re-entry analysis techniques were included in the back-analysis Three of the methods were real-time or variable methods where the re-entry time was dependent on the recorded seismicity Seismic events were included for each response if they were within 150 m of the modelled response centroid and within 72 hrs of the response initiation
1 Blanket rule ndash Fixed period of exclusion for each response
2 Events based re-entry ndash Re-entry is permitted when the number of events within a certain moving time window has dropped below the threshold
3 Energy-based re-entry ndash Re-entry is permitted when the seismic energy within a certain moving time window has dropped below the threshold
4 Vallejos and McKinnon ndash Re-entry is permitted when the three criteria described by Morkel (2017) have met the three thresholds
Definition of successful re-entry techniques
The success of each re-entry assessment methodology was judged based on two parameters the average period of exclusion that resulted from the re-entry rules and the percentage of large events that occurred within the re-entry time A good re-entry protocol minimises the period of exclusion while maximising the portion of large events within the exclusion The success of the blanket re-entry rule is plotted for Mine B in Figure 1 This highlights the strong correlation of large events with responses and how a large portion of events can be captured by relatively short exclusions
A re-entry protocol that assesses events in real time should be more successful than blanket rules where a fixed exclusion is defined for all responses irrespective of the observed activity This is because real-time methods require additional work in implementation and add uncertainty to mine scheduling and planning
Four different local magnitudes (-05 00 +05 and +10) were used to define a large event Even though these magnitudes are not always considered hazardous increasing the magnitude threshold reduces the size of the dataset
Vallejos and McKinnon optimisationThe Vallejos and McKinnon method
requires that each of the three thresholds are met before re-entry is permitted Some responses were found to not meet the re-entry guidelines and therefore a maximum re-entry time needed to be defined This was set at 72 hrs to align with the back-analysis time span
The variation in success resulting from different threshold values was investigated through a brute force approach A total of 61132 combinations of the threshold values were applied to all defined responses at each of the three mines For each combination the average time of the exclusion was calculated along with the number of large events that were captured Combinations of thresholds that result in the same success but had longer exclusions than other combinations were then removed to arrive at the optimised Vallejos
and McKinnon results
Energy and event-based optimisation
A similar optimisation process was undertaken for the energy and event-based methods The threshold number of events and total energy of events were adjusted as well as the length of the moving time window More than 200000 combinations of the two thresholds in each method were included in the optimisation
ResultsThe results of each optimisation were
collected to assess the relative success of each of the four re-entry methods Figure 2 shows an example of the results of each re-entry method for events over -05 ML at Mine A There are clear differences in the re-entry method performance and there are occasionally several hours longer exclusions for the same number of large events captured
Figure 2 Comparison of success for each re-entry assessment method
Figure 3 Average difference in re-entry time compared with blanket rule
UNDERGROUND
Australian Centre for Geomechanics | December 2017 Newsletter 11
The energy and event-based methods both outperformed the blanket re-entry rule but the Vallejos and McKinnon method was less efficient The difference between the methods is best highlighted by the variation in captured events for constant re-entry time or vice versa Figure 3 shows the difference in average re-entry time compared with the blanket rule for the same case as Figure 2
The results from each mine are summarised in Table 1 for all four back-analysis magnitudes The average difference in re-entry times compared with the blanket rule are coloured from lsquocoldrsquo to lsquohotrsquo in order from shortest to longest exclusion time The energy-based method was the best method in the majority of cases outperforming the event-based method in all but one case Both of these consistently outperformed the blanket rule
The Vallejos and McKinnon method was regularly the worst performing and was less efficient than the blanket rule in the majority of cases
ConclusionThe results of this research indicate that
a real-time re-entry assessment method can offer improved outcomes compared to blanket re-entry rules by reducing the average exclusion time while still capturing the same number or a higher number of large events The incorporation of event size in the assessment can result in better results than the event count The Vallejos and McKinnon method is a probabilistic framework for re-entry assessment but this was found to be less efficient That is for the same re-entry time less events are captured than the blanket rule in the majority of cases in this study
Future researchAn engineering-based design process
for managing exposure to seismicity in underground mines is still incomplete There are still very few documented methods that help mines determine when to evacuate where to exclude and when to re-enter A lot of analysis is kept onsite and there is little collaboration within industry on this subject It would be beneficial to draw out the analysis techniques that have been developed onsite If you would like to help inform the future research direction please complete the industry survey on exposure management procedures created by the ACG at mxrapcomlinks
This article is based on a paper presented at the ACG Eighth International Conference on Deep and High Stress Mining March 2017 View the full paper atpapersacguwaeduaup1704_11_Tierney
Average difference in re-entry time compared to blanket rule (hrs)
Mine Back-analysis Energy method
Event count method
Blanket rule Vallejos and McKinnon
A +10 ML +56 +35 00 -22
A +05 ML +50 +18 00 -45
A 00 ML +50 +18 00 -56
A -05 ML +48 +17 00 -53
B +10 ML +116 +102 00 +28
B +05 ML +66 +64 00 +41
B 00 ML +53 +52 00 -06
B -05 ML +46 +47 00 -12
C +10 ML +37 +33 00 -03
C +05 ML +58 +53 00 +37
C 00 ML +69 +66 00 +38
C -05 ML +39 +35 00 -21
Table 1 Summary of results from all three mines and various back-analysis magnitudes
Stuart Tierney
Australian Centre for Geomechanics Australia
mXrap is a geotechnical data analysis and monitoring platform within which data analysis tools have been developed The software is very versatile enabling a wide application across different areas of the geomechanics field As a result the software is being used as a technology transfer tool for several research projects with the Consortium members and research sponsors receiving software apps with which they can implement the research outcomes onsite This has contributed to several research organisations becoming members of the mXrap Consortium
mXrap (and its predecessor MS-RAP) was developed under the ACGrsquos Mine Seismicity and Rockburst Risk Management project that commenced in 2000 In 2015 the development of mXrap was separated from this ACG research project and its ongoing evolution is sponsored by the mXrap Consortium comprised of both sponsoring companies and research members that also contribute guidance and advice
The software mXrap provides the development environment (platform) within which apps dedicated to specific tasks are developed The ACG team has under the Mine Seismicity and Rockburst Risk Management project
developed several tools for the monitoring analysis and management of mining-induced seismicity Apps are now also developed for wider application and users may build and share their own apps
Software licences are only available to mXrap Consortium members Membership fees are directly related to the number of licences required by the Consortium member For more information please visit wwwmxrapcom or contact infomxrapcom
What is mXrap
Stuart completed a Masters of Engineering Science (mining geomechanics) at Curtin University in 2016 where his thesis in the final semester was assisted by the ACG In February 2017 he joined the ACG as a research assistant for our mXrap Consortium
OPEN PIT
Australian Centre for Geomechanics | December 2017 Newsletter12
The utilisation of photogrammetric software has been increasing considerably within the mining geotechnical field Its role in open pit mining for structural mapping is growing as access to highwalls becomes restricted for safety reasons Over the past five years the capability of ADAM Technologys 3DM Analyst Software Suite has improved to the point where it can now be used in conjunction with ARANZ Georsquos Leapfrog implicit modelling software to produce accurate structural models quickly and efficiently This method has successfully been utilised at Evolution Miningrsquos Cowal gold mine in Central West NSW
In the past photogrammetry models have been produced for individual benches for structural mapping in a window mapping format With the capability for modelling whole bench stacks structures can now be mapped across an entire pit wall which in the past has been difficult to accomplish with field mapping alone With improvements in computing capabilities and Adamtechrsquos software accurate digital terrain models overlain with photographs can be produced for large areas of open pit highwalls Figure 1 displays an example of a model spanning an area approximately 500 m across and 250 m high that was photographed and made ready to map in an hour and a half
Structures were mapped onto an Adamtech model as three-dimensional discs which are a visual representation of the orientation of the fault in three-dimensional space at the location of the modelled disc In the past structures that trend across multiple benches have been mapped as a single large disc which could end up being hundreds of metres in diameter At Cowal it was discovered that by mapping large scale structures with a series of smaller discs normally only a few metres in diameter the undulation of the structure can be reproduced as it trends across the pit wall An example of this process is displayed in Figure 2
The modelled structural discs which were mapped in a photogrammetric model in 3DM Analyst were exported in a format which can be imported into Leapfrog The structural discs were used to produce semi-planar fault meshes that used the orientation of the individual discs to guide the implicit modelling algorithms built into Leapfrog
Historically 3D modelling of significant fault and shear structures could only be completed using a combination of pit mapping and core logging data Two-dimensional sections were then used to connect these data points and produce
an overall 3D mesh of the structure The implicit modelling algorithms used in Leapfrog allow this process to be automated saving countless hours of manual modelling time This time can instead be utilised towards producing a more detailed structural model encompassing numerous structures which may not have been modelled in the past due to time constraints
Leapfrog allows for structural files to be appended with new data points as they
become available Field mapping and core logging data measurements in a dipdip direction format can be appended onto the existing structural files to allow data from previous cut-backs and logged drillholes to be included in the implicit modelling process As a result a much more accurate structure can be built that not only reflects what is happening in the current pit walls but also that of the rock behind these walls
Pit mapping information is useful for considering the interaction of the
Recent advances in structural modelling capabilitiesby Richard Battison Evolution Mining Australia
Figure 1 Photogrammetric model produced using ADAM Technologyrsquos 3DM Analyst Software Suite (approximately 500 m across and 250 m high)
Figure 2 Example of structural discs being used to outline the undulation of a structure as it trends up a pit wall
OPEN PIT
Australian Centre for Geomechanics | December 2017 Newsletter 13
different structures where they can be observed and accessed in the pit walls Any interaction observed between structures can be applied to the structural model in Leapfrog When applied the implicit modelling algorithm re-models the structures upon which the relations apply slicing or constraining the 3D mesh where it is intersected by crosscutting structures Figure 3 displays an example of before-and-after modelling relationships where they have been applied
A full list of crosscutting relationships is administered by the software Any conflicting cutting relationships in the chronological order of the structure are flagged so they can be rectified by the modeller This gives the user the luxury of not having to keep track of hundreds
of different structural intersection relationships that occur in a large structural model The user can observe the cutting relationships of structures in the field as well as in the photogrammetric model and apply these rules to the Leapfrog mesh without having to go through the other relationships to make sure there is not a conflict
The speed at which this modelling process can be completed means that geotechnical staff can update their structural model in Leapfrog after a new bench is mined out Previously mapped structural discs can be opened in the updated photogrammetric model after which the newly modelled discs can be added to account for the newly uncovered batter faces Updating the structural model
in this manner means that it can be kept up-to-date continuously rather than the current practice on most sites which is to update the model quarterly-to-half yearly By keeping the model up-to-date structural analyses can be updated against pit designs to foresee possible future instabilities and remediate them before they are actually mined
The newly updated structural meshes can be exported as a DTM file in a format which is compatible with most other modelling software packages This means that structural meshes can be shared with other stakeholders on a mine site who may not have access to Leapfrog For example drill and blast engineers can use the structural DTM files to adjust blast designs to protect batter faces from extensive blast damage along structural planes
The combination of ADAM Technologys 3DM Analyst Suite and ARANZ Georsquos Leapfrog software to produce structural models has provided the ability to increase the efficiency and accuracy of structural modelling at the Cowal gold operation The replacement of manual modelling with implicit modelling has removed a very time-consuming process This ability freed the geotechnical engineer to concentrate on the interpretation of the structural model as well as providing operational geotechnical staff with the ability to dynamically update the structural model as required
Richard Battison
Evolution Mining AustraliaFigure 3 A combination of photogrammetry and field mapping data being used to create a
structural mesh The fault has been assigned cross-cutting relationships to constrain its extents The original pre-constrained structure can be seen faded
S A V E T H E D A T E
ACG Geotechnical Engineering for Open Pit Mines23ndash25 October 2018 | Novotel Perth Langley Hotel | Perth Western Australia
ACG Instrumentation and Slope Monitoring Workshop26 October 2018 | Novotel Perth Langley Hotel | Perth Western Australia
Contact the ACG for sponsorship opportunities events-acguwaeduau
wwwacguwaeduauevents
Australian Centre for Geomechanics | December 2017 Newsletter14
ACG celebrates 25 years of mining geomechanics excellence
Established in June 1992 the Australian Centre for Geomechanics looks back in pride at the last 25 years and forward with enthusiasm and confidence to ACGrsquos future endeavours
The following profiles illustrate the range of research projects undertaken by our not-for-profit mining research centre and include some that are have been and will continue to be pivotal in the development and evolution of our team
bull Ground Support Systems Optimisation Research Project
bull Mine Seismicity and Rockburst Risk Management Research Project and mXrap Consortium
bull Strainburst Research Projectbull An Effective Stress Approach to Mine
BackfillIndustry has sought ACG advice and
assistance on projects from the backfill mines of China to the deep mines of Australia Canada and South Africa Projects range from mitigating the risks of seismic
hazards to the complexities of rock stress testing
Since 1992 the ACG has presented more than 300 industry courses seminars workshops conferences and symposia that have been attended by almost 14000 mining professionals and produced seven training videos in the areas of open pit underground and environmental mining geomechanics (Figure 1)
ACG Director Professor Yves Potvin concludes that ldquothe global mining industry has and continues to place its trust in the ACG to deliver the world-class research and training to advance mine safety and mitigate geotechnical risks We are grateful for industryrsquos ongoing support encouragement and counsel ndash it motivates and inspires our team to seek solutions and find technologies to address industryrsquos geotechnical challengesrdquo
In 2005 I was honoured to accept an invitation to join the board of the ACG as an industry representative Since then it has been very rewarding to witness the service that the ACG team has provided to the mining industry in Western Australia and to observe the high regard within the global mining community for the centrersquos staff and their work
Over the 25 years of the ACGrsquos existence the mining industry has continually strived for improvements in safety despite the enduring quest for greater productivity and efficiency including in deepening mines with more demanding geotechnical environments Safety and environmental standards imposed both internally and by regulation have continued to rise The ACGrsquos role in advancing geomechanics related research education and training has been closely attuned to these needs and has made important contributions to them
For this reason the industry is enormously grateful to the ACGrsquos founders for their far-sightedness Those founders have been able to see the centre flourish into the success it is today 25 years later led by its enterprising director Professor Yves Potvin I congratulate Yves and all who have contributed to that success
The ACG undertakes its activities with an admirable blend of energy rigour and pragmatism that will see the industry continue to both support and rely on the ACG for many years to come
Ian Suckling
Chairman of the Board Australian Centre for Geomechanics Australia
Figure 1 Number of attendees at ACG events by year since 1993
Total course numbers 2008 - 2017
0
200
400
600
800
1000
1200
Australian Centre for Geomechanics | December 2017 Newsletter 15
In 1991 a proposal for a Federal Government Cooperative Research Centre (CRC) was submitted from the Geomechanics Group at The University of Western Australia (UWA) in response to the call for the initial round of applications The parties to this cooperative application included UWA Curtin University (Western Australian School of Mines) CSIRO Department of Minerals and Energy (DME) and an industry partner
The application did not make the final cut for the 15 centres funded initially and the four research partners decided that what had been proposed was needed for the mining industry and each contributed to the formation of a self-funded research centre based at UWA The centre was conducted under the oversight of an industry chaired board of management and an advisory board comprising representatives from the mining industry and was formally launched in June 1992
The stated objective of the centre was to provide research and education services to the mining industry and from a very small base the centre remained viable in the early years by running courses for industry primarily on tailings management rock mechanics and mine geology The presenters for these courses were principally volunteers from the partners and interested mining companies At that stage the ACG staff consisted solely
of Christine Neskudla and I was essentially seconded from UWA on an almost full time basis Chris Swindells then with the DME was of considerable assistance to us in those early days
Some research grants were won in the early years from MERIWA and mining companies and some valuable research was conducted in the area of mine tailings However it was not until sufficient funds had been accumulated to enable the recruitment of Professor Yves Potvin in 1998 that the ACG had the wherewithal to expand both the scope and extent of research In 2000 I retired from UWA and the ACG and Yves was appointed director and since then the ACG has literally blossomed
In 2000 the concept of international seminars or conferences was initiated with the first of a series of annual seminars on Paste and Thickened Tailings which has become the preeminent gathering for this discipline in the world and has led to the publication of an advice and guidance manual ndash the third edition of which is currently being translated into Mandarin for the Chinese market at the request of the University of Science and Technology Beijing This concept has been expanded into other areas and the ACG now runs seminars worldwide and a number of technical publications have been produced
With the subsequent recruitment of other senior researchers such as Professor Phil Dight and Dr Johan Wesseloo the ACG has expanded to a professional and research staff in Perth currently totalling 14 to handle the workload associated with managing research in a number of fields as well as running courses seminars and various publications and through associations with other premium research organisations around the world has achieved an enviable international standing Quite frankly considering the humble start in 1992 it is amazing some 25 years later to see how successful the ACG has been and being totally self-funding (thanks to being rejected for first round CRC) it has been able to weather the financial ups and downs associated with the volatile mining industry
Achievements of the ACG ndash a retrospective reviewby Richard Jewell founding Australian Centre for Geomechanics director
Richard Jewell
Australian Centre for Geomechanics Australia
ACG Corporate Affiliate Memberships
2017 Corporate Affiliates
ACG Corporate Affiliate Memberships allow your company to gain exposure to industry leaders while also providing savings on our
well-known and respected further education and training platform Email josephineruddleuwaeduau for details
OPEN PIT
Australian Centre for Geomechanics | December 2017 Newsletter16
The geotechnical conundrum are surface observations reflecting rock mass behaviour at depthwrites Dr Michele Salvoni Australia and Professor Phil Dight Australian Centre for Geomechanics Australia
IntroductionMovements instability and failures
in open pit mines can pose important geotechnical problems that may lead to major impacts on the safety of personnel and productivity of the mining operations As geotechnical engineers we are responsible to collect analyse and regularly review a variety of information during the lifetime of the operation (eg geology structural geology material properties observations and monitoring data) and to recognise andor anticipate possible instabilityfailure mechanisms (Cawood amp Stacey 2006 Read 2007 Stacey 2009)
In modern mechanised open pit mining new tools such as ground-based radars and terrestrial laser scanners have started to support more traditional visual inspections and surveyed geodetic prisms to assess slope performance exposure (Little 2006 Harries et al 2006 Hutchison et al 2015) These latest technologies offer a wider coverage of the pit and almost real-time monitoring allowing rapid identification of unstable areas and managing safety and operational issues
Although these tools are extremely important on a daily basis for long-term operational management they can only provide information of near surface displacements and engineers often have to make assumptions on rock mass behaviour at depth (Salvoni et al 2016) In some cases traditional subsurface monitoring eg inclinometers piezometers time domain
reflectometry andor extensometers can provide valuable information However these instruments cannot cover the three-dimensional volume of the rock slope (Lynch amp Malovichko 2006) and require safe access for the drilling and installation of the system and also for data collection if the instruments cannot be read remotely
In this article experiences acquired during the last three years on a case study of a large scale unstable rock slope at MMG Century mine will be discussed The project has challenged one of the most common assumptions made when dealing with geotechnical problems and has examined the idea that near surface behaviour always reflects rock mass response at depth
Geologicalndashgeotechnical overview
Century mine was an open pit mine owned and operated by MMG Limited The mine is located near Lawn Hill in North Queensland approximately 250 km northwest of Mount Isa close to the Northern Territory border The Century deposit represents one of the major sediment-hosted zinc lead and silver deposits of the Mount Isa inlier and McArthur basin (Andrews 1998 Broadbent et al 2002) When mining operations ceased at the end of 2015 the pit was approximately 25 km long by 15 km wide at the surface with a final depth of 320 m
Since 2009 the South West Pit Wall has represented an ongoing challenge for site personnel with several multi-
batter failures associated with continuous bedding planes (Sweeney amp Abbott 2016) The pit wall is a 300 m high slope with an overall angle of 40deg developed within the footwall sequence (Figure 1) The units are characterised by the presence of thinly bedded shales exhibiting a highly anisotropic behaviour and affected by continuous fracturing and occasional bedding plane shears (Kurukuk amp Sweeney 2012) In addition to bedding there are three main geological structures named Pandorarsquos Page Creek and Creek Faults which bound the area and have contributed to the local rotation and folding of the bedding planes Particularly interesting is the presence of a massive block of CBX (carbonate breccia) which has been interpreted as a result of a large fault jog or dilation related to the Pandoras Fault (Salvoni et al 2016)
Generally the pit wall experienced periods of rapid acceleration (up to 10 mmday) during the wet season and steady trend movements (less than 1 mmday) during the dry season Major concerns at the mine started to rise during the 2012ndash13 wet season with an increase of acceleration and the development of tension cracks up to 30 m behind the pit crest Following numerical analysis (Sainsbury et al 2013) which indicated the likelihood of a deep-seated failure mechanism The mine operations decided to leave a buttress at the toe of the slope (~28deg) to manage the observed progressive movement in the slope above the CBX block Despite the change in the design the slope continued to move More information is provided by Salvoni et al (2016) and Sweeney and Abbott (2016)
Observations questions and hypothesis
There are a few observations and some key elements available to allow us to better understand the problem The first observation is that by looking at the historical deformation trend recorded by the prisms it appears that the rock mass near the surface was no longer moving in the elastic range In fact it shows a time-dependent behaviour (creeping) much more like a rock riverscree slope with rapid acceleration triggered by rainfall events (Figure 2) Also looking at the displacement vectors the CBX seems to have had a key role in the stability of the slope acting as a natural buttress being slowly pushed out in a toppling or Figure 1 Front view of the target site on the South West Pit Wall at November 2013 showing
the main geotechnical units and structural features
OPEN PIT
Australian Centre for Geomechanics | December 2017 Newsletter 17
rotation manner ie activepassive wedge Finally one important aspect has been overlooked the progressive weathering of shale near the surface As previously mentioned a common assumption in slope stability analysis is that an unstable rock mass is considered as a rigid block However at Century there are indications that soon after the shales were exposed they tended to rapidly break up and deteriorate due to their high clay mineral (montmorillonite) and sulphide mineral pyrite (FeS2) content Several authors highlighted how in low durability some materials like shales and their slaking erosion and surface creep mechanisms are dominant (Taylor amp Smith 1986 Walkinshaw amp Santi 1996 Marques et al 2005)
In this sense at the beginning of the project it was important to question if the large deformations observed near the surface truly reflected the proposed deep-seated mechanism behind the pit wall Given the fact that there was limited access to install traditional subsurface monitoring a microseismic system was proposed and subsequently implemented in November 2013 The aim of the project was to provide early warning of the development of the deep-seated failure and to understand how deep into the wall the rock mass was being damaged
Microseismic dataMicroseismic (MS) and acoustic
emission monitoring have found many uses over the years in the geotechnical field (Xiao et al 2016) Examples of applications are reported for mining rockburst risk assessment caving monitoring rock slope monitoring laboratory tests as well as for the oil and gas field These monitoring techniques are based on the recording of the radiated seismic energy generated by brittle fracturing of the rock to estimate a 3D location and parameters at the source The general idea is that as seismicity can be recorded at a lowinfinitesimal strain
strain near the onset of instability could be detected before surface deformation is eventually observed However in the open pit environment and in natural rock slopes the number of case studies remains limited and the technique has not reached the maturity to be used as a routine method requiring a great deal of interpretation (Wesseloo amp Sweby 2008)
The microseismic array deployed at Century comprised 16 sensors located in the volume of rock behind the South West Pit Wall As shown in Figure 3 the system tends to follow the slope curvature as pit geometry and accessibility represent major constraints for installing the sensors Navi-drilled boreholes behind the pit crest were the only option to enable the instruments to be sufficiently close to the
pit wall and the expected instability area The system was operative from November 2013 until February 2016 when it was decommissioned More details on the system are provided by Salvoni et al 2016
The majority of seismic data was recorded between February and April 2014 when a rapid acceleration of surface deformation was observed after a few days of heavy rainfall The slope experienced a total cumulative displacement of up to several metres with localised small instabilities and the partial detachment of the CBX block During this time the system recorded more than 2300 microseismic events ndash ranging from a moment magnitude of -2 to 02 From Figure 3 it can be observed how there is a good correspondence between the spatial and
Figure 2 (a) Ground displacements recorded by the prism monitoring and daily rainfall between October 2010 and January 2014 in different areas of the slope (b) 3D view showing the displacement vectors for the same time period and coloured by total cumulative displacement
Figure 3 (a b c d) Seismic events recorded from February to May 2014 behind the South West Pit Wall 3D view showing the seismic activation sequence for different time windows Seismic events are coloured and sized by moment magnitude
OPEN PIT
Australian Centre for Geomechanics | December 2017 Newsletter18
temporal distribution of microseismic and slope deformations activity The following points are made
1 From the 15th February 2014 seismic events started to be recorded behind the pit wall with a rate of approximately 11 events per day This activity was mainly concentrated in the lower section of Page Creek Fault in the wedge failure sector and behind the CBX block (Figure 3a)
2 During 23rd to 24th February two main event clusters were observed The first one corresponded to a localised planar failure in the lower section of Page Creek Fault while the second occurred in the buttress where the slip zone was observed A general increase in seismic activity was recorded (~20 events per day) with events also being detected in the upper section of the wall (Figure 3b)
3 From the middle of March to the middle of April 2014 the seismic activity rate reached its peak with more than 30 events per day Activity was mainly localised in the wedge failure sector behind the CBX block and in the upper section of the wall Events were also recorded in the right corner at the base of the CBX block and along the Pandoras Fault (Figure 3c)
4 Gradually from the middle of April 2014 events were mainly
concentrated in the wedge failure sector and behind the CBX block Activity progressively slowed down reaching only a few events per week by the end of May (Figure 3d)
Rock mass damage at depth and numerical analysis
Important information of the rock mass behaviour at depth can be extrapolated from the distribution of the microseismic activity Figure 4 shows a section through the pit wall representing the seismic events coloured by distance from the surface and sized by moment magnitude Seismicity tends to be concentrated within a narrow band between 20 and 40 m from the surface and behind the CBX block Particularly interesting is also the reduction of seismic activity in the lower section of the wall near surface A similar characteristic was also observed in another section view along the wedge failure sector
The data do not reveal any sign that a deep-seated instabilityfailure is developing as predicted by the numerical analysis More importantly the data confirm the hypothesis that different instability mechanisms are affecting slope behaviour The material close to the surface is characterised by intensely brokenweathered rock mass and is no longer able to produce and propagate much seismic energy (ie it is an aseismic zone) This area is subjected to creep driven movements that are always present even in dry conditions and are characterised by
an acceleration in movement related to seasonal rainfall As it is now much more broken up it is also much more permeable and with rainfall the influence of effective stress is leading to the unravelling Even though it is permeable it does not mean it dries out in the dry season This shallow instability has caused the rotation of the CBX block and triggered further deformation at depth where between 20 and 40 m of rock mass is progressively fracturing and may potentially develop into a multi-batter failure involving the upper section of the pit wall
To verify some of the concepts previously expressed and compare them with the available data and observations a series of simple 2D finite element numerical modelling was carried out The final model assumed a plastic layer of approximately 10 m of affected material characterised by the weathering An additional surface was also introduced to reproduce the effect of rainfall water during the raining season Derived MohrndashCoulomb failure criteria with no post-peak dilatancy and cohesion loss were then assigned to the constitutive model for the fresh shale and the CBX unit based on laboratory testing (Salvoni 2015) For the shales a joint model (Goodman et al 1968 Hammah et al 2008) was built in order to explicitly simulate the effect of the continuous bedding plane shears which most likely represents the major structural control of the slope
Final results are shown in Figure 5 This numerical analysis suggests that the assumed geometry and a 10 m thin layer
Figure 4 Section through the distribution of the distance of seismic events from the surface for the upper section of the pit wall (above) and for the wedge failure area (below)
OPEN PIT
Australian Centre for Geomechanics | December 2017 Newsletter 19
of weathered rock can create a toppling mechanism on the CBX with progressive shearing at the contact between the shale and breccia units and progressive damage at 30ndash40 m below the pit surface The weathered material has a time-dependent type of behaviour and is subjected to continuous unravelling associated with rapid acceleration triggered by the rainfall
ConclusionLarge unstable rock slopes can
pose significant hazards for personnel and operations in open pit minesroad cuttings A complete understanding of failure mechanisms and the state of the rock mass requires analysis of a comprehensive dataset However in
many cases information is limited to the surface displacement and engineers can only make assumptions about the rock mass behaviour at depth Although in many cases rigid block movement is a reasonable assumption in others it can lead to misleading interpretationnumerical analysis of the instability mechanisms
The MMG Century mine case study is an excellent example of how the combination of microseismic monitoring and critical thinking lead to a much better understanding as to how the slope was behaving The outcomes of the project not only provide an insight into the possible applications of microseismic data in open pits but also help reveal a complex
mechanism where slope deformations mask minimal damage at depth
Article references are available at acguwaeduaunewsletters-annual-reports
Dr Michele Salvoni
Australia
Figure 5 Final numerical analysis results with the slope affected by a 10 m weathered zone with a plastic behaviour and progressive shearing developing at depth where microseismic data were recorded
The ACG team congratulates Michele on
the successful submission of his PhD thesis Rock Damage
Assessment in a Large Unstable Slope from Microseismic
Monitoring ndash MMG Century Mine Case Study
We wish him all the best in his future endeavours
These ACG open pit mining workshops will accompany the 2018 International Symposium on Slope Stability in Open Pit Mining and Civil Engineering at the XIV International
Congress for Energy and Resource Mining in Seville Spain 11ndash13 April 2018
To register please visitwwwcongresomineriasevilla2018orginternacional-ingles
ACG-Workshophtml
ACG Instrumentation and Slope Monitoring Workshop amp InSAR Radar and Emerging
Technologies Workshop9 amp 10 April 2018 | Bespoke Workshop Halls Barceloacute
Conference Centre | Seville Spain
UNDERGROUND
Australian Centre for Geomechanics | December 2017 Newsletter20
Stope reconciliationby Dr Kyle Woodward Australian Centre for Geomechanics Australia
BackgroundMany underground mines around the
world use an open stope mining method The profitability of open stope mining depends on the accuracy of the stope design and the execution of the mining process The value of a stope is intrinsically linked to success of ore recovery but it is also related to the amount of unintentional dilution Stope performance is discussed in terms of underbreak (UB) ie ore not extracted and overbreak (OB) ie waste extracted The maximum value obtainable for a stope will be obtained from stopes with minimum overbreak and minimum underbreak
Open stope design approaches and tools have not evolved significantly since the 1980s and industry still extensively uses the stability graph method (Mathews et al 1980 Potvin 1988) An exception is the concept of Equivalent Linear Overbreak Sloughing (ELOS) which was developed by Clark and Pakalnis (1997) It was initially used to assess overbreak in narrow vein mining Capes (2009) extended the original Clarkrsquos database applied the methodology to open stope design and included some capability to forecast stope overbreak For most mine sites the robust statistical methods for forecasting overbreak are practically non-existent
Stopes with underbreak will leave behind unrecoverable ore and this can be as detrimental to stope value and mine economics as overbreak Existing assessments of open stope performance do not consider the evaluative estimation and forecasting of underbreak (Potvin et al 2015) Potvin et al (2016) highlight that the optimisation of overbreak and underbreak are generally conflicting and efforts that focus on reducing overbreak may increase the amount of underbreak This emphasises the importance of having good stope reconciliation tools and procedures that can translate into future stope performance optimisation
Techniques of underground surveying have made significant advancements when determining mined volumes most notably with the application of the cavity monitoring system (CMS) (Miller et al 1992) At most mines a wealth of data is created by accurate and routine stope surveying techniques The full potential of this data is far from being realised This data allows for the probabilistic forecasting and comprehensive assessment of stope performance and ultimately the optimisation of mining economics and the utilisation of a finite resource
A pilot case study - Olympic Dam (BHP)
Exploratory research at BHPrsquos Olympic Dam has shown that the concept of stope reconciliation can have a significant impact on the overbreak and underbreak outcomes at the mine (Potvin et al 2015 2016)
Figure 1 shows historical stope performance of Olympic Dam with respect to overbreak underbreak and a combined measure (Potvin et al 2016)
The previous work at Olympic Dam showed that the amount of overbreak was a function of traditional design parameters (hydraulic radius and the stability number) but also strongly correlated to the orientation of stope walls and the blasting pattern used The amount of underbreak was correlated to the drilling pattern and whether blasting was against a wall of cemented fill Other correlations were found between overbreak underbreak and the slot opening strategies
This research shows that in addition
to traditional measures operational and design factors can contribute to overbreak and underbreak outcomes This information can be used in the assessment of future stope performance and to forecast the potential for overbreak and underbreak
Stope reconciliation project Project overview
The current iteration of the stope reconciliation project has been supported by six sponsor sites along with the Minerals Research Institute of Western Australia (MRIWA) This project will build upon previous results at Olympic Dam to develop tools that enable a probabilistic approach to stope design This will involve the development of improved stope performance assessment and the investigation of factors that affect overbreak and underbreak
In practice possible influencing factors will be assessed from a range of data including stope design (eg stope
Figure 1 Historical underbreak and overbreak stope performance at Olympic Dam
Figure 2 An erroneously designed wireframe (left) and an automatically corrected wireframe (right)
UNDERGROUND
Australian Centre for Geomechanics | December 2017 Newsletter 21
dimensions stability number) operational information (eg drilling pattern slot opening adjacent stope fill walls) and geotechnical information The technology transfer to site will occur via mXrap software development and will aim to minimise manual data manipulation Conceptually given a stopersquos CMS and design the stope performance statistics will be automatically generated with a mXrap stope optimisation app Furthermore an additional mXrap app will provide a probabilistic forecast of overbreak and underbreak for a given stope design historical site-specific stope performance and factors that influence performance
Preliminary project progressThe assessment of stope performance
is underpinned by the quality of data Initial considerations of data quality focus on the quality of surveys specifically stope CMS and designs Surveys can be constructed with only visualisation in mind and may contain features that influence subsequent calculations An ideal CMS or design survey will be
bull a single surface representing an individual stope
bull consistent ie no sharp edges small ledges and other unrealistic features
bull a realistic and consistent resolutionbull free from self-intersectionsbull free from internal or external volumes
surfaces andbull a closed surface ie watertight
Survey quality is ideally considered during the CMS and design procedures to prevent automated approaches erroneously reinterpreting surveys without site-specific
information As part of preliminary work on survey quality a mXrap app was created to explore and address some of the more basic survey quality concerns Figure 2 gives an example of a common error (nodes not being lsquosnappedrsquo together) and shows the erronous design wireframe (left) and an automatically corrected wireframe (right)
The selection of a method to find the volumes associated with 3D surfaces also must consider how additional information might be integrated in a general assessment framework A familiar concept and format for geologicalgeotechnical information is a block model whereby rock properties are assigned to specific volumes An extension of this concept is not to use blocks of a uniform size but instead to use smaller blocks where more information is available and extra detail is warranted
A model of the volumes associated with stope CMS and designs can be achieved by the creation of an octree Essentially an octree is a tree data structure created from the partitioning of 3D space by recursively subdividing it into eight octants ie blocks are created by dividing volumes that are intersected by surfaces until an appropriate resolution is reached The implementation of an octree is an efficient and flexible framework for the assessment of stope performance which retains spatial information and is an essential feature to enable the assessment of factors that influence stope performance
An example of this type of stope performance assessment is shown in Figure 3 A stope CMS and design survey is used to create the subdivision of an octree
(left) These octree blocks are assessed with respect to design and CMS surfaces to determine if they are volumes of underbreak (centre) and overbreak (right)
The octree format lends itself to less conventional methods of assessing stope performance Figure 4 illustrates preliminary work that explores spatial characteristics of stope design and performance Shown in this figure (right) is the result of an algorithm which automatically detects the lsquouniquersquo straight angled and domed faces of a stope design Shown left is a projection map for a lsquouniquersquo face This plot shows the distance between CMS and design surfaces in a direction normal to the design survey This plot highlights the areas and severity of overbreak (positive distances) and underbreak (negative distances)
Areas plotted as blue are underbreak red are overbreak and green are mined to design
Concluding remarksStope design and performance
assessment has not significantly progressed despite the economics of mining being intrinsically linked to ore recovery and dilution Stope surveying data allows improvements to be made when assessing stope performance particularly when assessing the amount of underbreak and the development of probabilistic methods of stope design that optimise value
Previous research assessed stope performance at BHP Olympic Dam and showed that by considering operational and design factors in addition to
Figure 3 An octree sub-division of stope CMS and design surveys (left) and octree blocks which are volumes of underbreak (centre) and overbreak (right)
UNDERGROUND
Australian Centre for Geomechanics | December 2017 Newsletter22
traditional measures overbreak and underbreak outcomes can be improved The current stope reconciliation project will further develop tools to assess the influence of factors on stope performance and probabilistic stope design Initial work has focused on survey quality developing a general assessment framework and developing exploratory tools that characterise stope design and performance
Details about the ACG Stope Reconciliation and Optimisation Project are available at wwwacguwaeduauacg-research
Figure 4 Right ndash results of an algorithm which automatically detects the lsquouniquersquo straight angled and domed faces of a stope design Left ndash a projection plot shows the distance between CMS and design surfaces in a direction normal to the design survey
Dr Kyle Woodward
Australian Centre for Geomechanics Australia
The ACG acknowledges the following Stope Reconciliation and Optimisation Project sponsors
bull Agnico Eagle Mines Ltd Canadabull BHP Olympic Dambull Glencore Mount Isa Mines
bull Gold Fields Australia Pty Ltd Granny Smith
bull Hecla Mining Company Canadabull IAMGOLD Corporation Canada
bull MMG Limitedbull Minerals Research Institute of Western
Australia
12th International Conference on Mine Closure3ndash7 September 2018 | KUBUS Leipzig | Leipzig Germany
The Mine Closure 2018 Conference will be a multidisciplinary global forum for exchanging views and exploring ideas to aid new mines to operate with closure
in mind and support old sites to be closed economically whilst minimising environmental and social impacts
The conference host is Bergakademie Freiberg This prestigious university was founded in 1756 and is the oldest existing montane educational institution in
the worldLeipzig is located in the centre of one of Europes largest mine closure programmes with many examples of mine rehabilitation that offer new
opportunities for regional development
wwwmineclosure2018com
Conference Themesbull Legal financial socio-economical and
organisational aspectsbull Planning modelling and monitoringbull Mine closure case studiesbull Mine closure and mining
infrastructurebull Mine flooding balancing of
groundwater deficits and pit lakesbull Hydrogeochemistry acid mine
drainage and treatmentsbull Geotechnical aspectsbull Biodiversity and ecological aspectsbull Handling of contamination and soil
formationbull Aftercare marketing reorganisation
of land geotourism
Host Organisation
M I N E C L O S U R E 2 0 1 8
PASTE amp THICKENED TAILINGS
Australian Centre for Geomechanics | December 2017 Newsletter 23
IntroductionAttempts to improve the dewatering
behaviour of tailings through the addition of polymers at the point of discharge appear to have been first attempted in the early 1980s on coal tailings (Backer amp Busch 1981 Stewart et al 1986) Significant interest has developed more recently with a variety of applications on a number of tailings types over the past 15 years (Jeeravipoolvarn et al 2009 Riley et al 2015 Cooling amp Beveridge 2015) Terminology for this technology varies with it having been referred to as inline flocculation secondary flocculation and polymer treatment Herein it is referred to as polymer treatment (PT)
While initial impetus for polymer application is generally focused on rapid initial water release reduction in particle segregation and near-surface strength gain (ie for equipment access) implementation of PT can have ongoing effects on the geotechnical behaviour of tailings This is of importance with respect to the stability of the tailings storage facility (TSF) should the strength of PT tailings be relied upon when utilised in upstream raising or should they form part of a steepened beach without containment Further PT effects on ongoing consolidation behaviour will impact how a TSF consolidates over time
In terms of assessing the geotechnical effects of PT mature fine tailings (MFT) deposits are likely those that have received the greatest attention (Jeeravipoolvarn et al 2009 Beier et al 2013 Gholami amp Simms 2015) The oil sand MFT deposits are of significant area and extent exhibit low dewatering rates and without some form of treatment are very soft thus making covering difficult As such the potential for PT to accelerate and increase water release and thus surficial tailings strength gain has been studied extensively While the MFT research has led to major contributions to our understanding of the effects of PT MFT tailings are a unique material type and hence the applicability of this experience to other materials is unknown Further a number of key areas such as effects of PT on critical state rate effects of shear and behaviour of penetrometers in PT materials have received limited attention to date
To investigate some of the issues outlined between 2011 and 2014 a series of laboratory and centrifuge tests were carried out on a low plasticity slurry in an untreated (UT) and PT state at The University of Western Australia (UWA)
with financial support from the Australian Centre for Geomechanics (ACG) This work was summarised in three journal papers (Reid amp Fourie 2016 2017a 2017b) and two conference papers (Reid amp Fourie 2015 Reid et al 2015) This article provides a summary of the major outcomes of this research project
Material developmentFor the purposes of this research
project a synthetic slurry was developed comprising laboratory standard sand silt and kaolin clays mixed such that the resulting composite had similar gradation and plasticity to many tailings considered for PT A synthetic material was developed for this study rather than an actual tailings as it was important that essentially unlimited quantities of identical material could be produced (particularly for beam centrifuge tests) and to prevent any potential difficulties in obtaining permissions for publication that can occasionally occur when using an actual tailings
After development of the composite slurry BASF Australia Ltd provided assistance in selecting a polymer and dosage that significantly increased dewatering rates with high molecular weight polyacrylamide polymer Rheomax ETD DPW 1687 selected on this basis at an application rate of 500 g of polymer per tonne of dry solids
In addition to the UT and PT samples a sheared PT material (PT-S) was created
by preparing a batch of PT sample which was then sheared for 5 min using a plaster mixer This batch was created to enable some limited assessment of the effects of shearing during deposition andor flow on a beach on resulting geotechnical behaviour as shearing has been shown to reduce the effects of PT on MFT (Jeeravipoolvarn et al 2014)
Study methodsLaboratory
A series of laboratory element tests were carried out on both UT and PT specimens using slurry consolidometer triaxial (K0 and isotropic) and monotonic and cyclic direct simple shear (DSS) tests These tests were used to estimate consolidation behaviour shear strength critical state line (CSL) location and cyclic behaviour
To prepare samples for testing material was either poured directly into the testing device (slurry consolidometer) or firstly one-dimensionally consolidated in a cylinder then extruded and trimmed for subsequent testing (triaxial and DSS)
CentrifugeWhile laboratory element testing
enables direct comparison of material behaviour under known stress conditions in actual tailings practice it is more typical to initially characterise a deposit by means of penetrometer testing The cone penetration test with piezometer included (CPTu) is by far the most common
Effects of polymer treatment on geotechnical properties of a low-plasticity slurryby Dr David Reid and Professor Andy Fourie The University of Western Australia Australia
Figure 1 Miniature T-bar just prior to commencing penetration in PT material
PASTE amp THICKENED TAILINGS
Australian Centre for Geomechanics | December 2017 Newsletter24
penetrometer test used in tailings while full-flow penetrometers such as the ball penetrometer are increasingly finding application in soft tailings deposits (Wells amp Kaminsky 2015 Reid 2016) To enable penetrometer testing of two deposits with and without PT beam centrifuge testing was conducted The beam centrifuge is a
device within which a vessel containing soil is spun at significantly higher acceleration than normal gravity This enables a soil depth of ~200 mm within the centrifuge to exhibit the same stress field as a 20 m deep deposit Various tests and observations can then be made
While field-scale comparisons of UT
and PT would be preferable to centrifuge testing a true comparison of field-scale deposits would require a significant quantity of tailings to be deposited with identical index properties into two discrete areas This is likely to be impractical to achieve in any full scale scenario
The University of Western Australiarsquos 36 m diameter beam centrifuge was used in this study to enable miniature penetrometer (CPTu and T-Bar) testing on UT and PT samples The material was prepared in a similar way to the laboratory samples except on much larger scale Once spinning within the centrifuge a series of miniature CPTu and T-bar penetrometer tests were carried out Different penetration rates were used to enable assessment of the effects of drainage and shear rate on the results Dissipation tests were carried out as part of CPTu probing Figure 1 shows model preparation of the PT material with a T-bar positioned for a sounding
ResultsConsolidation behaviour
The results of consolidation testing are summarised in Figures 2 and 3 The testing indicated that the PT and PT-S materials exhibited a looser final dry density across the range of stresses tested than the UT material Alternatively permeability values for PT material were as much as an order of magnitude higher than UT while PT-S exhibited a permeability between that of UT and PT
The results from laboratory consolidation testing dissipation tests carried out during miniature CPTu probing and the rate of self-weight consolidation during centrifuge ramp-up are synthesised in Figure 4 The results are generally consistent with PT showing much higher rates of consolidation (consistent with higher permeability) The materials are only slightly anisotropic with respect to rate of consolidation with chcv ratios of approximately 14
That application of PT could significantly affect fabric and consolidation behaviour of a slurry with clay mineralogy should not be surprising eg changes to consolidation behaviour as significant as those shown here have previously been indicated merely from changing the pore fluid chemistry of a clay slurry (Wang amp Siu 2006 Sachan amp Penumadu 2007) While the lower final density resulting from PT is not a positive outcome in itself the effect of changes to consolidation behaviour on the densities achieved in a tailings deposit is more complicated as discussed subsequently in this article
Shear behaviourThe end points of each triaxial test on
PT and UT samples and the CSLs inferred are summarised as a state diagram in
Figure 2 Dry density versus vertical effective stress comparison slurry consolidometer results
Figure 3 Permeability versus vertical effective stress comparison slurry consolidometer results
Figure 4 Coefficient of consolidation estimates from laboratory and centrifuge
PASTE amp THICKENED TAILINGS
Australian Centre for Geomechanics | December 2017 Newsletter 25
Figure 5 The triaxial testing indicated a consistent difference between the UT and PT CSLs across a wide range of effective stresses For each material different triaxial test types all tended towards the same CSL The clear difference of the CSL between PT and UT is of significant importance when considering the application of critical state-based methods to assess the stability of thickened tailings stacks (Li et al 2009) should such stacks employ PT
Figure 6 presents the undrained strength ratio results for DSS tests carried out at a range of strain rates Despite the varying strain rates each test was carried out under constant volume ie approximately undrained conditions PT samples are seen to exhibit slightly greater strain rate sensitivity It is interesting to consider this result in the context of hand shear vane testing of PT trial deposits which would typically be sheared at high strain rate Although higher PT strengths have been seen in such testing (Beier et al 2013 Cooling amp Beveridge 2015) part of the observed difference may be a function of strain rate dependency This is an important consideration as the hand shear vane is often the most common tool used to characterise thin depths of PT material in trial deposits
The post-cyclic strength for a series of UT and PT tests are summarised in Figure 7 suggesting a very similar decay in undrained strength ratio for the two materials under a given amount of cyclic straining This suggests that the PT material at least in a post-cyclic loading scenario does not appear to be more brittle than UT material
Centrifuge penetrometer testingFigure 8 presents normalised
penetration resistance (Q) measured from CPT and T-bar tests at a range of dimensionless penetration velocities (V) (Finnie amp Randolph 1994) The UT material shows behaviour typical of a contractive clayndashsand mixture with low penetration resistances during high rates of penetration when excess pore pressures are generated during probing (Jaeger et al 2010) At lower velocities Q is seen to increase as the penetration process approaches drained conditions Alternatively PT material gives a relatively consistent penetration resistance across the range of V values applied This may be a result of the higher permeability of the PT material resulting in less excess pore pressure generation However at high rates of penetration PT material was seen to exhibit dilative behaviour under probing contrary to the expected behaviour of the material from laboratory element tests
Figure 9 summarises the results of CPT probes in a QndashFr soil type plot (Robertson 1990) This enables comparison of the inferred dilativecontractive state
of the material and the general soil type suggested from the CPT data channels The CPT results give drastically different results for the UT and PT samples when viewed in this context For example PT plots as having lower compressibility to UT material ndash the opposite of the laboratory results
for the two materials Although extensive examination of the implications of the QndashFr results is beyond the scope of this article it is clear that care is required when using the CPT to classify a PT deposit for undrained strength or to determine in situ state
Figure 5 State diagram and inferred CSLs
Figure 6 Rate effects in DSS shearing
Figure 7 Post-cyclic strength behaviour
PASTE amp THICKENED TAILINGS
Australian Centre for Geomechanics | December 2017 Newsletter26
The general results seen in centrifuge testing may be similar to those seen in one field-scale comparison of CPT probing through PT and UT material (da Silva 2011) In that example CPT probes through PT material showed much higher tip resistances which may have been a result primarily of increased drainage around the cone rather than an actual increase in strength or a denser state This confirms that great care is required in the use of penetration tests to obtain undrained shear strengths or state estimates in PT material
Consolidation modelling The realised average density within
a tailings deposit which is often the parameter of greatest relevance to an operator is a function of more than simply the final dry density under a given vertical effective stress Rather it is also affected by hydraulic conductivity ie rate of consolidation of the deposited material and the rate at which tailings are deposited into a given area
To enable comparison of the behaviour of idealised PT and UT tailings deposition the finite strain consolidation code CONDES0 (Yao amp Znidarcic 1997) was used Model parameters were based on test data previously presented (Figures 2 and 3) The CONDES0 code enables finite strain consolidation modelling of one-dimensional columns under different material placement rates Therefore models can be run with different rates of new material being added to the model per unit time ie different rates of rise (RoR) An important consideration regarding RoR should be noted in this context ndash specifically that there are different forms of RoR which require careful consideration when making comparisons in finite strain codes Three forms of RoR are considered herein as follows
bull Slurry RoR This represents the rate at which the deposited slurry would increase in height were no water release to occur (ie the material remained in a slurry state indefinitely) While a generally unrealistic scenario the slurry RoR is the required starting point for developing comparison models as it is only a function of cell area deposition rate and slurry density
bull Settled RoR The rate at which the tailings level would increase were the material to undergo hindered settling but no further consolidation As typical finite strain models including CONDES0 operate in an effective stress framework they are incapable of modelling the behaviour of slurries prior to the development of effective stress Therefore settled RoR forms the input to a finite difference code
bull Realised RoR This is the RoR value
observed on an actual tailings deposit and is also the value typically being discussed when referring to RoR in tailings practice Factors that affect realised RoR include the rate of deposition cell area consolidation characteristics of the tailings and drainage conditionsThe results of average dry density in
an idealised tailings deposit are presented in Figure 10 for a model assuming no
bottom drainage The data is presented as the average dry density in the model after a period of five years where the slurry RoR is varied from 5ndash40 myear At low slurry RoR the UT material achieves higher dry densities as consolidation keeps up with the deposition rate and therefore the higher final dry density of UT material governs what is achieved However as RoR increases the higher hydraulic conductivity of PT material increases in
Figure 9 Results summarised in a CPT classification chart
Figure 8 Dimensionless penetration resistance versus dimensionless penetration velocity
Drained penetration
Partially drained penetration
Undrained penetration
PASTE amp THICKENED TAILINGS
Australian Centre for Geomechanics | December 2017 Newsletter 27
importance eventually leading to higher average densities This difference becomes significant at high RoR Similar results were indicated by Znidarcic et al (2015) for MFT
Primary outcomes and future areas
The primary outcomes of the study discussed in this article are outlined as follows
bull Polymer treatment affected consolidation behaviour in two distinct ways (a) resulting in lower final densities at a given vertical effective stress while (b) resulting in higher permeability at a given density Numerical modelling of the effect of these changes on achievable dry density in an idealised storage area indicated that the potential benefits of PT with respect to average density and water release were manifested at high slurry RoR values
bull The study provided clear evidence that PT changed the location of the materialrsquos CSL This is an important consideration given potential application of PT in achieving steepened tailings beaches Application of critical state methods to assess the liquefaction susceptibility
of such beaches should include checks on the effect of PT on the CSL Publication of additional data for other materials of such observations would be of benefit
bull Significant shearing of the material after treatment resulted in a substantial reduction in some of the geotechnical effects of PT It is noted that the only sheared samples tested in this study were heavily sheared in order to represent a fully sheared case Further testing of PT tailings under different magnitudes of shear to link to behaviour down the beach would be beneficial
bull PT material exhibited slightly higher sensitivity to increased strain rates in terms of undrained shear strength This suggests caution must be applied when interpreting the results of hand shear vane tests which are often used to compare the behaviour of UT to PT material in trial-scale deposits
bull PT material exhibited higher penetration resistances in centrifuge testing This is despite the PT material having similar shear strengths when measured in laboratory element tests The increased drainage rates of PT material appear to be a
major contributor to the different penetrometer responses This is important to consider when comparing the results of the penetration tests of UT and PT deposits or when using the CPTu to determine in situ strengths and state of PT deposits
bull Consolidation modelling indicates that the rate of deposition ie slurry RoR has a major effect on whether PT will result in higher dry densities in a full-scale deposit At high deposition rates the higher permeability values of the PT material outweigh its lower final densities such that the average dry density achieved during deposition is higher than UT material
AcknowledgementsThe authors acknowledge the financial
assistance of the ACG the assistance of UWA laboratory centrifuge personnel and polymer treatment advice provided by BASF Australia Ltd
Article references are available at acguwaeduaunewsletters-annual-reports
Figure 10 Consolidation modelling summary
Dr David Reid
The University of Western Australia Australia
Professor Andy Fourie
The University of Western Australia Australia
21ST INTERNATIONAL SEMINAR ON
PASTE AND THICKENED TAILINGS11ndash13 APRIL 2018 | RENDEZVOUS HOTEL PERTH SCARBOROUGH | WESTERN AUSTRALIA
Principal SponsorWWWPASTE2018COM
EARLYBIRD REGISTRATION ENDS
26 FEBRUARY 2018
ACG event schedule
The
ACG
even
t sch
edule
is su
bject
to ch
ange
A u s t r a l i a n C e n t r e f o r G e o m e c h a n i c s | V o l u m e N o 4 6 | D e c e m b e r 2 0 1 7
wwwacguwaeduauevents
2018Static Liquefaction Workshop 6ndash7 March 2018 | Melbourne Australia
Rheology Fundamentals for Slurries and Pastes Workshop 9 April 2018 | Perth Australia
Is the Future Filtered Paste and Thickened Tailings Short Course 10 April 2018 | Perth Australia
21st International Seminar on Paste and Thickened Tailings wwwpaste2018com 11ndash13 April 2018 | Perth Australia
Instrumentation and Slope Monitoring Workshop 9 April 2018 | Seville Spain
InSAR Radar and Emerging Technologies Workshop 10 April 2018 | Seville Spain
Practical Rock Mechanics in Mining Short Course 14ndash16 May 2018 | Perth Australia
Introduction to Mine Seismicity Short Course 17ndash18 May 2018 | Perth Australia
Fourth International Symposium on Block and Sublevel Caving wwwcaving2018com 15ndash17 October 2018 | Vancouver Canada
Ground Support in Cave Mining Workshop 18 October 2018 | Vancouver Canada
Geotechnical Engineering for Open Pit Mines Short Course 23ndash25 October 2018 | Perth Australia
Instrumentation and Slope Monitoring Workshop 26 October 2018 | Perth Australia
Management Operation and Relinquishment of Tailings Storage Facilities 5ndash6 December 2018 | Perth Australia
Australian Centre for Geomechanics | 35 Stirling Hwy (M600) | Crawley Western Australia | Australia 6009Ph +61 8 6488 3300 | info-acguwaeduau | wwwacguwaeduau
FOURTH INTERNATIONAL SYMPOSIUM ON
BLOCK AND SUBLEVEL CAVING 15ndash17 OCTOBER 2018 | VANCOUVER CANADA
wwwcaving2018comABSTRACTS DUE 19 FEBRUARY 2018
SUNDAY | 14 OCTOBER
MONDAY | 15 OCTOBER
TUESDAY | 16 OCTOBER
WEDNESDAY | 17 OCTOBER
THURSDAY | 18 OCTOBER
FRIDAY | 19 OCTOBER
SRK Cave Mining Forum
Fourth International Symposium on Block and Sublevel Caving
ACG Ground Support in Cave
Mining Workshop
Site Visit to New Afton Mine
Symposium Dinner
Australian Centre for Geomechanics 2014 mXrap Australian Centre for Geomechanics Perth httpwwwmxrapcomBeck D Levkovitch V amp Simser B 2012 lsquoExplicit dynamic simulation for probabilistic forecasting of fault slip and rock mass seismic
potentialrsquo in Y Potvon (ed) Proceedings of the Sixth International Seminar on Deep and High Stress Mining Australian Centre for Geomechanics Perth pp 373ndash388
Hudyma M 2005 An introduction to mine seismicity seminar notes Australian Centre for Geomechanics PerthMcGaughey J 2014 lsquoA framework for 4D quantitative back-analysis and estimation of geotechnical hazard potential in minesrsquo Proceedings
of Geohazards 6 Canadian Geotechnical Society RichmondMendecki A 1993 lsquoReal time quantitative seismology in minesrsquo in RP Young (ed) Proceedings of the 3rd International Symposium on
Rockbursts and Seismicity in Mines AA Balkema Rotterdam pp 287ndash295Simser B amp Pritchard C 2010 lsquoObservational ground control at Xstratarsquos Nickel Rim South Mine Sudbury Ontariorsquo Proceedings of the
Canadian Institute of Mining Operatorrsquos Conference Canadian Institute of Mining Metallurgy and Petroleum Westmount Simser B Jalbout A amp Pakalnis R 2014 lsquoStability graph method for open stope design ndash case histories from two Sudbury Basin minesrsquo
Proceedings of the 1st International Conference on Applied Empirical Design Methods in Mining International Society for Rock Mechanics Lisbon
Simser B 2013 lsquoSeismic monitoring at Nickel Rim South Minersquo Proceedings of the 6th Microseismic Symposium and Workshop Engineering Seismology Group Kingston
van Aswegen G amp Butler AG 1993 lsquoApplications of quantitative seismology in South African gold minesrsquo in RP Young (ed) Proceedings of the 3rd International Symposium on Rockbursts and Seismicity in Mines AA Balkema Rotterdam pp 261ndash266
Rock mechanics tools for mining in high stress ground conditions at Nickel Rim South Mineby Ali Jalbout Goldcorp Inc Canada and Brad Simser Sudbury Integrated Nickel Operations A Glencore Company Canada
References from page 1ndash8 click here to return to article
References
Continued overleaf
Andrews SJ 1998 lsquoStratigraphy and depositional setting of the upper McNamara Group Lawn Hills region Northwest Queenslandrsquo Economic Geology vol 93 pp 1132ndash1152
Broadbent GC Andrews SJ amp Kelso IJ 2002 lsquoA decade of new ideas geology and exploration history of the Century Zn-Pb-Ag deposit northwestern Queensland Australiarsquo Society of Economic Geologists Special Publication 9 pp 119ndash140
Cawood F amp Stacey T 2006 lsquoSurvey and geotechnical slope monitoring considerationsrsquo The Journal of the South African Institute of Mining and Metallurgy vol 106 pp 495ndash502
Goodman RE Taylor RL amp Brekke TL 1968 lsquoA model for the mechanics of jointed rocksrsquo Journal of Soil Mechanics and Foundations Division vol 94 no 3 pp 634ndash659
Hammah R Yacoub T Corkum B amp Curran J 2008 lsquoThe practical modelling of discontinuous rock masses with finite element analysisrsquo Proceedings of the 42nd US Rock Mechanics Symposium American Rock Mechanics Association Alexandria
Harries N Noon D amp Rowley K 2006 lsquoCase studies of slope stability radar used in open cut minesrsquo Stability of Rock Slopes in Open Pit Mining and Civil Engineering Situations pp 335ndash342
Hutchison BJ Naude S amp Howarth J 2015 lsquoManagement of a toppling failiure wall collapse at the Kanmantoo Copper Mine in South Australiarsquo Proceedings of the 2015 International Symposium on Rock Slope Stability in Open Pit Mining and Civil Engineering The Southern African Institue of Mining and Metallurgy Johannesburg pp 81ndash98
Kurukuk N amp Sweeney E 2012 lsquoSlope stability assessment centuryrsquo Proceedings of the 9th AustraliandashNew Zealand Young Geotechnical Professionals Conference The New Zealand Geotechnical Society Wellington
Little MJ 2006 lsquoSlope monitoring strategy at PPRust open pit operationrsquo Proceedings of the 2016 International Symposium on Stability of Rock Slopes in Open Pit Mining and Civil Engineering The Southern African Institute of Mining and Metallurgy Johannesburg pp 211ndash230
Lynch RA amp Malovichko DA 2006 lsquoSeismology and slope stability in open pit minesrsquo Proceedings of the 2006 International Symposium on Stability of Rock Slopes in Open Pit Mining and Civil Engineering The Southern Africa Institute of Mining and Metallurgy Johannesburg pp 375ndash390
The geotechnical conundrum are surface observations reflecting rock mass behaviour at depthby Dr Michele Salvoni Australia and Professor Phil Dight Australian Centre for Geomechanics Australia
References from page 16ndash19 click here to return to article
References
Continued overleaf
Backer RR amp Busch RA 1981 Fine coal refuse slurry dewatering United States Department of the Interior Bureau of Mines Washington DCBeier N Wilson W Dunmola A amp Sego D 2013 lsquoImpact of flocculation-based dewatering on the shear strength of oil sands fine tailingsrsquo
Canadian Geotechnical Journal vol 50 no 9 pp 1001ndash1007Cooling D amp Beveridge A 2015 lsquoUse of Rheomaxreg ETD technology to thicken bauxite residual slurry during Super Thickener bypassrsquo
in AB Fourie amp RJ Jewell (eds) Paste and Thickened Tailings ndash A Guide 3rd edn Australian Centre for Geomechanics Perth pp 311ndash313Da Silva F 2011 lsquoReducing risks to tailings storage facilities through in-line flocculationrsquo in J Han amp DE Alzamora (eds) Proceedings of
GeoFrontiers 2011 Advances in Geotechnical Engineering American Society of Civil Engineers Reston pp 2937ndash2946Finnie IMS amp Randolph MF 1994 lsquoPunch-through and liquefaction induced failure of shallow foundations on calcareous sedimentsrsquo
Proceedings of the Seventh International Conference on Behavior of Offshore Structures (BOSS 94) Massachusetts Institute of Technology Cambridge pp 217ndash230
Gholami R amp Simms P 2015 lsquoShear behaviour in element testing of polymer amended mature fine tailingsrsquo Proceedings of the 68th Canadian Geotechnical Conference Canadian Geotechnical Society Richmond
Jaeger RA Dejong JT Boulanger RW Low HE amp Randolph MF 2010 lsquoVariable penetration rate CPT in an intermediate soilrsquo in PK Robertson amp PW Maybe (eds) Proceedings of the 2nd International Symposium on Cone Penetration Testing (CPT10)
Jeeravipoolvarn S Scott D Chalaturnyk R amp Shaw B 2014 lsquoEffect of pipeline shear on consolidation properties of oil sands fine tailingsrsquo Proceedings of Tailings and Mine Waste 2014 Information Technology Creative Media Vancouver pp 495ndash506
Jeeravipoolvarn S Scott J amp Chalaturnyk R 2009 lsquoGeotechnical characteristics of laboratory in-line thickened oil sands tailingsrsquo Proceedings of Tailings and Mine Waste 2009 Information Technology Creative Media Vancouver pp 813ndash828
Li AL Been K Ritchie D amp Welch D 2009 lsquoStability of large thickened non-segregated tailings slopesrsquo in RJ Jewell AB Fourie S Barrera and J Wiertz (eds) Proceedings of the 12th International Seminar on Paste and Thickened Australian Centre for Geomechanics Perth pp 301ndash312
Reid D 2016 lsquoEffect of rotation rate on shear vane results in a silty tailingsrsquo in BM Lehane HE Acosta-Martinez and R Kelly (eds) Proceedings of the 5th International Conference on Geotechnical and Geophysical Site Characterisation vol 1 Australian Geomechanics Society St Ives pp 369ndash374
Reid D amp Fourie AB 2015 lsquoEffects of shear on the behaviour of polymer-treated slurriesrsquo in FR Nejad (ed) Proceedings of Tailings and Mine Waste Management for the 21st Century The Australian Institute of Mining and Metallurgy Melbourne pp 215ndash224
Reid D amp Fourie AB 2016 lsquoLaboratory assessment of the effects of polymer treatment on geotechnical properties of low plasticity soil slurryrsquo Canadian Geotechnical Journal vol 53 no 10 pp 1718ndash1730
Effects of polymer treatment on geotechnical properties of a low-plasticity slurryby Dr David Reid and Professor Andy Fourie The University of Western Australia AustraliaReferences from page 23ndash27 click here to return to article
Marques EAG Vargas Jr EDA amp Antunes FS 2005 lsquoA study of the durability of some shales mudrocks and siltstones from Brazilrsquo Geotechnical amp Geological Engineering vol 23 pp 321ndash348
Read J 2007 lsquoPredicting the behaviour and failure of large rock slopesrsquo Proceedings of the 1st Canada-US Rock Mechanics Symposium American Rock Mechanics Association Alexandria
Sainsbury B Sainsbury D amp Hebert Y 2013 lsquoAssessment of the long-term stability of the Stage 8 West Wall Cutback at MMG Centuryrsquo unpublished Itasca internal report Itasca Australia Pty Ltd
Salvoni M 2015 lsquoRock mechanical characterization of the carbonate breccia and black carbonaceous shalesrsquo unpublished Australian Centre for Geomechanics report Australian Centre for Geomechanics Perth
Salvoni M amp Dight PM 2016 lsquoRock damage assessment in a large unstable slope from microseismic monitoring-MMG Century mine (Queensland Australia) case studyrsquo Engineering Geology vol 210 pp 45ndash56
Stacey P 2009 lsquoFundamentals of slope designrsquo in J Read and P Stacey (eds) Guidelines for Open Pit Slope Designrsquo AA Balkema Rotterdam pp 1ndash14
Sweeney E amp Abbott K 2016 lsquoGeotechnical analyses for risk managment of a large scale failure at Century mine Northwest Queenslandrsquo in PM Dight (ed) Proceedings of the First Asia Pacific Slope Stability in Mining Conference Australian Centre for Geomechanics Perth pp 225ndash238
Taylor RK amp Smith TJ 1986 lsquoThe engineering geology of clay minerals swelling shrinking and mudrock breakdownrsquo Clay Minerals vol 21 pp 235ndash260
Walkinshaw J amp Santi P 1996 Chapter 21 Shales and other degradable materials Landslides Investigation and Mitigation TRB Special Report vol 247 pp 555ndash576
Wesseloo J amp Sweby GJ 2008 lsquoMicroseismic monitoring of hard rock mine slopesrsquo in Y Potvin J Carter A Dyskin and R Jeffrey (eds) Proceedings of the First Southern Hemisphere International Rock Mechanics Symposium Australian Centre for Geomechanics Perth pp 433ndash450
Xiao Y-X Feng X-T Hudson JA Chen B-R Feng G-L amp Liu J-P 2016 lsquoISRM suggested method for in situ microseismic monitoring of the fracturing process in rock massesrsquo Rock Mechanics and Rock Engineering vol 49 pp 343ndash369
ReferencesReid D amp Fourie AB 2017a lsquoCentrifuge assessment of the effects of polymer treatment on penetrometer responsersquo International Journal for
Numerical and Analytical Methods in Geomechanics in pressReid D amp Fourie AB 2017b lsquoEffects of polymer treatment on undrained strengths and cyclic behavior of a low-plasticity slurryrsquo Journal of
Geotechnical and Geoenvironmental Engineering vol 143 no 6Reid D Utting L amp Fourie AB 2015 lsquoAssessing the effects of polymer treatment segregation considerationsrsquo Proceedings of Tailings and
Mine Waste 2015 The University of British Columbia VancouverRiley T Reid D amp Utting L 2015 lsquoPolymer-modified tailings deposition ndash ongoing testing and potential storage efficiency opportunitiesrsquo
in RJ Jewell amp AB Fourie (eds) Proceedings of the 18th International Seminar on Paste and Thickened Tailings Australian Centre for Geomechanics Perth pp 139ndash152
Robertson PK 1990 lsquoSoil classification using the cone penetration testrsquo Canadian Geotechnical Journal vol 27 no 1 pp 151ndash158Sachan A amp Penumadu D 2007 lsquoEffect of microfabric on shear behavior of kaolin clayrsquo Journal of Geotechnical and Geoenvironmental
Engineering vol 133 no 3 pp 306ndash318Stewart BM Backer RR amp Busch RA 1986 Thickening Fine Coal Refuse Slurry for Rapid Dewatering and Enhanced Safety report of
investigations United States Department of the Interior Bureau of Mines Washington DCWang YH amp Siu WK 2006 lsquoStructure characteristics and mechanical properties of kaolinite soils II Effects of structure on mechanical
propertiesrsquo Canadian Geotechnical Journal vol 43 no 6 pp 601ndash617Wells PS amp Kaminsky HAW 2015 lsquoSlurry to soil clay behaviour model - using methylene blue to cross the processgeotechnical engineering
dividersquo Proceedings of Tailings and Mine Waste 2015 The University of British Columbia VancouverYao D amp Znidarcic D 1997 Crust Formation and Desiccation Characteristics for Phosphatic Clays users manual for computer program
CONDES0 Florida Institute of Phosphate Research Polk CountyZnidarcic D Adkins S Utting L amp Catling M 2015 lsquoRheomax ETD technology a laboratory study of application performance and
associated geotechnical characteristics for polymer assisted tailings deposition of oil sands MFTrsquo Proceedings of Tailings and Mine Waste 2015 The University of British Columbia Vancouver pp 508ndash520

UNDERGROUND
Australian Centre for Geomechanics | December 2017 Newsletter 11
The energy and event-based methods both outperformed the blanket re-entry rule but the Vallejos and McKinnon method was less efficient The difference between the methods is best highlighted by the variation in captured events for constant re-entry time or vice versa Figure 3 shows the difference in average re-entry time compared with the blanket rule for the same case as Figure 2
The results from each mine are summarised in Table 1 for all four back-analysis magnitudes The average difference in re-entry times compared with the blanket rule are coloured from lsquocoldrsquo to lsquohotrsquo in order from shortest to longest exclusion time The energy-based method was the best method in the majority of cases outperforming the event-based method in all but one case Both of these consistently outperformed the blanket rule
The Vallejos and McKinnon method was regularly the worst performing and was less efficient than the blanket rule in the majority of cases
ConclusionThe results of this research indicate that
a real-time re-entry assessment method can offer improved outcomes compared to blanket re-entry rules by reducing the average exclusion time while still capturing the same number or a higher number of large events The incorporation of event size in the assessment can result in better results than the event count The Vallejos and McKinnon method is a probabilistic framework for re-entry assessment but this was found to be less efficient That is for the same re-entry time less events are captured than the blanket rule in the majority of cases in this study
Future researchAn engineering-based design process
for managing exposure to seismicity in underground mines is still incomplete There are still very few documented methods that help mines determine when to evacuate where to exclude and when to re-enter A lot of analysis is kept onsite and there is little collaboration within industry on this subject It would be beneficial to draw out the analysis techniques that have been developed onsite If you would like to help inform the future research direction please complete the industry survey on exposure management procedures created by the ACG at mxrapcomlinks
This article is based on a paper presented at the ACG Eighth International Conference on Deep and High Stress Mining March 2017 View the full paper atpapersacguwaeduaup1704_11_Tierney
Average difference in re-entry time compared to blanket rule (hrs)
Mine Back-analysis Energy method
Event count method
Blanket rule Vallejos and McKinnon
A +10 ML +56 +35 00 -22
A +05 ML +50 +18 00 -45
A 00 ML +50 +18 00 -56
A -05 ML +48 +17 00 -53
B +10 ML +116 +102 00 +28
B +05 ML +66 +64 00 +41
B 00 ML +53 +52 00 -06
B -05 ML +46 +47 00 -12
C +10 ML +37 +33 00 -03
C +05 ML +58 +53 00 +37
C 00 ML +69 +66 00 +38
C -05 ML +39 +35 00 -21
Table 1 Summary of results from all three mines and various back-analysis magnitudes
Stuart Tierney
Australian Centre for Geomechanics Australia
mXrap is a geotechnical data analysis and monitoring platform within which data analysis tools have been developed The software is very versatile enabling a wide application across different areas of the geomechanics field As a result the software is being used as a technology transfer tool for several research projects with the Consortium members and research sponsors receiving software apps with which they can implement the research outcomes onsite This has contributed to several research organisations becoming members of the mXrap Consortium
mXrap (and its predecessor MS-RAP) was developed under the ACGrsquos Mine Seismicity and Rockburst Risk Management project that commenced in 2000 In 2015 the development of mXrap was separated from this ACG research project and its ongoing evolution is sponsored by the mXrap Consortium comprised of both sponsoring companies and research members that also contribute guidance and advice
The software mXrap provides the development environment (platform) within which apps dedicated to specific tasks are developed The ACG team has under the Mine Seismicity and Rockburst Risk Management project
developed several tools for the monitoring analysis and management of mining-induced seismicity Apps are now also developed for wider application and users may build and share their own apps
Software licences are only available to mXrap Consortium members Membership fees are directly related to the number of licences required by the Consortium member For more information please visit wwwmxrapcom or contact infomxrapcom
What is mXrap
Stuart completed a Masters of Engineering Science (mining geomechanics) at Curtin University in 2016 where his thesis in the final semester was assisted by the ACG In February 2017 he joined the ACG as a research assistant for our mXrap Consortium
OPEN PIT
Australian Centre for Geomechanics | December 2017 Newsletter12
The utilisation of photogrammetric software has been increasing considerably within the mining geotechnical field Its role in open pit mining for structural mapping is growing as access to highwalls becomes restricted for safety reasons Over the past five years the capability of ADAM Technologys 3DM Analyst Software Suite has improved to the point where it can now be used in conjunction with ARANZ Georsquos Leapfrog implicit modelling software to produce accurate structural models quickly and efficiently This method has successfully been utilised at Evolution Miningrsquos Cowal gold mine in Central West NSW
In the past photogrammetry models have been produced for individual benches for structural mapping in a window mapping format With the capability for modelling whole bench stacks structures can now be mapped across an entire pit wall which in the past has been difficult to accomplish with field mapping alone With improvements in computing capabilities and Adamtechrsquos software accurate digital terrain models overlain with photographs can be produced for large areas of open pit highwalls Figure 1 displays an example of a model spanning an area approximately 500 m across and 250 m high that was photographed and made ready to map in an hour and a half
Structures were mapped onto an Adamtech model as three-dimensional discs which are a visual representation of the orientation of the fault in three-dimensional space at the location of the modelled disc In the past structures that trend across multiple benches have been mapped as a single large disc which could end up being hundreds of metres in diameter At Cowal it was discovered that by mapping large scale structures with a series of smaller discs normally only a few metres in diameter the undulation of the structure can be reproduced as it trends across the pit wall An example of this process is displayed in Figure 2
The modelled structural discs which were mapped in a photogrammetric model in 3DM Analyst were exported in a format which can be imported into Leapfrog The structural discs were used to produce semi-planar fault meshes that used the orientation of the individual discs to guide the implicit modelling algorithms built into Leapfrog
Historically 3D modelling of significant fault and shear structures could only be completed using a combination of pit mapping and core logging data Two-dimensional sections were then used to connect these data points and produce
an overall 3D mesh of the structure The implicit modelling algorithms used in Leapfrog allow this process to be automated saving countless hours of manual modelling time This time can instead be utilised towards producing a more detailed structural model encompassing numerous structures which may not have been modelled in the past due to time constraints
Leapfrog allows for structural files to be appended with new data points as they
become available Field mapping and core logging data measurements in a dipdip direction format can be appended onto the existing structural files to allow data from previous cut-backs and logged drillholes to be included in the implicit modelling process As a result a much more accurate structure can be built that not only reflects what is happening in the current pit walls but also that of the rock behind these walls
Pit mapping information is useful for considering the interaction of the
Recent advances in structural modelling capabilitiesby Richard Battison Evolution Mining Australia
Figure 1 Photogrammetric model produced using ADAM Technologyrsquos 3DM Analyst Software Suite (approximately 500 m across and 250 m high)
Figure 2 Example of structural discs being used to outline the undulation of a structure as it trends up a pit wall
OPEN PIT
Australian Centre for Geomechanics | December 2017 Newsletter 13
different structures where they can be observed and accessed in the pit walls Any interaction observed between structures can be applied to the structural model in Leapfrog When applied the implicit modelling algorithm re-models the structures upon which the relations apply slicing or constraining the 3D mesh where it is intersected by crosscutting structures Figure 3 displays an example of before-and-after modelling relationships where they have been applied
A full list of crosscutting relationships is administered by the software Any conflicting cutting relationships in the chronological order of the structure are flagged so they can be rectified by the modeller This gives the user the luxury of not having to keep track of hundreds
of different structural intersection relationships that occur in a large structural model The user can observe the cutting relationships of structures in the field as well as in the photogrammetric model and apply these rules to the Leapfrog mesh without having to go through the other relationships to make sure there is not a conflict
The speed at which this modelling process can be completed means that geotechnical staff can update their structural model in Leapfrog after a new bench is mined out Previously mapped structural discs can be opened in the updated photogrammetric model after which the newly modelled discs can be added to account for the newly uncovered batter faces Updating the structural model
in this manner means that it can be kept up-to-date continuously rather than the current practice on most sites which is to update the model quarterly-to-half yearly By keeping the model up-to-date structural analyses can be updated against pit designs to foresee possible future instabilities and remediate them before they are actually mined
The newly updated structural meshes can be exported as a DTM file in a format which is compatible with most other modelling software packages This means that structural meshes can be shared with other stakeholders on a mine site who may not have access to Leapfrog For example drill and blast engineers can use the structural DTM files to adjust blast designs to protect batter faces from extensive blast damage along structural planes
The combination of ADAM Technologys 3DM Analyst Suite and ARANZ Georsquos Leapfrog software to produce structural models has provided the ability to increase the efficiency and accuracy of structural modelling at the Cowal gold operation The replacement of manual modelling with implicit modelling has removed a very time-consuming process This ability freed the geotechnical engineer to concentrate on the interpretation of the structural model as well as providing operational geotechnical staff with the ability to dynamically update the structural model as required
Richard Battison
Evolution Mining AustraliaFigure 3 A combination of photogrammetry and field mapping data being used to create a
structural mesh The fault has been assigned cross-cutting relationships to constrain its extents The original pre-constrained structure can be seen faded
S A V E T H E D A T E
ACG Geotechnical Engineering for Open Pit Mines23ndash25 October 2018 | Novotel Perth Langley Hotel | Perth Western Australia
ACG Instrumentation and Slope Monitoring Workshop26 October 2018 | Novotel Perth Langley Hotel | Perth Western Australia
Contact the ACG for sponsorship opportunities events-acguwaeduau
wwwacguwaeduauevents
Australian Centre for Geomechanics | December 2017 Newsletter14
ACG celebrates 25 years of mining geomechanics excellence
Established in June 1992 the Australian Centre for Geomechanics looks back in pride at the last 25 years and forward with enthusiasm and confidence to ACGrsquos future endeavours
The following profiles illustrate the range of research projects undertaken by our not-for-profit mining research centre and include some that are have been and will continue to be pivotal in the development and evolution of our team
bull Ground Support Systems Optimisation Research Project
bull Mine Seismicity and Rockburst Risk Management Research Project and mXrap Consortium
bull Strainburst Research Projectbull An Effective Stress Approach to Mine
BackfillIndustry has sought ACG advice and
assistance on projects from the backfill mines of China to the deep mines of Australia Canada and South Africa Projects range from mitigating the risks of seismic
hazards to the complexities of rock stress testing
Since 1992 the ACG has presented more than 300 industry courses seminars workshops conferences and symposia that have been attended by almost 14000 mining professionals and produced seven training videos in the areas of open pit underground and environmental mining geomechanics (Figure 1)
ACG Director Professor Yves Potvin concludes that ldquothe global mining industry has and continues to place its trust in the ACG to deliver the world-class research and training to advance mine safety and mitigate geotechnical risks We are grateful for industryrsquos ongoing support encouragement and counsel ndash it motivates and inspires our team to seek solutions and find technologies to address industryrsquos geotechnical challengesrdquo
In 2005 I was honoured to accept an invitation to join the board of the ACG as an industry representative Since then it has been very rewarding to witness the service that the ACG team has provided to the mining industry in Western Australia and to observe the high regard within the global mining community for the centrersquos staff and their work
Over the 25 years of the ACGrsquos existence the mining industry has continually strived for improvements in safety despite the enduring quest for greater productivity and efficiency including in deepening mines with more demanding geotechnical environments Safety and environmental standards imposed both internally and by regulation have continued to rise The ACGrsquos role in advancing geomechanics related research education and training has been closely attuned to these needs and has made important contributions to them
For this reason the industry is enormously grateful to the ACGrsquos founders for their far-sightedness Those founders have been able to see the centre flourish into the success it is today 25 years later led by its enterprising director Professor Yves Potvin I congratulate Yves and all who have contributed to that success
The ACG undertakes its activities with an admirable blend of energy rigour and pragmatism that will see the industry continue to both support and rely on the ACG for many years to come
Ian Suckling
Chairman of the Board Australian Centre for Geomechanics Australia
Figure 1 Number of attendees at ACG events by year since 1993
Total course numbers 2008 - 2017
0
200
400
600
800
1000
1200
Australian Centre for Geomechanics | December 2017 Newsletter 15
In 1991 a proposal for a Federal Government Cooperative Research Centre (CRC) was submitted from the Geomechanics Group at The University of Western Australia (UWA) in response to the call for the initial round of applications The parties to this cooperative application included UWA Curtin University (Western Australian School of Mines) CSIRO Department of Minerals and Energy (DME) and an industry partner
The application did not make the final cut for the 15 centres funded initially and the four research partners decided that what had been proposed was needed for the mining industry and each contributed to the formation of a self-funded research centre based at UWA The centre was conducted under the oversight of an industry chaired board of management and an advisory board comprising representatives from the mining industry and was formally launched in June 1992
The stated objective of the centre was to provide research and education services to the mining industry and from a very small base the centre remained viable in the early years by running courses for industry primarily on tailings management rock mechanics and mine geology The presenters for these courses were principally volunteers from the partners and interested mining companies At that stage the ACG staff consisted solely
of Christine Neskudla and I was essentially seconded from UWA on an almost full time basis Chris Swindells then with the DME was of considerable assistance to us in those early days
Some research grants were won in the early years from MERIWA and mining companies and some valuable research was conducted in the area of mine tailings However it was not until sufficient funds had been accumulated to enable the recruitment of Professor Yves Potvin in 1998 that the ACG had the wherewithal to expand both the scope and extent of research In 2000 I retired from UWA and the ACG and Yves was appointed director and since then the ACG has literally blossomed
In 2000 the concept of international seminars or conferences was initiated with the first of a series of annual seminars on Paste and Thickened Tailings which has become the preeminent gathering for this discipline in the world and has led to the publication of an advice and guidance manual ndash the third edition of which is currently being translated into Mandarin for the Chinese market at the request of the University of Science and Technology Beijing This concept has been expanded into other areas and the ACG now runs seminars worldwide and a number of technical publications have been produced
With the subsequent recruitment of other senior researchers such as Professor Phil Dight and Dr Johan Wesseloo the ACG has expanded to a professional and research staff in Perth currently totalling 14 to handle the workload associated with managing research in a number of fields as well as running courses seminars and various publications and through associations with other premium research organisations around the world has achieved an enviable international standing Quite frankly considering the humble start in 1992 it is amazing some 25 years later to see how successful the ACG has been and being totally self-funding (thanks to being rejected for first round CRC) it has been able to weather the financial ups and downs associated with the volatile mining industry
Achievements of the ACG ndash a retrospective reviewby Richard Jewell founding Australian Centre for Geomechanics director
Richard Jewell
Australian Centre for Geomechanics Australia
ACG Corporate Affiliate Memberships
2017 Corporate Affiliates
ACG Corporate Affiliate Memberships allow your company to gain exposure to industry leaders while also providing savings on our
well-known and respected further education and training platform Email josephineruddleuwaeduau for details
OPEN PIT
Australian Centre for Geomechanics | December 2017 Newsletter16
The geotechnical conundrum are surface observations reflecting rock mass behaviour at depthwrites Dr Michele Salvoni Australia and Professor Phil Dight Australian Centre for Geomechanics Australia
IntroductionMovements instability and failures
in open pit mines can pose important geotechnical problems that may lead to major impacts on the safety of personnel and productivity of the mining operations As geotechnical engineers we are responsible to collect analyse and regularly review a variety of information during the lifetime of the operation (eg geology structural geology material properties observations and monitoring data) and to recognise andor anticipate possible instabilityfailure mechanisms (Cawood amp Stacey 2006 Read 2007 Stacey 2009)
In modern mechanised open pit mining new tools such as ground-based radars and terrestrial laser scanners have started to support more traditional visual inspections and surveyed geodetic prisms to assess slope performance exposure (Little 2006 Harries et al 2006 Hutchison et al 2015) These latest technologies offer a wider coverage of the pit and almost real-time monitoring allowing rapid identification of unstable areas and managing safety and operational issues
Although these tools are extremely important on a daily basis for long-term operational management they can only provide information of near surface displacements and engineers often have to make assumptions on rock mass behaviour at depth (Salvoni et al 2016) In some cases traditional subsurface monitoring eg inclinometers piezometers time domain
reflectometry andor extensometers can provide valuable information However these instruments cannot cover the three-dimensional volume of the rock slope (Lynch amp Malovichko 2006) and require safe access for the drilling and installation of the system and also for data collection if the instruments cannot be read remotely
In this article experiences acquired during the last three years on a case study of a large scale unstable rock slope at MMG Century mine will be discussed The project has challenged one of the most common assumptions made when dealing with geotechnical problems and has examined the idea that near surface behaviour always reflects rock mass response at depth
Geologicalndashgeotechnical overview
Century mine was an open pit mine owned and operated by MMG Limited The mine is located near Lawn Hill in North Queensland approximately 250 km northwest of Mount Isa close to the Northern Territory border The Century deposit represents one of the major sediment-hosted zinc lead and silver deposits of the Mount Isa inlier and McArthur basin (Andrews 1998 Broadbent et al 2002) When mining operations ceased at the end of 2015 the pit was approximately 25 km long by 15 km wide at the surface with a final depth of 320 m
Since 2009 the South West Pit Wall has represented an ongoing challenge for site personnel with several multi-
batter failures associated with continuous bedding planes (Sweeney amp Abbott 2016) The pit wall is a 300 m high slope with an overall angle of 40deg developed within the footwall sequence (Figure 1) The units are characterised by the presence of thinly bedded shales exhibiting a highly anisotropic behaviour and affected by continuous fracturing and occasional bedding plane shears (Kurukuk amp Sweeney 2012) In addition to bedding there are three main geological structures named Pandorarsquos Page Creek and Creek Faults which bound the area and have contributed to the local rotation and folding of the bedding planes Particularly interesting is the presence of a massive block of CBX (carbonate breccia) which has been interpreted as a result of a large fault jog or dilation related to the Pandoras Fault (Salvoni et al 2016)
Generally the pit wall experienced periods of rapid acceleration (up to 10 mmday) during the wet season and steady trend movements (less than 1 mmday) during the dry season Major concerns at the mine started to rise during the 2012ndash13 wet season with an increase of acceleration and the development of tension cracks up to 30 m behind the pit crest Following numerical analysis (Sainsbury et al 2013) which indicated the likelihood of a deep-seated failure mechanism The mine operations decided to leave a buttress at the toe of the slope (~28deg) to manage the observed progressive movement in the slope above the CBX block Despite the change in the design the slope continued to move More information is provided by Salvoni et al (2016) and Sweeney and Abbott (2016)
Observations questions and hypothesis
There are a few observations and some key elements available to allow us to better understand the problem The first observation is that by looking at the historical deformation trend recorded by the prisms it appears that the rock mass near the surface was no longer moving in the elastic range In fact it shows a time-dependent behaviour (creeping) much more like a rock riverscree slope with rapid acceleration triggered by rainfall events (Figure 2) Also looking at the displacement vectors the CBX seems to have had a key role in the stability of the slope acting as a natural buttress being slowly pushed out in a toppling or Figure 1 Front view of the target site on the South West Pit Wall at November 2013 showing
the main geotechnical units and structural features
OPEN PIT
Australian Centre for Geomechanics | December 2017 Newsletter 17
rotation manner ie activepassive wedge Finally one important aspect has been overlooked the progressive weathering of shale near the surface As previously mentioned a common assumption in slope stability analysis is that an unstable rock mass is considered as a rigid block However at Century there are indications that soon after the shales were exposed they tended to rapidly break up and deteriorate due to their high clay mineral (montmorillonite) and sulphide mineral pyrite (FeS2) content Several authors highlighted how in low durability some materials like shales and their slaking erosion and surface creep mechanisms are dominant (Taylor amp Smith 1986 Walkinshaw amp Santi 1996 Marques et al 2005)
In this sense at the beginning of the project it was important to question if the large deformations observed near the surface truly reflected the proposed deep-seated mechanism behind the pit wall Given the fact that there was limited access to install traditional subsurface monitoring a microseismic system was proposed and subsequently implemented in November 2013 The aim of the project was to provide early warning of the development of the deep-seated failure and to understand how deep into the wall the rock mass was being damaged
Microseismic dataMicroseismic (MS) and acoustic
emission monitoring have found many uses over the years in the geotechnical field (Xiao et al 2016) Examples of applications are reported for mining rockburst risk assessment caving monitoring rock slope monitoring laboratory tests as well as for the oil and gas field These monitoring techniques are based on the recording of the radiated seismic energy generated by brittle fracturing of the rock to estimate a 3D location and parameters at the source The general idea is that as seismicity can be recorded at a lowinfinitesimal strain
strain near the onset of instability could be detected before surface deformation is eventually observed However in the open pit environment and in natural rock slopes the number of case studies remains limited and the technique has not reached the maturity to be used as a routine method requiring a great deal of interpretation (Wesseloo amp Sweby 2008)
The microseismic array deployed at Century comprised 16 sensors located in the volume of rock behind the South West Pit Wall As shown in Figure 3 the system tends to follow the slope curvature as pit geometry and accessibility represent major constraints for installing the sensors Navi-drilled boreholes behind the pit crest were the only option to enable the instruments to be sufficiently close to the
pit wall and the expected instability area The system was operative from November 2013 until February 2016 when it was decommissioned More details on the system are provided by Salvoni et al 2016
The majority of seismic data was recorded between February and April 2014 when a rapid acceleration of surface deformation was observed after a few days of heavy rainfall The slope experienced a total cumulative displacement of up to several metres with localised small instabilities and the partial detachment of the CBX block During this time the system recorded more than 2300 microseismic events ndash ranging from a moment magnitude of -2 to 02 From Figure 3 it can be observed how there is a good correspondence between the spatial and
Figure 2 (a) Ground displacements recorded by the prism monitoring and daily rainfall between October 2010 and January 2014 in different areas of the slope (b) 3D view showing the displacement vectors for the same time period and coloured by total cumulative displacement
Figure 3 (a b c d) Seismic events recorded from February to May 2014 behind the South West Pit Wall 3D view showing the seismic activation sequence for different time windows Seismic events are coloured and sized by moment magnitude
OPEN PIT
Australian Centre for Geomechanics | December 2017 Newsletter18
temporal distribution of microseismic and slope deformations activity The following points are made
1 From the 15th February 2014 seismic events started to be recorded behind the pit wall with a rate of approximately 11 events per day This activity was mainly concentrated in the lower section of Page Creek Fault in the wedge failure sector and behind the CBX block (Figure 3a)
2 During 23rd to 24th February two main event clusters were observed The first one corresponded to a localised planar failure in the lower section of Page Creek Fault while the second occurred in the buttress where the slip zone was observed A general increase in seismic activity was recorded (~20 events per day) with events also being detected in the upper section of the wall (Figure 3b)
3 From the middle of March to the middle of April 2014 the seismic activity rate reached its peak with more than 30 events per day Activity was mainly localised in the wedge failure sector behind the CBX block and in the upper section of the wall Events were also recorded in the right corner at the base of the CBX block and along the Pandoras Fault (Figure 3c)
4 Gradually from the middle of April 2014 events were mainly
concentrated in the wedge failure sector and behind the CBX block Activity progressively slowed down reaching only a few events per week by the end of May (Figure 3d)
Rock mass damage at depth and numerical analysis
Important information of the rock mass behaviour at depth can be extrapolated from the distribution of the microseismic activity Figure 4 shows a section through the pit wall representing the seismic events coloured by distance from the surface and sized by moment magnitude Seismicity tends to be concentrated within a narrow band between 20 and 40 m from the surface and behind the CBX block Particularly interesting is also the reduction of seismic activity in the lower section of the wall near surface A similar characteristic was also observed in another section view along the wedge failure sector
The data do not reveal any sign that a deep-seated instabilityfailure is developing as predicted by the numerical analysis More importantly the data confirm the hypothesis that different instability mechanisms are affecting slope behaviour The material close to the surface is characterised by intensely brokenweathered rock mass and is no longer able to produce and propagate much seismic energy (ie it is an aseismic zone) This area is subjected to creep driven movements that are always present even in dry conditions and are characterised by
an acceleration in movement related to seasonal rainfall As it is now much more broken up it is also much more permeable and with rainfall the influence of effective stress is leading to the unravelling Even though it is permeable it does not mean it dries out in the dry season This shallow instability has caused the rotation of the CBX block and triggered further deformation at depth where between 20 and 40 m of rock mass is progressively fracturing and may potentially develop into a multi-batter failure involving the upper section of the pit wall
To verify some of the concepts previously expressed and compare them with the available data and observations a series of simple 2D finite element numerical modelling was carried out The final model assumed a plastic layer of approximately 10 m of affected material characterised by the weathering An additional surface was also introduced to reproduce the effect of rainfall water during the raining season Derived MohrndashCoulomb failure criteria with no post-peak dilatancy and cohesion loss were then assigned to the constitutive model for the fresh shale and the CBX unit based on laboratory testing (Salvoni 2015) For the shales a joint model (Goodman et al 1968 Hammah et al 2008) was built in order to explicitly simulate the effect of the continuous bedding plane shears which most likely represents the major structural control of the slope
Final results are shown in Figure 5 This numerical analysis suggests that the assumed geometry and a 10 m thin layer
Figure 4 Section through the distribution of the distance of seismic events from the surface for the upper section of the pit wall (above) and for the wedge failure area (below)
OPEN PIT
Australian Centre for Geomechanics | December 2017 Newsletter 19
of weathered rock can create a toppling mechanism on the CBX with progressive shearing at the contact between the shale and breccia units and progressive damage at 30ndash40 m below the pit surface The weathered material has a time-dependent type of behaviour and is subjected to continuous unravelling associated with rapid acceleration triggered by the rainfall
ConclusionLarge unstable rock slopes can
pose significant hazards for personnel and operations in open pit minesroad cuttings A complete understanding of failure mechanisms and the state of the rock mass requires analysis of a comprehensive dataset However in
many cases information is limited to the surface displacement and engineers can only make assumptions about the rock mass behaviour at depth Although in many cases rigid block movement is a reasonable assumption in others it can lead to misleading interpretationnumerical analysis of the instability mechanisms
The MMG Century mine case study is an excellent example of how the combination of microseismic monitoring and critical thinking lead to a much better understanding as to how the slope was behaving The outcomes of the project not only provide an insight into the possible applications of microseismic data in open pits but also help reveal a complex
mechanism where slope deformations mask minimal damage at depth
Article references are available at acguwaeduaunewsletters-annual-reports
Dr Michele Salvoni
Australia
Figure 5 Final numerical analysis results with the slope affected by a 10 m weathered zone with a plastic behaviour and progressive shearing developing at depth where microseismic data were recorded
The ACG team congratulates Michele on
the successful submission of his PhD thesis Rock Damage
Assessment in a Large Unstable Slope from Microseismic
Monitoring ndash MMG Century Mine Case Study
We wish him all the best in his future endeavours
These ACG open pit mining workshops will accompany the 2018 International Symposium on Slope Stability in Open Pit Mining and Civil Engineering at the XIV International
Congress for Energy and Resource Mining in Seville Spain 11ndash13 April 2018
To register please visitwwwcongresomineriasevilla2018orginternacional-ingles
ACG-Workshophtml
ACG Instrumentation and Slope Monitoring Workshop amp InSAR Radar and Emerging
Technologies Workshop9 amp 10 April 2018 | Bespoke Workshop Halls Barceloacute
Conference Centre | Seville Spain
UNDERGROUND
Australian Centre for Geomechanics | December 2017 Newsletter20
Stope reconciliationby Dr Kyle Woodward Australian Centre for Geomechanics Australia
BackgroundMany underground mines around the
world use an open stope mining method The profitability of open stope mining depends on the accuracy of the stope design and the execution of the mining process The value of a stope is intrinsically linked to success of ore recovery but it is also related to the amount of unintentional dilution Stope performance is discussed in terms of underbreak (UB) ie ore not extracted and overbreak (OB) ie waste extracted The maximum value obtainable for a stope will be obtained from stopes with minimum overbreak and minimum underbreak
Open stope design approaches and tools have not evolved significantly since the 1980s and industry still extensively uses the stability graph method (Mathews et al 1980 Potvin 1988) An exception is the concept of Equivalent Linear Overbreak Sloughing (ELOS) which was developed by Clark and Pakalnis (1997) It was initially used to assess overbreak in narrow vein mining Capes (2009) extended the original Clarkrsquos database applied the methodology to open stope design and included some capability to forecast stope overbreak For most mine sites the robust statistical methods for forecasting overbreak are practically non-existent
Stopes with underbreak will leave behind unrecoverable ore and this can be as detrimental to stope value and mine economics as overbreak Existing assessments of open stope performance do not consider the evaluative estimation and forecasting of underbreak (Potvin et al 2015) Potvin et al (2016) highlight that the optimisation of overbreak and underbreak are generally conflicting and efforts that focus on reducing overbreak may increase the amount of underbreak This emphasises the importance of having good stope reconciliation tools and procedures that can translate into future stope performance optimisation
Techniques of underground surveying have made significant advancements when determining mined volumes most notably with the application of the cavity monitoring system (CMS) (Miller et al 1992) At most mines a wealth of data is created by accurate and routine stope surveying techniques The full potential of this data is far from being realised This data allows for the probabilistic forecasting and comprehensive assessment of stope performance and ultimately the optimisation of mining economics and the utilisation of a finite resource
A pilot case study - Olympic Dam (BHP)
Exploratory research at BHPrsquos Olympic Dam has shown that the concept of stope reconciliation can have a significant impact on the overbreak and underbreak outcomes at the mine (Potvin et al 2015 2016)
Figure 1 shows historical stope performance of Olympic Dam with respect to overbreak underbreak and a combined measure (Potvin et al 2016)
The previous work at Olympic Dam showed that the amount of overbreak was a function of traditional design parameters (hydraulic radius and the stability number) but also strongly correlated to the orientation of stope walls and the blasting pattern used The amount of underbreak was correlated to the drilling pattern and whether blasting was against a wall of cemented fill Other correlations were found between overbreak underbreak and the slot opening strategies
This research shows that in addition
to traditional measures operational and design factors can contribute to overbreak and underbreak outcomes This information can be used in the assessment of future stope performance and to forecast the potential for overbreak and underbreak
Stope reconciliation project Project overview
The current iteration of the stope reconciliation project has been supported by six sponsor sites along with the Minerals Research Institute of Western Australia (MRIWA) This project will build upon previous results at Olympic Dam to develop tools that enable a probabilistic approach to stope design This will involve the development of improved stope performance assessment and the investigation of factors that affect overbreak and underbreak
In practice possible influencing factors will be assessed from a range of data including stope design (eg stope
Figure 1 Historical underbreak and overbreak stope performance at Olympic Dam
Figure 2 An erroneously designed wireframe (left) and an automatically corrected wireframe (right)
UNDERGROUND
Australian Centre for Geomechanics | December 2017 Newsletter 21
dimensions stability number) operational information (eg drilling pattern slot opening adjacent stope fill walls) and geotechnical information The technology transfer to site will occur via mXrap software development and will aim to minimise manual data manipulation Conceptually given a stopersquos CMS and design the stope performance statistics will be automatically generated with a mXrap stope optimisation app Furthermore an additional mXrap app will provide a probabilistic forecast of overbreak and underbreak for a given stope design historical site-specific stope performance and factors that influence performance
Preliminary project progressThe assessment of stope performance
is underpinned by the quality of data Initial considerations of data quality focus on the quality of surveys specifically stope CMS and designs Surveys can be constructed with only visualisation in mind and may contain features that influence subsequent calculations An ideal CMS or design survey will be
bull a single surface representing an individual stope
bull consistent ie no sharp edges small ledges and other unrealistic features
bull a realistic and consistent resolutionbull free from self-intersectionsbull free from internal or external volumes
surfaces andbull a closed surface ie watertight
Survey quality is ideally considered during the CMS and design procedures to prevent automated approaches erroneously reinterpreting surveys without site-specific
information As part of preliminary work on survey quality a mXrap app was created to explore and address some of the more basic survey quality concerns Figure 2 gives an example of a common error (nodes not being lsquosnappedrsquo together) and shows the erronous design wireframe (left) and an automatically corrected wireframe (right)
The selection of a method to find the volumes associated with 3D surfaces also must consider how additional information might be integrated in a general assessment framework A familiar concept and format for geologicalgeotechnical information is a block model whereby rock properties are assigned to specific volumes An extension of this concept is not to use blocks of a uniform size but instead to use smaller blocks where more information is available and extra detail is warranted
A model of the volumes associated with stope CMS and designs can be achieved by the creation of an octree Essentially an octree is a tree data structure created from the partitioning of 3D space by recursively subdividing it into eight octants ie blocks are created by dividing volumes that are intersected by surfaces until an appropriate resolution is reached The implementation of an octree is an efficient and flexible framework for the assessment of stope performance which retains spatial information and is an essential feature to enable the assessment of factors that influence stope performance
An example of this type of stope performance assessment is shown in Figure 3 A stope CMS and design survey is used to create the subdivision of an octree
(left) These octree blocks are assessed with respect to design and CMS surfaces to determine if they are volumes of underbreak (centre) and overbreak (right)
The octree format lends itself to less conventional methods of assessing stope performance Figure 4 illustrates preliminary work that explores spatial characteristics of stope design and performance Shown in this figure (right) is the result of an algorithm which automatically detects the lsquouniquersquo straight angled and domed faces of a stope design Shown left is a projection map for a lsquouniquersquo face This plot shows the distance between CMS and design surfaces in a direction normal to the design survey This plot highlights the areas and severity of overbreak (positive distances) and underbreak (negative distances)
Areas plotted as blue are underbreak red are overbreak and green are mined to design
Concluding remarksStope design and performance
assessment has not significantly progressed despite the economics of mining being intrinsically linked to ore recovery and dilution Stope surveying data allows improvements to be made when assessing stope performance particularly when assessing the amount of underbreak and the development of probabilistic methods of stope design that optimise value
Previous research assessed stope performance at BHP Olympic Dam and showed that by considering operational and design factors in addition to
Figure 3 An octree sub-division of stope CMS and design surveys (left) and octree blocks which are volumes of underbreak (centre) and overbreak (right)
UNDERGROUND
Australian Centre for Geomechanics | December 2017 Newsletter22
traditional measures overbreak and underbreak outcomes can be improved The current stope reconciliation project will further develop tools to assess the influence of factors on stope performance and probabilistic stope design Initial work has focused on survey quality developing a general assessment framework and developing exploratory tools that characterise stope design and performance
Details about the ACG Stope Reconciliation and Optimisation Project are available at wwwacguwaeduauacg-research
Figure 4 Right ndash results of an algorithm which automatically detects the lsquouniquersquo straight angled and domed faces of a stope design Left ndash a projection plot shows the distance between CMS and design surfaces in a direction normal to the design survey
Dr Kyle Woodward
Australian Centre for Geomechanics Australia
The ACG acknowledges the following Stope Reconciliation and Optimisation Project sponsors
bull Agnico Eagle Mines Ltd Canadabull BHP Olympic Dambull Glencore Mount Isa Mines
bull Gold Fields Australia Pty Ltd Granny Smith
bull Hecla Mining Company Canadabull IAMGOLD Corporation Canada
bull MMG Limitedbull Minerals Research Institute of Western
Australia
12th International Conference on Mine Closure3ndash7 September 2018 | KUBUS Leipzig | Leipzig Germany
The Mine Closure 2018 Conference will be a multidisciplinary global forum for exchanging views and exploring ideas to aid new mines to operate with closure
in mind and support old sites to be closed economically whilst minimising environmental and social impacts
The conference host is Bergakademie Freiberg This prestigious university was founded in 1756 and is the oldest existing montane educational institution in
the worldLeipzig is located in the centre of one of Europes largest mine closure programmes with many examples of mine rehabilitation that offer new
opportunities for regional development
wwwmineclosure2018com
Conference Themesbull Legal financial socio-economical and
organisational aspectsbull Planning modelling and monitoringbull Mine closure case studiesbull Mine closure and mining
infrastructurebull Mine flooding balancing of
groundwater deficits and pit lakesbull Hydrogeochemistry acid mine
drainage and treatmentsbull Geotechnical aspectsbull Biodiversity and ecological aspectsbull Handling of contamination and soil
formationbull Aftercare marketing reorganisation
of land geotourism
Host Organisation
M I N E C L O S U R E 2 0 1 8
PASTE amp THICKENED TAILINGS
Australian Centre for Geomechanics | December 2017 Newsletter 23
IntroductionAttempts to improve the dewatering
behaviour of tailings through the addition of polymers at the point of discharge appear to have been first attempted in the early 1980s on coal tailings (Backer amp Busch 1981 Stewart et al 1986) Significant interest has developed more recently with a variety of applications on a number of tailings types over the past 15 years (Jeeravipoolvarn et al 2009 Riley et al 2015 Cooling amp Beveridge 2015) Terminology for this technology varies with it having been referred to as inline flocculation secondary flocculation and polymer treatment Herein it is referred to as polymer treatment (PT)
While initial impetus for polymer application is generally focused on rapid initial water release reduction in particle segregation and near-surface strength gain (ie for equipment access) implementation of PT can have ongoing effects on the geotechnical behaviour of tailings This is of importance with respect to the stability of the tailings storage facility (TSF) should the strength of PT tailings be relied upon when utilised in upstream raising or should they form part of a steepened beach without containment Further PT effects on ongoing consolidation behaviour will impact how a TSF consolidates over time
In terms of assessing the geotechnical effects of PT mature fine tailings (MFT) deposits are likely those that have received the greatest attention (Jeeravipoolvarn et al 2009 Beier et al 2013 Gholami amp Simms 2015) The oil sand MFT deposits are of significant area and extent exhibit low dewatering rates and without some form of treatment are very soft thus making covering difficult As such the potential for PT to accelerate and increase water release and thus surficial tailings strength gain has been studied extensively While the MFT research has led to major contributions to our understanding of the effects of PT MFT tailings are a unique material type and hence the applicability of this experience to other materials is unknown Further a number of key areas such as effects of PT on critical state rate effects of shear and behaviour of penetrometers in PT materials have received limited attention to date
To investigate some of the issues outlined between 2011 and 2014 a series of laboratory and centrifuge tests were carried out on a low plasticity slurry in an untreated (UT) and PT state at The University of Western Australia (UWA)
with financial support from the Australian Centre for Geomechanics (ACG) This work was summarised in three journal papers (Reid amp Fourie 2016 2017a 2017b) and two conference papers (Reid amp Fourie 2015 Reid et al 2015) This article provides a summary of the major outcomes of this research project
Material developmentFor the purposes of this research
project a synthetic slurry was developed comprising laboratory standard sand silt and kaolin clays mixed such that the resulting composite had similar gradation and plasticity to many tailings considered for PT A synthetic material was developed for this study rather than an actual tailings as it was important that essentially unlimited quantities of identical material could be produced (particularly for beam centrifuge tests) and to prevent any potential difficulties in obtaining permissions for publication that can occasionally occur when using an actual tailings
After development of the composite slurry BASF Australia Ltd provided assistance in selecting a polymer and dosage that significantly increased dewatering rates with high molecular weight polyacrylamide polymer Rheomax ETD DPW 1687 selected on this basis at an application rate of 500 g of polymer per tonne of dry solids
In addition to the UT and PT samples a sheared PT material (PT-S) was created
by preparing a batch of PT sample which was then sheared for 5 min using a plaster mixer This batch was created to enable some limited assessment of the effects of shearing during deposition andor flow on a beach on resulting geotechnical behaviour as shearing has been shown to reduce the effects of PT on MFT (Jeeravipoolvarn et al 2014)
Study methodsLaboratory
A series of laboratory element tests were carried out on both UT and PT specimens using slurry consolidometer triaxial (K0 and isotropic) and monotonic and cyclic direct simple shear (DSS) tests These tests were used to estimate consolidation behaviour shear strength critical state line (CSL) location and cyclic behaviour
To prepare samples for testing material was either poured directly into the testing device (slurry consolidometer) or firstly one-dimensionally consolidated in a cylinder then extruded and trimmed for subsequent testing (triaxial and DSS)
CentrifugeWhile laboratory element testing
enables direct comparison of material behaviour under known stress conditions in actual tailings practice it is more typical to initially characterise a deposit by means of penetrometer testing The cone penetration test with piezometer included (CPTu) is by far the most common
Effects of polymer treatment on geotechnical properties of a low-plasticity slurryby Dr David Reid and Professor Andy Fourie The University of Western Australia Australia
Figure 1 Miniature T-bar just prior to commencing penetration in PT material
PASTE amp THICKENED TAILINGS
Australian Centre for Geomechanics | December 2017 Newsletter24
penetrometer test used in tailings while full-flow penetrometers such as the ball penetrometer are increasingly finding application in soft tailings deposits (Wells amp Kaminsky 2015 Reid 2016) To enable penetrometer testing of two deposits with and without PT beam centrifuge testing was conducted The beam centrifuge is a
device within which a vessel containing soil is spun at significantly higher acceleration than normal gravity This enables a soil depth of ~200 mm within the centrifuge to exhibit the same stress field as a 20 m deep deposit Various tests and observations can then be made
While field-scale comparisons of UT
and PT would be preferable to centrifuge testing a true comparison of field-scale deposits would require a significant quantity of tailings to be deposited with identical index properties into two discrete areas This is likely to be impractical to achieve in any full scale scenario
The University of Western Australiarsquos 36 m diameter beam centrifuge was used in this study to enable miniature penetrometer (CPTu and T-Bar) testing on UT and PT samples The material was prepared in a similar way to the laboratory samples except on much larger scale Once spinning within the centrifuge a series of miniature CPTu and T-bar penetrometer tests were carried out Different penetration rates were used to enable assessment of the effects of drainage and shear rate on the results Dissipation tests were carried out as part of CPTu probing Figure 1 shows model preparation of the PT material with a T-bar positioned for a sounding
ResultsConsolidation behaviour
The results of consolidation testing are summarised in Figures 2 and 3 The testing indicated that the PT and PT-S materials exhibited a looser final dry density across the range of stresses tested than the UT material Alternatively permeability values for PT material were as much as an order of magnitude higher than UT while PT-S exhibited a permeability between that of UT and PT
The results from laboratory consolidation testing dissipation tests carried out during miniature CPTu probing and the rate of self-weight consolidation during centrifuge ramp-up are synthesised in Figure 4 The results are generally consistent with PT showing much higher rates of consolidation (consistent with higher permeability) The materials are only slightly anisotropic with respect to rate of consolidation with chcv ratios of approximately 14
That application of PT could significantly affect fabric and consolidation behaviour of a slurry with clay mineralogy should not be surprising eg changes to consolidation behaviour as significant as those shown here have previously been indicated merely from changing the pore fluid chemistry of a clay slurry (Wang amp Siu 2006 Sachan amp Penumadu 2007) While the lower final density resulting from PT is not a positive outcome in itself the effect of changes to consolidation behaviour on the densities achieved in a tailings deposit is more complicated as discussed subsequently in this article
Shear behaviourThe end points of each triaxial test on
PT and UT samples and the CSLs inferred are summarised as a state diagram in
Figure 2 Dry density versus vertical effective stress comparison slurry consolidometer results
Figure 3 Permeability versus vertical effective stress comparison slurry consolidometer results
Figure 4 Coefficient of consolidation estimates from laboratory and centrifuge
PASTE amp THICKENED TAILINGS
Australian Centre for Geomechanics | December 2017 Newsletter 25
Figure 5 The triaxial testing indicated a consistent difference between the UT and PT CSLs across a wide range of effective stresses For each material different triaxial test types all tended towards the same CSL The clear difference of the CSL between PT and UT is of significant importance when considering the application of critical state-based methods to assess the stability of thickened tailings stacks (Li et al 2009) should such stacks employ PT
Figure 6 presents the undrained strength ratio results for DSS tests carried out at a range of strain rates Despite the varying strain rates each test was carried out under constant volume ie approximately undrained conditions PT samples are seen to exhibit slightly greater strain rate sensitivity It is interesting to consider this result in the context of hand shear vane testing of PT trial deposits which would typically be sheared at high strain rate Although higher PT strengths have been seen in such testing (Beier et al 2013 Cooling amp Beveridge 2015) part of the observed difference may be a function of strain rate dependency This is an important consideration as the hand shear vane is often the most common tool used to characterise thin depths of PT material in trial deposits
The post-cyclic strength for a series of UT and PT tests are summarised in Figure 7 suggesting a very similar decay in undrained strength ratio for the two materials under a given amount of cyclic straining This suggests that the PT material at least in a post-cyclic loading scenario does not appear to be more brittle than UT material
Centrifuge penetrometer testingFigure 8 presents normalised
penetration resistance (Q) measured from CPT and T-bar tests at a range of dimensionless penetration velocities (V) (Finnie amp Randolph 1994) The UT material shows behaviour typical of a contractive clayndashsand mixture with low penetration resistances during high rates of penetration when excess pore pressures are generated during probing (Jaeger et al 2010) At lower velocities Q is seen to increase as the penetration process approaches drained conditions Alternatively PT material gives a relatively consistent penetration resistance across the range of V values applied This may be a result of the higher permeability of the PT material resulting in less excess pore pressure generation However at high rates of penetration PT material was seen to exhibit dilative behaviour under probing contrary to the expected behaviour of the material from laboratory element tests
Figure 9 summarises the results of CPT probes in a QndashFr soil type plot (Robertson 1990) This enables comparison of the inferred dilativecontractive state
of the material and the general soil type suggested from the CPT data channels The CPT results give drastically different results for the UT and PT samples when viewed in this context For example PT plots as having lower compressibility to UT material ndash the opposite of the laboratory results
for the two materials Although extensive examination of the implications of the QndashFr results is beyond the scope of this article it is clear that care is required when using the CPT to classify a PT deposit for undrained strength or to determine in situ state
Figure 5 State diagram and inferred CSLs
Figure 6 Rate effects in DSS shearing
Figure 7 Post-cyclic strength behaviour
PASTE amp THICKENED TAILINGS
Australian Centre for Geomechanics | December 2017 Newsletter26
The general results seen in centrifuge testing may be similar to those seen in one field-scale comparison of CPT probing through PT and UT material (da Silva 2011) In that example CPT probes through PT material showed much higher tip resistances which may have been a result primarily of increased drainage around the cone rather than an actual increase in strength or a denser state This confirms that great care is required in the use of penetration tests to obtain undrained shear strengths or state estimates in PT material
Consolidation modelling The realised average density within
a tailings deposit which is often the parameter of greatest relevance to an operator is a function of more than simply the final dry density under a given vertical effective stress Rather it is also affected by hydraulic conductivity ie rate of consolidation of the deposited material and the rate at which tailings are deposited into a given area
To enable comparison of the behaviour of idealised PT and UT tailings deposition the finite strain consolidation code CONDES0 (Yao amp Znidarcic 1997) was used Model parameters were based on test data previously presented (Figures 2 and 3) The CONDES0 code enables finite strain consolidation modelling of one-dimensional columns under different material placement rates Therefore models can be run with different rates of new material being added to the model per unit time ie different rates of rise (RoR) An important consideration regarding RoR should be noted in this context ndash specifically that there are different forms of RoR which require careful consideration when making comparisons in finite strain codes Three forms of RoR are considered herein as follows
bull Slurry RoR This represents the rate at which the deposited slurry would increase in height were no water release to occur (ie the material remained in a slurry state indefinitely) While a generally unrealistic scenario the slurry RoR is the required starting point for developing comparison models as it is only a function of cell area deposition rate and slurry density
bull Settled RoR The rate at which the tailings level would increase were the material to undergo hindered settling but no further consolidation As typical finite strain models including CONDES0 operate in an effective stress framework they are incapable of modelling the behaviour of slurries prior to the development of effective stress Therefore settled RoR forms the input to a finite difference code
bull Realised RoR This is the RoR value
observed on an actual tailings deposit and is also the value typically being discussed when referring to RoR in tailings practice Factors that affect realised RoR include the rate of deposition cell area consolidation characteristics of the tailings and drainage conditionsThe results of average dry density in
an idealised tailings deposit are presented in Figure 10 for a model assuming no
bottom drainage The data is presented as the average dry density in the model after a period of five years where the slurry RoR is varied from 5ndash40 myear At low slurry RoR the UT material achieves higher dry densities as consolidation keeps up with the deposition rate and therefore the higher final dry density of UT material governs what is achieved However as RoR increases the higher hydraulic conductivity of PT material increases in
Figure 9 Results summarised in a CPT classification chart
Figure 8 Dimensionless penetration resistance versus dimensionless penetration velocity
Drained penetration
Partially drained penetration
Undrained penetration
PASTE amp THICKENED TAILINGS
Australian Centre for Geomechanics | December 2017 Newsletter 27
importance eventually leading to higher average densities This difference becomes significant at high RoR Similar results were indicated by Znidarcic et al (2015) for MFT
Primary outcomes and future areas
The primary outcomes of the study discussed in this article are outlined as follows
bull Polymer treatment affected consolidation behaviour in two distinct ways (a) resulting in lower final densities at a given vertical effective stress while (b) resulting in higher permeability at a given density Numerical modelling of the effect of these changes on achievable dry density in an idealised storage area indicated that the potential benefits of PT with respect to average density and water release were manifested at high slurry RoR values
bull The study provided clear evidence that PT changed the location of the materialrsquos CSL This is an important consideration given potential application of PT in achieving steepened tailings beaches Application of critical state methods to assess the liquefaction susceptibility
of such beaches should include checks on the effect of PT on the CSL Publication of additional data for other materials of such observations would be of benefit
bull Significant shearing of the material after treatment resulted in a substantial reduction in some of the geotechnical effects of PT It is noted that the only sheared samples tested in this study were heavily sheared in order to represent a fully sheared case Further testing of PT tailings under different magnitudes of shear to link to behaviour down the beach would be beneficial
bull PT material exhibited slightly higher sensitivity to increased strain rates in terms of undrained shear strength This suggests caution must be applied when interpreting the results of hand shear vane tests which are often used to compare the behaviour of UT to PT material in trial-scale deposits
bull PT material exhibited higher penetration resistances in centrifuge testing This is despite the PT material having similar shear strengths when measured in laboratory element tests The increased drainage rates of PT material appear to be a
major contributor to the different penetrometer responses This is important to consider when comparing the results of the penetration tests of UT and PT deposits or when using the CPTu to determine in situ strengths and state of PT deposits
bull Consolidation modelling indicates that the rate of deposition ie slurry RoR has a major effect on whether PT will result in higher dry densities in a full-scale deposit At high deposition rates the higher permeability values of the PT material outweigh its lower final densities such that the average dry density achieved during deposition is higher than UT material
AcknowledgementsThe authors acknowledge the financial
assistance of the ACG the assistance of UWA laboratory centrifuge personnel and polymer treatment advice provided by BASF Australia Ltd
Article references are available at acguwaeduaunewsletters-annual-reports
Figure 10 Consolidation modelling summary
Dr David Reid
The University of Western Australia Australia
Professor Andy Fourie
The University of Western Australia Australia
21ST INTERNATIONAL SEMINAR ON
PASTE AND THICKENED TAILINGS11ndash13 APRIL 2018 | RENDEZVOUS HOTEL PERTH SCARBOROUGH | WESTERN AUSTRALIA
Principal SponsorWWWPASTE2018COM
EARLYBIRD REGISTRATION ENDS
26 FEBRUARY 2018
ACG event schedule
The
ACG
even
t sch
edule
is su
bject
to ch
ange
A u s t r a l i a n C e n t r e f o r G e o m e c h a n i c s | V o l u m e N o 4 6 | D e c e m b e r 2 0 1 7
wwwacguwaeduauevents
2018Static Liquefaction Workshop 6ndash7 March 2018 | Melbourne Australia
Rheology Fundamentals for Slurries and Pastes Workshop 9 April 2018 | Perth Australia
Is the Future Filtered Paste and Thickened Tailings Short Course 10 April 2018 | Perth Australia
21st International Seminar on Paste and Thickened Tailings wwwpaste2018com 11ndash13 April 2018 | Perth Australia
Instrumentation and Slope Monitoring Workshop 9 April 2018 | Seville Spain
InSAR Radar and Emerging Technologies Workshop 10 April 2018 | Seville Spain
Practical Rock Mechanics in Mining Short Course 14ndash16 May 2018 | Perth Australia
Introduction to Mine Seismicity Short Course 17ndash18 May 2018 | Perth Australia
Fourth International Symposium on Block and Sublevel Caving wwwcaving2018com 15ndash17 October 2018 | Vancouver Canada
Ground Support in Cave Mining Workshop 18 October 2018 | Vancouver Canada
Geotechnical Engineering for Open Pit Mines Short Course 23ndash25 October 2018 | Perth Australia
Instrumentation and Slope Monitoring Workshop 26 October 2018 | Perth Australia
Management Operation and Relinquishment of Tailings Storage Facilities 5ndash6 December 2018 | Perth Australia
Australian Centre for Geomechanics | 35 Stirling Hwy (M600) | Crawley Western Australia | Australia 6009Ph +61 8 6488 3300 | info-acguwaeduau | wwwacguwaeduau
FOURTH INTERNATIONAL SYMPOSIUM ON
BLOCK AND SUBLEVEL CAVING 15ndash17 OCTOBER 2018 | VANCOUVER CANADA
wwwcaving2018comABSTRACTS DUE 19 FEBRUARY 2018
SUNDAY | 14 OCTOBER
MONDAY | 15 OCTOBER
TUESDAY | 16 OCTOBER
WEDNESDAY | 17 OCTOBER
THURSDAY | 18 OCTOBER
FRIDAY | 19 OCTOBER
SRK Cave Mining Forum
Fourth International Symposium on Block and Sublevel Caving
ACG Ground Support in Cave
Mining Workshop
Site Visit to New Afton Mine
Symposium Dinner
Australian Centre for Geomechanics 2014 mXrap Australian Centre for Geomechanics Perth httpwwwmxrapcomBeck D Levkovitch V amp Simser B 2012 lsquoExplicit dynamic simulation for probabilistic forecasting of fault slip and rock mass seismic
potentialrsquo in Y Potvon (ed) Proceedings of the Sixth International Seminar on Deep and High Stress Mining Australian Centre for Geomechanics Perth pp 373ndash388
Hudyma M 2005 An introduction to mine seismicity seminar notes Australian Centre for Geomechanics PerthMcGaughey J 2014 lsquoA framework for 4D quantitative back-analysis and estimation of geotechnical hazard potential in minesrsquo Proceedings
of Geohazards 6 Canadian Geotechnical Society RichmondMendecki A 1993 lsquoReal time quantitative seismology in minesrsquo in RP Young (ed) Proceedings of the 3rd International Symposium on
Rockbursts and Seismicity in Mines AA Balkema Rotterdam pp 287ndash295Simser B amp Pritchard C 2010 lsquoObservational ground control at Xstratarsquos Nickel Rim South Mine Sudbury Ontariorsquo Proceedings of the
Canadian Institute of Mining Operatorrsquos Conference Canadian Institute of Mining Metallurgy and Petroleum Westmount Simser B Jalbout A amp Pakalnis R 2014 lsquoStability graph method for open stope design ndash case histories from two Sudbury Basin minesrsquo
Proceedings of the 1st International Conference on Applied Empirical Design Methods in Mining International Society for Rock Mechanics Lisbon
Simser B 2013 lsquoSeismic monitoring at Nickel Rim South Minersquo Proceedings of the 6th Microseismic Symposium and Workshop Engineering Seismology Group Kingston
van Aswegen G amp Butler AG 1993 lsquoApplications of quantitative seismology in South African gold minesrsquo in RP Young (ed) Proceedings of the 3rd International Symposium on Rockbursts and Seismicity in Mines AA Balkema Rotterdam pp 261ndash266
Rock mechanics tools for mining in high stress ground conditions at Nickel Rim South Mineby Ali Jalbout Goldcorp Inc Canada and Brad Simser Sudbury Integrated Nickel Operations A Glencore Company Canada
References from page 1ndash8 click here to return to article
References
Continued overleaf
Andrews SJ 1998 lsquoStratigraphy and depositional setting of the upper McNamara Group Lawn Hills region Northwest Queenslandrsquo Economic Geology vol 93 pp 1132ndash1152
Broadbent GC Andrews SJ amp Kelso IJ 2002 lsquoA decade of new ideas geology and exploration history of the Century Zn-Pb-Ag deposit northwestern Queensland Australiarsquo Society of Economic Geologists Special Publication 9 pp 119ndash140
Cawood F amp Stacey T 2006 lsquoSurvey and geotechnical slope monitoring considerationsrsquo The Journal of the South African Institute of Mining and Metallurgy vol 106 pp 495ndash502
Goodman RE Taylor RL amp Brekke TL 1968 lsquoA model for the mechanics of jointed rocksrsquo Journal of Soil Mechanics and Foundations Division vol 94 no 3 pp 634ndash659
Hammah R Yacoub T Corkum B amp Curran J 2008 lsquoThe practical modelling of discontinuous rock masses with finite element analysisrsquo Proceedings of the 42nd US Rock Mechanics Symposium American Rock Mechanics Association Alexandria
Harries N Noon D amp Rowley K 2006 lsquoCase studies of slope stability radar used in open cut minesrsquo Stability of Rock Slopes in Open Pit Mining and Civil Engineering Situations pp 335ndash342
Hutchison BJ Naude S amp Howarth J 2015 lsquoManagement of a toppling failiure wall collapse at the Kanmantoo Copper Mine in South Australiarsquo Proceedings of the 2015 International Symposium on Rock Slope Stability in Open Pit Mining and Civil Engineering The Southern African Institue of Mining and Metallurgy Johannesburg pp 81ndash98
Kurukuk N amp Sweeney E 2012 lsquoSlope stability assessment centuryrsquo Proceedings of the 9th AustraliandashNew Zealand Young Geotechnical Professionals Conference The New Zealand Geotechnical Society Wellington
Little MJ 2006 lsquoSlope monitoring strategy at PPRust open pit operationrsquo Proceedings of the 2016 International Symposium on Stability of Rock Slopes in Open Pit Mining and Civil Engineering The Southern African Institute of Mining and Metallurgy Johannesburg pp 211ndash230
Lynch RA amp Malovichko DA 2006 lsquoSeismology and slope stability in open pit minesrsquo Proceedings of the 2006 International Symposium on Stability of Rock Slopes in Open Pit Mining and Civil Engineering The Southern Africa Institute of Mining and Metallurgy Johannesburg pp 375ndash390
The geotechnical conundrum are surface observations reflecting rock mass behaviour at depthby Dr Michele Salvoni Australia and Professor Phil Dight Australian Centre for Geomechanics Australia
References from page 16ndash19 click here to return to article
References
Continued overleaf
Backer RR amp Busch RA 1981 Fine coal refuse slurry dewatering United States Department of the Interior Bureau of Mines Washington DCBeier N Wilson W Dunmola A amp Sego D 2013 lsquoImpact of flocculation-based dewatering on the shear strength of oil sands fine tailingsrsquo
Canadian Geotechnical Journal vol 50 no 9 pp 1001ndash1007Cooling D amp Beveridge A 2015 lsquoUse of Rheomaxreg ETD technology to thicken bauxite residual slurry during Super Thickener bypassrsquo
in AB Fourie amp RJ Jewell (eds) Paste and Thickened Tailings ndash A Guide 3rd edn Australian Centre for Geomechanics Perth pp 311ndash313Da Silva F 2011 lsquoReducing risks to tailings storage facilities through in-line flocculationrsquo in J Han amp DE Alzamora (eds) Proceedings of
GeoFrontiers 2011 Advances in Geotechnical Engineering American Society of Civil Engineers Reston pp 2937ndash2946Finnie IMS amp Randolph MF 1994 lsquoPunch-through and liquefaction induced failure of shallow foundations on calcareous sedimentsrsquo
Proceedings of the Seventh International Conference on Behavior of Offshore Structures (BOSS 94) Massachusetts Institute of Technology Cambridge pp 217ndash230
Gholami R amp Simms P 2015 lsquoShear behaviour in element testing of polymer amended mature fine tailingsrsquo Proceedings of the 68th Canadian Geotechnical Conference Canadian Geotechnical Society Richmond
Jaeger RA Dejong JT Boulanger RW Low HE amp Randolph MF 2010 lsquoVariable penetration rate CPT in an intermediate soilrsquo in PK Robertson amp PW Maybe (eds) Proceedings of the 2nd International Symposium on Cone Penetration Testing (CPT10)
Jeeravipoolvarn S Scott D Chalaturnyk R amp Shaw B 2014 lsquoEffect of pipeline shear on consolidation properties of oil sands fine tailingsrsquo Proceedings of Tailings and Mine Waste 2014 Information Technology Creative Media Vancouver pp 495ndash506
Jeeravipoolvarn S Scott J amp Chalaturnyk R 2009 lsquoGeotechnical characteristics of laboratory in-line thickened oil sands tailingsrsquo Proceedings of Tailings and Mine Waste 2009 Information Technology Creative Media Vancouver pp 813ndash828
Li AL Been K Ritchie D amp Welch D 2009 lsquoStability of large thickened non-segregated tailings slopesrsquo in RJ Jewell AB Fourie S Barrera and J Wiertz (eds) Proceedings of the 12th International Seminar on Paste and Thickened Australian Centre for Geomechanics Perth pp 301ndash312
Reid D 2016 lsquoEffect of rotation rate on shear vane results in a silty tailingsrsquo in BM Lehane HE Acosta-Martinez and R Kelly (eds) Proceedings of the 5th International Conference on Geotechnical and Geophysical Site Characterisation vol 1 Australian Geomechanics Society St Ives pp 369ndash374
Reid D amp Fourie AB 2015 lsquoEffects of shear on the behaviour of polymer-treated slurriesrsquo in FR Nejad (ed) Proceedings of Tailings and Mine Waste Management for the 21st Century The Australian Institute of Mining and Metallurgy Melbourne pp 215ndash224
Reid D amp Fourie AB 2016 lsquoLaboratory assessment of the effects of polymer treatment on geotechnical properties of low plasticity soil slurryrsquo Canadian Geotechnical Journal vol 53 no 10 pp 1718ndash1730
Effects of polymer treatment on geotechnical properties of a low-plasticity slurryby Dr David Reid and Professor Andy Fourie The University of Western Australia AustraliaReferences from page 23ndash27 click here to return to article
Marques EAG Vargas Jr EDA amp Antunes FS 2005 lsquoA study of the durability of some shales mudrocks and siltstones from Brazilrsquo Geotechnical amp Geological Engineering vol 23 pp 321ndash348
Read J 2007 lsquoPredicting the behaviour and failure of large rock slopesrsquo Proceedings of the 1st Canada-US Rock Mechanics Symposium American Rock Mechanics Association Alexandria
Sainsbury B Sainsbury D amp Hebert Y 2013 lsquoAssessment of the long-term stability of the Stage 8 West Wall Cutback at MMG Centuryrsquo unpublished Itasca internal report Itasca Australia Pty Ltd
Salvoni M 2015 lsquoRock mechanical characterization of the carbonate breccia and black carbonaceous shalesrsquo unpublished Australian Centre for Geomechanics report Australian Centre for Geomechanics Perth
Salvoni M amp Dight PM 2016 lsquoRock damage assessment in a large unstable slope from microseismic monitoring-MMG Century mine (Queensland Australia) case studyrsquo Engineering Geology vol 210 pp 45ndash56
Stacey P 2009 lsquoFundamentals of slope designrsquo in J Read and P Stacey (eds) Guidelines for Open Pit Slope Designrsquo AA Balkema Rotterdam pp 1ndash14
Sweeney E amp Abbott K 2016 lsquoGeotechnical analyses for risk managment of a large scale failure at Century mine Northwest Queenslandrsquo in PM Dight (ed) Proceedings of the First Asia Pacific Slope Stability in Mining Conference Australian Centre for Geomechanics Perth pp 225ndash238
Taylor RK amp Smith TJ 1986 lsquoThe engineering geology of clay minerals swelling shrinking and mudrock breakdownrsquo Clay Minerals vol 21 pp 235ndash260
Walkinshaw J amp Santi P 1996 Chapter 21 Shales and other degradable materials Landslides Investigation and Mitigation TRB Special Report vol 247 pp 555ndash576
Wesseloo J amp Sweby GJ 2008 lsquoMicroseismic monitoring of hard rock mine slopesrsquo in Y Potvin J Carter A Dyskin and R Jeffrey (eds) Proceedings of the First Southern Hemisphere International Rock Mechanics Symposium Australian Centre for Geomechanics Perth pp 433ndash450
Xiao Y-X Feng X-T Hudson JA Chen B-R Feng G-L amp Liu J-P 2016 lsquoISRM suggested method for in situ microseismic monitoring of the fracturing process in rock massesrsquo Rock Mechanics and Rock Engineering vol 49 pp 343ndash369
ReferencesReid D amp Fourie AB 2017a lsquoCentrifuge assessment of the effects of polymer treatment on penetrometer responsersquo International Journal for
Numerical and Analytical Methods in Geomechanics in pressReid D amp Fourie AB 2017b lsquoEffects of polymer treatment on undrained strengths and cyclic behavior of a low-plasticity slurryrsquo Journal of
Geotechnical and Geoenvironmental Engineering vol 143 no 6Reid D Utting L amp Fourie AB 2015 lsquoAssessing the effects of polymer treatment segregation considerationsrsquo Proceedings of Tailings and
Mine Waste 2015 The University of British Columbia VancouverRiley T Reid D amp Utting L 2015 lsquoPolymer-modified tailings deposition ndash ongoing testing and potential storage efficiency opportunitiesrsquo
in RJ Jewell amp AB Fourie (eds) Proceedings of the 18th International Seminar on Paste and Thickened Tailings Australian Centre for Geomechanics Perth pp 139ndash152
Robertson PK 1990 lsquoSoil classification using the cone penetration testrsquo Canadian Geotechnical Journal vol 27 no 1 pp 151ndash158Sachan A amp Penumadu D 2007 lsquoEffect of microfabric on shear behavior of kaolin clayrsquo Journal of Geotechnical and Geoenvironmental
Engineering vol 133 no 3 pp 306ndash318Stewart BM Backer RR amp Busch RA 1986 Thickening Fine Coal Refuse Slurry for Rapid Dewatering and Enhanced Safety report of
investigations United States Department of the Interior Bureau of Mines Washington DCWang YH amp Siu WK 2006 lsquoStructure characteristics and mechanical properties of kaolinite soils II Effects of structure on mechanical
propertiesrsquo Canadian Geotechnical Journal vol 43 no 6 pp 601ndash617Wells PS amp Kaminsky HAW 2015 lsquoSlurry to soil clay behaviour model - using methylene blue to cross the processgeotechnical engineering
dividersquo Proceedings of Tailings and Mine Waste 2015 The University of British Columbia VancouverYao D amp Znidarcic D 1997 Crust Formation and Desiccation Characteristics for Phosphatic Clays users manual for computer program
CONDES0 Florida Institute of Phosphate Research Polk CountyZnidarcic D Adkins S Utting L amp Catling M 2015 lsquoRheomax ETD technology a laboratory study of application performance and
associated geotechnical characteristics for polymer assisted tailings deposition of oil sands MFTrsquo Proceedings of Tailings and Mine Waste 2015 The University of British Columbia Vancouver pp 508ndash520

OPEN PIT
Australian Centre for Geomechanics | December 2017 Newsletter 13
different structures where they can be observed and accessed in the pit walls Any interaction observed between structures can be applied to the structural model in Leapfrog When applied the implicit modelling algorithm re-models the structures upon which the relations apply slicing or constraining the 3D mesh where it is intersected by crosscutting structures Figure 3 displays an example of before-and-after modelling relationships where they have been applied
A full list of crosscutting relationships is administered by the software Any conflicting cutting relationships in the chronological order of the structure are flagged so they can be rectified by the modeller This gives the user the luxury of not having to keep track of hundreds
of different structural intersection relationships that occur in a large structural model The user can observe the cutting relationships of structures in the field as well as in the photogrammetric model and apply these rules to the Leapfrog mesh without having to go through the other relationships to make sure there is not a conflict
The speed at which this modelling process can be completed means that geotechnical staff can update their structural model in Leapfrog after a new bench is mined out Previously mapped structural discs can be opened in the updated photogrammetric model after which the newly modelled discs can be added to account for the newly uncovered batter faces Updating the structural model
in this manner means that it can be kept up-to-date continuously rather than the current practice on most sites which is to update the model quarterly-to-half yearly By keeping the model up-to-date structural analyses can be updated against pit designs to foresee possible future instabilities and remediate them before they are actually mined
The newly updated structural meshes can be exported as a DTM file in a format which is compatible with most other modelling software packages This means that structural meshes can be shared with other stakeholders on a mine site who may not have access to Leapfrog For example drill and blast engineers can use the structural DTM files to adjust blast designs to protect batter faces from extensive blast damage along structural planes
The combination of ADAM Technologys 3DM Analyst Suite and ARANZ Georsquos Leapfrog software to produce structural models has provided the ability to increase the efficiency and accuracy of structural modelling at the Cowal gold operation The replacement of manual modelling with implicit modelling has removed a very time-consuming process This ability freed the geotechnical engineer to concentrate on the interpretation of the structural model as well as providing operational geotechnical staff with the ability to dynamically update the structural model as required
Richard Battison
Evolution Mining AustraliaFigure 3 A combination of photogrammetry and field mapping data being used to create a
structural mesh The fault has been assigned cross-cutting relationships to constrain its extents The original pre-constrained structure can be seen faded
S A V E T H E D A T E
ACG Geotechnical Engineering for Open Pit Mines23ndash25 October 2018 | Novotel Perth Langley Hotel | Perth Western Australia
ACG Instrumentation and Slope Monitoring Workshop26 October 2018 | Novotel Perth Langley Hotel | Perth Western Australia
Contact the ACG for sponsorship opportunities events-acguwaeduau
wwwacguwaeduauevents
Australian Centre for Geomechanics | December 2017 Newsletter14
ACG celebrates 25 years of mining geomechanics excellence
Established in June 1992 the Australian Centre for Geomechanics looks back in pride at the last 25 years and forward with enthusiasm and confidence to ACGrsquos future endeavours
The following profiles illustrate the range of research projects undertaken by our not-for-profit mining research centre and include some that are have been and will continue to be pivotal in the development and evolution of our team
bull Ground Support Systems Optimisation Research Project
bull Mine Seismicity and Rockburst Risk Management Research Project and mXrap Consortium
bull Strainburst Research Projectbull An Effective Stress Approach to Mine
BackfillIndustry has sought ACG advice and
assistance on projects from the backfill mines of China to the deep mines of Australia Canada and South Africa Projects range from mitigating the risks of seismic
hazards to the complexities of rock stress testing
Since 1992 the ACG has presented more than 300 industry courses seminars workshops conferences and symposia that have been attended by almost 14000 mining professionals and produced seven training videos in the areas of open pit underground and environmental mining geomechanics (Figure 1)
ACG Director Professor Yves Potvin concludes that ldquothe global mining industry has and continues to place its trust in the ACG to deliver the world-class research and training to advance mine safety and mitigate geotechnical risks We are grateful for industryrsquos ongoing support encouragement and counsel ndash it motivates and inspires our team to seek solutions and find technologies to address industryrsquos geotechnical challengesrdquo
In 2005 I was honoured to accept an invitation to join the board of the ACG as an industry representative Since then it has been very rewarding to witness the service that the ACG team has provided to the mining industry in Western Australia and to observe the high regard within the global mining community for the centrersquos staff and their work
Over the 25 years of the ACGrsquos existence the mining industry has continually strived for improvements in safety despite the enduring quest for greater productivity and efficiency including in deepening mines with more demanding geotechnical environments Safety and environmental standards imposed both internally and by regulation have continued to rise The ACGrsquos role in advancing geomechanics related research education and training has been closely attuned to these needs and has made important contributions to them
For this reason the industry is enormously grateful to the ACGrsquos founders for their far-sightedness Those founders have been able to see the centre flourish into the success it is today 25 years later led by its enterprising director Professor Yves Potvin I congratulate Yves and all who have contributed to that success
The ACG undertakes its activities with an admirable blend of energy rigour and pragmatism that will see the industry continue to both support and rely on the ACG for many years to come
Ian Suckling
Chairman of the Board Australian Centre for Geomechanics Australia
Figure 1 Number of attendees at ACG events by year since 1993
Total course numbers 2008 - 2017
0
200
400
600
800
1000
1200
Australian Centre for Geomechanics | December 2017 Newsletter 15
In 1991 a proposal for a Federal Government Cooperative Research Centre (CRC) was submitted from the Geomechanics Group at The University of Western Australia (UWA) in response to the call for the initial round of applications The parties to this cooperative application included UWA Curtin University (Western Australian School of Mines) CSIRO Department of Minerals and Energy (DME) and an industry partner
The application did not make the final cut for the 15 centres funded initially and the four research partners decided that what had been proposed was needed for the mining industry and each contributed to the formation of a self-funded research centre based at UWA The centre was conducted under the oversight of an industry chaired board of management and an advisory board comprising representatives from the mining industry and was formally launched in June 1992
The stated objective of the centre was to provide research and education services to the mining industry and from a very small base the centre remained viable in the early years by running courses for industry primarily on tailings management rock mechanics and mine geology The presenters for these courses were principally volunteers from the partners and interested mining companies At that stage the ACG staff consisted solely
of Christine Neskudla and I was essentially seconded from UWA on an almost full time basis Chris Swindells then with the DME was of considerable assistance to us in those early days
Some research grants were won in the early years from MERIWA and mining companies and some valuable research was conducted in the area of mine tailings However it was not until sufficient funds had been accumulated to enable the recruitment of Professor Yves Potvin in 1998 that the ACG had the wherewithal to expand both the scope and extent of research In 2000 I retired from UWA and the ACG and Yves was appointed director and since then the ACG has literally blossomed
In 2000 the concept of international seminars or conferences was initiated with the first of a series of annual seminars on Paste and Thickened Tailings which has become the preeminent gathering for this discipline in the world and has led to the publication of an advice and guidance manual ndash the third edition of which is currently being translated into Mandarin for the Chinese market at the request of the University of Science and Technology Beijing This concept has been expanded into other areas and the ACG now runs seminars worldwide and a number of technical publications have been produced
With the subsequent recruitment of other senior researchers such as Professor Phil Dight and Dr Johan Wesseloo the ACG has expanded to a professional and research staff in Perth currently totalling 14 to handle the workload associated with managing research in a number of fields as well as running courses seminars and various publications and through associations with other premium research organisations around the world has achieved an enviable international standing Quite frankly considering the humble start in 1992 it is amazing some 25 years later to see how successful the ACG has been and being totally self-funding (thanks to being rejected for first round CRC) it has been able to weather the financial ups and downs associated with the volatile mining industry
Achievements of the ACG ndash a retrospective reviewby Richard Jewell founding Australian Centre for Geomechanics director
Richard Jewell
Australian Centre for Geomechanics Australia
ACG Corporate Affiliate Memberships
2017 Corporate Affiliates
ACG Corporate Affiliate Memberships allow your company to gain exposure to industry leaders while also providing savings on our
well-known and respected further education and training platform Email josephineruddleuwaeduau for details
OPEN PIT
Australian Centre for Geomechanics | December 2017 Newsletter16
The geotechnical conundrum are surface observations reflecting rock mass behaviour at depthwrites Dr Michele Salvoni Australia and Professor Phil Dight Australian Centre for Geomechanics Australia
IntroductionMovements instability and failures
in open pit mines can pose important geotechnical problems that may lead to major impacts on the safety of personnel and productivity of the mining operations As geotechnical engineers we are responsible to collect analyse and regularly review a variety of information during the lifetime of the operation (eg geology structural geology material properties observations and monitoring data) and to recognise andor anticipate possible instabilityfailure mechanisms (Cawood amp Stacey 2006 Read 2007 Stacey 2009)
In modern mechanised open pit mining new tools such as ground-based radars and terrestrial laser scanners have started to support more traditional visual inspections and surveyed geodetic prisms to assess slope performance exposure (Little 2006 Harries et al 2006 Hutchison et al 2015) These latest technologies offer a wider coverage of the pit and almost real-time monitoring allowing rapid identification of unstable areas and managing safety and operational issues
Although these tools are extremely important on a daily basis for long-term operational management they can only provide information of near surface displacements and engineers often have to make assumptions on rock mass behaviour at depth (Salvoni et al 2016) In some cases traditional subsurface monitoring eg inclinometers piezometers time domain
reflectometry andor extensometers can provide valuable information However these instruments cannot cover the three-dimensional volume of the rock slope (Lynch amp Malovichko 2006) and require safe access for the drilling and installation of the system and also for data collection if the instruments cannot be read remotely
In this article experiences acquired during the last three years on a case study of a large scale unstable rock slope at MMG Century mine will be discussed The project has challenged one of the most common assumptions made when dealing with geotechnical problems and has examined the idea that near surface behaviour always reflects rock mass response at depth
Geologicalndashgeotechnical overview
Century mine was an open pit mine owned and operated by MMG Limited The mine is located near Lawn Hill in North Queensland approximately 250 km northwest of Mount Isa close to the Northern Territory border The Century deposit represents one of the major sediment-hosted zinc lead and silver deposits of the Mount Isa inlier and McArthur basin (Andrews 1998 Broadbent et al 2002) When mining operations ceased at the end of 2015 the pit was approximately 25 km long by 15 km wide at the surface with a final depth of 320 m
Since 2009 the South West Pit Wall has represented an ongoing challenge for site personnel with several multi-
batter failures associated with continuous bedding planes (Sweeney amp Abbott 2016) The pit wall is a 300 m high slope with an overall angle of 40deg developed within the footwall sequence (Figure 1) The units are characterised by the presence of thinly bedded shales exhibiting a highly anisotropic behaviour and affected by continuous fracturing and occasional bedding plane shears (Kurukuk amp Sweeney 2012) In addition to bedding there are three main geological structures named Pandorarsquos Page Creek and Creek Faults which bound the area and have contributed to the local rotation and folding of the bedding planes Particularly interesting is the presence of a massive block of CBX (carbonate breccia) which has been interpreted as a result of a large fault jog or dilation related to the Pandoras Fault (Salvoni et al 2016)
Generally the pit wall experienced periods of rapid acceleration (up to 10 mmday) during the wet season and steady trend movements (less than 1 mmday) during the dry season Major concerns at the mine started to rise during the 2012ndash13 wet season with an increase of acceleration and the development of tension cracks up to 30 m behind the pit crest Following numerical analysis (Sainsbury et al 2013) which indicated the likelihood of a deep-seated failure mechanism The mine operations decided to leave a buttress at the toe of the slope (~28deg) to manage the observed progressive movement in the slope above the CBX block Despite the change in the design the slope continued to move More information is provided by Salvoni et al (2016) and Sweeney and Abbott (2016)
Observations questions and hypothesis
There are a few observations and some key elements available to allow us to better understand the problem The first observation is that by looking at the historical deformation trend recorded by the prisms it appears that the rock mass near the surface was no longer moving in the elastic range In fact it shows a time-dependent behaviour (creeping) much more like a rock riverscree slope with rapid acceleration triggered by rainfall events (Figure 2) Also looking at the displacement vectors the CBX seems to have had a key role in the stability of the slope acting as a natural buttress being slowly pushed out in a toppling or Figure 1 Front view of the target site on the South West Pit Wall at November 2013 showing
the main geotechnical units and structural features
OPEN PIT
Australian Centre for Geomechanics | December 2017 Newsletter 17
rotation manner ie activepassive wedge Finally one important aspect has been overlooked the progressive weathering of shale near the surface As previously mentioned a common assumption in slope stability analysis is that an unstable rock mass is considered as a rigid block However at Century there are indications that soon after the shales were exposed they tended to rapidly break up and deteriorate due to their high clay mineral (montmorillonite) and sulphide mineral pyrite (FeS2) content Several authors highlighted how in low durability some materials like shales and their slaking erosion and surface creep mechanisms are dominant (Taylor amp Smith 1986 Walkinshaw amp Santi 1996 Marques et al 2005)
In this sense at the beginning of the project it was important to question if the large deformations observed near the surface truly reflected the proposed deep-seated mechanism behind the pit wall Given the fact that there was limited access to install traditional subsurface monitoring a microseismic system was proposed and subsequently implemented in November 2013 The aim of the project was to provide early warning of the development of the deep-seated failure and to understand how deep into the wall the rock mass was being damaged
Microseismic dataMicroseismic (MS) and acoustic
emission monitoring have found many uses over the years in the geotechnical field (Xiao et al 2016) Examples of applications are reported for mining rockburst risk assessment caving monitoring rock slope monitoring laboratory tests as well as for the oil and gas field These monitoring techniques are based on the recording of the radiated seismic energy generated by brittle fracturing of the rock to estimate a 3D location and parameters at the source The general idea is that as seismicity can be recorded at a lowinfinitesimal strain
strain near the onset of instability could be detected before surface deformation is eventually observed However in the open pit environment and in natural rock slopes the number of case studies remains limited and the technique has not reached the maturity to be used as a routine method requiring a great deal of interpretation (Wesseloo amp Sweby 2008)
The microseismic array deployed at Century comprised 16 sensors located in the volume of rock behind the South West Pit Wall As shown in Figure 3 the system tends to follow the slope curvature as pit geometry and accessibility represent major constraints for installing the sensors Navi-drilled boreholes behind the pit crest were the only option to enable the instruments to be sufficiently close to the
pit wall and the expected instability area The system was operative from November 2013 until February 2016 when it was decommissioned More details on the system are provided by Salvoni et al 2016
The majority of seismic data was recorded between February and April 2014 when a rapid acceleration of surface deformation was observed after a few days of heavy rainfall The slope experienced a total cumulative displacement of up to several metres with localised small instabilities and the partial detachment of the CBX block During this time the system recorded more than 2300 microseismic events ndash ranging from a moment magnitude of -2 to 02 From Figure 3 it can be observed how there is a good correspondence between the spatial and
Figure 2 (a) Ground displacements recorded by the prism monitoring and daily rainfall between October 2010 and January 2014 in different areas of the slope (b) 3D view showing the displacement vectors for the same time period and coloured by total cumulative displacement
Figure 3 (a b c d) Seismic events recorded from February to May 2014 behind the South West Pit Wall 3D view showing the seismic activation sequence for different time windows Seismic events are coloured and sized by moment magnitude
OPEN PIT
Australian Centre for Geomechanics | December 2017 Newsletter18
temporal distribution of microseismic and slope deformations activity The following points are made
1 From the 15th February 2014 seismic events started to be recorded behind the pit wall with a rate of approximately 11 events per day This activity was mainly concentrated in the lower section of Page Creek Fault in the wedge failure sector and behind the CBX block (Figure 3a)
2 During 23rd to 24th February two main event clusters were observed The first one corresponded to a localised planar failure in the lower section of Page Creek Fault while the second occurred in the buttress where the slip zone was observed A general increase in seismic activity was recorded (~20 events per day) with events also being detected in the upper section of the wall (Figure 3b)
3 From the middle of March to the middle of April 2014 the seismic activity rate reached its peak with more than 30 events per day Activity was mainly localised in the wedge failure sector behind the CBX block and in the upper section of the wall Events were also recorded in the right corner at the base of the CBX block and along the Pandoras Fault (Figure 3c)
4 Gradually from the middle of April 2014 events were mainly
concentrated in the wedge failure sector and behind the CBX block Activity progressively slowed down reaching only a few events per week by the end of May (Figure 3d)
Rock mass damage at depth and numerical analysis
Important information of the rock mass behaviour at depth can be extrapolated from the distribution of the microseismic activity Figure 4 shows a section through the pit wall representing the seismic events coloured by distance from the surface and sized by moment magnitude Seismicity tends to be concentrated within a narrow band between 20 and 40 m from the surface and behind the CBX block Particularly interesting is also the reduction of seismic activity in the lower section of the wall near surface A similar characteristic was also observed in another section view along the wedge failure sector
The data do not reveal any sign that a deep-seated instabilityfailure is developing as predicted by the numerical analysis More importantly the data confirm the hypothesis that different instability mechanisms are affecting slope behaviour The material close to the surface is characterised by intensely brokenweathered rock mass and is no longer able to produce and propagate much seismic energy (ie it is an aseismic zone) This area is subjected to creep driven movements that are always present even in dry conditions and are characterised by
an acceleration in movement related to seasonal rainfall As it is now much more broken up it is also much more permeable and with rainfall the influence of effective stress is leading to the unravelling Even though it is permeable it does not mean it dries out in the dry season This shallow instability has caused the rotation of the CBX block and triggered further deformation at depth where between 20 and 40 m of rock mass is progressively fracturing and may potentially develop into a multi-batter failure involving the upper section of the pit wall
To verify some of the concepts previously expressed and compare them with the available data and observations a series of simple 2D finite element numerical modelling was carried out The final model assumed a plastic layer of approximately 10 m of affected material characterised by the weathering An additional surface was also introduced to reproduce the effect of rainfall water during the raining season Derived MohrndashCoulomb failure criteria with no post-peak dilatancy and cohesion loss were then assigned to the constitutive model for the fresh shale and the CBX unit based on laboratory testing (Salvoni 2015) For the shales a joint model (Goodman et al 1968 Hammah et al 2008) was built in order to explicitly simulate the effect of the continuous bedding plane shears which most likely represents the major structural control of the slope
Final results are shown in Figure 5 This numerical analysis suggests that the assumed geometry and a 10 m thin layer
Figure 4 Section through the distribution of the distance of seismic events from the surface for the upper section of the pit wall (above) and for the wedge failure area (below)
OPEN PIT
Australian Centre for Geomechanics | December 2017 Newsletter 19
of weathered rock can create a toppling mechanism on the CBX with progressive shearing at the contact between the shale and breccia units and progressive damage at 30ndash40 m below the pit surface The weathered material has a time-dependent type of behaviour and is subjected to continuous unravelling associated with rapid acceleration triggered by the rainfall
ConclusionLarge unstable rock slopes can
pose significant hazards for personnel and operations in open pit minesroad cuttings A complete understanding of failure mechanisms and the state of the rock mass requires analysis of a comprehensive dataset However in
many cases information is limited to the surface displacement and engineers can only make assumptions about the rock mass behaviour at depth Although in many cases rigid block movement is a reasonable assumption in others it can lead to misleading interpretationnumerical analysis of the instability mechanisms
The MMG Century mine case study is an excellent example of how the combination of microseismic monitoring and critical thinking lead to a much better understanding as to how the slope was behaving The outcomes of the project not only provide an insight into the possible applications of microseismic data in open pits but also help reveal a complex
mechanism where slope deformations mask minimal damage at depth
Article references are available at acguwaeduaunewsletters-annual-reports
Dr Michele Salvoni
Australia
Figure 5 Final numerical analysis results with the slope affected by a 10 m weathered zone with a plastic behaviour and progressive shearing developing at depth where microseismic data were recorded
The ACG team congratulates Michele on
the successful submission of his PhD thesis Rock Damage
Assessment in a Large Unstable Slope from Microseismic
Monitoring ndash MMG Century Mine Case Study
We wish him all the best in his future endeavours
These ACG open pit mining workshops will accompany the 2018 International Symposium on Slope Stability in Open Pit Mining and Civil Engineering at the XIV International
Congress for Energy and Resource Mining in Seville Spain 11ndash13 April 2018
To register please visitwwwcongresomineriasevilla2018orginternacional-ingles
ACG-Workshophtml
ACG Instrumentation and Slope Monitoring Workshop amp InSAR Radar and Emerging
Technologies Workshop9 amp 10 April 2018 | Bespoke Workshop Halls Barceloacute
Conference Centre | Seville Spain
UNDERGROUND
Australian Centre for Geomechanics | December 2017 Newsletter20
Stope reconciliationby Dr Kyle Woodward Australian Centre for Geomechanics Australia
BackgroundMany underground mines around the
world use an open stope mining method The profitability of open stope mining depends on the accuracy of the stope design and the execution of the mining process The value of a stope is intrinsically linked to success of ore recovery but it is also related to the amount of unintentional dilution Stope performance is discussed in terms of underbreak (UB) ie ore not extracted and overbreak (OB) ie waste extracted The maximum value obtainable for a stope will be obtained from stopes with minimum overbreak and minimum underbreak
Open stope design approaches and tools have not evolved significantly since the 1980s and industry still extensively uses the stability graph method (Mathews et al 1980 Potvin 1988) An exception is the concept of Equivalent Linear Overbreak Sloughing (ELOS) which was developed by Clark and Pakalnis (1997) It was initially used to assess overbreak in narrow vein mining Capes (2009) extended the original Clarkrsquos database applied the methodology to open stope design and included some capability to forecast stope overbreak For most mine sites the robust statistical methods for forecasting overbreak are practically non-existent
Stopes with underbreak will leave behind unrecoverable ore and this can be as detrimental to stope value and mine economics as overbreak Existing assessments of open stope performance do not consider the evaluative estimation and forecasting of underbreak (Potvin et al 2015) Potvin et al (2016) highlight that the optimisation of overbreak and underbreak are generally conflicting and efforts that focus on reducing overbreak may increase the amount of underbreak This emphasises the importance of having good stope reconciliation tools and procedures that can translate into future stope performance optimisation
Techniques of underground surveying have made significant advancements when determining mined volumes most notably with the application of the cavity monitoring system (CMS) (Miller et al 1992) At most mines a wealth of data is created by accurate and routine stope surveying techniques The full potential of this data is far from being realised This data allows for the probabilistic forecasting and comprehensive assessment of stope performance and ultimately the optimisation of mining economics and the utilisation of a finite resource
A pilot case study - Olympic Dam (BHP)
Exploratory research at BHPrsquos Olympic Dam has shown that the concept of stope reconciliation can have a significant impact on the overbreak and underbreak outcomes at the mine (Potvin et al 2015 2016)
Figure 1 shows historical stope performance of Olympic Dam with respect to overbreak underbreak and a combined measure (Potvin et al 2016)
The previous work at Olympic Dam showed that the amount of overbreak was a function of traditional design parameters (hydraulic radius and the stability number) but also strongly correlated to the orientation of stope walls and the blasting pattern used The amount of underbreak was correlated to the drilling pattern and whether blasting was against a wall of cemented fill Other correlations were found between overbreak underbreak and the slot opening strategies
This research shows that in addition
to traditional measures operational and design factors can contribute to overbreak and underbreak outcomes This information can be used in the assessment of future stope performance and to forecast the potential for overbreak and underbreak
Stope reconciliation project Project overview
The current iteration of the stope reconciliation project has been supported by six sponsor sites along with the Minerals Research Institute of Western Australia (MRIWA) This project will build upon previous results at Olympic Dam to develop tools that enable a probabilistic approach to stope design This will involve the development of improved stope performance assessment and the investigation of factors that affect overbreak and underbreak
In practice possible influencing factors will be assessed from a range of data including stope design (eg stope
Figure 1 Historical underbreak and overbreak stope performance at Olympic Dam
Figure 2 An erroneously designed wireframe (left) and an automatically corrected wireframe (right)
UNDERGROUND
Australian Centre for Geomechanics | December 2017 Newsletter 21
dimensions stability number) operational information (eg drilling pattern slot opening adjacent stope fill walls) and geotechnical information The technology transfer to site will occur via mXrap software development and will aim to minimise manual data manipulation Conceptually given a stopersquos CMS and design the stope performance statistics will be automatically generated with a mXrap stope optimisation app Furthermore an additional mXrap app will provide a probabilistic forecast of overbreak and underbreak for a given stope design historical site-specific stope performance and factors that influence performance
Preliminary project progressThe assessment of stope performance
is underpinned by the quality of data Initial considerations of data quality focus on the quality of surveys specifically stope CMS and designs Surveys can be constructed with only visualisation in mind and may contain features that influence subsequent calculations An ideal CMS or design survey will be
bull a single surface representing an individual stope
bull consistent ie no sharp edges small ledges and other unrealistic features
bull a realistic and consistent resolutionbull free from self-intersectionsbull free from internal or external volumes
surfaces andbull a closed surface ie watertight
Survey quality is ideally considered during the CMS and design procedures to prevent automated approaches erroneously reinterpreting surveys without site-specific
information As part of preliminary work on survey quality a mXrap app was created to explore and address some of the more basic survey quality concerns Figure 2 gives an example of a common error (nodes not being lsquosnappedrsquo together) and shows the erronous design wireframe (left) and an automatically corrected wireframe (right)
The selection of a method to find the volumes associated with 3D surfaces also must consider how additional information might be integrated in a general assessment framework A familiar concept and format for geologicalgeotechnical information is a block model whereby rock properties are assigned to specific volumes An extension of this concept is not to use blocks of a uniform size but instead to use smaller blocks where more information is available and extra detail is warranted
A model of the volumes associated with stope CMS and designs can be achieved by the creation of an octree Essentially an octree is a tree data structure created from the partitioning of 3D space by recursively subdividing it into eight octants ie blocks are created by dividing volumes that are intersected by surfaces until an appropriate resolution is reached The implementation of an octree is an efficient and flexible framework for the assessment of stope performance which retains spatial information and is an essential feature to enable the assessment of factors that influence stope performance
An example of this type of stope performance assessment is shown in Figure 3 A stope CMS and design survey is used to create the subdivision of an octree
(left) These octree blocks are assessed with respect to design and CMS surfaces to determine if they are volumes of underbreak (centre) and overbreak (right)
The octree format lends itself to less conventional methods of assessing stope performance Figure 4 illustrates preliminary work that explores spatial characteristics of stope design and performance Shown in this figure (right) is the result of an algorithm which automatically detects the lsquouniquersquo straight angled and domed faces of a stope design Shown left is a projection map for a lsquouniquersquo face This plot shows the distance between CMS and design surfaces in a direction normal to the design survey This plot highlights the areas and severity of overbreak (positive distances) and underbreak (negative distances)
Areas plotted as blue are underbreak red are overbreak and green are mined to design
Concluding remarksStope design and performance
assessment has not significantly progressed despite the economics of mining being intrinsically linked to ore recovery and dilution Stope surveying data allows improvements to be made when assessing stope performance particularly when assessing the amount of underbreak and the development of probabilistic methods of stope design that optimise value
Previous research assessed stope performance at BHP Olympic Dam and showed that by considering operational and design factors in addition to
Figure 3 An octree sub-division of stope CMS and design surveys (left) and octree blocks which are volumes of underbreak (centre) and overbreak (right)
UNDERGROUND
Australian Centre for Geomechanics | December 2017 Newsletter22
traditional measures overbreak and underbreak outcomes can be improved The current stope reconciliation project will further develop tools to assess the influence of factors on stope performance and probabilistic stope design Initial work has focused on survey quality developing a general assessment framework and developing exploratory tools that characterise stope design and performance
Details about the ACG Stope Reconciliation and Optimisation Project are available at wwwacguwaeduauacg-research
Figure 4 Right ndash results of an algorithm which automatically detects the lsquouniquersquo straight angled and domed faces of a stope design Left ndash a projection plot shows the distance between CMS and design surfaces in a direction normal to the design survey
Dr Kyle Woodward
Australian Centre for Geomechanics Australia
The ACG acknowledges the following Stope Reconciliation and Optimisation Project sponsors
bull Agnico Eagle Mines Ltd Canadabull BHP Olympic Dambull Glencore Mount Isa Mines
bull Gold Fields Australia Pty Ltd Granny Smith
bull Hecla Mining Company Canadabull IAMGOLD Corporation Canada
bull MMG Limitedbull Minerals Research Institute of Western
Australia
12th International Conference on Mine Closure3ndash7 September 2018 | KUBUS Leipzig | Leipzig Germany
The Mine Closure 2018 Conference will be a multidisciplinary global forum for exchanging views and exploring ideas to aid new mines to operate with closure
in mind and support old sites to be closed economically whilst minimising environmental and social impacts
The conference host is Bergakademie Freiberg This prestigious university was founded in 1756 and is the oldest existing montane educational institution in
the worldLeipzig is located in the centre of one of Europes largest mine closure programmes with many examples of mine rehabilitation that offer new
opportunities for regional development
wwwmineclosure2018com
Conference Themesbull Legal financial socio-economical and
organisational aspectsbull Planning modelling and monitoringbull Mine closure case studiesbull Mine closure and mining
infrastructurebull Mine flooding balancing of
groundwater deficits and pit lakesbull Hydrogeochemistry acid mine
drainage and treatmentsbull Geotechnical aspectsbull Biodiversity and ecological aspectsbull Handling of contamination and soil
formationbull Aftercare marketing reorganisation
of land geotourism
Host Organisation
M I N E C L O S U R E 2 0 1 8
PASTE amp THICKENED TAILINGS
Australian Centre for Geomechanics | December 2017 Newsletter 23
IntroductionAttempts to improve the dewatering
behaviour of tailings through the addition of polymers at the point of discharge appear to have been first attempted in the early 1980s on coal tailings (Backer amp Busch 1981 Stewart et al 1986) Significant interest has developed more recently with a variety of applications on a number of tailings types over the past 15 years (Jeeravipoolvarn et al 2009 Riley et al 2015 Cooling amp Beveridge 2015) Terminology for this technology varies with it having been referred to as inline flocculation secondary flocculation and polymer treatment Herein it is referred to as polymer treatment (PT)
While initial impetus for polymer application is generally focused on rapid initial water release reduction in particle segregation and near-surface strength gain (ie for equipment access) implementation of PT can have ongoing effects on the geotechnical behaviour of tailings This is of importance with respect to the stability of the tailings storage facility (TSF) should the strength of PT tailings be relied upon when utilised in upstream raising or should they form part of a steepened beach without containment Further PT effects on ongoing consolidation behaviour will impact how a TSF consolidates over time
In terms of assessing the geotechnical effects of PT mature fine tailings (MFT) deposits are likely those that have received the greatest attention (Jeeravipoolvarn et al 2009 Beier et al 2013 Gholami amp Simms 2015) The oil sand MFT deposits are of significant area and extent exhibit low dewatering rates and without some form of treatment are very soft thus making covering difficult As such the potential for PT to accelerate and increase water release and thus surficial tailings strength gain has been studied extensively While the MFT research has led to major contributions to our understanding of the effects of PT MFT tailings are a unique material type and hence the applicability of this experience to other materials is unknown Further a number of key areas such as effects of PT on critical state rate effects of shear and behaviour of penetrometers in PT materials have received limited attention to date
To investigate some of the issues outlined between 2011 and 2014 a series of laboratory and centrifuge tests were carried out on a low plasticity slurry in an untreated (UT) and PT state at The University of Western Australia (UWA)
with financial support from the Australian Centre for Geomechanics (ACG) This work was summarised in three journal papers (Reid amp Fourie 2016 2017a 2017b) and two conference papers (Reid amp Fourie 2015 Reid et al 2015) This article provides a summary of the major outcomes of this research project
Material developmentFor the purposes of this research
project a synthetic slurry was developed comprising laboratory standard sand silt and kaolin clays mixed such that the resulting composite had similar gradation and plasticity to many tailings considered for PT A synthetic material was developed for this study rather than an actual tailings as it was important that essentially unlimited quantities of identical material could be produced (particularly for beam centrifuge tests) and to prevent any potential difficulties in obtaining permissions for publication that can occasionally occur when using an actual tailings
After development of the composite slurry BASF Australia Ltd provided assistance in selecting a polymer and dosage that significantly increased dewatering rates with high molecular weight polyacrylamide polymer Rheomax ETD DPW 1687 selected on this basis at an application rate of 500 g of polymer per tonne of dry solids
In addition to the UT and PT samples a sheared PT material (PT-S) was created
by preparing a batch of PT sample which was then sheared for 5 min using a plaster mixer This batch was created to enable some limited assessment of the effects of shearing during deposition andor flow on a beach on resulting geotechnical behaviour as shearing has been shown to reduce the effects of PT on MFT (Jeeravipoolvarn et al 2014)
Study methodsLaboratory
A series of laboratory element tests were carried out on both UT and PT specimens using slurry consolidometer triaxial (K0 and isotropic) and monotonic and cyclic direct simple shear (DSS) tests These tests were used to estimate consolidation behaviour shear strength critical state line (CSL) location and cyclic behaviour
To prepare samples for testing material was either poured directly into the testing device (slurry consolidometer) or firstly one-dimensionally consolidated in a cylinder then extruded and trimmed for subsequent testing (triaxial and DSS)
CentrifugeWhile laboratory element testing
enables direct comparison of material behaviour under known stress conditions in actual tailings practice it is more typical to initially characterise a deposit by means of penetrometer testing The cone penetration test with piezometer included (CPTu) is by far the most common
Effects of polymer treatment on geotechnical properties of a low-plasticity slurryby Dr David Reid and Professor Andy Fourie The University of Western Australia Australia
Figure 1 Miniature T-bar just prior to commencing penetration in PT material
PASTE amp THICKENED TAILINGS
Australian Centre for Geomechanics | December 2017 Newsletter24
penetrometer test used in tailings while full-flow penetrometers such as the ball penetrometer are increasingly finding application in soft tailings deposits (Wells amp Kaminsky 2015 Reid 2016) To enable penetrometer testing of two deposits with and without PT beam centrifuge testing was conducted The beam centrifuge is a
device within which a vessel containing soil is spun at significantly higher acceleration than normal gravity This enables a soil depth of ~200 mm within the centrifuge to exhibit the same stress field as a 20 m deep deposit Various tests and observations can then be made
While field-scale comparisons of UT
and PT would be preferable to centrifuge testing a true comparison of field-scale deposits would require a significant quantity of tailings to be deposited with identical index properties into two discrete areas This is likely to be impractical to achieve in any full scale scenario
The University of Western Australiarsquos 36 m diameter beam centrifuge was used in this study to enable miniature penetrometer (CPTu and T-Bar) testing on UT and PT samples The material was prepared in a similar way to the laboratory samples except on much larger scale Once spinning within the centrifuge a series of miniature CPTu and T-bar penetrometer tests were carried out Different penetration rates were used to enable assessment of the effects of drainage and shear rate on the results Dissipation tests were carried out as part of CPTu probing Figure 1 shows model preparation of the PT material with a T-bar positioned for a sounding
ResultsConsolidation behaviour
The results of consolidation testing are summarised in Figures 2 and 3 The testing indicated that the PT and PT-S materials exhibited a looser final dry density across the range of stresses tested than the UT material Alternatively permeability values for PT material were as much as an order of magnitude higher than UT while PT-S exhibited a permeability between that of UT and PT
The results from laboratory consolidation testing dissipation tests carried out during miniature CPTu probing and the rate of self-weight consolidation during centrifuge ramp-up are synthesised in Figure 4 The results are generally consistent with PT showing much higher rates of consolidation (consistent with higher permeability) The materials are only slightly anisotropic with respect to rate of consolidation with chcv ratios of approximately 14
That application of PT could significantly affect fabric and consolidation behaviour of a slurry with clay mineralogy should not be surprising eg changes to consolidation behaviour as significant as those shown here have previously been indicated merely from changing the pore fluid chemistry of a clay slurry (Wang amp Siu 2006 Sachan amp Penumadu 2007) While the lower final density resulting from PT is not a positive outcome in itself the effect of changes to consolidation behaviour on the densities achieved in a tailings deposit is more complicated as discussed subsequently in this article
Shear behaviourThe end points of each triaxial test on
PT and UT samples and the CSLs inferred are summarised as a state diagram in
Figure 2 Dry density versus vertical effective stress comparison slurry consolidometer results
Figure 3 Permeability versus vertical effective stress comparison slurry consolidometer results
Figure 4 Coefficient of consolidation estimates from laboratory and centrifuge
PASTE amp THICKENED TAILINGS
Australian Centre for Geomechanics | December 2017 Newsletter 25
Figure 5 The triaxial testing indicated a consistent difference between the UT and PT CSLs across a wide range of effective stresses For each material different triaxial test types all tended towards the same CSL The clear difference of the CSL between PT and UT is of significant importance when considering the application of critical state-based methods to assess the stability of thickened tailings stacks (Li et al 2009) should such stacks employ PT
Figure 6 presents the undrained strength ratio results for DSS tests carried out at a range of strain rates Despite the varying strain rates each test was carried out under constant volume ie approximately undrained conditions PT samples are seen to exhibit slightly greater strain rate sensitivity It is interesting to consider this result in the context of hand shear vane testing of PT trial deposits which would typically be sheared at high strain rate Although higher PT strengths have been seen in such testing (Beier et al 2013 Cooling amp Beveridge 2015) part of the observed difference may be a function of strain rate dependency This is an important consideration as the hand shear vane is often the most common tool used to characterise thin depths of PT material in trial deposits
The post-cyclic strength for a series of UT and PT tests are summarised in Figure 7 suggesting a very similar decay in undrained strength ratio for the two materials under a given amount of cyclic straining This suggests that the PT material at least in a post-cyclic loading scenario does not appear to be more brittle than UT material
Centrifuge penetrometer testingFigure 8 presents normalised
penetration resistance (Q) measured from CPT and T-bar tests at a range of dimensionless penetration velocities (V) (Finnie amp Randolph 1994) The UT material shows behaviour typical of a contractive clayndashsand mixture with low penetration resistances during high rates of penetration when excess pore pressures are generated during probing (Jaeger et al 2010) At lower velocities Q is seen to increase as the penetration process approaches drained conditions Alternatively PT material gives a relatively consistent penetration resistance across the range of V values applied This may be a result of the higher permeability of the PT material resulting in less excess pore pressure generation However at high rates of penetration PT material was seen to exhibit dilative behaviour under probing contrary to the expected behaviour of the material from laboratory element tests
Figure 9 summarises the results of CPT probes in a QndashFr soil type plot (Robertson 1990) This enables comparison of the inferred dilativecontractive state
of the material and the general soil type suggested from the CPT data channels The CPT results give drastically different results for the UT and PT samples when viewed in this context For example PT plots as having lower compressibility to UT material ndash the opposite of the laboratory results
for the two materials Although extensive examination of the implications of the QndashFr results is beyond the scope of this article it is clear that care is required when using the CPT to classify a PT deposit for undrained strength or to determine in situ state
Figure 5 State diagram and inferred CSLs
Figure 6 Rate effects in DSS shearing
Figure 7 Post-cyclic strength behaviour
PASTE amp THICKENED TAILINGS
Australian Centre for Geomechanics | December 2017 Newsletter26
The general results seen in centrifuge testing may be similar to those seen in one field-scale comparison of CPT probing through PT and UT material (da Silva 2011) In that example CPT probes through PT material showed much higher tip resistances which may have been a result primarily of increased drainage around the cone rather than an actual increase in strength or a denser state This confirms that great care is required in the use of penetration tests to obtain undrained shear strengths or state estimates in PT material
Consolidation modelling The realised average density within
a tailings deposit which is often the parameter of greatest relevance to an operator is a function of more than simply the final dry density under a given vertical effective stress Rather it is also affected by hydraulic conductivity ie rate of consolidation of the deposited material and the rate at which tailings are deposited into a given area
To enable comparison of the behaviour of idealised PT and UT tailings deposition the finite strain consolidation code CONDES0 (Yao amp Znidarcic 1997) was used Model parameters were based on test data previously presented (Figures 2 and 3) The CONDES0 code enables finite strain consolidation modelling of one-dimensional columns under different material placement rates Therefore models can be run with different rates of new material being added to the model per unit time ie different rates of rise (RoR) An important consideration regarding RoR should be noted in this context ndash specifically that there are different forms of RoR which require careful consideration when making comparisons in finite strain codes Three forms of RoR are considered herein as follows
bull Slurry RoR This represents the rate at which the deposited slurry would increase in height were no water release to occur (ie the material remained in a slurry state indefinitely) While a generally unrealistic scenario the slurry RoR is the required starting point for developing comparison models as it is only a function of cell area deposition rate and slurry density
bull Settled RoR The rate at which the tailings level would increase were the material to undergo hindered settling but no further consolidation As typical finite strain models including CONDES0 operate in an effective stress framework they are incapable of modelling the behaviour of slurries prior to the development of effective stress Therefore settled RoR forms the input to a finite difference code
bull Realised RoR This is the RoR value
observed on an actual tailings deposit and is also the value typically being discussed when referring to RoR in tailings practice Factors that affect realised RoR include the rate of deposition cell area consolidation characteristics of the tailings and drainage conditionsThe results of average dry density in
an idealised tailings deposit are presented in Figure 10 for a model assuming no
bottom drainage The data is presented as the average dry density in the model after a period of five years where the slurry RoR is varied from 5ndash40 myear At low slurry RoR the UT material achieves higher dry densities as consolidation keeps up with the deposition rate and therefore the higher final dry density of UT material governs what is achieved However as RoR increases the higher hydraulic conductivity of PT material increases in
Figure 9 Results summarised in a CPT classification chart
Figure 8 Dimensionless penetration resistance versus dimensionless penetration velocity
Drained penetration
Partially drained penetration
Undrained penetration
PASTE amp THICKENED TAILINGS
Australian Centre for Geomechanics | December 2017 Newsletter 27
importance eventually leading to higher average densities This difference becomes significant at high RoR Similar results were indicated by Znidarcic et al (2015) for MFT
Primary outcomes and future areas
The primary outcomes of the study discussed in this article are outlined as follows
bull Polymer treatment affected consolidation behaviour in two distinct ways (a) resulting in lower final densities at a given vertical effective stress while (b) resulting in higher permeability at a given density Numerical modelling of the effect of these changes on achievable dry density in an idealised storage area indicated that the potential benefits of PT with respect to average density and water release were manifested at high slurry RoR values
bull The study provided clear evidence that PT changed the location of the materialrsquos CSL This is an important consideration given potential application of PT in achieving steepened tailings beaches Application of critical state methods to assess the liquefaction susceptibility
of such beaches should include checks on the effect of PT on the CSL Publication of additional data for other materials of such observations would be of benefit
bull Significant shearing of the material after treatment resulted in a substantial reduction in some of the geotechnical effects of PT It is noted that the only sheared samples tested in this study were heavily sheared in order to represent a fully sheared case Further testing of PT tailings under different magnitudes of shear to link to behaviour down the beach would be beneficial
bull PT material exhibited slightly higher sensitivity to increased strain rates in terms of undrained shear strength This suggests caution must be applied when interpreting the results of hand shear vane tests which are often used to compare the behaviour of UT to PT material in trial-scale deposits
bull PT material exhibited higher penetration resistances in centrifuge testing This is despite the PT material having similar shear strengths when measured in laboratory element tests The increased drainage rates of PT material appear to be a
major contributor to the different penetrometer responses This is important to consider when comparing the results of the penetration tests of UT and PT deposits or when using the CPTu to determine in situ strengths and state of PT deposits
bull Consolidation modelling indicates that the rate of deposition ie slurry RoR has a major effect on whether PT will result in higher dry densities in a full-scale deposit At high deposition rates the higher permeability values of the PT material outweigh its lower final densities such that the average dry density achieved during deposition is higher than UT material
AcknowledgementsThe authors acknowledge the financial
assistance of the ACG the assistance of UWA laboratory centrifuge personnel and polymer treatment advice provided by BASF Australia Ltd
Article references are available at acguwaeduaunewsletters-annual-reports
Figure 10 Consolidation modelling summary
Dr David Reid
The University of Western Australia Australia
Professor Andy Fourie
The University of Western Australia Australia
21ST INTERNATIONAL SEMINAR ON
PASTE AND THICKENED TAILINGS11ndash13 APRIL 2018 | RENDEZVOUS HOTEL PERTH SCARBOROUGH | WESTERN AUSTRALIA
Principal SponsorWWWPASTE2018COM
EARLYBIRD REGISTRATION ENDS
26 FEBRUARY 2018
ACG event schedule
The
ACG
even
t sch
edule
is su
bject
to ch
ange
A u s t r a l i a n C e n t r e f o r G e o m e c h a n i c s | V o l u m e N o 4 6 | D e c e m b e r 2 0 1 7
wwwacguwaeduauevents
2018Static Liquefaction Workshop 6ndash7 March 2018 | Melbourne Australia
Rheology Fundamentals for Slurries and Pastes Workshop 9 April 2018 | Perth Australia
Is the Future Filtered Paste and Thickened Tailings Short Course 10 April 2018 | Perth Australia
21st International Seminar on Paste and Thickened Tailings wwwpaste2018com 11ndash13 April 2018 | Perth Australia
Instrumentation and Slope Monitoring Workshop 9 April 2018 | Seville Spain
InSAR Radar and Emerging Technologies Workshop 10 April 2018 | Seville Spain
Practical Rock Mechanics in Mining Short Course 14ndash16 May 2018 | Perth Australia
Introduction to Mine Seismicity Short Course 17ndash18 May 2018 | Perth Australia
Fourth International Symposium on Block and Sublevel Caving wwwcaving2018com 15ndash17 October 2018 | Vancouver Canada
Ground Support in Cave Mining Workshop 18 October 2018 | Vancouver Canada
Geotechnical Engineering for Open Pit Mines Short Course 23ndash25 October 2018 | Perth Australia
Instrumentation and Slope Monitoring Workshop 26 October 2018 | Perth Australia
Management Operation and Relinquishment of Tailings Storage Facilities 5ndash6 December 2018 | Perth Australia
Australian Centre for Geomechanics | 35 Stirling Hwy (M600) | Crawley Western Australia | Australia 6009Ph +61 8 6488 3300 | info-acguwaeduau | wwwacguwaeduau
FOURTH INTERNATIONAL SYMPOSIUM ON
BLOCK AND SUBLEVEL CAVING 15ndash17 OCTOBER 2018 | VANCOUVER CANADA
wwwcaving2018comABSTRACTS DUE 19 FEBRUARY 2018
SUNDAY | 14 OCTOBER
MONDAY | 15 OCTOBER
TUESDAY | 16 OCTOBER
WEDNESDAY | 17 OCTOBER
THURSDAY | 18 OCTOBER
FRIDAY | 19 OCTOBER
SRK Cave Mining Forum
Fourth International Symposium on Block and Sublevel Caving
ACG Ground Support in Cave
Mining Workshop
Site Visit to New Afton Mine
Symposium Dinner
Australian Centre for Geomechanics 2014 mXrap Australian Centre for Geomechanics Perth httpwwwmxrapcomBeck D Levkovitch V amp Simser B 2012 lsquoExplicit dynamic simulation for probabilistic forecasting of fault slip and rock mass seismic
potentialrsquo in Y Potvon (ed) Proceedings of the Sixth International Seminar on Deep and High Stress Mining Australian Centre for Geomechanics Perth pp 373ndash388
Hudyma M 2005 An introduction to mine seismicity seminar notes Australian Centre for Geomechanics PerthMcGaughey J 2014 lsquoA framework for 4D quantitative back-analysis and estimation of geotechnical hazard potential in minesrsquo Proceedings
of Geohazards 6 Canadian Geotechnical Society RichmondMendecki A 1993 lsquoReal time quantitative seismology in minesrsquo in RP Young (ed) Proceedings of the 3rd International Symposium on
Rockbursts and Seismicity in Mines AA Balkema Rotterdam pp 287ndash295Simser B amp Pritchard C 2010 lsquoObservational ground control at Xstratarsquos Nickel Rim South Mine Sudbury Ontariorsquo Proceedings of the
Canadian Institute of Mining Operatorrsquos Conference Canadian Institute of Mining Metallurgy and Petroleum Westmount Simser B Jalbout A amp Pakalnis R 2014 lsquoStability graph method for open stope design ndash case histories from two Sudbury Basin minesrsquo
Proceedings of the 1st International Conference on Applied Empirical Design Methods in Mining International Society for Rock Mechanics Lisbon
Simser B 2013 lsquoSeismic monitoring at Nickel Rim South Minersquo Proceedings of the 6th Microseismic Symposium and Workshop Engineering Seismology Group Kingston
van Aswegen G amp Butler AG 1993 lsquoApplications of quantitative seismology in South African gold minesrsquo in RP Young (ed) Proceedings of the 3rd International Symposium on Rockbursts and Seismicity in Mines AA Balkema Rotterdam pp 261ndash266
Rock mechanics tools for mining in high stress ground conditions at Nickel Rim South Mineby Ali Jalbout Goldcorp Inc Canada and Brad Simser Sudbury Integrated Nickel Operations A Glencore Company Canada
References from page 1ndash8 click here to return to article
References
Continued overleaf
Andrews SJ 1998 lsquoStratigraphy and depositional setting of the upper McNamara Group Lawn Hills region Northwest Queenslandrsquo Economic Geology vol 93 pp 1132ndash1152
Broadbent GC Andrews SJ amp Kelso IJ 2002 lsquoA decade of new ideas geology and exploration history of the Century Zn-Pb-Ag deposit northwestern Queensland Australiarsquo Society of Economic Geologists Special Publication 9 pp 119ndash140
Cawood F amp Stacey T 2006 lsquoSurvey and geotechnical slope monitoring considerationsrsquo The Journal of the South African Institute of Mining and Metallurgy vol 106 pp 495ndash502
Goodman RE Taylor RL amp Brekke TL 1968 lsquoA model for the mechanics of jointed rocksrsquo Journal of Soil Mechanics and Foundations Division vol 94 no 3 pp 634ndash659
Hammah R Yacoub T Corkum B amp Curran J 2008 lsquoThe practical modelling of discontinuous rock masses with finite element analysisrsquo Proceedings of the 42nd US Rock Mechanics Symposium American Rock Mechanics Association Alexandria
Harries N Noon D amp Rowley K 2006 lsquoCase studies of slope stability radar used in open cut minesrsquo Stability of Rock Slopes in Open Pit Mining and Civil Engineering Situations pp 335ndash342
Hutchison BJ Naude S amp Howarth J 2015 lsquoManagement of a toppling failiure wall collapse at the Kanmantoo Copper Mine in South Australiarsquo Proceedings of the 2015 International Symposium on Rock Slope Stability in Open Pit Mining and Civil Engineering The Southern African Institue of Mining and Metallurgy Johannesburg pp 81ndash98
Kurukuk N amp Sweeney E 2012 lsquoSlope stability assessment centuryrsquo Proceedings of the 9th AustraliandashNew Zealand Young Geotechnical Professionals Conference The New Zealand Geotechnical Society Wellington
Little MJ 2006 lsquoSlope monitoring strategy at PPRust open pit operationrsquo Proceedings of the 2016 International Symposium on Stability of Rock Slopes in Open Pit Mining and Civil Engineering The Southern African Institute of Mining and Metallurgy Johannesburg pp 211ndash230
Lynch RA amp Malovichko DA 2006 lsquoSeismology and slope stability in open pit minesrsquo Proceedings of the 2006 International Symposium on Stability of Rock Slopes in Open Pit Mining and Civil Engineering The Southern Africa Institute of Mining and Metallurgy Johannesburg pp 375ndash390
The geotechnical conundrum are surface observations reflecting rock mass behaviour at depthby Dr Michele Salvoni Australia and Professor Phil Dight Australian Centre for Geomechanics Australia
References from page 16ndash19 click here to return to article
References
Continued overleaf
Backer RR amp Busch RA 1981 Fine coal refuse slurry dewatering United States Department of the Interior Bureau of Mines Washington DCBeier N Wilson W Dunmola A amp Sego D 2013 lsquoImpact of flocculation-based dewatering on the shear strength of oil sands fine tailingsrsquo
Canadian Geotechnical Journal vol 50 no 9 pp 1001ndash1007Cooling D amp Beveridge A 2015 lsquoUse of Rheomaxreg ETD technology to thicken bauxite residual slurry during Super Thickener bypassrsquo
in AB Fourie amp RJ Jewell (eds) Paste and Thickened Tailings ndash A Guide 3rd edn Australian Centre for Geomechanics Perth pp 311ndash313Da Silva F 2011 lsquoReducing risks to tailings storage facilities through in-line flocculationrsquo in J Han amp DE Alzamora (eds) Proceedings of
GeoFrontiers 2011 Advances in Geotechnical Engineering American Society of Civil Engineers Reston pp 2937ndash2946Finnie IMS amp Randolph MF 1994 lsquoPunch-through and liquefaction induced failure of shallow foundations on calcareous sedimentsrsquo
Proceedings of the Seventh International Conference on Behavior of Offshore Structures (BOSS 94) Massachusetts Institute of Technology Cambridge pp 217ndash230
Gholami R amp Simms P 2015 lsquoShear behaviour in element testing of polymer amended mature fine tailingsrsquo Proceedings of the 68th Canadian Geotechnical Conference Canadian Geotechnical Society Richmond
Jaeger RA Dejong JT Boulanger RW Low HE amp Randolph MF 2010 lsquoVariable penetration rate CPT in an intermediate soilrsquo in PK Robertson amp PW Maybe (eds) Proceedings of the 2nd International Symposium on Cone Penetration Testing (CPT10)
Jeeravipoolvarn S Scott D Chalaturnyk R amp Shaw B 2014 lsquoEffect of pipeline shear on consolidation properties of oil sands fine tailingsrsquo Proceedings of Tailings and Mine Waste 2014 Information Technology Creative Media Vancouver pp 495ndash506
Jeeravipoolvarn S Scott J amp Chalaturnyk R 2009 lsquoGeotechnical characteristics of laboratory in-line thickened oil sands tailingsrsquo Proceedings of Tailings and Mine Waste 2009 Information Technology Creative Media Vancouver pp 813ndash828
Li AL Been K Ritchie D amp Welch D 2009 lsquoStability of large thickened non-segregated tailings slopesrsquo in RJ Jewell AB Fourie S Barrera and J Wiertz (eds) Proceedings of the 12th International Seminar on Paste and Thickened Australian Centre for Geomechanics Perth pp 301ndash312
Reid D 2016 lsquoEffect of rotation rate on shear vane results in a silty tailingsrsquo in BM Lehane HE Acosta-Martinez and R Kelly (eds) Proceedings of the 5th International Conference on Geotechnical and Geophysical Site Characterisation vol 1 Australian Geomechanics Society St Ives pp 369ndash374
Reid D amp Fourie AB 2015 lsquoEffects of shear on the behaviour of polymer-treated slurriesrsquo in FR Nejad (ed) Proceedings of Tailings and Mine Waste Management for the 21st Century The Australian Institute of Mining and Metallurgy Melbourne pp 215ndash224
Reid D amp Fourie AB 2016 lsquoLaboratory assessment of the effects of polymer treatment on geotechnical properties of low plasticity soil slurryrsquo Canadian Geotechnical Journal vol 53 no 10 pp 1718ndash1730
Effects of polymer treatment on geotechnical properties of a low-plasticity slurryby Dr David Reid and Professor Andy Fourie The University of Western Australia AustraliaReferences from page 23ndash27 click here to return to article
Marques EAG Vargas Jr EDA amp Antunes FS 2005 lsquoA study of the durability of some shales mudrocks and siltstones from Brazilrsquo Geotechnical amp Geological Engineering vol 23 pp 321ndash348
Read J 2007 lsquoPredicting the behaviour and failure of large rock slopesrsquo Proceedings of the 1st Canada-US Rock Mechanics Symposium American Rock Mechanics Association Alexandria
Sainsbury B Sainsbury D amp Hebert Y 2013 lsquoAssessment of the long-term stability of the Stage 8 West Wall Cutback at MMG Centuryrsquo unpublished Itasca internal report Itasca Australia Pty Ltd
Salvoni M 2015 lsquoRock mechanical characterization of the carbonate breccia and black carbonaceous shalesrsquo unpublished Australian Centre for Geomechanics report Australian Centre for Geomechanics Perth
Salvoni M amp Dight PM 2016 lsquoRock damage assessment in a large unstable slope from microseismic monitoring-MMG Century mine (Queensland Australia) case studyrsquo Engineering Geology vol 210 pp 45ndash56
Stacey P 2009 lsquoFundamentals of slope designrsquo in J Read and P Stacey (eds) Guidelines for Open Pit Slope Designrsquo AA Balkema Rotterdam pp 1ndash14
Sweeney E amp Abbott K 2016 lsquoGeotechnical analyses for risk managment of a large scale failure at Century mine Northwest Queenslandrsquo in PM Dight (ed) Proceedings of the First Asia Pacific Slope Stability in Mining Conference Australian Centre for Geomechanics Perth pp 225ndash238
Taylor RK amp Smith TJ 1986 lsquoThe engineering geology of clay minerals swelling shrinking and mudrock breakdownrsquo Clay Minerals vol 21 pp 235ndash260
Walkinshaw J amp Santi P 1996 Chapter 21 Shales and other degradable materials Landslides Investigation and Mitigation TRB Special Report vol 247 pp 555ndash576
Wesseloo J amp Sweby GJ 2008 lsquoMicroseismic monitoring of hard rock mine slopesrsquo in Y Potvin J Carter A Dyskin and R Jeffrey (eds) Proceedings of the First Southern Hemisphere International Rock Mechanics Symposium Australian Centre for Geomechanics Perth pp 433ndash450
Xiao Y-X Feng X-T Hudson JA Chen B-R Feng G-L amp Liu J-P 2016 lsquoISRM suggested method for in situ microseismic monitoring of the fracturing process in rock massesrsquo Rock Mechanics and Rock Engineering vol 49 pp 343ndash369
ReferencesReid D amp Fourie AB 2017a lsquoCentrifuge assessment of the effects of polymer treatment on penetrometer responsersquo International Journal for
Numerical and Analytical Methods in Geomechanics in pressReid D amp Fourie AB 2017b lsquoEffects of polymer treatment on undrained strengths and cyclic behavior of a low-plasticity slurryrsquo Journal of
Geotechnical and Geoenvironmental Engineering vol 143 no 6Reid D Utting L amp Fourie AB 2015 lsquoAssessing the effects of polymer treatment segregation considerationsrsquo Proceedings of Tailings and
Mine Waste 2015 The University of British Columbia VancouverRiley T Reid D amp Utting L 2015 lsquoPolymer-modified tailings deposition ndash ongoing testing and potential storage efficiency opportunitiesrsquo
in RJ Jewell amp AB Fourie (eds) Proceedings of the 18th International Seminar on Paste and Thickened Tailings Australian Centre for Geomechanics Perth pp 139ndash152
Robertson PK 1990 lsquoSoil classification using the cone penetration testrsquo Canadian Geotechnical Journal vol 27 no 1 pp 151ndash158Sachan A amp Penumadu D 2007 lsquoEffect of microfabric on shear behavior of kaolin clayrsquo Journal of Geotechnical and Geoenvironmental
Engineering vol 133 no 3 pp 306ndash318Stewart BM Backer RR amp Busch RA 1986 Thickening Fine Coal Refuse Slurry for Rapid Dewatering and Enhanced Safety report of
investigations United States Department of the Interior Bureau of Mines Washington DCWang YH amp Siu WK 2006 lsquoStructure characteristics and mechanical properties of kaolinite soils II Effects of structure on mechanical
propertiesrsquo Canadian Geotechnical Journal vol 43 no 6 pp 601ndash617Wells PS amp Kaminsky HAW 2015 lsquoSlurry to soil clay behaviour model - using methylene blue to cross the processgeotechnical engineering
dividersquo Proceedings of Tailings and Mine Waste 2015 The University of British Columbia VancouverYao D amp Znidarcic D 1997 Crust Formation and Desiccation Characteristics for Phosphatic Clays users manual for computer program
CONDES0 Florida Institute of Phosphate Research Polk CountyZnidarcic D Adkins S Utting L amp Catling M 2015 lsquoRheomax ETD technology a laboratory study of application performance and
associated geotechnical characteristics for polymer assisted tailings deposition of oil sands MFTrsquo Proceedings of Tailings and Mine Waste 2015 The University of British Columbia Vancouver pp 508ndash520

OPEN PIT
Australian Centre for Geomechanics | December 2017 Newsletter 19
of weathered rock can create a toppling mechanism on the CBX with progressive shearing at the contact between the shale and breccia units and progressive damage at 30ndash40 m below the pit surface The weathered material has a time-dependent type of behaviour and is subjected to continuous unravelling associated with rapid acceleration triggered by the rainfall
ConclusionLarge unstable rock slopes can
pose significant hazards for personnel and operations in open pit minesroad cuttings A complete understanding of failure mechanisms and the state of the rock mass requires analysis of a comprehensive dataset However in
many cases information is limited to the surface displacement and engineers can only make assumptions about the rock mass behaviour at depth Although in many cases rigid block movement is a reasonable assumption in others it can lead to misleading interpretationnumerical analysis of the instability mechanisms
The MMG Century mine case study is an excellent example of how the combination of microseismic monitoring and critical thinking lead to a much better understanding as to how the slope was behaving The outcomes of the project not only provide an insight into the possible applications of microseismic data in open pits but also help reveal a complex
mechanism where slope deformations mask minimal damage at depth
Article references are available at acguwaeduaunewsletters-annual-reports
Dr Michele Salvoni
Australia
Figure 5 Final numerical analysis results with the slope affected by a 10 m weathered zone with a plastic behaviour and progressive shearing developing at depth where microseismic data were recorded
The ACG team congratulates Michele on
the successful submission of his PhD thesis Rock Damage
Assessment in a Large Unstable Slope from Microseismic
Monitoring ndash MMG Century Mine Case Study
We wish him all the best in his future endeavours
These ACG open pit mining workshops will accompany the 2018 International Symposium on Slope Stability in Open Pit Mining and Civil Engineering at the XIV International
Congress for Energy and Resource Mining in Seville Spain 11ndash13 April 2018
To register please visitwwwcongresomineriasevilla2018orginternacional-ingles
ACG-Workshophtml
ACG Instrumentation and Slope Monitoring Workshop amp InSAR Radar and Emerging
Technologies Workshop9 amp 10 April 2018 | Bespoke Workshop Halls Barceloacute
Conference Centre | Seville Spain
UNDERGROUND
Australian Centre for Geomechanics | December 2017 Newsletter20
Stope reconciliationby Dr Kyle Woodward Australian Centre for Geomechanics Australia
BackgroundMany underground mines around the
world use an open stope mining method The profitability of open stope mining depends on the accuracy of the stope design and the execution of the mining process The value of a stope is intrinsically linked to success of ore recovery but it is also related to the amount of unintentional dilution Stope performance is discussed in terms of underbreak (UB) ie ore not extracted and overbreak (OB) ie waste extracted The maximum value obtainable for a stope will be obtained from stopes with minimum overbreak and minimum underbreak
Open stope design approaches and tools have not evolved significantly since the 1980s and industry still extensively uses the stability graph method (Mathews et al 1980 Potvin 1988) An exception is the concept of Equivalent Linear Overbreak Sloughing (ELOS) which was developed by Clark and Pakalnis (1997) It was initially used to assess overbreak in narrow vein mining Capes (2009) extended the original Clarkrsquos database applied the methodology to open stope design and included some capability to forecast stope overbreak For most mine sites the robust statistical methods for forecasting overbreak are practically non-existent
Stopes with underbreak will leave behind unrecoverable ore and this can be as detrimental to stope value and mine economics as overbreak Existing assessments of open stope performance do not consider the evaluative estimation and forecasting of underbreak (Potvin et al 2015) Potvin et al (2016) highlight that the optimisation of overbreak and underbreak are generally conflicting and efforts that focus on reducing overbreak may increase the amount of underbreak This emphasises the importance of having good stope reconciliation tools and procedures that can translate into future stope performance optimisation
Techniques of underground surveying have made significant advancements when determining mined volumes most notably with the application of the cavity monitoring system (CMS) (Miller et al 1992) At most mines a wealth of data is created by accurate and routine stope surveying techniques The full potential of this data is far from being realised This data allows for the probabilistic forecasting and comprehensive assessment of stope performance and ultimately the optimisation of mining economics and the utilisation of a finite resource
A pilot case study - Olympic Dam (BHP)
Exploratory research at BHPrsquos Olympic Dam has shown that the concept of stope reconciliation can have a significant impact on the overbreak and underbreak outcomes at the mine (Potvin et al 2015 2016)
Figure 1 shows historical stope performance of Olympic Dam with respect to overbreak underbreak and a combined measure (Potvin et al 2016)
The previous work at Olympic Dam showed that the amount of overbreak was a function of traditional design parameters (hydraulic radius and the stability number) but also strongly correlated to the orientation of stope walls and the blasting pattern used The amount of underbreak was correlated to the drilling pattern and whether blasting was against a wall of cemented fill Other correlations were found between overbreak underbreak and the slot opening strategies
This research shows that in addition
to traditional measures operational and design factors can contribute to overbreak and underbreak outcomes This information can be used in the assessment of future stope performance and to forecast the potential for overbreak and underbreak
Stope reconciliation project Project overview
The current iteration of the stope reconciliation project has been supported by six sponsor sites along with the Minerals Research Institute of Western Australia (MRIWA) This project will build upon previous results at Olympic Dam to develop tools that enable a probabilistic approach to stope design This will involve the development of improved stope performance assessment and the investigation of factors that affect overbreak and underbreak
In practice possible influencing factors will be assessed from a range of data including stope design (eg stope
Figure 1 Historical underbreak and overbreak stope performance at Olympic Dam
Figure 2 An erroneously designed wireframe (left) and an automatically corrected wireframe (right)
UNDERGROUND
Australian Centre for Geomechanics | December 2017 Newsletter 21
dimensions stability number) operational information (eg drilling pattern slot opening adjacent stope fill walls) and geotechnical information The technology transfer to site will occur via mXrap software development and will aim to minimise manual data manipulation Conceptually given a stopersquos CMS and design the stope performance statistics will be automatically generated with a mXrap stope optimisation app Furthermore an additional mXrap app will provide a probabilistic forecast of overbreak and underbreak for a given stope design historical site-specific stope performance and factors that influence performance
Preliminary project progressThe assessment of stope performance
is underpinned by the quality of data Initial considerations of data quality focus on the quality of surveys specifically stope CMS and designs Surveys can be constructed with only visualisation in mind and may contain features that influence subsequent calculations An ideal CMS or design survey will be
bull a single surface representing an individual stope
bull consistent ie no sharp edges small ledges and other unrealistic features
bull a realistic and consistent resolutionbull free from self-intersectionsbull free from internal or external volumes
surfaces andbull a closed surface ie watertight
Survey quality is ideally considered during the CMS and design procedures to prevent automated approaches erroneously reinterpreting surveys without site-specific
information As part of preliminary work on survey quality a mXrap app was created to explore and address some of the more basic survey quality concerns Figure 2 gives an example of a common error (nodes not being lsquosnappedrsquo together) and shows the erronous design wireframe (left) and an automatically corrected wireframe (right)
The selection of a method to find the volumes associated with 3D surfaces also must consider how additional information might be integrated in a general assessment framework A familiar concept and format for geologicalgeotechnical information is a block model whereby rock properties are assigned to specific volumes An extension of this concept is not to use blocks of a uniform size but instead to use smaller blocks where more information is available and extra detail is warranted
A model of the volumes associated with stope CMS and designs can be achieved by the creation of an octree Essentially an octree is a tree data structure created from the partitioning of 3D space by recursively subdividing it into eight octants ie blocks are created by dividing volumes that are intersected by surfaces until an appropriate resolution is reached The implementation of an octree is an efficient and flexible framework for the assessment of stope performance which retains spatial information and is an essential feature to enable the assessment of factors that influence stope performance
An example of this type of stope performance assessment is shown in Figure 3 A stope CMS and design survey is used to create the subdivision of an octree
(left) These octree blocks are assessed with respect to design and CMS surfaces to determine if they are volumes of underbreak (centre) and overbreak (right)
The octree format lends itself to less conventional methods of assessing stope performance Figure 4 illustrates preliminary work that explores spatial characteristics of stope design and performance Shown in this figure (right) is the result of an algorithm which automatically detects the lsquouniquersquo straight angled and domed faces of a stope design Shown left is a projection map for a lsquouniquersquo face This plot shows the distance between CMS and design surfaces in a direction normal to the design survey This plot highlights the areas and severity of overbreak (positive distances) and underbreak (negative distances)
Areas plotted as blue are underbreak red are overbreak and green are mined to design
Concluding remarksStope design and performance
assessment has not significantly progressed despite the economics of mining being intrinsically linked to ore recovery and dilution Stope surveying data allows improvements to be made when assessing stope performance particularly when assessing the amount of underbreak and the development of probabilistic methods of stope design that optimise value
Previous research assessed stope performance at BHP Olympic Dam and showed that by considering operational and design factors in addition to
Figure 3 An octree sub-division of stope CMS and design surveys (left) and octree blocks which are volumes of underbreak (centre) and overbreak (right)
UNDERGROUND
Australian Centre for Geomechanics | December 2017 Newsletter22
traditional measures overbreak and underbreak outcomes can be improved The current stope reconciliation project will further develop tools to assess the influence of factors on stope performance and probabilistic stope design Initial work has focused on survey quality developing a general assessment framework and developing exploratory tools that characterise stope design and performance
Details about the ACG Stope Reconciliation and Optimisation Project are available at wwwacguwaeduauacg-research
Figure 4 Right ndash results of an algorithm which automatically detects the lsquouniquersquo straight angled and domed faces of a stope design Left ndash a projection plot shows the distance between CMS and design surfaces in a direction normal to the design survey
Dr Kyle Woodward
Australian Centre for Geomechanics Australia
The ACG acknowledges the following Stope Reconciliation and Optimisation Project sponsors
bull Agnico Eagle Mines Ltd Canadabull BHP Olympic Dambull Glencore Mount Isa Mines
bull Gold Fields Australia Pty Ltd Granny Smith
bull Hecla Mining Company Canadabull IAMGOLD Corporation Canada
bull MMG Limitedbull Minerals Research Institute of Western
Australia
12th International Conference on Mine Closure3ndash7 September 2018 | KUBUS Leipzig | Leipzig Germany
The Mine Closure 2018 Conference will be a multidisciplinary global forum for exchanging views and exploring ideas to aid new mines to operate with closure
in mind and support old sites to be closed economically whilst minimising environmental and social impacts
The conference host is Bergakademie Freiberg This prestigious university was founded in 1756 and is the oldest existing montane educational institution in
the worldLeipzig is located in the centre of one of Europes largest mine closure programmes with many examples of mine rehabilitation that offer new
opportunities for regional development
wwwmineclosure2018com
Conference Themesbull Legal financial socio-economical and
organisational aspectsbull Planning modelling and monitoringbull Mine closure case studiesbull Mine closure and mining
infrastructurebull Mine flooding balancing of
groundwater deficits and pit lakesbull Hydrogeochemistry acid mine
drainage and treatmentsbull Geotechnical aspectsbull Biodiversity and ecological aspectsbull Handling of contamination and soil
formationbull Aftercare marketing reorganisation
of land geotourism
Host Organisation
M I N E C L O S U R E 2 0 1 8
PASTE amp THICKENED TAILINGS
Australian Centre for Geomechanics | December 2017 Newsletter 23
IntroductionAttempts to improve the dewatering
behaviour of tailings through the addition of polymers at the point of discharge appear to have been first attempted in the early 1980s on coal tailings (Backer amp Busch 1981 Stewart et al 1986) Significant interest has developed more recently with a variety of applications on a number of tailings types over the past 15 years (Jeeravipoolvarn et al 2009 Riley et al 2015 Cooling amp Beveridge 2015) Terminology for this technology varies with it having been referred to as inline flocculation secondary flocculation and polymer treatment Herein it is referred to as polymer treatment (PT)
While initial impetus for polymer application is generally focused on rapid initial water release reduction in particle segregation and near-surface strength gain (ie for equipment access) implementation of PT can have ongoing effects on the geotechnical behaviour of tailings This is of importance with respect to the stability of the tailings storage facility (TSF) should the strength of PT tailings be relied upon when utilised in upstream raising or should they form part of a steepened beach without containment Further PT effects on ongoing consolidation behaviour will impact how a TSF consolidates over time
In terms of assessing the geotechnical effects of PT mature fine tailings (MFT) deposits are likely those that have received the greatest attention (Jeeravipoolvarn et al 2009 Beier et al 2013 Gholami amp Simms 2015) The oil sand MFT deposits are of significant area and extent exhibit low dewatering rates and without some form of treatment are very soft thus making covering difficult As such the potential for PT to accelerate and increase water release and thus surficial tailings strength gain has been studied extensively While the MFT research has led to major contributions to our understanding of the effects of PT MFT tailings are a unique material type and hence the applicability of this experience to other materials is unknown Further a number of key areas such as effects of PT on critical state rate effects of shear and behaviour of penetrometers in PT materials have received limited attention to date
To investigate some of the issues outlined between 2011 and 2014 a series of laboratory and centrifuge tests were carried out on a low plasticity slurry in an untreated (UT) and PT state at The University of Western Australia (UWA)
with financial support from the Australian Centre for Geomechanics (ACG) This work was summarised in three journal papers (Reid amp Fourie 2016 2017a 2017b) and two conference papers (Reid amp Fourie 2015 Reid et al 2015) This article provides a summary of the major outcomes of this research project
Material developmentFor the purposes of this research
project a synthetic slurry was developed comprising laboratory standard sand silt and kaolin clays mixed such that the resulting composite had similar gradation and plasticity to many tailings considered for PT A synthetic material was developed for this study rather than an actual tailings as it was important that essentially unlimited quantities of identical material could be produced (particularly for beam centrifuge tests) and to prevent any potential difficulties in obtaining permissions for publication that can occasionally occur when using an actual tailings
After development of the composite slurry BASF Australia Ltd provided assistance in selecting a polymer and dosage that significantly increased dewatering rates with high molecular weight polyacrylamide polymer Rheomax ETD DPW 1687 selected on this basis at an application rate of 500 g of polymer per tonne of dry solids
In addition to the UT and PT samples a sheared PT material (PT-S) was created
by preparing a batch of PT sample which was then sheared for 5 min using a plaster mixer This batch was created to enable some limited assessment of the effects of shearing during deposition andor flow on a beach on resulting geotechnical behaviour as shearing has been shown to reduce the effects of PT on MFT (Jeeravipoolvarn et al 2014)
Study methodsLaboratory
A series of laboratory element tests were carried out on both UT and PT specimens using slurry consolidometer triaxial (K0 and isotropic) and monotonic and cyclic direct simple shear (DSS) tests These tests were used to estimate consolidation behaviour shear strength critical state line (CSL) location and cyclic behaviour
To prepare samples for testing material was either poured directly into the testing device (slurry consolidometer) or firstly one-dimensionally consolidated in a cylinder then extruded and trimmed for subsequent testing (triaxial and DSS)
CentrifugeWhile laboratory element testing
enables direct comparison of material behaviour under known stress conditions in actual tailings practice it is more typical to initially characterise a deposit by means of penetrometer testing The cone penetration test with piezometer included (CPTu) is by far the most common
Effects of polymer treatment on geotechnical properties of a low-plasticity slurryby Dr David Reid and Professor Andy Fourie The University of Western Australia Australia
Figure 1 Miniature T-bar just prior to commencing penetration in PT material
PASTE amp THICKENED TAILINGS
Australian Centre for Geomechanics | December 2017 Newsletter24
penetrometer test used in tailings while full-flow penetrometers such as the ball penetrometer are increasingly finding application in soft tailings deposits (Wells amp Kaminsky 2015 Reid 2016) To enable penetrometer testing of two deposits with and without PT beam centrifuge testing was conducted The beam centrifuge is a
device within which a vessel containing soil is spun at significantly higher acceleration than normal gravity This enables a soil depth of ~200 mm within the centrifuge to exhibit the same stress field as a 20 m deep deposit Various tests and observations can then be made
While field-scale comparisons of UT
and PT would be preferable to centrifuge testing a true comparison of field-scale deposits would require a significant quantity of tailings to be deposited with identical index properties into two discrete areas This is likely to be impractical to achieve in any full scale scenario
The University of Western Australiarsquos 36 m diameter beam centrifuge was used in this study to enable miniature penetrometer (CPTu and T-Bar) testing on UT and PT samples The material was prepared in a similar way to the laboratory samples except on much larger scale Once spinning within the centrifuge a series of miniature CPTu and T-bar penetrometer tests were carried out Different penetration rates were used to enable assessment of the effects of drainage and shear rate on the results Dissipation tests were carried out as part of CPTu probing Figure 1 shows model preparation of the PT material with a T-bar positioned for a sounding
ResultsConsolidation behaviour
The results of consolidation testing are summarised in Figures 2 and 3 The testing indicated that the PT and PT-S materials exhibited a looser final dry density across the range of stresses tested than the UT material Alternatively permeability values for PT material were as much as an order of magnitude higher than UT while PT-S exhibited a permeability between that of UT and PT
The results from laboratory consolidation testing dissipation tests carried out during miniature CPTu probing and the rate of self-weight consolidation during centrifuge ramp-up are synthesised in Figure 4 The results are generally consistent with PT showing much higher rates of consolidation (consistent with higher permeability) The materials are only slightly anisotropic with respect to rate of consolidation with chcv ratios of approximately 14
That application of PT could significantly affect fabric and consolidation behaviour of a slurry with clay mineralogy should not be surprising eg changes to consolidation behaviour as significant as those shown here have previously been indicated merely from changing the pore fluid chemistry of a clay slurry (Wang amp Siu 2006 Sachan amp Penumadu 2007) While the lower final density resulting from PT is not a positive outcome in itself the effect of changes to consolidation behaviour on the densities achieved in a tailings deposit is more complicated as discussed subsequently in this article
Shear behaviourThe end points of each triaxial test on
PT and UT samples and the CSLs inferred are summarised as a state diagram in
Figure 2 Dry density versus vertical effective stress comparison slurry consolidometer results
Figure 3 Permeability versus vertical effective stress comparison slurry consolidometer results
Figure 4 Coefficient of consolidation estimates from laboratory and centrifuge
PASTE amp THICKENED TAILINGS
Australian Centre for Geomechanics | December 2017 Newsletter 25
Figure 5 The triaxial testing indicated a consistent difference between the UT and PT CSLs across a wide range of effective stresses For each material different triaxial test types all tended towards the same CSL The clear difference of the CSL between PT and UT is of significant importance when considering the application of critical state-based methods to assess the stability of thickened tailings stacks (Li et al 2009) should such stacks employ PT
Figure 6 presents the undrained strength ratio results for DSS tests carried out at a range of strain rates Despite the varying strain rates each test was carried out under constant volume ie approximately undrained conditions PT samples are seen to exhibit slightly greater strain rate sensitivity It is interesting to consider this result in the context of hand shear vane testing of PT trial deposits which would typically be sheared at high strain rate Although higher PT strengths have been seen in such testing (Beier et al 2013 Cooling amp Beveridge 2015) part of the observed difference may be a function of strain rate dependency This is an important consideration as the hand shear vane is often the most common tool used to characterise thin depths of PT material in trial deposits
The post-cyclic strength for a series of UT and PT tests are summarised in Figure 7 suggesting a very similar decay in undrained strength ratio for the two materials under a given amount of cyclic straining This suggests that the PT material at least in a post-cyclic loading scenario does not appear to be more brittle than UT material
Centrifuge penetrometer testingFigure 8 presents normalised
penetration resistance (Q) measured from CPT and T-bar tests at a range of dimensionless penetration velocities (V) (Finnie amp Randolph 1994) The UT material shows behaviour typical of a contractive clayndashsand mixture with low penetration resistances during high rates of penetration when excess pore pressures are generated during probing (Jaeger et al 2010) At lower velocities Q is seen to increase as the penetration process approaches drained conditions Alternatively PT material gives a relatively consistent penetration resistance across the range of V values applied This may be a result of the higher permeability of the PT material resulting in less excess pore pressure generation However at high rates of penetration PT material was seen to exhibit dilative behaviour under probing contrary to the expected behaviour of the material from laboratory element tests
Figure 9 summarises the results of CPT probes in a QndashFr soil type plot (Robertson 1990) This enables comparison of the inferred dilativecontractive state
of the material and the general soil type suggested from the CPT data channels The CPT results give drastically different results for the UT and PT samples when viewed in this context For example PT plots as having lower compressibility to UT material ndash the opposite of the laboratory results
for the two materials Although extensive examination of the implications of the QndashFr results is beyond the scope of this article it is clear that care is required when using the CPT to classify a PT deposit for undrained strength or to determine in situ state
Figure 5 State diagram and inferred CSLs
Figure 6 Rate effects in DSS shearing
Figure 7 Post-cyclic strength behaviour
PASTE amp THICKENED TAILINGS
Australian Centre for Geomechanics | December 2017 Newsletter26
The general results seen in centrifuge testing may be similar to those seen in one field-scale comparison of CPT probing through PT and UT material (da Silva 2011) In that example CPT probes through PT material showed much higher tip resistances which may have been a result primarily of increased drainage around the cone rather than an actual increase in strength or a denser state This confirms that great care is required in the use of penetration tests to obtain undrained shear strengths or state estimates in PT material
Consolidation modelling The realised average density within
a tailings deposit which is often the parameter of greatest relevance to an operator is a function of more than simply the final dry density under a given vertical effective stress Rather it is also affected by hydraulic conductivity ie rate of consolidation of the deposited material and the rate at which tailings are deposited into a given area
To enable comparison of the behaviour of idealised PT and UT tailings deposition the finite strain consolidation code CONDES0 (Yao amp Znidarcic 1997) was used Model parameters were based on test data previously presented (Figures 2 and 3) The CONDES0 code enables finite strain consolidation modelling of one-dimensional columns under different material placement rates Therefore models can be run with different rates of new material being added to the model per unit time ie different rates of rise (RoR) An important consideration regarding RoR should be noted in this context ndash specifically that there are different forms of RoR which require careful consideration when making comparisons in finite strain codes Three forms of RoR are considered herein as follows
bull Slurry RoR This represents the rate at which the deposited slurry would increase in height were no water release to occur (ie the material remained in a slurry state indefinitely) While a generally unrealistic scenario the slurry RoR is the required starting point for developing comparison models as it is only a function of cell area deposition rate and slurry density
bull Settled RoR The rate at which the tailings level would increase were the material to undergo hindered settling but no further consolidation As typical finite strain models including CONDES0 operate in an effective stress framework they are incapable of modelling the behaviour of slurries prior to the development of effective stress Therefore settled RoR forms the input to a finite difference code
bull Realised RoR This is the RoR value
observed on an actual tailings deposit and is also the value typically being discussed when referring to RoR in tailings practice Factors that affect realised RoR include the rate of deposition cell area consolidation characteristics of the tailings and drainage conditionsThe results of average dry density in
an idealised tailings deposit are presented in Figure 10 for a model assuming no
bottom drainage The data is presented as the average dry density in the model after a period of five years where the slurry RoR is varied from 5ndash40 myear At low slurry RoR the UT material achieves higher dry densities as consolidation keeps up with the deposition rate and therefore the higher final dry density of UT material governs what is achieved However as RoR increases the higher hydraulic conductivity of PT material increases in
Figure 9 Results summarised in a CPT classification chart
Figure 8 Dimensionless penetration resistance versus dimensionless penetration velocity
Drained penetration
Partially drained penetration
Undrained penetration
PASTE amp THICKENED TAILINGS
Australian Centre for Geomechanics | December 2017 Newsletter 27
importance eventually leading to higher average densities This difference becomes significant at high RoR Similar results were indicated by Znidarcic et al (2015) for MFT
Primary outcomes and future areas
The primary outcomes of the study discussed in this article are outlined as follows
bull Polymer treatment affected consolidation behaviour in two distinct ways (a) resulting in lower final densities at a given vertical effective stress while (b) resulting in higher permeability at a given density Numerical modelling of the effect of these changes on achievable dry density in an idealised storage area indicated that the potential benefits of PT with respect to average density and water release were manifested at high slurry RoR values
bull The study provided clear evidence that PT changed the location of the materialrsquos CSL This is an important consideration given potential application of PT in achieving steepened tailings beaches Application of critical state methods to assess the liquefaction susceptibility
of such beaches should include checks on the effect of PT on the CSL Publication of additional data for other materials of such observations would be of benefit
bull Significant shearing of the material after treatment resulted in a substantial reduction in some of the geotechnical effects of PT It is noted that the only sheared samples tested in this study were heavily sheared in order to represent a fully sheared case Further testing of PT tailings under different magnitudes of shear to link to behaviour down the beach would be beneficial
bull PT material exhibited slightly higher sensitivity to increased strain rates in terms of undrained shear strength This suggests caution must be applied when interpreting the results of hand shear vane tests which are often used to compare the behaviour of UT to PT material in trial-scale deposits
bull PT material exhibited higher penetration resistances in centrifuge testing This is despite the PT material having similar shear strengths when measured in laboratory element tests The increased drainage rates of PT material appear to be a
major contributor to the different penetrometer responses This is important to consider when comparing the results of the penetration tests of UT and PT deposits or when using the CPTu to determine in situ strengths and state of PT deposits
bull Consolidation modelling indicates that the rate of deposition ie slurry RoR has a major effect on whether PT will result in higher dry densities in a full-scale deposit At high deposition rates the higher permeability values of the PT material outweigh its lower final densities such that the average dry density achieved during deposition is higher than UT material
AcknowledgementsThe authors acknowledge the financial
assistance of the ACG the assistance of UWA laboratory centrifuge personnel and polymer treatment advice provided by BASF Australia Ltd
Article references are available at acguwaeduaunewsletters-annual-reports
Figure 10 Consolidation modelling summary
Dr David Reid
The University of Western Australia Australia
Professor Andy Fourie
The University of Western Australia Australia
21ST INTERNATIONAL SEMINAR ON
PASTE AND THICKENED TAILINGS11ndash13 APRIL 2018 | RENDEZVOUS HOTEL PERTH SCARBOROUGH | WESTERN AUSTRALIA
Principal SponsorWWWPASTE2018COM
EARLYBIRD REGISTRATION ENDS
26 FEBRUARY 2018
ACG event schedule
The
ACG
even
t sch
edule
is su
bject
to ch
ange
A u s t r a l i a n C e n t r e f o r G e o m e c h a n i c s | V o l u m e N o 4 6 | D e c e m b e r 2 0 1 7
wwwacguwaeduauevents
2018Static Liquefaction Workshop 6ndash7 March 2018 | Melbourne Australia
Rheology Fundamentals for Slurries and Pastes Workshop 9 April 2018 | Perth Australia
Is the Future Filtered Paste and Thickened Tailings Short Course 10 April 2018 | Perth Australia
21st International Seminar on Paste and Thickened Tailings wwwpaste2018com 11ndash13 April 2018 | Perth Australia
Instrumentation and Slope Monitoring Workshop 9 April 2018 | Seville Spain
InSAR Radar and Emerging Technologies Workshop 10 April 2018 | Seville Spain
Practical Rock Mechanics in Mining Short Course 14ndash16 May 2018 | Perth Australia
Introduction to Mine Seismicity Short Course 17ndash18 May 2018 | Perth Australia
Fourth International Symposium on Block and Sublevel Caving wwwcaving2018com 15ndash17 October 2018 | Vancouver Canada
Ground Support in Cave Mining Workshop 18 October 2018 | Vancouver Canada
Geotechnical Engineering for Open Pit Mines Short Course 23ndash25 October 2018 | Perth Australia
Instrumentation and Slope Monitoring Workshop 26 October 2018 | Perth Australia
Management Operation and Relinquishment of Tailings Storage Facilities 5ndash6 December 2018 | Perth Australia
Australian Centre for Geomechanics | 35 Stirling Hwy (M600) | Crawley Western Australia | Australia 6009Ph +61 8 6488 3300 | info-acguwaeduau | wwwacguwaeduau
FOURTH INTERNATIONAL SYMPOSIUM ON
BLOCK AND SUBLEVEL CAVING 15ndash17 OCTOBER 2018 | VANCOUVER CANADA
wwwcaving2018comABSTRACTS DUE 19 FEBRUARY 2018
SUNDAY | 14 OCTOBER
MONDAY | 15 OCTOBER
TUESDAY | 16 OCTOBER
WEDNESDAY | 17 OCTOBER
THURSDAY | 18 OCTOBER
FRIDAY | 19 OCTOBER
SRK Cave Mining Forum
Fourth International Symposium on Block and Sublevel Caving
ACG Ground Support in Cave
Mining Workshop
Site Visit to New Afton Mine
Symposium Dinner
Australian Centre for Geomechanics 2014 mXrap Australian Centre for Geomechanics Perth httpwwwmxrapcomBeck D Levkovitch V amp Simser B 2012 lsquoExplicit dynamic simulation for probabilistic forecasting of fault slip and rock mass seismic
potentialrsquo in Y Potvon (ed) Proceedings of the Sixth International Seminar on Deep and High Stress Mining Australian Centre for Geomechanics Perth pp 373ndash388
Hudyma M 2005 An introduction to mine seismicity seminar notes Australian Centre for Geomechanics PerthMcGaughey J 2014 lsquoA framework for 4D quantitative back-analysis and estimation of geotechnical hazard potential in minesrsquo Proceedings
of Geohazards 6 Canadian Geotechnical Society RichmondMendecki A 1993 lsquoReal time quantitative seismology in minesrsquo in RP Young (ed) Proceedings of the 3rd International Symposium on
Rockbursts and Seismicity in Mines AA Balkema Rotterdam pp 287ndash295Simser B amp Pritchard C 2010 lsquoObservational ground control at Xstratarsquos Nickel Rim South Mine Sudbury Ontariorsquo Proceedings of the
Canadian Institute of Mining Operatorrsquos Conference Canadian Institute of Mining Metallurgy and Petroleum Westmount Simser B Jalbout A amp Pakalnis R 2014 lsquoStability graph method for open stope design ndash case histories from two Sudbury Basin minesrsquo
Proceedings of the 1st International Conference on Applied Empirical Design Methods in Mining International Society for Rock Mechanics Lisbon
Simser B 2013 lsquoSeismic monitoring at Nickel Rim South Minersquo Proceedings of the 6th Microseismic Symposium and Workshop Engineering Seismology Group Kingston
van Aswegen G amp Butler AG 1993 lsquoApplications of quantitative seismology in South African gold minesrsquo in RP Young (ed) Proceedings of the 3rd International Symposium on Rockbursts and Seismicity in Mines AA Balkema Rotterdam pp 261ndash266
Rock mechanics tools for mining in high stress ground conditions at Nickel Rim South Mineby Ali Jalbout Goldcorp Inc Canada and Brad Simser Sudbury Integrated Nickel Operations A Glencore Company Canada
References from page 1ndash8 click here to return to article
References
Continued overleaf
Andrews SJ 1998 lsquoStratigraphy and depositional setting of the upper McNamara Group Lawn Hills region Northwest Queenslandrsquo Economic Geology vol 93 pp 1132ndash1152
Broadbent GC Andrews SJ amp Kelso IJ 2002 lsquoA decade of new ideas geology and exploration history of the Century Zn-Pb-Ag deposit northwestern Queensland Australiarsquo Society of Economic Geologists Special Publication 9 pp 119ndash140
Cawood F amp Stacey T 2006 lsquoSurvey and geotechnical slope monitoring considerationsrsquo The Journal of the South African Institute of Mining and Metallurgy vol 106 pp 495ndash502
Goodman RE Taylor RL amp Brekke TL 1968 lsquoA model for the mechanics of jointed rocksrsquo Journal of Soil Mechanics and Foundations Division vol 94 no 3 pp 634ndash659
Hammah R Yacoub T Corkum B amp Curran J 2008 lsquoThe practical modelling of discontinuous rock masses with finite element analysisrsquo Proceedings of the 42nd US Rock Mechanics Symposium American Rock Mechanics Association Alexandria
Harries N Noon D amp Rowley K 2006 lsquoCase studies of slope stability radar used in open cut minesrsquo Stability of Rock Slopes in Open Pit Mining and Civil Engineering Situations pp 335ndash342
Hutchison BJ Naude S amp Howarth J 2015 lsquoManagement of a toppling failiure wall collapse at the Kanmantoo Copper Mine in South Australiarsquo Proceedings of the 2015 International Symposium on Rock Slope Stability in Open Pit Mining and Civil Engineering The Southern African Institue of Mining and Metallurgy Johannesburg pp 81ndash98
Kurukuk N amp Sweeney E 2012 lsquoSlope stability assessment centuryrsquo Proceedings of the 9th AustraliandashNew Zealand Young Geotechnical Professionals Conference The New Zealand Geotechnical Society Wellington
Little MJ 2006 lsquoSlope monitoring strategy at PPRust open pit operationrsquo Proceedings of the 2016 International Symposium on Stability of Rock Slopes in Open Pit Mining and Civil Engineering The Southern African Institute of Mining and Metallurgy Johannesburg pp 211ndash230
Lynch RA amp Malovichko DA 2006 lsquoSeismology and slope stability in open pit minesrsquo Proceedings of the 2006 International Symposium on Stability of Rock Slopes in Open Pit Mining and Civil Engineering The Southern Africa Institute of Mining and Metallurgy Johannesburg pp 375ndash390
The geotechnical conundrum are surface observations reflecting rock mass behaviour at depthby Dr Michele Salvoni Australia and Professor Phil Dight Australian Centre for Geomechanics Australia
References from page 16ndash19 click here to return to article
References
Continued overleaf
Backer RR amp Busch RA 1981 Fine coal refuse slurry dewatering United States Department of the Interior Bureau of Mines Washington DCBeier N Wilson W Dunmola A amp Sego D 2013 lsquoImpact of flocculation-based dewatering on the shear strength of oil sands fine tailingsrsquo
Canadian Geotechnical Journal vol 50 no 9 pp 1001ndash1007Cooling D amp Beveridge A 2015 lsquoUse of Rheomaxreg ETD technology to thicken bauxite residual slurry during Super Thickener bypassrsquo
in AB Fourie amp RJ Jewell (eds) Paste and Thickened Tailings ndash A Guide 3rd edn Australian Centre for Geomechanics Perth pp 311ndash313Da Silva F 2011 lsquoReducing risks to tailings storage facilities through in-line flocculationrsquo in J Han amp DE Alzamora (eds) Proceedings of
GeoFrontiers 2011 Advances in Geotechnical Engineering American Society of Civil Engineers Reston pp 2937ndash2946Finnie IMS amp Randolph MF 1994 lsquoPunch-through and liquefaction induced failure of shallow foundations on calcareous sedimentsrsquo
Proceedings of the Seventh International Conference on Behavior of Offshore Structures (BOSS 94) Massachusetts Institute of Technology Cambridge pp 217ndash230
Gholami R amp Simms P 2015 lsquoShear behaviour in element testing of polymer amended mature fine tailingsrsquo Proceedings of the 68th Canadian Geotechnical Conference Canadian Geotechnical Society Richmond
Jaeger RA Dejong JT Boulanger RW Low HE amp Randolph MF 2010 lsquoVariable penetration rate CPT in an intermediate soilrsquo in PK Robertson amp PW Maybe (eds) Proceedings of the 2nd International Symposium on Cone Penetration Testing (CPT10)
Jeeravipoolvarn S Scott D Chalaturnyk R amp Shaw B 2014 lsquoEffect of pipeline shear on consolidation properties of oil sands fine tailingsrsquo Proceedings of Tailings and Mine Waste 2014 Information Technology Creative Media Vancouver pp 495ndash506
Jeeravipoolvarn S Scott J amp Chalaturnyk R 2009 lsquoGeotechnical characteristics of laboratory in-line thickened oil sands tailingsrsquo Proceedings of Tailings and Mine Waste 2009 Information Technology Creative Media Vancouver pp 813ndash828
Li AL Been K Ritchie D amp Welch D 2009 lsquoStability of large thickened non-segregated tailings slopesrsquo in RJ Jewell AB Fourie S Barrera and J Wiertz (eds) Proceedings of the 12th International Seminar on Paste and Thickened Australian Centre for Geomechanics Perth pp 301ndash312
Reid D 2016 lsquoEffect of rotation rate on shear vane results in a silty tailingsrsquo in BM Lehane HE Acosta-Martinez and R Kelly (eds) Proceedings of the 5th International Conference on Geotechnical and Geophysical Site Characterisation vol 1 Australian Geomechanics Society St Ives pp 369ndash374
Reid D amp Fourie AB 2015 lsquoEffects of shear on the behaviour of polymer-treated slurriesrsquo in FR Nejad (ed) Proceedings of Tailings and Mine Waste Management for the 21st Century The Australian Institute of Mining and Metallurgy Melbourne pp 215ndash224
Reid D amp Fourie AB 2016 lsquoLaboratory assessment of the effects of polymer treatment on geotechnical properties of low plasticity soil slurryrsquo Canadian Geotechnical Journal vol 53 no 10 pp 1718ndash1730
Effects of polymer treatment on geotechnical properties of a low-plasticity slurryby Dr David Reid and Professor Andy Fourie The University of Western Australia AustraliaReferences from page 23ndash27 click here to return to article
Marques EAG Vargas Jr EDA amp Antunes FS 2005 lsquoA study of the durability of some shales mudrocks and siltstones from Brazilrsquo Geotechnical amp Geological Engineering vol 23 pp 321ndash348
Read J 2007 lsquoPredicting the behaviour and failure of large rock slopesrsquo Proceedings of the 1st Canada-US Rock Mechanics Symposium American Rock Mechanics Association Alexandria
Sainsbury B Sainsbury D amp Hebert Y 2013 lsquoAssessment of the long-term stability of the Stage 8 West Wall Cutback at MMG Centuryrsquo unpublished Itasca internal report Itasca Australia Pty Ltd
Salvoni M 2015 lsquoRock mechanical characterization of the carbonate breccia and black carbonaceous shalesrsquo unpublished Australian Centre for Geomechanics report Australian Centre for Geomechanics Perth
Salvoni M amp Dight PM 2016 lsquoRock damage assessment in a large unstable slope from microseismic monitoring-MMG Century mine (Queensland Australia) case studyrsquo Engineering Geology vol 210 pp 45ndash56
Stacey P 2009 lsquoFundamentals of slope designrsquo in J Read and P Stacey (eds) Guidelines for Open Pit Slope Designrsquo AA Balkema Rotterdam pp 1ndash14
Sweeney E amp Abbott K 2016 lsquoGeotechnical analyses for risk managment of a large scale failure at Century mine Northwest Queenslandrsquo in PM Dight (ed) Proceedings of the First Asia Pacific Slope Stability in Mining Conference Australian Centre for Geomechanics Perth pp 225ndash238
Taylor RK amp Smith TJ 1986 lsquoThe engineering geology of clay minerals swelling shrinking and mudrock breakdownrsquo Clay Minerals vol 21 pp 235ndash260
Walkinshaw J amp Santi P 1996 Chapter 21 Shales and other degradable materials Landslides Investigation and Mitigation TRB Special Report vol 247 pp 555ndash576
Wesseloo J amp Sweby GJ 2008 lsquoMicroseismic monitoring of hard rock mine slopesrsquo in Y Potvin J Carter A Dyskin and R Jeffrey (eds) Proceedings of the First Southern Hemisphere International Rock Mechanics Symposium Australian Centre for Geomechanics Perth pp 433ndash450
Xiao Y-X Feng X-T Hudson JA Chen B-R Feng G-L amp Liu J-P 2016 lsquoISRM suggested method for in situ microseismic monitoring of the fracturing process in rock massesrsquo Rock Mechanics and Rock Engineering vol 49 pp 343ndash369
ReferencesReid D amp Fourie AB 2017a lsquoCentrifuge assessment of the effects of polymer treatment on penetrometer responsersquo International Journal for
Numerical and Analytical Methods in Geomechanics in pressReid D amp Fourie AB 2017b lsquoEffects of polymer treatment on undrained strengths and cyclic behavior of a low-plasticity slurryrsquo Journal of
Geotechnical and Geoenvironmental Engineering vol 143 no 6Reid D Utting L amp Fourie AB 2015 lsquoAssessing the effects of polymer treatment segregation considerationsrsquo Proceedings of Tailings and
Mine Waste 2015 The University of British Columbia VancouverRiley T Reid D amp Utting L 2015 lsquoPolymer-modified tailings deposition ndash ongoing testing and potential storage efficiency opportunitiesrsquo
in RJ Jewell amp AB Fourie (eds) Proceedings of the 18th International Seminar on Paste and Thickened Tailings Australian Centre for Geomechanics Perth pp 139ndash152
Robertson PK 1990 lsquoSoil classification using the cone penetration testrsquo Canadian Geotechnical Journal vol 27 no 1 pp 151ndash158Sachan A amp Penumadu D 2007 lsquoEffect of microfabric on shear behavior of kaolin clayrsquo Journal of Geotechnical and Geoenvironmental
Engineering vol 133 no 3 pp 306ndash318Stewart BM Backer RR amp Busch RA 1986 Thickening Fine Coal Refuse Slurry for Rapid Dewatering and Enhanced Safety report of
investigations United States Department of the Interior Bureau of Mines Washington DCWang YH amp Siu WK 2006 lsquoStructure characteristics and mechanical properties of kaolinite soils II Effects of structure on mechanical
propertiesrsquo Canadian Geotechnical Journal vol 43 no 6 pp 601ndash617Wells PS amp Kaminsky HAW 2015 lsquoSlurry to soil clay behaviour model - using methylene blue to cross the processgeotechnical engineering
dividersquo Proceedings of Tailings and Mine Waste 2015 The University of British Columbia VancouverYao D amp Znidarcic D 1997 Crust Formation and Desiccation Characteristics for Phosphatic Clays users manual for computer program
CONDES0 Florida Institute of Phosphate Research Polk CountyZnidarcic D Adkins S Utting L amp Catling M 2015 lsquoRheomax ETD technology a laboratory study of application performance and
associated geotechnical characteristics for polymer assisted tailings deposition of oil sands MFTrsquo Proceedings of Tailings and Mine Waste 2015 The University of British Columbia Vancouver pp 508ndash520
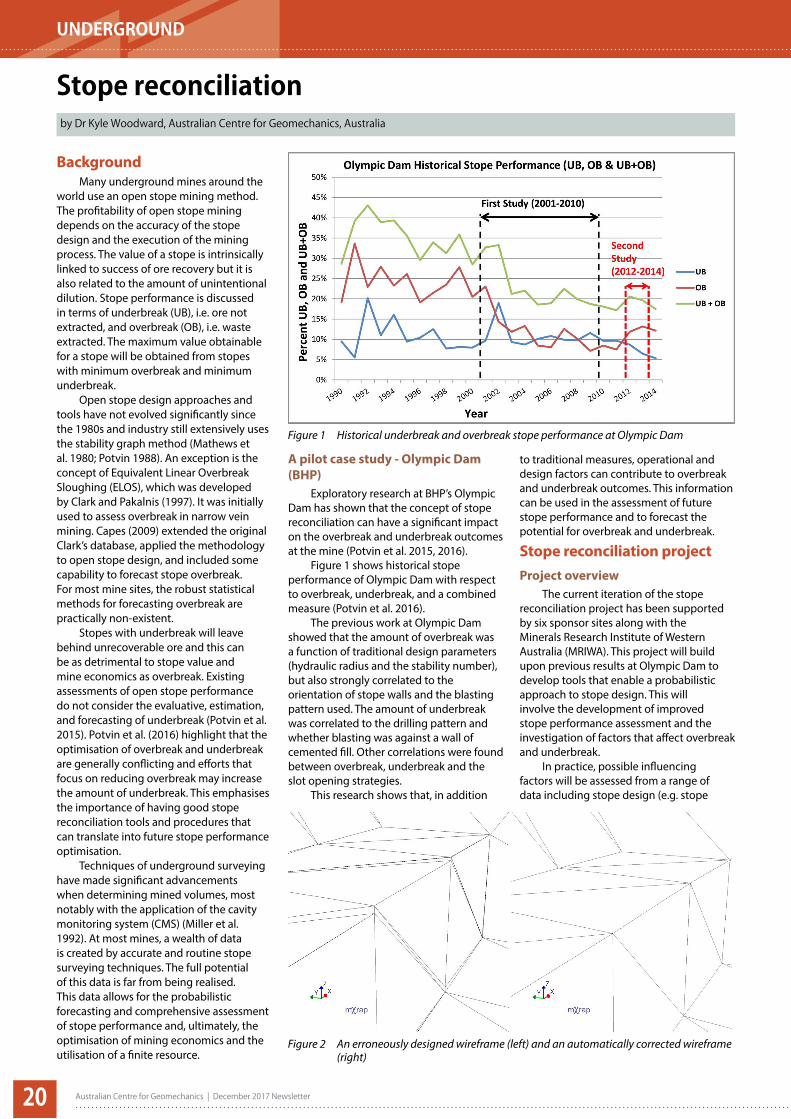
UNDERGROUND
Australian Centre for Geomechanics | December 2017 Newsletter 21
dimensions stability number) operational information (eg drilling pattern slot opening adjacent stope fill walls) and geotechnical information The technology transfer to site will occur via mXrap software development and will aim to minimise manual data manipulation Conceptually given a stopersquos CMS and design the stope performance statistics will be automatically generated with a mXrap stope optimisation app Furthermore an additional mXrap app will provide a probabilistic forecast of overbreak and underbreak for a given stope design historical site-specific stope performance and factors that influence performance
Preliminary project progressThe assessment of stope performance
is underpinned by the quality of data Initial considerations of data quality focus on the quality of surveys specifically stope CMS and designs Surveys can be constructed with only visualisation in mind and may contain features that influence subsequent calculations An ideal CMS or design survey will be
bull a single surface representing an individual stope
bull consistent ie no sharp edges small ledges and other unrealistic features
bull a realistic and consistent resolutionbull free from self-intersectionsbull free from internal or external volumes
surfaces andbull a closed surface ie watertight
Survey quality is ideally considered during the CMS and design procedures to prevent automated approaches erroneously reinterpreting surveys without site-specific
information As part of preliminary work on survey quality a mXrap app was created to explore and address some of the more basic survey quality concerns Figure 2 gives an example of a common error (nodes not being lsquosnappedrsquo together) and shows the erronous design wireframe (left) and an automatically corrected wireframe (right)
The selection of a method to find the volumes associated with 3D surfaces also must consider how additional information might be integrated in a general assessment framework A familiar concept and format for geologicalgeotechnical information is a block model whereby rock properties are assigned to specific volumes An extension of this concept is not to use blocks of a uniform size but instead to use smaller blocks where more information is available and extra detail is warranted
A model of the volumes associated with stope CMS and designs can be achieved by the creation of an octree Essentially an octree is a tree data structure created from the partitioning of 3D space by recursively subdividing it into eight octants ie blocks are created by dividing volumes that are intersected by surfaces until an appropriate resolution is reached The implementation of an octree is an efficient and flexible framework for the assessment of stope performance which retains spatial information and is an essential feature to enable the assessment of factors that influence stope performance
An example of this type of stope performance assessment is shown in Figure 3 A stope CMS and design survey is used to create the subdivision of an octree
(left) These octree blocks are assessed with respect to design and CMS surfaces to determine if they are volumes of underbreak (centre) and overbreak (right)
The octree format lends itself to less conventional methods of assessing stope performance Figure 4 illustrates preliminary work that explores spatial characteristics of stope design and performance Shown in this figure (right) is the result of an algorithm which automatically detects the lsquouniquersquo straight angled and domed faces of a stope design Shown left is a projection map for a lsquouniquersquo face This plot shows the distance between CMS and design surfaces in a direction normal to the design survey This plot highlights the areas and severity of overbreak (positive distances) and underbreak (negative distances)
Areas plotted as blue are underbreak red are overbreak and green are mined to design
Concluding remarksStope design and performance
assessment has not significantly progressed despite the economics of mining being intrinsically linked to ore recovery and dilution Stope surveying data allows improvements to be made when assessing stope performance particularly when assessing the amount of underbreak and the development of probabilistic methods of stope design that optimise value
Previous research assessed stope performance at BHP Olympic Dam and showed that by considering operational and design factors in addition to
Figure 3 An octree sub-division of stope CMS and design surveys (left) and octree blocks which are volumes of underbreak (centre) and overbreak (right)
UNDERGROUND
Australian Centre for Geomechanics | December 2017 Newsletter22
traditional measures overbreak and underbreak outcomes can be improved The current stope reconciliation project will further develop tools to assess the influence of factors on stope performance and probabilistic stope design Initial work has focused on survey quality developing a general assessment framework and developing exploratory tools that characterise stope design and performance
Details about the ACG Stope Reconciliation and Optimisation Project are available at wwwacguwaeduauacg-research
Figure 4 Right ndash results of an algorithm which automatically detects the lsquouniquersquo straight angled and domed faces of a stope design Left ndash a projection plot shows the distance between CMS and design surfaces in a direction normal to the design survey
Dr Kyle Woodward
Australian Centre for Geomechanics Australia
The ACG acknowledges the following Stope Reconciliation and Optimisation Project sponsors
bull Agnico Eagle Mines Ltd Canadabull BHP Olympic Dambull Glencore Mount Isa Mines
bull Gold Fields Australia Pty Ltd Granny Smith
bull Hecla Mining Company Canadabull IAMGOLD Corporation Canada
bull MMG Limitedbull Minerals Research Institute of Western
Australia
12th International Conference on Mine Closure3ndash7 September 2018 | KUBUS Leipzig | Leipzig Germany
The Mine Closure 2018 Conference will be a multidisciplinary global forum for exchanging views and exploring ideas to aid new mines to operate with closure
in mind and support old sites to be closed economically whilst minimising environmental and social impacts
The conference host is Bergakademie Freiberg This prestigious university was founded in 1756 and is the oldest existing montane educational institution in
the worldLeipzig is located in the centre of one of Europes largest mine closure programmes with many examples of mine rehabilitation that offer new
opportunities for regional development
wwwmineclosure2018com
Conference Themesbull Legal financial socio-economical and
organisational aspectsbull Planning modelling and monitoringbull Mine closure case studiesbull Mine closure and mining
infrastructurebull Mine flooding balancing of
groundwater deficits and pit lakesbull Hydrogeochemistry acid mine
drainage and treatmentsbull Geotechnical aspectsbull Biodiversity and ecological aspectsbull Handling of contamination and soil
formationbull Aftercare marketing reorganisation
of land geotourism
Host Organisation
M I N E C L O S U R E 2 0 1 8
PASTE amp THICKENED TAILINGS
Australian Centre for Geomechanics | December 2017 Newsletter 23
IntroductionAttempts to improve the dewatering
behaviour of tailings through the addition of polymers at the point of discharge appear to have been first attempted in the early 1980s on coal tailings (Backer amp Busch 1981 Stewart et al 1986) Significant interest has developed more recently with a variety of applications on a number of tailings types over the past 15 years (Jeeravipoolvarn et al 2009 Riley et al 2015 Cooling amp Beveridge 2015) Terminology for this technology varies with it having been referred to as inline flocculation secondary flocculation and polymer treatment Herein it is referred to as polymer treatment (PT)
While initial impetus for polymer application is generally focused on rapid initial water release reduction in particle segregation and near-surface strength gain (ie for equipment access) implementation of PT can have ongoing effects on the geotechnical behaviour of tailings This is of importance with respect to the stability of the tailings storage facility (TSF) should the strength of PT tailings be relied upon when utilised in upstream raising or should they form part of a steepened beach without containment Further PT effects on ongoing consolidation behaviour will impact how a TSF consolidates over time
In terms of assessing the geotechnical effects of PT mature fine tailings (MFT) deposits are likely those that have received the greatest attention (Jeeravipoolvarn et al 2009 Beier et al 2013 Gholami amp Simms 2015) The oil sand MFT deposits are of significant area and extent exhibit low dewatering rates and without some form of treatment are very soft thus making covering difficult As such the potential for PT to accelerate and increase water release and thus surficial tailings strength gain has been studied extensively While the MFT research has led to major contributions to our understanding of the effects of PT MFT tailings are a unique material type and hence the applicability of this experience to other materials is unknown Further a number of key areas such as effects of PT on critical state rate effects of shear and behaviour of penetrometers in PT materials have received limited attention to date
To investigate some of the issues outlined between 2011 and 2014 a series of laboratory and centrifuge tests were carried out on a low plasticity slurry in an untreated (UT) and PT state at The University of Western Australia (UWA)
with financial support from the Australian Centre for Geomechanics (ACG) This work was summarised in three journal papers (Reid amp Fourie 2016 2017a 2017b) and two conference papers (Reid amp Fourie 2015 Reid et al 2015) This article provides a summary of the major outcomes of this research project
Material developmentFor the purposes of this research
project a synthetic slurry was developed comprising laboratory standard sand silt and kaolin clays mixed such that the resulting composite had similar gradation and plasticity to many tailings considered for PT A synthetic material was developed for this study rather than an actual tailings as it was important that essentially unlimited quantities of identical material could be produced (particularly for beam centrifuge tests) and to prevent any potential difficulties in obtaining permissions for publication that can occasionally occur when using an actual tailings
After development of the composite slurry BASF Australia Ltd provided assistance in selecting a polymer and dosage that significantly increased dewatering rates with high molecular weight polyacrylamide polymer Rheomax ETD DPW 1687 selected on this basis at an application rate of 500 g of polymer per tonne of dry solids
In addition to the UT and PT samples a sheared PT material (PT-S) was created
by preparing a batch of PT sample which was then sheared for 5 min using a plaster mixer This batch was created to enable some limited assessment of the effects of shearing during deposition andor flow on a beach on resulting geotechnical behaviour as shearing has been shown to reduce the effects of PT on MFT (Jeeravipoolvarn et al 2014)
Study methodsLaboratory
A series of laboratory element tests were carried out on both UT and PT specimens using slurry consolidometer triaxial (K0 and isotropic) and monotonic and cyclic direct simple shear (DSS) tests These tests were used to estimate consolidation behaviour shear strength critical state line (CSL) location and cyclic behaviour
To prepare samples for testing material was either poured directly into the testing device (slurry consolidometer) or firstly one-dimensionally consolidated in a cylinder then extruded and trimmed for subsequent testing (triaxial and DSS)
CentrifugeWhile laboratory element testing
enables direct comparison of material behaviour under known stress conditions in actual tailings practice it is more typical to initially characterise a deposit by means of penetrometer testing The cone penetration test with piezometer included (CPTu) is by far the most common
Effects of polymer treatment on geotechnical properties of a low-plasticity slurryby Dr David Reid and Professor Andy Fourie The University of Western Australia Australia
Figure 1 Miniature T-bar just prior to commencing penetration in PT material
PASTE amp THICKENED TAILINGS
Australian Centre for Geomechanics | December 2017 Newsletter24
penetrometer test used in tailings while full-flow penetrometers such as the ball penetrometer are increasingly finding application in soft tailings deposits (Wells amp Kaminsky 2015 Reid 2016) To enable penetrometer testing of two deposits with and without PT beam centrifuge testing was conducted The beam centrifuge is a
device within which a vessel containing soil is spun at significantly higher acceleration than normal gravity This enables a soil depth of ~200 mm within the centrifuge to exhibit the same stress field as a 20 m deep deposit Various tests and observations can then be made
While field-scale comparisons of UT
and PT would be preferable to centrifuge testing a true comparison of field-scale deposits would require a significant quantity of tailings to be deposited with identical index properties into two discrete areas This is likely to be impractical to achieve in any full scale scenario
The University of Western Australiarsquos 36 m diameter beam centrifuge was used in this study to enable miniature penetrometer (CPTu and T-Bar) testing on UT and PT samples The material was prepared in a similar way to the laboratory samples except on much larger scale Once spinning within the centrifuge a series of miniature CPTu and T-bar penetrometer tests were carried out Different penetration rates were used to enable assessment of the effects of drainage and shear rate on the results Dissipation tests were carried out as part of CPTu probing Figure 1 shows model preparation of the PT material with a T-bar positioned for a sounding
ResultsConsolidation behaviour
The results of consolidation testing are summarised in Figures 2 and 3 The testing indicated that the PT and PT-S materials exhibited a looser final dry density across the range of stresses tested than the UT material Alternatively permeability values for PT material were as much as an order of magnitude higher than UT while PT-S exhibited a permeability between that of UT and PT
The results from laboratory consolidation testing dissipation tests carried out during miniature CPTu probing and the rate of self-weight consolidation during centrifuge ramp-up are synthesised in Figure 4 The results are generally consistent with PT showing much higher rates of consolidation (consistent with higher permeability) The materials are only slightly anisotropic with respect to rate of consolidation with chcv ratios of approximately 14
That application of PT could significantly affect fabric and consolidation behaviour of a slurry with clay mineralogy should not be surprising eg changes to consolidation behaviour as significant as those shown here have previously been indicated merely from changing the pore fluid chemistry of a clay slurry (Wang amp Siu 2006 Sachan amp Penumadu 2007) While the lower final density resulting from PT is not a positive outcome in itself the effect of changes to consolidation behaviour on the densities achieved in a tailings deposit is more complicated as discussed subsequently in this article
Shear behaviourThe end points of each triaxial test on
PT and UT samples and the CSLs inferred are summarised as a state diagram in
Figure 2 Dry density versus vertical effective stress comparison slurry consolidometer results
Figure 3 Permeability versus vertical effective stress comparison slurry consolidometer results
Figure 4 Coefficient of consolidation estimates from laboratory and centrifuge
PASTE amp THICKENED TAILINGS
Australian Centre for Geomechanics | December 2017 Newsletter 25
Figure 5 The triaxial testing indicated a consistent difference between the UT and PT CSLs across a wide range of effective stresses For each material different triaxial test types all tended towards the same CSL The clear difference of the CSL between PT and UT is of significant importance when considering the application of critical state-based methods to assess the stability of thickened tailings stacks (Li et al 2009) should such stacks employ PT
Figure 6 presents the undrained strength ratio results for DSS tests carried out at a range of strain rates Despite the varying strain rates each test was carried out under constant volume ie approximately undrained conditions PT samples are seen to exhibit slightly greater strain rate sensitivity It is interesting to consider this result in the context of hand shear vane testing of PT trial deposits which would typically be sheared at high strain rate Although higher PT strengths have been seen in such testing (Beier et al 2013 Cooling amp Beveridge 2015) part of the observed difference may be a function of strain rate dependency This is an important consideration as the hand shear vane is often the most common tool used to characterise thin depths of PT material in trial deposits
The post-cyclic strength for a series of UT and PT tests are summarised in Figure 7 suggesting a very similar decay in undrained strength ratio for the two materials under a given amount of cyclic straining This suggests that the PT material at least in a post-cyclic loading scenario does not appear to be more brittle than UT material
Centrifuge penetrometer testingFigure 8 presents normalised
penetration resistance (Q) measured from CPT and T-bar tests at a range of dimensionless penetration velocities (V) (Finnie amp Randolph 1994) The UT material shows behaviour typical of a contractive clayndashsand mixture with low penetration resistances during high rates of penetration when excess pore pressures are generated during probing (Jaeger et al 2010) At lower velocities Q is seen to increase as the penetration process approaches drained conditions Alternatively PT material gives a relatively consistent penetration resistance across the range of V values applied This may be a result of the higher permeability of the PT material resulting in less excess pore pressure generation However at high rates of penetration PT material was seen to exhibit dilative behaviour under probing contrary to the expected behaviour of the material from laboratory element tests
Figure 9 summarises the results of CPT probes in a QndashFr soil type plot (Robertson 1990) This enables comparison of the inferred dilativecontractive state
of the material and the general soil type suggested from the CPT data channels The CPT results give drastically different results for the UT and PT samples when viewed in this context For example PT plots as having lower compressibility to UT material ndash the opposite of the laboratory results
for the two materials Although extensive examination of the implications of the QndashFr results is beyond the scope of this article it is clear that care is required when using the CPT to classify a PT deposit for undrained strength or to determine in situ state
Figure 5 State diagram and inferred CSLs
Figure 6 Rate effects in DSS shearing
Figure 7 Post-cyclic strength behaviour
PASTE amp THICKENED TAILINGS
Australian Centre for Geomechanics | December 2017 Newsletter26
The general results seen in centrifuge testing may be similar to those seen in one field-scale comparison of CPT probing through PT and UT material (da Silva 2011) In that example CPT probes through PT material showed much higher tip resistances which may have been a result primarily of increased drainage around the cone rather than an actual increase in strength or a denser state This confirms that great care is required in the use of penetration tests to obtain undrained shear strengths or state estimates in PT material
Consolidation modelling The realised average density within
a tailings deposit which is often the parameter of greatest relevance to an operator is a function of more than simply the final dry density under a given vertical effective stress Rather it is also affected by hydraulic conductivity ie rate of consolidation of the deposited material and the rate at which tailings are deposited into a given area
To enable comparison of the behaviour of idealised PT and UT tailings deposition the finite strain consolidation code CONDES0 (Yao amp Znidarcic 1997) was used Model parameters were based on test data previously presented (Figures 2 and 3) The CONDES0 code enables finite strain consolidation modelling of one-dimensional columns under different material placement rates Therefore models can be run with different rates of new material being added to the model per unit time ie different rates of rise (RoR) An important consideration regarding RoR should be noted in this context ndash specifically that there are different forms of RoR which require careful consideration when making comparisons in finite strain codes Three forms of RoR are considered herein as follows
bull Slurry RoR This represents the rate at which the deposited slurry would increase in height were no water release to occur (ie the material remained in a slurry state indefinitely) While a generally unrealistic scenario the slurry RoR is the required starting point for developing comparison models as it is only a function of cell area deposition rate and slurry density
bull Settled RoR The rate at which the tailings level would increase were the material to undergo hindered settling but no further consolidation As typical finite strain models including CONDES0 operate in an effective stress framework they are incapable of modelling the behaviour of slurries prior to the development of effective stress Therefore settled RoR forms the input to a finite difference code
bull Realised RoR This is the RoR value
observed on an actual tailings deposit and is also the value typically being discussed when referring to RoR in tailings practice Factors that affect realised RoR include the rate of deposition cell area consolidation characteristics of the tailings and drainage conditionsThe results of average dry density in
an idealised tailings deposit are presented in Figure 10 for a model assuming no
bottom drainage The data is presented as the average dry density in the model after a period of five years where the slurry RoR is varied from 5ndash40 myear At low slurry RoR the UT material achieves higher dry densities as consolidation keeps up with the deposition rate and therefore the higher final dry density of UT material governs what is achieved However as RoR increases the higher hydraulic conductivity of PT material increases in
Figure 9 Results summarised in a CPT classification chart
Figure 8 Dimensionless penetration resistance versus dimensionless penetration velocity
Drained penetration
Partially drained penetration
Undrained penetration
PASTE amp THICKENED TAILINGS
Australian Centre for Geomechanics | December 2017 Newsletter 27
importance eventually leading to higher average densities This difference becomes significant at high RoR Similar results were indicated by Znidarcic et al (2015) for MFT
Primary outcomes and future areas
The primary outcomes of the study discussed in this article are outlined as follows
bull Polymer treatment affected consolidation behaviour in two distinct ways (a) resulting in lower final densities at a given vertical effective stress while (b) resulting in higher permeability at a given density Numerical modelling of the effect of these changes on achievable dry density in an idealised storage area indicated that the potential benefits of PT with respect to average density and water release were manifested at high slurry RoR values
bull The study provided clear evidence that PT changed the location of the materialrsquos CSL This is an important consideration given potential application of PT in achieving steepened tailings beaches Application of critical state methods to assess the liquefaction susceptibility
of such beaches should include checks on the effect of PT on the CSL Publication of additional data for other materials of such observations would be of benefit
bull Significant shearing of the material after treatment resulted in a substantial reduction in some of the geotechnical effects of PT It is noted that the only sheared samples tested in this study were heavily sheared in order to represent a fully sheared case Further testing of PT tailings under different magnitudes of shear to link to behaviour down the beach would be beneficial
bull PT material exhibited slightly higher sensitivity to increased strain rates in terms of undrained shear strength This suggests caution must be applied when interpreting the results of hand shear vane tests which are often used to compare the behaviour of UT to PT material in trial-scale deposits
bull PT material exhibited higher penetration resistances in centrifuge testing This is despite the PT material having similar shear strengths when measured in laboratory element tests The increased drainage rates of PT material appear to be a
major contributor to the different penetrometer responses This is important to consider when comparing the results of the penetration tests of UT and PT deposits or when using the CPTu to determine in situ strengths and state of PT deposits
bull Consolidation modelling indicates that the rate of deposition ie slurry RoR has a major effect on whether PT will result in higher dry densities in a full-scale deposit At high deposition rates the higher permeability values of the PT material outweigh its lower final densities such that the average dry density achieved during deposition is higher than UT material
AcknowledgementsThe authors acknowledge the financial
assistance of the ACG the assistance of UWA laboratory centrifuge personnel and polymer treatment advice provided by BASF Australia Ltd
Article references are available at acguwaeduaunewsletters-annual-reports
Figure 10 Consolidation modelling summary
Dr David Reid
The University of Western Australia Australia
Professor Andy Fourie
The University of Western Australia Australia
21ST INTERNATIONAL SEMINAR ON
PASTE AND THICKENED TAILINGS11ndash13 APRIL 2018 | RENDEZVOUS HOTEL PERTH SCARBOROUGH | WESTERN AUSTRALIA
Principal SponsorWWWPASTE2018COM
EARLYBIRD REGISTRATION ENDS
26 FEBRUARY 2018
ACG event schedule
The
ACG
even
t sch
edule
is su
bject
to ch
ange
A u s t r a l i a n C e n t r e f o r G e o m e c h a n i c s | V o l u m e N o 4 6 | D e c e m b e r 2 0 1 7
wwwacguwaeduauevents
2018Static Liquefaction Workshop 6ndash7 March 2018 | Melbourne Australia
Rheology Fundamentals for Slurries and Pastes Workshop 9 April 2018 | Perth Australia
Is the Future Filtered Paste and Thickened Tailings Short Course 10 April 2018 | Perth Australia
21st International Seminar on Paste and Thickened Tailings wwwpaste2018com 11ndash13 April 2018 | Perth Australia
Instrumentation and Slope Monitoring Workshop 9 April 2018 | Seville Spain
InSAR Radar and Emerging Technologies Workshop 10 April 2018 | Seville Spain
Practical Rock Mechanics in Mining Short Course 14ndash16 May 2018 | Perth Australia
Introduction to Mine Seismicity Short Course 17ndash18 May 2018 | Perth Australia
Fourth International Symposium on Block and Sublevel Caving wwwcaving2018com 15ndash17 October 2018 | Vancouver Canada
Ground Support in Cave Mining Workshop 18 October 2018 | Vancouver Canada
Geotechnical Engineering for Open Pit Mines Short Course 23ndash25 October 2018 | Perth Australia
Instrumentation and Slope Monitoring Workshop 26 October 2018 | Perth Australia
Management Operation and Relinquishment of Tailings Storage Facilities 5ndash6 December 2018 | Perth Australia
Australian Centre for Geomechanics | 35 Stirling Hwy (M600) | Crawley Western Australia | Australia 6009Ph +61 8 6488 3300 | info-acguwaeduau | wwwacguwaeduau
FOURTH INTERNATIONAL SYMPOSIUM ON
BLOCK AND SUBLEVEL CAVING 15ndash17 OCTOBER 2018 | VANCOUVER CANADA
wwwcaving2018comABSTRACTS DUE 19 FEBRUARY 2018
SUNDAY | 14 OCTOBER
MONDAY | 15 OCTOBER
TUESDAY | 16 OCTOBER
WEDNESDAY | 17 OCTOBER
THURSDAY | 18 OCTOBER
FRIDAY | 19 OCTOBER
SRK Cave Mining Forum
Fourth International Symposium on Block and Sublevel Caving
ACG Ground Support in Cave
Mining Workshop
Site Visit to New Afton Mine
Symposium Dinner
Australian Centre for Geomechanics 2014 mXrap Australian Centre for Geomechanics Perth httpwwwmxrapcomBeck D Levkovitch V amp Simser B 2012 lsquoExplicit dynamic simulation for probabilistic forecasting of fault slip and rock mass seismic
potentialrsquo in Y Potvon (ed) Proceedings of the Sixth International Seminar on Deep and High Stress Mining Australian Centre for Geomechanics Perth pp 373ndash388
Hudyma M 2005 An introduction to mine seismicity seminar notes Australian Centre for Geomechanics PerthMcGaughey J 2014 lsquoA framework for 4D quantitative back-analysis and estimation of geotechnical hazard potential in minesrsquo Proceedings
of Geohazards 6 Canadian Geotechnical Society RichmondMendecki A 1993 lsquoReal time quantitative seismology in minesrsquo in RP Young (ed) Proceedings of the 3rd International Symposium on
Rockbursts and Seismicity in Mines AA Balkema Rotterdam pp 287ndash295Simser B amp Pritchard C 2010 lsquoObservational ground control at Xstratarsquos Nickel Rim South Mine Sudbury Ontariorsquo Proceedings of the
Canadian Institute of Mining Operatorrsquos Conference Canadian Institute of Mining Metallurgy and Petroleum Westmount Simser B Jalbout A amp Pakalnis R 2014 lsquoStability graph method for open stope design ndash case histories from two Sudbury Basin minesrsquo
Proceedings of the 1st International Conference on Applied Empirical Design Methods in Mining International Society for Rock Mechanics Lisbon
Simser B 2013 lsquoSeismic monitoring at Nickel Rim South Minersquo Proceedings of the 6th Microseismic Symposium and Workshop Engineering Seismology Group Kingston
van Aswegen G amp Butler AG 1993 lsquoApplications of quantitative seismology in South African gold minesrsquo in RP Young (ed) Proceedings of the 3rd International Symposium on Rockbursts and Seismicity in Mines AA Balkema Rotterdam pp 261ndash266
Rock mechanics tools for mining in high stress ground conditions at Nickel Rim South Mineby Ali Jalbout Goldcorp Inc Canada and Brad Simser Sudbury Integrated Nickel Operations A Glencore Company Canada
References from page 1ndash8 click here to return to article
References
Continued overleaf
Andrews SJ 1998 lsquoStratigraphy and depositional setting of the upper McNamara Group Lawn Hills region Northwest Queenslandrsquo Economic Geology vol 93 pp 1132ndash1152
Broadbent GC Andrews SJ amp Kelso IJ 2002 lsquoA decade of new ideas geology and exploration history of the Century Zn-Pb-Ag deposit northwestern Queensland Australiarsquo Society of Economic Geologists Special Publication 9 pp 119ndash140
Cawood F amp Stacey T 2006 lsquoSurvey and geotechnical slope monitoring considerationsrsquo The Journal of the South African Institute of Mining and Metallurgy vol 106 pp 495ndash502
Goodman RE Taylor RL amp Brekke TL 1968 lsquoA model for the mechanics of jointed rocksrsquo Journal of Soil Mechanics and Foundations Division vol 94 no 3 pp 634ndash659
Hammah R Yacoub T Corkum B amp Curran J 2008 lsquoThe practical modelling of discontinuous rock masses with finite element analysisrsquo Proceedings of the 42nd US Rock Mechanics Symposium American Rock Mechanics Association Alexandria
Harries N Noon D amp Rowley K 2006 lsquoCase studies of slope stability radar used in open cut minesrsquo Stability of Rock Slopes in Open Pit Mining and Civil Engineering Situations pp 335ndash342
Hutchison BJ Naude S amp Howarth J 2015 lsquoManagement of a toppling failiure wall collapse at the Kanmantoo Copper Mine in South Australiarsquo Proceedings of the 2015 International Symposium on Rock Slope Stability in Open Pit Mining and Civil Engineering The Southern African Institue of Mining and Metallurgy Johannesburg pp 81ndash98
Kurukuk N amp Sweeney E 2012 lsquoSlope stability assessment centuryrsquo Proceedings of the 9th AustraliandashNew Zealand Young Geotechnical Professionals Conference The New Zealand Geotechnical Society Wellington
Little MJ 2006 lsquoSlope monitoring strategy at PPRust open pit operationrsquo Proceedings of the 2016 International Symposium on Stability of Rock Slopes in Open Pit Mining and Civil Engineering The Southern African Institute of Mining and Metallurgy Johannesburg pp 211ndash230
Lynch RA amp Malovichko DA 2006 lsquoSeismology and slope stability in open pit minesrsquo Proceedings of the 2006 International Symposium on Stability of Rock Slopes in Open Pit Mining and Civil Engineering The Southern Africa Institute of Mining and Metallurgy Johannesburg pp 375ndash390
The geotechnical conundrum are surface observations reflecting rock mass behaviour at depthby Dr Michele Salvoni Australia and Professor Phil Dight Australian Centre for Geomechanics Australia
References from page 16ndash19 click here to return to article
References
Continued overleaf
Backer RR amp Busch RA 1981 Fine coal refuse slurry dewatering United States Department of the Interior Bureau of Mines Washington DCBeier N Wilson W Dunmola A amp Sego D 2013 lsquoImpact of flocculation-based dewatering on the shear strength of oil sands fine tailingsrsquo
Canadian Geotechnical Journal vol 50 no 9 pp 1001ndash1007Cooling D amp Beveridge A 2015 lsquoUse of Rheomaxreg ETD technology to thicken bauxite residual slurry during Super Thickener bypassrsquo
in AB Fourie amp RJ Jewell (eds) Paste and Thickened Tailings ndash A Guide 3rd edn Australian Centre for Geomechanics Perth pp 311ndash313Da Silva F 2011 lsquoReducing risks to tailings storage facilities through in-line flocculationrsquo in J Han amp DE Alzamora (eds) Proceedings of
GeoFrontiers 2011 Advances in Geotechnical Engineering American Society of Civil Engineers Reston pp 2937ndash2946Finnie IMS amp Randolph MF 1994 lsquoPunch-through and liquefaction induced failure of shallow foundations on calcareous sedimentsrsquo
Proceedings of the Seventh International Conference on Behavior of Offshore Structures (BOSS 94) Massachusetts Institute of Technology Cambridge pp 217ndash230
Gholami R amp Simms P 2015 lsquoShear behaviour in element testing of polymer amended mature fine tailingsrsquo Proceedings of the 68th Canadian Geotechnical Conference Canadian Geotechnical Society Richmond
Jaeger RA Dejong JT Boulanger RW Low HE amp Randolph MF 2010 lsquoVariable penetration rate CPT in an intermediate soilrsquo in PK Robertson amp PW Maybe (eds) Proceedings of the 2nd International Symposium on Cone Penetration Testing (CPT10)
Jeeravipoolvarn S Scott D Chalaturnyk R amp Shaw B 2014 lsquoEffect of pipeline shear on consolidation properties of oil sands fine tailingsrsquo Proceedings of Tailings and Mine Waste 2014 Information Technology Creative Media Vancouver pp 495ndash506
Jeeravipoolvarn S Scott J amp Chalaturnyk R 2009 lsquoGeotechnical characteristics of laboratory in-line thickened oil sands tailingsrsquo Proceedings of Tailings and Mine Waste 2009 Information Technology Creative Media Vancouver pp 813ndash828
Li AL Been K Ritchie D amp Welch D 2009 lsquoStability of large thickened non-segregated tailings slopesrsquo in RJ Jewell AB Fourie S Barrera and J Wiertz (eds) Proceedings of the 12th International Seminar on Paste and Thickened Australian Centre for Geomechanics Perth pp 301ndash312
Reid D 2016 lsquoEffect of rotation rate on shear vane results in a silty tailingsrsquo in BM Lehane HE Acosta-Martinez and R Kelly (eds) Proceedings of the 5th International Conference on Geotechnical and Geophysical Site Characterisation vol 1 Australian Geomechanics Society St Ives pp 369ndash374
Reid D amp Fourie AB 2015 lsquoEffects of shear on the behaviour of polymer-treated slurriesrsquo in FR Nejad (ed) Proceedings of Tailings and Mine Waste Management for the 21st Century The Australian Institute of Mining and Metallurgy Melbourne pp 215ndash224
Reid D amp Fourie AB 2016 lsquoLaboratory assessment of the effects of polymer treatment on geotechnical properties of low plasticity soil slurryrsquo Canadian Geotechnical Journal vol 53 no 10 pp 1718ndash1730
Effects of polymer treatment on geotechnical properties of a low-plasticity slurryby Dr David Reid and Professor Andy Fourie The University of Western Australia AustraliaReferences from page 23ndash27 click here to return to article
Marques EAG Vargas Jr EDA amp Antunes FS 2005 lsquoA study of the durability of some shales mudrocks and siltstones from Brazilrsquo Geotechnical amp Geological Engineering vol 23 pp 321ndash348
Read J 2007 lsquoPredicting the behaviour and failure of large rock slopesrsquo Proceedings of the 1st Canada-US Rock Mechanics Symposium American Rock Mechanics Association Alexandria
Sainsbury B Sainsbury D amp Hebert Y 2013 lsquoAssessment of the long-term stability of the Stage 8 West Wall Cutback at MMG Centuryrsquo unpublished Itasca internal report Itasca Australia Pty Ltd
Salvoni M 2015 lsquoRock mechanical characterization of the carbonate breccia and black carbonaceous shalesrsquo unpublished Australian Centre for Geomechanics report Australian Centre for Geomechanics Perth
Salvoni M amp Dight PM 2016 lsquoRock damage assessment in a large unstable slope from microseismic monitoring-MMG Century mine (Queensland Australia) case studyrsquo Engineering Geology vol 210 pp 45ndash56
Stacey P 2009 lsquoFundamentals of slope designrsquo in J Read and P Stacey (eds) Guidelines for Open Pit Slope Designrsquo AA Balkema Rotterdam pp 1ndash14
Sweeney E amp Abbott K 2016 lsquoGeotechnical analyses for risk managment of a large scale failure at Century mine Northwest Queenslandrsquo in PM Dight (ed) Proceedings of the First Asia Pacific Slope Stability in Mining Conference Australian Centre for Geomechanics Perth pp 225ndash238
Taylor RK amp Smith TJ 1986 lsquoThe engineering geology of clay minerals swelling shrinking and mudrock breakdownrsquo Clay Minerals vol 21 pp 235ndash260
Walkinshaw J amp Santi P 1996 Chapter 21 Shales and other degradable materials Landslides Investigation and Mitigation TRB Special Report vol 247 pp 555ndash576
Wesseloo J amp Sweby GJ 2008 lsquoMicroseismic monitoring of hard rock mine slopesrsquo in Y Potvin J Carter A Dyskin and R Jeffrey (eds) Proceedings of the First Southern Hemisphere International Rock Mechanics Symposium Australian Centre for Geomechanics Perth pp 433ndash450
Xiao Y-X Feng X-T Hudson JA Chen B-R Feng G-L amp Liu J-P 2016 lsquoISRM suggested method for in situ microseismic monitoring of the fracturing process in rock massesrsquo Rock Mechanics and Rock Engineering vol 49 pp 343ndash369
ReferencesReid D amp Fourie AB 2017a lsquoCentrifuge assessment of the effects of polymer treatment on penetrometer responsersquo International Journal for
Numerical and Analytical Methods in Geomechanics in pressReid D amp Fourie AB 2017b lsquoEffects of polymer treatment on undrained strengths and cyclic behavior of a low-plasticity slurryrsquo Journal of
Geotechnical and Geoenvironmental Engineering vol 143 no 6Reid D Utting L amp Fourie AB 2015 lsquoAssessing the effects of polymer treatment segregation considerationsrsquo Proceedings of Tailings and
Mine Waste 2015 The University of British Columbia VancouverRiley T Reid D amp Utting L 2015 lsquoPolymer-modified tailings deposition ndash ongoing testing and potential storage efficiency opportunitiesrsquo
in RJ Jewell amp AB Fourie (eds) Proceedings of the 18th International Seminar on Paste and Thickened Tailings Australian Centre for Geomechanics Perth pp 139ndash152
Robertson PK 1990 lsquoSoil classification using the cone penetration testrsquo Canadian Geotechnical Journal vol 27 no 1 pp 151ndash158Sachan A amp Penumadu D 2007 lsquoEffect of microfabric on shear behavior of kaolin clayrsquo Journal of Geotechnical and Geoenvironmental
Engineering vol 133 no 3 pp 306ndash318Stewart BM Backer RR amp Busch RA 1986 Thickening Fine Coal Refuse Slurry for Rapid Dewatering and Enhanced Safety report of
investigations United States Department of the Interior Bureau of Mines Washington DCWang YH amp Siu WK 2006 lsquoStructure characteristics and mechanical properties of kaolinite soils II Effects of structure on mechanical
propertiesrsquo Canadian Geotechnical Journal vol 43 no 6 pp 601ndash617Wells PS amp Kaminsky HAW 2015 lsquoSlurry to soil clay behaviour model - using methylene blue to cross the processgeotechnical engineering
dividersquo Proceedings of Tailings and Mine Waste 2015 The University of British Columbia VancouverYao D amp Znidarcic D 1997 Crust Formation and Desiccation Characteristics for Phosphatic Clays users manual for computer program
CONDES0 Florida Institute of Phosphate Research Polk CountyZnidarcic D Adkins S Utting L amp Catling M 2015 lsquoRheomax ETD technology a laboratory study of application performance and
associated geotechnical characteristics for polymer assisted tailings deposition of oil sands MFTrsquo Proceedings of Tailings and Mine Waste 2015 The University of British Columbia Vancouver pp 508ndash520
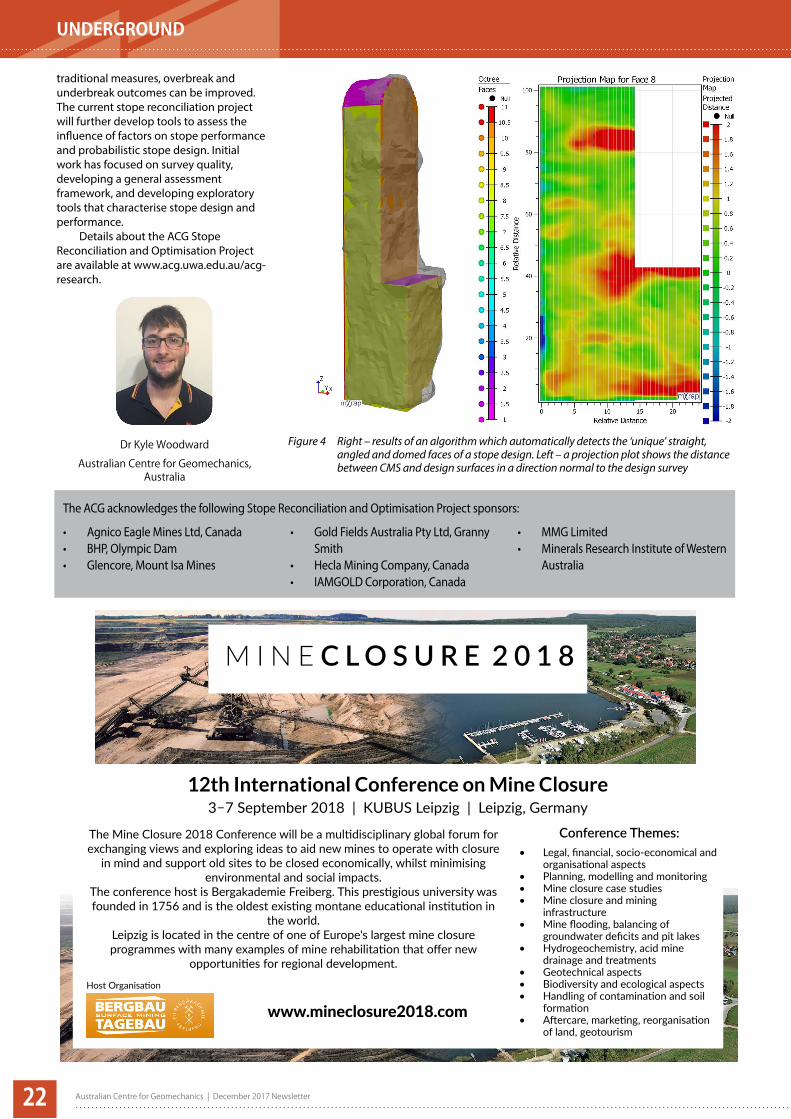
UNDERGROUND
Australian Centre for Geomechanics | December 2017 Newsletter22
traditional measures overbreak and underbreak outcomes can be improved The current stope reconciliation project will further develop tools to assess the influence of factors on stope performance and probabilistic stope design Initial work has focused on survey quality developing a general assessment framework and developing exploratory tools that characterise stope design and performance
Details about the ACG Stope Reconciliation and Optimisation Project are available at wwwacguwaeduauacg-research
Figure 4 Right ndash results of an algorithm which automatically detects the lsquouniquersquo straight angled and domed faces of a stope design Left ndash a projection plot shows the distance between CMS and design surfaces in a direction normal to the design survey
Dr Kyle Woodward
Australian Centre for Geomechanics Australia
The ACG acknowledges the following Stope Reconciliation and Optimisation Project sponsors
bull Agnico Eagle Mines Ltd Canadabull BHP Olympic Dambull Glencore Mount Isa Mines
bull Gold Fields Australia Pty Ltd Granny Smith
bull Hecla Mining Company Canadabull IAMGOLD Corporation Canada
bull MMG Limitedbull Minerals Research Institute of Western
Australia
12th International Conference on Mine Closure3ndash7 September 2018 | KUBUS Leipzig | Leipzig Germany
The Mine Closure 2018 Conference will be a multidisciplinary global forum for exchanging views and exploring ideas to aid new mines to operate with closure
in mind and support old sites to be closed economically whilst minimising environmental and social impacts
The conference host is Bergakademie Freiberg This prestigious university was founded in 1756 and is the oldest existing montane educational institution in
the worldLeipzig is located in the centre of one of Europes largest mine closure programmes with many examples of mine rehabilitation that offer new
opportunities for regional development
wwwmineclosure2018com
Conference Themesbull Legal financial socio-economical and
organisational aspectsbull Planning modelling and monitoringbull Mine closure case studiesbull Mine closure and mining
infrastructurebull Mine flooding balancing of
groundwater deficits and pit lakesbull Hydrogeochemistry acid mine
drainage and treatmentsbull Geotechnical aspectsbull Biodiversity and ecological aspectsbull Handling of contamination and soil
formationbull Aftercare marketing reorganisation
of land geotourism
Host Organisation
M I N E C L O S U R E 2 0 1 8
PASTE amp THICKENED TAILINGS
Australian Centre for Geomechanics | December 2017 Newsletter 23
IntroductionAttempts to improve the dewatering
behaviour of tailings through the addition of polymers at the point of discharge appear to have been first attempted in the early 1980s on coal tailings (Backer amp Busch 1981 Stewart et al 1986) Significant interest has developed more recently with a variety of applications on a number of tailings types over the past 15 years (Jeeravipoolvarn et al 2009 Riley et al 2015 Cooling amp Beveridge 2015) Terminology for this technology varies with it having been referred to as inline flocculation secondary flocculation and polymer treatment Herein it is referred to as polymer treatment (PT)
While initial impetus for polymer application is generally focused on rapid initial water release reduction in particle segregation and near-surface strength gain (ie for equipment access) implementation of PT can have ongoing effects on the geotechnical behaviour of tailings This is of importance with respect to the stability of the tailings storage facility (TSF) should the strength of PT tailings be relied upon when utilised in upstream raising or should they form part of a steepened beach without containment Further PT effects on ongoing consolidation behaviour will impact how a TSF consolidates over time
In terms of assessing the geotechnical effects of PT mature fine tailings (MFT) deposits are likely those that have received the greatest attention (Jeeravipoolvarn et al 2009 Beier et al 2013 Gholami amp Simms 2015) The oil sand MFT deposits are of significant area and extent exhibit low dewatering rates and without some form of treatment are very soft thus making covering difficult As such the potential for PT to accelerate and increase water release and thus surficial tailings strength gain has been studied extensively While the MFT research has led to major contributions to our understanding of the effects of PT MFT tailings are a unique material type and hence the applicability of this experience to other materials is unknown Further a number of key areas such as effects of PT on critical state rate effects of shear and behaviour of penetrometers in PT materials have received limited attention to date
To investigate some of the issues outlined between 2011 and 2014 a series of laboratory and centrifuge tests were carried out on a low plasticity slurry in an untreated (UT) and PT state at The University of Western Australia (UWA)
with financial support from the Australian Centre for Geomechanics (ACG) This work was summarised in three journal papers (Reid amp Fourie 2016 2017a 2017b) and two conference papers (Reid amp Fourie 2015 Reid et al 2015) This article provides a summary of the major outcomes of this research project
Material developmentFor the purposes of this research
project a synthetic slurry was developed comprising laboratory standard sand silt and kaolin clays mixed such that the resulting composite had similar gradation and plasticity to many tailings considered for PT A synthetic material was developed for this study rather than an actual tailings as it was important that essentially unlimited quantities of identical material could be produced (particularly for beam centrifuge tests) and to prevent any potential difficulties in obtaining permissions for publication that can occasionally occur when using an actual tailings
After development of the composite slurry BASF Australia Ltd provided assistance in selecting a polymer and dosage that significantly increased dewatering rates with high molecular weight polyacrylamide polymer Rheomax ETD DPW 1687 selected on this basis at an application rate of 500 g of polymer per tonne of dry solids
In addition to the UT and PT samples a sheared PT material (PT-S) was created
by preparing a batch of PT sample which was then sheared for 5 min using a plaster mixer This batch was created to enable some limited assessment of the effects of shearing during deposition andor flow on a beach on resulting geotechnical behaviour as shearing has been shown to reduce the effects of PT on MFT (Jeeravipoolvarn et al 2014)
Study methodsLaboratory
A series of laboratory element tests were carried out on both UT and PT specimens using slurry consolidometer triaxial (K0 and isotropic) and monotonic and cyclic direct simple shear (DSS) tests These tests were used to estimate consolidation behaviour shear strength critical state line (CSL) location and cyclic behaviour
To prepare samples for testing material was either poured directly into the testing device (slurry consolidometer) or firstly one-dimensionally consolidated in a cylinder then extruded and trimmed for subsequent testing (triaxial and DSS)
CentrifugeWhile laboratory element testing
enables direct comparison of material behaviour under known stress conditions in actual tailings practice it is more typical to initially characterise a deposit by means of penetrometer testing The cone penetration test with piezometer included (CPTu) is by far the most common
Effects of polymer treatment on geotechnical properties of a low-plasticity slurryby Dr David Reid and Professor Andy Fourie The University of Western Australia Australia
Figure 1 Miniature T-bar just prior to commencing penetration in PT material
PASTE amp THICKENED TAILINGS
Australian Centre for Geomechanics | December 2017 Newsletter24
penetrometer test used in tailings while full-flow penetrometers such as the ball penetrometer are increasingly finding application in soft tailings deposits (Wells amp Kaminsky 2015 Reid 2016) To enable penetrometer testing of two deposits with and without PT beam centrifuge testing was conducted The beam centrifuge is a
device within which a vessel containing soil is spun at significantly higher acceleration than normal gravity This enables a soil depth of ~200 mm within the centrifuge to exhibit the same stress field as a 20 m deep deposit Various tests and observations can then be made
While field-scale comparisons of UT
and PT would be preferable to centrifuge testing a true comparison of field-scale deposits would require a significant quantity of tailings to be deposited with identical index properties into two discrete areas This is likely to be impractical to achieve in any full scale scenario
The University of Western Australiarsquos 36 m diameter beam centrifuge was used in this study to enable miniature penetrometer (CPTu and T-Bar) testing on UT and PT samples The material was prepared in a similar way to the laboratory samples except on much larger scale Once spinning within the centrifuge a series of miniature CPTu and T-bar penetrometer tests were carried out Different penetration rates were used to enable assessment of the effects of drainage and shear rate on the results Dissipation tests were carried out as part of CPTu probing Figure 1 shows model preparation of the PT material with a T-bar positioned for a sounding
ResultsConsolidation behaviour
The results of consolidation testing are summarised in Figures 2 and 3 The testing indicated that the PT and PT-S materials exhibited a looser final dry density across the range of stresses tested than the UT material Alternatively permeability values for PT material were as much as an order of magnitude higher than UT while PT-S exhibited a permeability between that of UT and PT
The results from laboratory consolidation testing dissipation tests carried out during miniature CPTu probing and the rate of self-weight consolidation during centrifuge ramp-up are synthesised in Figure 4 The results are generally consistent with PT showing much higher rates of consolidation (consistent with higher permeability) The materials are only slightly anisotropic with respect to rate of consolidation with chcv ratios of approximately 14
That application of PT could significantly affect fabric and consolidation behaviour of a slurry with clay mineralogy should not be surprising eg changes to consolidation behaviour as significant as those shown here have previously been indicated merely from changing the pore fluid chemistry of a clay slurry (Wang amp Siu 2006 Sachan amp Penumadu 2007) While the lower final density resulting from PT is not a positive outcome in itself the effect of changes to consolidation behaviour on the densities achieved in a tailings deposit is more complicated as discussed subsequently in this article
Shear behaviourThe end points of each triaxial test on
PT and UT samples and the CSLs inferred are summarised as a state diagram in
Figure 2 Dry density versus vertical effective stress comparison slurry consolidometer results
Figure 3 Permeability versus vertical effective stress comparison slurry consolidometer results
Figure 4 Coefficient of consolidation estimates from laboratory and centrifuge
PASTE amp THICKENED TAILINGS
Australian Centre for Geomechanics | December 2017 Newsletter 25
Figure 5 The triaxial testing indicated a consistent difference between the UT and PT CSLs across a wide range of effective stresses For each material different triaxial test types all tended towards the same CSL The clear difference of the CSL between PT and UT is of significant importance when considering the application of critical state-based methods to assess the stability of thickened tailings stacks (Li et al 2009) should such stacks employ PT
Figure 6 presents the undrained strength ratio results for DSS tests carried out at a range of strain rates Despite the varying strain rates each test was carried out under constant volume ie approximately undrained conditions PT samples are seen to exhibit slightly greater strain rate sensitivity It is interesting to consider this result in the context of hand shear vane testing of PT trial deposits which would typically be sheared at high strain rate Although higher PT strengths have been seen in such testing (Beier et al 2013 Cooling amp Beveridge 2015) part of the observed difference may be a function of strain rate dependency This is an important consideration as the hand shear vane is often the most common tool used to characterise thin depths of PT material in trial deposits
The post-cyclic strength for a series of UT and PT tests are summarised in Figure 7 suggesting a very similar decay in undrained strength ratio for the two materials under a given amount of cyclic straining This suggests that the PT material at least in a post-cyclic loading scenario does not appear to be more brittle than UT material
Centrifuge penetrometer testingFigure 8 presents normalised
penetration resistance (Q) measured from CPT and T-bar tests at a range of dimensionless penetration velocities (V) (Finnie amp Randolph 1994) The UT material shows behaviour typical of a contractive clayndashsand mixture with low penetration resistances during high rates of penetration when excess pore pressures are generated during probing (Jaeger et al 2010) At lower velocities Q is seen to increase as the penetration process approaches drained conditions Alternatively PT material gives a relatively consistent penetration resistance across the range of V values applied This may be a result of the higher permeability of the PT material resulting in less excess pore pressure generation However at high rates of penetration PT material was seen to exhibit dilative behaviour under probing contrary to the expected behaviour of the material from laboratory element tests
Figure 9 summarises the results of CPT probes in a QndashFr soil type plot (Robertson 1990) This enables comparison of the inferred dilativecontractive state
of the material and the general soil type suggested from the CPT data channels The CPT results give drastically different results for the UT and PT samples when viewed in this context For example PT plots as having lower compressibility to UT material ndash the opposite of the laboratory results
for the two materials Although extensive examination of the implications of the QndashFr results is beyond the scope of this article it is clear that care is required when using the CPT to classify a PT deposit for undrained strength or to determine in situ state
Figure 5 State diagram and inferred CSLs
Figure 6 Rate effects in DSS shearing
Figure 7 Post-cyclic strength behaviour
PASTE amp THICKENED TAILINGS
Australian Centre for Geomechanics | December 2017 Newsletter26
The general results seen in centrifuge testing may be similar to those seen in one field-scale comparison of CPT probing through PT and UT material (da Silva 2011) In that example CPT probes through PT material showed much higher tip resistances which may have been a result primarily of increased drainage around the cone rather than an actual increase in strength or a denser state This confirms that great care is required in the use of penetration tests to obtain undrained shear strengths or state estimates in PT material
Consolidation modelling The realised average density within
a tailings deposit which is often the parameter of greatest relevance to an operator is a function of more than simply the final dry density under a given vertical effective stress Rather it is also affected by hydraulic conductivity ie rate of consolidation of the deposited material and the rate at which tailings are deposited into a given area
To enable comparison of the behaviour of idealised PT and UT tailings deposition the finite strain consolidation code CONDES0 (Yao amp Znidarcic 1997) was used Model parameters were based on test data previously presented (Figures 2 and 3) The CONDES0 code enables finite strain consolidation modelling of one-dimensional columns under different material placement rates Therefore models can be run with different rates of new material being added to the model per unit time ie different rates of rise (RoR) An important consideration regarding RoR should be noted in this context ndash specifically that there are different forms of RoR which require careful consideration when making comparisons in finite strain codes Three forms of RoR are considered herein as follows
bull Slurry RoR This represents the rate at which the deposited slurry would increase in height were no water release to occur (ie the material remained in a slurry state indefinitely) While a generally unrealistic scenario the slurry RoR is the required starting point for developing comparison models as it is only a function of cell area deposition rate and slurry density
bull Settled RoR The rate at which the tailings level would increase were the material to undergo hindered settling but no further consolidation As typical finite strain models including CONDES0 operate in an effective stress framework they are incapable of modelling the behaviour of slurries prior to the development of effective stress Therefore settled RoR forms the input to a finite difference code
bull Realised RoR This is the RoR value
observed on an actual tailings deposit and is also the value typically being discussed when referring to RoR in tailings practice Factors that affect realised RoR include the rate of deposition cell area consolidation characteristics of the tailings and drainage conditionsThe results of average dry density in
an idealised tailings deposit are presented in Figure 10 for a model assuming no
bottom drainage The data is presented as the average dry density in the model after a period of five years where the slurry RoR is varied from 5ndash40 myear At low slurry RoR the UT material achieves higher dry densities as consolidation keeps up with the deposition rate and therefore the higher final dry density of UT material governs what is achieved However as RoR increases the higher hydraulic conductivity of PT material increases in
Figure 9 Results summarised in a CPT classification chart
Figure 8 Dimensionless penetration resistance versus dimensionless penetration velocity
Drained penetration
Partially drained penetration
Undrained penetration
PASTE amp THICKENED TAILINGS
Australian Centre for Geomechanics | December 2017 Newsletter 27
importance eventually leading to higher average densities This difference becomes significant at high RoR Similar results were indicated by Znidarcic et al (2015) for MFT
Primary outcomes and future areas
The primary outcomes of the study discussed in this article are outlined as follows
bull Polymer treatment affected consolidation behaviour in two distinct ways (a) resulting in lower final densities at a given vertical effective stress while (b) resulting in higher permeability at a given density Numerical modelling of the effect of these changes on achievable dry density in an idealised storage area indicated that the potential benefits of PT with respect to average density and water release were manifested at high slurry RoR values
bull The study provided clear evidence that PT changed the location of the materialrsquos CSL This is an important consideration given potential application of PT in achieving steepened tailings beaches Application of critical state methods to assess the liquefaction susceptibility
of such beaches should include checks on the effect of PT on the CSL Publication of additional data for other materials of such observations would be of benefit
bull Significant shearing of the material after treatment resulted in a substantial reduction in some of the geotechnical effects of PT It is noted that the only sheared samples tested in this study were heavily sheared in order to represent a fully sheared case Further testing of PT tailings under different magnitudes of shear to link to behaviour down the beach would be beneficial
bull PT material exhibited slightly higher sensitivity to increased strain rates in terms of undrained shear strength This suggests caution must be applied when interpreting the results of hand shear vane tests which are often used to compare the behaviour of UT to PT material in trial-scale deposits
bull PT material exhibited higher penetration resistances in centrifuge testing This is despite the PT material having similar shear strengths when measured in laboratory element tests The increased drainage rates of PT material appear to be a
major contributor to the different penetrometer responses This is important to consider when comparing the results of the penetration tests of UT and PT deposits or when using the CPTu to determine in situ strengths and state of PT deposits
bull Consolidation modelling indicates that the rate of deposition ie slurry RoR has a major effect on whether PT will result in higher dry densities in a full-scale deposit At high deposition rates the higher permeability values of the PT material outweigh its lower final densities such that the average dry density achieved during deposition is higher than UT material
AcknowledgementsThe authors acknowledge the financial
assistance of the ACG the assistance of UWA laboratory centrifuge personnel and polymer treatment advice provided by BASF Australia Ltd
Article references are available at acguwaeduaunewsletters-annual-reports
Figure 10 Consolidation modelling summary
Dr David Reid
The University of Western Australia Australia
Professor Andy Fourie
The University of Western Australia Australia
21ST INTERNATIONAL SEMINAR ON
PASTE AND THICKENED TAILINGS11ndash13 APRIL 2018 | RENDEZVOUS HOTEL PERTH SCARBOROUGH | WESTERN AUSTRALIA
Principal SponsorWWWPASTE2018COM
EARLYBIRD REGISTRATION ENDS
26 FEBRUARY 2018
ACG event schedule
The
ACG
even
t sch
edule
is su
bject
to ch
ange
A u s t r a l i a n C e n t r e f o r G e o m e c h a n i c s | V o l u m e N o 4 6 | D e c e m b e r 2 0 1 7
wwwacguwaeduauevents
2018Static Liquefaction Workshop 6ndash7 March 2018 | Melbourne Australia
Rheology Fundamentals for Slurries and Pastes Workshop 9 April 2018 | Perth Australia
Is the Future Filtered Paste and Thickened Tailings Short Course 10 April 2018 | Perth Australia
21st International Seminar on Paste and Thickened Tailings wwwpaste2018com 11ndash13 April 2018 | Perth Australia
Instrumentation and Slope Monitoring Workshop 9 April 2018 | Seville Spain
InSAR Radar and Emerging Technologies Workshop 10 April 2018 | Seville Spain
Practical Rock Mechanics in Mining Short Course 14ndash16 May 2018 | Perth Australia
Introduction to Mine Seismicity Short Course 17ndash18 May 2018 | Perth Australia
Fourth International Symposium on Block and Sublevel Caving wwwcaving2018com 15ndash17 October 2018 | Vancouver Canada
Ground Support in Cave Mining Workshop 18 October 2018 | Vancouver Canada
Geotechnical Engineering for Open Pit Mines Short Course 23ndash25 October 2018 | Perth Australia
Instrumentation and Slope Monitoring Workshop 26 October 2018 | Perth Australia
Management Operation and Relinquishment of Tailings Storage Facilities 5ndash6 December 2018 | Perth Australia
Australian Centre for Geomechanics | 35 Stirling Hwy (M600) | Crawley Western Australia | Australia 6009Ph +61 8 6488 3300 | info-acguwaeduau | wwwacguwaeduau
FOURTH INTERNATIONAL SYMPOSIUM ON
BLOCK AND SUBLEVEL CAVING 15ndash17 OCTOBER 2018 | VANCOUVER CANADA
wwwcaving2018comABSTRACTS DUE 19 FEBRUARY 2018
SUNDAY | 14 OCTOBER
MONDAY | 15 OCTOBER
TUESDAY | 16 OCTOBER
WEDNESDAY | 17 OCTOBER
THURSDAY | 18 OCTOBER
FRIDAY | 19 OCTOBER
SRK Cave Mining Forum
Fourth International Symposium on Block and Sublevel Caving
ACG Ground Support in Cave
Mining Workshop
Site Visit to New Afton Mine
Symposium Dinner
Australian Centre for Geomechanics 2014 mXrap Australian Centre for Geomechanics Perth httpwwwmxrapcomBeck D Levkovitch V amp Simser B 2012 lsquoExplicit dynamic simulation for probabilistic forecasting of fault slip and rock mass seismic
potentialrsquo in Y Potvon (ed) Proceedings of the Sixth International Seminar on Deep and High Stress Mining Australian Centre for Geomechanics Perth pp 373ndash388
Hudyma M 2005 An introduction to mine seismicity seminar notes Australian Centre for Geomechanics PerthMcGaughey J 2014 lsquoA framework for 4D quantitative back-analysis and estimation of geotechnical hazard potential in minesrsquo Proceedings
of Geohazards 6 Canadian Geotechnical Society RichmondMendecki A 1993 lsquoReal time quantitative seismology in minesrsquo in RP Young (ed) Proceedings of the 3rd International Symposium on
Rockbursts and Seismicity in Mines AA Balkema Rotterdam pp 287ndash295Simser B amp Pritchard C 2010 lsquoObservational ground control at Xstratarsquos Nickel Rim South Mine Sudbury Ontariorsquo Proceedings of the
Canadian Institute of Mining Operatorrsquos Conference Canadian Institute of Mining Metallurgy and Petroleum Westmount Simser B Jalbout A amp Pakalnis R 2014 lsquoStability graph method for open stope design ndash case histories from two Sudbury Basin minesrsquo
Proceedings of the 1st International Conference on Applied Empirical Design Methods in Mining International Society for Rock Mechanics Lisbon
Simser B 2013 lsquoSeismic monitoring at Nickel Rim South Minersquo Proceedings of the 6th Microseismic Symposium and Workshop Engineering Seismology Group Kingston
van Aswegen G amp Butler AG 1993 lsquoApplications of quantitative seismology in South African gold minesrsquo in RP Young (ed) Proceedings of the 3rd International Symposium on Rockbursts and Seismicity in Mines AA Balkema Rotterdam pp 261ndash266
Rock mechanics tools for mining in high stress ground conditions at Nickel Rim South Mineby Ali Jalbout Goldcorp Inc Canada and Brad Simser Sudbury Integrated Nickel Operations A Glencore Company Canada
References from page 1ndash8 click here to return to article
References
Continued overleaf
Andrews SJ 1998 lsquoStratigraphy and depositional setting of the upper McNamara Group Lawn Hills region Northwest Queenslandrsquo Economic Geology vol 93 pp 1132ndash1152
Broadbent GC Andrews SJ amp Kelso IJ 2002 lsquoA decade of new ideas geology and exploration history of the Century Zn-Pb-Ag deposit northwestern Queensland Australiarsquo Society of Economic Geologists Special Publication 9 pp 119ndash140
Cawood F amp Stacey T 2006 lsquoSurvey and geotechnical slope monitoring considerationsrsquo The Journal of the South African Institute of Mining and Metallurgy vol 106 pp 495ndash502
Goodman RE Taylor RL amp Brekke TL 1968 lsquoA model for the mechanics of jointed rocksrsquo Journal of Soil Mechanics and Foundations Division vol 94 no 3 pp 634ndash659
Hammah R Yacoub T Corkum B amp Curran J 2008 lsquoThe practical modelling of discontinuous rock masses with finite element analysisrsquo Proceedings of the 42nd US Rock Mechanics Symposium American Rock Mechanics Association Alexandria
Harries N Noon D amp Rowley K 2006 lsquoCase studies of slope stability radar used in open cut minesrsquo Stability of Rock Slopes in Open Pit Mining and Civil Engineering Situations pp 335ndash342
Hutchison BJ Naude S amp Howarth J 2015 lsquoManagement of a toppling failiure wall collapse at the Kanmantoo Copper Mine in South Australiarsquo Proceedings of the 2015 International Symposium on Rock Slope Stability in Open Pit Mining and Civil Engineering The Southern African Institue of Mining and Metallurgy Johannesburg pp 81ndash98
Kurukuk N amp Sweeney E 2012 lsquoSlope stability assessment centuryrsquo Proceedings of the 9th AustraliandashNew Zealand Young Geotechnical Professionals Conference The New Zealand Geotechnical Society Wellington
Little MJ 2006 lsquoSlope monitoring strategy at PPRust open pit operationrsquo Proceedings of the 2016 International Symposium on Stability of Rock Slopes in Open Pit Mining and Civil Engineering The Southern African Institute of Mining and Metallurgy Johannesburg pp 211ndash230
Lynch RA amp Malovichko DA 2006 lsquoSeismology and slope stability in open pit minesrsquo Proceedings of the 2006 International Symposium on Stability of Rock Slopes in Open Pit Mining and Civil Engineering The Southern Africa Institute of Mining and Metallurgy Johannesburg pp 375ndash390
The geotechnical conundrum are surface observations reflecting rock mass behaviour at depthby Dr Michele Salvoni Australia and Professor Phil Dight Australian Centre for Geomechanics Australia
References from page 16ndash19 click here to return to article
References
Continued overleaf
Backer RR amp Busch RA 1981 Fine coal refuse slurry dewatering United States Department of the Interior Bureau of Mines Washington DCBeier N Wilson W Dunmola A amp Sego D 2013 lsquoImpact of flocculation-based dewatering on the shear strength of oil sands fine tailingsrsquo
Canadian Geotechnical Journal vol 50 no 9 pp 1001ndash1007Cooling D amp Beveridge A 2015 lsquoUse of Rheomaxreg ETD technology to thicken bauxite residual slurry during Super Thickener bypassrsquo
in AB Fourie amp RJ Jewell (eds) Paste and Thickened Tailings ndash A Guide 3rd edn Australian Centre for Geomechanics Perth pp 311ndash313Da Silva F 2011 lsquoReducing risks to tailings storage facilities through in-line flocculationrsquo in J Han amp DE Alzamora (eds) Proceedings of
GeoFrontiers 2011 Advances in Geotechnical Engineering American Society of Civil Engineers Reston pp 2937ndash2946Finnie IMS amp Randolph MF 1994 lsquoPunch-through and liquefaction induced failure of shallow foundations on calcareous sedimentsrsquo
Proceedings of the Seventh International Conference on Behavior of Offshore Structures (BOSS 94) Massachusetts Institute of Technology Cambridge pp 217ndash230
Gholami R amp Simms P 2015 lsquoShear behaviour in element testing of polymer amended mature fine tailingsrsquo Proceedings of the 68th Canadian Geotechnical Conference Canadian Geotechnical Society Richmond
Jaeger RA Dejong JT Boulanger RW Low HE amp Randolph MF 2010 lsquoVariable penetration rate CPT in an intermediate soilrsquo in PK Robertson amp PW Maybe (eds) Proceedings of the 2nd International Symposium on Cone Penetration Testing (CPT10)
Jeeravipoolvarn S Scott D Chalaturnyk R amp Shaw B 2014 lsquoEffect of pipeline shear on consolidation properties of oil sands fine tailingsrsquo Proceedings of Tailings and Mine Waste 2014 Information Technology Creative Media Vancouver pp 495ndash506
Jeeravipoolvarn S Scott J amp Chalaturnyk R 2009 lsquoGeotechnical characteristics of laboratory in-line thickened oil sands tailingsrsquo Proceedings of Tailings and Mine Waste 2009 Information Technology Creative Media Vancouver pp 813ndash828
Li AL Been K Ritchie D amp Welch D 2009 lsquoStability of large thickened non-segregated tailings slopesrsquo in RJ Jewell AB Fourie S Barrera and J Wiertz (eds) Proceedings of the 12th International Seminar on Paste and Thickened Australian Centre for Geomechanics Perth pp 301ndash312
Reid D 2016 lsquoEffect of rotation rate on shear vane results in a silty tailingsrsquo in BM Lehane HE Acosta-Martinez and R Kelly (eds) Proceedings of the 5th International Conference on Geotechnical and Geophysical Site Characterisation vol 1 Australian Geomechanics Society St Ives pp 369ndash374
Reid D amp Fourie AB 2015 lsquoEffects of shear on the behaviour of polymer-treated slurriesrsquo in FR Nejad (ed) Proceedings of Tailings and Mine Waste Management for the 21st Century The Australian Institute of Mining and Metallurgy Melbourne pp 215ndash224
Reid D amp Fourie AB 2016 lsquoLaboratory assessment of the effects of polymer treatment on geotechnical properties of low plasticity soil slurryrsquo Canadian Geotechnical Journal vol 53 no 10 pp 1718ndash1730
Effects of polymer treatment on geotechnical properties of a low-plasticity slurryby Dr David Reid and Professor Andy Fourie The University of Western Australia AustraliaReferences from page 23ndash27 click here to return to article
Marques EAG Vargas Jr EDA amp Antunes FS 2005 lsquoA study of the durability of some shales mudrocks and siltstones from Brazilrsquo Geotechnical amp Geological Engineering vol 23 pp 321ndash348
Read J 2007 lsquoPredicting the behaviour and failure of large rock slopesrsquo Proceedings of the 1st Canada-US Rock Mechanics Symposium American Rock Mechanics Association Alexandria
Sainsbury B Sainsbury D amp Hebert Y 2013 lsquoAssessment of the long-term stability of the Stage 8 West Wall Cutback at MMG Centuryrsquo unpublished Itasca internal report Itasca Australia Pty Ltd
Salvoni M 2015 lsquoRock mechanical characterization of the carbonate breccia and black carbonaceous shalesrsquo unpublished Australian Centre for Geomechanics report Australian Centre for Geomechanics Perth
Salvoni M amp Dight PM 2016 lsquoRock damage assessment in a large unstable slope from microseismic monitoring-MMG Century mine (Queensland Australia) case studyrsquo Engineering Geology vol 210 pp 45ndash56
Stacey P 2009 lsquoFundamentals of slope designrsquo in J Read and P Stacey (eds) Guidelines for Open Pit Slope Designrsquo AA Balkema Rotterdam pp 1ndash14
Sweeney E amp Abbott K 2016 lsquoGeotechnical analyses for risk managment of a large scale failure at Century mine Northwest Queenslandrsquo in PM Dight (ed) Proceedings of the First Asia Pacific Slope Stability in Mining Conference Australian Centre for Geomechanics Perth pp 225ndash238
Taylor RK amp Smith TJ 1986 lsquoThe engineering geology of clay minerals swelling shrinking and mudrock breakdownrsquo Clay Minerals vol 21 pp 235ndash260
Walkinshaw J amp Santi P 1996 Chapter 21 Shales and other degradable materials Landslides Investigation and Mitigation TRB Special Report vol 247 pp 555ndash576
Wesseloo J amp Sweby GJ 2008 lsquoMicroseismic monitoring of hard rock mine slopesrsquo in Y Potvin J Carter A Dyskin and R Jeffrey (eds) Proceedings of the First Southern Hemisphere International Rock Mechanics Symposium Australian Centre for Geomechanics Perth pp 433ndash450
Xiao Y-X Feng X-T Hudson JA Chen B-R Feng G-L amp Liu J-P 2016 lsquoISRM suggested method for in situ microseismic monitoring of the fracturing process in rock massesrsquo Rock Mechanics and Rock Engineering vol 49 pp 343ndash369
ReferencesReid D amp Fourie AB 2017a lsquoCentrifuge assessment of the effects of polymer treatment on penetrometer responsersquo International Journal for
Numerical and Analytical Methods in Geomechanics in pressReid D amp Fourie AB 2017b lsquoEffects of polymer treatment on undrained strengths and cyclic behavior of a low-plasticity slurryrsquo Journal of
Geotechnical and Geoenvironmental Engineering vol 143 no 6Reid D Utting L amp Fourie AB 2015 lsquoAssessing the effects of polymer treatment segregation considerationsrsquo Proceedings of Tailings and
Mine Waste 2015 The University of British Columbia VancouverRiley T Reid D amp Utting L 2015 lsquoPolymer-modified tailings deposition ndash ongoing testing and potential storage efficiency opportunitiesrsquo
in RJ Jewell amp AB Fourie (eds) Proceedings of the 18th International Seminar on Paste and Thickened Tailings Australian Centre for Geomechanics Perth pp 139ndash152
Robertson PK 1990 lsquoSoil classification using the cone penetration testrsquo Canadian Geotechnical Journal vol 27 no 1 pp 151ndash158Sachan A amp Penumadu D 2007 lsquoEffect of microfabric on shear behavior of kaolin clayrsquo Journal of Geotechnical and Geoenvironmental
Engineering vol 133 no 3 pp 306ndash318Stewart BM Backer RR amp Busch RA 1986 Thickening Fine Coal Refuse Slurry for Rapid Dewatering and Enhanced Safety report of
investigations United States Department of the Interior Bureau of Mines Washington DCWang YH amp Siu WK 2006 lsquoStructure characteristics and mechanical properties of kaolinite soils II Effects of structure on mechanical
propertiesrsquo Canadian Geotechnical Journal vol 43 no 6 pp 601ndash617Wells PS amp Kaminsky HAW 2015 lsquoSlurry to soil clay behaviour model - using methylene blue to cross the processgeotechnical engineering
dividersquo Proceedings of Tailings and Mine Waste 2015 The University of British Columbia VancouverYao D amp Znidarcic D 1997 Crust Formation and Desiccation Characteristics for Phosphatic Clays users manual for computer program
CONDES0 Florida Institute of Phosphate Research Polk CountyZnidarcic D Adkins S Utting L amp Catling M 2015 lsquoRheomax ETD technology a laboratory study of application performance and
associated geotechnical characteristics for polymer assisted tailings deposition of oil sands MFTrsquo Proceedings of Tailings and Mine Waste 2015 The University of British Columbia Vancouver pp 508ndash520

PASTE amp THICKENED TAILINGS
Australian Centre for Geomechanics | December 2017 Newsletter 27
importance eventually leading to higher average densities This difference becomes significant at high RoR Similar results were indicated by Znidarcic et al (2015) for MFT
Primary outcomes and future areas
The primary outcomes of the study discussed in this article are outlined as follows
bull Polymer treatment affected consolidation behaviour in two distinct ways (a) resulting in lower final densities at a given vertical effective stress while (b) resulting in higher permeability at a given density Numerical modelling of the effect of these changes on achievable dry density in an idealised storage area indicated that the potential benefits of PT with respect to average density and water release were manifested at high slurry RoR values
bull The study provided clear evidence that PT changed the location of the materialrsquos CSL This is an important consideration given potential application of PT in achieving steepened tailings beaches Application of critical state methods to assess the liquefaction susceptibility
of such beaches should include checks on the effect of PT on the CSL Publication of additional data for other materials of such observations would be of benefit
bull Significant shearing of the material after treatment resulted in a substantial reduction in some of the geotechnical effects of PT It is noted that the only sheared samples tested in this study were heavily sheared in order to represent a fully sheared case Further testing of PT tailings under different magnitudes of shear to link to behaviour down the beach would be beneficial
bull PT material exhibited slightly higher sensitivity to increased strain rates in terms of undrained shear strength This suggests caution must be applied when interpreting the results of hand shear vane tests which are often used to compare the behaviour of UT to PT material in trial-scale deposits
bull PT material exhibited higher penetration resistances in centrifuge testing This is despite the PT material having similar shear strengths when measured in laboratory element tests The increased drainage rates of PT material appear to be a
major contributor to the different penetrometer responses This is important to consider when comparing the results of the penetration tests of UT and PT deposits or when using the CPTu to determine in situ strengths and state of PT deposits
bull Consolidation modelling indicates that the rate of deposition ie slurry RoR has a major effect on whether PT will result in higher dry densities in a full-scale deposit At high deposition rates the higher permeability values of the PT material outweigh its lower final densities such that the average dry density achieved during deposition is higher than UT material
AcknowledgementsThe authors acknowledge the financial
assistance of the ACG the assistance of UWA laboratory centrifuge personnel and polymer treatment advice provided by BASF Australia Ltd
Article references are available at acguwaeduaunewsletters-annual-reports
Figure 10 Consolidation modelling summary
Dr David Reid
The University of Western Australia Australia
Professor Andy Fourie
The University of Western Australia Australia
21ST INTERNATIONAL SEMINAR ON
PASTE AND THICKENED TAILINGS11ndash13 APRIL 2018 | RENDEZVOUS HOTEL PERTH SCARBOROUGH | WESTERN AUSTRALIA
Principal SponsorWWWPASTE2018COM
EARLYBIRD REGISTRATION ENDS
26 FEBRUARY 2018
ACG event schedule
The
ACG
even
t sch
edule
is su
bject
to ch
ange
A u s t r a l i a n C e n t r e f o r G e o m e c h a n i c s | V o l u m e N o 4 6 | D e c e m b e r 2 0 1 7
wwwacguwaeduauevents
2018Static Liquefaction Workshop 6ndash7 March 2018 | Melbourne Australia
Rheology Fundamentals for Slurries and Pastes Workshop 9 April 2018 | Perth Australia
Is the Future Filtered Paste and Thickened Tailings Short Course 10 April 2018 | Perth Australia
21st International Seminar on Paste and Thickened Tailings wwwpaste2018com 11ndash13 April 2018 | Perth Australia
Instrumentation and Slope Monitoring Workshop 9 April 2018 | Seville Spain
InSAR Radar and Emerging Technologies Workshop 10 April 2018 | Seville Spain
Practical Rock Mechanics in Mining Short Course 14ndash16 May 2018 | Perth Australia
Introduction to Mine Seismicity Short Course 17ndash18 May 2018 | Perth Australia
Fourth International Symposium on Block and Sublevel Caving wwwcaving2018com 15ndash17 October 2018 | Vancouver Canada
Ground Support in Cave Mining Workshop 18 October 2018 | Vancouver Canada
Geotechnical Engineering for Open Pit Mines Short Course 23ndash25 October 2018 | Perth Australia
Instrumentation and Slope Monitoring Workshop 26 October 2018 | Perth Australia
Management Operation and Relinquishment of Tailings Storage Facilities 5ndash6 December 2018 | Perth Australia
Australian Centre for Geomechanics | 35 Stirling Hwy (M600) | Crawley Western Australia | Australia 6009Ph +61 8 6488 3300 | info-acguwaeduau | wwwacguwaeduau
FOURTH INTERNATIONAL SYMPOSIUM ON
BLOCK AND SUBLEVEL CAVING 15ndash17 OCTOBER 2018 | VANCOUVER CANADA
wwwcaving2018comABSTRACTS DUE 19 FEBRUARY 2018
SUNDAY | 14 OCTOBER
MONDAY | 15 OCTOBER
TUESDAY | 16 OCTOBER
WEDNESDAY | 17 OCTOBER
THURSDAY | 18 OCTOBER
FRIDAY | 19 OCTOBER
SRK Cave Mining Forum
Fourth International Symposium on Block and Sublevel Caving
ACG Ground Support in Cave
Mining Workshop
Site Visit to New Afton Mine
Symposium Dinner
Australian Centre for Geomechanics 2014 mXrap Australian Centre for Geomechanics Perth httpwwwmxrapcomBeck D Levkovitch V amp Simser B 2012 lsquoExplicit dynamic simulation for probabilistic forecasting of fault slip and rock mass seismic
potentialrsquo in Y Potvon (ed) Proceedings of the Sixth International Seminar on Deep and High Stress Mining Australian Centre for Geomechanics Perth pp 373ndash388
Hudyma M 2005 An introduction to mine seismicity seminar notes Australian Centre for Geomechanics PerthMcGaughey J 2014 lsquoA framework for 4D quantitative back-analysis and estimation of geotechnical hazard potential in minesrsquo Proceedings
of Geohazards 6 Canadian Geotechnical Society RichmondMendecki A 1993 lsquoReal time quantitative seismology in minesrsquo in RP Young (ed) Proceedings of the 3rd International Symposium on
Rockbursts and Seismicity in Mines AA Balkema Rotterdam pp 287ndash295Simser B amp Pritchard C 2010 lsquoObservational ground control at Xstratarsquos Nickel Rim South Mine Sudbury Ontariorsquo Proceedings of the
Canadian Institute of Mining Operatorrsquos Conference Canadian Institute of Mining Metallurgy and Petroleum Westmount Simser B Jalbout A amp Pakalnis R 2014 lsquoStability graph method for open stope design ndash case histories from two Sudbury Basin minesrsquo
Proceedings of the 1st International Conference on Applied Empirical Design Methods in Mining International Society for Rock Mechanics Lisbon
Simser B 2013 lsquoSeismic monitoring at Nickel Rim South Minersquo Proceedings of the 6th Microseismic Symposium and Workshop Engineering Seismology Group Kingston
van Aswegen G amp Butler AG 1993 lsquoApplications of quantitative seismology in South African gold minesrsquo in RP Young (ed) Proceedings of the 3rd International Symposium on Rockbursts and Seismicity in Mines AA Balkema Rotterdam pp 261ndash266
Rock mechanics tools for mining in high stress ground conditions at Nickel Rim South Mineby Ali Jalbout Goldcorp Inc Canada and Brad Simser Sudbury Integrated Nickel Operations A Glencore Company Canada
References from page 1ndash8 click here to return to article
References
Continued overleaf
Andrews SJ 1998 lsquoStratigraphy and depositional setting of the upper McNamara Group Lawn Hills region Northwest Queenslandrsquo Economic Geology vol 93 pp 1132ndash1152
Broadbent GC Andrews SJ amp Kelso IJ 2002 lsquoA decade of new ideas geology and exploration history of the Century Zn-Pb-Ag deposit northwestern Queensland Australiarsquo Society of Economic Geologists Special Publication 9 pp 119ndash140
Cawood F amp Stacey T 2006 lsquoSurvey and geotechnical slope monitoring considerationsrsquo The Journal of the South African Institute of Mining and Metallurgy vol 106 pp 495ndash502
Goodman RE Taylor RL amp Brekke TL 1968 lsquoA model for the mechanics of jointed rocksrsquo Journal of Soil Mechanics and Foundations Division vol 94 no 3 pp 634ndash659
Hammah R Yacoub T Corkum B amp Curran J 2008 lsquoThe practical modelling of discontinuous rock masses with finite element analysisrsquo Proceedings of the 42nd US Rock Mechanics Symposium American Rock Mechanics Association Alexandria
Harries N Noon D amp Rowley K 2006 lsquoCase studies of slope stability radar used in open cut minesrsquo Stability of Rock Slopes in Open Pit Mining and Civil Engineering Situations pp 335ndash342
Hutchison BJ Naude S amp Howarth J 2015 lsquoManagement of a toppling failiure wall collapse at the Kanmantoo Copper Mine in South Australiarsquo Proceedings of the 2015 International Symposium on Rock Slope Stability in Open Pit Mining and Civil Engineering The Southern African Institue of Mining and Metallurgy Johannesburg pp 81ndash98
Kurukuk N amp Sweeney E 2012 lsquoSlope stability assessment centuryrsquo Proceedings of the 9th AustraliandashNew Zealand Young Geotechnical Professionals Conference The New Zealand Geotechnical Society Wellington
Little MJ 2006 lsquoSlope monitoring strategy at PPRust open pit operationrsquo Proceedings of the 2016 International Symposium on Stability of Rock Slopes in Open Pit Mining and Civil Engineering The Southern African Institute of Mining and Metallurgy Johannesburg pp 211ndash230
Lynch RA amp Malovichko DA 2006 lsquoSeismology and slope stability in open pit minesrsquo Proceedings of the 2006 International Symposium on Stability of Rock Slopes in Open Pit Mining and Civil Engineering The Southern Africa Institute of Mining and Metallurgy Johannesburg pp 375ndash390
The geotechnical conundrum are surface observations reflecting rock mass behaviour at depthby Dr Michele Salvoni Australia and Professor Phil Dight Australian Centre for Geomechanics Australia
References from page 16ndash19 click here to return to article
References
Continued overleaf
Backer RR amp Busch RA 1981 Fine coal refuse slurry dewatering United States Department of the Interior Bureau of Mines Washington DCBeier N Wilson W Dunmola A amp Sego D 2013 lsquoImpact of flocculation-based dewatering on the shear strength of oil sands fine tailingsrsquo
Canadian Geotechnical Journal vol 50 no 9 pp 1001ndash1007Cooling D amp Beveridge A 2015 lsquoUse of Rheomaxreg ETD technology to thicken bauxite residual slurry during Super Thickener bypassrsquo
in AB Fourie amp RJ Jewell (eds) Paste and Thickened Tailings ndash A Guide 3rd edn Australian Centre for Geomechanics Perth pp 311ndash313Da Silva F 2011 lsquoReducing risks to tailings storage facilities through in-line flocculationrsquo in J Han amp DE Alzamora (eds) Proceedings of
GeoFrontiers 2011 Advances in Geotechnical Engineering American Society of Civil Engineers Reston pp 2937ndash2946Finnie IMS amp Randolph MF 1994 lsquoPunch-through and liquefaction induced failure of shallow foundations on calcareous sedimentsrsquo
Proceedings of the Seventh International Conference on Behavior of Offshore Structures (BOSS 94) Massachusetts Institute of Technology Cambridge pp 217ndash230
Gholami R amp Simms P 2015 lsquoShear behaviour in element testing of polymer amended mature fine tailingsrsquo Proceedings of the 68th Canadian Geotechnical Conference Canadian Geotechnical Society Richmond
Jaeger RA Dejong JT Boulanger RW Low HE amp Randolph MF 2010 lsquoVariable penetration rate CPT in an intermediate soilrsquo in PK Robertson amp PW Maybe (eds) Proceedings of the 2nd International Symposium on Cone Penetration Testing (CPT10)
Jeeravipoolvarn S Scott D Chalaturnyk R amp Shaw B 2014 lsquoEffect of pipeline shear on consolidation properties of oil sands fine tailingsrsquo Proceedings of Tailings and Mine Waste 2014 Information Technology Creative Media Vancouver pp 495ndash506
Jeeravipoolvarn S Scott J amp Chalaturnyk R 2009 lsquoGeotechnical characteristics of laboratory in-line thickened oil sands tailingsrsquo Proceedings of Tailings and Mine Waste 2009 Information Technology Creative Media Vancouver pp 813ndash828
Li AL Been K Ritchie D amp Welch D 2009 lsquoStability of large thickened non-segregated tailings slopesrsquo in RJ Jewell AB Fourie S Barrera and J Wiertz (eds) Proceedings of the 12th International Seminar on Paste and Thickened Australian Centre for Geomechanics Perth pp 301ndash312
Reid D 2016 lsquoEffect of rotation rate on shear vane results in a silty tailingsrsquo in BM Lehane HE Acosta-Martinez and R Kelly (eds) Proceedings of the 5th International Conference on Geotechnical and Geophysical Site Characterisation vol 1 Australian Geomechanics Society St Ives pp 369ndash374
Reid D amp Fourie AB 2015 lsquoEffects of shear on the behaviour of polymer-treated slurriesrsquo in FR Nejad (ed) Proceedings of Tailings and Mine Waste Management for the 21st Century The Australian Institute of Mining and Metallurgy Melbourne pp 215ndash224
Reid D amp Fourie AB 2016 lsquoLaboratory assessment of the effects of polymer treatment on geotechnical properties of low plasticity soil slurryrsquo Canadian Geotechnical Journal vol 53 no 10 pp 1718ndash1730
Effects of polymer treatment on geotechnical properties of a low-plasticity slurryby Dr David Reid and Professor Andy Fourie The University of Western Australia AustraliaReferences from page 23ndash27 click here to return to article
Marques EAG Vargas Jr EDA amp Antunes FS 2005 lsquoA study of the durability of some shales mudrocks and siltstones from Brazilrsquo Geotechnical amp Geological Engineering vol 23 pp 321ndash348
Read J 2007 lsquoPredicting the behaviour and failure of large rock slopesrsquo Proceedings of the 1st Canada-US Rock Mechanics Symposium American Rock Mechanics Association Alexandria
Sainsbury B Sainsbury D amp Hebert Y 2013 lsquoAssessment of the long-term stability of the Stage 8 West Wall Cutback at MMG Centuryrsquo unpublished Itasca internal report Itasca Australia Pty Ltd
Salvoni M 2015 lsquoRock mechanical characterization of the carbonate breccia and black carbonaceous shalesrsquo unpublished Australian Centre for Geomechanics report Australian Centre for Geomechanics Perth
Salvoni M amp Dight PM 2016 lsquoRock damage assessment in a large unstable slope from microseismic monitoring-MMG Century mine (Queensland Australia) case studyrsquo Engineering Geology vol 210 pp 45ndash56
Stacey P 2009 lsquoFundamentals of slope designrsquo in J Read and P Stacey (eds) Guidelines for Open Pit Slope Designrsquo AA Balkema Rotterdam pp 1ndash14
Sweeney E amp Abbott K 2016 lsquoGeotechnical analyses for risk managment of a large scale failure at Century mine Northwest Queenslandrsquo in PM Dight (ed) Proceedings of the First Asia Pacific Slope Stability in Mining Conference Australian Centre for Geomechanics Perth pp 225ndash238
Taylor RK amp Smith TJ 1986 lsquoThe engineering geology of clay minerals swelling shrinking and mudrock breakdownrsquo Clay Minerals vol 21 pp 235ndash260
Walkinshaw J amp Santi P 1996 Chapter 21 Shales and other degradable materials Landslides Investigation and Mitigation TRB Special Report vol 247 pp 555ndash576
Wesseloo J amp Sweby GJ 2008 lsquoMicroseismic monitoring of hard rock mine slopesrsquo in Y Potvin J Carter A Dyskin and R Jeffrey (eds) Proceedings of the First Southern Hemisphere International Rock Mechanics Symposium Australian Centre for Geomechanics Perth pp 433ndash450
Xiao Y-X Feng X-T Hudson JA Chen B-R Feng G-L amp Liu J-P 2016 lsquoISRM suggested method for in situ microseismic monitoring of the fracturing process in rock massesrsquo Rock Mechanics and Rock Engineering vol 49 pp 343ndash369
ReferencesReid D amp Fourie AB 2017a lsquoCentrifuge assessment of the effects of polymer treatment on penetrometer responsersquo International Journal for
Numerical and Analytical Methods in Geomechanics in pressReid D amp Fourie AB 2017b lsquoEffects of polymer treatment on undrained strengths and cyclic behavior of a low-plasticity slurryrsquo Journal of
Geotechnical and Geoenvironmental Engineering vol 143 no 6Reid D Utting L amp Fourie AB 2015 lsquoAssessing the effects of polymer treatment segregation considerationsrsquo Proceedings of Tailings and
Mine Waste 2015 The University of British Columbia VancouverRiley T Reid D amp Utting L 2015 lsquoPolymer-modified tailings deposition ndash ongoing testing and potential storage efficiency opportunitiesrsquo
in RJ Jewell amp AB Fourie (eds) Proceedings of the 18th International Seminar on Paste and Thickened Tailings Australian Centre for Geomechanics Perth pp 139ndash152
Robertson PK 1990 lsquoSoil classification using the cone penetration testrsquo Canadian Geotechnical Journal vol 27 no 1 pp 151ndash158Sachan A amp Penumadu D 2007 lsquoEffect of microfabric on shear behavior of kaolin clayrsquo Journal of Geotechnical and Geoenvironmental
Engineering vol 133 no 3 pp 306ndash318Stewart BM Backer RR amp Busch RA 1986 Thickening Fine Coal Refuse Slurry for Rapid Dewatering and Enhanced Safety report of
investigations United States Department of the Interior Bureau of Mines Washington DCWang YH amp Siu WK 2006 lsquoStructure characteristics and mechanical properties of kaolinite soils II Effects of structure on mechanical
propertiesrsquo Canadian Geotechnical Journal vol 43 no 6 pp 601ndash617Wells PS amp Kaminsky HAW 2015 lsquoSlurry to soil clay behaviour model - using methylene blue to cross the processgeotechnical engineering
dividersquo Proceedings of Tailings and Mine Waste 2015 The University of British Columbia VancouverYao D amp Znidarcic D 1997 Crust Formation and Desiccation Characteristics for Phosphatic Clays users manual for computer program
CONDES0 Florida Institute of Phosphate Research Polk CountyZnidarcic D Adkins S Utting L amp Catling M 2015 lsquoRheomax ETD technology a laboratory study of application performance and
associated geotechnical characteristics for polymer assisted tailings deposition of oil sands MFTrsquo Proceedings of Tailings and Mine Waste 2015 The University of British Columbia Vancouver pp 508ndash520