Embed Size (px)
Citation preview

ENSCO
NASA Contractor Report CR-203009
Final Report on the AMU NEXRAD Exploitation Task
Prepared by: Applied Meteorology Unit
Prepared for: Kennedy Space Center Under Contract NAS10-96018
NASA National Aeronautics and Space Administration
Office of Management
Scientific and Technical Information Program
1997

ENSCO
i
ATTRIBUTES AND ACKNOWLEDGMENTS:
Dr. Francis J. Merceret PH-B3
Applied Meteorology Unit (AMU):
Winifred C. Lambert, Author Mark M. Wheeler, Author
ENSCO
ii
Table of Contents
List of Figures ................................................................................................................................................iv
List of Tables..................................................................................................................................................vi
Executive Summary...................................................................................................................................... vii
1. Introduction .................................................................................................................................................1
1.1 Purpose of the Report ...........................................................................................................................1
1.2 Organization of the Report ...................................................................................................................1
1.3 NEXRAD System Capabilities.............................................................................................................1
1.4 NEXRAD System Characteristics ........................................................................................................3
1.4.1 Modes of Operation ......................................................................................................................3
1.4.1.1 Clear Air Mode .....................................................................................................................3
1.4.1.2 Precipitation Mode................................................................................................................3
1.4.2 Algorithm Descriptions.................................................................................................................4
1.5 NEXRAD Exploitation Task Procedures .............................................................................................4
1.5.1 AMU Tasking ...............................................................................................................................5
1.5.2 Data Collection and Case Study Analysis.....................................................................................5
1.5.3 WSR-88D Analysis and Display Tools ........................................................................................6
1.5.3.1 Motif-IRAS ...........................................................................................................................6
1.5.3.2 88Display ..............................................................................................................................6
1.5.3.3 WATADS .............................................................................................................................7
1.5.3.4 The PUP ................................................................................................................................8
2. Case Studies ..............................................................................................................................................10
2.1 Overview of the Case Studies.............................................................................................................10
2.2 Convection Initiation Mechanisms .....................................................................................................10
2.2.1 Boundary Layer Convection .......................................................................................................11
2.2.2 Sea Breeze...................................................................................................................................15
2.2.3 Merritt Island Convergence ........................................................................................................18
ENSCO
iii
Table of Contents (continued)
2.2.4 Indian River Convergence ..........................................................................................................19
2.2.5 Interlake Convergence ................................................................................................................20
2.2.6 Storm Outflow Boundaries .........................................................................................................21
2.2.7 Fires ............................................................................................................................................23
2.3 Severe Storms .....................................................................................................................................25
3. Summary and Recommendations ..............................................................................................................36
3.1 Techniques to Use with PUP to Identify Signatures...........................................................................36
3.1.1 Convection Initiation ..................................................................................................................36
3.1.2 Severe Storms .............................................................................................................................38
3.2 Future NEXRAD Products and Displays ...........................................................................................40
3.2.1 Suggested Improvements for the Current System.......................................................................40
3.2.2 Future Systems............................................................................................................................41
3.2.2.1 WATADS and WDSS.........................................................................................................42
3.2.2.2 Current Research for Future Displays.................................................................................42
3.3 Conclusions ........................................................................................................................................43
4. References .................................................................................................................................................45

ENSCO
iv
List of Figures
Figure 1-1 Overview of the NEXRAD system equipment and data flow................................................2
Figure 1-2 NEXRAD Radar Data Acquisition (RDA) unit. ....................................................................2
Figure 1-3 An example of the WATADS display....................................................................................8
Figure 1-4 The PUP display.....................................................................................................................9
Figure 2-1 Visible satellite image of HCRs in southeast Florida. ..........................................................12
Figure 2-2 Schematic diagram showing the interaction between HCRs and the sea breeze front (Figure 8 in Atkins et al. 1995). ...........................................................................................12
Figure 2-3 10 August 1995 2109 UTC WSR-88D/KMLB 0.5˚ reflectivity image. ..............................14
Figure 2-4 20 July 1995 1755 UTC WSR-88D/KMLB 0.5˚ reflectivity image. ...................................15
Figure 2-5 8 August 1995 2008 UTC WSR-88D/KMLB 0.5˚ reflectivity image. ................................16
Figure 2-6 20 July 1995 1742 UTC WSR-88D/KMLB 0.5˚ reflectivity image. ...................................17
Figure 2-7 12 July 1995 1607 UTC WSR-88D/KMLB 0.5˚ reflectivity image. ...................................19
Figure 2-8 28 June 1995 1600 UTC WSR-88D/KMLB 0.5˚ reflectivity image....................................20
Figure 2-9 11 July 1995 1831 UTC WSR-88D/KMLB 0.5˚ reflectivity image. ...................................22
Figure 2-10 6 September 1995 1705 UTC WSR-88D/KMLB 0.5˚ reflectivity image. ...........................23
Figure 2-11 11 July 1995 1601 UTC WSR-88D/KMLB 0.5˚ reflectivity image. ...................................24
Figure 2-12 11 July 1995 1951 UTC WSR-88D/KMLB 0.5˚ reflectivity image. ...................................25
Figure 2-13 CCAS sounding at 1445 UTC on 26 June 1995. Wind speed is in knots and temperature is in ˚C. .............................................................................................................27
Figure 2-14 Time series for the KSC cell that produced a 38 kt gust at 2107 UTC. ...............................27
Figure 2-15 26 June 1995 2110 UTC WSR-88D/KMLB 0.5˚ velocity image showing the microburst signature over the Cape. .....................................................................................28
Figure 2-16 CCAS sounding at 1325 UTC on 10 July 1995. Wind speed is in knots and temperature is in ˚C. .............................................................................................................29
Figure 2-17 Time series for the KSC cell that produced a 63 kt gust at 2120 UTC. ...............................30
Figure 2-18 10 July 1995 2117 UTC WSR-88D/KMLB 0.5˚ velocity image showing the microburst signature northwest of the Cape. ........................................................................31
Figure 2-19 Time series for the Cocoa Beach cell that produced a 47 kt gust at 2010 UTC at tower 300 (near Hwy. 528).............................................................................................................32

ENSCO
v
List of Figures (continued)
Figure 2-20 7 September 1995 1954 UTC WSR-88D/KMLB 0.5˚ velocity image showing the microburst signature south of the Cape. ...............................................................................33
Figure 3-1 VCP 11 scan strategy. Note the higher vertical resolution for cells within 80 km of the radar......................................................................................................................................39
Figure 3-2 VCP 21 scan strategy. Note the gaps in vertical coverage for cells within 80 km of the radar......................................................................................................................................39
List of Tables
Table 2-1 Summary of the convective days chosen for the case studies and the data collected. ‘All’ indicates both the Level II and Level IV data were available....................................................10
Table 2-2 Chronological List of Examined Microburst Events.....................................................................34
ENSCO
vi
Executive Summary
The objectives of this task are to determine what radar signatures are present prior to and at the time of convection initiation, and to determine radar signatures which will help distinguish whether the ensuing convection will become severe. Radar data from the WSR-88D radar located at NWS Melbourne (WSR-88D/KMLB) were collected between June and September 1995, and 16 convective case studies were analyzed for which the radar was operating during the entire period of interest. To meet the objectives, these data were analyzed with other radar data analysis tools besides the PUP (Principle User Processor) to bring further insight into the radar-detectable signatures associated with convection initiation and severe storm development.
All WSR-88D/KMLB products were scrutinized for their utility in detecting convection initiation signatures. The analysis was confined to base reflectivity, velocity, spectrum width, and composite reflectivity in which the features involved in convection initiation could be detected. Through process of elimination, it was found that the 0.5˚ reflectivity product with the lowest reflectivity values displayed is the best product to monitor for convection initiation signatures. Because most of the summertime convection in east central Florida is triggered by boundary layer rather than upper level dynamic processes, the upper level scans provided little information regarding the location of convection initiation signatures. Velocity components of the features which were weak or not parallel to the radial of the beam made them very difficult to detect. The spectrum width field had an overall noisy appearance and gave no indication of the existence of important features. In the composite reflectivity product, weaker convection initiation features can be hidden by scatterers aloft that have higher reflectivities.
There were seven features identified as convection initiation signatures in this study, most of which are already familiar to forecasters. They are horizontal convective rolls (HCRs), the sea breeze, the Merritt Island convergence zone, the Indian River convergence zone, interlake convergence, storm outflow boundaries, and fires. Interactions between two or more of the features were always observed in the data (except for one case of Merritt Island convergence) before convection was initiated.
Many of these features were detectable on the PUP in the 5 to 15 dBZ range. Features in these reflectivity ranges are most easily detected when the radar is in clear air mode as the value range displayed is -28 to 28 dBZ. However, the radar is usually in precipitation mode during the summer. The lowest value displayed in this mode is 5 dBZ. Weak boundaries with reflectivities ≤ 5 dBZ, which were often responsible for the initiation of convection, are not well defined or not detected in precipitation mode. This underscores the importance of monitoring the lowest levels of reflectivity values in precipitation mode. The weaker (radar-undetectable) boundaries can be monitored in the visible satellite image when clouds form above them.

ENSCO
vii
The following procedures are recommended for optimal detection of convection initiation signatures:
• Request that WSR-88D/KMLB operate in clear air mode as long as possible and monitor the 0.5˚ reflectivity product in order that any weak features responsible for initiating the first cells of the day be detected.
• Display the full range of reflectivity values in the 0.5˚ reflectivity product in order to detect most of the features responsible for initiating subsequent convection.
• Monitor the visible satellite image in conjunction with the radar data as the very weak boundaries and HCRs may not be radar detectable in precipitation mode.
Monitoring the full range of reflectivity values (second recommendation) may be difficult for forecasters to implement consistently as they will also need to use other configurations which will help them determine the structure and severity of existing cells. Under these circumstances the 0.5˚ reflectivity product could be monitored as part of a 4-panel display in one of the PUP monitors.
All WSR-88D/KMLB products were scrutinized, both singly and in combination with other products, to determine their utility in detecting severe storm precursors and signatures. Severe storms possess at least one of the following three features: 1) winds ≥ 50 kt, 2) 3/4” hail, and 3) tornadoes/waterspouts. In the data collected for this study, the most common severe weather element was that of high winds from microbursts. There were few instances of confirmed observations of 3/4” hail and only one confirmed tornado. Thus, the WSR-88D products were only analyzed for precursors to high wind events.
The data were analyzed with WATADS (WSR-88D Algorithm Testing and Display System) which displays the values of the radar derived products in time series graphs for each individual cell. This analysis showed that both the parameter values and trends are essential to the prediction of a high wind event. The values and trends of storm maximum reflectivity, core aspect ratio, and VIL (vertically integrated liquid) proved to be important in predicting microbursts. Typically, the maximum reflectivity remains steady at ≥ 55 dBZ while the values of the other three parameters increase 15 to 20 minutes before the event then decrease sharply 5 to 10 minutes before high winds are observed at the surface. The values of these parameters depend on the operating volume coverage pattern (VCP) of the radar, which is either VCP 21 or VCP 11 when the radar is in precipitation mode. The VCP 11 beam coverage is more complete than that of VCP 21 and provides a better data set for input to the algorithms and, therefore, more accurate parameter values for the storms in question.
There are many other products, including the base data scans, which are helpful in determining the structure, intensity, and parameter trends of a storm. It is best to display these in the 4-panel display feature available on the PUP in specific combinations which will help the forecaster determine the characteristics and intensity of a potentially severe storm. Three sample 4-panel displays are given in this report, and forecasters may wish to build additional displays tailored to their specific needs.

ENSCO
viii
The following procedures are recommended for optimal prediction and detection of severe storms:
• If deep convection is expected to develop from existing cells, operate the radar with VCP 11.
• Monitor the values of maximum reflectivity in the composite reflectivity product, the trends of VIL in the VIL product, and the trends of core aspect ratio (WDSS only) for microburst prediction. Specific values and trends for these parameters are given in the report.
• Use the 4-panel displays given in this report or develop displays to help determine the structure and intensity of existing cells.
Most of the recommended procedures given in this report are already used by operational forecasters at the 45WS, SMG, and NWS Melbourne. All the WSR-88D/KMLB products were thoroughly analyzed with three display tools for new ways to look at the data which would bring further insight into detecting convection initiation and severe storm signatures. These conclusions confirm that the operational procedures in current use are effective and should continue to be employed. This report documents the effectiveness of those procedures and may serve as a training manual for new forecasters unfamiliar with the use of NEXRAD in the central Florida environment.
This report also provides guidance for future research regarding the use of NEXRAD products for detecting convection initiation and severe storm signatures. Suggestions for new and improvements to existing NEXRAD products are provided. Until new products geared toward detecting convection initiation signatures are implemented in the NEXRAD system, no further study is needed for this objective. The severe storm signature objective, however, is not fully complete since analyses for two severe weather features, 3/4” hail and tornadoes, were not possible due to their lack of occurrence in the data. In addition, several new products are available in Build 9.0 whose value in forecasting and detecting severe storms in the central Florida environment is unknown. Future work should be structured such that the WSR-88D/KMLB data set will contain a sufficient number of confirmed occurrences of severe hail and tornadoes so the utility of all the products in forecasting and detecting severe storms can be determined
ENSCO
1
1. Introduction
1.1 Purpose of the Report
The purpose of this report is to document the findings from the Applied Meteorology Unit’s (AMU) WSR-88D (Weather Surveillance Radar 1988 Doppler) Exploitation task. This task focuses on determining convection initiation and severe/non-severe storm radar signatures in east central Florida using data from the WSR-88D radar located at the National Weather Service (NWS) Office in Melbourne, Florida (WSR-88D/KMLB).
1.2 Organization of the Report
The information presented in this report is divided into three major sections. Section 1, Introduction, provides a summary of the Next Generation Weather Radar (NEXRAD) system characteristics. It also includes a restatement of the AMU WSR-88D Exploitation Task and the analysis tools and data used to execute the task. Section 2, Case Studies, contains an overview of the case studies used in determining the convection initiation and severe storm signatures and discusses the particular radar signatures of each phenomenon. Finally, Section 3, Summary and Recommendations, discusses radar products and other data to utilize for identifying convection initiation and severe storm signatures, suggestions for improvements to existing WSR-88D data analysis software, and descriptions of tools being developed which may prove beneficial in an operational setting.
1.3 NEXRAD System Capabilities
All radars in the past have only had the capability to measure target reflectivity. As a Doppler radar, the WSR-88D is also capable of measuring the radial velocity of the radar targets (hydrometeors in most cases). Doppler theory states that the returned signal from a moving target experiences a shift in frequency, referred to as the Doppler shift, when compared to the frequency that would have been returned from a stationary target and is proportional to the speed of the moving target. In practice, the Doppler frequency shift experienced from a moving target is a minute fraction of the original frequency in the transmitted signal and is not detectable by the WSR-88D. Instead, the WSR-88D is designed to detect the phase of the returned signal and therefore, is able to calculate the pulse-to-pulse phase change. Consecutive pulses are transmitted from the radar in phase with each other. After intercepting a moving target, subsequent pulses that are returned to the radar will be out of phase with each other due to the change in location of the target. This phase shift is proportional to the velocity of the target toward or away from the radar.
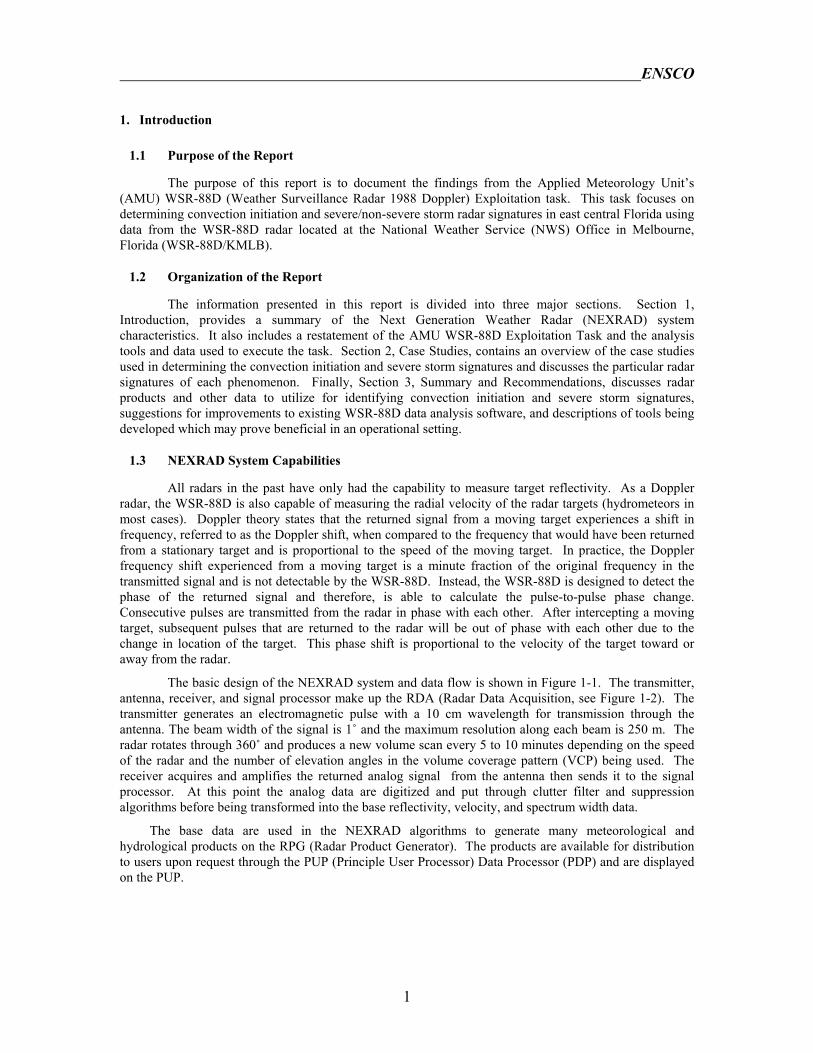
The basic design of the NEXRAD system and data flow is shown in Figure 1-1. The transmitter, antenna, receiver, and signal processor make up the RDA (Radar Data Acquisition, see Figure 1-2). The transmitter generates an electromagnetic pulse with a 10 cm wavelength for transmission through the antenna. The beam width of the signal is 1˚ and the maximum resolution along each beam is 250 m. The radar rotates through 360˚ and produces a new volume scan every 5 to 10 minutes depending on the speed of the radar and the number of elevation angles in the volume coverage pattern (VCP) being used. The receiver acquires and amplifies the returned analog signal from the antenna then sends it to the signal processor. At this point the analog data are digitized and put through clutter filter and suppression algorithms before being transformed into the base reflectivity, velocity, and spectrum width data.
The base data are used in the NEXRAD algorithms to generate many meteorological and hydrological products on the RPG (Radar Product Generator). The products are available for distribution to users upon request through the PUP (Principle User Processor) Data Processor (PDP) and are displayed on the PUP.

ENSCO
2
RECEIVERTRANSMITTER
SIGNAL PROCESSOR
RADAR PRODUCT GENERATOR
(RPG)
ANTENNA Transmitted Signal
Returned Signal/Data/Products
PUP DATA PROCESSOR (PDP)
PRINCIPLE USER PROCESSOR
(PUP)RADAR DATA ACQUISITION
(RDA)
Figure 1-1 Overview of the NEXRAD system equipment and data flow.
QuickTime™ and aPhoto - JPEG decompressor
are needed to see this picture.
Figure 1-2 NEXRAD Radar Data Acquisition (RDA) unit.
1.4 NEXRAD System Characteristics
Along with the Doppler capability discussed in Section 1.3, the WSR-88D uses certain modes of operation which either increase its ability to detect weak meteorological features or improve the spatial and temporal resolution of the data. The products generated by the algorithms in the RPG provide the

ENSCO
3
forecasters with different means of displaying and analyzing the data, not only from their local WSR-88D but also from WSR-88Ds at other sites.
1.4.1 Modes of Operation
The WSR-88D operates in one of two modes: clear air or precipitation. Clear air mode is generally used to detect weak boundary layer features, and precipitation mode is used to monitor areas of precipitation (Federal Meteorological Handbook No. 11, Part C, 1991).
1.4.1.1 Clear Air Mode
The personnel at NWS Melbourne can put the WSR-88D/KMLB in clear air mode when requested by operational forecasters as long as no significant precipitation exists in the radar coverage area. The slower rotation speed of the RDA allows the system to receive more returned energy from a target, thus enabling it to detect weak features. The two VCPs used in clear air mode are VCP 31 and VCP 32. They both produce a volume scan every 10 minutes using five elevation angles (0.5˚, 1.5˚, 2.5˚, 3.5˚, and 4.5˚) but use a different pulse length. VCP 31 uses a longer pulse length than VCP 32 which increases the radar’s maximum range but decreases the maximum spatial resolution by at least 50%. As a result, VCP 32 is primarily used in clear air mode. The radar scans only the lowest elevations of the atmosphere in this mode. Since the number of scatterers that return power in clear air (bugs, birds, dust) decreases with height, there is generally no need to obtain high elevation data. Products created in clear air mode are updated every 10 minutes, the length of time it takes to create a volume scan. Once the radar finds a reflectivity feature that it associates with precipitation, the operating mode is automatically switched from clear air to precipitation mode. The value of reflectivity associated with the change into precipitation mode is approximately 30 dBZ. This automatic switch can be overridden.
1.4.1.2 Precipitation Mode
VCP 21 is the default scan strategy when the radar is switched to precipitation mode. Unlike clear air mode which scans only the low-levels and is repeated every 10 minutes, VCP 21 is designed to produce a volume scan at six minute intervals using nine elevation angles (0.5˚, 1.45˚, 2.4˚, 3.35˚, 4.3˚, 6.0˚, 9.9˚, 14.6˚, and 19.5˚). All products are available and updated every six minutes. However, with only nine elevation angles, some regions of the atmosphere cannot be sampled. Moreover, with a maximum elevation angle of 19.5˚, it is not possible to sample the upper-levels of storms close to the radar. The inability to see the top of a storm will affect products that depend on the volumetric data (e.g., echo tops or vertically integrated liquid). Since there is a maximum of nine samples of the storm structure with height, it is clear that vertical cross-sections taken from these volume scans will have reduced vertical resolution.
VCP 11 is usually selected when deep convection is detected or when severe weather is expected to occur. VCP 11 provides increased vertical and temporal resolution as it contains 14 elevation angles (0.5˚, 1.45˚, 2.4˚, 3.35˚, 4.3˚, 5.25˚, 6.2˚, 7.5˚, 8.7˚, 10.0˚, 12.0˚, 14.0˚, 16.7˚, and 19.5˚) repeated every 5 minutes. The overall increased resolution aids in forecasting the rapid development of severe weather. As with VCP 21, it is not possible to sample the upper-levels of storms close to the radar as the maximum elevation angle is 19.5˚. However, the gain in vertical resolution due to more scans will produce more realistic values in products that depend on the volumetric data.
1.4.2 Algorithm Descriptions
As stated in Section 1.3, the NEXRAD system provides the meteorological community with automatic processing and dissemination of WSR-88D products. There are a total of 31 meteorological products created in the RPG (Federal Meteorological Handbook No. 11, Part C, 1991, herein referred to as FMH-11C). The following is a brief description of several of the algorithms important to this study. Detailed descriptions of these algorithms, including typical uses and limitations, can be found in FMH-11C.
ENSCO
4
Reflectivity - Reflectivity represents the energy returned from a target, usually a hydrometeor. As the size and/or number of targets increase, the reflectivity increases. The reflectivity is displayed for each individual elevation scan in the volume.
Mean Radial Velocity - The mean radial velocity (herein referred to as velocity) is the average velocity of the targets in a gate. Because larger targets return more energy, they contribute the most to the value of this product. The velocity is displayed for each individual elevation scan in the volume.
Spectrum Width - The spectrum width is related to the range of target velocities in a gate. It increases as the variability of the wind increases such as within convergent boundaries or thunderstorms. The spectrum width is displayed for each individual elevation scan in the volume.
Composite Reflectivity - The composite reflectivity product displays the maximum reflectivity observed over a certain area(.54x.54 nmi or 2.2x2.2 nmi) above the surface of the earth. Thus, the value displayed for a given location could come from any of the elevation scans in the current volume.
Storm Series (Tracking) - This algorithm monitors the movement of identified storms by relating the storms in the current volume scan to the storms in the previous volume scan. It starts with the centroid of the most intense storm and relates it to the centroids of cells in the previous volume, beginning with the most intense cell. If a storm cannot be related to a storm in the previous scan, it is designated as a new cell. This algorithm performs well with isolated storms that are not rapidly changing but does lose track or misidentify cluster of cells or cells that are rapidly intensifying.
Vertically Integrated Liquid Water (VIL) - VIL values are related to a storm cell’s updraft strength and potential for producing severe weather. The VIL algorithm estimates the column liquid water content over a 4x4 km (2.2x2.2 nmi) grid box using the radar reflectivities in the column. Each grid box within each elevation scan is given the highest VIL value within the grid box. They are then integrated vertically to produce the VIL for that column. The highest possible value for any grid box is set at 80x106kg km-2 to moderate the values associated with hail.
Echo Tops - The echo top algorithm measures the maximum height where the reflectivity is still greater than or equal to 18.3 dBZ, then adds the mean sea level (MSL) height of the RDA to produce the echo top height. Because of beam widening, the uncertainty of the accuracy of the estimated top increases with range.
1.5 NEXRAD Exploitation Task Procedures
The AMU NEXRAD Exploitation task began in late 1993 as a vision to evaluate the effectiveness and utility of the WSR-88D/KMLB and its products in support of space flight operations. Several meetings to discuss the objectives of the task in detail (in person and via teleconference) were held with the three primary users, the Spaceflight Meteorology Group (SMG), 45th Weather Squadron (45WS), and NWS Melbourne. Several teleconferences were also held with the Operational Support Facility (OSF). The users produced a list of objectives that were ranked by each user according to their operational needs. The objectives that were ranked first on each list were considered for the task. SMG chose the identification of convection initiation signatures, the 45WS chose the determination of severe/non-severe signatures, and NWS Melbourne chose the verification of the VAD (velocity azimuth display) wind profile (VWP). OSF was given the task of the WSR-88D/KMLB VWP verification as they were doing similar work for other WSR-88D sites, and the remaining two objectives became part of the AMU NEXRAD Exploitation task.
1.5.1 AMU Tasking
The official AMU NEXRAD Exploitation task memorandum was distributed in March 1995. The memorandum stated that the AMU would focus on determining convection initiation signatures and severe/non-severe WSR-88D/KMLB storm signatures based on data collected during the summer of 1995.
Goals for the AMU NEXRAD Exploitation task were to

ENSCO
5
• Collect and archive WSR-88D/KMLB clear air and precipitation mode data sets during the warm season,
• Collect at least 10 data sets,
• Collect other key data sources (i.e. satellite, tower, rawinsonde, etc.),
• Study storms that developed near and affected the Kennedy Space Center/Cape Canaveral Air Station (KSC/CCAS) area,
• Use WSR-88D display tools such as Motif-IRAS and others that would help in the post-analysis of the data, and
• Write a report detailing the findings of the analysis.
1.5.2 Data Collection and Case Study Analysis
The AMU collected and archived WSR-88D/KMLB data for case study analyses from June through September 1995. The archived data sets consist of WSR-88D/KMLB Archive Level II data (the digitized data from the signal processor), and Archive Level IV PUP products generated in the RPG. The storms of interest were those that developed in the vicinity of and affected the KSC/CCAS area. It was requested that the radar operate in clear air mode in the morning (1100 - 1600 UTC) in order to detect any weak features that may be responsible for initiating the first convection of the day. However, this was not possible during most of the summer due to early storm development or operational concerns of expected storm development in the area. Therefore, no clear air mode data were available for the analysis of convection initiation.
Although it is an excellent data set, there are two limitations associated with the radar data collected. First, there were a few time periods when the radar base data were not available, and some of the radar data from the crucial periods of convection initiation and development from non-severe to severe convection were missing. Secondly, there was no data collected in clear air mode. In this mode the radar is able to detect low reflectivity convergent areas, such as some outflow boundaries, land-water interfaces, and horizontal convective rolls (HCRs). These features have been shown in numerous field studies to be important in the initiation of convection.
ENSCO
6
The data used in the analyses included but were not limited to the following:
• Radar Data Sources:
- PUP product Level IV archive
- Level II archive from NWS Melbourne
• Other Key Data Sources:
- Satellite imagery (visible and IR)
- Synoptic patterns
- Tower data for cases near the KSC/CCAS
- Microburst Day Potential Index (MDPI)
- Upper air data
- Surface observations
- Lightning Location and Protection (LLP) data sets
- NGM output
This study was based on data from the summer with no major synoptic systems affecting central Florida (excluding tropical systems). With the weak synoptic scale forcing, most thunderstorm development was caused by enhanced low-level convergence associated with interactions between several boundary layer features. With this type of convection initiation, many factors need to be analyzed and projected in time to be able to forecast the area for convective development. These factors include but are not limited to the low- to mid-level moisture and wind flow characteristics, thermodynamic and moisture distribution, and expected genesis area and movement.
1.5.3 WSR-88D Analysis and Display Tools
The following is a brief description of each of the WSR-88D data analysis tools used by the AMU for this task. The first three tools discussed, Motif-IRAS, 88Display, and WATADS, are not available to operational forecasters.
1.5.3.1 Motif-IRAS
Motif-IRAS (Interactive Radar Analysis Software) is an X-Windows/UNIX workstation based software tool used to display radar data. This tool was developed by Mr. Dave Priegnitz at The South Dakota School of Mines and Technology. It has been used exclusively as a research tool to analyze base level data from a number of research radars including the WSR-88D. Motif-IRAS contains a map background of the Florida state boundary on which it can display all elevation angles of reflectivity (0 to 70 dBZ), velocity (-30 to 30 m/s), and spectrum width (0 to 20 m/s). It also has its own algorithms for calculating composite reflectivity, VIL, and echo tops, and for generating CAPPIs and cross sections
1.5.3.2 88Display
The Motif-IRAS display software was modified by Mr. Steve Hoffert and Mr. Matt Pearce of the Department of Meteorology at The Pennsylvania State University into another WSR-88D data display tool called 88Display. This software package displays the Level II data in the same manner as Motif-IRAS, with a few enhancements.
It mimics the NEXRAD algorithms for VIL, echo tops, and composite reflectivity, and has its own algorithms for a user-definable layer composite reflectivity and CAPPI (constant altitude plan position indicator) plots. It has a much higher resolution map background of the Florida counties and coastline than Motif-IRAS that also includes lakes and rivers. It allows for a user-definable color table and has several

ENSCO
7
color tables from which to choose. Perhaps the most important feature is that it is able to display all reflectivity values in the Level II data from -20 to 70 dBZ.
All functions, including displaying a new elevation angle or data type and building a loop, are much faster and more user friendly. The animation algorithm allows the user to loop over an unlimited time frame and to control the speed of the animation. The cross-section utility allows the user control over the direction and width of the cross-section. A keystroke in the display window allows the user to define a new elevation angle or product to display.
1.5.3.3 WATADS
The OSF, on behalf of the NEXRAD agencies, tasked the National Severe Storms Laboratory (NSSL) to enhance and make user-friendly a software package that NSSL had developed for internal use and testing algorithms. The result of this work is the WSR-88D Algorithm Testing And Display System (WATADS) which executes WSR-88D and NSSL algorithms and displays the resulting products (see Figure 1-3). This version of the WATADS (version 8.0, version 9.0 will be released in February 1997), consists of the following algorithms:
• WSR-88D Baseline Algorithms
• Enhanced NSSL Algorithms for;
- Mesocyclone Signature and Mesocyclone Detection
- Tornado Vortex Signature and Tornado Detection
- Storm Series and Storm Cell Identification
- Velocity Dealiasing and Tracking
- Precipitation Processing
- Hail Detection
- Velocity Wind Profile
- Storm Relative Velocity
The display software is a version of the NSSL-developed Radar Algorithm Display System (RADS) (Sanger 1994). The WATADS has some of the functionality of the PUP (e.g., map backgrounds, magnification, animation, etc.). More functionality may be added in future WATADS releases (e.g. vertical cross sections).
ENSCO
8
QuickTime™ and aPhoto - JPEG decompressor
are needed to see this picture.
Figure 1-3 An example of the WATADS display.
The WATADS operates in an X-Windows Motif environment on HP 9000 700 series and SunSPARC 20 UNIX workstations. The WATADS, using Level II data, provides the user with the capability to perform several types of studies including
• Case studies,
• Adaptable algorithm parameter studies,
• Algorithm performance evaluations,
• Baseline and enhanced algorithm performance comparisons, and
• User interface concepts evaluations.
The WATADS provides the user with the ability to change algorithm parameters to emulate the effects the changes would have on the WSR-88D system. The adaptable parameters and their names are the same on the WATADS and the NEXRAD software.
1.5.3.4 The PUP
The final display system used for this task was the PUP workstation (Figure 1-4), which is a part of the PUP group. The PUP group consists of the software and hardware (the PDP, the System Console, and the PUP workstation) that allows the request, receipt, archive, display, manipulation and annotation of WSR-88D products. The PUP workstation is the primary meteorological work area for the operational display and analysis of WSR-88D weather products.

ENSCO
9
QuickTime™ and aPhoto - JPEG decompressor
are needed to see this picture.
Figure 1-4 The PUP display.

ENSCO
10
2. Case Studies
2.1 Overview of the Case Studies
As stated in Section 1.5.2, WSR-88D/KMLB data from the summer of 1995 were collected and archived by the AMU at NWS MLB for case study analyses. Sixteen convective case study days were selected from this data set based on the occurrence of convective activity and data availability (see Table 2-1). On all days convection was initiated and developed under weak tropospheric wind conditions and without support from strong synoptic scale dynamics.
Table 2-1 Summary of the convective days chosen for the case studies and the data collected. ‘All’ indicates both the Level II and Level IV data were available.
Date / Time of Activity
Data Collected
Date / Time of Activity
Data Collected
20 Jun/14 - 23 UTC all 20 Jul/14 - 20 UTC all
26 Jun/15 - 21 UTC all 8 Aug/16 - 21 UTC no Level IV
28 Jun/15 - 21 UTC all 10 Aug/17 - 23 UTC all
10 Jul/17 - 22 UTC all 1 Sep/14 - 19 UTC all
11 Jul/15 - 21 UTC all 6 Sep/14 - 21 UTC all
12 Jul/14 - 18 UTC all 7 Sep/16 - 22 UTC all
13 Jul/17 - 21 UTC all 8 Sep/15 - 21 UTC all
17 Jul/09 - 20 UTC all 12 Sep/13 - 20 UTC all
2.2 Convection Initiation Mechanisms
Convective clouds range in size from the small fair weather cumulus to the large supercell thunderstorm. This study focuses on the initiation of convective clouds that produce precipitation, which includes all precipitating cells up to storms that produce severe weather, herein referred to as deep convection. This type of convection can be initiated by several mechanisms in central Florida. During the fall, winter, and spring strong cold fronts can propagate into the area and induce strong convective outbreaks. Tropical disturbances, such as easterly waves and tropical storms, and frictional convergence from strong onshore flow can also generate strong convection. Convection is triggered in these examples under strong upper-level dynamic influences. However, deep convection over central Florida in the summer is most often triggered by the interactions between boundary layer phenomena rather than influences from upper-level dynamic processes. This was the case in all the data collected for this study.

ENSCO
11
The boundary layer features identified in the data which contributed to the initiation of deep convection include the sea breeze boundary, the boundary layer modes of horizontal roll and cellular convection, the Indian River convergence zone, interlake convergence zones, the Merritt Island convergence zone, storm outflow boundaries, and fires. All of these phenomena are detectable by the WSR-88D in clear air mode. Research has shown that before deep convection forms these features can have reflectivity values from just above to below 0 dBZ (Atkins et al. 1995). The reflectivity range displayed on the PUP in clear air mode is -28 to 28 dBZ. However, the WSR-88D/KMLB was rarely operated in this mode during the data collection period due to operational constraints which caused the radar to be operated in precipitation mode. The lowest reflectivity value displayed in this mode is 5 dBZ. This is adequate to detect the stronger features but weaker features also play an important role in convection initiation and need to be identified by the forecaster. Because of the lack of data below 5 dBZ in the Level IV reflectivity product, the Level II data were used in the 88Display tool to analyze convection initiation signatures. Even when the radar was operating in precipitation mode, reflectivity values down to -20 dBZ could be displayed using this display tool.
The descriptions of each of the features in the boundary layer associated with convection initiation will be discussed separately in the following subsections. However, it is important to note that deep convection was not initiated in this study unless two or more of the following features interacted with each other in some manner. Those interactions will be discussed and examples will be given in each subsection. The reflectivity images presented were created using the 88Display tool. Date, time, location, and elevation angle information is at the top of each image, and the color scale with associated reflectivity values (in dBZ) is at the bottom.
2.2.1 Boundary Layer Convection
Boundary layer convection occurs almost daily over the Florida peninsula as a result of daytime surface heating. This convection can be cellular in nature or organized into linear structures called horizontal convective rolls (HCRs). The former type appears as quasi-evenly spaced small cumulus clouds. The HCRs can be described as horizontal pairs of clockwise and counterclockwise rotating tubes that are oriented quasi-parallel to the mean wind direction (Atkins et al. 1995).
HCRs occur quite frequently over Florida. Evidence of their existence can be seen in visible satellite images as lines of small cumulus clouds, also known as cloud streets, oriented quasi-parallel to the mean low-level flow as seen in Figure 2-1. The clouds are located between rolls where there is surface convergence and upward vertical motion (Figure 2-2). They can be readily seen in the reflectivity field when the WSR-88D is in clear air mode but can also be seen in an animation of the reflectivity product when the radar is in precipitation mode. Their reflectivity values typically range from -5 to 10 dBZ. HCR depth and wavelength (distance between cloud lines) depend on the convective boundary layer (CBL) depth and vertical wind shear. Both depth and wavelength tend to increase throughout the day as the height of the CBL increases and the wind shear decreases due to mixing.

ENSCO
12
Figure 2-1 Visible satellite image of HCRs in southeast Florida. The lines of clouds, or cloud
streets, are actually between the rolls where there is surface convergence and upward motion.
Figure 2-2 Schematic diagram showing the interaction between HCRs and the sea breeze front
(Figure 8 in Atkins et al. 1995). The front is indicated by the barbed line and the circulation at the front is shaded in gray. The white tubes are HCRs and the white arrows between them show the mean flow. Clouds exist where there is upward vertical motion between the rolls and become deeper when they encounter the added upward motion at the front.
ENSCO
13
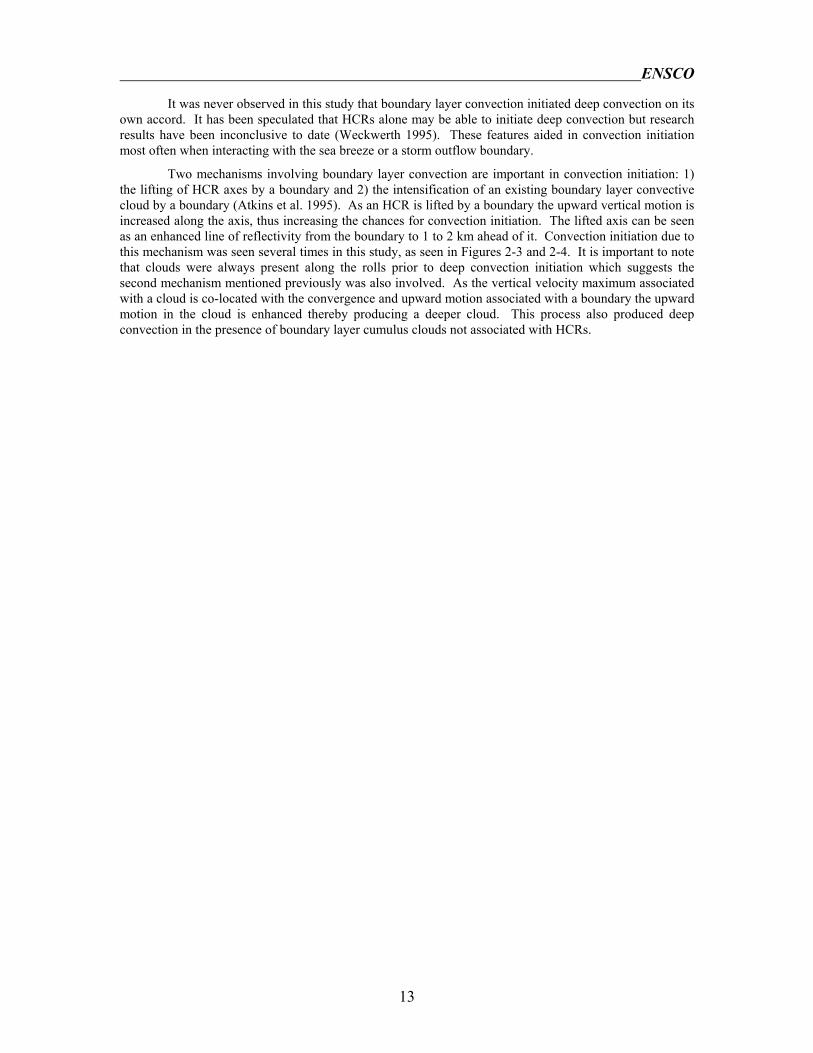
It was never observed in this study that boundary layer convection initiated deep convection on its own accord. It has been speculated that HCRs alone may be able to initiate deep convection but research results have been inconclusive to date (Weckwerth 1995). These features aided in convection initiation most often when interacting with the sea breeze or a storm outflow boundary.
Two mechanisms involving boundary layer convection are important in convection initiation: 1) the lifting of HCR axes by a boundary and 2) the intensification of an existing boundary layer convective cloud by a boundary (Atkins et al. 1995). As an HCR is lifted by a boundary the upward vertical motion is increased along the axis, thus increasing the chances for convection initiation. The lifted axis can be seen as an enhanced line of reflectivity from the boundary to 1 to 2 km ahead of it. Convection initiation due to this mechanism was seen several times in this study, as seen in Figures 2-3 and 2-4. It is important to note that clouds were always present along the rolls prior to deep convection initiation which suggests the second mechanism mentioned previously was also involved. As the vertical velocity maximum associated with a cloud is co-located with the convergence and upward motion associated with a boundary the upward motion in the cloud is enhanced thereby producing a deeper cloud. This process also produced deep convection in the presence of boundary layer cumulus clouds not associated with HCRs.
ENSCO
14
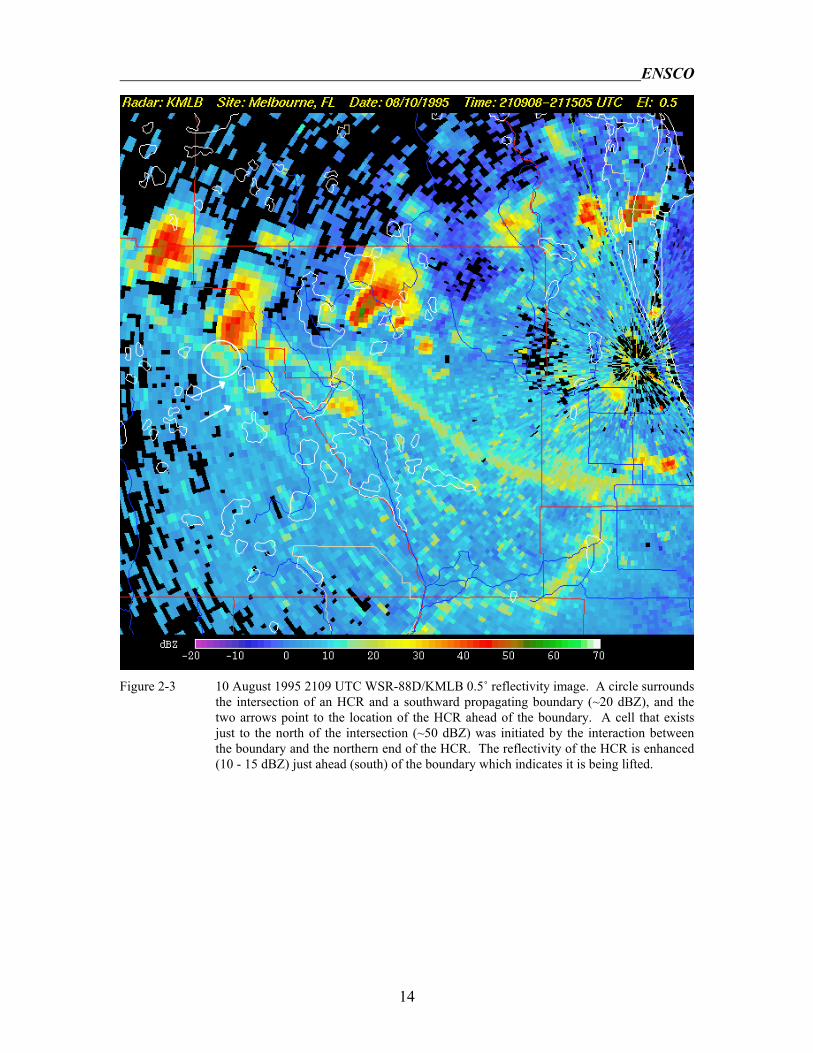
Figure 2-3 10 August 1995 2109 UTC WSR-88D/KMLB 0.5˚ reflectivity image. A circle surrounds
the intersection of an HCR and a southward propagating boundary (~20 dBZ), and the two arrows point to the location of the HCR ahead of the boundary. A cell that exists just to the north of the intersection (~50 dBZ) was initiated by the interaction between the boundary and the northern end of the HCR. The reflectivity of the HCR is enhanced (10 - 15 dBZ) just ahead (south) of the boundary which indicates it is being lifted.
ENSCO
15
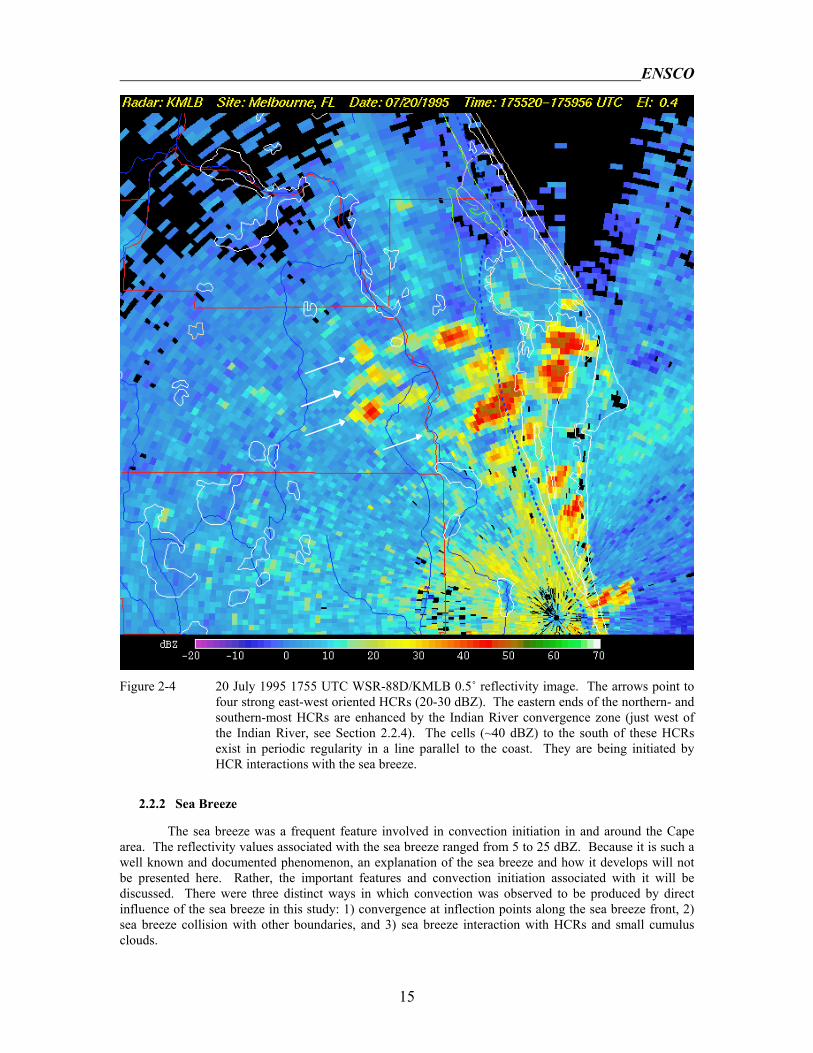
Figure 2-4 20 July 1995 1755 UTC WSR-88D/KMLB 0.5˚ reflectivity image. The arrows point to
four strong east-west oriented HCRs (20-30 dBZ). The eastern ends of the northern- and southern-most HCRs are enhanced by the Indian River convergence zone (just west of the Indian River, see Section 2.2.4). The cells (~40 dBZ) to the south of these HCRs exist in periodic regularity in a line parallel to the coast. They are being initiated by HCR interactions with the sea breeze.
2.2.2 Sea Breeze
The sea breeze was a frequent feature involved in convection initiation in and around the Cape area. The reflectivity values associated with the sea breeze ranged from 5 to 25 dBZ. Because it is such a well known and documented phenomenon, an explanation of the sea breeze and how it develops will not be presented here. Rather, the important features and convection initiation associated with it will be discussed. There were three distinct ways in which convection was observed to be produced by direct influence of the sea breeze in this study: 1) convergence at inflection points along the sea breeze front, 2) sea breeze collision with other boundaries, and 3) sea breeze interaction with HCRs and small cumulus clouds.

ENSCO
16
At times the sea breeze front can deviate from its usual straight line shape and take on a ‘scalloped’ appearance with one or more inflection points. This can be caused by an irregularity in the shape of the coastline such as at the Cape (Laird et al. 1995), or by the influence of outflow boundaries behind the front causing it to bow outward (Figure 2-5). In either case, inflection points form along the sea breeze front which identify areas of increased surface convergence. These inflection points increase the probability of convection initiating, as opposed to that of the linear sea breeze, when they interact with one of the other features discussed in this section.
Figure 2-5 8 August 1995 2008 UTC WSR-88D/KMLB 0.5˚ reflectivity image. Two inflection
points on the sea breeze front are encompassed by circles. The northern point was formed by the shape of the coastline along the Cape and the southern point was formed by an outflow boundary behind the front. A cell that initiated at the latter point can be seen to its east-northeast.
The interaction between the sea breeze front and storm outflow boundaries was a very common convection initiation mechanism. The storms that produced these boundaries were always ahead (west) of the front. Outflow boundaries ahead of the front with a westerly component collided with the easterly flow
ENSCO
17
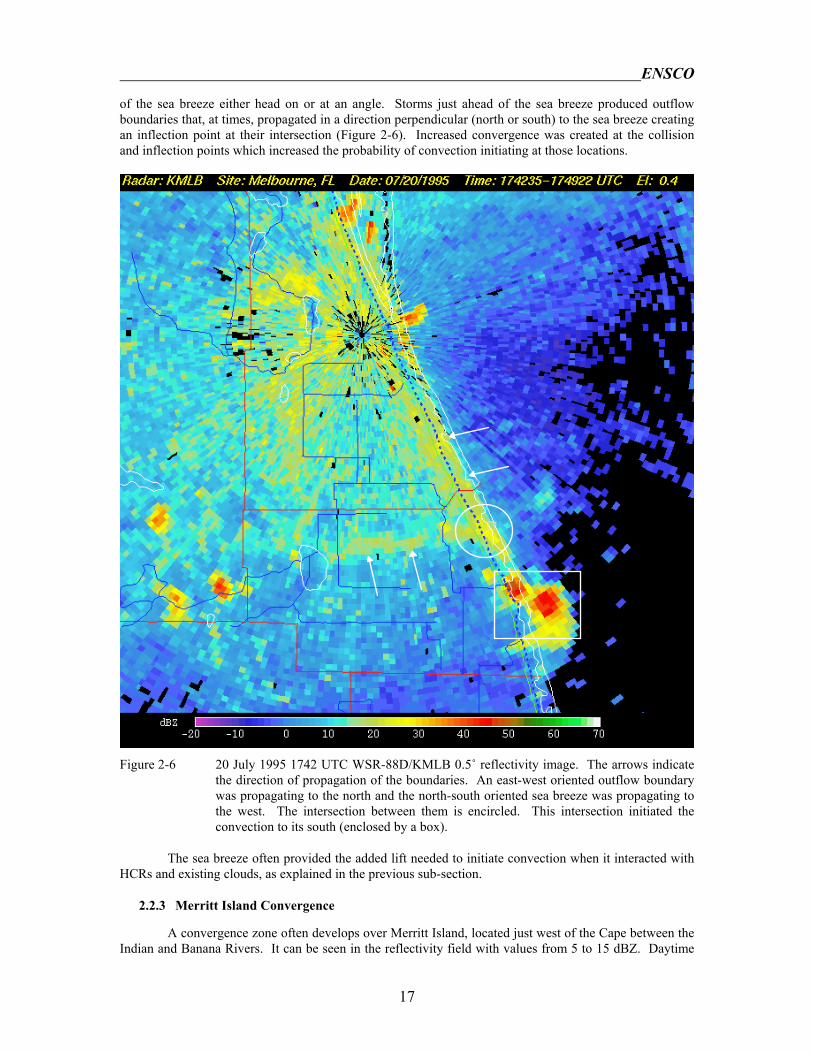
of the sea breeze either head on or at an angle. Storms just ahead of the sea breeze produced outflow boundaries that, at times, propagated in a direction perpendicular (north or south) to the sea breeze creating an inflection point at their intersection (Figure 2-6). Increased convergence was created at the collision and inflection points which increased the probability of convection initiating at those locations.
Figure 2-6 20 July 1995 1742 UTC WSR-88D/KMLB 0.5˚ reflectivity image. The arrows indicate
the direction of propagation of the boundaries. An east-west oriented outflow boundary was propagating to the north and the north-south oriented sea breeze was propagating to the west. The intersection between them is encircled. This intersection initiated the convection to its south (enclosed by a box).
The sea breeze often provided the added lift needed to initiate convection when it interacted with HCRs and existing clouds, as explained in the previous sub-section.
2.2.3 Merritt Island Convergence
A convergence zone often develops over Merritt Island, located just west of the Cape between the Indian and Banana Rivers. It can be seen in the reflectivity field with values from 5 to 15 dBZ. Daytime

ENSCO
18
heating over Merritt Island induces river breeze circulations from both rivers that converge over the island. Small cumulus clouds can be seen over Merritt Island from the Cape as well as in the visible satellite imagery when the convergence is present.
The Merritt Island convergence zone aided in convection initiation most often when another boundary, usually a storm outflow boundary from the west, collided with it. However, one deep convective cell developed over Merritt Island without the aid of other features (Figure 2-7) in this data set. This was the only feature that was able to produce deep convection without interacting with another in this study.
Figure 2-7 12 July 1995 1607 UTC WSR-88D/KMLB 0.5˚ reflectivity image. The convection on
the western shore of Merritt Island (surrounded by a box) formed as a result of the Merritt Island convergence zone alone. The storm was advecting to the west with the easterly flow that was present on this day.

ENSCO
19
2.2.4 Indian River Convergence
A quasi-stationary thin line of reflectivity often formed on the western shore of the Indian River on days when the low-level flow over central Florida was westerly. This was the result of increased convergence between the westerly flow and the westward moving portion of the Indian River breeze. Typical reflectivity values of this feature were between 5 to 15 dBZ. A good example of Indian River convergence is shown in Figure 2-8.
As a stationary boundary, existing clouds or other features would interact with it to initiate convection by advecting or propagating to it. The vertical velocities associated with the features would be increased by the upward motion that existed at the convergence line as they passed over it. As the sea breeze progressed westward, it would often merge with the Indian River convergence line which then propagated with and behaved as the sea breeze. A detailed explanation of the Indian River convergence zone and its interactions with the sea breeze can be found in Laird et al. (1995).
Figure 2-8 28 June 1995 1600 UTC WSR-88D/KMLB 0.5˚ reflectivity image. The arrows point to
the north-south oriented Indian River convergence zone (~20 dBZ) on the western shore of the Indian River.
ENSCO
20
2.2.5 Interlake Convergence
Several rivers and many small lakes are located west of the NWS Melbourne radar and Cape area towards the center of the peninsula (areas outlined in white in Figure 2-3). Lake and river breezes can develop around these features which will likely converge with each other over the land between them. It was difficult to see this in the 0.5˚ reflectivity scan as the beam is well above the surface in this area (≥ 2000 ft). The convergence was never strong enough to initiate deep convection but small cumuli were occasionally seen to form between the lakes in the visible satellite image. In several of the cases, deep convection initiated between the lakes with the passage of an outflow boundary. That these cells formed between the lakes suggests that enhanced vertical motion, most likely from lake breeze convergence, existed in these areas.
2.2.6 Storm Outflow Boundaries
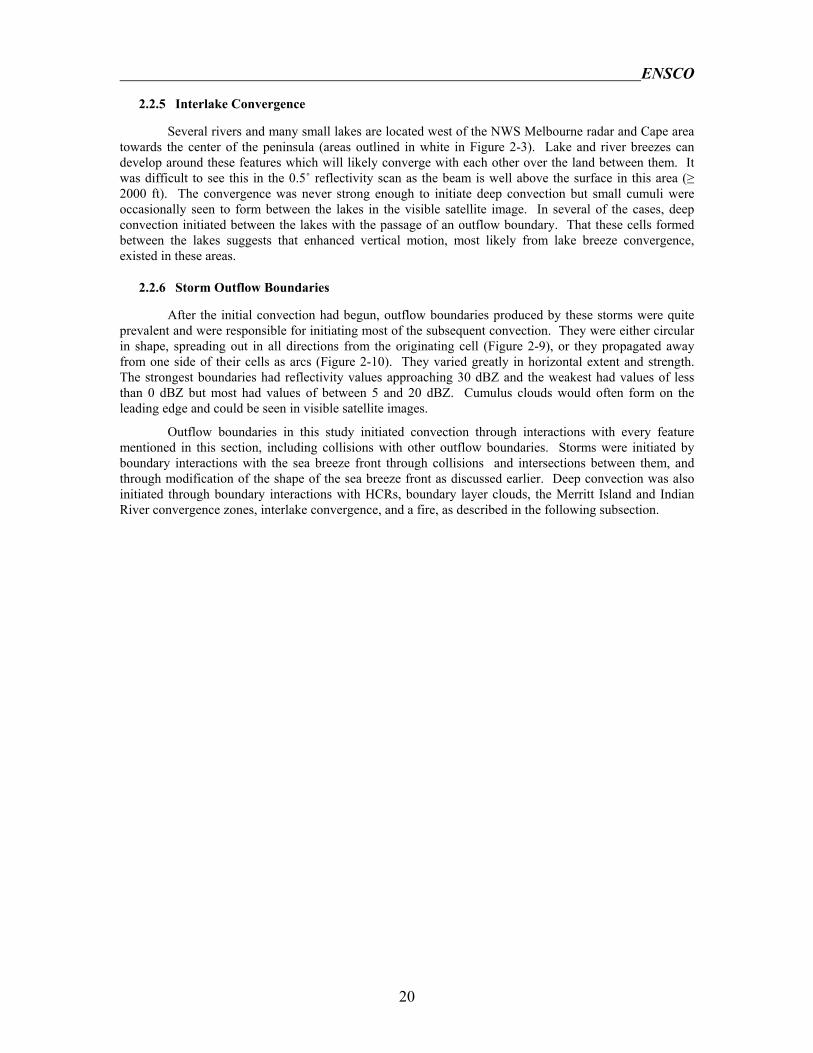
After the initial convection had begun, outflow boundaries produced by these storms were quite prevalent and were responsible for initiating most of the subsequent convection. They were either circular in shape, spreading out in all directions from the originating cell (Figure 2-9), or they propagated away from one side of their cells as arcs (Figure 2-10). They varied greatly in horizontal extent and strength. The strongest boundaries had reflectivity values approaching 30 dBZ and the weakest had values of less than 0 dBZ but most had values of between 5 and 20 dBZ. Cumulus clouds would often form on the leading edge and could be seen in visible satellite images.
Outflow boundaries in this study initiated convection through interactions with every feature mentioned in this section, including collisions with other outflow boundaries. Storms were initiated by boundary interactions with the sea breeze front through collisions and intersections between them, and through modification of the shape of the sea breeze front as discussed earlier. Deep convection was also initiated through boundary interactions with HCRs, boundary layer clouds, the Merritt Island and Indian River convergence zones, interlake convergence, and a fire, as described in the following subsection.
ENSCO
21
Figure 2-9 11 July 1995 1831 UTC WSR-88D/KMLB 0.5˚ reflectivity image. The cell in the center
produced an outward propagating circular outflow boundary (~5 - 15 dBZ) which can be seen to the north, west, and south of the cell (direction and location indicated by arrows). The large white arrow shows the direction of propagation of the cell.

ENSCO
22
Figure 2-10 6 September 1995 1705 UTC WSR-88D/KMLB 0.5˚ reflectivity image. The cell
surrounded by a box produced an outflow boundary (~15 - 20 dBZ) which propagated to the southeast. The arrow points out the location of the boundary.
2.2.7 Fires
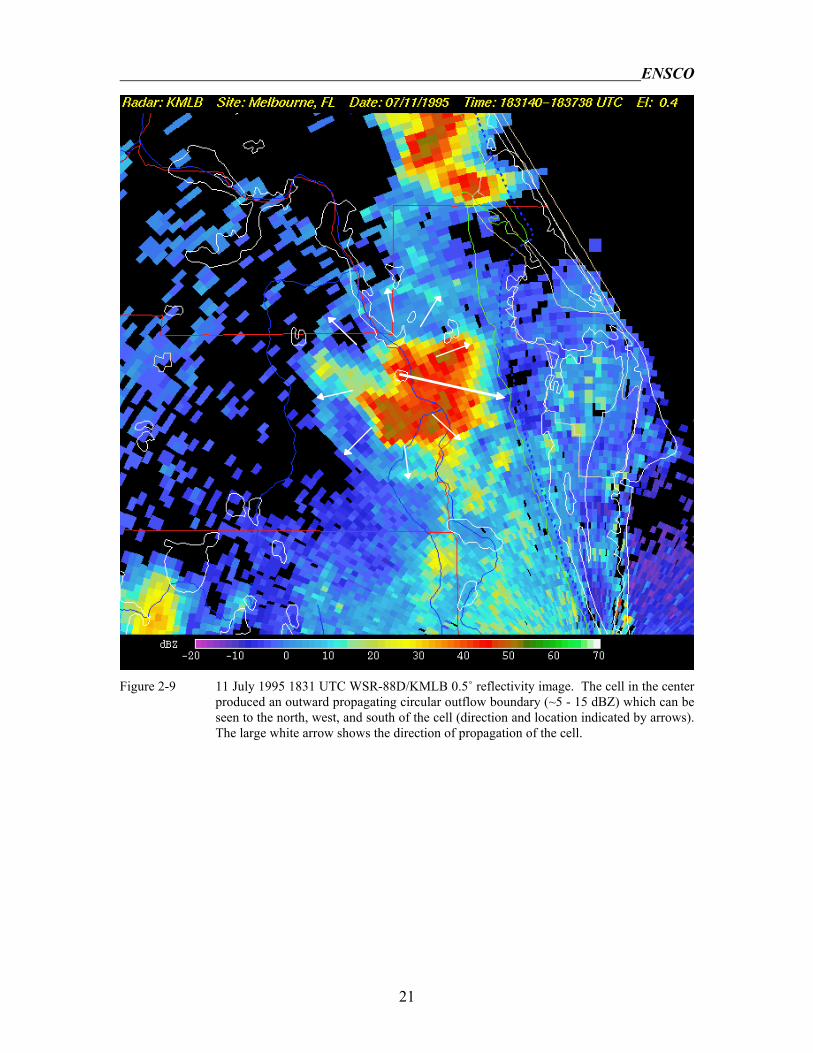
Smoke from fires can be identified in the reflectivity field as stationary low reflectivity features that elongate and spread in the direction of the flow with time. Their reflectivity values ranged from 15 to 30 dBZ. Several fires were seen in the low-level reflectivity data throughout the data collection period but only one helped produce significant convection. On 11 July 1995 at approximately 1530 UTC a wildfire started in northeastern Orange County and appeared in the reflectivity field with values of 25 - 30 dBZ (Figure 2-11). A large cumulus cloud that had formed over the fire was intensified by the passage of an eastward propagating outflow boundary, initiating a deep convective storm. The outflow boundary from this storm (see Figure 2-9) collided with the Merritt Island convergence zone and produced a severe storm over the Cape (Figure 2-12).
Even though this type of convection initiation occurred only once in this study, fires have occasionally been observed to act as convection initiation mechanisms in east central Florida (W. Roeder,
ENSCO
23
personal communication). The strength of the convection that formed as a direct (initial deep convective cell) and indirect (severe storm over the Cape) result of the fire in this study underscores the importance of monitoring the locations of fires as potential convection initiation locations in an already unstable environment.
Figure 2-11 11 July 1995 1601 UTC WSR-88D/KMLB 0.5˚ reflectivity image. The feature
surrounded by the box (~25 - 30 dBZ) is smoke from a wildfire.

ENSCO
24
Figure 2-12 11 July 1995 1951 UTC WSR-88D/KMLB 0.5˚ reflectivity image. The strong line of
convection surrounded by the box was formed by a collision between the ‘fire’ cell’s outflow boundary and the Merritt Island convergence zone. A tornado was reported at the north end of the line (indicated by the arrow) at this time but no rotation was seen in the velocity field and no high values were seen in the spectrum width at this location.
2.3 Severe Storms
A storm is considered severe when it possesses at least one of the following three characteristics: 1) near surface winds ≥ 50 kt, 2) ≥ 3/4” hail, and 3) tornadoes or waterspouts. From June to September 1995, east central Florida experienced no major severe weather outbreaks (excluding Hurricane Erin). There were few instances of confirmed observations of 3/4” or greater hail and only one confirmed tornado, but there were many observations of winds in excess of 50 kt. In the sixteen selected cases, strong winds due to microbursts were the most common severe weather event. Thus, the WSR-88D/KMLB products were only analyzed for precursors to high wind events.
Using WATADS as the WSR-88D/KMLB data analysis tool, several interesting features were discovered that may help the forecaster in predicting thunderstorms capable of producing damaging
ENSCO
25
microbursts. WATADS provides a means of tracking cell trend information on many cell parameters through the display of time series graphs. It was discovered that the trends of base reflectivity, VIL, core aspect ratio, and storm top divergence offered advance notice that a cell had the potential to produce microbursts. Core aspect ratio, which is not available operationally, is the ratio of the storm depth to the storm width given by
Core Aspect Ratio =Storm DepthStorm Width
,
where the storm depth is the distance between the storm top and base and the storm width is the width of the storm component containing the maximum reflectivity of the storm. Three microburst cases were picked for review: 26 June 1995, 10 July 1995, and 7 September 1995. All were radar-detectable microburst events with confirmed strong surface winds.
The CCAS sounding for 1445 UTC on 26 June 1995 (Figure 2-13) showed a moist layer up to 750 mb, a dry layer from 750 to 650 mb, then moisture above this dry layer. The steering flow winds were from the southwest. Winds near the surface were 10 kt or less, indicating a good chance for east coast sea breeze development. The Microburst Day Potential Index (MDPI) (Wheeler, 1996) from the 1445 UTC sounding was 1.06 indicating there was a good chance for microbursts to occur on this day.
Figure 2-14 is a time series of cell reflectivity, VIL, core aspect ratio, and cell top divergence for a storm that had developed over KSC/CCAS. The values of core aspect ratio were divided by 10 in this and all other time series shown in order for it to be displayed on the same scale as the other data. At 2057 UTC, the maximum reflectivity of the cell was 55 dBZ or greater, the VIL value was above 30 kg/m2, and the cell’s core aspect ratio was rapidly increasing from 300 to 480. At 2107 UTC (10 minutes later), a 38 kt wind was detected at tower 403 on the KSC/CCAS tower mesonet. The downburst velocity signature can be seen in the WSR-88D/KMLB velocity pattern (Figure 2-15).
QuickTime™ and aPhoto - JPEG decompressor
are needed to see this picture.
Figure 2-13 CCAS sounding at 1445 UTC on 26 June 1995. Wind speed is in knots and temperature
is in ˚C.
Error! Not a valid link.

ENSCO
26
Figure 2-14 Time series for the KSC cell that produced a 38 kt gust at 2107 UTC.
Figure 2-15 26 June 1995 2110 UTC WSR-88D/KMLB 0.5˚ velocity image showing the microburst
signature over the Cape. The microburst signature is surrounded by a box.
The second microburst case study occurred on 10 July 1995 at 2120 UTC. During this event, a 63 kt wind was detected at tower 819.
Figure 2-16 is the 1325 UTC CCAS sounding for 10 July 1995. Dry air can be seen between 600 and 500 mb. The MDPI for this day was 1.14 indicating a high probability for microbursts to occur with convective storms. As shown in Figure 2-17, the VIL rapidly increased from 22 to 34 kg/m2 and the cell’s core aspect ratio also increased rapidly to 490 just prior to the microburst event at 2107 UTC. This rapid increase in the core aspect ratio is noticeable in most of the severe wind events during the analysis period. The downburst signature just west of KSC can be seen in the WSR-88D/KMLB velocity display for 2110 UTC (Figure 2-18). Minutes later at 2120 UTC a 63 kt wind gust was recorded at tower 819 on the KSC/CCAS mesonet.

ENSCO
27
QuickTime™ and aPhoto - JPEG decompressor
are needed to see this picture.
Figure 2-16 CCAS sounding at 1325 UTC on 10 July 1995. Wind speed is in knots and temperature
is in ˚C.
Error! Not a valid link.Figure 2-17 Time series for the KSC cell that produced a 63 kt gust at 2120 UTC.

ENSCO
28
Figure 2-18 10 July 1995 2117 UTC WSR-88D/KMLB 0.5˚ velocity image showing the microburst
signature northwest of the Cape. The microburst is surrounded by a box, and the white dot is the approximate location of tower 819.

ENSCO
29
The third microburst case study occurred on 9 September 1995. Since the CCAS sounding for this day was not archived locally, a thermodynamic analysis of this event was not performed. Figure 2-19 displays the time series of core aspect ratio, maximum reflectivity, VIL, and storm top divergence for the cell which produced the microburst. As with the previous cases there was an increase in VIL and core aspect ratio before the event and the maximum reflectivity of the storm remained above 55 dBZ. Storm top divergence did not exhibit a sharp increase immediately prior to the microburst event, but decreased slightly when the other parameters were increasing. Figure 2-20 shows the WSR-88D/KMLB velocity image for 1954 UTC which depicts the microburst signature near Cocoa Beach, FL. The severe wind event was also detected by the KSC/CCAS tower mesonet. Tower 300 reported a 47 kt wind gust at 2010 UTC from this microburst.
Error! Not a valid link.
Figure 2-19 Time series for the Cocoa Beach cell that produced a 47 kt gust at 2010 UTC at tower 300 (near Hwy. 528).

ENSCO
30
Figure 2-20 7 September 1995 1954 UTC WSR-88D/KMLB 0.5˚ velocity image showing the
microburst signature south of the Cape. The microburst is surrounded by a box.
These three cases show the need for forecasters to track the time series of the key cell parameters to determine a cell’s severity and its likelihood to become severe. A new real-time display system similar to WATADS, called the Warning Decision Support System (WDSS), provides the user with time series charts of cell parameters easily and quickly. The WDSS also provides the user a cell ranking chart for quick cell analysis and viewing.
The time series of maximum reflectivity, VIL, core aspect ratio, and storm top divergence were analyzed to determine common characteristics. The analysis indicates that storms (not all severe) prior to producing microbursts were generally characterized by
• Maximum reflectivity ≥ 55 dBZ, • Increasing (≥ 30 kg/m2) then rapidly decreasing VIL, and • Increasing then rapidly decreasing core aspect ratio.
ENSCO
31
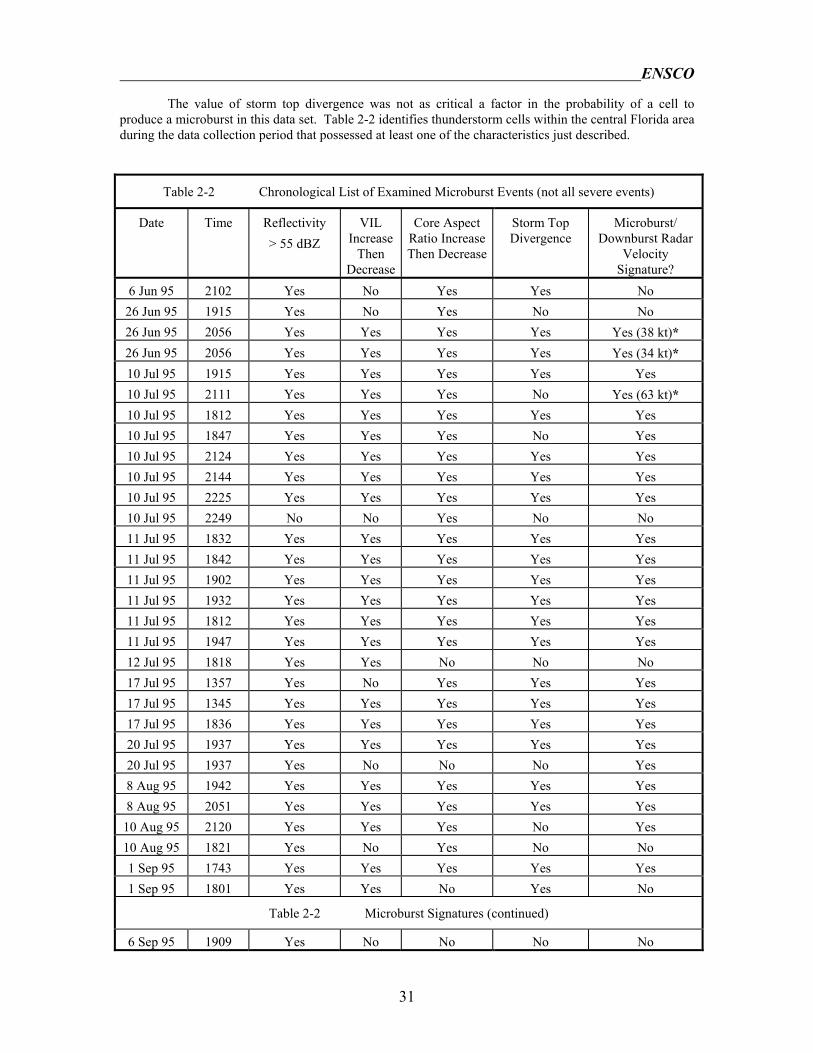
The value of storm top divergence was not as critical a factor in the probability of a cell to produce a microburst in this data set. Table 2-2 identifies thunderstorm cells within the central Florida area during the data collection period that possessed at least one of the characteristics just described.
Table 2-2 Chronological List of Examined Microburst Events (not all severe events)
Date Time Reflectivity > 55 dBZ
VIL Increase
Then Decrease
Core Aspect Ratio Increase Then Decrease
Storm Top Divergence
Microburst/ Downburst Radar
Velocity Signature?
6 Jun 95 2102 Yes No Yes Yes No 26 Jun 95 1915 Yes No Yes No No 26 Jun 95 2056 Yes Yes Yes Yes Yes (38 kt)* 26 Jun 95 2056 Yes Yes Yes Yes Yes (34 kt)* 10 Jul 95 1915 Yes Yes Yes Yes Yes 10 Jul 95 2111 Yes Yes Yes No Yes (63 kt)* 10 Jul 95 1812 Yes Yes Yes Yes Yes 10 Jul 95 1847 Yes Yes Yes No Yes 10 Jul 95 2124 Yes Yes Yes Yes Yes 10 Jul 95 2144 Yes Yes Yes Yes Yes 10 Jul 95 2225 Yes Yes Yes Yes Yes 10 Jul 95 2249 No No Yes No No 11 Jul 95 1832 Yes Yes Yes Yes Yes 11 Jul 95 1842 Yes Yes Yes Yes Yes 11 Jul 95 1902 Yes Yes Yes Yes Yes 11 Jul 95 1932 Yes Yes Yes Yes Yes 11 Jul 95 1812 Yes Yes Yes Yes Yes 11 Jul 95 1947 Yes Yes Yes Yes Yes 12 Jul 95 1818 Yes Yes No No No 17 Jul 95 1357 Yes No Yes Yes Yes 17 Jul 95 1345 Yes Yes Yes Yes Yes 17 Jul 95 1836 Yes Yes Yes Yes Yes 20 Jul 95 1937 Yes Yes Yes Yes Yes 20 Jul 95 1937 Yes No No No Yes 8 Aug 95 1942 Yes Yes Yes Yes Yes 8 Aug 95 2051 Yes Yes Yes Yes Yes
10 Aug 95 2120 Yes Yes Yes No Yes 10 Aug 95 1821 Yes No Yes No No 1 Sep 95 1743 Yes Yes Yes Yes Yes 1 Sep 95 1801 Yes Yes No Yes No
Table 2-2 Microburst Signatures (continued)
6 Sep 95 1909 Yes No No No No

ENSCO
32
7 Sep 95 1758 Yes Yes Yes Yes Yes 7 Sep 95 1756 Yes Yes Yes No No 7 Sep 95 1950 Yes Yes Yes Yes Yes 7 Sep 95 2000 Yes Yes Yes No Yes 7 Sep 95 2020 Yes Yes Yes Yes Yes (47 kt)* 8 Sep 95 1830 Yes Yes Yes No Yes (37 kt)* 8 Sep 95 1910 Yes Yes Yes Yes Yes
* KSC/CCAS tower mesonet reported wind gust.
Skill scores for this technique, such as the probability of detection, false alarm rate, and critical success index, cannot be calculated reliably from such a small data set. Furthermore, cases were chosen based on the existence of a microburst and at least one of the parameters. Thus, any skill scores calculated would likely be biased, indicating a high success rate in using this technique. Data from more cells, regardless of whether they produce microbursts or possess one of the suggested parameters, need to be analyzed in order to determine the true usefulness of this technique.
ENSCO
33
3. Summary and Recommendations
3.1 Techniques to Use with PUP to Identify Signatures
WATADS and 88Display were used in this study to analyze the radar data because of their unique display features not available on the PUP. WATADS is able to display the PUP products of reflectivity (scans and composite), velocity (scans, storm relative, wind profiles), spectrum width (scans), and precipitation accumulation (1 hour, 3 hour, storm total) products. However, it also calculates all the WSR-88D algorithms found in the RPG and displays the time series of the values (referred to in WATADS as trend sets). This proved to be very useful in determining the trends of certain cell-specific features prior to the occurrence of severe weather. 88Display produces plots of reflectivity, velocity, and spectrum width along with VIL, composite reflectivity, echo tops, layer composite reflectivity, and CAPPI displays. The highest resolution color table, which provides a different color approximately every 1.5 dBZ, was used. This allowed some of the weaker boundary layer features important to convection initiation to be resolved.
Although WATADS and 88Display were very helpful in determining convection initiation and severe storm signatures, the operational forecaster does not have these tools available to aid in radar data analysis. The PUP is the official display station for the WSR-88D and is the main tool available to operational personnel. Therefore, descriptions of how the features appear in the PUP display are given.
3.1.1 Convection Initiation
All products in the NEXRAD system were analyzed for their utility in detecting convection initiation signatures. However, while there are products which help determine the intensity of existing cells (e.g. VIL, echo top, storm relative motion, etc.), there are currently no products that are geared toward identifying convection initiation signatures other than the base products in clear air mode. The analysis was, therefore, confined to the products of reflectivity, velocity, spectrum width, and composite reflectivity in which the features involved in convection initiation could be detected.
Of these products , 0.5˚ reflectivity was found to be the most useful in identifying convection initiation signatures in both clear air and precipitation mode. Because most of the summertime convection in east central Florida is triggered by boundary layer rather than upper-level dynamic processes, the upper-level scans provide little information regarding the location of convection initiation signatures. The velocity product only provides useful information when a boundary moves directly toward or away from the radar as velocities that are not parallel to a beam cannot be accurately measured. It was unable to unambiguously display the subtle convergence pattern found with HCRs, interlake convergence, or the Merritt Island and Indian River convergence zones. The spectrum width product has a generally noisy appearance in which it is difficult to identify even some of the stronger features. In the composite reflectivity product weaker features at the surface can be hidden by scatterers aloft that have higher reflectivities. It was often the case in this study that weak feature interactions that triggered convection could not be seen in the composite reflectivity field.
In order to predict where convection will initiate, it is important to be able to resolve the HCRs, sea breeze, Merritt Island convergence, Indian River convergence, interlake convergence, storm outflow boundaries, and fires as discussed in Section 2.2. These features are all resolvable in the 0.5˚ reflectivity product when the radar is operating in clear air mode which displays reflectivities in the range -28 to 28 dBZ. As stated earlier, the lowest reflectivity value displayed on the PUP in precipitation mode is 5 dBZ. Many of the stronger features can be seen between 5 and 15 dBZ. However, weaker features with reflectivities ≤ 5 dBZ which also play a significant role in convection initiation, especially the first convection of the day, can be easily missed or not seen at all in precipitation mode. Thus it is important that the radar be operated in clear air mode prior to the start of convection, when it does not conflict with other needs, in order to see the features that will initiate that convection.
Once precipitation starts, however, the radar must be in precipitation mode. There were many cases in which it was observed that weaker (≤ 15 dBZ) features also played vital roles in the initiation of subsequent convection and the intensification of existing convection. It is therefore important that the
ENSCO
34
lowest reflectivity values in the 0.5˚ scan be monitored for any features that could interact to initiate convection or enhance existing cells when the radar is in precipitation mode.
In general, one must look for areas or lines of enhanced reflectivity when looking for convection initiation signatures. This is already done by operations personnel when the locations of the sea breeze, storm outflow, and other boundaries are being monitored. Special guidelines for identifying each feature are outlined below.
Boundary Layer Convection: HCRs can be seen quite easily in clear air mode even before the formation of clouds. They appear as quasi-stationary lines approximately 15 - 20 km in length separated by a distance of approximately 2 - 10 km. The distance between them typically increases throughout the day but rarely exceeds 12 - 15 km. Their depth is proportional to the depth of the boundary layer which also tends to increase throughout the day. It is more difficult to locate HCRs in precipitation mode as their reflectivity values tend to be quite low. The visible satellite imagery is very useful in this case for verification of HCR existence. The operator should be able to see the HCRs in the 1-second animation of the reflectivity product (the fastest time resolution allowed at highest spatial resolution) by displaying all reflectivity levels. Cellular convection is more difficult to see even in clear air mode. The dimensions of and distance between the clouds can vary in the same time period, especially over land. The visible satellite images are best for locating these clouds over the Cape.
Sea Breeze: The leading edge of the sea breeze is usually visible in the precipitation mode reflectivity product. If the reflectivity values are high (approaching 25 dBZ), it can be seen from southern Volusia County to northern Indian River County. The reflectivity values are strongest near the radar and decrease toward the ends as the beam rises above the boundary. In order to see the shape and location of the sea breeze, it is important to monitor all values of reflectivity as the reflectivities will decrease with distance from the radar. It is especially important, when monitoring convection initiation, propagation, and intensification that has the potential to affect KSC/CCAS operations, to know the location and shape of the leading edge of the sea breeze. At this distance from the radar (~40 km) the sea breeze will likely be defined by the lower values (5 - 15 dBZ).
Merritt Island, Indian River, and Interlake Convergence: The Merritt Island and Indian River convergence zones tend to have low reflectivity values but can be seen when the radar is in precipitation mode. It is difficult, however, to see any defined areas of enhanced reflectivities with interlake convergence. The best way to deduce the existence of these convergence zones, especially when the Merritt Island and Indian River zones are weak, is to look for a complete absence of reflectivity over the bodies of water, and a decrease in the number of pixels over land away from the convergence zone. This requires that the lowest reflectivity values be displayed. Zooming in on the suspected area and displaying the 1-second animation will further aid in deducing the presence of these features, as will examining the visible satellite imagery.
Storm Outflow Boundaries: After convection has begun, storm outflow boundaries were responsible for most of the subsequent convection initiation in this study. These boundaries can interact to initiate more convection which will produce more outflow boundaries. They can propagate in any direction regardless of the larger scale flow but it was observed in this study that propagation in the direction of storm movement is preferred. The weakest boundaries can be identified by a lack of reflectivity where a storm has dissipated (the boundary will be on the edge) which again makes it necessary to monitor all reflectivity levels. There were several cases in which weak outflow boundaries (< 10 dBZ) were instrumental in initiating and intensifying convection. Not all boundary collisions will initiate convection, not even some interactions between strong boundaries. It was noted in this study that convection was rarely initiated from boundary collisions in areas previously affected by convection and behind the sea breeze front.
Fires: The best way to determine if a feature is a fire is to display all reflectivity levels and examine the 1-second animation. The feature will remain fixed over the fire but will extend downstream with the flow over time. As stated earlier, only one fire event in the data collected helped produce deep convection. An outflow boundary, whose leading edge was identified by a lack of reflectivity behind it, collided with a cloud that had developed over the fire and initiated a deep convective cell. An outflow boundary from a storm just south of the cell and the Indian River boundary, both at 5 dBZ, collided with
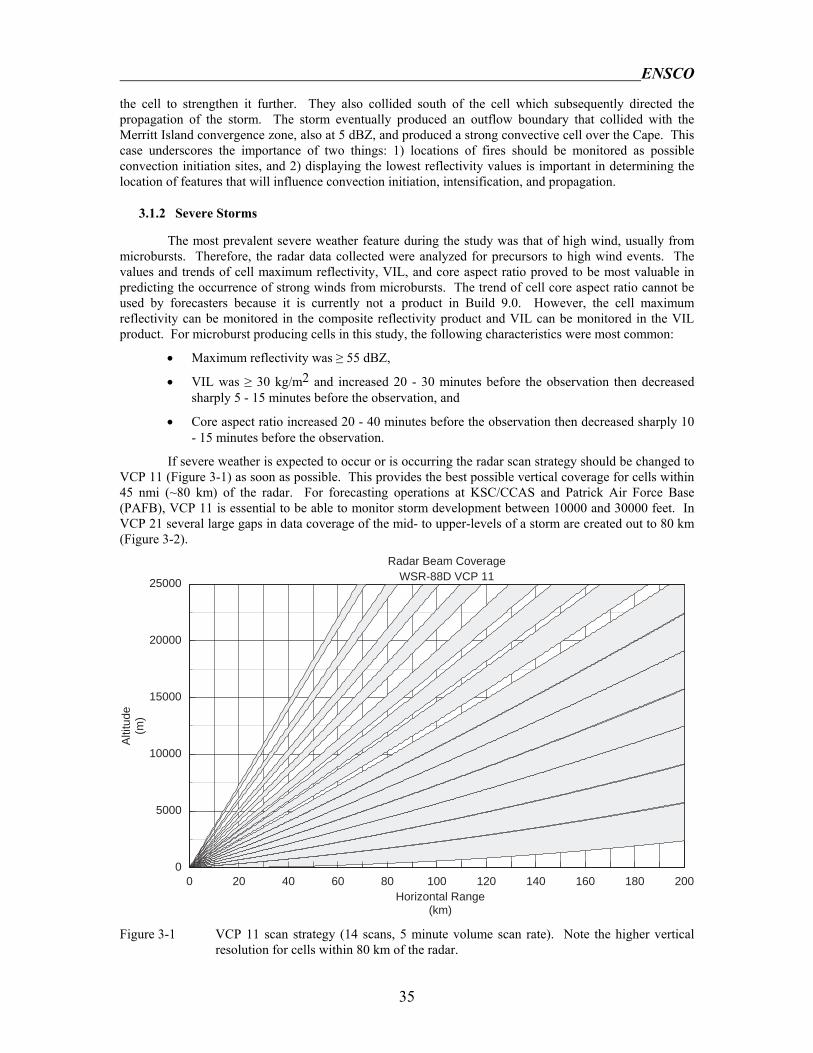
ENSCO
35
the cell to strengthen it further. They also collided south of the cell which subsequently directed the propagation of the storm. The storm eventually produced an outflow boundary that collided with the Merritt Island convergence zone, also at 5 dBZ, and produced a strong convective cell over the Cape. This case underscores the importance of two things: 1) locations of fires should be monitored as possible convection initiation sites, and 2) displaying the lowest reflectivity values is important in determining the location of features that will influence convection initiation, intensification, and propagation.
3.1.2 Severe Storms
The most prevalent severe weather feature during the study was that of high wind, usually from microbursts. Therefore, the radar data collected were analyzed for precursors to high wind events. The values and trends of cell maximum reflectivity, VIL, and core aspect ratio proved to be most valuable in predicting the occurrence of strong winds from microbursts. The trend of cell core aspect ratio cannot be used by forecasters because it is currently not a product in Build 9.0. However, the cell maximum reflectivity can be monitored in the composite reflectivity product and VIL can be monitored in the VIL product. For microburst producing cells in this study, the following characteristics were most common:
• Maximum reflectivity was ≥ 55 dBZ,
• VIL was ≥ 30 kg/m2 and increased 20 - 30 minutes before the observation then decreased sharply 5 - 15 minutes before the observation, and
• Core aspect ratio increased 20 - 40 minutes before the observation then decreased sharply 10 - 15 minutes before the observation.
If severe weather is expected to occur or is occurring the radar scan strategy should be changed to VCP 11 (Figure 3-1) as soon as possible. This provides the best possible vertical coverage for cells within 45 nmi (~80 km) of the radar. For forecasting operations at KSC/CCAS and Patrick Air Force Base (PAFB), VCP 11 is essential to be able to monitor storm development between 10000 and 30000 feet. In VCP 21 several large gaps in data coverage of the mid- to upper-levels of a storm are created out to 80 km (Figure 3-2).
0 20 40 60 80 100 120 140 160 180 2000
5000
10000
15000
20000
25000
Alti
tude
(m)
Horizontal Range(km)
Radar Beam CoverageWSR-88D VCP 11
Figure 3-1 VCP 11 scan strategy (14 scans, 5 minute volume scan rate). Note the higher vertical
resolution for cells within 80 km of the radar.

ENSCO
36
0 20 40 60 80 100 120 140 160 180 2000
5000
10000
15000
20000
25000A
ltitu
de(m
)
Horizontal Range(km)
Radar Beam CoverageWSR-88D VCP 21
Number of Scans: 9
Beam Width: 0.95 degrees
Figure 3-2 VCP 21 scan strategy (9 scans, 6 minute volume scan rate). Note the gaps in vertical
coverage for cells within 80 km of the radar.
Important cell information can be retrieved from the WSR-88D PUP through the use of user function keys that, when activated, display user-defined products. These function keys allow the user to develop different ways of viewing the critical radar data which would help the forecaster monitor for severe weather signatures. To monitor for severe weather, these function keys should be programmed to allow the user to select several 4-panel combined cell analysis views. Some AMU recommended sample configurations are given below. The forecaster may develop additional displays that will provide the information needed to better understand the synoptic situation, cell structure, and stage of storm development in specific situations.
Example 1. This 4-panel display will aid in determining the severity of a storm. The composite reflectivity (CR) will identify storms with high maximum reflectivity values, high VIL will identify storms with strong updrafts, 0.5˚ reflectivity identifies reflectivity gradients, low-level strength, and boundary locations, and the 0.5˚ velocity identifies boundary movement and strong winds.
Panel 1) CR Image ( ≥ 55 dBZ for microbursts ) Panel 2) VIL Image ( ≥ 30 kg/m2 and increasing for microbursts ) Panel 3) 0.5˚ Reflectivity ( precipitation strength, boundary locations ) Panel 4) 0.5˚ Velocity ( surface convergence/wind strength )
Example 2. These four products will aid in determining the existence and strength of low-level precipitation cores and locations of mid-level rotation and upper-level divergence.
Panel 1) 6.1˚ Velocity ( storm top divergence ) Panel 2) 2.4˚ Velocity ( mid-level rotation/convergence) Panel 3) 4.3˚ Reflectivity ( precipitation core strength ) Panel 4) 0.5˚ Reflectivity ( precipitation strength, boundary locations)
Example 3. With this display, forecasters will be able to monitor storms for echo overhang locations and storm inflow regions.
ENSCO
37
Panel 1) 0.5˚ Reflectivity ( precipitation strength, boundary locations ) Panel 2) 2.4˚ Reflectivity ( reflectivity gradients ) Panel 3) 4.3˚ Reflectivity ( reflectivity gradients ) Panel 4) 6.1˚ Reflectivity ( reflectivity gradients )
These are only samples of the many possible 4-panel displays that can be created to help the forecaster determine storm development, structure, and severity. Forecasters can determine which displays will provide them with the vital information needed to forecast severe weather events.
3.2 Future NEXRAD Products and Displays
The NEXRAD products are being continually analyzed, modified, and tested in order to supply the most accurate and helpful products to the operational forecasters. In addition, new systems with improved display capabilities are being developed that will help improve the operational nowcast. Research on algorithms for boundary and severe weather feature detection is ongoing. The following subsections discuss these aspects of the NEXRAD system.
3.2.1 Suggested Improvements for the Current System
The algorithms in Build 9.0, which were installed in the fall of 1996, are currently in use. Some of the new features include a cell parameter time series display, a cell based VIL algorithm, and a new storm cell identification and tracking (SCIT) algorithm. Operations personnel can make requests for improvements to existing algorithms or for new algorithms and products in future builds. After analyzing the radar data using the tools discussed in Section 1.5, the authors have suggestions for improvements to the algorithms and products that will enhance the operators’ ability to detect convection initiation and severe storm signatures.
The easiest and most important display to develop in order to help forecasters detect convection initiation signatures is one in which reflectivity values below 5 dBZ can be displayed in precipitation mode. This can be easily done as the raw base data contain the full range of reflectivity values. A higher resolution color table than that currently available would help enhance the weak features involved in convection initiation, and a faster animation without loss of spatial resolution would be more effective in alerting the forecaster to weak, moving features. Algorithms to identify and track moving boundaries would also be helpful in identifying weak boundaries that could help initiate convection. Eventually, a warning algorithm for detection of probable convection initiation locations should be developed and added to the system.
The minimum horizontal extent of the cross section product, which is 50 nmi, makes it difficult to see the details of a potentially severe cell’s vertical structure. This value should be made flexible so that it fits more closely the actual length of the cross section defined by the user. The trend of core aspect ratio was proven in this study to be a valuable parameter in forecasting the occurrence of microbursts, but it is not available operationally. The addition of this product to the NEXRAD system would aid forecasters in identifying storms which could potentially produce microbursts. Finally, automated microburst forecast and detection algorithms that can identify cells likely to produce microbursts should be added to the system.
A notable restriction in the present system that hinders the forecasters’ ability to inspect cells for severe signatures is that of algorithm processing and transmission speed. In both VCP 21 and VCP 11, the base products of reflectivity, velocity, and spectrum width are available on the PUP almost immediately after the raw data are received and processed. However, the derived products (e.g. CR, VIL, echo tops, etc.) available for display are usually 10 - 15 minutes old and can be as much as 20 minutes old. Severe weather phenomena can develop and dissipate in this time period. This issue should be addressed and the appropriate changes, such as the installation of a faster communication line, made to the existing hardware and software. In the meantime, this problem can be alleviated somewhat by streamlining the user-definable Routine Product Set (RPS) lists (11 in all) to only include the products needed to sufficiently analyze a given situation (e.g., pre-convective, convective/precipitating, developing severe weather, etc.).
ENSCO
38
3.2.2 Future Systems
The NWS, Department of Defense, and the Federal Aviation Administration are currently supporting an effort to change the components of the NEXRAD system which calculate and display the products (RPG and PUP) in order to maintain cost effective operations and to take advantage of advances in hydrometeorological science and technology (Saffle 1996). This effort will involve rehosting the NEXRAD system from its existing proprietary computer platform to an open systems workstation platform taking advantage of multiple vendor, commercial-off-the-shelf (COTS) components. Although all the components of the NEXRAD system will be changed to an open systems environment, the Open Radar Product Generator (ORPG) will be fielded first in 1999, followed by the Open Radar Data Acquisition (ORDA) in 2000 (all dates are estimated). The entire effort, is planned to be completed sometime after the year 2000.
New display software will need to be developed in order to accommodate the operating systems of the new COTS hardware. Projects to develop such software are currently underway that use UNIX-based workstations as the display platform for the NEXRAD products. WATADS and WDSS are two new software packages that are currently being developed and tested in NWS operations. The use of the new COTS platform will likely make the timely transition of new algorithms developed in the research community more feasible.
3.2.2.1 WATADS and WDSS
The versatility in developing displays afforded by UNIX-based workstations has led to the development of the WDSS and WATADS display tools. As discussed earlier, WDSS is a real-time data analysis system and WATADS is an off-line package used for data post-analysis and algorithm modification and testing. Both are currently installed and in use at NWS Melbourne, and WATADS is installed in the AMU North.
The National Severe Storms Laboratory (NSSL) conducted a Proof-of-Concept test of the WDSS during August 1996 at NWS Melbourne. Although some algorithms still need modifications to be effective in the central Florida environment, the system performed quite well overall and was well received by the NWS Melbourne and AMU personnel.
The following are the key features and tools available on the WDSS and WATADS:
• User-friendly interface • Cell time series graphs • Cell severity ranking • Faster animation looping capability • X-Windows environment (display several products in separate windows on the monitor at the
same time) • Microburst, hail, and tornado alerts • Ability to quickly zoom in on features of interest • NSSL algorithms as well as WSR-88D algorithms • Ability to quickly modify and tune the NSSL algorithms for the central Florida environment
Both systems use COTS hardware, making software and hardware modifications and updates much easier and more cost effective.
3.2.2.2 Current Research for Future Displays
Much research has been conducted on automatically detecting lines of convergence important for convection initiation (e.g. outflow boundaries, HCRs, etc.) in Doppler radar data (Wilson and Mueller 1993). Most studies have used low-level reflectivity gradients and velocity shifts to define the locations of boundaries. Fankhauser et al. (1995) used wavelet transforms to detect the subtle reflectivity gradients and
ENSCO
39
convergence lines associated with HCRs. Roberts (1996) used the combination of increasing reflectivity and decreasing brightness temperature in IR satellite data to provide advance warning of storm growth.
Neural networks have recently begun to be scrutinized for their utility in predicting the occurrence of certain meteorological phenomena using radar data. A neural network (NN) is used in lieu of a non-linear model that cannot be solved exactly. The NN is ‘trained’ with a large sample of data consisting of input values that produce a known result then exposed to data not included in the training set with the aim of predicting a new, and possibly different, outcome. Highly accurate predictions can be made with a trained NN even though the physical process may not be understood. Marzban and Stumpf (1996) developed a mesocyclone detection NN and compared it with the current NSSL mesocyclone detection algorithm (MDA). This NN was trained with a large data set of radar-derived attributes based on Doppler velocity data then tested with data not included in the training data set. The results showed that the NN outperformed the current NSSL MDA. Research in this area is ongoing and may lead to more accurate predictions of severe meteorological events using WSR-88D data.
3.3 Conclusions
While it is important to discuss imminent and possible improvements to the NEXRAD system, the focus of this report is to provide guidelines to the forecaster for optimal use of the current NEXRAD products and hardware in determining locations of convection initiation and severe storm development. Several techniques for identifying convection initiation and severe storm signatures on the PUP are given in this report.
Through process of elimination it was found that the clear air mode 0.5˚ reflectivity product with the lowest reflectivity values displayed is the best product to monitor for convection initiation signatures. There were seven features identified in the data: HCRs, the sea breeze, Merritt Island convergence, Indian River convergence, interlake convergence, storm outflow boundaries, and fires. Many of these signatures were detectable on the PUP in the 5 to 15 dBZ range, but prior to the first convection of the day many features had reflectivities of ≤ 5 dBZ. Features in this reflectivity range are most well defined and more easily detected when the radar is in clear air mode as the value range displayed is -28 to 28 dBZ.
Many of these features can also be detected when the radar is in precipitation mode and weaker features may be detected in an animation of this product. The 1-second animation, which is the fastest speed with the highest spatial resolution, should be used. As stated earlier, many of the features have reflectivities in the 5 to 15 dBZ range. Thus, it is important that the lowest reflectivity values be displayed and monitored in precipitation mode. Features that are not detectable by the radar in precipitation mode may be seen in the visible satellite image. In summary, the following procedures are recommended for optimal detection of convection initiation signatures:
• Request that the WSR-88D/KMLB operate in clear air mode as long as possible and monitor the 0.5˚ reflectivity product in order that any weak features responsible for initiating the first cells of the day be detected.
• Display the full range of reflectivity values in the 0.5˚ reflectivity product in order to detect most of the features responsible for initiating subsequent convection.
• Monitor the visible satellite image in conjunction with the radar data as the very weak boundaries and HCRs may not be radar detectable in precipitation mode.
Monitoring the full range of reflectivity values, as stated in the second recommendation, may be difficult for forecasters to implement consistently as they will also need to monitor other products which will help them determine the structure and severity of existing cells. Under these circumstances the 0.5˚ reflectivity product could be monitored as part of a 4-panel display in one of the PUP monitors.
While there is only one main product useful in detecting convection initiation signatures, there are many products and combinations of products that are useful in detecting and predicting severe storm development. In the data collected for this study, the most common severe weather element was that of high winds from microbursts. Thus, the products were analyzed for precursors to and indicators of high wind events. The values and trends of maximum reflectivity, VIL, and core aspect ratio (display not

ENSCO
40
available in Build 9.0) proved to be most critical in forecasting this phenomenon. The values of these parameters depend on the VCP in use. VCP 11 provides a more complete data set and, therefore, more accurate parameter values.
There are many other products which are helpful in determining the structure, intensity, and parameter trends of a storm. It is best to display these in the 4-panel display feature available on the PUP in specific combinations which will help the forecaster determine the characteristics and intensity of a potentially severe storm. Three sample 4-panel displays are given earlier in this section, and forecasters should be encouraged to build their own displays. In summary, the following procedures are recommended for optimal prediction and detection of severe storms:
• If severe weather is expected to develop from existing cells, operate the WSR-88D/KMLB in VCP 11.
• Monitor the trends of maximum reflectivity in the composite reflectivity product (values ≥ 55 dBZ) and in the cell trend display (PUP and WDSS), the trends of VIL in the VIL product and cell trend display (values ≥ 30 kg/m2, increasing then decreasing, PUP and WDSS), and the cell trend display of core aspect ratio (increasing then decreasing ,WDSS only) for microburst prediction.
• Use the 4-panel displays given in this report or develop displays to help determine the structure and intensity of existing cells.
Most of the recommended procedures given for detecting convection initiation and severe storm signatures are already in use by operational forecasters at the 45WS, SMG, and NWS Melbourne. All the WSR-88D/KMLB products were thoroughly analyzed with three display tools for new ways to look at the products, individually and in combination, which would bring further insight into detecting convection initiation and severe storm signatures. These conclusions confirm that the operational procedures in current use are effective and should continue to be employed. This report documents the effectiveness of those procedures and may serve as a training manual for new forecasters unfamiliar with the use of NEXRAD in the central Florida environment.
Until new products geared toward detecting convection initiation signatures are implemented in the NEXRAD system, no further study is needed for this objective. Appropriate personnel should promote and support the development and transition of the products suggested in the previous section to operations. If such products become available, they should be examined for their utility in forecasting convection initiation in central Florida.
The severe storm signature objective, however, is not fully complete since analyses for two severe weather features, 3/4” hail and tornadoes, were not possible due to their lack of occurrence in the data. More data are also needed to completely analyze the parameters suggested for predicting microbursts. This analysis should include a determination of the product values, trends, and lead times critical to forecasting severe weather events. In addition, several new products are available in Build 9.0, including cell based VIL and time series graphs of certain storm parameters, whose value in forecasting and detecting severe storms in the central Florida environment is unknown. Future work should be expanded such that the WSR-88D/KMLB data set will contain a sufficient number of confirmed occurrences of severe hail and tornadoes so the utility of all the products in forecasting and detecting severe storms can be determined.
ENSCO
41
4. References
Atkins, N. T., R. M. Wakimoto, and T. M. Weckwerth, 1995: Observations of the sea-breeze front during CaPE. Part II: Dual-Doppler and aircraft analysis. Mon. Wea. Rev., 123, 944 - 969.
Fankhauser, J. C., N. A. Crook, J. Tuttle, L. J. Miller, and C. G. Wade, 1995: Initiation of deep convection along boundary layer convergence lines in a semitropical environment. Mon. Wea. Rev., 123, 291 - 313.
Federal Meteorological Handbook, No. 11 (Interim Version One), 1991: Doppler Radar Meteorological Observations. Part C, WSR-88D Products and Algorithms. FCM-H11C-1991, Office of the Federal Coordinator for Meteorological Services and Supporting Research, Rockville, MD, 210 pp.
Laird, N. F., D. A. R. Kristovich, R. M. Rauber, H. T. Ochs III, and L. J. Miller, 1995: The Cape Canaveral sea and river breezes: Kinematic structure and convective initiation. Mon. Wea. Rev., 123, 2942 - 2956.
Marzban, C., and G. J. Stumpf, 1996: A neural network for tornado prediction based on Doppler radar-derived attributes. J. Appl. Meteor., 35, 617 - 626.
Roberts, R. D., 1996: Integration of WSR-88D and GOES-8 data for detecting and forecasting storm initiation. Preprints, 15th Conf. on Weather Analysis and Forecasting, Norfolk, VA, Amer. Meteor. Soc., 287 - 290.
Saffle, R. E., 1996: NEXRAD and its evolution progress. Bull. Amer. Meteor. Soc., 77, 2125 - 2126.
Sanger, S. S., R. M. Steadham, J. M. Jarboe, R. E. Schlegel, and A. Sellakannu, 1995: Human factors contributions to the evolution of an interactive Doppler radar and weather detection algorithm and display system. Preprints, 11th Int. Conf. on Interactive Information and Processing Systems for Meteorology, Oceanography, and Hydrology, Dallas, TX, Amer. Meteor. Soc., 1 - 6.
Weckwerth, T. M., 1995: A study of horizontal convective rolls occurring within clear-air convective boundary layers. NCAR Cooperative Ph.D Thesis No. 160, University of California, Los Angeles, 405 Hilgard Ave., Los Angeles, CA 90095-1565, 179 pp.
Wheeler, M. M., 1996: Verification and implementation of Microburst Day Potential Index (MDPI) and Wind INDEX (WINDEX) forecasting tools ad Cape Canaveral Air Station. NASA Contractor Report CR-201354, KSC, FL, 25 pp.
Wilson, J. W., and C. K. Mueller, 1993: Nowcasts of thunderstorm initiation and evolution. Wea. Forecasting, 8, 113 - 131.