Embed Size (px)
Citation preview
Next Generation Scanning LIDAR Systems for OptimizingWake Turbulence Separation Minima
Ludovic Thobois* Jean-Pierre Cariou
(LEOSPHERE, Orsay, France)
Abstract: Numerous studies have been performed to better understand the behavior of wake vortices with re-
gards to aircraft characteristics and weather conditionsover the pastten years. These studies have led to the de-
velopment of the aircraft RECATegorization (RECAT) programs in Europe and in USA. Its phase one focused
on redefining distance separation matrix with six static aircraft wake turbulence categories instead of three with
the current International Civil Aviation Organization (ICAO) regulations. In Europe, the RECAT-EU regula-
tion is now entering under operational implementation atseveral key airports. As proven by several research
projects in the past, LIght Detection And Ranging (LIDAR) sensors are considered as the ground truth wake
vortex measurements for assessing the safety impact of a new wake turbulence regulation at an airport in quan-
tifying the risks given the local specificities. LIDAR’s can also be used to perform risk monitoring after the im-
plementation. In this paper, the principle to measure wake vortices with scanning coherent Doppler LIDARs is
described as well as its dedicated post-processing. Finally the use of WINDCUBELIDAR based solution for sup-
porting the implementation of new wake turbulenceregulation is described along with satisfyingresults that have
permitted the monitoring of the wake vortex encounter risk after the implementation of a new wake turbulence
regulation.
Key words: Wake turbulence; Wake vortices; LIght Detection And Ranging (LIDAR); Algorithm; Circulation;
Data collection; Safety case; Risk monitoring
CLC index: TN958.98 Document code: A Article number: 2095-283X(2017)06-0689-10
DOI: 10.12000/JR17056
Reference format: Ludovic Thobois and Jean-Pierre Cariou. Next generation scanning LIDAR systems for
optimizing wake turbulence separation minima[J]. Journal of Radars, 2017, 6(6): 689–698. DOI: 10.12000/JR17056.
I Introduction
Today, wake turbulence hazard is a majorconcern for the air traffic management. ATM hasto face to a continuous and significant air trafficgrowth and specific air traffic management ofheavy and super heavy aircrafts, while at thesame time reducing its costs and improving thesafety. One worldwide emerging solution is to im-prove the runway throughput by modernizingcurrent conservative International Civil AviationOrganization (ICAO) regulations on aircraft dis-tance separations established sixty years ago.
For ten years, many research LIght Detec-
tion And Ranging (LIDAR) systems have been
used for better understanding wake vortices beha-
viors within large range of wind and turbulence
conditions. All these studies[1–3] helped to design
new concepts of wake separations between air-
crafts thanks to the proven capabilities of LID-
AR systems to assess the risks of wake vortex en-
counters through the circulation retrievals. The
recategorization project, called RECAT, has been
launched by a joint initiative EUROCONTROL –
FAA in order to renew and optimize the out-of-
date currently applied ICAO regulations on dis-
tance separation. The RECAT Phase 1 consists in
defining a new distance separation matrix com-
posed of six static aircraft categories instead of
three for the current ICAO-PANS wake turbu-
lence scheme. A European version, RECAT-EU
has been developed by EUROCONTROL[4]. The
impact on the risk of wake vortex encounters is
Manuscript received June 13, 2017; Revised September 13, 2017;
Published online November 21, 2017.
*Communication author: Ludovic Thobois.
E-mail: [email protected].
第 6卷第 6期 雷 达 学 报 Vol. 6No. 6
2017年12月 Journal of Radars Dec. 2017
evaluated by a severity metric based on the
rolling moment induced on the following aircraft
by the circulation (strength) of the wake vortices
generated by the leading aircraft. Extensive stud-
ies of wake vortex behaviors have been per-
formed through the realization of numerous wake
vortex data collections and simulations. The wake
vortex data collections were realized with scan-
ning coherent Doppler LIDARs at several air-
ports including London Heathrow airport and
Paris-Charles de Gaulle airport and representing
more than 200000 wake vortex tracks. The data
analysis focused on the wake vortex behaviors in
reasonable worst case conditions defined asthe
longest tracks (lasting 5 adimensional time) and
in ground proximity (at one wingspan of
altitude). These conditions allow to evaluate the
risk where and when it matters following the res-
ults of statistical studies analyzing the risk of
wake vortex encounters[5]. When combining wake
vortex data and air traffic data, a statistical di-
mensionless decay model of the wake vortex circu-
lation in reasonable worst case conditions for each
aircraft has been developed. Recent studies [4]
showed that this model in such conditions fits rel-
atively well for several wake vortex database col-
lected at different airports. Based on all these
studies, the safety case of RECAT-EU[6] has been
realized and presented to the European Aviation
Safety Agency (EASA) which validated it as a
basis to update current ICAO wake turbulence
scheme[7].
The gains in airport capacities brought by the
RECAT-EU scheme have been demonstrated at
pioneer airports and have been simulated for
manyother airports. Basically for European
busiest airports with a significant ratio of
heavies’s air traffic, the gains should reach
between 2 and 5%. In Europe, deployments of
these new wake turbulence regulations on more
than fifteen airports are scheduled until 2025 ac-
cording to the Pilot Common Project (PCP) reg-
ulation framework [REG (EU) No 716/2014]. In
addition, other static or dynamic concepts like
Time-Based Separationhave also been developed.
TBShas been deployed at London Heathrow air-
port in 2015 and will be deployed within 2025 on
numerous European airports.For the implementations of wake turbulence
regulations, the use of scanning coherent DopplerLIDARs is required since it is the only one provensensor able to provide the ground truth wake vor-tex data[1–3]. Even if LIDAR can measure only un-der clear air conditions, it has been shown thatwake vortex behaviors are the same whatever theweather conditions are LIDAR-friendly or non-LIDAR-friendly[8]. If several years ago, wake tur-bulence programs were considered to be at re-search stages, they are now entering into opera-tional phases with extensive deployments at air-ports. This requires using more reliable and cost-effective LIDAR sensors. Today, new Light Detec-tion and Ranging LIDAR technique, more pre-cisely the coherent Doppler LIDAR technologybased on fiber lasers, has been developed and in-dustrialized. This technology is based on the sameprinciple of measurements than the old techno-logy based on solid state or g aslasers. Fiberbased LIDAR sensors have already been valid-ated to provide accurate wind measurements foroperational purposes[9] especially in the wind en-ergy where they are becoming standard sensors.They have also been used for monitoring wakevortices in the framework of applied researchprojects and first step of operational projects[10–13].
This paper will propose a methodology to usescanning coherent Doppler LIDAR sensors forproviding relevant characterization of the wakevortices in terms of detection, localization and cir-culation in the scope of the implementation ofnew wake turbulence regulation.A robust and ac-curate wake vortex algorithm in adequation withthe targeted operational uses will be described. Itspreliminary evaluation on limited datasets will bepresented. Finally, this solution has been de-ployed at Paris-Charles de Gaulle airport. Prelim-inary analysis of first data collected at this air-port will be presented and discussed.
2 Principle of Wake Vortex Measure-ments with Doppler Lidars
For the deployment of a new wake turbu-lence regulation, the scanning coherent Doppler
690 Journal of Radars Vol. 6
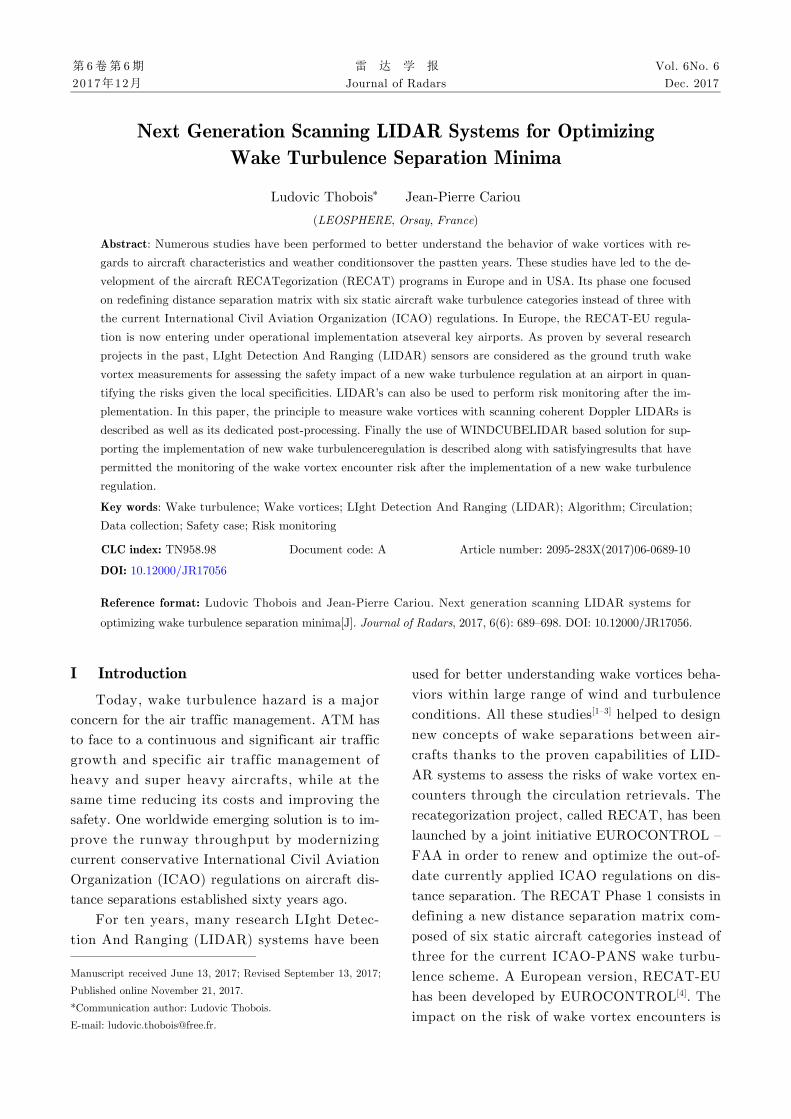
LIDAR [9] provides the characterization of thewake vortices in terms of detection, localizationand circulation. The fiber based coherent Dop-pler LIDAR technology allows to adapt easily theparameters of the configuration like the spatialand temporal resolutions and the scanning pat-terns in order to monitor the wake vortices in anoptimal way. Besides, the compactness of suchLIDAR sensors allows to install them quickly atan airport on multiple runways, at different alti-tudes and during takeoff or landing following therequirements defined in the safety assessment. Inaddition, the blind zone with such a LIDAR ismuch lower which allows to have more flexiblilityin the LIDAR position. Fig. 1 shows the typicalsetup of a fiber based scanning LIDAR for meas-uring wake vortices to a runway. The LIDARscans vertically (Range Height Indicator-RHIscans) and perpendicularly to the runway. Thisallows to measure directly thevelocities inducedby the wake vortices which are oriented in thesame plan. This ensures the LIDAR to measureaccurately the wake vortex circulation (strength).
The location of the LIDAR along the runway
direction will be defined for collecting relevant
wake vortex data atone wingspan of altitude
where the Wake Vortex Encounter (WVE) risk is
the highest of the wake vortices (one wingspan).
The distance from the LIDAR to the runwaywill
be mainly constrainted by the area of interest for
monitoring wake vortices and by the LIDAR spe-
cifications. For RECAT-EU, as the safety assess-
ment is based on the longest tracks correspond-
ing to the reasonable worst case conditions, the
wake vortices that must be monitored are the
ones that remain relatively close to the runway
during their lifetime. This area of monitoring can
be set to a length of 500 m corresponding to 250 m
for each side of the runway. Vertically, the same
reason implies given the distance of the area of in-
terest from the LIDAR to fix an appropriate
swept angle which allows to follow wake vortices
rebounds occurring at the shortest distance. The
minimum elevation angle should be as closest as
possible to 0° in order to monitor the wake vor-
tices descent at the lowest altitude, theoretically
around half of initial wake vortex span (b0). The
main constraining LIDAR specifications are the
length of the blind zone (typically 80 m for fiber
based coherent LIDARs) and the maximum dis-
tance at which accurate wind and wake vortices
measurements can be performed. This parameter
depends on the specified spatial resolution. For a
resolution of 5 m, the maximum distance will
reach 900 m where as for a resolution of 10 m, the
maximum distance can reach up to 1.5 km.
Besides, basic measurement constraints are
linked to the typical characteristic scales of the
phenomena of interest. For localizing wake vor-
tices with an error smaller than 10 m the cores of
the wake vortices, the spatial resolution of the
LIDAR should be 5 m at least. For retrieving ac-
curately their circulation, at least one point in
each core is required. This leads to a constraint
on vertical resolution of 2 m and allows to get
about 10 points of wind measurements along one
WV diameter (20 m typical). This allows to “re-
solve” the wake vortex velocity profile. Given
their typical duration, a sufficient update rate
must also be used (0.1 Hz at the minimum or 10
s) in order to monitor the circulation decay. Giv-
en all these constraints, the scanning scenario of a
scanning coherent Doppler LIDAR for providing
wake vortex data can be determined.Following the defined scanning scenario, dif-
ferent levels of data will be collected by the LID-AR sensor: the raw data which are the spectradata representing all the Doppler frequencies orvelocities acquired in one probing volume of eachline of sight, the radial wind data which corres-pond to the averaged velocity determined for each
LIDAR
Fig. 1 Setup for monitoring wake vortices at airport
No. 6 Ludovic Thobois et al.: Next Generation Scanning LIDAR Systems for Optimizing Wake Turbulence... 691
probing volume of each line of sight and the wakevortex data which correspond to the presence, thelocalization and the circulation of wake vorticesper scan. Radial data provided by coherent Dop-pler LIDARs with short pulses, ie. high range res-olution can well represent the velocities profiles ofwake vortices.
Among all the different types of existing wakevortex algorithms [10,14–16] in this study, an al-gorithm based on the optimization of a fit of awake vortex analytical model on radial windspeeds[11] has been chosen for this accuracy androbustness. This algorithm consists in three mainparts:
- Detection of vortices: on every RHI scan,the algorithm detects the presence or not of wakevortices given a threshold on radial speed disper-sions.
- Localization of vortices: in case presence of
vortices is notified, the algorithm will intend to
localize the core of the vortices in a Cartesian
grid. The localization uses advanced image pro-
cessing technics as well as a tracking window to
narrow the search areaapplied on the maps of ra-
dial wind speeds. The localization of each wake
vortex of one pair is performed independently.The
initial tracking window is based on the distance
from the LIDAR position to the middle of the
runway and for subsequent time steps the two
windows are moved independently based on the
average crosswinds measured by the Lidar. The
accuracy of the localization depends on the resolu-
tion of the data at any given location, while the
precision depends on the turbulence present in the
atmosphere. Hence, higher the amount of turbu-
lence, lower the precision of the algorithm. A his-
tory of one wake vortex track is saved to filter
out unexpected behavior in the data.- Circulation of vortices: The circulation /
strength is then determined for the two wake vor-tices by using aleast squareiterative approach forfitting a Hallock-Burnham wake vortex analyticalmodel on the radial wind speeds near the core loc-ation[11]. This approach has been tweaked to beable to calculate vortex circulation strengths evenfor one single vortex, mostly at the edge of the
RHI scan. The sensitivity of the circulationstrength depends on the accuracy of the localiza-tion of the vortex cores. Based on sensitivity ana-lysis, it was observed that an accuracy of at least5 m, is necessary for accurate circulationstrengths.
For all these steps, the algorithm estimatesthe cross wind vertical profile for each scan in or-der to remove it from the radial wind speeds andto keep only the wind speeds induced by the wakevortices.
3 Wake Vortex Data Collection at Paris-Charles de Gaulle Airport
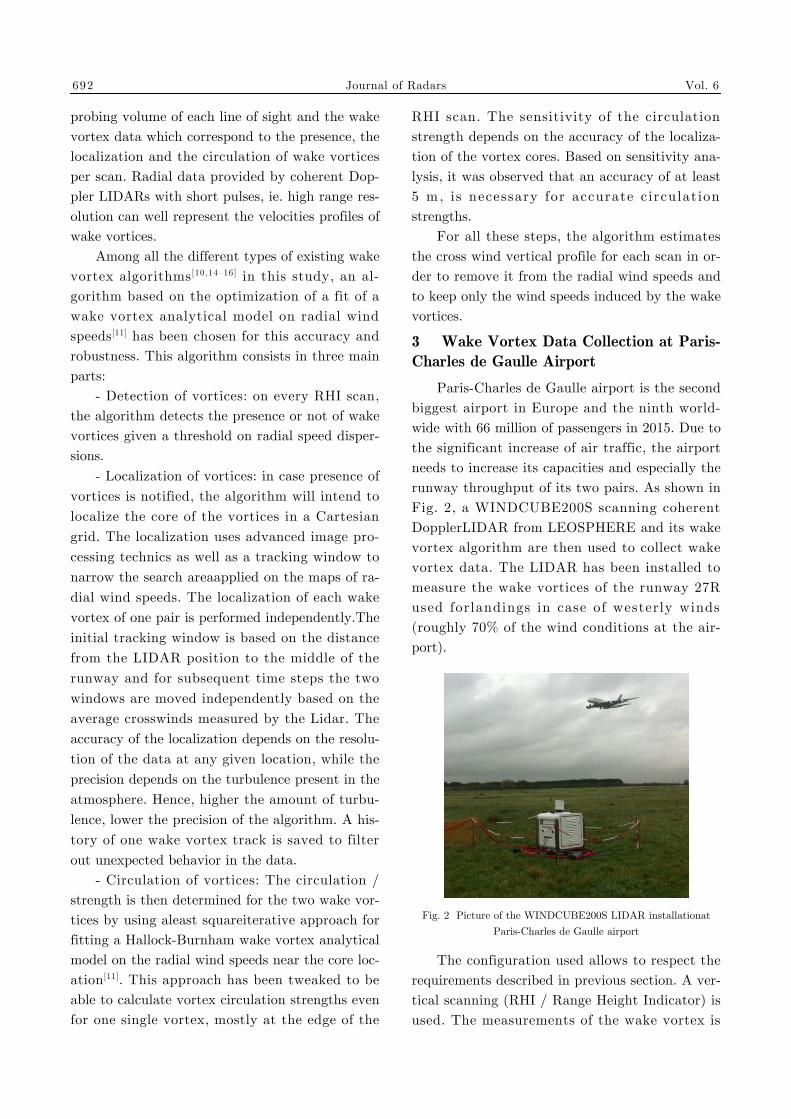
Paris-Charles de Gaulle airport is the secondbiggest airport in Europe and the ninth world-wide with 66 million of passengers in 2015. Due tothe significant increase of air traffic, the airportneeds to increase its capacities and especially therunway throughput of its two pairs. As shown inFig. 2, a WINDCUBE200S scanning coherentDopplerLIDAR from LEOSPHERE and its wakevortex algorithm are then used to collect wakevortex data. The LIDAR has been installed tomeasure the wake vortices of the runway 27Rused forlandings in case of westerly winds(roughly 70% of the wind conditions at the air-port).
The configuration used allows to respect therequirements described in previous section. A ver-tical scanning (RHI / Range Height Indicator) isused. The measurements of the wake vortex is
Fig. 2 Picture of the WINDCUBE200S LIDAR installationat
Paris-Charles de Gaulle airport
692 Journal of Radars Vol. 6
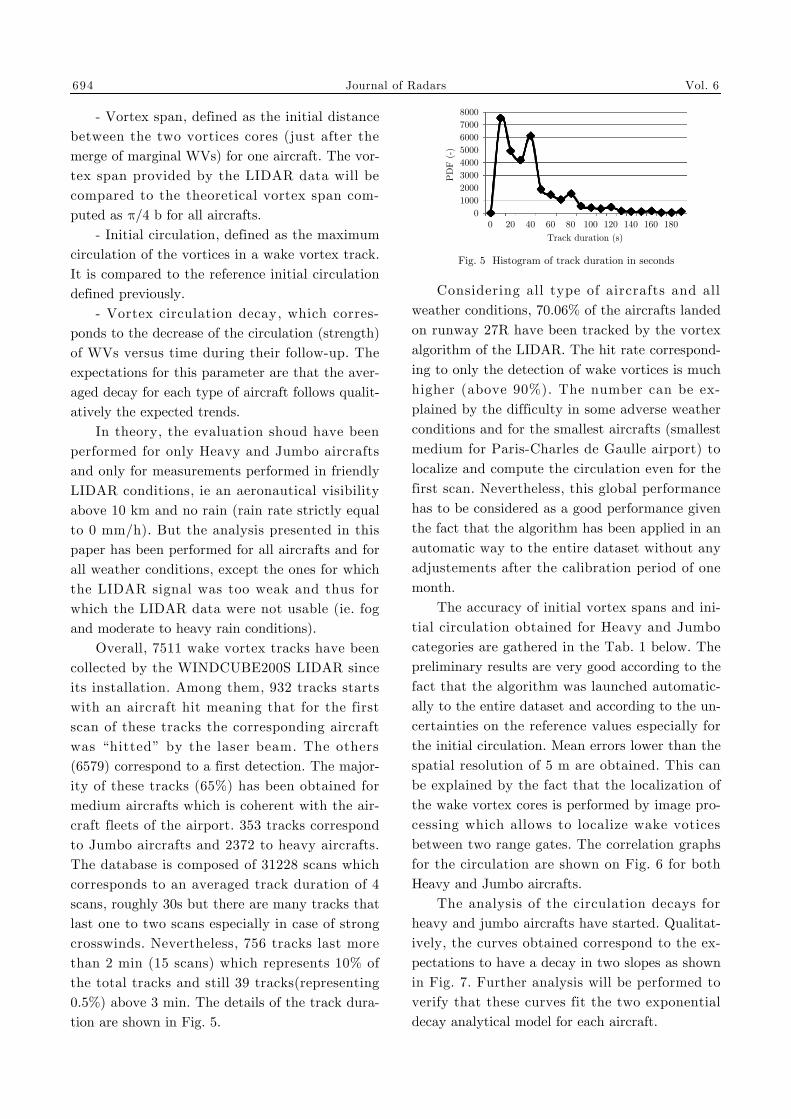
performed when the scan is going down in ordernot to deform the shape of the wake vortex whichare usely going down. The measurement pointsalong the beams of the LIDAR are setup in orderto have the target vertical and range resolutionsin the area of interest defined as 250 m on eachside of the runway. As indicated in Fig. 3, as theLIDAR is located at 350 m from the runway cen-ter, the wake vortex can be monitored between100 m to 600 m with the target resolutions. But itis important to mention that the LIDAR ac-quires data from 60 m to 800 m. This leads to ac-quire 158 measurement points per line of sight.Given the altitude of the aircrafts (80 m abovethe ground), the swept angle of the RHI scan hasbeen defined in order to be able to measure wakevortices very close to the LIDAR at 100 m of alti-tude. It has been fixed to 24°. Following the re-quirements of 8 s of update rate of wake vortexdata, the scanning speed is thus imposed to3.75°/s taking into account 1 s for the scanninghead to come back to the starting position. Toreach the vertical resolution of 2 m, an angularresolution of 0.19° must be used that leads to anaccumulation time per beam of 50 ms. TheWINDCUBE Lidar is configured in the wake vor-tex mode with specific pulses and analysis win-dows and with the use of range gate overlappingin order to reach the targetted range resolution of5 m.
In order to collect, archive and post-processthe huge amount of data collected, the LIDAR isdirectly connected to a wake vortex server that
archives all the data collected, post-processes thespectra data into radial data in a first step andinto vortex data in a second step. In total, 17hours of wake vortex measurements are per-formed per day.
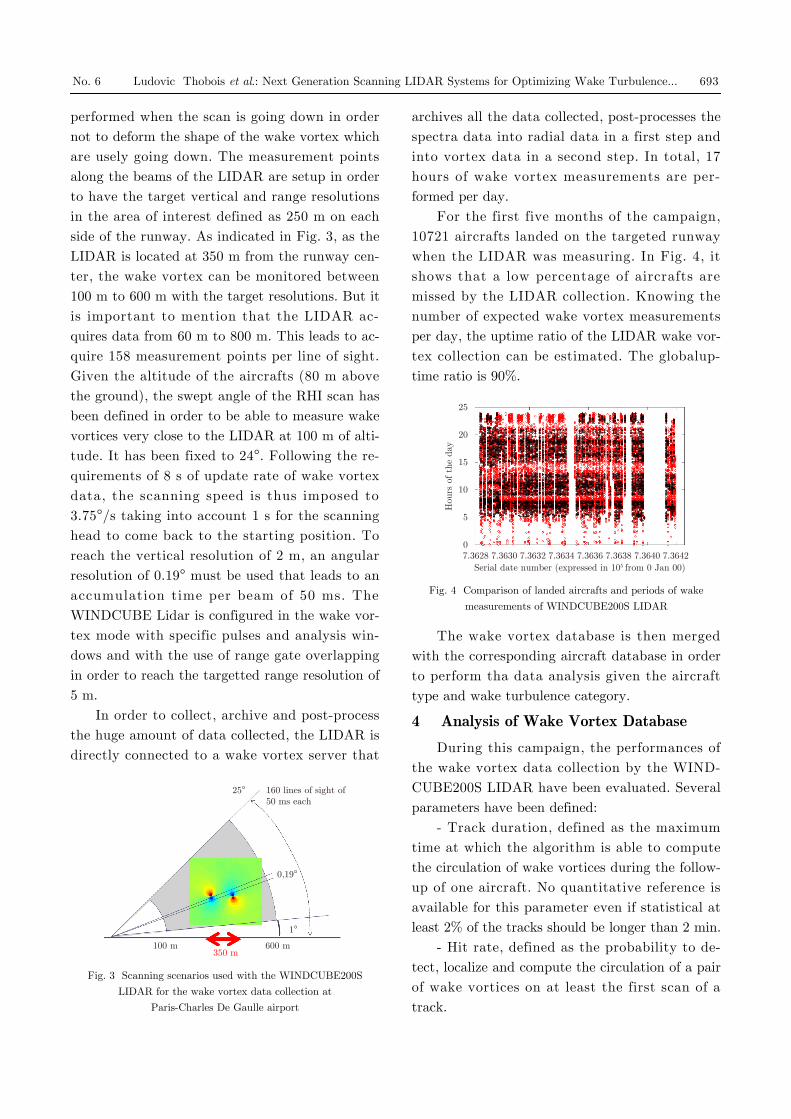
For the first five months of the campaign,10721 aircrafts landed on the targeted runwaywhen the LIDAR was measuring. In Fig. 4, itshows that a low percentage of aircrafts aremissed by the LIDAR collection. Knowing thenumber of expected wake vortex measurementsper day, the uptime ratio of the LIDAR wake vor-tex collection can be estimated. The globalup-time ratio is 90%.
The wake vortex database is then mergedwith the corresponding aircraft database in orderto perform tha data analysis given the aircrafttype and wake turbulence category.
4 Analysis of Wake Vortex Database
During this campaign, the performances ofthe wake vortex data collection by the WIND-CUBE200S LIDAR have been evaluated. Severalparameters have been defined:
- Track duration, defined as the maximumtime at which the algorithm is able to computethe circulation of wake vortices during the follow-up of one aircraft. No quantitative reference isavailable for this parameter even if statistical atleast 2% of the tracks should be longer than 2 min.
- Hit rate, defined as the probability to de-tect, localize and compute the circulation of a pairof wake vortices on at least the first scan of atrack.
25°
0,19°
160 lines of sight of50 ms each
1°
600 m350 m
100 m
Fig. 3 Scanning scenarios used with the WINDCUBE200S
LIDAR for the wake vortex data collection at
Paris-Charles De Gaulle airport
Hou
rs o
f th
e da
y
Serial date number (expressed in 105 from 0 Jan 00)
25
20
15
10
5
07.3628 7.3630 7.3632 7.3634 7.3636 7.3638 7.3640 7.3642
Fig. 4 Comparison of landed aircrafts and periods of wake
measurements of WINDCUBE200S LIDAR
No. 6 Ludovic Thobois et al.: Next Generation Scanning LIDAR Systems for Optimizing Wake Turbulence... 693
- Vortex span, defined as the initial distancebetween the two vortices cores (just after themerge of marginal WVs) for one aircraft. The vor-tex span provided by the LIDAR data will becompared to the theoretical vortex span com-puted as p/4 b for all aircrafts.
- Initial circulation, defined as the maximumcirculation of the vortices in a wake vortex track.It is compared to the reference initial circulationdefined previously.
- Vortex circulation decay, which corres-ponds to the decrease of the circulation (strength)of WVs versus time during their follow-up. Theexpectations for this parameter are that the aver-aged decay for each type of aircraft follows qualit-atively the expected trends.
In theory, the evaluation shoud have beenperformed for only Heavy and Jumbo aircraftsand only for measurements performed in friendlyLIDAR conditions, ie an aeronautical visibilityabove 10 km and no rain (rain rate strictly equalto 0 mm/h). But the analysis presented in thispaper has been performed for all aircrafts and forall weather conditions, except the ones for whichthe LIDAR signal was too weak and thus forwhich the LIDAR data were not usable (ie. fogand moderate to heavy rain conditions).
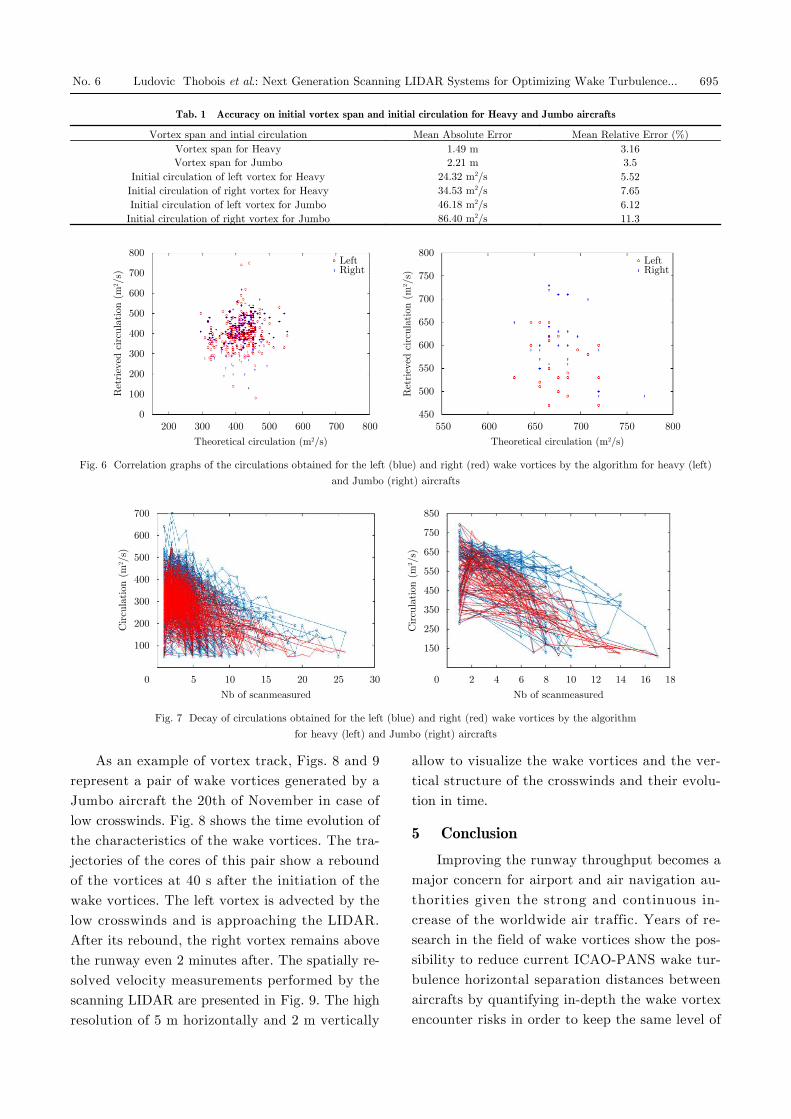
Overall, 7511 wake vortex tracks have beencollected by the WINDCUBE200S LIDAR sinceits installation. Among them, 932 tracks startswith an aircraft hit meaning that for the firstscan of these tracks the corresponding aircraftwas “hitted” by the laser beam. The others(6579) correspond to a first detection. The major-ity of these tracks (65%) has been obtained formedium aircrafts which is coherent with the air-craft fleets of the airport. 353 tracks correspondto Jumbo aircrafts and 2372 to heavy aircrafts.The database is composed of 31228 scans whichcorresponds to an averaged track duration of 4scans, roughly 30s but there are many tracks thatlast one to two scans especially in case of strongcrosswinds. Nevertheless, 756 tracks last morethan 2 min (15 scans) which represents 10% ofthe total tracks and still 39 tracks(representing0.5%) above 3 min. The details of the track dura-tion are shown in Fig. 5.
Considering all type of aircrafts and allweather conditions, 70.06% of the aircrafts landedon runway 27R have been tracked by the vortexalgorithm of the LIDAR. The hit rate correspond-ing to only the detection of wake vortices is muchhigher (above 90%). The number can be ex-plained by the difficulty in some adverse weatherconditions and for the smallest aircrafts (smallestmedium for Paris-Charles de Gaulle airport) tolocalize and compute the circulation even for thefirst scan. Nevertheless, this global performancehas to be considered as a good performance giventhe fact that the algorithm has been applied in anautomatic way to the entire dataset without anyadjustements after the calibration period of onemonth.
The accuracy of initial vortex spans and ini-tial circulation obtained for Heavy and Jumbocategories are gathered in the Tab. 1 below. Thepreliminary results are very good according to thefact that the algorithm was launched automatic-ally to the entire dataset and according to the un-certainties on the reference values especially forthe initial circulation. Mean errors lower than thespatial resolution of 5 m are obtained. This canbe explained by the fact that the localization ofthe wake vortex cores is performed by image pro-cessing which allows to localize wake voticesbetween two range gates. The correlation graphsfor the circulation are shown on Fig. 6 for bothHeavy and Jumbo aircrafts.
The analysis of the circulation decays forheavy and jumbo aircrafts have started. Qualitat-ively, the curves obtained correspond to the ex-pectations to have a decay in two slopes as shownin Fig. 7. Further analysis will be performed toverify that these curves fit the two exponentialdecay analytical model for each aircraft.
80007000600050004000300020001000
PD
F (
-)
00 20 40 60
Track duration (s)
80 100 120 140 160 180
Fig. 5 Histogram of track duration in seconds
694 Journal of Radars Vol. 6
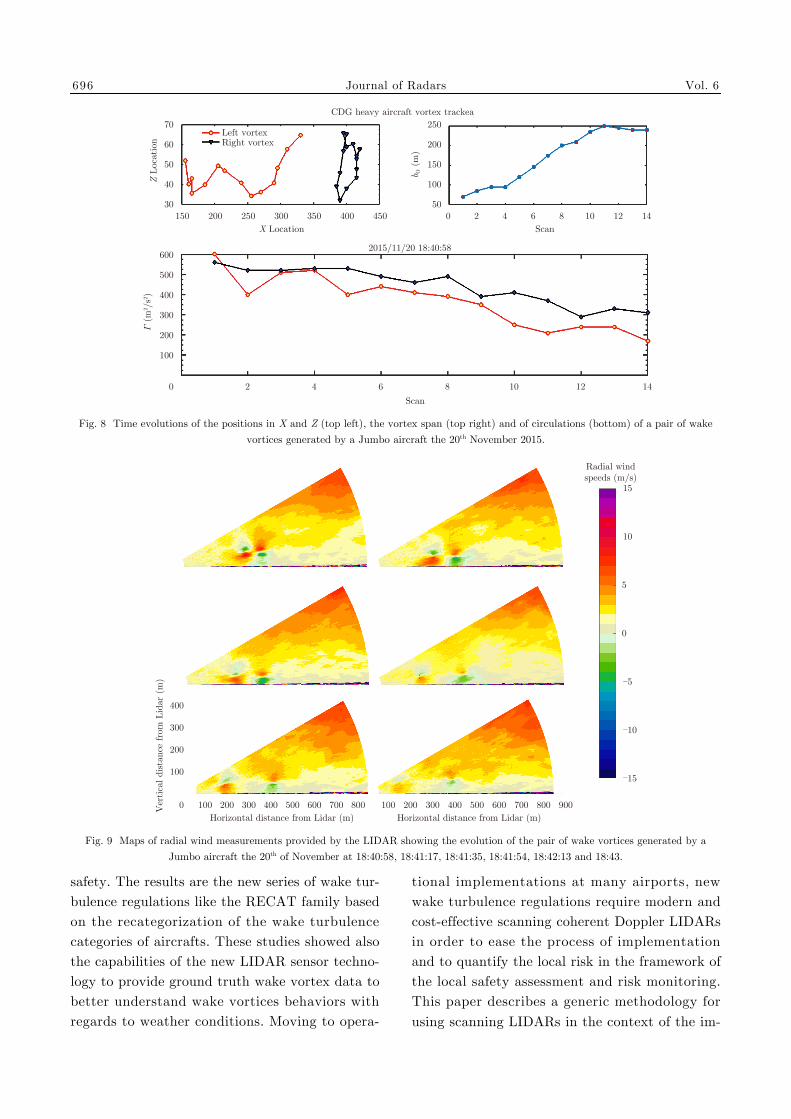
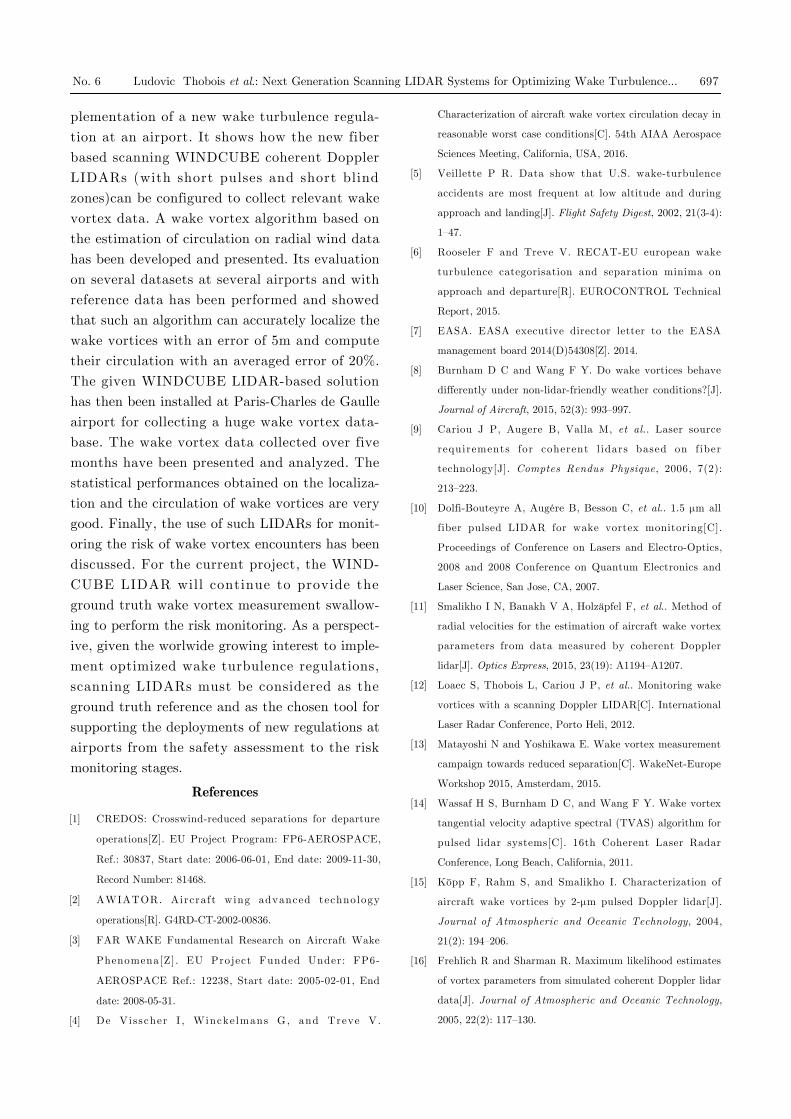
As an example of vortex track, Figs. 8 and 9represent a pair of wake vortices generated by aJumbo aircraft the 20th of November in case oflow crosswinds. Fig. 8 shows the time evolution ofthe characteristics of the wake vortices. The tra-jectories of the cores of this pair show a reboundof the vortices at 40 s after the initiation of thewake vortices. The left vortex is advected by thelow crosswinds and is approaching the LIDAR.After its rebound, the right vortex remains abovethe runway even 2 minutes after. The spatially re-solved velocity measurements performed by thescanning LIDAR are presented in Fig. 9. The highresolution of 5 m horizontally and 2 m vertically
allow to visualize the wake vortices and the ver-tical structure of the crosswinds and their evolu-tion in time.
5 Conclusion
Improving the runway throughput becomes amajor concern for airport and air navigation au-thorities given the strong and continuous in-crease of the worldwide air traffic. Years of re-search in the field of wake vortices show the pos-sibility to reduce current ICAO-PANS wake tur-bulence horizontal separation distances betweenaircrafts by quantifying in-depth the wake vortexencounter risks in order to keep the same level of
Ret
riev
ed c
ircu
lati
on (
m2 /
s)
800
700
600
500
400
300
200
100
0R
etri
eved
cir
cula
tion
(m
2 /s)
800LeftRight
750
700
650
600
550
500
450200 300 400 500 600 700 800
Theoretical circulation (m2/s)
550 600 650 700 750 800
Theoretical circulation (m2/s)
LeftRight
Fig. 6 Correlation graphs of the circulations obtained for the left (blue) and right (red) wake vortices by the algorithm for heavy (left)
and Jumbo (right) aircrafts
Cir
cula
tion
(m
2 /s)
700
600
500
400
300
200
100
0
Cir
cula
tion
(m
2 /s)
850
750
650
550
450
350
250
150
05 10 15 20 25 30
Nb of scanmeasured
2 4 6 8 10 12 14 16 18
Nb of scanmeasured Fig. 7 Decay of circulations obtained for the left (blue) and right (red) wake vortices by the algorithm
for heavy (left) and Jumbo (right) aircrafts
Tab. 1 Accuracy on initial vortex span and initial circulation for Heavy and Jumbo aircrafts
Vortex span and intial circulation Mean Absolute Error Mean Relative Error (%)Vortex span for Heavy 1.49 m 3.16Vortex span for Jumbo 2.21 m 3.5
Initial circulation of left vortex for Heavy 24.32 m2/s 5.52Initial circulation of right vortex for Heavy 34.53 m2/s 7.65Initial circulation of left vortex for Jumbo 46.18 m2/s 6.12
Initial circulation of right vortex for Jumbo 86.40 m2/s 11.3
No. 6 Ludovic Thobois et al.: Next Generation Scanning LIDAR Systems for Optimizing Wake Turbulence... 695
safety. The results are the new series of wake tur-bulence regulations like the RECAT family basedon the recategorization of the wake turbulencecategories of aircrafts. These studies showed alsothe capabilities of the new LIDAR sensor techno-logy to provide ground truth wake vortex data tobetter understand wake vortices behaviors withregards to weather conditions. Moving to opera-
tional implementations at many airports, newwake turbulence regulations require modern andcost-effective scanning coherent Doppler LIDARsin order to ease the process of implementationand to quantify the local risk in the framework ofthe local safety assessment and risk monitoring.This paper describes a generic methodology for
using scanning LIDARs in the context of the im-
2 4 6
Scan
ScanX Location
Left vortexRight vortex
2015/11/20 18:40:58
CDG heavy aircraft vortex trackea
b O (
m)
8 10 14120
2 4 6 8 10 14120200 250 300 350 400 450150
Z L
ocat
ion
70
60
50
40
30
250
200
150
100
50
600
500
400
300
200
100
G (
m2 /
s2 )
Fig. 8 Time evolutions of the positions in X and Z (top left), the vortex span (top right) and of circulations (bottom) of a pair of wake
vortices generated by a Jumbo aircraft the 20th November 2015.
Horizontal distance from Lidar (m) Horizontal distance from Lidar (m)
Ver
tica
l di
stan
ce fro
m L
idar
(m
)
Radial windspeeds (m/s)
400
300
200
100
0 100 200 300 400 500 600 700 800 100 200 300 400 500 600 700 800 900
15
10
5
0
-5
-10
-15
Fig. 9 Maps of radial wind measurements provided by the LIDAR showing the evolution of the pair of wake vortices generated by a
Jumbo aircraft the 20th of November at 18:40:58, 18:41:17, 18:41:35, 18:41:54, 18:42:13 and 18:43.
696 Journal of Radars Vol. 6
plementation of a new wake turbulence regula-
tion at an airport. It shows how the new fiber
based scanning WINDCUBE coherent Doppler
LIDARs (with short pulses and short blind
zones)can be configured to collect relevant wake
vortex data. A wake vortex algorithm based on
the estimation of circulation on radial wind data
has been developed and presented. Its evaluation
on several datasets at several airports and with
reference data has been performed and showed
that such an algorithm can accurately localize the
wake vortices with an error of 5m and compute
their circulation with an averaged error of 20%.
The given WINDCUBE LIDAR-based solution
has then been installed at Paris-Charles de Gaulle
airport for collecting a huge wake vortex data-
base. The wake vortex data collected over five
months have been presented and analyzed. The
statistical performances obtained on the localiza-
tion and the circulation of wake vortices are very
good. Finally, the use of such LIDARs for monit-
oring the risk of wake vortex encounters has been
discussed. For the current project, the WIND-
CUBE LIDAR will continue to provide the
ground truth wake vortex measurement swallow-
ing to perform the risk monitoring. As a perspect-
ive, given the worlwide growing interest to imple-
ment optimized wake turbulence regulations,
scanning LIDARs must be considered as the
ground truth reference and as the chosen tool for
supporting the deployments of new regulations at
airports from the safety assessment to the risk
monitoring stages.
References
CREDOS: Crosswind-reduced separations for departure
operations[Z]. EU Project Program: FP6-AEROSPACE,
Ref.: 30837, Start date: 2006-06-01, End date: 2009-11-30,
Record Number: 81468.
[1]
AWIATOR. Aircraft wing advanced technology
operations[R]. G4RD-CT-2002-00836.
[2]
FAR WAKE Fundamental Research on Aircraft Wake
Phenomena[Z]. EU Project Funded Under: FP6-
AEROSPACE Ref.: 12238, Start date: 2005-02-01, End
date: 2008-05-31.
[3]
De Visscher I , Wincke lmans G, and Treve V.[4]
Characterization of aircraft wake vortex circulation decay in
reasonable worst case conditions[C]. 54th AIAA Aerospace
Sciences Meeting, California, USA, 2016.
Veillette P R. Data show that U.S. wake-turbulence
accidents are most frequent at low altitude and during
approach and landing[J]. Flight Safety Digest, 2002, 21(3-4):
1–47.
[5]
Rooseler F and Treve V. RECAT-EU european wake
turbulence categorisation and separation minima on
approach and departure[R]. EUROCONTROL Technical
Report, 2015.
[6]
EASA. EASA executive director letter to the EASA
management board 2014(D)54308[Z]. 2014.
[7]
Burnham D C and Wang F Y. Do wake vortices behave
differently under non-lidar-friendly weather conditions?[J].
Journal of Aircraft, 2015, 52(3): 993–997.
[8]
Cariou J P, Augere B, Valla M, et al.. Laser source
requirements for coherent l idars based on f iber
technology[J]. Comptes Rendus Physique, 2006, 7(2):
213–223.
[9]
Dolfi-Bouteyre A, Augére B, Besson C, et al.. 1.5 μm all
fiber pulsed LIDAR for wake vortex monitoring[C].
Proceedings of Conference on Lasers and Electro-Optics,
2008 and 2008 Conference on Quantum Electronics and
Laser Science, San Jose, CA, 2007.
[10]
Smalikho I N, Banakh V A, Holzäpfel F, et al.. Method of
radial velocities for the estimation of aircraft wake vortex
parameters from data measured by coherent Doppler
lidar[J]. Optics Express, 2015, 23(19): A1194–A1207.
[11]
Loaec S, Thobois L, Cariou J P, et al.. Monitoring wake
vortices with a scanning Doppler LIDAR[C]. International
Laser Radar Conference, Porto Heli, 2012.
[12]
Matayoshi N and Yoshikawa E. Wake vortex measurement
campaign towards reduced separation[C]. WakeNet-Europe
Workshop 2015, Amsterdam, 2015.
[13]
Wassaf H S, Burnham D C, and Wang F Y. Wake vortex
tangential velocity adaptive spectral (TVAS) algorithm for
pulsed lidar systems[C]. 16th Coherent Laser Radar
Conference, Long Beach, California, 2011.
[14]
Köpp F, Rahm S, and Smalikho I. Characterization of
aircraft wake vortices by 2-μm pulsed Doppler lidar[J].
Journal of Atmospheric and Oceanic Technology, 2004,
21(2): 194–206.
[15]
Frehlich R and Sharman R. Maximum likelihood estimates
of vortex parameters from simulated coherent Doppler lidar
data[J]. Journal of Atmospheric and Oceanic Technology,
2005, 22(2): 117–130.
[16]
No. 6 Ludovic Thobois et al.: Next Generation Scanning LIDAR Systems for Optimizing Wake Turbulence... 697

Ludovic Thobois received a Phd Thesis from INP
Toulouse, France in Fluid dynamics (2006). He studied
large eddy simulations of turbulent flows close to surfaces
without and with chemistry. He joined in 2011 the ad-
vanced research division of LEOSPHERE as the scientific
studies manager. He was in charge of developing new post-
processing techniques for providing more accurate and rel-
evant observations from LIDAR raw data. He is an active
participant of several working groups in Europe in charge
of exploring the capabilities of new remote sensors for
meteorology and aviation weather applications. He was for
example involved in several SESAR workpackages related
to the measurements of wake vortex and the detection of
wind shear at several airports in Europe including Paris-
Charles de Gaulle airport. He is also involved ina COST
European action related to the cooperation of European
countries in science and technology for the study of re-
mote sensing in future observing networks for weather &
climate. He is the author of many articles and presenta-
tions in international conferences in the fields of meteoro-
logy, aviation weather related conferences. He was also an
active participant of the expert groups related to wake
turbulence in Europe (WAKENET-EU) and in USA
(WAKENET-US).
Jean-Pierre Cariou is Scientific Director at Leosphere and
senior scientist in lidar technology. He received an engin-
eer degree in Optics from Institutd’ Optique Graduate
School inOrsay in 1981 and a PhD in Astronomy and Spa-
tial Techniques in 1983. At ONERA (French Aerospace
Lab), he has been involved in many developments of co-
herent lidars and laser imagers. During 10 years, he was
the head of the Laser and Optoelectronics research group,
including 20 scientists. He developed different generations
of lidars and participated to studies both in instrumental
modeling, source development and instrument design.
Since 1995, he has been creating new lidar instruments
based on 1.5 μm Erbium doped fiber amplifiers, allowing
single mode operation, reliability and cost effectiveness. In
2007, he joined Leosphere as Associate and Technical Dir-
ector. Since then, Leosphere is developing a family of co-
herent wind lidars, for wind energy market, meteorology
and airport wind hazard monitoring. He is currently head-
ing the Scientific Research & Technologies Department
(DRST), including new technologies and signal processing
developments, and external cooperation with academic in-
stitutions and companies as well. He is author of many
articles in the lidar field and tutored 5 PhD theses. Jean-
Pierre Cariou has been awarded the 2010 Inventor prize
by the Marius Lavet Foundation and the Montgolfier 2013
prize by the SEIN in France.
698 Journal of Radars Vol. 6


![3D Imaging for Array InSAR Based on Gaussian Mixture Model ...radars.ie.ac.cn/fileLDXB/journal/article/ldxb/2017/... · Gaussian mixture model clustering[J]. Journal of Radars, 2017,](https://img.pdfslide.net/doc/110x75/5f0f8fe47e708231d444c6c1/3d-imaging-for-array-insar-based-on-gaussian-mixture-model-gaussian-mixture.jpg)