Embed Size (px)
Citation preview
Next Generation Sequencing Informatics
Markets
November, 2014
Greg Caressi
SVP Healthcare & Life Sciences
2
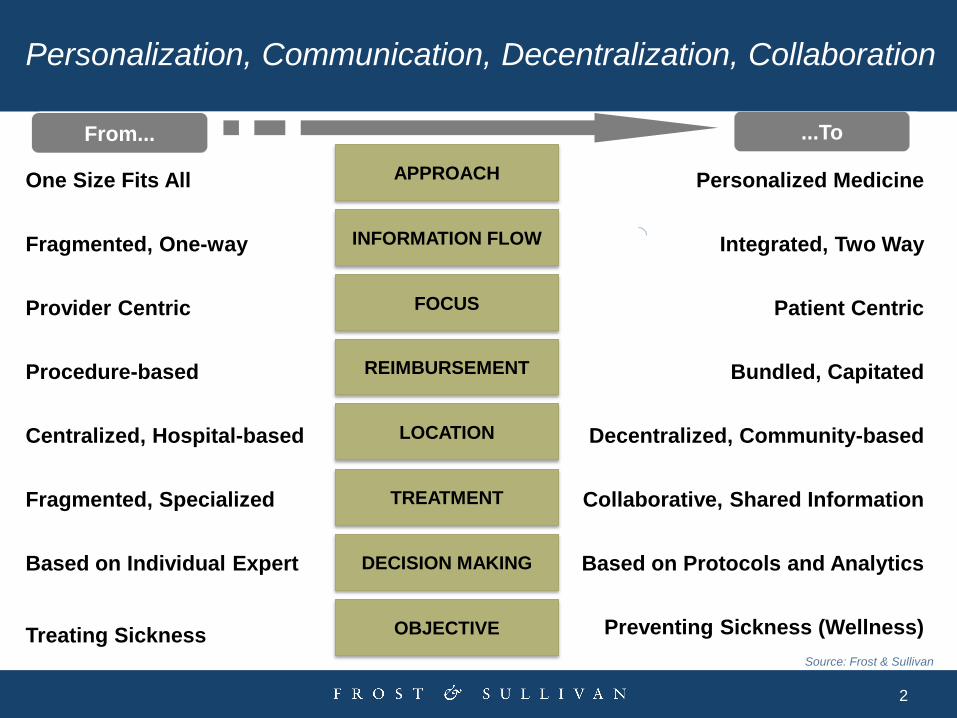
Personalization, Communication, Decentralization, Collaboration
Personalized Medicine
Patient Centric
Decentralized, Community-based
Collaborative, Shared Information
Based on Protocols and Analytics
Preventing Sickness (Wellness)
Integrated, Two Way
From...
One Size Fits All
Provider Centric
Centralized, Hospital-based
Fragmented, Specialized
Based on Individual Expert
Treating Sickness
Fragmented, One-way INFORMATION FLOW
LOCATION
FOCUS
APPROACH
TREATMENT
DECISION MAKING
OBJECTIVE
...To
Procedure-based Bundled, Capitated REIMBURSEMENT
Source: Frost & Sullivan
3
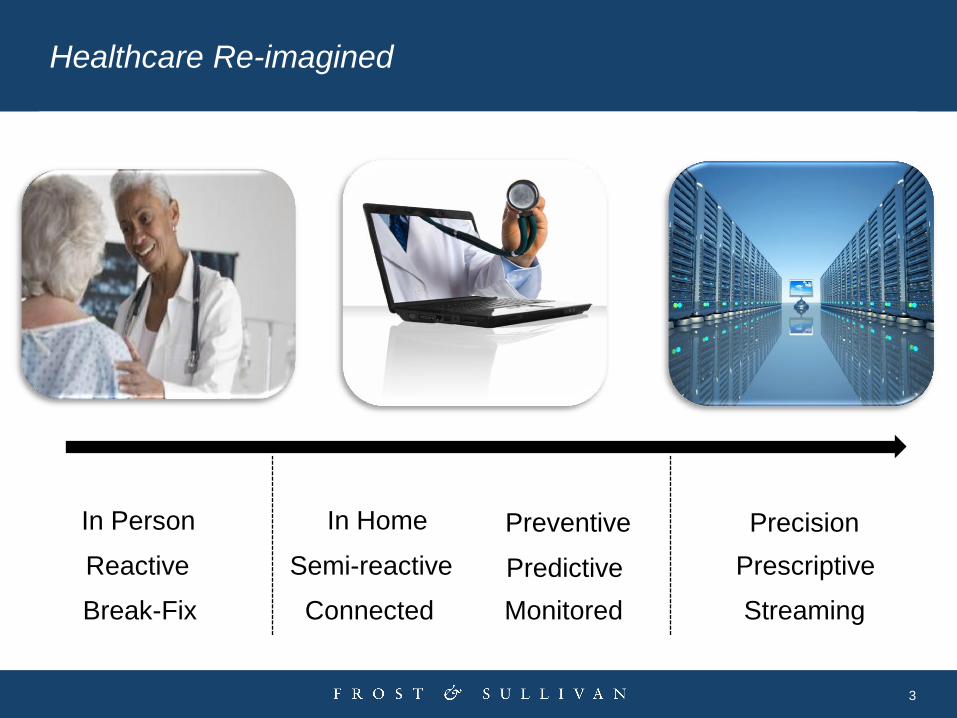
Healthcare Re-imagined
In Person In Home
Prescriptive Reactive Semi-reactive
Monitored
Predictive
Preventive
Break-Fix Connected
Precision
Streaming
4
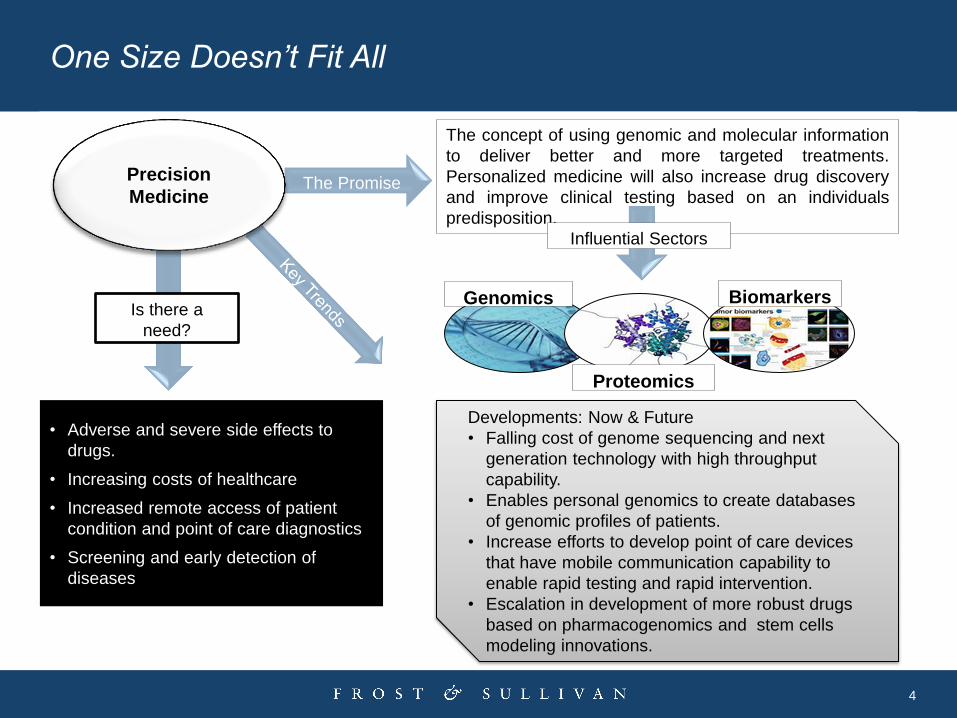
The Promise
One Size Doesn’t Fit All
Precision
Medicine
The concept of using genomic and molecular information
to deliver better and more targeted treatments.
Personalized medicine will also increase drug discovery
and improve clinical testing based on an individuals
predisposition.
Is there a
need?
• Adverse and severe side effects to
drugs.
• Increasing costs of healthcare
• Increased remote access of patient
condition and point of care diagnostics
• Screening and early detection of
diseases
Developments: Now & Future
• Falling cost of genome sequencing and next
generation technology with high throughput
capability.
• Enables personal genomics to create databases
of genomic profiles of patients.
• Increase efforts to develop point of care devices
that have mobile communication capability to
enable rapid testing and rapid intervention.
• Escalation in development of more robust drugs
based on pharmacogenomics and stem cells
modeling innovations.
Influential Sectors
Biomarkers
Proteomics
Genomics
5
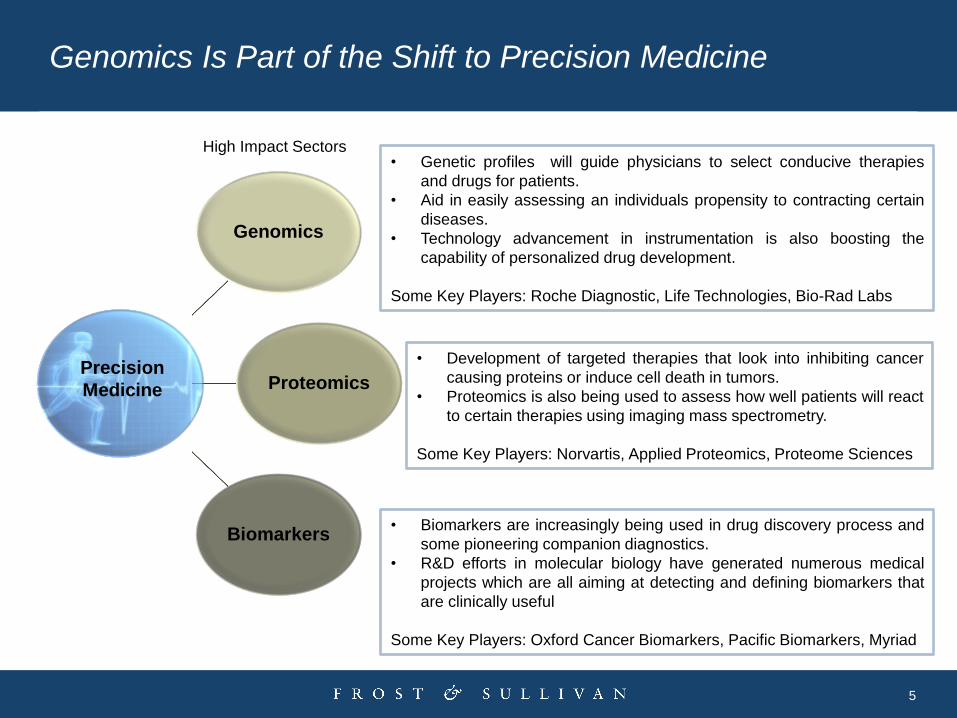
Genomics Is Part of the Shift to Precision Medicine
Genomics
Proteomics
Biomarkers
• Genetic profiles will guide physicians to select conducive therapies
and drugs for patients.
• Aid in easily assessing an individuals propensity to contracting certain
diseases.
• Technology advancement in instrumentation is also boosting the
capability of personalized drug development.
Some Key Players: Roche Diagnostic, Life Technologies, Bio-Rad Labs
• Development of targeted therapies that look into inhibiting cancer
causing proteins or induce cell death in tumors.
• Proteomics is also being used to assess how well patients will react
to certain therapies using imaging mass spectrometry.
Some Key Players: Norvartis, Applied Proteomics, Proteome Sciences
• Biomarkers are increasingly being used in drug discovery process and
some pioneering companion diagnostics.
• R&D efforts in molecular biology have generated numerous medical
projects which are all aiming at detecting and defining biomarkers that
are clinically useful
Some Key Players: Oxford Cancer Biomarkers, Pacific Biomarkers, Myriad
Precision
Medicine
High Impact Sectors
6
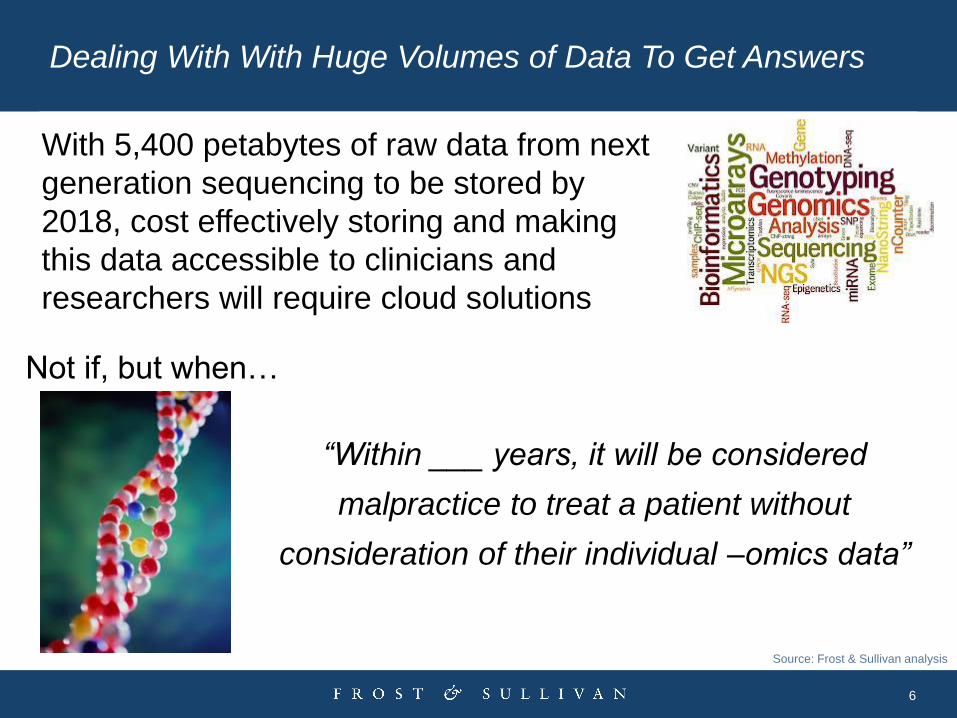
Dealing With With Huge Volumes of Data To Get Answers
Source: Frost & Sullivan analysis
“Within ___ years, it will be considered
malpractice to treat a patient without
consideration of their individual –omics data”
Not if, but when…
With 5,400 petabytes of raw data from next
generation sequencing to be stored by
2018, cost effectively storing and making
this data accessible to clinicians and
researchers will require cloud solutions
7
Change, By the Numbers
8
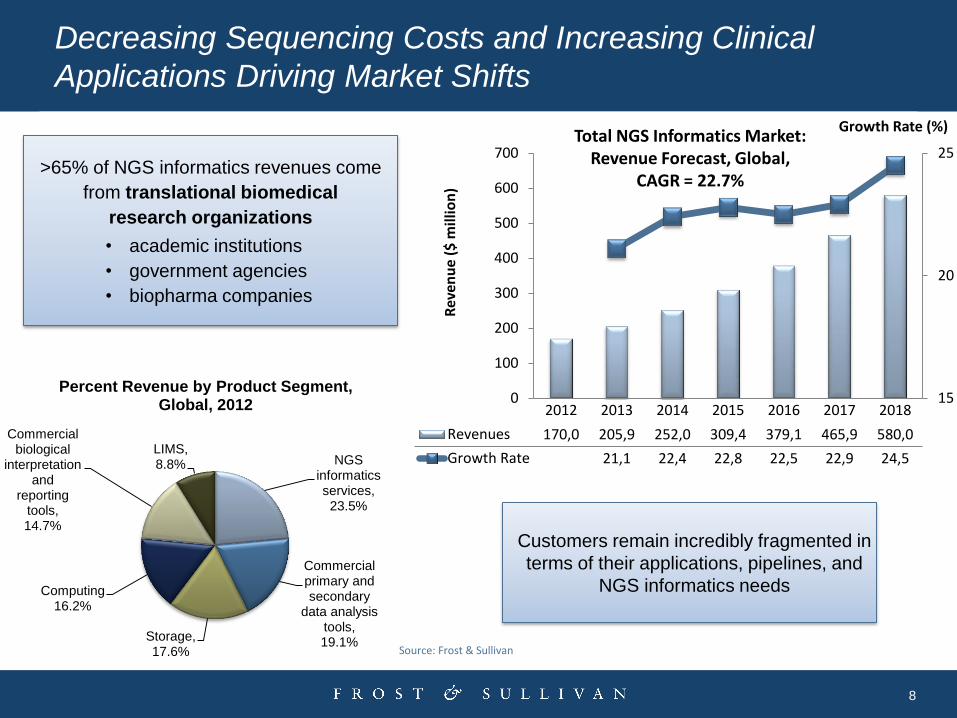
Decreasing Sequencing Costs and Increasing Clinical
Applications Driving Market Shifts
Source: Frost & Sullivan
Customers remain incredibly fragmented in
terms of their applications, pipelines, and
NGS informatics needs
>65% of NGS informatics revenues come
from translational biomedical
research organizations
• academic institutions
• government agencies
• biopharma companies
15
20
25
0
100
200
300
400
500
600
700
2012 2013 2014 2015 2016 2017 2018
Revenues 170,0 205,9 252,0 309,4 379,1 465,9 580,0
Growth Rate 21,1 22,4 22,8 22,5 22,9 24,5R
even
ue
($ m
illio
n)
Growth Rate (%) Total NGS Informatics Market:
Revenue Forecast, Global, CAGR = 22.7%
NGS informatics services, 23.5%
Commercial primary and secondary
data analysis tools, 19.1% Storage,
17.6%
Computing 16.2%
Commercial biological
interpretation and
reporting tools, 14.7%
LIMS, 8.8%
Percent Revenue by Product Segment, Global, 2012
9
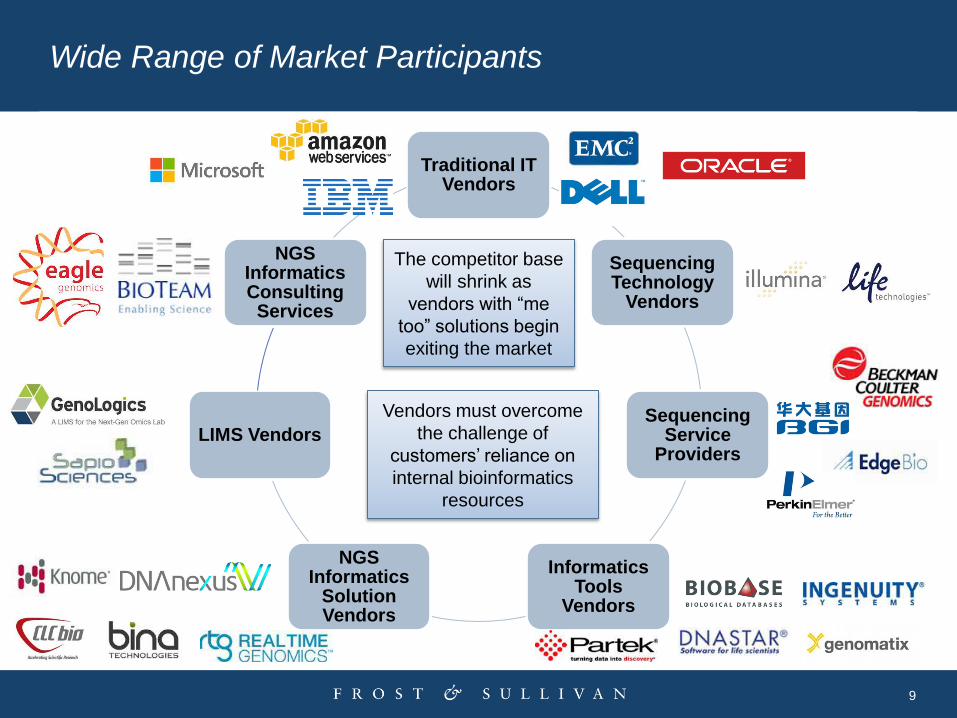
Traditional IT Vendors
Sequencing Technology
Vendors
Sequencing Service
Providers
Informatics Tools
Vendors
NGS Informatics
Solution Vendors
LIMS Vendors
NGS Informatics Consulting Services
Wide Range of Market Participants
The competitor base
will shrink as
vendors with “me
too” solutions begin
exiting the market
Vendors must overcome
the challenge of
customers’ reliance on
internal bioinformatics
resources
10
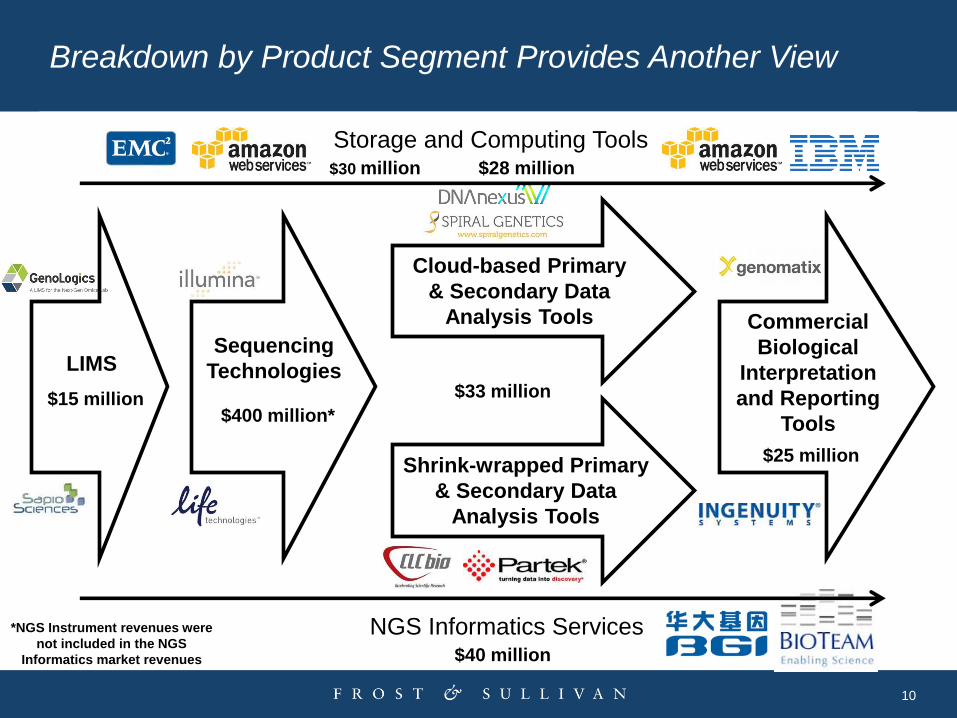
Breakdown by Product Segment Provides Another View
Storage and Computing Tools $30 million $28 million
NGS Informatics Services $40 million
LIMS
$15 million
Sequencing
Technologies
$400 million*
Commercial
Biological
Interpretation
and Reporting
Tools
$25 million
Cloud-based Primary
& Secondary Data
Analysis Tools
$33 million
Shrink-wrapped Primary
& Secondary Data
Analysis Tools
*NGS Instrument revenues were
not included in the NGS
Informatics market revenues
11
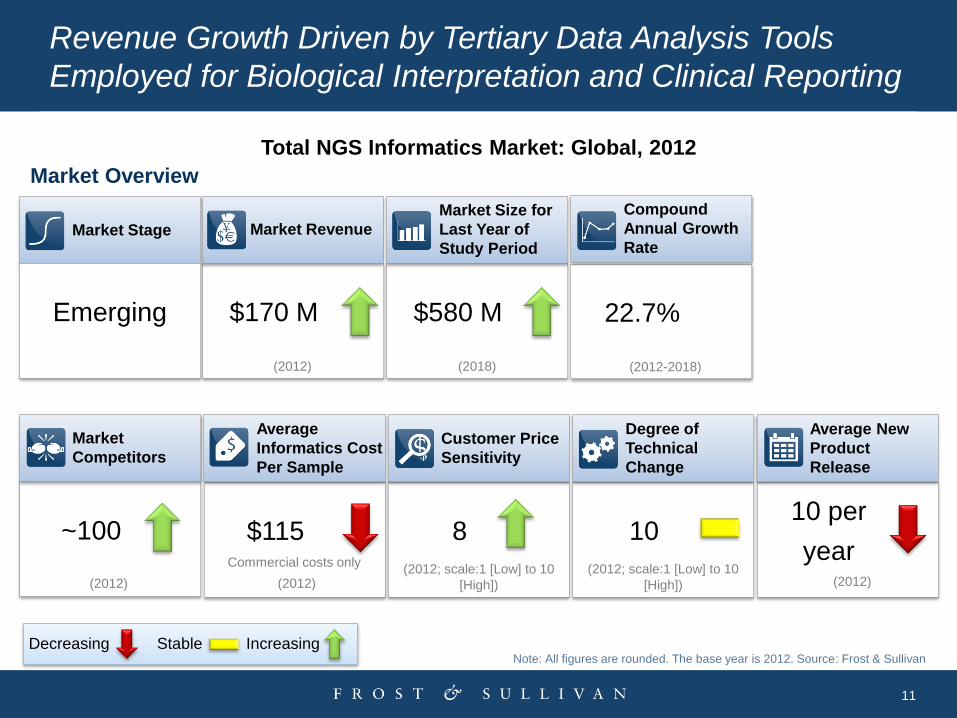
Revenue Growth Driven by Tertiary Data Analysis Tools
Employed for Biological Interpretation and Clinical Reporting
Note: All figures are rounded. The base year is 2012. Source: Frost & Sullivan
8
Customer Price
Sensitivity
(2012; scale:1 [Low] to 10
[High])
Stable Increasing Decreasing
Market Overview
10
Degree of
Technical
Change
(2012; scale:1 [Low] to 10
[High])
$170 M
Market Revenue
(2012)
$580 M
Market Size for
Last Year of
Study Period
(2018)
22.7%
Compound
Annual Growth
Rate
(2012-2018)
Market Stage
Emerging
$115
Average
Informatics Cost
Per Sample
(2012)
10 per
year
Average New
Product
Release
(2012)
Commercial costs only
~100
Market
Competitors
(2012)
Total NGS Informatics Market: Global, 2012
12
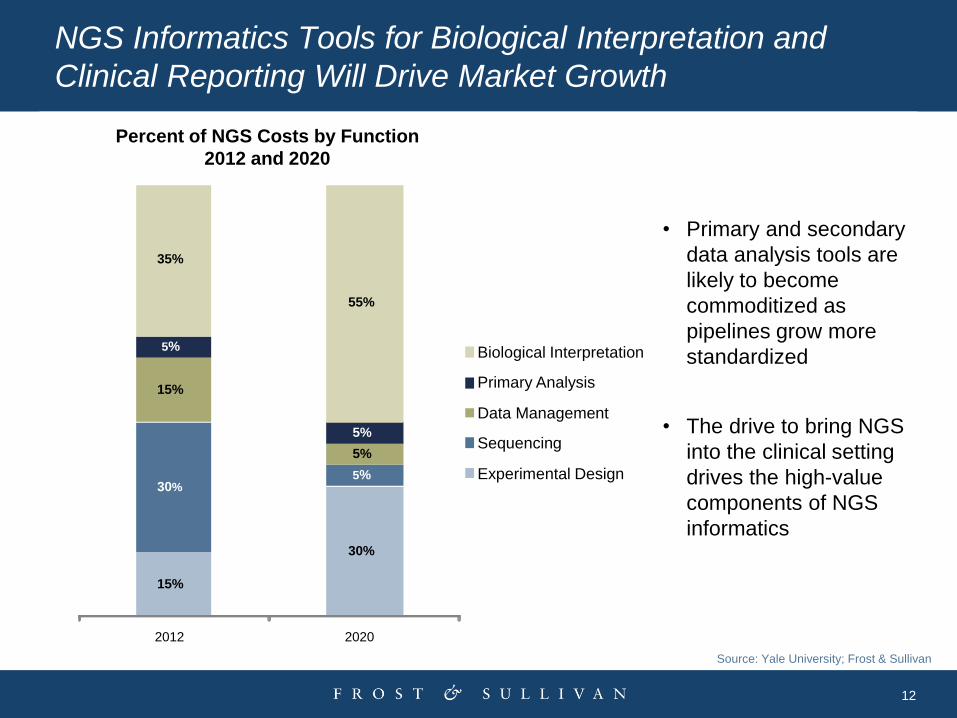
NGS Informatics Tools for Biological Interpretation and
Clinical Reporting Will Drive Market Growth
Source: Yale University; Frost & Sullivan
• Primary and secondary
data analysis tools are
likely to become
commoditized as
pipelines grow more
standardized
• The drive to bring NGS
into the clinical setting
drives the high-value
components of NGS
informatics
Percent of NGS Costs by Function
2012 and 2020
15%
30%
30% 5%
15%
5%
5%
5%
35%
55%
2012 2020
Biological Interpretation
Primary Analysis
Data Management
Sequencing
Experimental Design
13
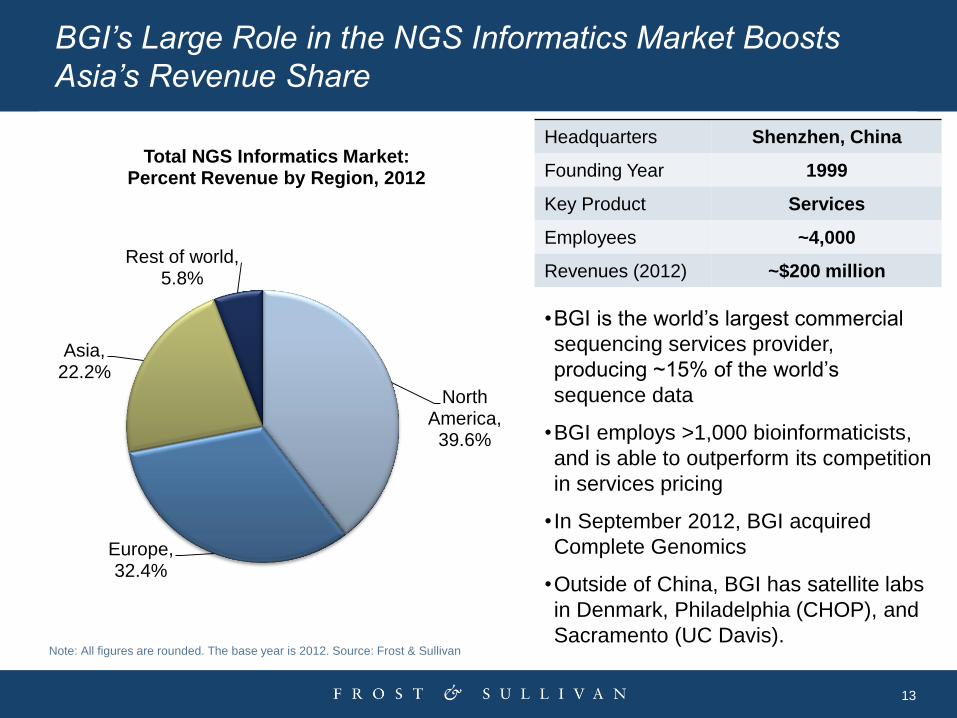
BGI’s Large Role in the NGS Informatics Market Boosts
Asia’s Revenue Share
Note: All figures are rounded. The base year is 2012. Source: Frost & Sullivan
North America,
39.6%
Europe, 32.4%
Asia, 22.2%
Rest of world, 5.8%
Total NGS Informatics Market: Percent Revenue by Region, 2012
Headquarters Shenzhen, China
Founding Year 1999
Key Product Services
Employees ~4,000
Revenues (2012) ~$200 million
•BGI is the world’s largest commercial
sequencing services provider,
producing ~15% of the world’s
sequence data
•BGI employs >1,000 bioinformaticists,
and is able to outperform its competition
in services pricing
• In September 2012, BGI acquired
Complete Genomics
•Outside of China, BGI has satellite labs
in Denmark, Philadelphia (CHOP), and
Sacramento (UC Davis).
14
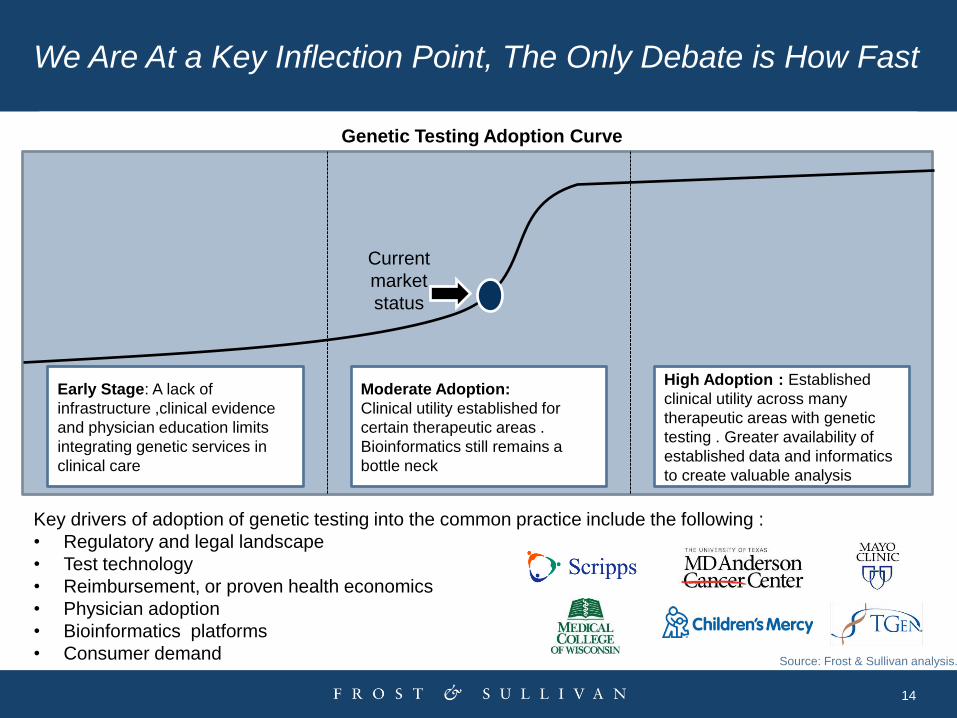
We Are At a Key Inflection Point, The Only Debate is How Fast
Early Stage: A lack of
infrastructure ,clinical evidence
and physician education limits
integrating genetic services in
clinical care
Moderate Adoption:
Clinical utility established for
certain therapeutic areas .
Bioinformatics still remains a
bottle neck
High Adoption : Established
clinical utility across many
therapeutic areas with genetic
testing . Greater availability of
established data and informatics
to create valuable analysis
Key drivers of adoption of genetic testing into the common practice include the following :
• Regulatory and legal landscape
• Test technology
• Reimbursement, or proven health economics
• Physician adoption
• Bioinformatics platforms
• Consumer demand
Current
market
status
Source: Frost & Sullivan analysis.
Genetic Testing Adoption Curve
15
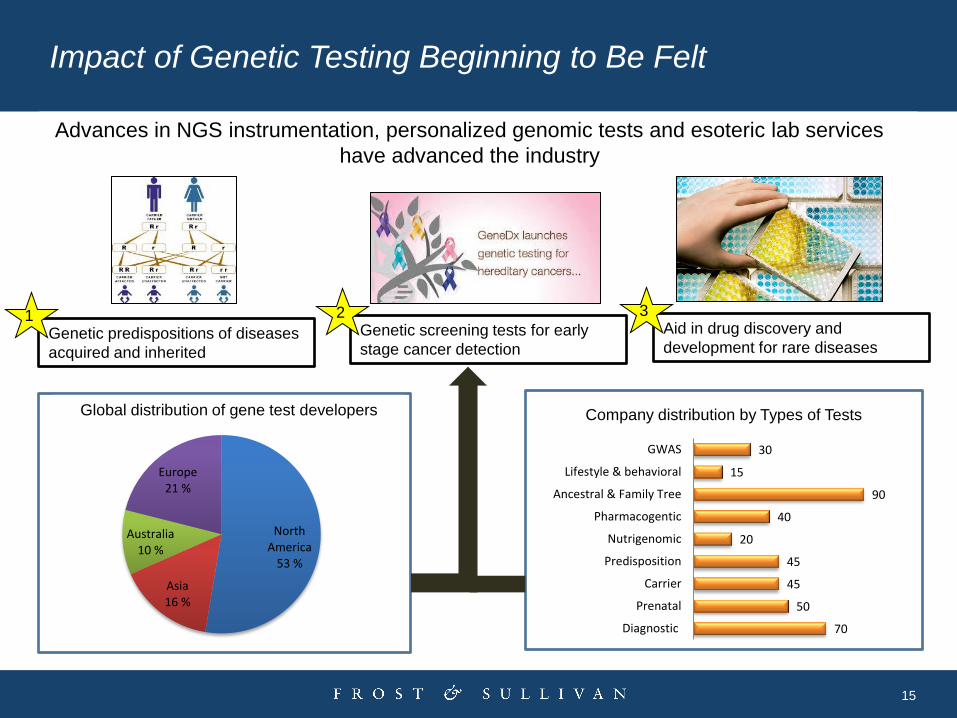
Impact of Genetic Testing Beginning to Be Felt
Global distribution of gene test developers
North America
53 %
Asia 16 %
Australia 10 %
Europe 21 %
Company distribution by Types of Tests
70
50
45
45
20
40
90
15
30
Diagnostic
Prenatal
Carrier
Predisposition
Nutrigenomic
Pharmacogentic
Ancestral & Family Tree
Lifestyle & behavioral
GWAS
Genetic predispositions of diseases
acquired and inherited
Advances in NGS instrumentation, personalized genomic tests and esoteric lab services
have advanced the industry
1 Genetic screening tests for early
stage cancer detection
2 Aid in drug discovery and
development for rare diseases
3
16
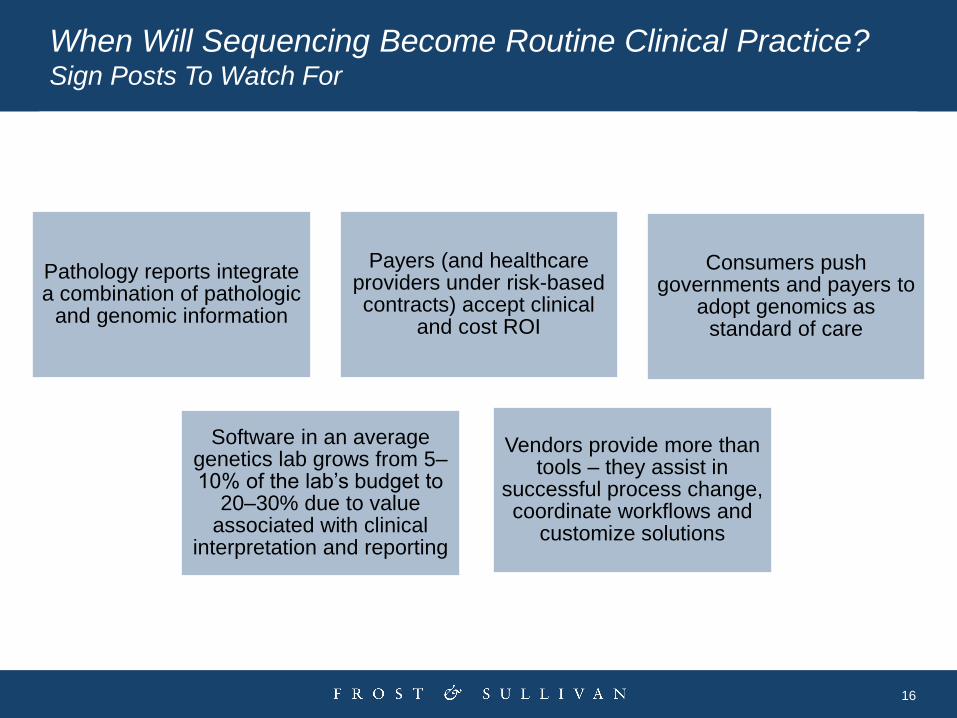
Pathology reports integrate a combination of pathologic
and genomic information
Payers (and healthcare providers under risk-based contracts) accept clinical
and cost ROI
Consumers push governments and payers to
adopt genomics as standard of care
Software in an average genetics lab grows from 5–10% of the lab’s budget to
20–30% due to value associated with clinical
interpretation and reporting
Vendors provide more than tools – they assist in
successful process change, coordinate workflows and
customize solutions
When Will Sequencing Become Routine Clinical Practice? Sign Posts To Watch For
17
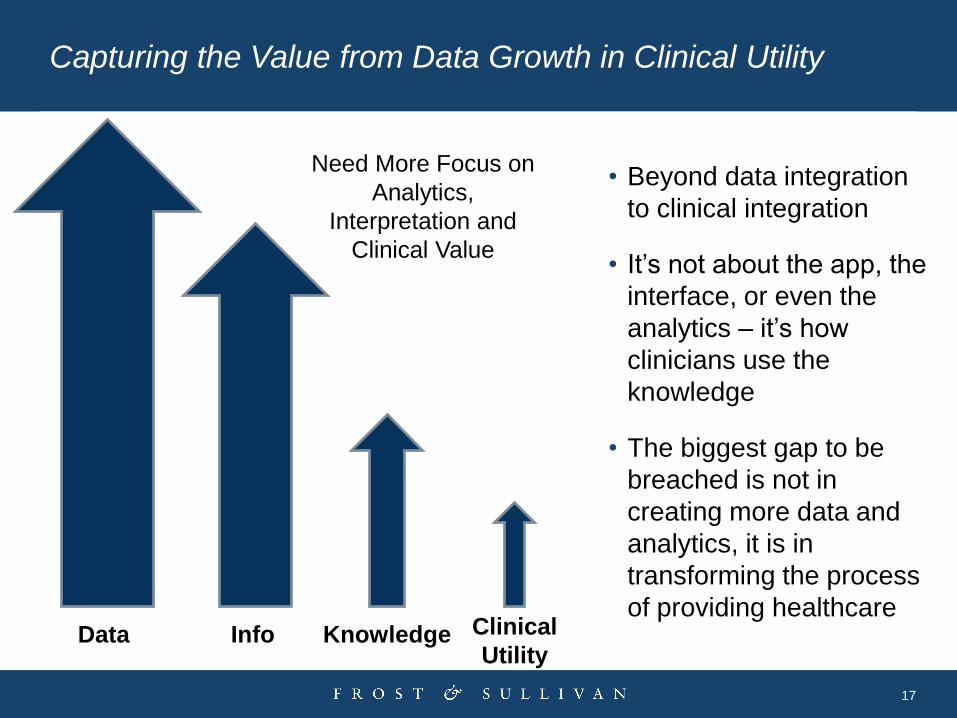
Capturing the Value from Data Growth in Clinical Utility
Data Info Knowledge Clinical
Utility
• Beyond data integration
to clinical integration
• It’s not about the app, the
interface, or even the
analytics – it’s how
clinicians use the
knowledge
• The biggest gap to be
breached is not in
creating more data and
analytics, it is in
transforming the process
of providing healthcare
Need More Focus on
Analytics,
Interpretation and
Clinical Value
18
What Will The Future Look Like?
• Healthcare increasingly data driven
and customized
• Healthcare more like other service
industries
• Globalized care delivery
• New care models focused on
collaboration, information exchange /
awareness, achieving health
outcomes, especially with chronic
disease care
• Increased development of standards
of care and incentives to adopt them
• Personalization of treatment,
interaction, coverage
• Increased patient engagement to
manage disease via remote
monitoring and mobile apps
• Increased leveraging of technology and
non-physicians
• More “generics” – technologies
providing same value at lower price,
stripped down feature sets
• Increased use of analytics to define
care pathways
19
Thank You
Greg Caressi Senior Vice President Healthcare & Life Sciences
(+1) 650 475-4555