Embed Size (px)
Citation preview
Next
Investor Presentation
January / February 2020
2
Agenda
Business model and strategy
ESG at SAF-HOLLAND
Market positioning
Our Acquisitions
Financial Performance 9M 2019
Outlook
Appendix
3
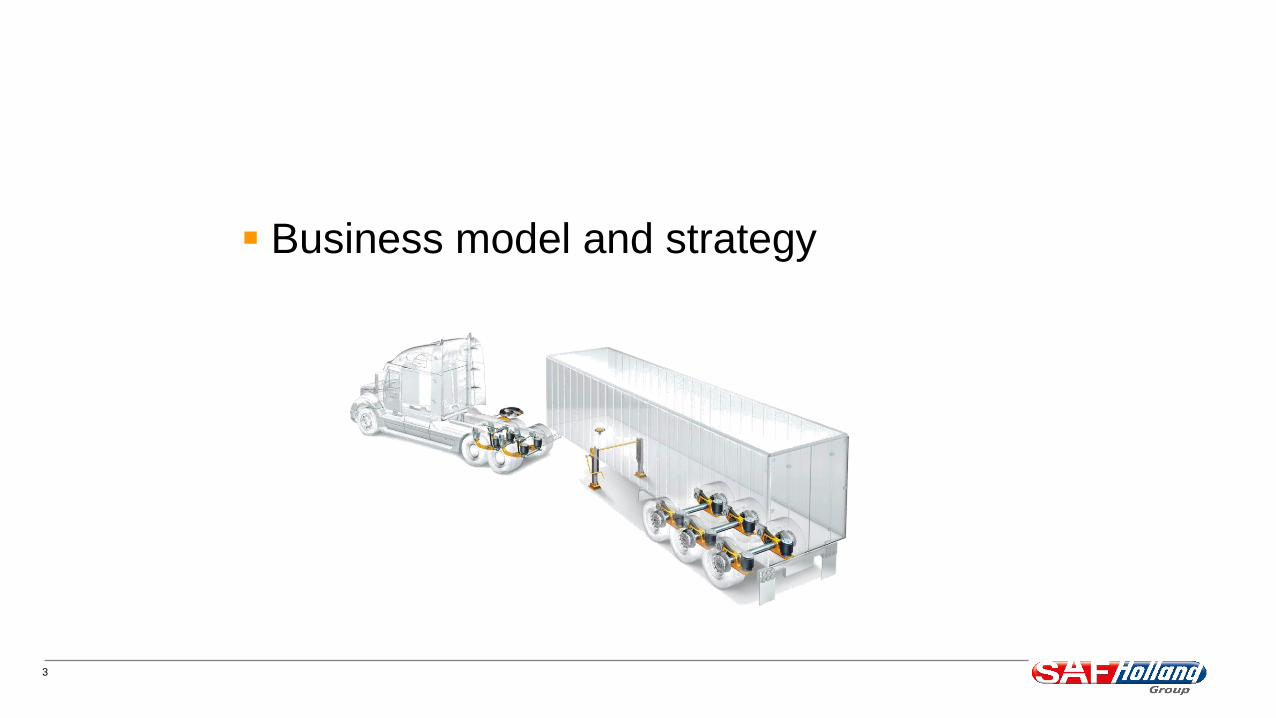
Business model and strategy
4
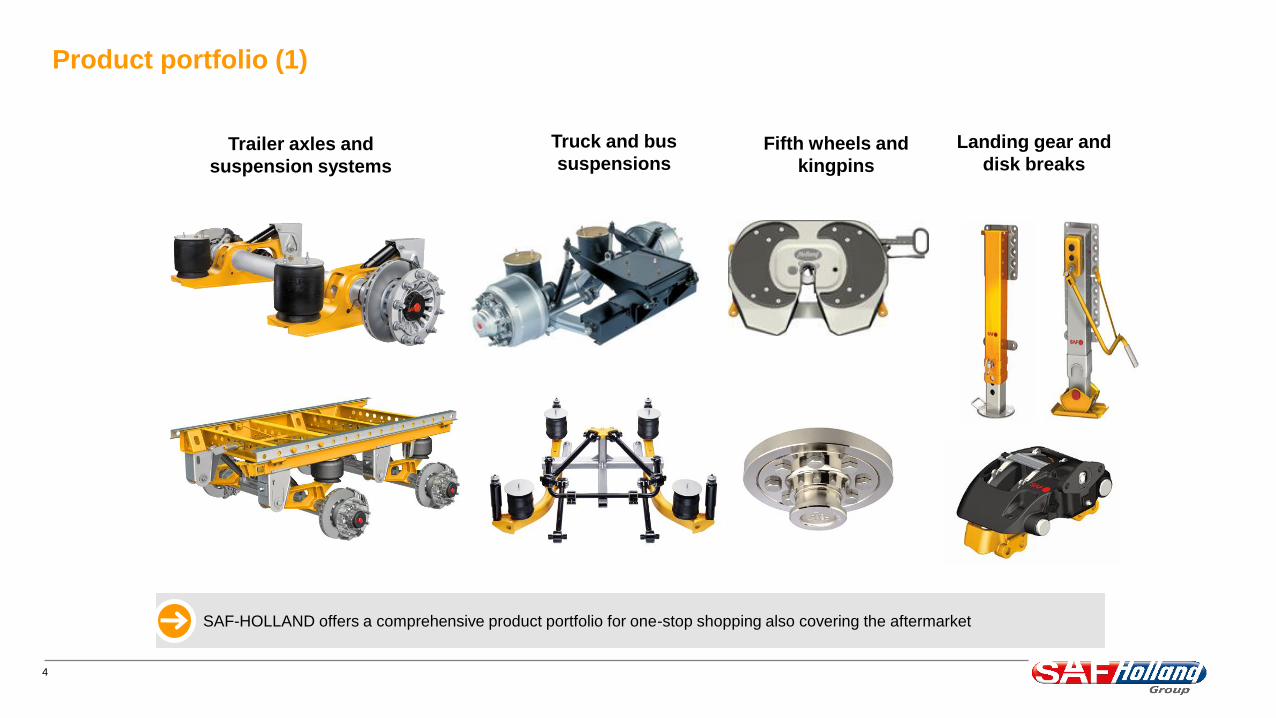
Product portfolio (1)
SAF-HOLLAND offers a comprehensive product portfolio for one-stop shopping also covering the aftermarket
Trailer axles and
suspension systems
Truck and bus
suspensionsFifth wheels and
kingpins
Landing gear and
disk breaks
5
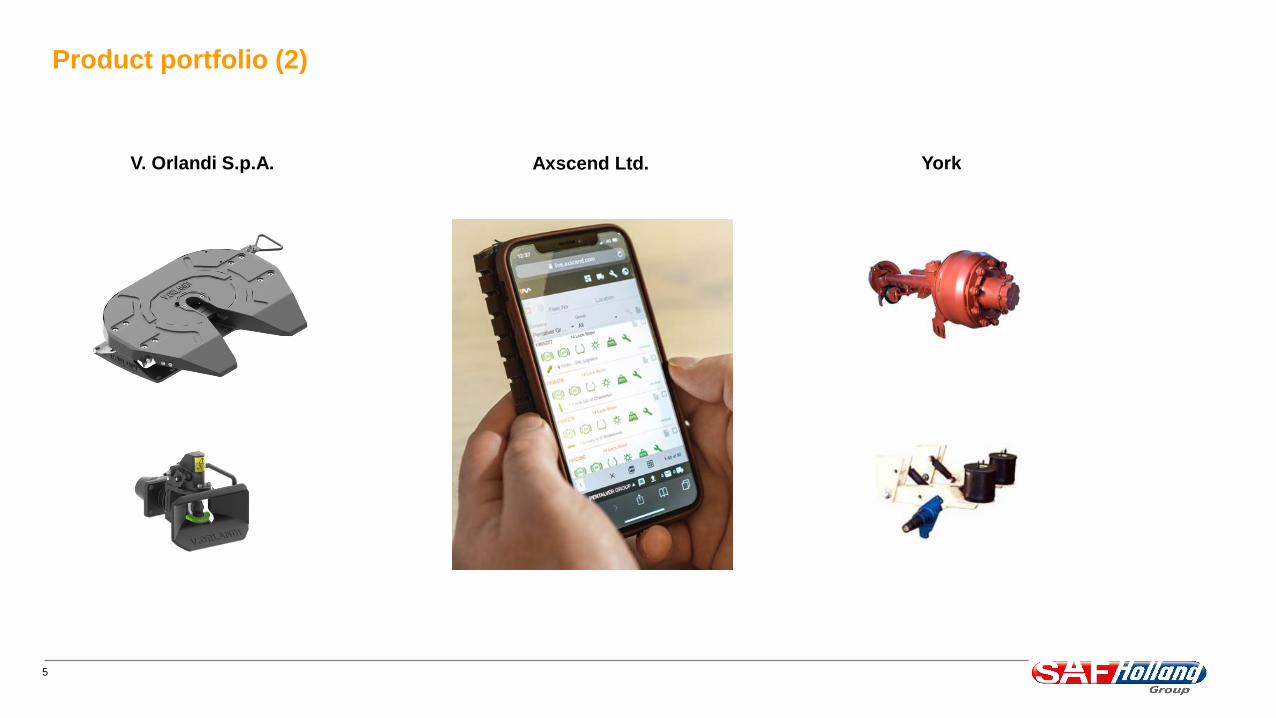
Product portfolio (2)
V. Orlandi S.p.A. YorkAxscend Ltd.
6
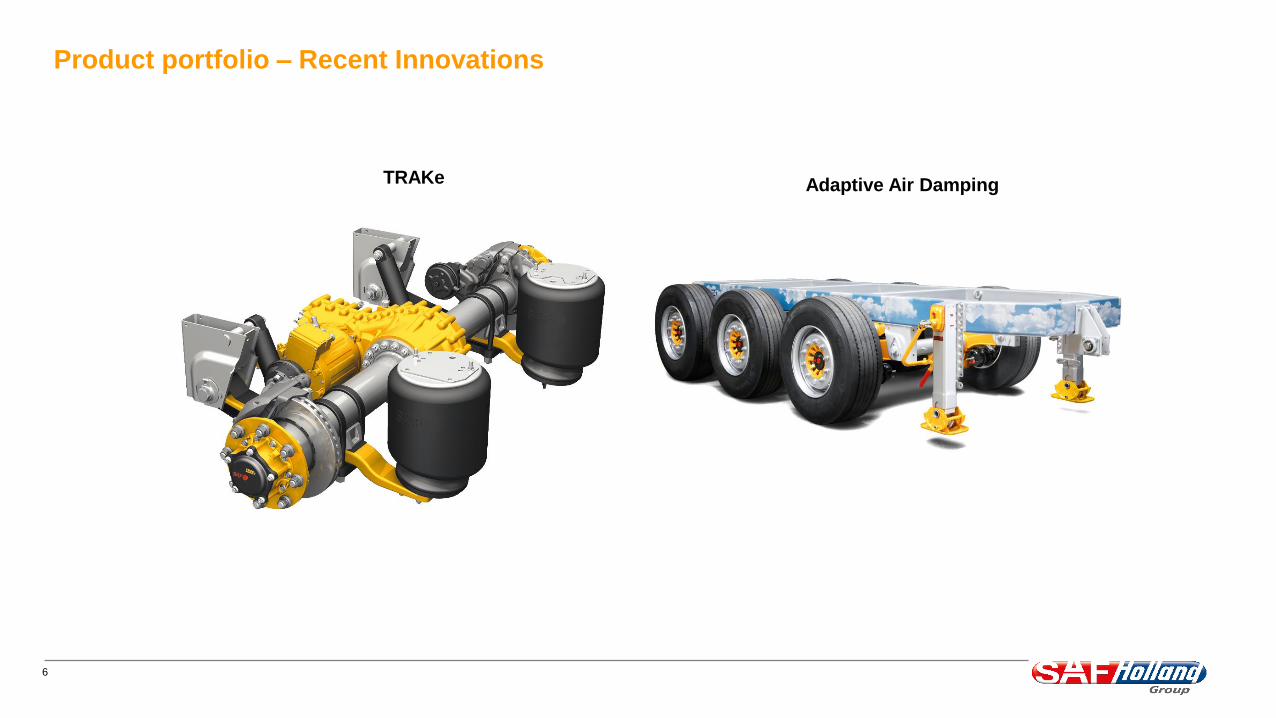
Product portfolio – Recent Innovations
TRAKe Adaptive Air Damping
7
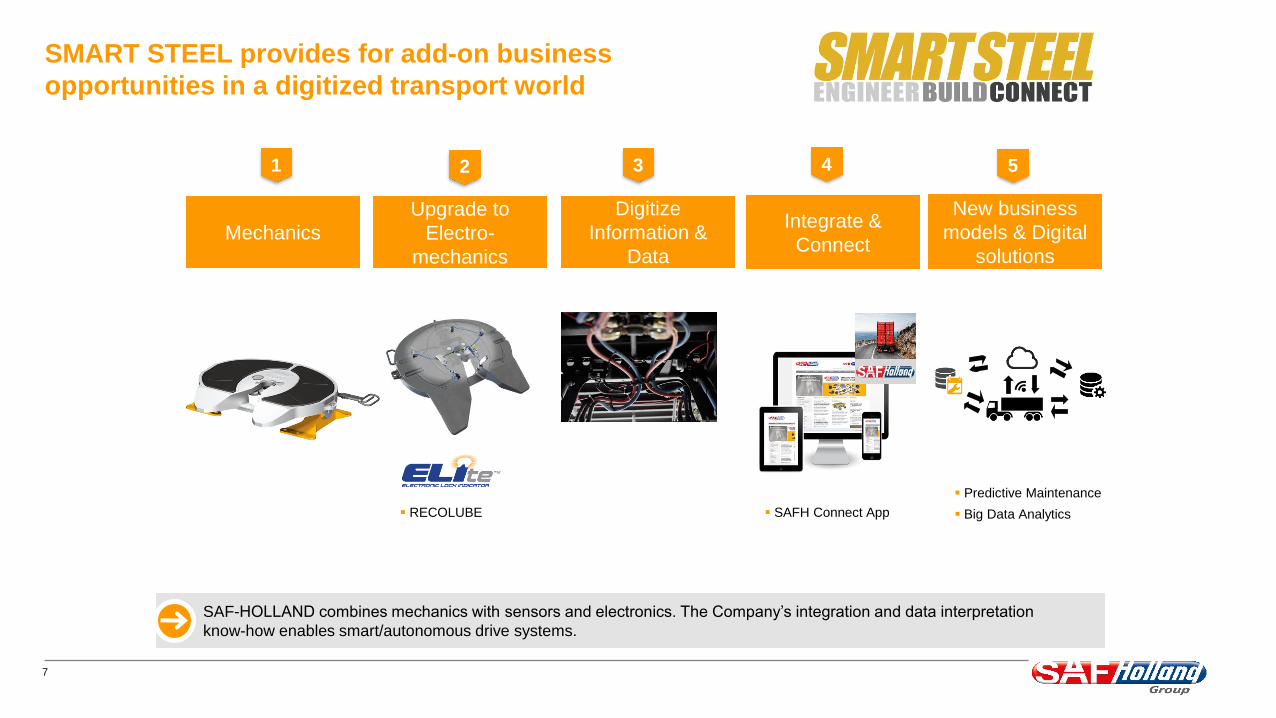
SMART STEEL provides for add-on business
opportunities in a digitized transport world
SAFH Connect App
Predictive Maintenance
Big Data Analytics
Mechanics
Upgrade to
Electro-
mechanics
Digitize
Information &
Data
New business
models & Digital
solutions
Integrate &
Connect
1 2 3 4 5
RECOLUBE
SAF-HOLLAND combines mechanics with sensors and electronics. The Company’s integration and data interpretation
know-how enables smart/autonomous drive systems.
8
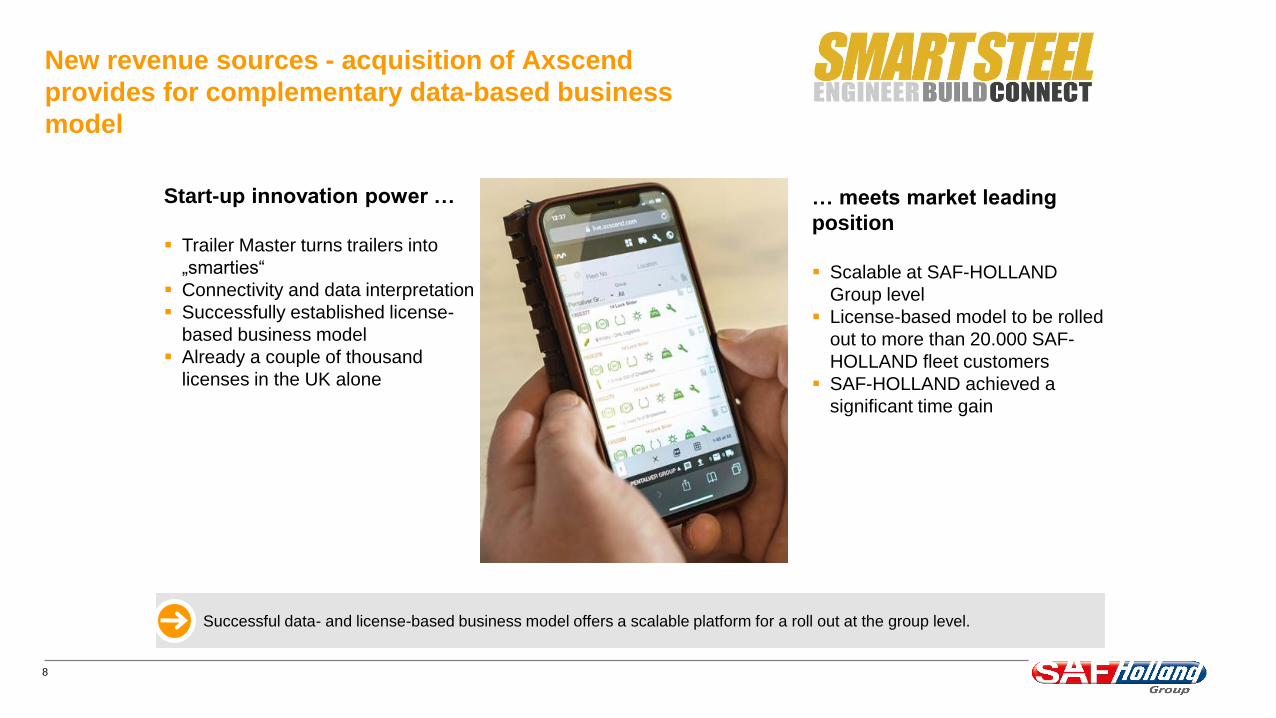
New revenue sources - acquisition of Axscend
provides for complementary data-based business
model
Start-up innovation power …
Trailer Master turns trailers into
„smarties“
Connectivity and data interpretation
Successfully established license-
based business model
Already a couple of thousand
licenses in the UK alone
… meets market leading
position
Scalable at SAF-HOLLAND
Group level
License-based model to be rolled
out to more than 20.000 SAF-
HOLLAND fleet customers
SAF-HOLLAND achieved a
significant time gain
Successful data- and license-based business model offers a scalable platform for a roll out at the group level.
9
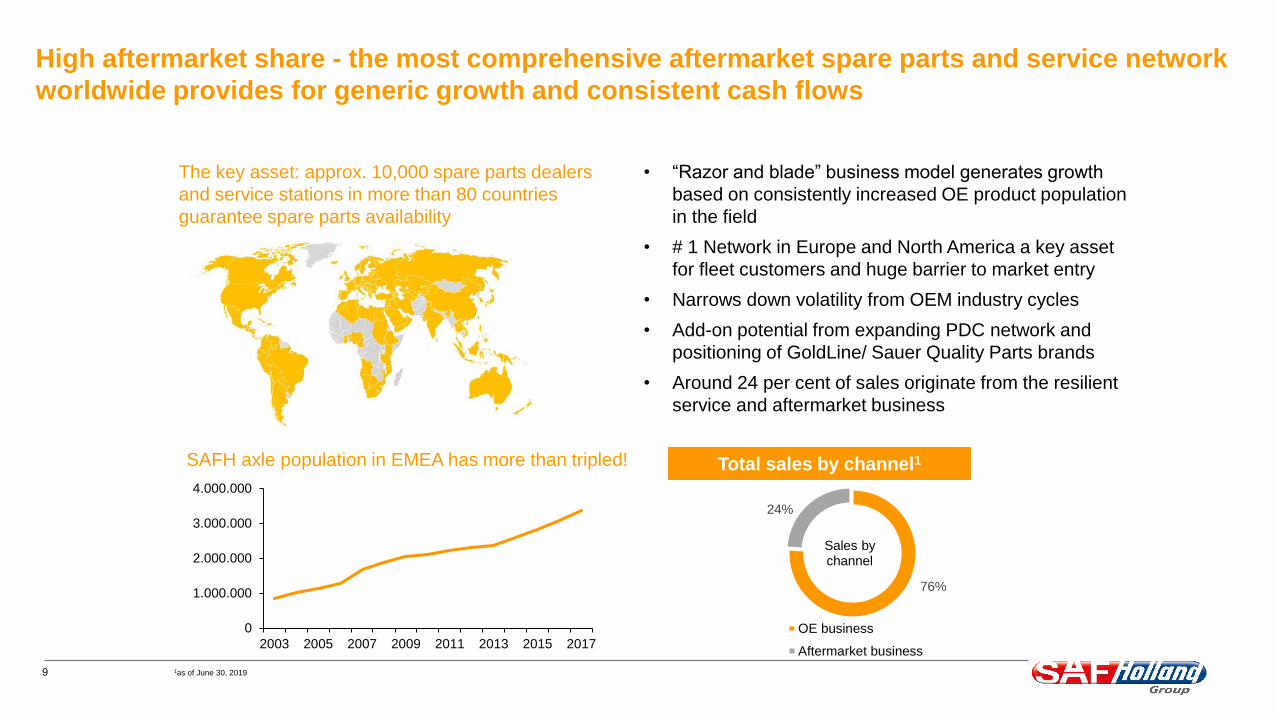
High aftermarket share - the most comprehensive aftermarket spare parts and service network
worldwide provides for generic growth and consistent cash flows
• “Razor and blade” business model generates growth
based on consistently increased OE product population
in the field
• # 1 Network in Europe and North America a key asset
for fleet customers and huge barrier to market entry
• Narrows down volatility from OEM industry cycles
• Add-on potential from expanding PDC network and
positioning of GoldLine/ Sauer Quality Parts brands
• Around 24 per cent of sales originate from the resilient
service and aftermarket business
The key asset: approx. 10,000 spare parts dealers
and service stations in more than 80 countries
guarantee spare parts availability
SAFH axle population in EMEA has more than tripled!
0
1.000.000
2.000.000
3.000.000
4.000.000
2003 2005 2007 2009 2011 2013 2015 2017
76%
24%
Sales by channel
OE business
Aftermarket business
1as of June 30, 2019
Total sales by channel1
10
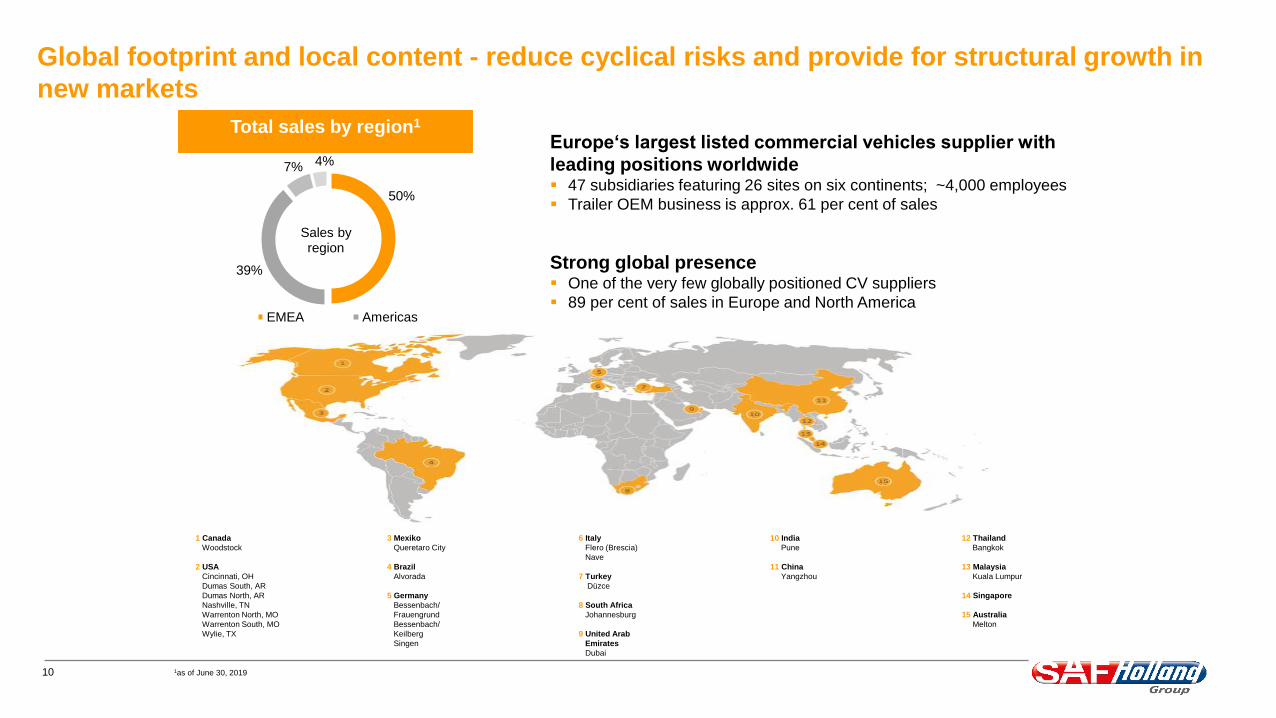
Global footprint and local content - reduce cyclical risks and provide for structural growth in
new markets
Strong global presence One of the very few globally positioned CV suppliers
89 per cent of sales in Europe and North America
50%
39%
7% 4%
Sales by region
EMEA Americas
APAC China
Total sales by region1
Europe‘s largest listed commercial vehicles supplier with
leading positions worldwide 47 subsidiaries featuring 26 sites on six continents; ~4,000 employees
Trailer OEM business is approx. 61 per cent of sales
1as of June 30, 2019
1 Canada 3 Mexiko 6 Italy 10 India 12 Thailand
Woodstock Queretaro City Flero (Brescia) Pune Bangkok
Nave
2 USA 4 Brazil 11 China 13 Malaysia
Cincinnati, OH Alvorada 7 Turkey Yangzhou Kuala Lumpur
Dumas South, AR Düzce
Dumas North, AR 5 Germany 14 Singapore
Nashville, TN Bessenbach/ 8 South Africa
Warrenton North, MO Frauengrund Johannesburg 15 Australia
Warrenton South, MO Bessenbach/ Melton
Wylie, TX Keilberg 9 United Arab
Singen Emirates
Dubai

11
Diversified customer base - Unique selling model based upon direct access to broad end
customer base that specifies products
Customer feedback as regards technical
and market requirements
End customer
High brand
recognition:
Superior product
performance
combined with
aftermarket
excellence
OEM
Pull
Sales Sales
Push
Sales focusing on fleet managers
> 80 per cent of purchasing decisions taken by the
fleets
Large footprint into fleets of different sizes and OEs
Top 10 customers represent only approx. 35% of sales1
1as of 2018 total sales
12
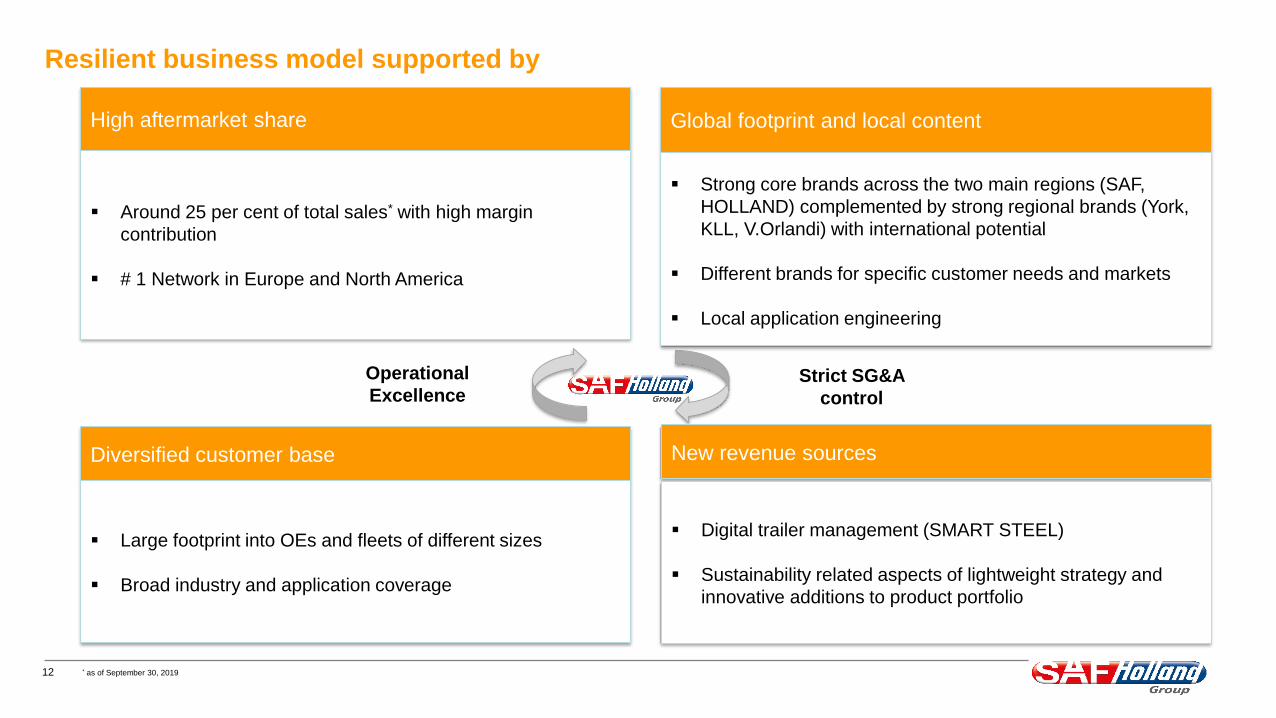
Resilient business model supported by
* as of September 30, 2019
High aftermarket share
Around 25 per cent of total sales* with high margin
contribution
# 1 Network in Europe and North America
Diversified customer base
Large footprint into OEs and fleets of different sizes
Broad industry and application coverage
New revenue sources
Digital trailer management (SMART STEEL)
Sustainability related aspects of lightweight strategy and
innovative additions to product portfolio
Global footprint and local content
Strong core brands across the two main regions (SAF,
HOLLAND) complemented by strong regional brands (York,
KLL, V.Orlandi) with international potential
Different brands for specific customer needs and markets
Local application engineering
Operational
ExcellenceStrict SG&A
control
13
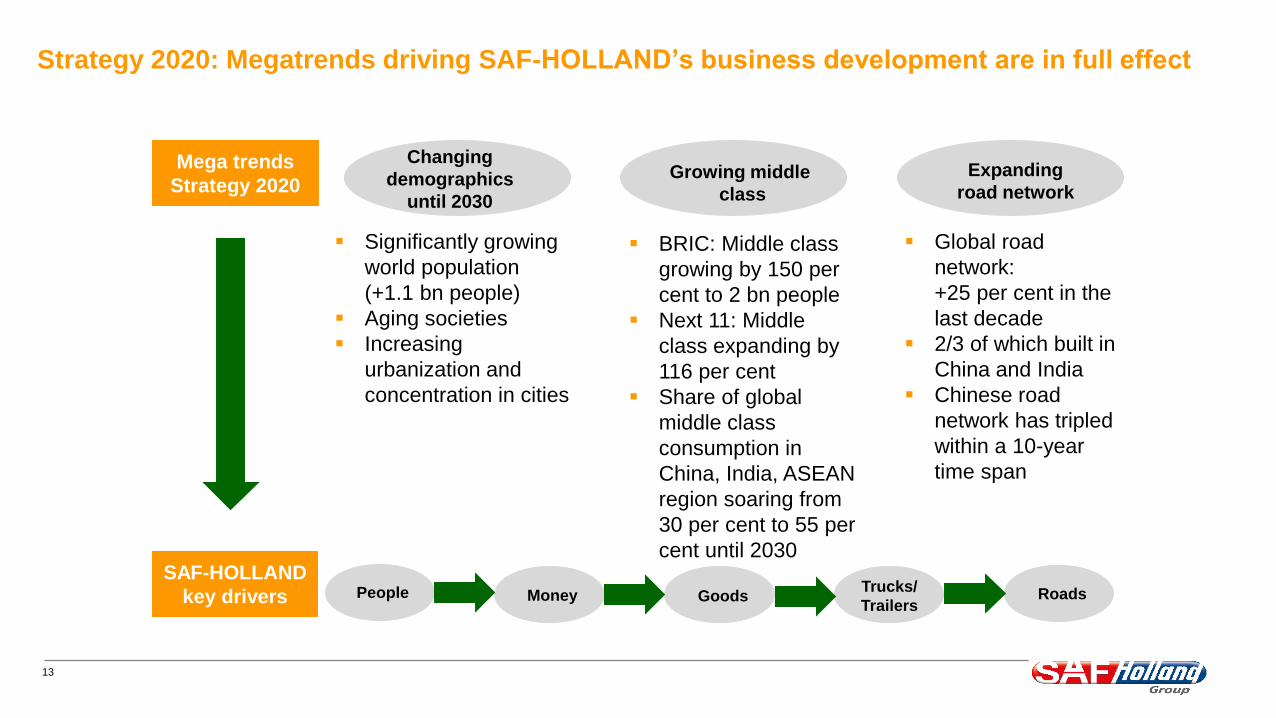
Strategy 2020: Megatrends driving SAF-HOLLAND’s business development are in full effect
Mega trends
Strategy 2020
Changing
demographics
until 2030
Significantly growing
world population
(+1.1 bn people)
Aging societies
Increasing
urbanization and
concentration in cities
SAF-HOLLAND
key drivers
Growing middle
class
Expanding
road network
BRIC: Middle class
growing by 150 per
cent to 2 bn people
Next 11: Middle
class expanding by
116 per cent
Share of global
middle class
consumption in
China, India, ASEAN
region soaring from
30 per cent to 55 per
cent until 2030
Global road
network:
+25 per cent in the
last decade
2/3 of which built in
China and India
Chinese road
network has tripled
within a 10-year
time span
People Money GoodsTrucks/
TrailersRoads
14
ESG at SAF-Holland
15
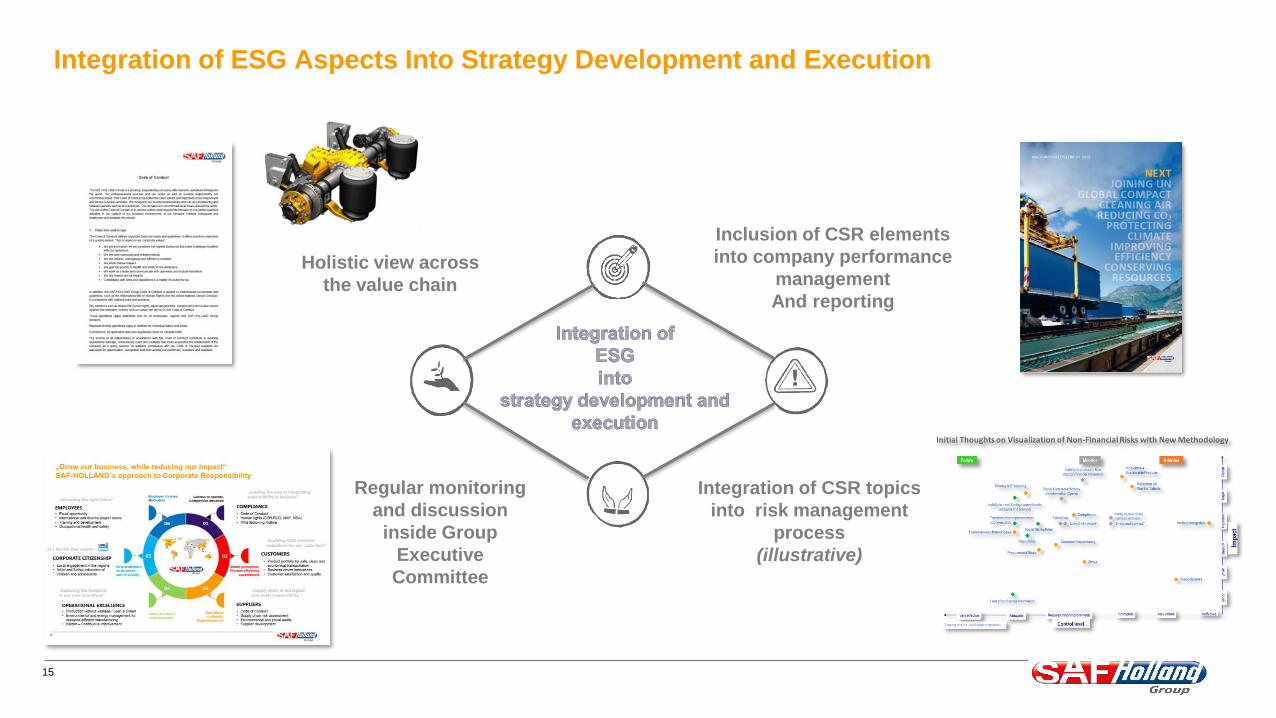
Integration of ESG Aspects Into Strategy Development and Execution
Regular monitoring
and discussion
inside Group
Executive
Committee
Inclusion of CSR elements
into company performance
management
And reporting
Integration of CSR topics
into risk management
process
(illustrative)
Holistic view across
the value chain
16
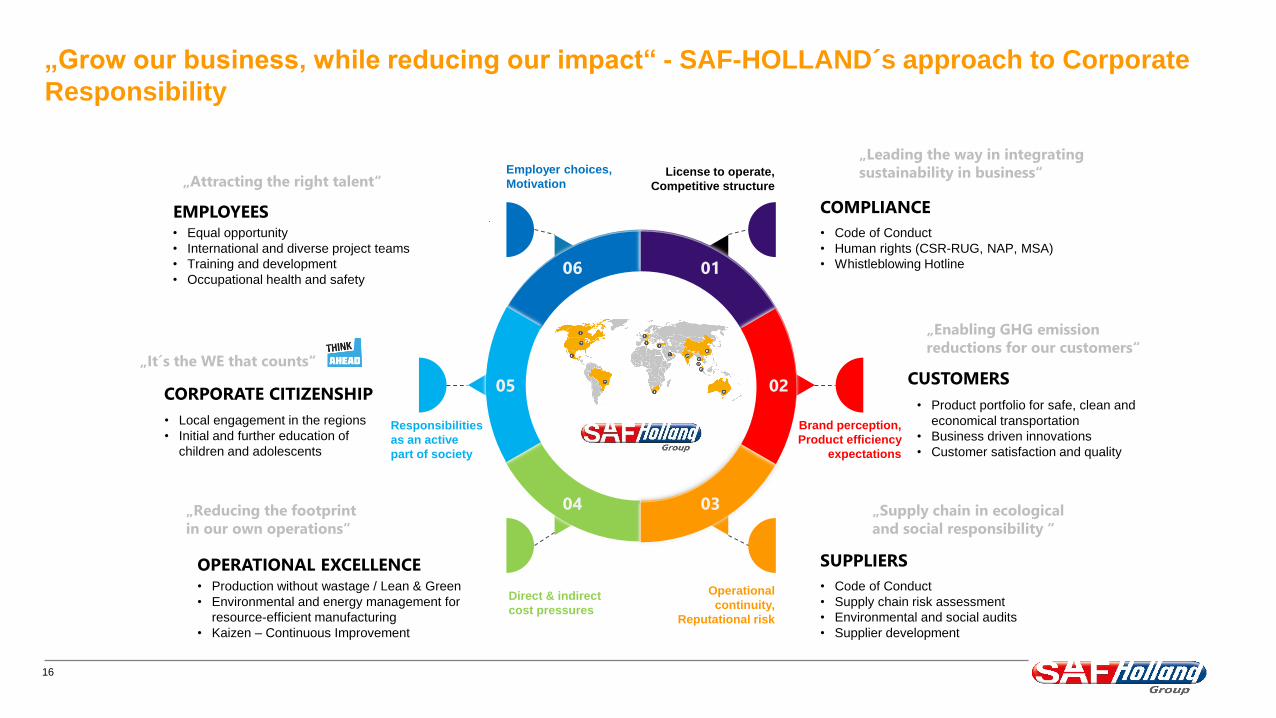
„Grow our business, while reducing our impact“ - SAF-HOLLAND´s approach to Corporate
Responsibility
01
03
06
04
0205
COMPLIANCE
• Code of Conduct
• Human rights (CSR-RUG, NAP, MSA)
• Whistleblowing Hotline
CUSTOMERS
• Product portfolio for safe, clean and
economical transportation
• Business driven innovations
• Customer satisfaction and quality
SUPPLIERS
• Code of Conduct
• Supply chain risk assessment
• Environmental and social audits
• Supplier development
EMPLOYEES• Equal opportunity
• International and diverse project teams
• Training and development
• Occupational health and safety
CORPORATE CITIZENSHIP
• Local engagement in the regions
• Initial and further education of
children and adolescents
OPERATIONAL EXCELLENCE• Production without wastage / Lean & Green
• Environmental and energy management for
resource-efficient manufacturing
• Kaizen – Continuous Improvement
„It´s the WE that counts“
„Attracting the right talent“
„Reducing the footprint
in our own operations“
„Enabling GHG emission
reductions for our customers“
„Supply chain in ecological
and social responsibility “
„Leading the way in integrating
sustainability in business“
Brand perception,
Product efficiency
expectations
Operational
continuity,
Reputational risk
Responsibilities
as an active
part of society
Direct & indirect
cost pressures
Employer choices,
MotivationLicense to operate,
Competitive structure
17
Our Acquisitions
18
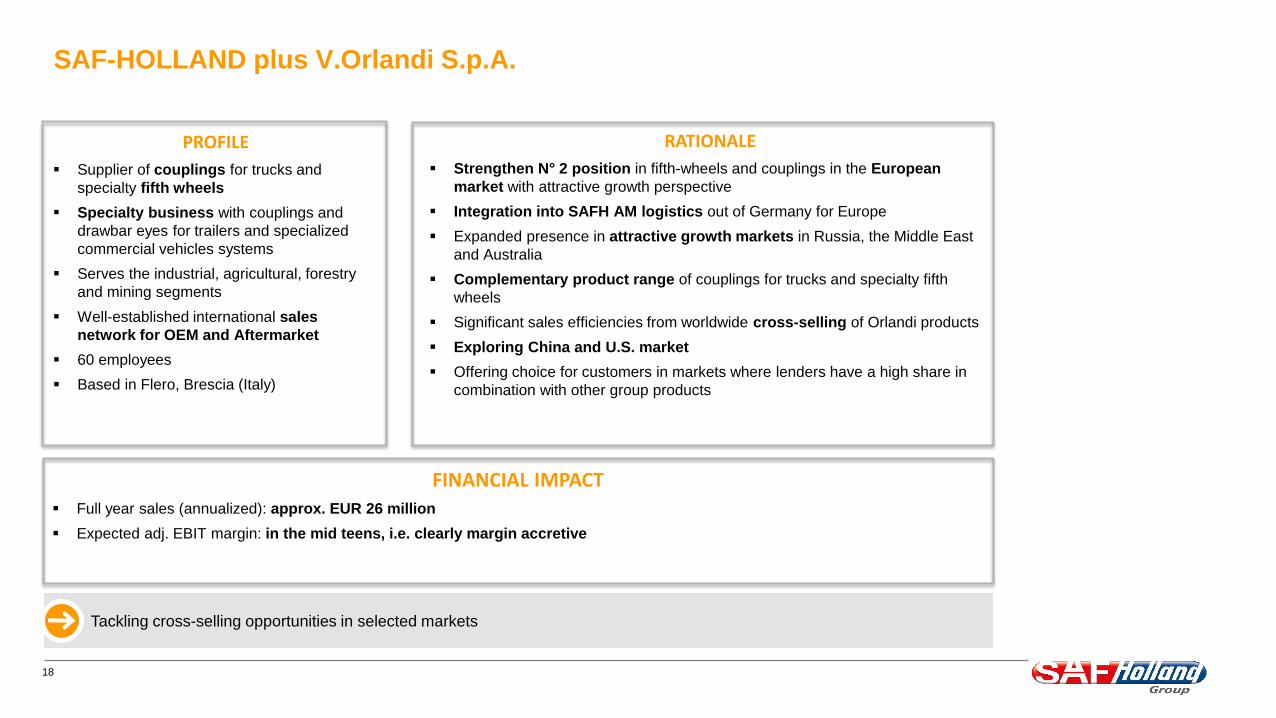
SAF-HOLLAND plus V.Orlandi S.p.A.
RATIONALE
Strengthen N° 2 position in fifth-wheels and couplings in the European
market with attractive growth perspective
Integration into SAFH AM logistics out of Germany for Europe
Expanded presence in attractive growth markets in Russia, the Middle East
and Australia
Complementary product range of couplings for trucks and specialty fifth
wheels
Significant sales efficiencies from worldwide cross-selling of Orlandi products
Exploring China and U.S. market
Offering choice for customers in markets where lenders have a high share in
combination with other group products
FINANCIAL IMPACT
Full year sales (annualized): approx. EUR 26 million
Expected adj. EBIT margin: in the mid teens, i.e. clearly margin accretive
PROFILE
Supplier of couplings for trucks and
specialty fifth wheels
Specialty business with couplings and
drawbar eyes for trailers and specialized
commercial vehicles systems
Serves the industrial, agricultural, forestry
and mining segments
Well-established international sales
network for OEM and Aftermarket
60 employees
Based in Flero, Brescia (Italy)
Tackling cross-selling opportunities in selected markets
19
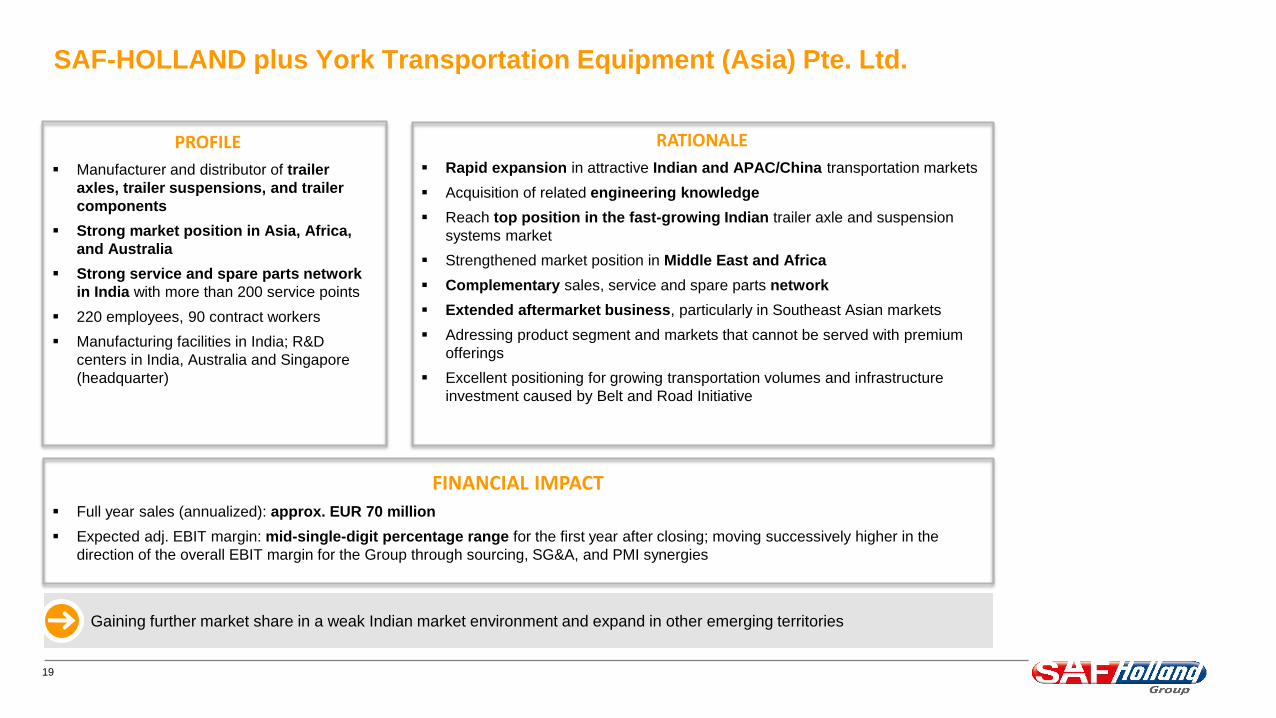
SAF-HOLLAND plus York Transportation Equipment (Asia) Pte. Ltd.
Gaining further market share in a weak Indian market environment and expand in other emerging territories
PROFILE
Manufacturer and distributor of trailer
axles, trailer suspensions, and trailer
components
Strong market position in Asia, Africa,
and Australia
Strong service and spare parts network
in India with more than 200 service points
220 employees, 90 contract workers
Manufacturing facilities in India; R&D
centers in India, Australia and Singapore
(headquarter)
RATIONALE
Rapid expansion in attractive Indian and APAC/China transportation markets
Acquisition of related engineering knowledge
Reach top position in the fast-growing Indian trailer axle and suspension
systems market
Strengthened market position in Middle East and Africa
Complementary sales, service and spare parts network
Extended aftermarket business, particularly in Southeast Asian markets
Adressing product segment and markets that cannot be served with premium
offerings
Excellent positioning for growing transportation volumes and infrastructure
investment caused by Belt and Road Initiative
FINANCIAL IMPACT
Full year sales (annualized): approx. EUR 70 million
Expected adj. EBIT margin: mid-single-digit percentage range for the first year after closing; moving successively higher in the
direction of the overall EBIT margin for the Group through sourcing, SG&A, and PMI synergies
20
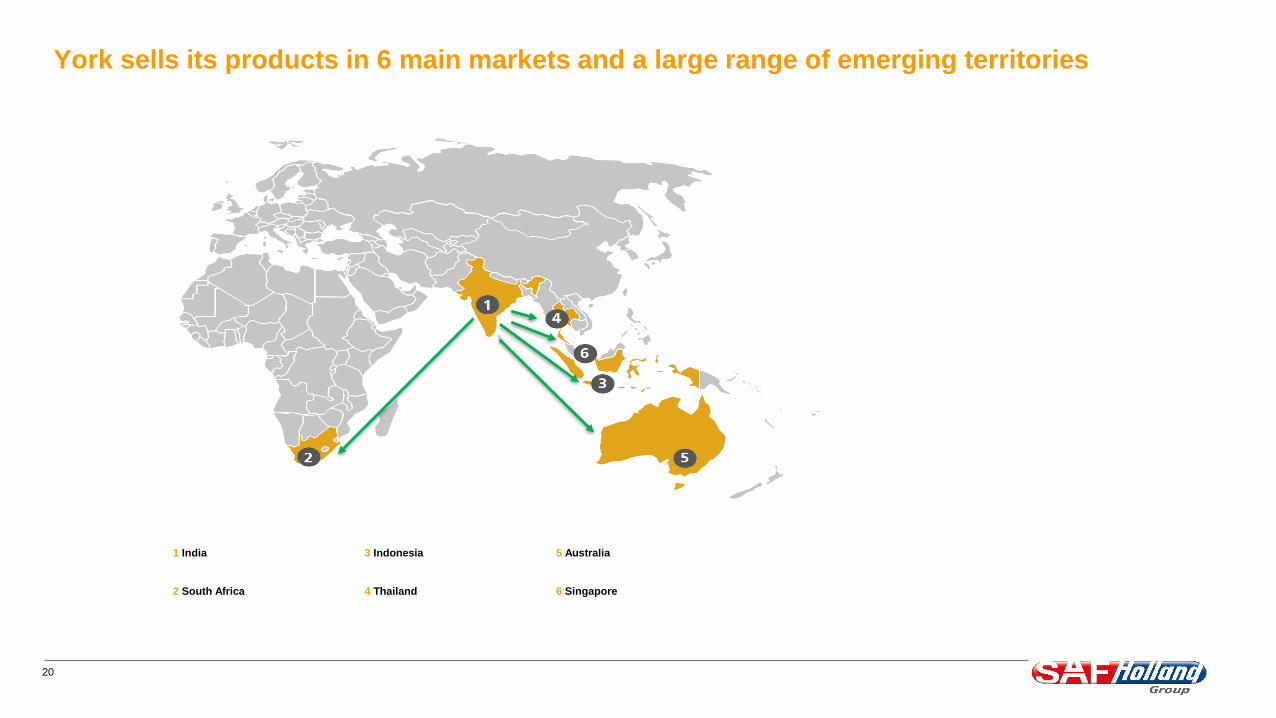
York sells its products in 6 main markets and a large range of emerging territories
1 India 3 Indonesia 5 Australia
2 South Africa 4 Thailand 6 Singapore
21
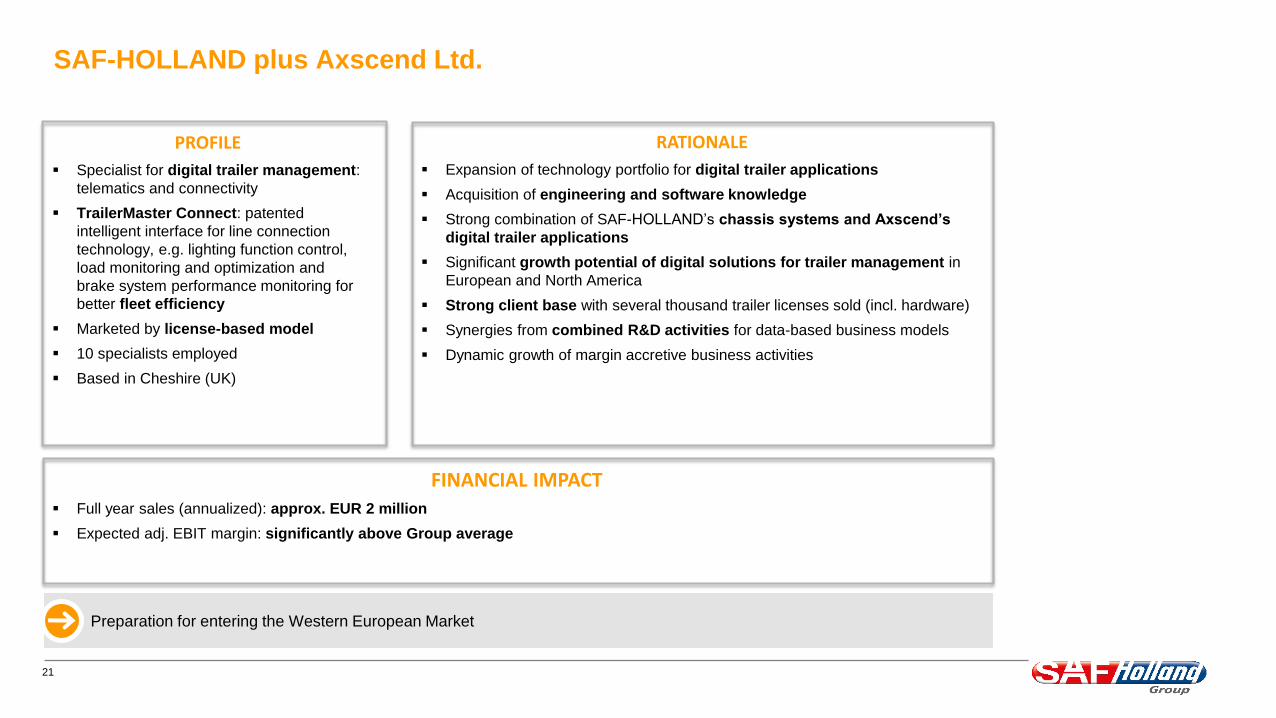
SAF-HOLLAND plus Axscend Ltd.
Preparation for entering the Western European Market
PROFILE
Specialist for digital trailer management:
telematics and connectivity
TrailerMaster Connect: patented
intelligent interface for line connection
technology, e.g. lighting function control,
load monitoring and optimization and
brake system performance monitoring for
better fleet efficiency
Marketed by license-based model
10 specialists employed
Based in Cheshire (UK)
RATIONALE
Expansion of technology portfolio for digital trailer applications
Acquisition of engineering and software knowledge
Strong combination of SAF-HOLLAND’s chassis systems and Axscend’s
digital trailer applications
Significant growth potential of digital solutions for trailer management in
European and North America
Strong client base with several thousand trailer licenses sold (incl. hardware)
Synergies from combined R&D activities for data-based business models
Dynamic growth of margin accretive business activities
FINANCIAL IMPACT
Full year sales (annualized): approx. EUR 2 million
Expected adj. EBIT margin: significantly above Group average
22
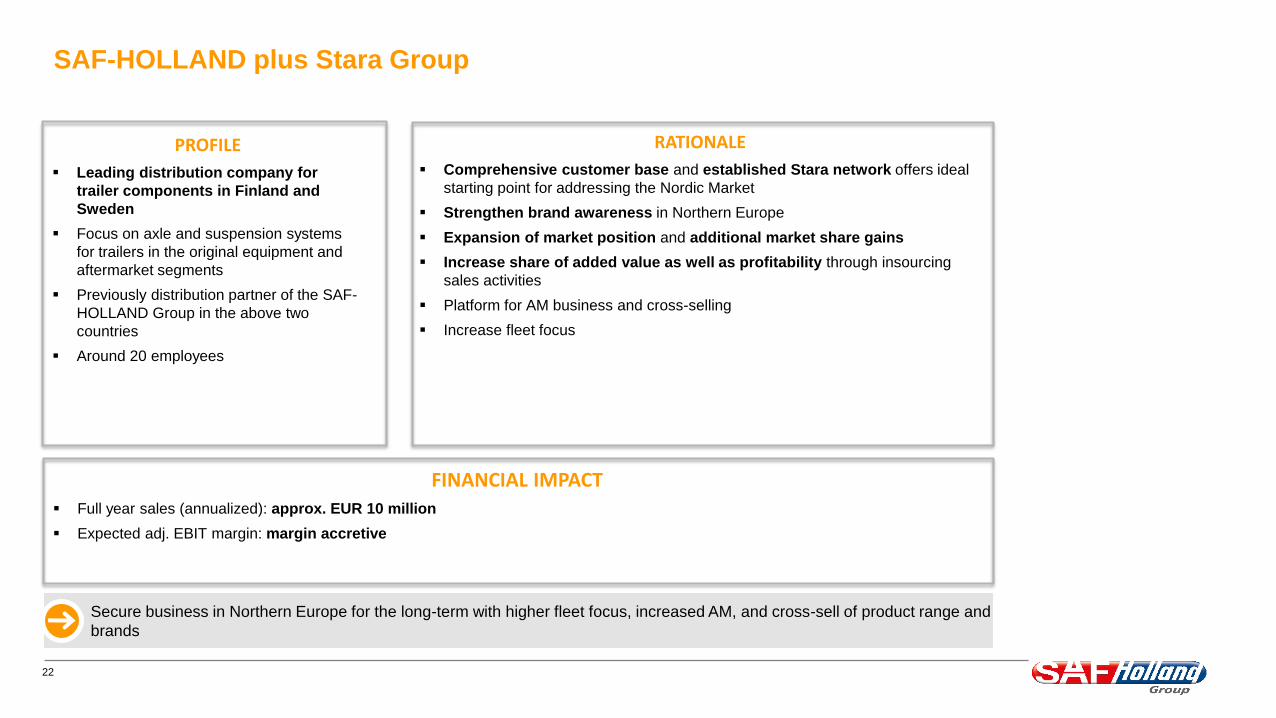
SAF-HOLLAND plus Stara Group
Secure business in Northern Europe for the long-term with higher fleet focus, increased AM, and cross-sell of product range and
brands
PROFILE
Leading distribution company for
trailer components in Finland and
Sweden
Focus on axle and suspension systems
for trailers in the original equipment and
aftermarket segments
Previously distribution partner of the SAF-
HOLLAND Group in the above two
countries
Around 20 employees
RATIONALE
Comprehensive customer base and established Stara network offers ideal
starting point for addressing the Nordic Market
Strengthen brand awareness in Northern Europe
Expansion of market position and additional market share gains
Increase share of added value as well as profitability through insourcing
sales activities
Platform for AM business and cross-selling
Increase fleet focus
FINANCIAL IMPACT
Full year sales (annualized): approx. EUR 10 million
Expected adj. EBIT margin: margin accretive
23
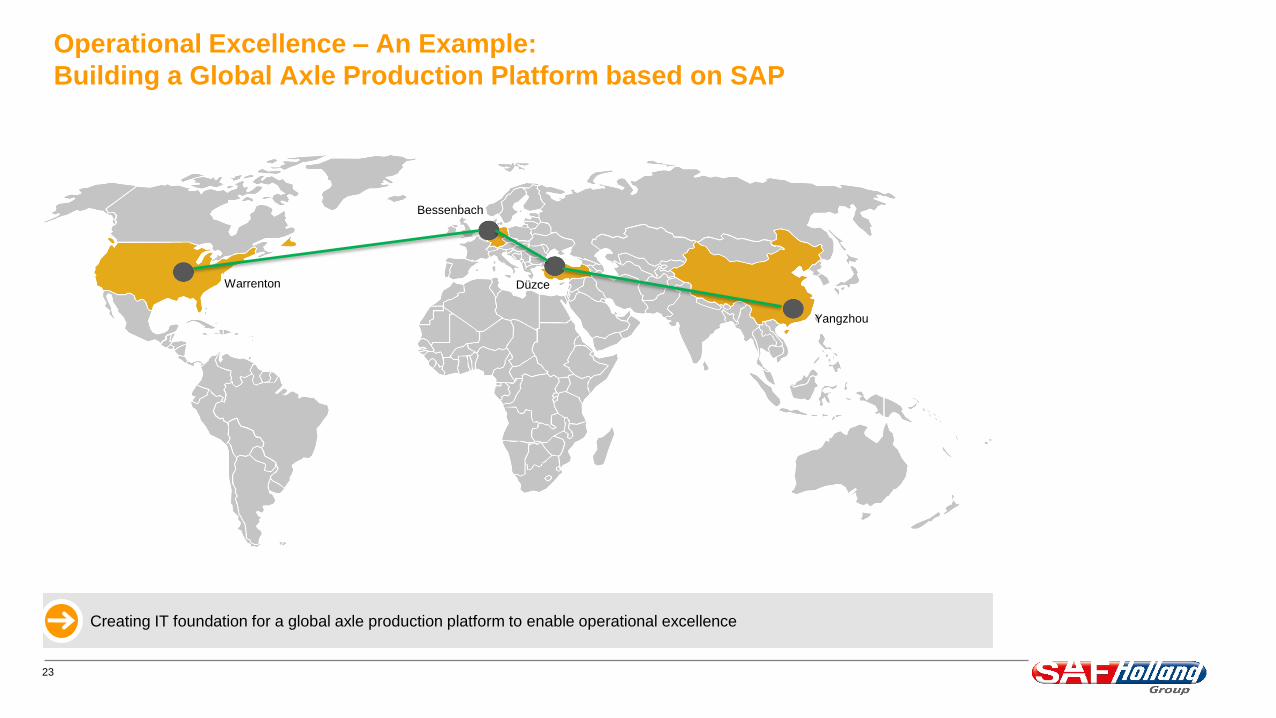
Operational Excellence – An Example:
Building a Global Axle Production Platform based on SAP
Creating IT foundation for a global axle production platform to enable operational excellence
Bessenbach
Warrenton Düzce
Yangzhou
24
Financial performance 9M 2019
25
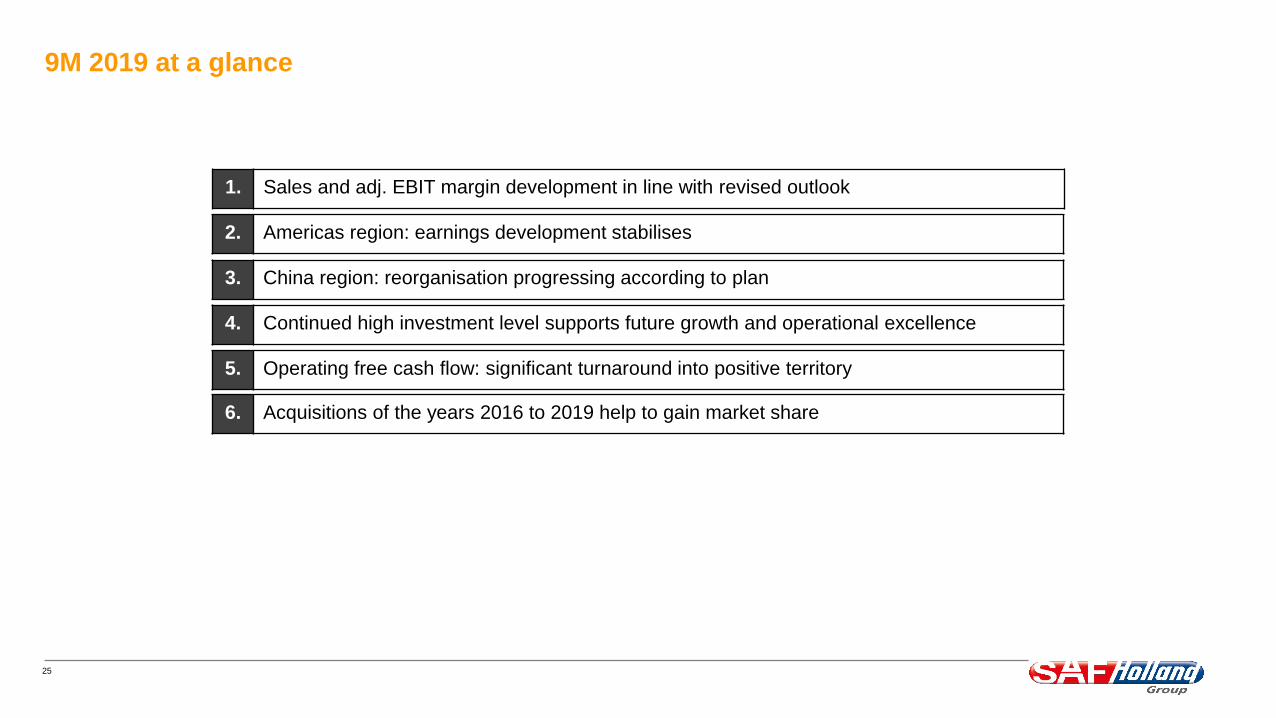
9M 2019 at a glance
1. Sales and adj. EBIT margin development in line with revised outlook
2. Americas region: earnings development stabilises
3. China region: reorganisation progressing according to plan
4. Continued high investment level supports future growth and operational excellence
5. Operating free cash flow: significant turnaround into positive territory
6. Acquisitions of the years 2016 to 2019 help to gain market share

26
Group
Adj. EBIT (€ mn)* Adj. EBIT by quarter (€ mn)*
Sales (€ mn)* Sales by quarter (€ mn)*
YTD
313.2294.9
Q1 Q2 Q3
340.5
Q4
346.0
1,008.6980.9
345.4 349.5 319.7
+2.8%
+17.3% +1.2%-8.0%
• 9M/2019 sales influenced by
Acquisition effects (+3.9 per cent
respectively € +38.1 mn)
FX effects (+2.2 per cent
respectively € +22.0 mn)
Organic effects (-3.3 per cent
respectively € -32.3 mn net; strong
organic growth in the Americas
region could not compensate for the
other regions)
• Adj. EBIT margin in 9M/2019 influenced
by
Stabilizing earnings situation in the
Americas region (+)
Weakening margin development in
the EMEA and APAC region (-)
Heavy losses in the China region (-)
• Adj. EBIT margin in 9M/2018 positively
affected by the partial settlement of a
medical plan in the US6.9%6.6%7.2%
YTD
25.2
6.9% 7.2%
Q1
7.2%
Q2
8.0%
71.1
5.4%
Q3
5.8%
Q4
66.9
20.324.8
27.023.9
17.0 18.4
-5.9%
2018
2019
* All figures shown are rounded, minor discrepancies may arise from additions of these amounts.
27
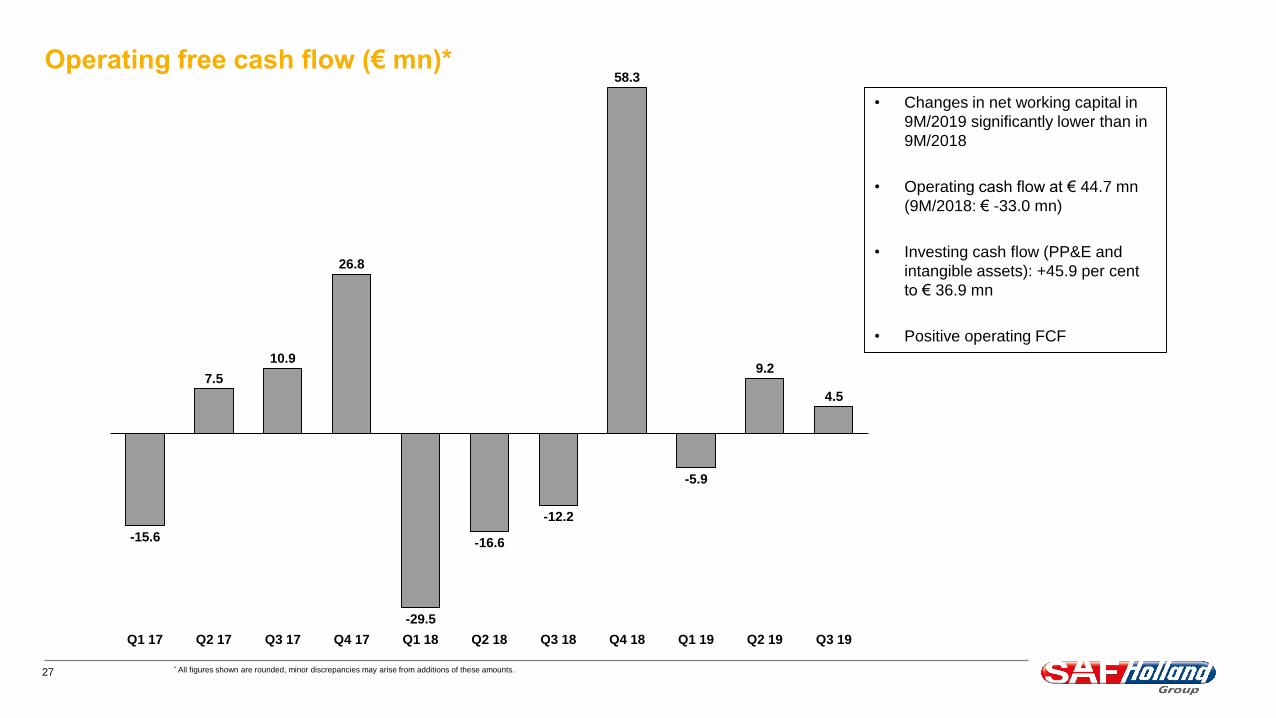
Operating free cash flow (€ mn)*
Q2 18 Q3 19Q1 17 Q2 17 Q3 18 Q4 18Q3 17 Q1 18Q4 17 Q1 19 Q2 19
-15.6
7.5
10.9
26.8
-29.5
-16.6
-12.2
58.3
-5.9
9.2
4.5
• Changes in net working capital in
9M/2019 significantly lower than in
9M/2018
• Operating cash flow at € 44.7 mn
(9M/2018: € -33.0 mn)
• Investing cash flow (PP&E and
intangible assets): +45.9 per cent
to € 36.9 mn
• Positive operating FCF
* All figures shown are rounded, minor discrepancies may arise from additions of these amounts.
28
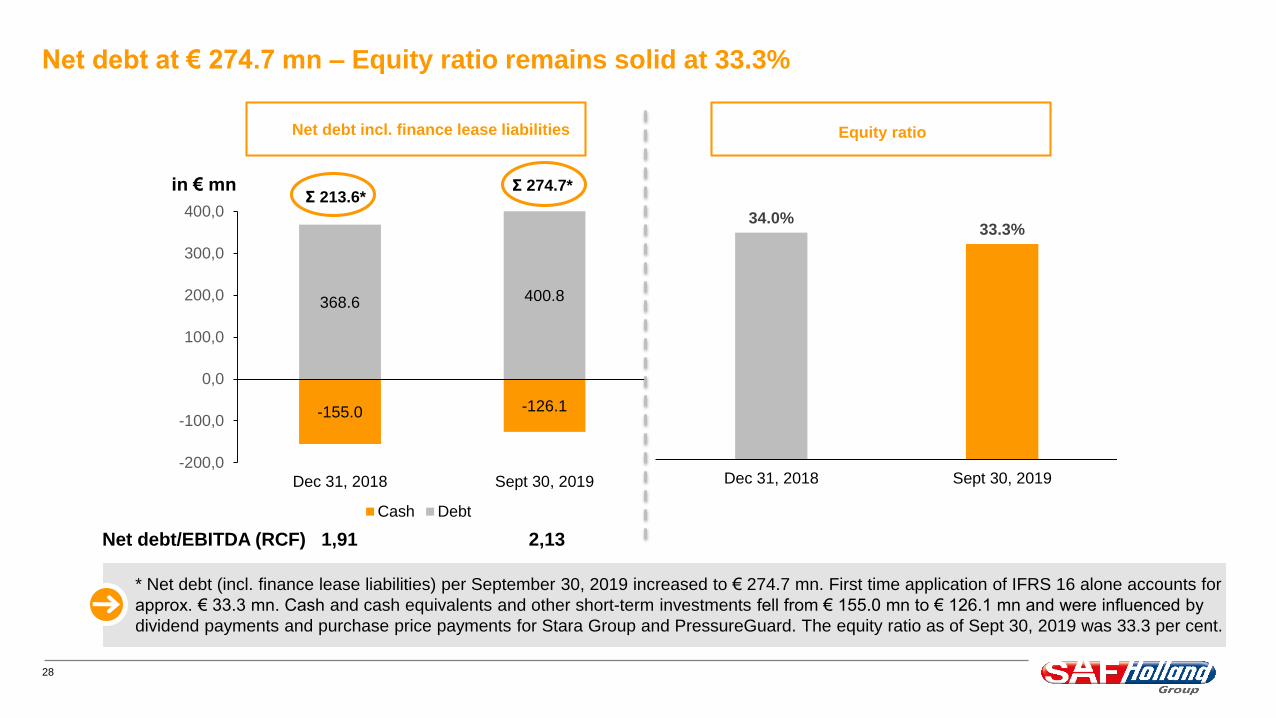
Net debt at € 274.7 mn – Equity ratio remains solid at 33.3%
in € mn
* Net debt (incl. finance lease liabilities) per September 30, 2019 increased to € 274.7 mn. First time application of IFRS 16 alone accounts for
approx. € 33.3 mn. Cash and cash equivalents and other short-term investments fell from € 155.0 mn to € 126.1 mn and were influenced by
dividend payments and purchase price payments for Stara Group and PressureGuard. The equity ratio as of Sept 30, 2019 was 33.3 per cent.
-155.0 -126.1
368.6 400.8
-200,0
-100,0
0,0
100,0
200,0
300,0
400,0
Dec 31, 2018 Sept 30, 2019
Cash Debt
Σ 213.6*Σ 274.7*
34.0%33.3%
Dec 31, 2018 Sept 30, 2019
Equity ratioNet debt incl. finance lease liabilities
Net debt/EBITDA (RCF) 1,91 2,13
29
2019/2020: Setting solid foundations for the next phase
• Re-start China in Yangzhou
Provide competitive products for the domestic Chinese market
Win new orders in the domestic Chinese market
Expand strategic customer relationships
Reduce operating losses in China substantially
• Accelerate efforts regarding Program FORWARD with focus on operational excellence
• Improve SG&A ratio worldwide
• Drive aftermarket expansion in core markets
• Enhance free cash flow generation – Focus on sound capital allocation and working capital optimisation
• Secure solid financial profile
Even out debt profile
Financial covenants under control
30
Outlook
31
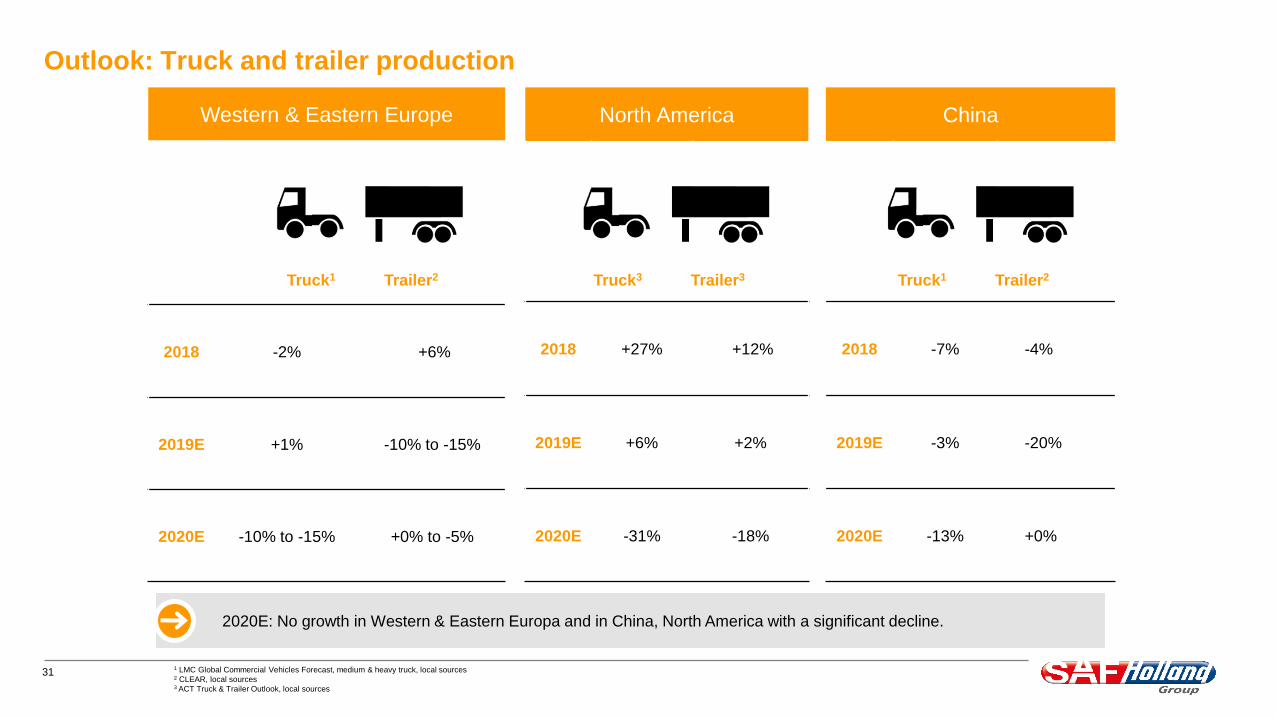
Western & Eastern Europe
2018 -2% +6%
2019E +1% -10% to -15%
2020E -10% to -15% +0% to -5%
Outlook: Truck and trailer production
1 LMC Global Commercial Vehicles Forecast, medium & heavy truck, local sources2 CLEAR, local sources3 ACT Truck & Trailer Outlook, local sources
North America
2018 +27% +12%
2019E +6% +2%
2020E -31% -18%
China
2018 -7% -4%
2019E -3% -20%
2020E -13% +0%
Trailer2Truck1 Trailer3Truck3 Trailer2Truck1
2020E: No growth in Western & Eastern Europa and in China, North America with a significant decline.
32
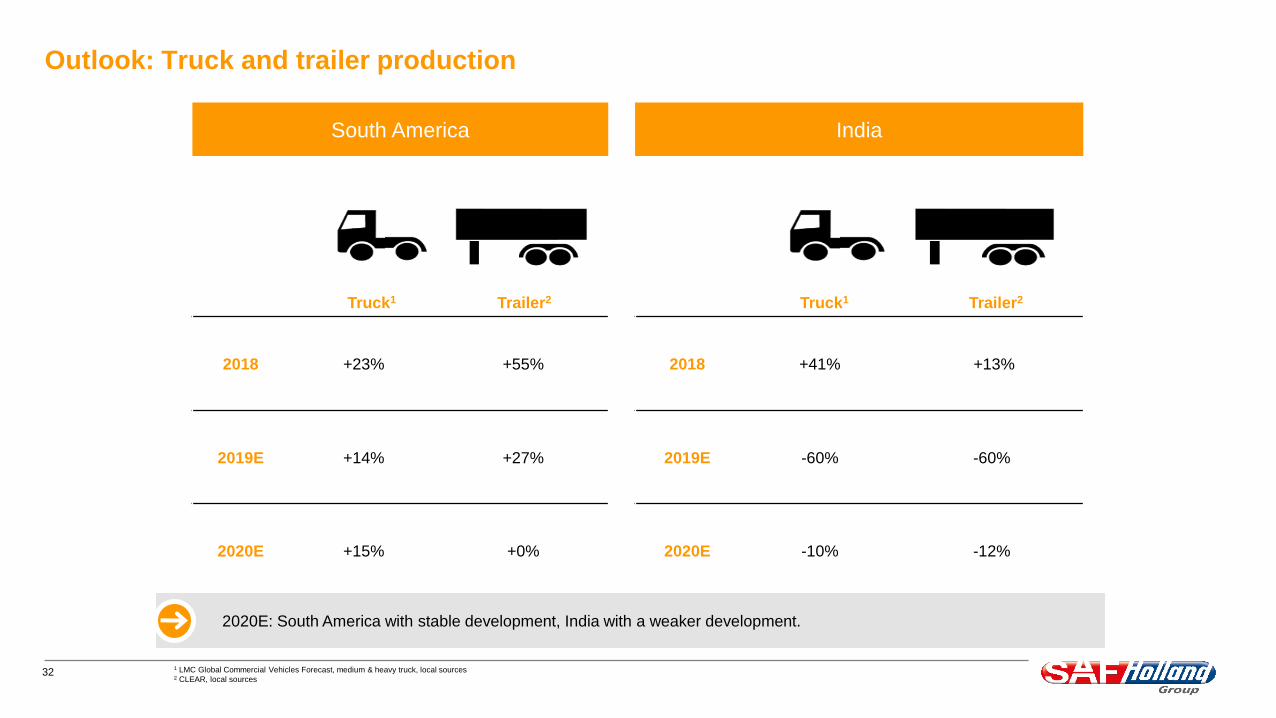
Outlook: Truck and trailer production
1 LMC Global Commercial Vehicles Forecast, medium & heavy truck, local sources2 CLEAR, local sources
India
2018 +41% +13%
2019E -60% -60%
2020E -10% -12%
South America
2018 +23% +55%
2019E +14% +27%
2020E +15% +0%
Trailer2Truck1 Trailer2Truck1
2020E: South America with stable development, India with a weaker development.
33
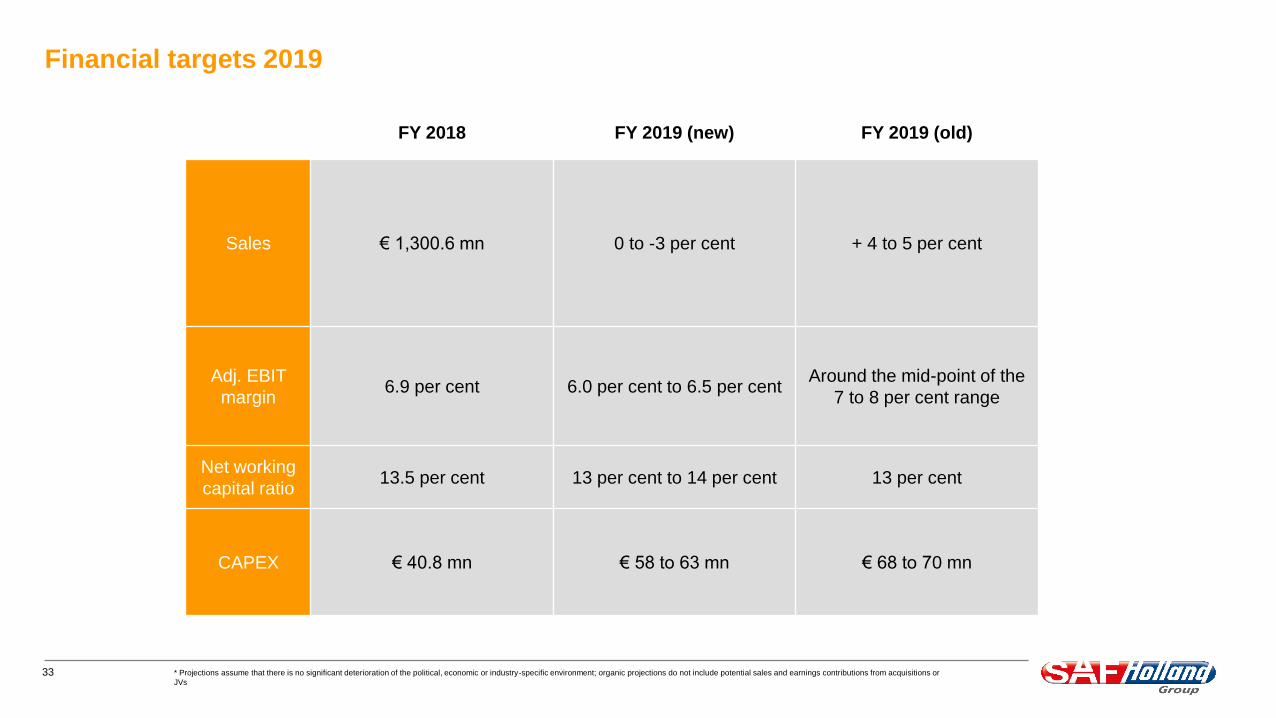
Financial targets 2019
FY 2018 FY 2019 (new) FY 2019 (old)
Sales € 1,300.6 mn 0 to -3 per cent + 4 to 5 per cent
Adj. EBIT
margin6.9 per cent 6.0 per cent to 6.5 per cent
Around the mid-point of the
7 to 8 per cent range
Net working
capital ratio13.5 per cent 13 per cent to 14 per cent 13 per cent
CAPEX € 40.8 mn € 58 to 63 mn € 68 to 70 mn
* Projections assume that there is no significant deterioration of the political, economic or industry-specific environment; organic projections do not include potential sales and earnings contributions from acquisitions or
JVs
34
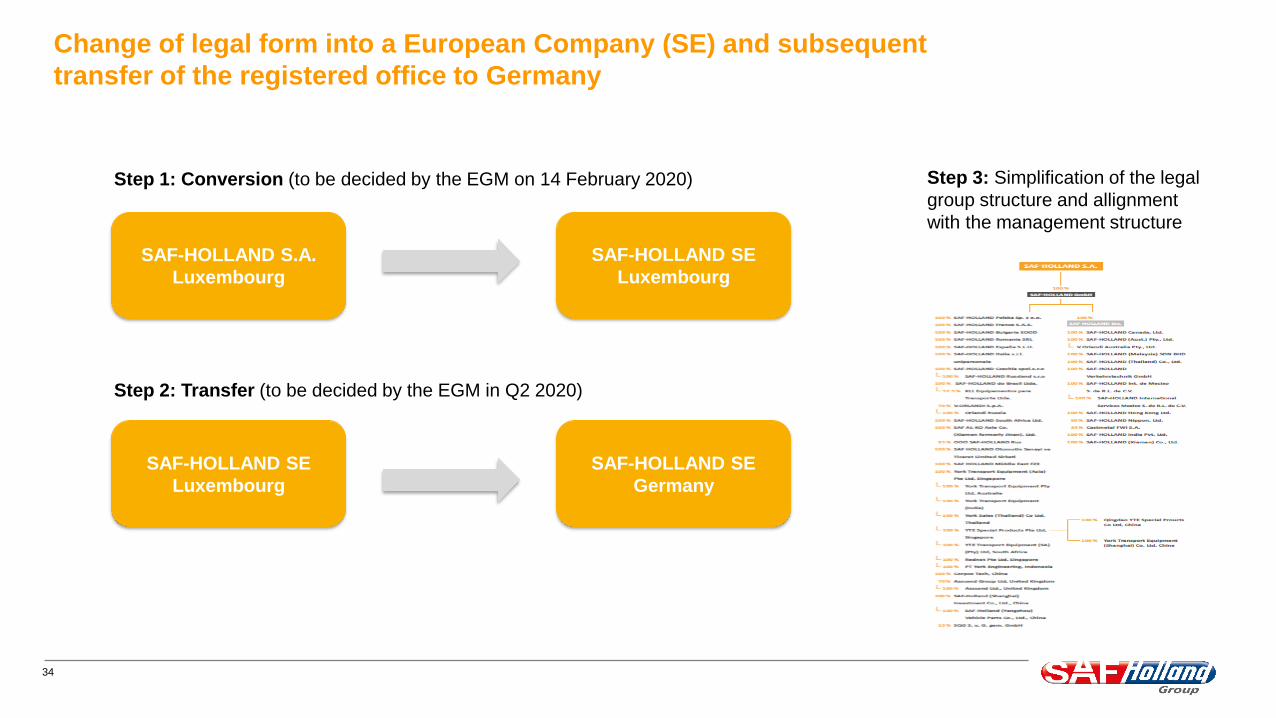
Change of legal form into a European Company (SE) and subsequent
transfer of the registered office to Germany
SAF-HOLLAND S.A.
Luxembourg
SAF-HOLLAND SE
Germany
SAF-HOLLAND SE
Luxembourg
SAF-HOLLAND SE
Luxembourg
Step 1: Conversion (to be decided by the EGM on 14 February 2020)
Step 2: Transfer (to be decided by the EGM in Q2 2020)
Step 3: Simplification of the legal
group structure and allignment
with the management structure
35
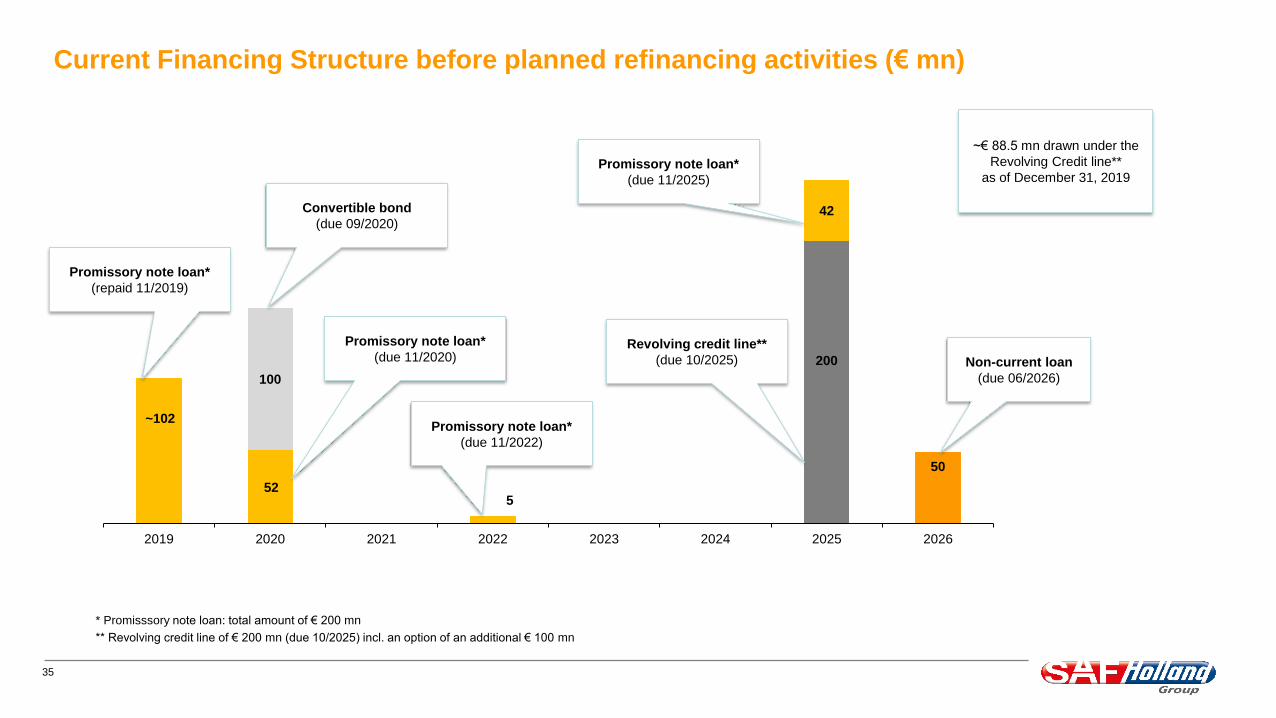
Current Financing Structure before planned refinancing activities (€ mn)
~102
200
50
100
42
2019 2020 2021 2022 2023 2024 2025 2026
* Promisssory note loan: total amount of € 200 mn
** Revolving credit line of € 200 mn (due 10/2025) incl. an option of an additional € 100 mn
52
Convertible bond
(due 09/2020)
Non-current loan
(due 06/2026)
Promissory note loan*
(due 11/2020)
Promissory note loan*
(due 11/2022)
Promissory note loan*
(due 11/2025)
~€ 88.5 mn drawn under the
Revolving Credit line**
as of December 31, 2019
5
Revolving credit line**
(due 10/2025)
Promissory note loan*
(repaid 11/2019)
36
Appendix
37
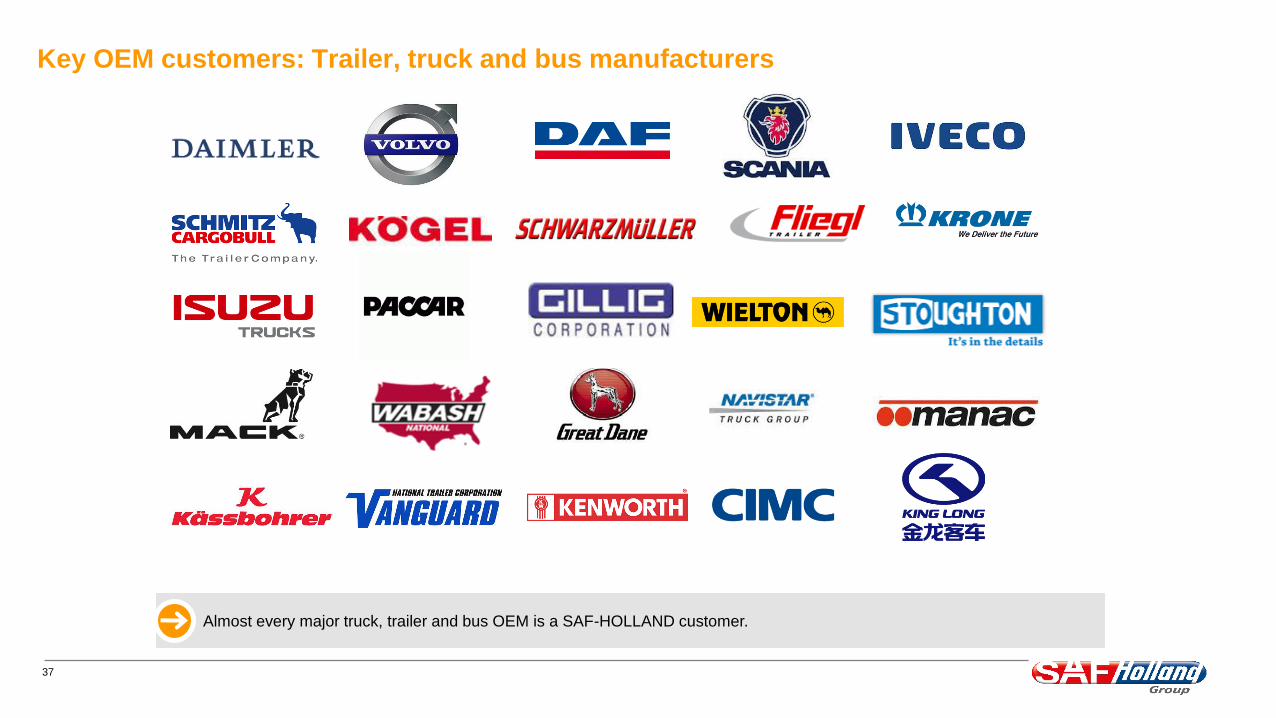
Key OEM customers: Trailer, truck and bus manufacturers
Almost every major truck, trailer and bus OEM is a SAF-HOLLAND customer.
38
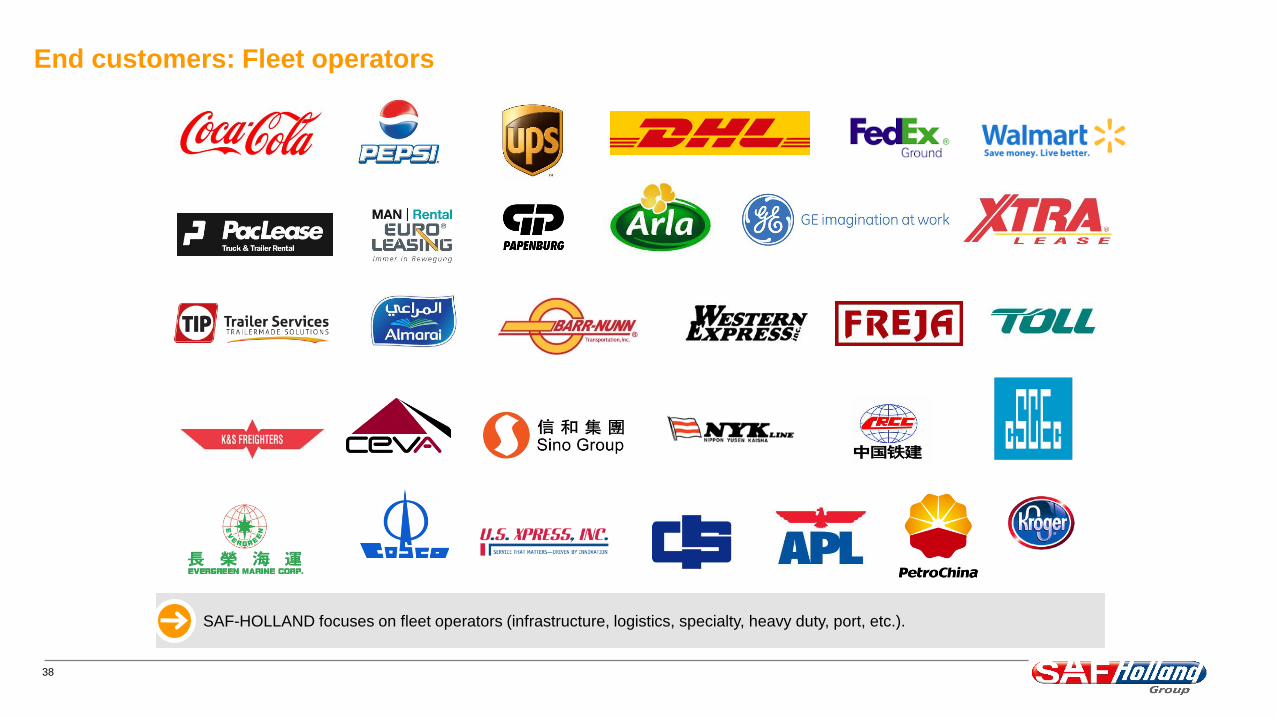
End customers: Fleet operators
SAF-HOLLAND focuses on fleet operators (infrastructure, logistics, specialty, heavy duty, port, etc.).
39
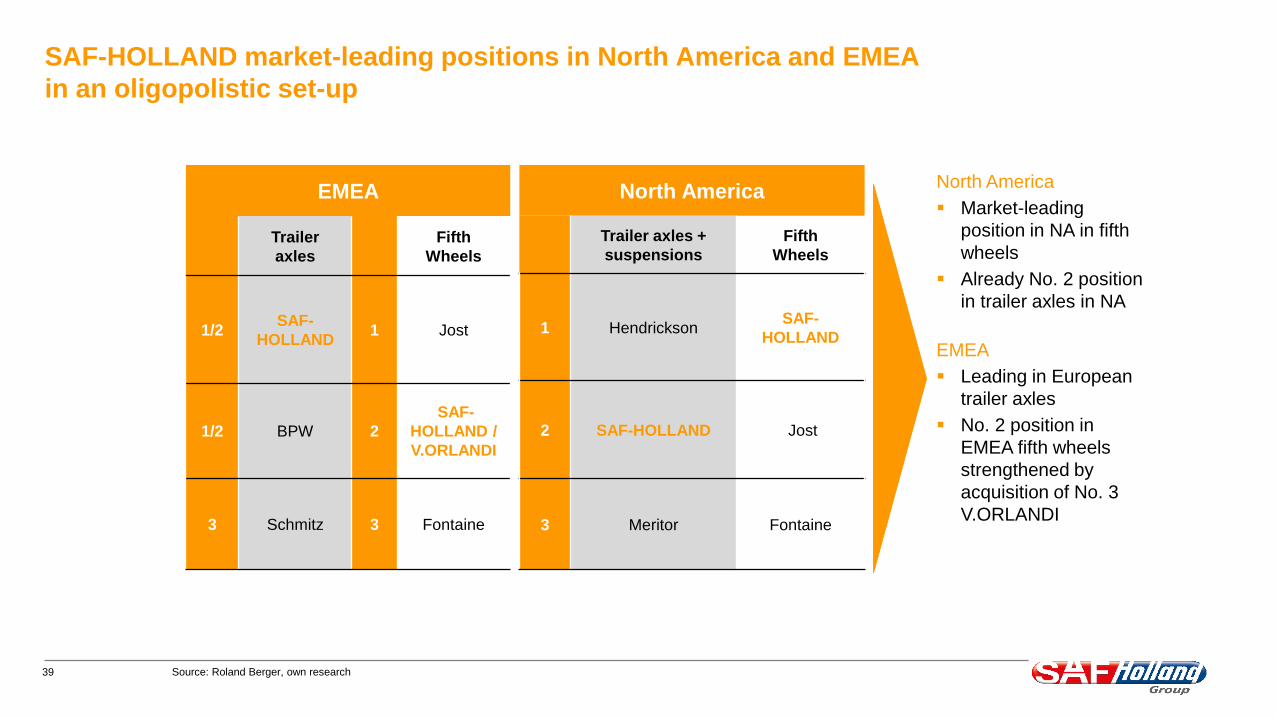
SAF-HOLLAND market-leading positions in North America and EMEA
in an oligopolistic set-up
EMEA
Trailer
axles
Fifth
Wheels
1/2SAF-
HOLLAND1 Jost
1/2 BPW 2
SAF-
HOLLAND /
V.ORLANDI
3 Schmitz 3 Fontaine
North America
Trailer axles +
suspensions
Fifth
Wheels
1 HendricksonSAF-
HOLLAND
2 SAF-HOLLAND Jost
3 Meritor Fontaine
North America
Market-leading
position in NA in fifth
wheels
Already No. 2 position
in trailer axles in NA
EMEA
Leading in European
trailer axles
No. 2 position in
EMEA fifth wheels
strengthened by
acquisition of No. 3
V.ORLANDI
Source: Roland Berger, own research
40
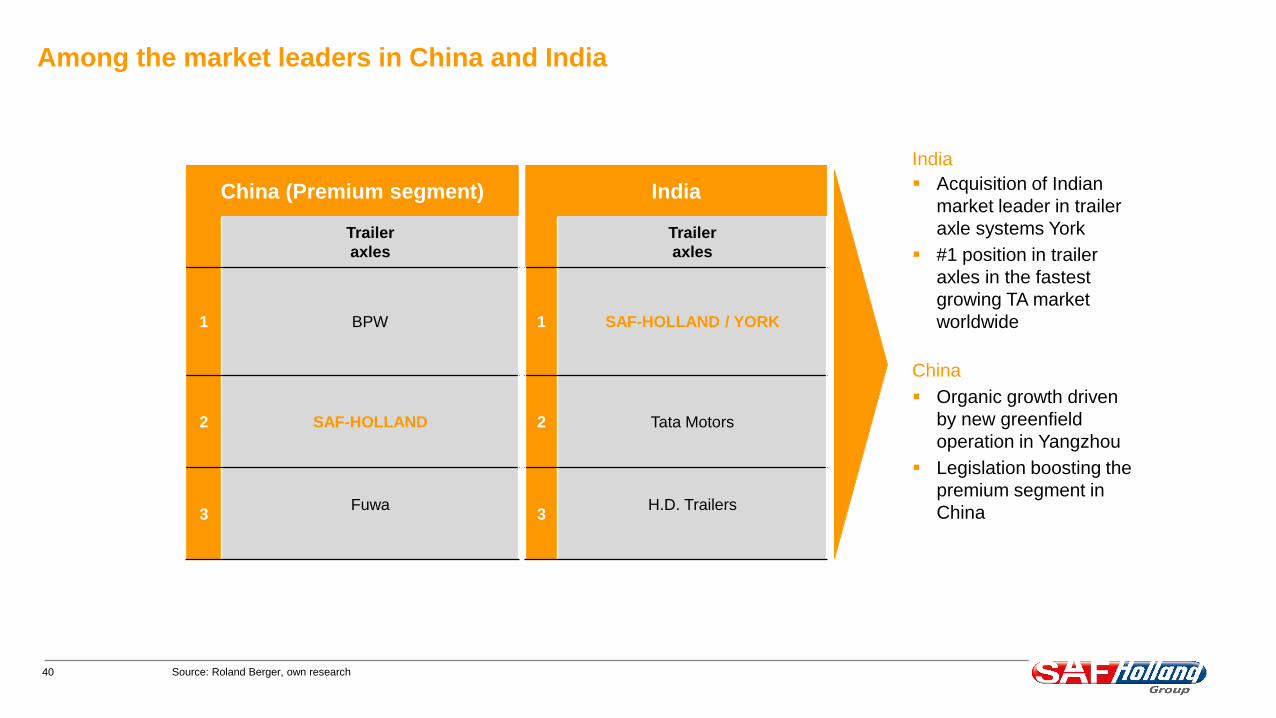
Among the market leaders in China and India
China (Premium segment)
Trailer
axles
1 BPW
2 SAF-HOLLAND
3Fuwa
India
Acquisition of Indian
market leader in trailer
axle systems York
#1 position in trailer
axles in the fastest
growing TA market
worldwide
China
Organic growth driven
by new greenfield
operation in Yangzhou
Legislation boosting the
premium segment in
China
Source: Roland Berger, own research
India
Trailer
axles
1 SAF-HOLLAND / YORK
2 Tata Motors
3H.D. Trailers
41
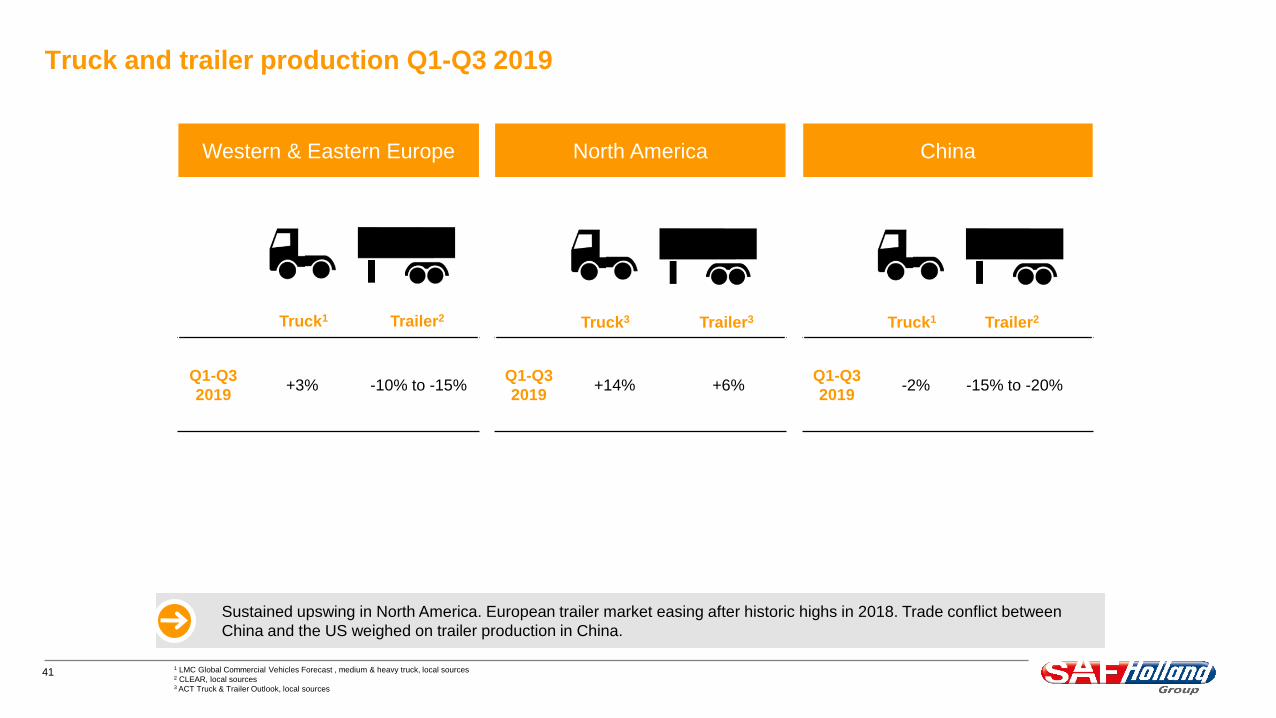
Truck and trailer production Q1-Q3 2019
1 LMC Global Commercial Vehicles Forecast , medium & heavy truck, local sources2 CLEAR, local sources3 ACT Truck & Trailer Outlook, local sources
North America
Q1-Q3
2019 +14% +6%
China
Q1-Q3
2019-2% -15% to -20%
Western & Eastern Europe
Q1-Q3
2019+3% -10% to -15%
Trailer2Truck1 Trailer3Truck3 Trailer2Truck1
Sustained upswing in North America. European trailer market easing after historic highs in 2018. Trade conflict between
China and the US weighed on trailer production in China.
42
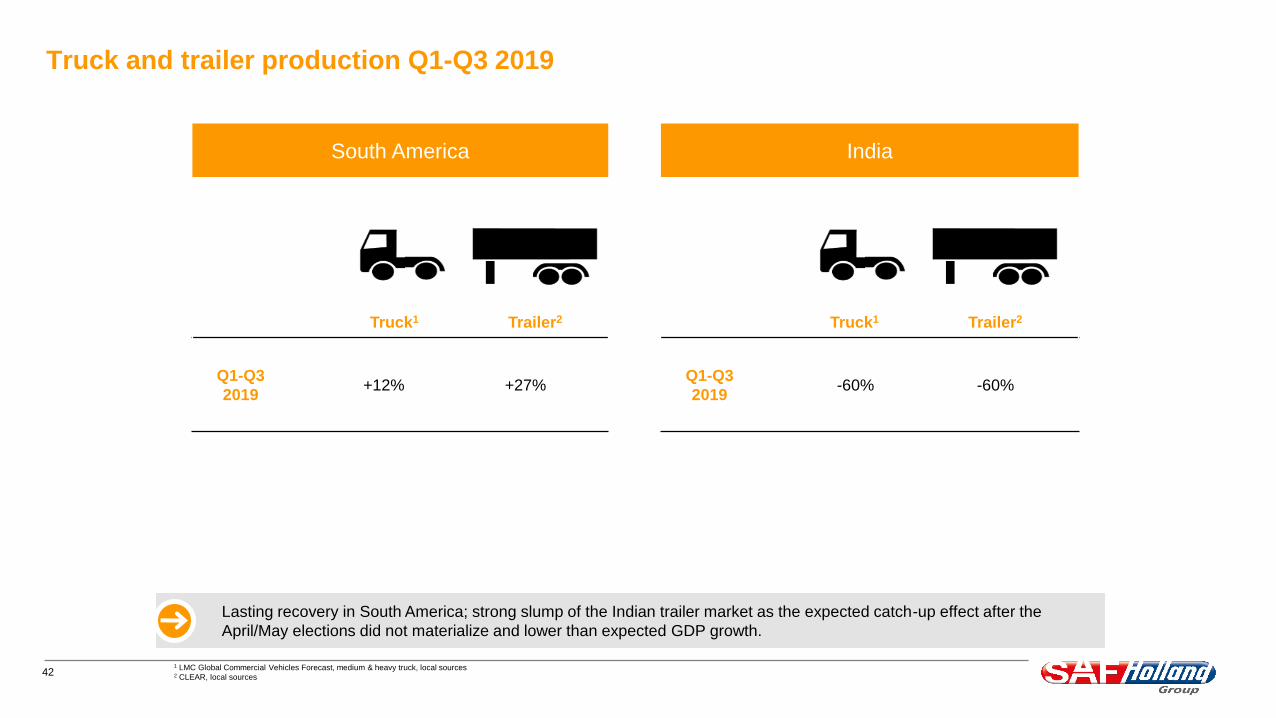
Truck and trailer production Q1-Q3 2019
1 LMC Global Commercial Vehicles Forecast, medium & heavy truck, local sources2 CLEAR, local sources
India
Q1-Q3
2019 -60% -60%
South America
Q1-Q3
2019+12% +27%
Trailer2 Truck1Trailer2 Truck1
Lasting recovery in South America; strong slump of the Indian trailer market as the expected catch-up effect after the
April/May elections did not materialize and lower than expected GDP growth.
43
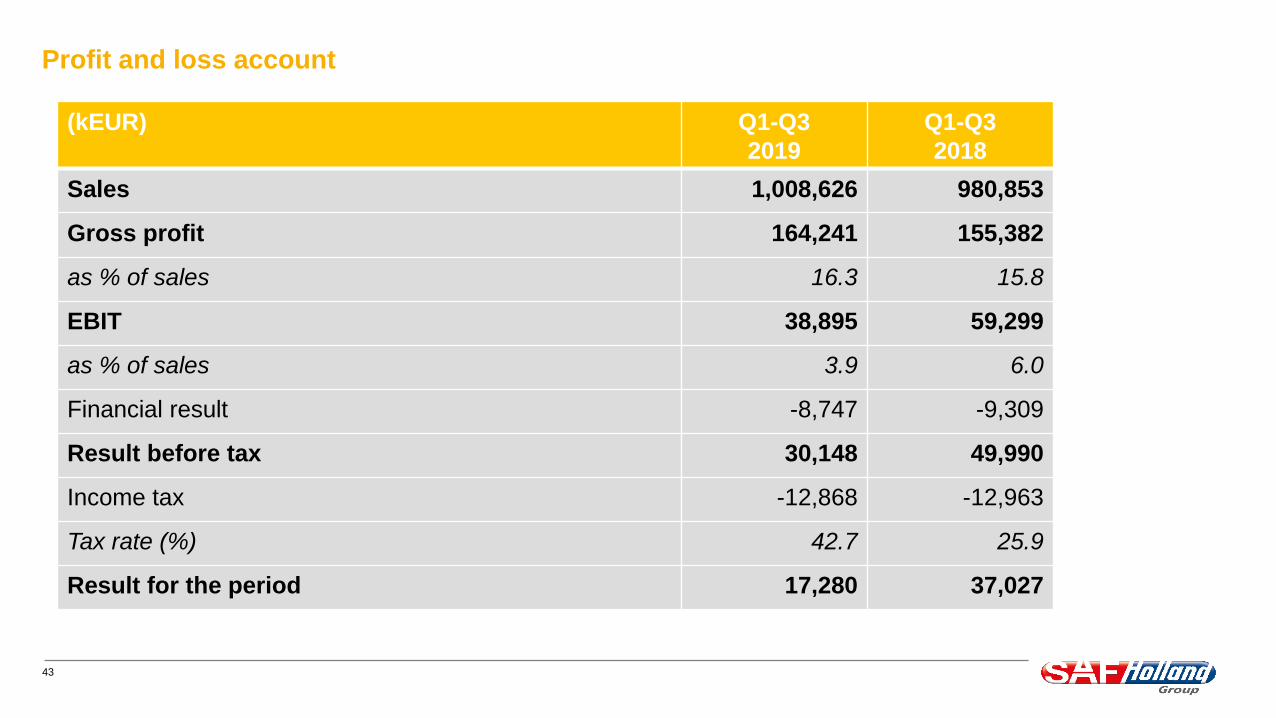
Profit and loss account
(kEUR) Q1-Q3
2019
Q1-Q3
2018
Sales 1,008,626 980,853
Gross profit 164,241 155,382
as % of sales 16.3 15.8
EBIT 38,895 59,299
as % of sales 3.9 6.0
Financial result -8,747 -9,309
Result before tax 30,148 49,990
Income tax -12,868 -12,963
Tax rate (%) 42.7 25.9
Result for the period 17,280 37,027
44
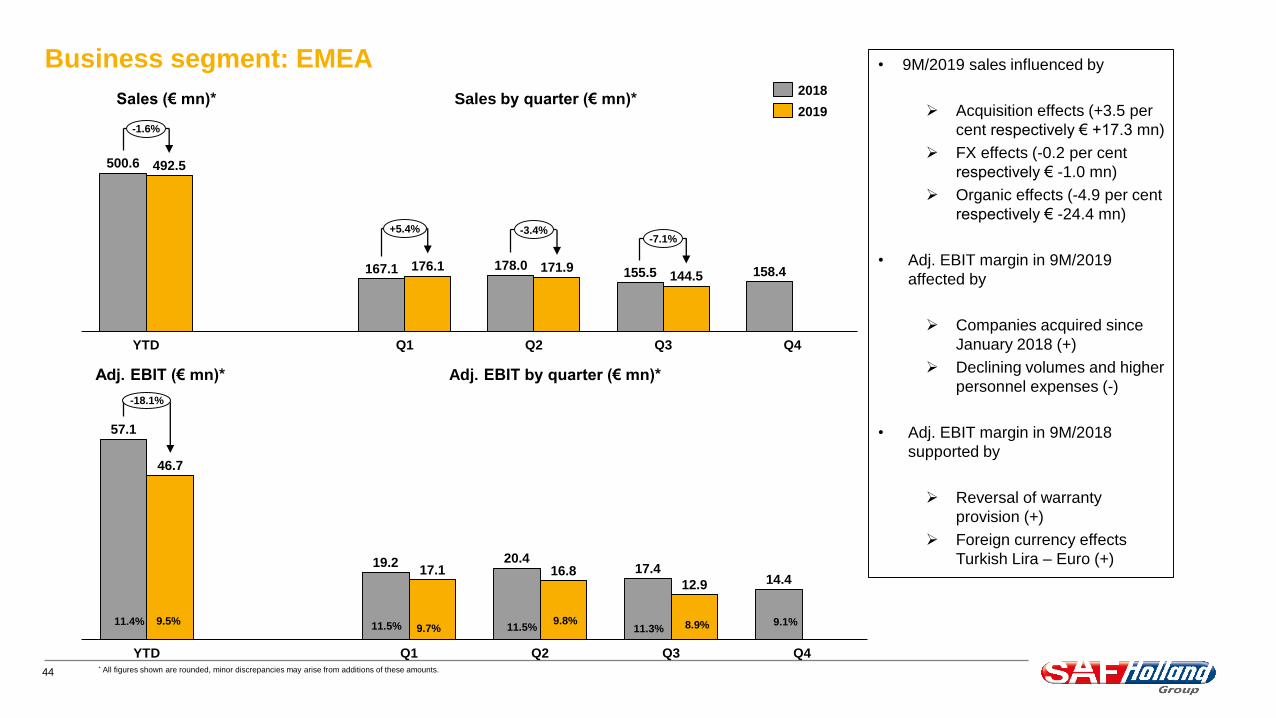
Business segment: EMEA
Adj. EBIT (€ mn)* Adj. EBIT by quarter (€ mn)*
Sales (€ mn)* Sales by quarter (€ mn)*
500.6
YTD Q4Q3
158.4
Q1 Q2
144.5
492.5
167.1 176.1 178.0 171.9 155.5
-1.6%
+5.4% -3.4%-7.1%
Q1
9.8%
YTD
11.4% 9.5%
Q4
9.7%11.5% 11.5%
Q2
11.3% 8.9%
Q3
9.1%
46.7
57.1
19.217.1
20.416.8 17.4
12.9 14.4
-18.1%
• 9M/2019 sales influenced by
Acquisition effects (+3.5 per
cent respectively € +17.3 mn)
FX effects (-0.2 per cent
respectively € -1.0 mn)
Organic effects (-4.9 per cent
respectively € -24.4 mn)
• Adj. EBIT margin in 9M/2019
affected by
Companies acquired since
January 2018 (+)
Declining volumes and higher
personnel expenses (-)
• Adj. EBIT margin in 9M/2018
supported by
Reversal of warranty
provision (+)
Foreign currency effects
Turkish Lira – Euro (+)
2018
2019
* All figures shown are rounded, minor discrepancies may arise from additions of these amounts.

45
Business segment: Americas
Adj. EBIT (€ mn)* Adj. EBIT by quarter (€ mn)*
Sales (€ mn)* Sales by quarter (€ mn)*
Q3
117.7
Q1YTD Q2 Q4
416.1
353.9
101.9131.3 123.0
141.3 128.9 143.6
+17.6%
+28.9% +14.8% +11.3%
8.1%
0.5%
6.3%1.8%
-0.7%
YTD
5.2%
Q1 Q2
5.0% 5.5%
7.8
Q3
1.7%
Q4
6.5
26.1
-0.7
6.8
0.6
11.4
6.5
2.0
• 9M/2019 sales influenced by
Organic effects (+11.3 per
cent respectively € +39.9 mn;
outperformed the market)
FX effects (+6.2 per cent
respectively € +22.1 mn)
• Adj. EBIT margin in 9M/2019 affected
by
Operational efficiency gains
from program FORWARD (+)
Contractual passing on of prior
year’s steel price increases (+)
Lower purchase prices for steel
and other materials (+)
More profitable aftermarket
business (+)
• Adj. EBIT margin in 9M/2018
positively affected by the partial
settlement of a medical plan in the US
2018
2019
* All figures shown are rounded, minor discrepancies may arise from additions of these amounts.
46
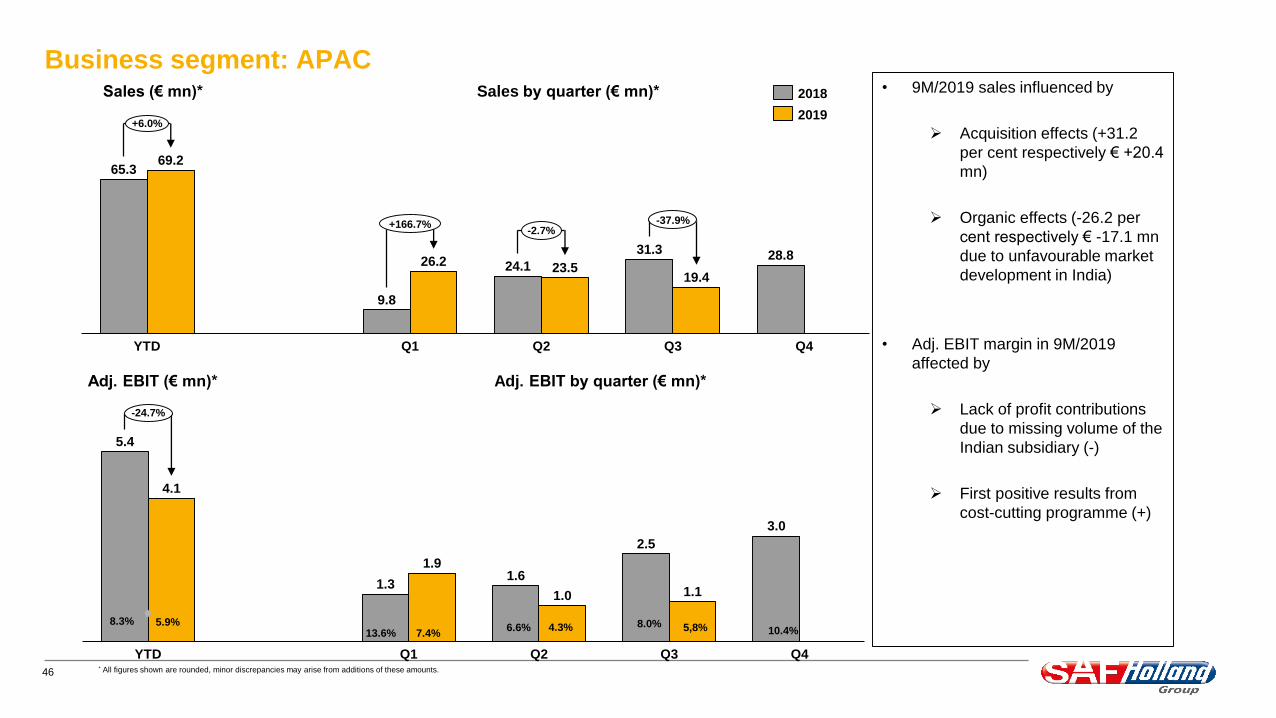
Business segment: APAC
Adj. EBIT (€ mn)* Adj. EBIT by quarter (€ mn)*
Sales (€ mn)* Sales by quarter (€ mn)*
Q4YTD Q1 Q2 Q3
9.8
65.369.2
24.126.223.5
31.3
19.4
28.8
+6.0%
+166.7%-2.7%
-37.9%
7.4%
Q4
8.3%5,8%
5.9%6.6%
YTD
8.0%13.6%
Q1
4.3%
1.0
Q2 Q3
10.4%
3.0
5.4
4.1
1.3
2.5
1.91.6
1.1
-24.7%
• 9M/2019 sales influenced by
Acquisition effects (+31.2
per cent respectively € +20.4
mn)
Organic effects (-26.2 per
cent respectively € -17.1 mn
due to unfavourable market
development in India)
• Adj. EBIT margin in 9M/2019
affected by
Lack of profit contributions
due to missing volume of the
Indian subsidiary (-)
First positive results from
cost-cutting programme (+)
2019
2018
* All figures shown are rounded, minor discrepancies may arise from additions of these amounts.
47
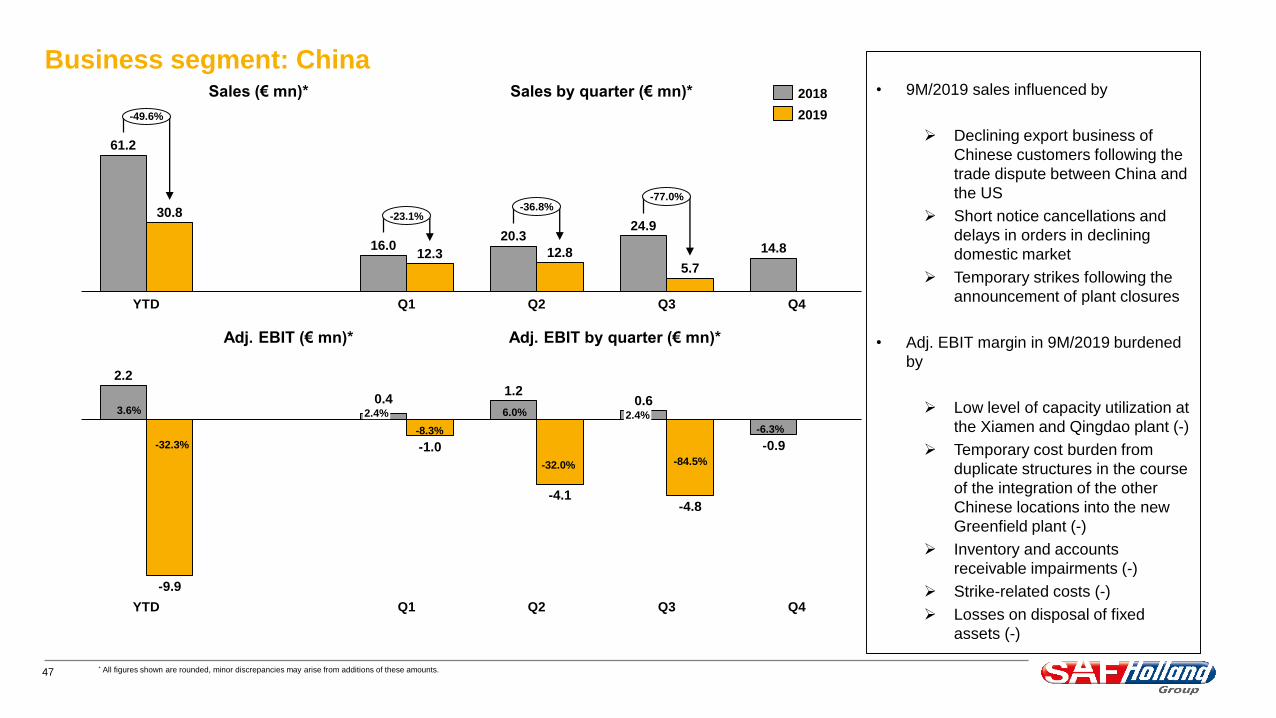
Business segment: China
Adj. EBIT (€ mn)* Adj. EBIT by quarter (€ mn)*
Sales (€ mn)* Sales by quarter (€ mn)*
Q1YTD Q2
12.8
Q3 Q4
14.820.3
5.7
61.2
30.8
12.316.0
24.9
-49.6%
-23.1%-36.8%
-77.0%
Q1
-8.3%
YTD
2.4%
-32.3%
-4.1
2.4%3.6% 6.0%
-32.0%
Q2
-84.5%
Q3
-6.3%
Q4
2.2
-9.9
-0.9
0.4
-1.0
1.20.6
-4.8
• 9M/2019 sales influenced by
Declining export business of
Chinese customers following the
trade dispute between China and
the US
Short notice cancellations and
delays in orders in declining
domestic market
Temporary strikes following the
announcement of plant closures
• Adj. EBIT margin in 9M/2019 burdened
by
Low level of capacity utilization at
the Xiamen and Qingdao plant (-)
Temporary cost burden from
duplicate structures in the course
of the integration of the other
Chinese locations into the new
Greenfield plant (-)
Inventory and accounts
receivable impairments (-)
Strike-related costs (-)
Losses on disposal of fixed
assets (-)
2018
2019
* All figures shown are rounded, minor discrepancies may arise from additions of these amounts.
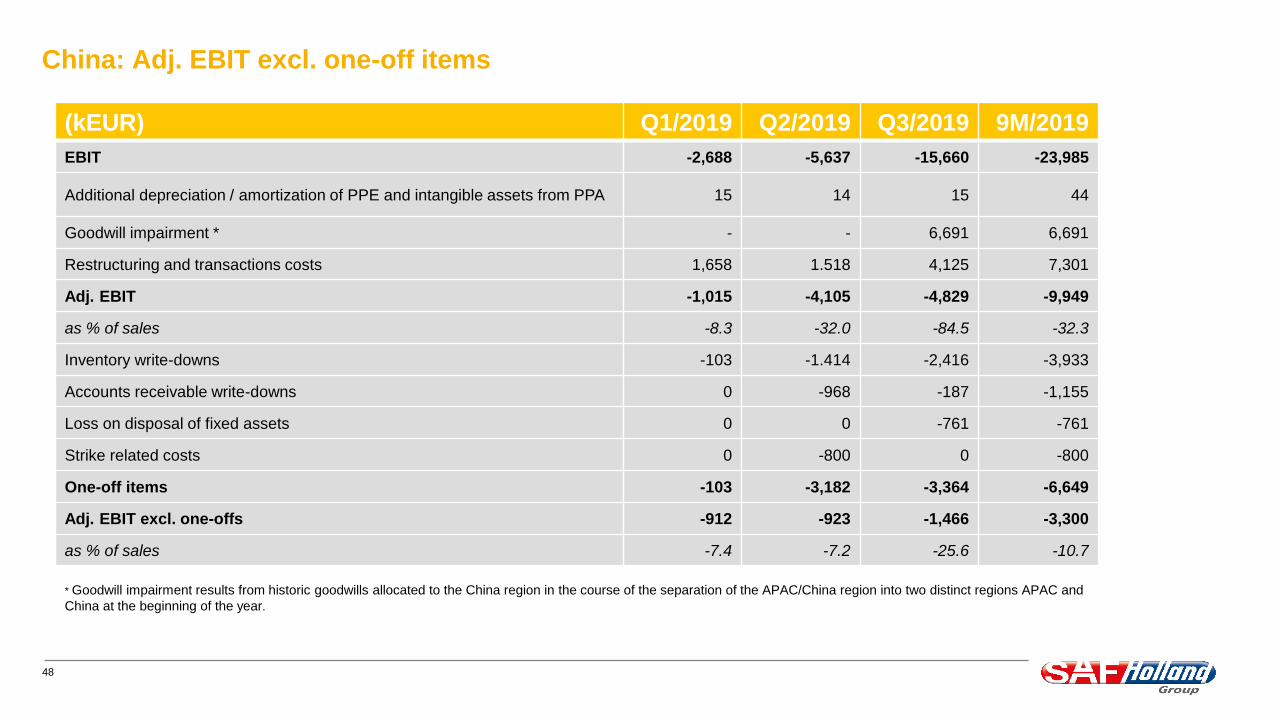
48
China: Adj. EBIT excl. one-off items
(kEUR) Q1/2019 Q2/2019 Q3/2019 9M/2019
EBIT -2,688 -5,637 -15,660 -23,985
Additional depreciation / amortization of PPE and intangible assets from PPA 15 14 15 44
Goodwill impairment * - - 6,691 6,691
Restructuring and transactions costs 1,658 1.518 4,125 7,301
Adj. EBIT -1,015 -4,105 -4,829 -9,949
as % of sales -8.3 -32.0 -84.5 -32.3
Inventory write-downs -103 -1.414 -2,416 -3,933
Accounts receivable write-downs 0 -968 -187 -1,155
Loss on disposal of fixed assets 0 0 -761 -761
Strike related costs 0 -800 0 -800
One-off items -103 -3,182 -3,364 -6,649
Adj. EBIT excl. one-offs -912 -923 -1,466 -3,300
as % of sales -7.4 -7.2 -25.6 -10.7
* Goodwill impairment results from historic goodwills allocated to the China region in the course of the separation of the APAC/China region into two distinct regions APAC and
China at the beginning of the year.
49
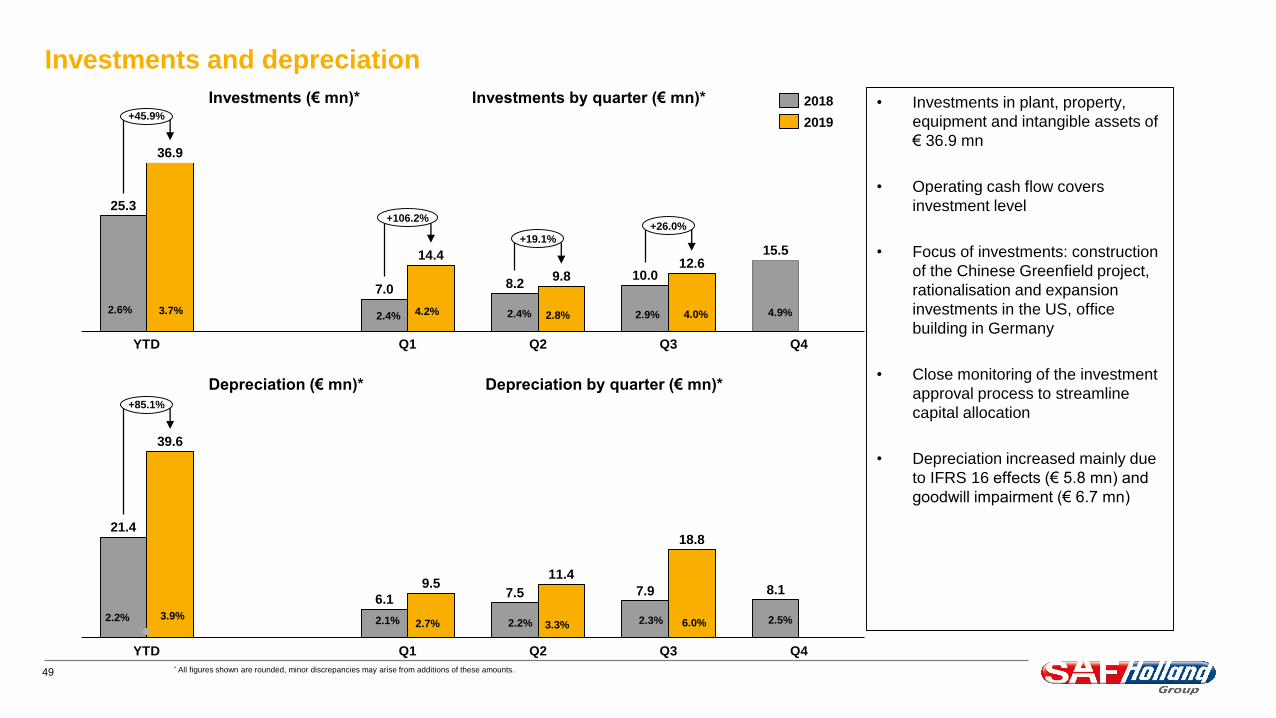
Investments and depreciation
Depreciation (€ mn)* Depreciation by quarter (€ mn)*
Investments (€ mn)* Investments by quarter (€ mn)*
2.6%2.4%
3.7% 2.4%
YTD
4.2%
Q1
2.8% 4.9%
12.6
Q3
4.0%2.9%
14.4
Q2
9.8
15.5
Q4
25.3
36.9
7.0 8.210.0
+45.9%
+106.2%
+19.1%
+26.0%
• Investments in plant, property,
equipment and intangible assets of
€ 36.9 mn
• Operating cash flow covers
investment level
• Focus of investments: construction
of the Chinese Greenfield project,
rationalisation and expansion
investments in the US, office
building in Germany
• Close monitoring of the investment
approval process to streamline
capital allocation
• Depreciation increased mainly due
to IFRS 16 effects (€ 5.8 mn) and
goodwill impairment (€ 6.7 mn)
Q1
2.7%
YTD
2.2% 3.9%2.2%2.1% 3.3%
Q2
2.3% 6.0%
Q3
2.5%
Q4
11.4
21.4
39.6
6.1
9.57.5 7.9
18.8
8.1
+85.1%
2018
2019
* All figures shown are rounded, minor discrepancies may arise from additions of these amounts.
50
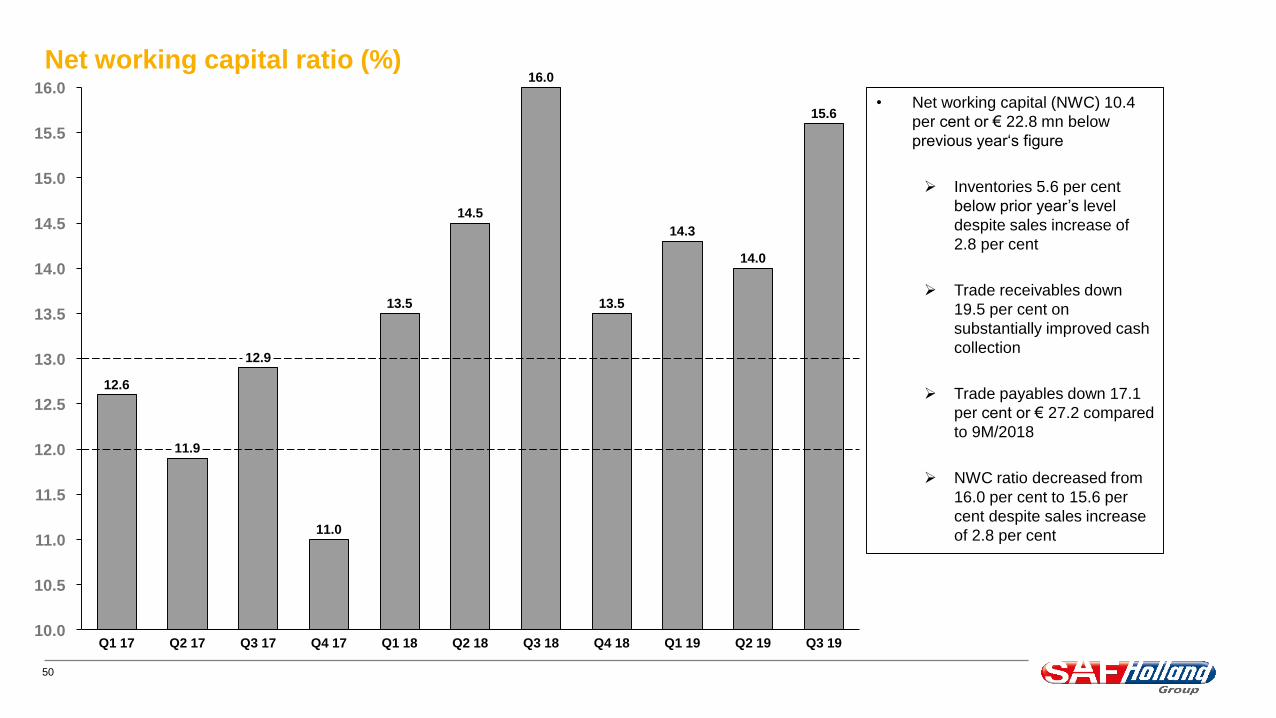
Net working capital ratio (%)
11.5
10.0
15.0
11.0
12.0
15.5
12.5
13.0
16.0
13.5
10.5
14.0
14.5
13.5
11.9
15.6
Q1 17 Q3 17 Q4 17 Q1 18 Q2 18 Q3 18 Q4 18 Q1 19 Q2 19
14.0
Q3 19
12.6
12.9
14.5
11.0
16.0
13.5
14.3
Q2 17
• Net working capital (NWC) 10.4
per cent or € 22.8 mn below
previous year‘s figure
Inventories 5.6 per cent
below prior year’s level
despite sales increase of
2.8 per cent
Trade receivables down
19.5 per cent on
substantially improved cash
collection
Trade payables down 17.1
per cent or € 27.2 compared
to 9M/2018
NWC ratio decreased from
16.0 per cent to 15.6 per
cent despite sales increase
of 2.8 per cent
51
SAF-HOLLAND Group
Hauptstraße 26
63856 Bessenbach
Germany
www.safholland.com
Michael Schickling
Head of Investor Relations / Corporate Communications
Phone: +49 - 6095 301-617
Alexander Pöschl
Senior Manager Investor Relations / Corporate Communications
Phone: +49 - 6095 301-117
Klaus Breitenbach
Senior Manager Investor Relations / Corporate Communications
Phone: +49 - 6095 301-565
IR Contact
52
Disclaimer
Not for general release, publication or distribution in the United States, Australia, Canada or Japan.
By attending this presentation you agree to be bound by the following limitations:
This presentation has been prepared by SAF-HOLLAND S.A. (“SAF-HOLLAND”) and comprises written materials concerning SAF-HOLLAND. It is furnished to you solely
for your information and may not be reproduced or redistributed, in whole or in part, to any other person. It contains summary information only and does not purport to be
comprehensive and is not intended to be (and should not be used as) the sole basis of any analysis or other evaluation. No representation or warranty, express or implied,
is made as to, and no reliance should be placed on, the fairness, accuracy, completeness or correctness of any information, including projections, estimates, targets and
opinions, contained herein, and no liability whatsoever is accepted as to any errors, omissions or misstatements contained herein, and, accordingly, neither SAF-HOLLAND
nor any of its directors, officers, employees or advisors nor any other person shall have any responsibility or liability whatsoever (for negligence or otherwise) arising,
directly or indirectly, from the use of this presentation, or its contents or otherwise in connection with this presentation.
This presentation contains certain statements related to our future business and financial performance and future events or developments involving SAF-HOLLAND and/or
the industry in which SAF-HOLLAND operates that may constitute forward-looking statements. These statements may be identified by words such as “believes,” “expects,”
“predicts,” “intends,” “projects,” “plans,” “estimates,” “aims,” “foresees,” “anticipates,” “targets,” and similar expressions. Forward-looking statements are not historical facts,
but solely opinions, views and forecasts which are based on current expectations and certain assumptions of SAF-HOLLAND’s management or cited from third party
sources which are uncertain and subject to risks. Actual events may differ significantly from the anticipated developments due to a number of factors, including without
limitation, changes in general economic conditions, changes affecting the fair values of the assets held by SAF-HOLLAND and its subsidiaries, changes affecting interest
rate levels, changes in competition levels, changes in laws and regulations, environmental damages, the potential impact of legal proceedings and actions and the Group’s
ability to achieve operational synergies from past or future acquisitions. Should any of these risks or uncertainties materialize, or should underlying expectations not occur
or assumptions prove to be incorrect, actual results, performance or achievements of SAF-HOLLAND may (negatively or positively) vary materially from those described,
explicitly or implicitly, in the relevant forward-looking statement.
The information contained in this presentation, including any forward-looking statements expressed herein, speaks only as of the date hereof and reflects current legislation
and the business and financial affairs of the SAF-HOLLAND which are subject to change and audit. Neither the delivery of this presentation nor any further discussions of
SAF-HOLLAND with any of the recipients thereof shall, under any circumstances, create any implication that there has been no change in the affairs of SAF-HOLLAND
since such date. Consequently, SAF-HOLLAND neither accepts any responsibility for the future accuracy of the information contained in this presentation, including any
forward-looking statements expressed herein, nor assumes any obligation, to update or revise this information to reflect subsequent events or developments which differ
from those anticipated.
This presentation is not directed to, or intended for distribution to or use by, any person or entity that is a citizen or resident or located in any state, country or other
jurisdiction where such distribution, publication, availability or use would be contrary to law or regulation or which would require any registration or licensing within such
jurisdiction. This presentation is for information purposes only and does neither constitute an offer to sell securities, nor any recommendation of, or solicitation of an offer to
buy, any securities of SAF-HOLLAND in the United States, Germany or any other jurisdiction. In the United States, any securities may not be offered or sold absent
registration or an exemption from registration under the U.S. Securities Act of 1933.


![Diffs Eqs[Sfetsos]](https://img.pdfslide.net/doc/110x75/5695d49d1a28ab9b02a218df/diffs-eqssfetsos.jpg)

