Embed Size (px)
Citation preview
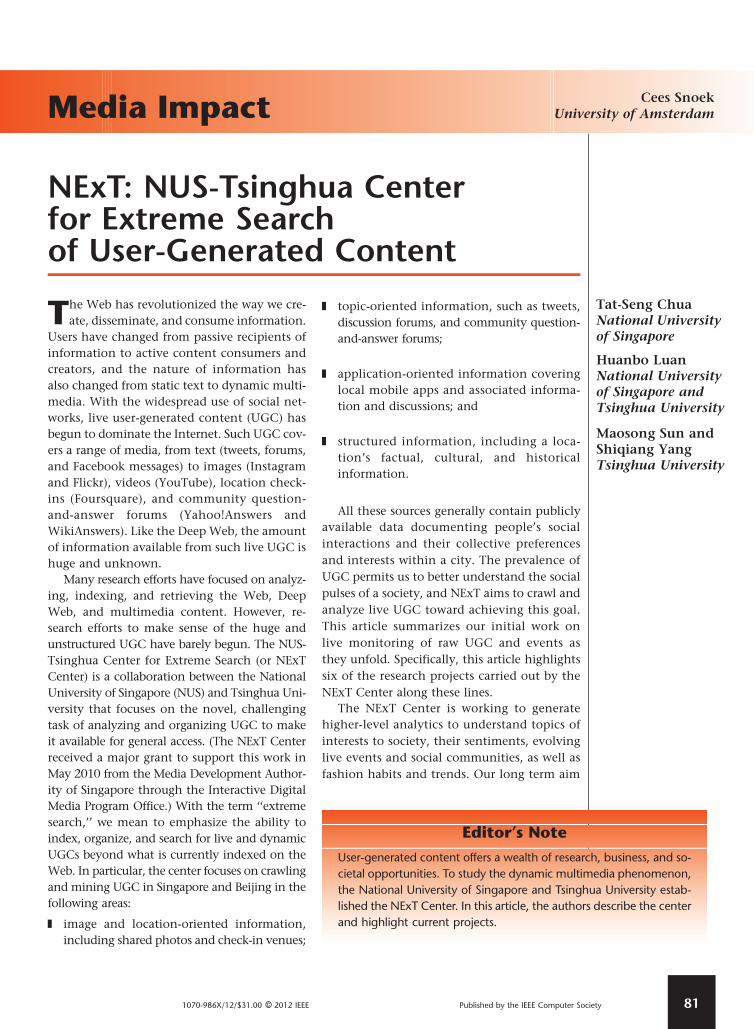
NExT: NUS-Tsinghua Centerfor Extreme Searchof User-Generated Content
The Web has revolutionized the way we cre-
ate, disseminate, and consume information.
Users have changed from passive recipients of
information to active content consumers and
creators, and the nature of information has
also changed from static text to dynamic multi-
media. With the widespread use of social net-
works, live user-generated content (UGC) has
begun to dominate the Internet. Such UGC cov-
ers a range of media, from text (tweets, forums,
and Facebook messages) to images (Instagram
and Flickr), videos (YouTube), location check-
ins (Foursquare), and community question-
and-answer forums (Yahoo!Answers and
WikiAnswers). Like the Deep Web, the amount
of information available from such live UGC is
huge and unknown.
Many research efforts have focused on analyz-
ing, indexing, and retrieving the Web, Deep
Web, and multimedia content. However, re-
search efforts to make sense of the huge and
unstructured UGC have barely begun. The NUS-
Tsinghua Center for Extreme Search (or NExT
Center) is a collaboration between the National
University of Singapore (NUS) and Tsinghua Uni-
versity that focuses on the novel, challenging
task of analyzing and organizing UGC to make
it available for general access. (The NExT Center
received a major grant to support this work in
May 2010 from the Media Development Author-
ity of Singapore through the Interactive Digital
Media Program Office.) With the term ‘‘extreme
search,’’ we mean to emphasize the ability to
index, organize, and search for live and dynamic
UGCs beyond what is currently indexed on the
Web. In particular, the center focuses on crawling
and mining UGC in Singapore and Beijing in the
following areas:
� image and location-oriented information,
including shared photos and check-in venues;
� topic-oriented information, such as tweets,
discussion forums, and community question-
and-answer forums;
� application-oriented information covering
local mobile apps and associated informa-
tion and discussions; and
� structured information, including a loca-
tion’s factual, cultural, and historical
information.
All these sources generally contain publicly
available data documenting people’s social
interactions and their collective preferences
and interests within a city. The prevalence of
UGC permits us to better understand the social
pulses of a society, and NExT aims to crawl and
analyze live UGC toward achieving this goal.
This article summarizes our initial work on
live monitoring of raw UGC and events as
they unfold. Specifically, this article highlights
six of the research projects carried out by the
NExT Center along these lines.
The NExT Center is working to generate
higher-level analytics to understand topics of
interests to society, their sentiments, evolving
live events and social communities, as well as
fashion habits and trends. Our long term aim
[3B2-9] mmu2012030081.3d 12/7/012 11:1 Page 81
Media Impact Cees SnoekUniversity of Amsterdam
Huanbo LuanNational Universityof Singapore andTsinghua University
Maosong Sun andShiqiang YangTsinghua University
Tat-Seng ChuaNational Universityof Singapore
Editor’s Note
User-generated content offers a wealth of research, business, and so-
cietal opportunities. To study the dynamic multimedia phenomenon,
the National University of Singapore and Tsinghua University estab-
lished the NExT Center. In this article, the authors describe the center
and highlight current projects.
1070-986X/12/$31.00 �c 2012 IEEE Published by the IEEE Computer Society 81
is to generate social graphs of topics and peo-
ple, documenting the activities and concerns
of people within the society.
Live Monitoring
Part of the NExT Center’s efforts is to crawl
and monitor UGC related to a city. Along
this aim, we have continually crawled the
image and location-oriented UGC, topic-
oriented UGC, UGC related to local mobile
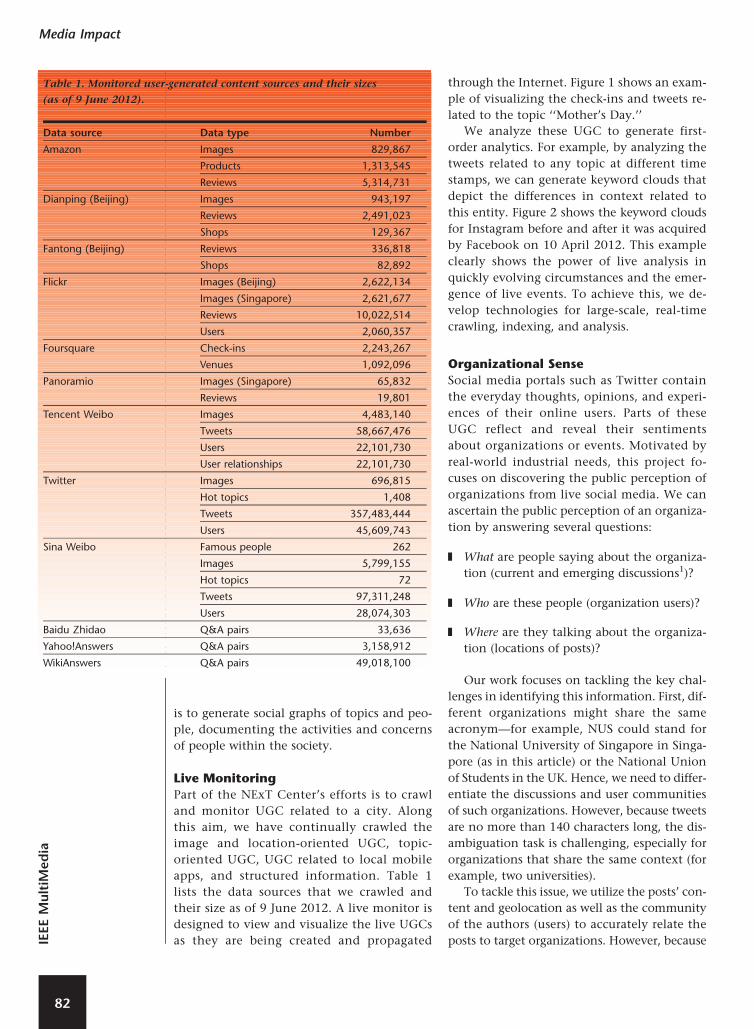
apps, and structured information. Table 1
lists the data sources that we crawled and
their size as of 9 June 2012. A live monitor is
designed to view and visualize the live UGCs
as they are being created and propagated
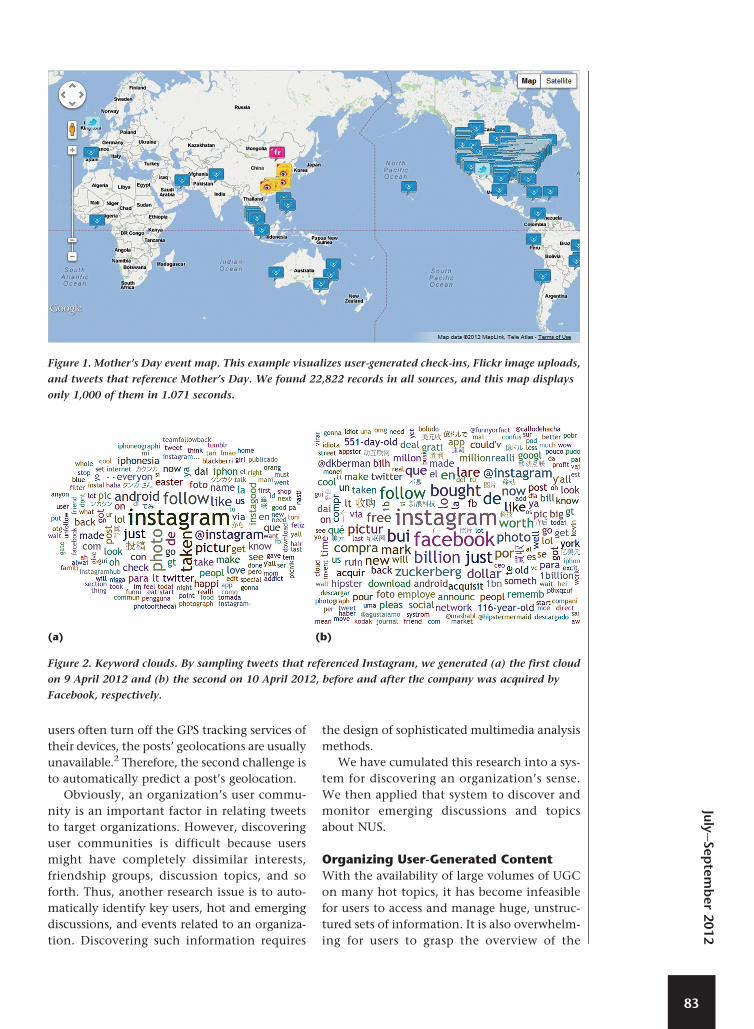
through the Internet. Figure 1 shows an exam-
ple of visualizing the check-ins and tweets re-
lated to the topic ‘‘Mother’s Day.’’
We analyze these UGC to generate first-
order analytics. For example, by analyzing the
tweets related to any topic at different time
stamps, we can generate keyword clouds that
depict the differences in context related to
this entity. Figure 2 shows the keyword clouds
for Instagram before and after it was acquired
by Facebook on 10 April 2012. This example
clearly shows the power of live analysis in
quickly evolving circumstances and the emer-
gence of live events. To achieve this, we de-
velop technologies for large-scale, real-time
crawling, indexing, and analysis.
Organizational Sense
Social media portals such as Twitter contain
the everyday thoughts, opinions, and experi-
ences of their online users. Parts of these
UGC reflect and reveal their sentiments
about organizations or events. Motivated by
real-world industrial needs, this project fo-
cuses on discovering the public perception of
organizations from live social media. We can
ascertain the public perception of an organiza-
tion by answering several questions:
� What are people saying about the organiza-
tion (current and emerging discussions1)?
� Who are these people (organization users)?
� Where are they talking about the organiza-
tion (locations of posts)?
Our work focuses on tackling the key chal-
lenges in identifying this information. First, dif-
ferent organizations might share the same
acronym—for example, NUS could stand for
the National University of Singapore in Singa-
pore (as in this article) or the National Union
of Students in the UK. Hence, we need to differ-
entiate the discussions and user communities
of such organizations. However, because tweets
are no more than 140 characters long, the dis-
ambiguation task is challenging, especially for
organizations that share the same context (for
example, two universities).
To tackle this issue, we utilize the posts’ con-
tent and geolocation as well as the community
of the authors (users) to accurately relate the
posts to target organizations. However, because
[3B2-9] mmu2012030081.3d 12/7/012 11:1 Page 82
Table 1. Monitored user-generated content sources and their sizes
(as of 9 June 2012).
Data source Data type Number
Amazon Images 829,867
Products 1,313,545
Reviews 5,314,731
Dianping (Beijing) Images 943,197
Reviews 2,491,023
Shops 129,367
Fantong (Beijing) Reviews 336,818
Shops 82,892
Flickr Images (Beijing) 2,622,134
Images (Singapore) 2,621,677
Reviews 10,022,514
Users 2,060,357
Foursquare Check-ins 2,243,267
Venues 1,092,096
Panoramio Images (Singapore) 65,832
Reviews 19,801
Tencent Weibo Images 4,483,140
Tweets 58,667,476
Users 22,101,730
User relationships 22,101,730
Twitter Images 696,815
Hot topics 1,408
Tweets 357,483,444
Users 45,609,743
Sina Weibo Famous people 262
Images 5,799,155
Hot topics 72
Tweets 97,311,248
Users 28,074,303
Baidu Zhidao Q&A pairs 33,636
Yahoo!Answers Q&A pairs 3,158,912
WikiAnswers Q&A pairs 49,018,100
IEEE
Mu
ltiM
ed
ia
82
Media Impact
users often turn off the GPS tracking services of
their devices, the posts’ geolocations are usually
unavailable.2 Therefore, the second challenge is
to automatically predict a post’s geolocation.
Obviously, an organization’s user commu-
nity is an important factor in relating tweets
to target organizations. However, discovering
user communities is difficult because users
might have completely dissimilar interests,
friendship groups, discussion topics, and so
forth. Thus, another research issue is to auto-
matically identify key users, hot and emerging
discussions, and events related to an organiza-
tion. Discovering such information requires
the design of sophisticated multimedia analysis
methods.
We have cumulated this research into a sys-
tem for discovering an organization’s sense.
We then applied that system to discover and
monitor emerging discussions and topics
about NUS.
Organizing User-Generated Content
With the availability of large volumes of UGC
on many hot topics, it has become infeasible
for users to access and manage huge, unstruc-
tured sets of information. It is also overwhelm-
ing for users to grasp the overview of the
[3B2-9] mmu2012030081.3d 12/7/012 11:1 Page 83
Figure 1. Mother’s Day event map. This example visualizes user-generated check-ins, Flickr image uploads,
and tweets that reference Mother’s Day. We found 22,822 records in all sources, and this map displays
only 1,000 of them in 1.071 seconds.
Figure 2. Keyword clouds. By sampling tweets that referenced Instagram, we generated (a) the first cloud
on 9 April 2012 and (b) the second on 10 April 2012, before and after the company was acquired by
Facebook, respectively.
(a) (b)
July
�Sep
tem
ber
2012
83
discussions and obtain a sense of key subtopics
of common concern and interest to most
users. To tackle this problem, we developed a
framework to automatically ‘‘read,’’ digest,
and organize UGC in human-oriented struc-
tures to facilitate user access. In other words,
we aim to leverage domain knowledge to orga-
nize UGC related to any topic into hierarchies
or network structures that resemble the se-
mantic models in human brains.
Our system consists of three major steps:
1. Mine the concepts and propositions from
natural language sentences in a large
closed-domain UGC corpus.
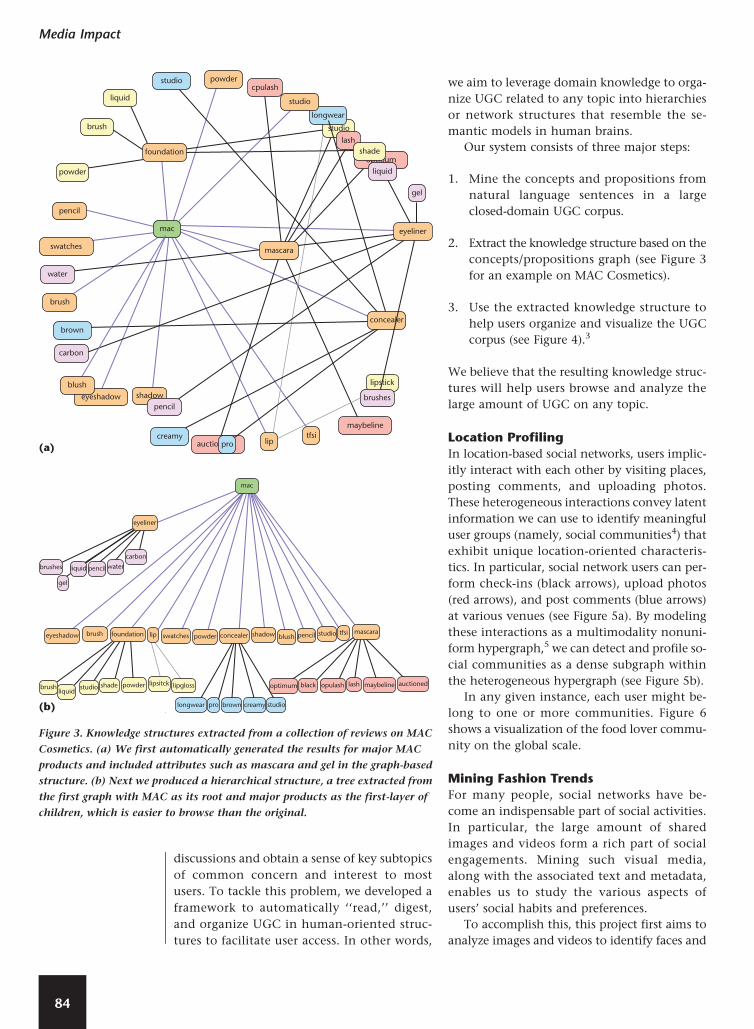
2. Extract the knowledge structure based on the
concepts/propositions graph (see Figure 3
for an example on MAC Cosmetics).
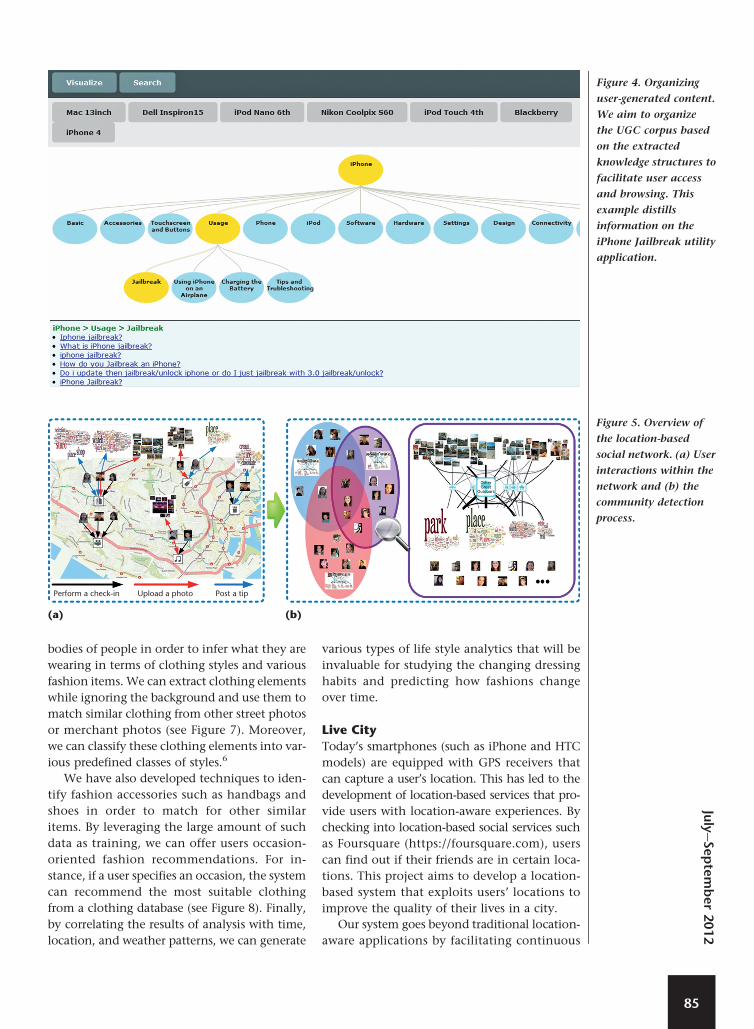
3. Use the extracted knowledge structure to
help users organize and visualize the UGC
corpus (see Figure 4).3
We believe that the resulting knowledge struc-
tures will help users browse and analyze the
large amount of UGC on any topic.
Location Profiling
In location-based social networks, users implic-
itly interact with each other by visiting places,
posting comments, and uploading photos.
These heterogeneous interactions convey latent
information we can use to identify meaningful
user groups (namely, social communities4) that
exhibit unique location-oriented characteris-
tics. In particular, social network users can per-
form check-ins (black arrows), upload photos
(red arrows), and post comments (blue arrows)
at various venues (see Figure 5a). By modeling
these interactions as a multimodality nonuni-
form hypergraph,5 we can detect and profile so-
cial communities as a dense subgraph within
the heterogeneous hypergraph (see Figure 5b).
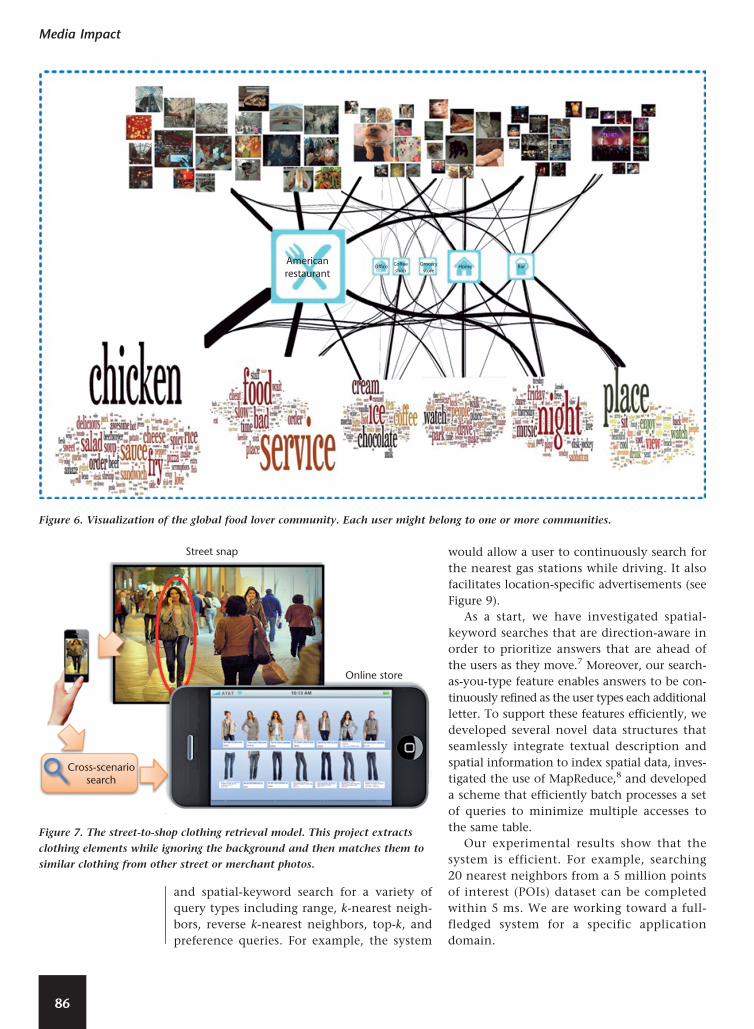
In any given instance, each user might be-
long to one or more communities. Figure 6
shows a visualization of the food lover commu-
nity on the global scale.
Mining Fashion Trends
For many people, social networks have be-
come an indispensable part of social activities.
In particular, the large amount of shared
images and videos form a rich part of social
engagements. Mining such visual media,
along with the associated text and metadata,
enables us to study the various aspects of
users’ social habits and preferences.
To accomplish this, this project first aims to
analyze images and videos to identify faces and
[3B2-9] mmu2012030081.3d 12/7/012 11:1 Page 84
Figure 3. Knowledge structures extracted from a collection of reviews on MAC
Cosmetics. (a) We first automatically generated the results for major MAC
products and included attributes such as mascara and gel in the graph-based
structure. (b) Next we produced a hierarchical structure, a tree extracted from
the first graph with MAC as its root and major products as the first-layer of
children, which is easier to browse than the original.
eyeshadow
brushes
gel
liquid
liquid
pencil water
carbon
eyeliner
eyeshadow brush
brush
foundation lip swatches powder concealer shadow blush pencil studio
studio shade powder lipsitck lipgloss
longwear pro brown creamy studio
optimum black opulash lash maybeline auctioned
tfsi mascara
mac
(a)
(b)
foundation
studio
liquid
brush
brush
brown
carbon
brushes
lipstick
mascara
gel
lash
studio
longwear
studio
cpulashpowder
shadow
powder
pencil
pencil
creamylip
tfsimaybeline
auction
swatches
water
mac
optioumshade
pro
concealer
eyeliner
liquid
blush
84
Media Impact
bodies of people in order to infer what they are
wearing in terms of clothing styles and various
fashion items. We can extract clothing elements
while ignoring the background and use them to
match similar clothing from other street photos
or merchant photos (see Figure 7). Moreover,
we can classify these clothing elements into var-
ious predefined classes of styles.6
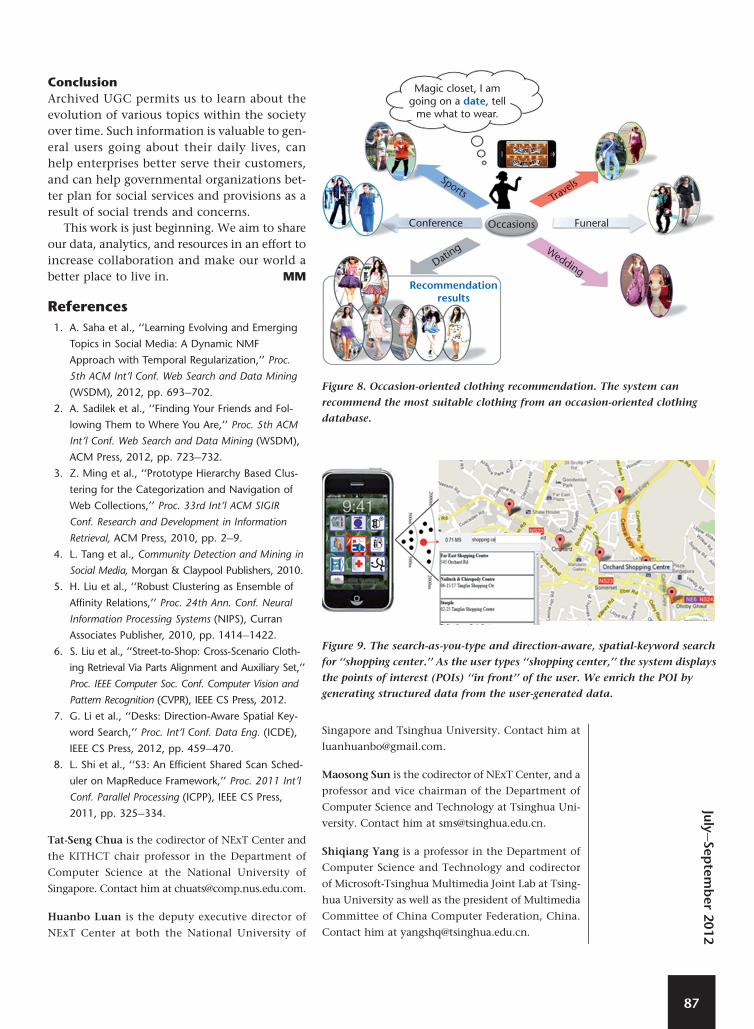
We have also developed techniques to iden-
tify fashion accessories such as handbags and
shoes in order to match for other similar
items. By leveraging the large amount of such
data as training, we can offer users occasion-
oriented fashion recommendations. For in-
stance, if a user specifies an occasion, the system
can recommend the most suitable clothing
from a clothing database (see Figure 8). Finally,
by correlating the results of analysis with time,
location, and weather patterns, we can generate
various types of life style analytics that will be
invaluable for studying the changing dressing
habits and predicting how fashions change
over time.
Live City
Today’s smartphones (such as iPhone and HTC
models) are equipped with GPS receivers that
can capture a user’s location. This has led to the
development of location-based services that pro-
vide users with location-aware experiences. By
checking into location-based social services such
as Foursquare (https://foursquare.com), users
can find out if their friends are in certain loca-
tions. This project aims to develop a location-
based system that exploits users’ locations to
improve the quality of their lives in a city.
Our system goes beyond traditional location-
aware applications by facilitating continuous
[3B2-9] mmu2012030081.3d 12/7/012 11:1 Page 85
Perform a check-in
(a) (b)
Upload a photo Post a tip
Figure 5. Overview of
the location-based
social network. (a) User
interactions within the
network and (b) the
community detection
process.
Figure 4. Organizing
user-generated content.
We aim to organize
the UGC corpus based
on the extracted
knowledge structures to
facilitate user access
and browsing. This
example distills
information on the
iPhone Jailbreak utility
application.
July
�Sep
tem
ber
2012
85
and spatial-keyword search for a variety of
query types including range, k-nearest neigh-
bors, reverse k-nearest neighbors, top-k, and
preference queries. For example, the system
would allow a user to continuously search for
the nearest gas stations while driving. It also
facilitates location-specific advertisements (see
Figure 9).
As a start, we have investigated spatial-
keyword searches that are direction-aware in
order to prioritize answers that are ahead of
the users as they move.7 Moreover, our search-
as-you-type feature enables answers to be con-
tinuously refined as the user types each additional
letter. To support these features efficiently, we
developed several novel data structures that
seamlessly integrate textual description and
spatial information to index spatial data, inves-
tigated the use of MapReduce,8 and developed
a scheme that efficiently batch processes a set
of queries to minimize multiple accesses to
the same table.
Our experimental results show that the
system is efficient. For example, searching
20 nearest neighbors from a 5 million points
of interest (POIs) dataset can be completed
within 5 ms. We are working toward a full-
fledged system for a specific application
domain.
[3B2-9] mmu2012030081.3d 12/7/012 11:1 Page 86
Figure 6. Visualization of the global food lover community. Each user might belong to one or more communities.
Americanrestaurant
Figure 7. The street-to-shop clothing retrieval model. This project extracts
clothing elements while ignoring the background and then matches them to
similar clothing from other street or merchant photos.
Street snap
Online store
Cross-scenariosearch
86
Media Impact
Conclusion
Archived UGC permits us to learn about the
evolution of various topics within the society
over time. Such information is valuable to gen-
eral users going about their daily lives, can
help enterprises better serve their customers,
and can help governmental organizations bet-
ter plan for social services and provisions as a
result of social trends and concerns.
This work is just beginning. We aim to share
our data, analytics, and resources in an effort to
increase collaboration and make our world a
better place to live in. MM
References
1. A. Saha et al., ‘‘Learning Evolving and Emerging
Topics in Social Media: A Dynamic NMF
Approach with Temporal Regularization,’’ Proc.
5th ACM Int’l Conf. Web Search and Data Mining
(WSDM), 2012, pp. 693�702.
2. A. Sadilek et al., ‘‘Finding Your Friends and Fol-
lowing Them to Where You Are,’’ Proc. 5th ACM
Int’l Conf. Web Search and Data Mining (WSDM),
ACM Press, 2012, pp. 723�732.
3. Z. Ming et al., ‘‘Prototype Hierarchy Based Clus-
tering for the Categorization and Navigation of
Web Collections,’’ Proc. 33rd Int’l ACM SIGIR
Conf. Research and Development in Information
Retrieval, ACM Press, 2010, pp. 2�9.
4. L. Tang et al., Community Detection and Mining in
Social Media, Morgan & Claypool Publishers, 2010.
5. H. Liu et al., ‘‘Robust Clustering as Ensemble of
Affinity Relations,’’ Proc. 24th Ann. Conf. Neural
Information Processing Systems (NIPS), Curran
Associates Publisher, 2010, pp. 1414�1422.
6. S. Liu et al., ‘‘Street-to-Shop: Cross-Scenario Cloth-
ing Retrieval Via Parts Alignment and Auxiliary Set,’’
Proc. IEEE Computer Soc. Conf. Computer Vision and
Pattern Recognition (CVPR), IEEE CS Press, 2012.
7. G. Li et al., ‘‘Desks: Direction-Aware Spatial Key-
word Search,’’ Proc. Int’l Conf. Data Eng. (ICDE),
IEEE CS Press, 2012, pp. 459�470.
8. L. Shi et al., ‘‘S3: An Efficient Shared Scan Sched-
uler on MapReduce Framework,’’ Proc. 2011 Int’l
Conf. Parallel Processing (ICPP), IEEE CS Press,
2011, pp. 325�334.
Tat-Seng Chua is the codirector of NExT Center and
the KITHCT chair professor in the Department of
Computer Science at the National University of
Singapore. Contact him at [email protected].
Huanbo Luan is the deputy executive director of
NExT Center at both the National University of
Singapore and Tsinghua University. Contact him at
Maosong Sun is the codirector of NExT Center, and a
professor and vice chairman of the Department of
Computer Science and Technology at Tsinghua Uni-
versity. Contact him at [email protected].
Shiqiang Yang is a professor in the Department of
Computer Science and Technology and codirector
of Microsoft-Tsinghua Multimedia Joint Lab at Tsing-
hua University as well as the president of Multimedia
Committee of China Computer Federation, China.
Contact him at [email protected].
[3B2-9] mmu2012030081.3d 12/7/012 11:1 Page 87
Figure 8. Occasion-oriented clothing recommendation. The system can
recommend the most suitable clothing from an occasion-oriented clothing
database.
Figure 9. The search-as-you-type and direction-aware, spatial-keyword search
for ‘‘shopping center.’’ As the user types ‘‘shopping center,’’ the system displays
the points of interest (POIs) ‘‘in front’’ of the user. We enrich the POI by
generating structured data from the user-generated data.
Magic closet, I amgoing on a date, tell
me what to wear.
Sports Travel
s
FuneralOccasionsConference
Dating Wedding
Recommendationresults
July
�Sep
tem
ber
2012
87