Embed Size (px)
Citation preview

HU-EP-13/48SFB/CPP-13-67
Next-to-leading order QCD corrections to five jet production at the LHC
Simon Badger
Niels Bohr International Academy and Discovery Center, The Niels Bohr Institute,University of Copenhagen, Blegdamsvej 17, DK-2100 Copenhagen, Denmark∗
Benedikt Biedermann
Humboldt-Universitat zu Berlin, Institut fur Physik,Newtonstraße 15, D-12489 Berlin, Germany†
Peter Uwer
Humboldt-Universitat zu Berlin, Institut fur Physik,Newtonstraße 15, D-12489 Berlin, Germany‡
Valery Yundin
Niels Bohr International Academy and Discovery Center, The Niels Bohr Institute,University of Copenhagen, Blegdamsvej 17, DK-2100 Copenhagen, Denmark§
(Dated: October 11, 2018)
We present theoretical predictions for five jet production in proton-proton collisions at next-to-leading orderaccuracy in QCD. Inclusive as well as differential observables are studied for collision energies of 7 and 8 TeV. Ingeneral the next-to-leading order corrections stabilize the theoretical predictions with respect to scale variations.In case of the inclusive jet cross sections, we compare with experimental data where possible and find reasonableagreement. We observe that the four-to-three and five-to-four jet ratios show better perturbative convergencethan the known three-to-two ratio and are promising candidates for future αs measurements. Furthermore, wepresent a detailed analysis of uncertainties related to parton distribution functions. The full colour virtual matrixelements used in the computation were obtained with the NJET package [1], a publicly available library for theevaluation of one-loop amplitudes in massless QCD.
Keywords: massless QCD, jet physics, hadronic collisions, unitarity method, next-to-leading order corrections
I. INTRODUCTION
The wealth of data recorded at the LHC experimentsin run 1 presents an excellent opportunity to test quantumchromo-dynamics (QCD) in a new energy regime. Further-more, multi-jet production at large transverse momentum canprovide useful information to constrain the parton distributionfunctions. Where precise theoretical results are available, thedata can also be used to determine the strong coupling con-stant αs. In that context large multiplicities may turn out to beparticularly useful, in analogy to what has been observed inelectron-positron annihilation. Pure QCD reactions with mul-tiple jet production can also give large backgrounds to variousnew physics searches therefore precision predictions are re-quired.
Next-to-leading order (NLO) predictions at fixed order inαs for di-jet production have been known for more than
∗ [email protected]† [email protected]‡ [email protected]§ [email protected]
20 years [2]. Three-jet production represents a considerableincrease in computational complexity and a full computationwas completed in 2002 [3], and implemented in the publiccode NLOJET++, though pure gluonic contributions wereknown previously [4]. Breakthroughs in virtual amplitudecomputations have recently enabled predictions of four-jetproduction [5, 6], with results generally in good agreementwith the experimental data [7]. Di-jet production is known tosuffer from large corrections from soft gluon radiation whichrequires resummation beyond fixed order perturbation theory.Theoretical predictions at NLO including the parton shower(NLO+PS) allow to account for these effects and obtain a bet-ter description of the available data [8, 9]. The CMS collab-oration has recently completed a measurement of αs from theinclusive 3-jet to inclusive 2-jet ratio. The measurement il-lustrates well the LHC potential for precision measurements.With NNLO QCD corrections to di-jet production just aroundthe corner [10], theoretical uncertainties look to be under goodcontrol and enable future QCD predictions to move beyondthe ‘industry standard’ LO+PS/ME+PS accuracy.
By now there has been a great success of the program toautomate NLO computations. Processes with four or five fi-nal state particles, previously thought to be impossible, are
arX
iv:1
309.
6585
v1 [
hep-
ph]
25
Sep
2013

2
now available in public codes [1, 11–14]. New methods andalgorithms [15–17] have been pushing the boundaries of per-turbative QCD computations and increasing the range of phe-nomenological applications (recent examples can be found in[18–22], see also [23] for a more complete overview). Pow-erful on-shell unitarity methods have been established formany years [24, 25] yet continue to demonstrate the abilityto simplify calculations of extremely high multiplicity am-plitudes inaccessible with alternative tools. Recent state-of-the-art computations include the NLO QCD corrections topp→W + 5 jets [19] by the BLACKHAT collaboration. Inthis paper we present the first computation for the productionof five hard jets at NLO in QCD.
The article is organized as follows: we first give anoverview of the computational framework for the various par-tonic sub-channels in Section II. Section III contains our re-sults for the NLO QCD corrections to pp → 5 jets. Wedescribe the numerical setup and interface with the SherpaMonte-Carlo event generator [26] in Section III A along withkinematic cuts. Results for total cross sections and jet ratiosare compared to the available data in Section III B. We presentdifferential distributions in the jet transverse momenta and ra-pidity and perform a detailed comparison of different PDF fits.We finally present our conclusions and outlook for the future.Two appendices containing a complete set of distributions andnumerical values used in the plotted histograms are includedto ease future comparisons.
II. OUTLINE OF THE CALCULATION
The calculation is done in QCD with five massless quarkflavours including the bottom-quark in the initial state. Weexpect the neglected contributions from top quark loops to bemuch smaller than the estimated theoretical uncertainty. Theprocesses contributing to five-jet production may be derivedfrom the following four basic channels via crossing symmetry
0→ ggggggg, 0→ qqggggg,
0→ qqq′q′ggg, 0→ qqq′q′q′′q′′g
where q, q′ and q′′ denote generic quarks of different flavour.Amplitudes with like-flavour quark pairs can always be ob-tained from the amplitudes for different flavours by an ap-propriate (anti) symmetrization. The n-jet differential crosssection expanded in the coupling αs reads
dσn = dσLOn +dδσ
NLOn +O(αn+2
s ) (1)
where dσLOn ∼ αn
s and dδσNLOn ∼ αn+1
s . In the QCD improvedparton model, the leading order differential cross section dσLO
nis given by
dσLOn = ∑
i, j∈{q,q,g}
dxidx jFj/H2(x j,µ f )Fi/H1(xi,µ f )
×dσBn(i(xiP1)+ j(x jP2)→ n part.
). (2)
P1,P2 are the momenta of the two incoming hadrons H1,H2which we assume to be massless. The total incoming mo-mentum of the initial state partons P = xiP1 + x jP2 leads to
a partonic centre-of-mass energy squared s = 2xix j(P1 ·P2) =x1x2shad with shad being the hadronic centre-of-mass energysquared. The parton distribution functions Fi/H(x,µ f ) de-scribe, roughly speaking, the probability to find a parton i in-side a hadron H with a momentum fraction between x and x+dx. Note that the parton distribution functions depend besidesx also on the unphysical factorization scale µ f . The partonicdifferential cross section dσB
n(i(x1P1)+ j(x jP2)→ n part.
)de-
scribes the reaction (i j→ n-jets) in Born approximation usingthe leading order matrix elements |Mn(i j→ n part.)|2 and asuitable jet algorithm Θn-jet:
dσBn =
12s
n
∏`=1
d3k`(2π)32E`
Θn-jet
× (2π)4δ
(P−
n
∑m=1
km
)∣∣Mn(i j→ n part.)∣∣2. (3)
ki are the four momenta of the outgoing partons obeyings= (∑n
i=1 ki)2. The jet algorithm Θn-jet is a function depending
solely on the final state parton momenta ki and on parametersdefining the geometric extensions of the jet. Its value is equalto one if the final state momentum configuration correspondsto a valid n-jet event and zero otherwise. The Born matrix ele-ments M (i j→ n part.) have been evaluated with Comix [27]within the Sherpa framework. The Sherpa Monte Carlo eventgenerator [28] has also been used to perform the numericalphase space integration.
At NLO accuracy both the virtual corrections dσVn (one-
loop contribution interfered with the Born amplitude) and thereal corrections dσR
n+1 (tree-level amplitudes with one addi-tional parton in the final state) contribute to the n-jet crosssection. Both dσV
n and dσRn+1 contain separately collinear and
soft divergences. Only after combining the two contributionsand factorizing the initial state singularities into renormalizedparton distributions one obtains a finite result. In order to per-form the cancellation of the divergences numerically we ap-ply the Catani-Seymour subtraction method [29]. The idea isto add and subtract local counter-terms dσS
n+1 with (n+ 1)-parton kinematics which, on the one hand, mimic point-wisethe singularity structure of the real corrections and which,on the other hand, are chosen such that the singularity dueto the additional parton emission can be calculated analyti-cally via separate integration of the one-particle phase-space.Since the latter cancel by construction the divergences fromthe virtual corrections, only finite quantities remain makingthe numerical integration with a Monte Carlo program feasi-ble. Schematically, we may write the total cross section as
δσNLO =
∫n
(dσ
Vn +
∫1
dσSn+1)+
∫n
dσFacn
+∫
n+1
(dσ
Rn+1−dσ
Sn+1). (4)
dσFacn is due to the factorization of initial state singularities.
The NLO corrections can then be written in terms of threefinite contributions:
dδσNLOn = dσ
Vn +dσ
In +dσ
RSn+1, (5)

3
dσVn denotes the finite part of the virtual corrections, dσI
n thefinite part of the integrated subtraction terms together with thecontribution from the factorization and dσRS
n+1 the real cor-rections combined with the subtraction terms. For the com-putation of dσI
n and dσRSn we use Sherpa which provides a
numerical implementation of the Catani-Seymour subtractionscheme. The required tree-level amplitudes are, as in the LOcase, computed with Comix as part of the Sherpa framework.
The necessary one-loop matrix elements for the virtual cor-rections dσV
n are evaluated with the publicly available NJET1
package [1]. NJET uses an on-shell generalized unitarityframework [30–33] to compute multi-parton one-loop prim-itive amplitudes from tree-level building blocks. An accu-rate numerical implementation is achieved using the integrandreduction procedure of OPP [34]. The algorithm is basedon the NGLUON library [11] following the description of D-dimensional generalized unitarity presented in Refs. [35, 36]and using Berends-Giele recursion [37] for efficient numer-ical evaluation of tree-level amplitudes. For a more detaileddescription of the employed methods and the usage of the pro-gram, we refer to Refs. [1, 11]. The scalar loop integrals areobtained via the QCDLOOP/FF PACKAGE [38, 39]. We notethat NJET is so far the only publicly available tool that is ableto compute all one-loop seven-point matrix-elements that con-tribute to five-jet production in hadronic collisions. For refer-ence numerical evaluations of the one-loop matrix elements ata single phase-space point have been presented previously [1].
III. RESULTS FOR 5-JET PRODUCTION AT THE LHC AT7 AND 8 TEV
A. Numerical setup
As mentioned earlier we use the Sherpa Monte-Carlo eventgenerator [26] to handle phase-space integration and gen-eration of tree-level and Catani-Seymour dipole subtractionterms using the colour dressed formalism implemented inComix [27, 28]. The virtual matrix elements are interfacedusing the Binoth Les Houches Accord [40, 41].
To combine partons into jets we use the anti-kt jet clusteringalgorithm as implemented in FASTJET [42, 43]. Furthermoreasymmetric cuts on the jets ordered in transverse momenta,pT , are applied to match the ATLAS multi-jet measurements[7]:
p j1T > 80 GeV, p j≥2
T > 60 GeV, R = 0.4. (6)
The PDFs are accessed through the LHAPDF interface[44] with all central values using NNPDF2.1 [45] for LO(αs(MZ) = 0.119) and NNPDF2.3 [46] for NLO (αs(MZ) =0.118) if not mentioned otherwise.
Generated events are stored in Root Ntuple format [47]which allows for flexible analysis. Renormalization and fac-torization dependence can be re-weighted at the analysis level
1 To download NJET visit the project home page athttps://bitbucket.org/njet/njet/.
as well as the choice of PDF set. Since the event generationof high multiplicity processes at NLO is computationally in-tensive analysis of PDF uncertainties and scale choices wouldbe prohibitive without this technique.
B. Numerical results
In this section we present the numerical results for totalcross sections and selected2 distributions at centre-of-massenergies of 7 and 8 TeV. Within the setup described in theprevious section we have chosen the renormalization and fac-torization scales to be equal µr = µ f = µ and use a dynamicalscale based on the total transverse momentum HT of the finalstate partons:
HT =
Nparton
∑i=1
ppartonT,i . (7)
We then obtain the 5-jet cross section at 7 TeV,
µ σ7TeV-LO5 [nb] σ7TeV-NLO
5 [nb]
HT/2 0.699(0.004) 0.544(0.016)
HT 0.419(0.002) 0.479(0.008)
HT/4 1.228(0.006) 0.367(0.032)
where numerical integration errors are quoted in parentheses.We show the values of the cross section at three values of therenormalization scale, µ = xHT/2 where x = 0.5,1,2. We ob-serve significant reduction in the residual scale dependencewhen including NLO corrections. Within the chosen scaleband, the LO predictions lie within a range of 0.810 nb whileat NLO the range is 0.177 nb. The analagous results at 8 TeVare shown below.
µ σ8TeV-LO5 [nb] σ8TeV-NLO
5 [nb]
HT/2 1.044(0.006) 0.790(0.021)
HT 0.631(0.004) 0.723(0.011)
HT/4 1.814(0.010) 0.477(0.042)
In Fig. 1 the scale dependence of the leading order and next-to-leading order cross section is illustrated. The dashed blackline indicates µ = HT/2. The horizontal bands show the vari-ation of the cross section for a scale variation between HT/4and HT . The uncertainty due to scale variation is roughlyreduced by a factor of one third. Furthermore we see thataround µ = HT/2 the NLO cross section is flat indicating thatµ = HT/2 is a reasonable choice for the central scale. This isfurther supported by the fact that for µ = HT/2 the NLO cor-rections are very small. It is also interesting to observe that
2 The complete set of results presented in this section together with ad-ditional distributions for 7 and 8 TeV can be obtained from https://bitbucket.org/njet/njet/wiki/Results/Physics.

4
0.0 0.5 1.0 1.5 2.0 2.5 3.0 3.5
x, µR = xHT
0
500
1000
1500
σ(p
b)
NJet + Sherpapp→ 5 jet at 7 TeV
LO w/ NLO PDFs
NLO
FIG. 1. Same as Fig. 2 but using the NLO setup in LO.
the two bands, LO and NLO, nicely overlap. Note howeverthat we have used the NLO setup in the leading order calcu-lation. In particular the NLO PDFs with the corresponding αsare employed. In Fig. 2 we show the scale dependence using
0.0 0.5 1.0 1.5 2.0 2.5 3.0 3.5
x, µR = xHT
0
500
1000
1500
σ(p
b)
NJet + Sherpapp→ 5 jet at 7 TeV
LO
NLO
FIG. 2. Residual scale dependence of the 5-jet cross section in lead-ing and next-to-leading order.
in the leading order prediction LO PDFs with the respectiveαs. Compared to Fig. 1 we observe in Fig. 2 a much larger dif-ference between the LO and NLO prediction. To some extendthe difference is due to the change in αs. Similar to what hasbeen found in Ref. [6] we conclude that using the NLO PDFsin the LO predictions gives a better approximation to the fullresult compared to using LO PDFs.
Although not a physical observable it is interesting to askhow the different partonic channels contribute to the inclusive5-jet rate. Ignoring different quark flavours we distinguishnine partonic channels in LO:
gg→ 5g, gg→ qq+3g, qg→ q+4g,qq→ 5g, gg→ 4q+g, qg→ 3q+2g,qq→ qq+3g, qg→ 5q, qq→ 4q+g,
where q may be any quark or anti-quark with exception of thetop-quark i.e. qq = {uu,uu,ud,ud, . . .}. In Tab. I the indi-vidual contribution of each channel is presented. The most
TABLE I. Contribution of individual partonic channels.
qg→ q+4g 39.2%gg→ 5g 27.3%qq→ 2q+3g 13.5%qg→ 3q+2g 9.0%gg→ 2q+3g 8.5%qq→ 4q+g 1.8%gg→ 4q+g 0.5%qg→ 5q 0.2%qq→ 5g 0.04%
important contribution is provided by the qg initial state. Al-most 50% of the cross section can be attributed to this chan-nel. This is a consequence of the large parton luminosity incombination with the sizeable cross sections. Among the qginitiated reactions the qg→ q+4g channel is with about 40%of the cross section the most important process. Replacingthe quark line in this process by a gluon will still lead to largepartonic cross sections. However the gg parton flux is reducedcompared to the qg initial state. As a consequence the purelygluonic reaction leads to a slightly smaller contribution and isresponsible for about 25% of the cross section. The composi-tion of the cross section may provide useful information whenjet rates are used to constrain the PDFs. Since the luminosityfunctions
Li j(s,shad,µ f ) =1
shad
shad∫s
dss
Fi/p
(µ f ,
sshad
)Fj/p
(µ f ,
ss
)(8)
depend on the partonic centre-of-mass energy, the composi-tion may be different for different kinematical configurations.We come back to this point when we discuss differential dis-tributions.
In Tab. II we show for completeness the cross sections fortwo, three and four-jet production as calculated with NJETusing the same setup as in the five jet case. The real correc-tions to five-jet production allow us to calculate also the crosssection for six jet production, however only in leading orderQCD. The result is given by

5
µ σ7TeV-NLO2 [nb] σ7TeV-NLO
3 [nb] σ7TeV-NLO4 [nb]
HT /2 1175(3) 52.5(0.3) 5.65(0.07)
HT 1046(2) 54.4(0.2) 5.36(0.04)
HT /4 1295(4) 33.2(0.4) 3.72(0.12)
TABLE II. Results for two, three and four-jet production with thesame setup as in the five-jet case. All values in units of nb.
µ σ7TeV-LO6 [nb] σ8TeV-LO
6 [nb]
HT/2 0.0496(0.0005) 0.0844(0.0010)
HT 0.0263(0.0003) 0.0452(0.0005)
HT/4 0.0992(0.0011) 0.1673(0.0021)
where the NNPDF2.3 NLO PDF set with αs = 0.118 has beenused. The jet rates have been measured recently by ATLASusing the 7 TeV data set [7]. In Fig. 3 we show the data
102
103
104
105
106
σ(p
b)
NJet + Sherpapp→ jets at 7 TeV
LO
NLOATLAS dataCERN-PH-EP-2011-098
2 3 4 5 6
Inclusive Jet Multiplicity
1
2
The
ory
/da
ta
FIG. 3. Cross sections for 2-, 3-, 4-, 5- and 6-jet production inleading and next-to-leading order as calculated with NJET as wellas results from ATLAS measurements [7]. All LO quantities useNNPDF2.1 with αs(MZ) = 0.119. NLO quantities use NNPDF2.3with αs(MZ) = 0.118, the 6-jet cross section is only avaiable LOaccuracy.
together with the theoretical predictions in leading and next-to-leading order. In case of the six jet rate only LO resultsare shown. In the lower plot the ratio of theoretical predic-tions with respect to data is given. With exception of the twojet cross section the inclusion of the NLO results improvessignificantly the comparison with data. For the higher mul-tiplicities where NLO predictions are available the ratio be-tween theory and data is about 1.2−1.3. Given that inclusive
cross sections are intrinsically difficult to measure we con-sider this agreement as remarkable good. In particular forthree-, four- and five-jet production the theoretical predictionsagree within the uncertainties with the data. One should alsokeep in mind that a one per cent uncertainty of the collider en-ergy may lead to sizeable changes in the cross sections. (Forexample, the inclusive cross section for top-quark pair produc-tion changes by about 3% when the energy is changed from7 TeV to (7±0.07) TeV.) Instead of studying inclusive crosssections it is useful to consider their ratios since many theo-retical and experimental uncertainties (i.e. uncertainties dueto luminosity, scale dependence, PDF dependence etc.) maycancel between numerator and denominator. In particular onemay consider
Rn =σ(n+1)-jet
σn-jet. (9)
This quantity is in leading order proportional to the QCD cou-pling αs and can be used to determine the value of αs fromjet rates. In Fig. 4 we show QCD predictions in NLO using
2 3 4n
0.02
0.06
0.10
0.14
0.18
σn
+1/σ
n
NJet + Sherpapp→ jets at 7 TeV
NNPDF2.3
MSTW2008
ABM11
CT10
ATLAS data
FIG. 4. Theoretical predictions for the jet ratios Rn compared withrecent ATLAS measurements [7]. Theoretical predictions are madewith the central values of the 4 listed PDF sets with NLO αs running.αs(mZ) = 0.118 for NNPDF2.3, CT10 and ABM11 and αs(mZ) =0.120 for MSTW2008
different PDF sets together with the results from ATLAS. Theresults obtained from NNPDF2.3 are also collected in Tab. IIIwhere, in addition, the ratios at leading order (using the LOsetup with NNPDF2.1) are shown. In case of R3 and R4 per-turbation theory seems to provide stable results. The leadingorder and next-to-leading order values differ by less than 10%.In addition NNPDF [46], CT10 [48] and MSTW08 [49] givecompatible predictions. ABM11 [50] gives slightly smaller

6
Rn ATLAS[7] LO NLO
2 0.070+0.007−0.005 0.0925(0.0002) 0.0447(0.0003)
3 0.098+0.006−0.007 0.102(0.000) 0.108(0.002)
4 0.101+0.012−0.011 0.097(0.001) 0.096(0.003)
5 0.123+0.028−0.027 0.102(0.001) −−
TABLE III. Results for the jet ratios Rn for the central scale of HT /2and NNPDF2.3 PDF set.
results for R3 and R4. Within uncertainties the predictions alsoagree with the ATLAS measurements. For R2 a different pic-ture is observed. First of all the theoretical predictions changeby about −50% when going from LO to NLO. The origin ofthis behaviour is traced back to the inclusive two-jet cross sec-tion which is affected by large perturbative corrections. As afunction of the leading jet pT , all PDF sets agree well with the3/2 ratio ATLAS data at large pT as shown in figure Fig. 5. In
100 200 300 400 500 600 700 800
Leading Jet pT [GeV]
0.0
0.2
0.4
0.6
0.8
(dσ
3/dpT
)/(dσ
2/dpT
)
NJet + Sherpa at 7 TeV
LO w/ NLO PDFs NNPDF2.3
LO w/ NLO PDFs MSTW2008
LO w/ NLO PDFs ABM11
LO w/ NLO PDFs CT10
NLO NNPDF2.3
NLO MSTW2008
NLO ABM11
NLO CT10
ATLAS data
FIG. 5. The 3/2 jet ratio as a function of the pT of the leading jet.ATLAS data is taken from [7]. The cuts are given in section III Aexcept the jet cone radius which is taken as R = 0.6.
Fig. 6 we compare LO and NLO predictions for Rn as functionof the leading jet pT . While for R3 and R4 the corrections aremoderate for all values of pT we observe large negative cor-rections independent from pT in case of R2. Most likely thetwo-jet rate is very sensitive to soft gluon emission while thehigher jet multiplicities are less affected. As a consequencethe fixed-order calculations fail to give reliable predictions forthe 2-jet rate. A possible improvement could be expected fromsoft gluon resummation and matching with parton shower cal-
100 200 300 400 500 600 700 800
Leading Jet pT [GeV]
0.2
0.4
0.6
0.8
1.0
1.2
(dσn
+1/dpT
)/(dσn/dpT
)
NJet + Sherpa at 7 TeVLO 3/2
LO 4/3
LO 5/4
NLO 3/2
NLO 4/3
NLO 5/4
FIG. 6. The Rn ratio as a function of the pT of the leading jet.
culations. As long as only fixed-order calculations are used topredict R2 we do not expect a perfect agreement with the data,especially in the low pT region. Similar to what has been ob-served in Fig. 3 the comparison with data shows indeed sig-nificant discrepancy in R2.
Let us now move on to less inclusive quantities. In Fig. 7we show the transverse momentum distribution of the lead-ing jet for five-jet production. Similar to the inclusive quanti-ties a significant reduction of the scale uncertainty is observedwhen going from LO to NLO. Using again the NLO setup tocalculate the LO predictions, the NLO calculation gives verysmall corrections. Over a wide range the LO predictions aremodified by less than 10%. A remarkable feature observedalready in the 4-jet calculation [5, 6] is the almost constantK-factor. Again the dynamical scale seems to re-sum possiblelarge logarithms which would appear at large transverse mo-mentum using a fixed scale. Similar findings apply to trans-verse momentum distribution of the sub-leading jets. In Fig. 8we show the rapidity distribution of the leading jet, again inLO and NLO QCD. In the range −2 < η < 2 the distributionis remarkably flat. Again the NLO corrections are below 10%for most η values and the K-factor is roughly constant. Wehave also investigated differential distributions for a centre-of-mass energy of 8 TeV. Studying normalized distributionsto account for the increase of the inclusive jet cross sectionwhen going from 7 to 8 TeV we find a remarkable agreementbetween the 7 and 8 TeV predictions. As example we presentin Fig. 9 the double-ratio,
1σ7TeV-LO
5
dσ7TeV-LO5dη
/1
σ8TeV-LO5
dσ8TeV-LO5dη
.
7
10−3
10−2
10−1
100
101
dσ/dpT
[pb/G
eV]
NJet + Sherpapp→ 5 jet at 7 TeV
LO w/ NLO PDFs
NLO
100 200 300 400 500 600 700 800 900
Leading jet pT [GeV]
0.0
0.5
1.0
1.5
2.0
FIG. 7. The pT distribution of the leading jet. Both LO and NLO usethe NNPDF2.3 PDF set with αs(MZ) = 0.118
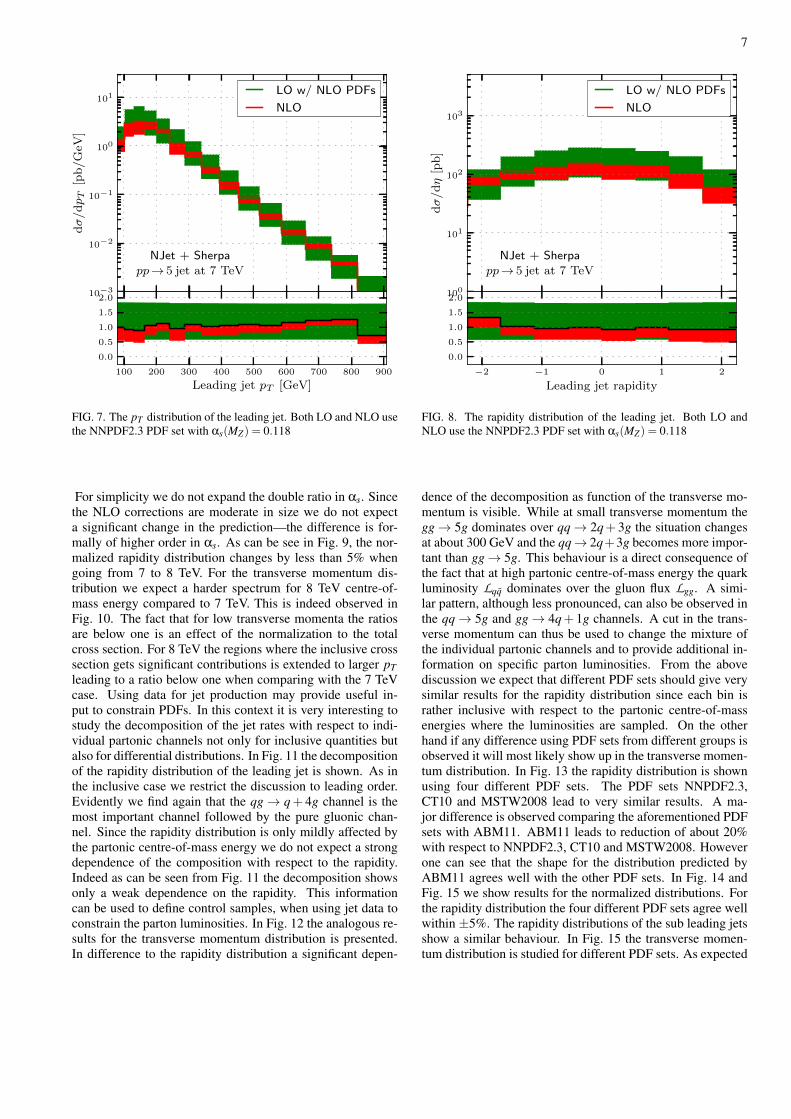
For simplicity we do not expand the double ratio in αs. Sincethe NLO corrections are moderate in size we do not expecta significant change in the prediction—the difference is for-mally of higher order in αs. As can be see in Fig. 9, the nor-malized rapidity distribution changes by less than 5% whengoing from 7 to 8 TeV. For the transverse momentum dis-tribution we expect a harder spectrum for 8 TeV centre-of-mass energy compared to 7 TeV. This is indeed observed inFig. 10. The fact that for low transverse momenta the ratiosare below one is an effect of the normalization to the totalcross section. For 8 TeV the regions where the inclusive crosssection gets significant contributions is extended to larger pTleading to a ratio below one when comparing with the 7 TeVcase. Using data for jet production may provide useful in-put to constrain PDFs. In this context it is very interesting tostudy the decomposition of the jet rates with respect to indi-vidual partonic channels not only for inclusive quantities butalso for differential distributions. In Fig. 11 the decompositionof the rapidity distribution of the leading jet is shown. As inthe inclusive case we restrict the discussion to leading order.Evidently we find again that the qg→ q+ 4g channel is themost important channel followed by the pure gluonic chan-nel. Since the rapidity distribution is only mildly affected bythe partonic centre-of-mass energy we do not expect a strongdependence of the composition with respect to the rapidity.Indeed as can be seen from Fig. 11 the decomposition showsonly a weak dependence on the rapidity. This informationcan be used to define control samples, when using jet data toconstrain the parton luminosities. In Fig. 12 the analogous re-sults for the transverse momentum distribution is presented.In difference to the rapidity distribution a significant depen-
100
101
102
103
dσ/dη
[pb]
NJet + Sherpapp→ 5 jet at 7 TeV
LO w/ NLO PDFs
NLO
−2 −1 0 1 2
Leading jet rapidity
0.0
0.5
1.0
1.5
2.0
FIG. 8. The rapidity distribution of the leading jet. Both LO andNLO use the NNPDF2.3 PDF set with αs(MZ) = 0.118
dence of the decomposition as function of the transverse mo-mentum is visible. While at small transverse momentum thegg→ 5g dominates over qq→ 2q+ 3g the situation changesat about 300 GeV and the qq→ 2q+3g becomes more impor-tant than gg→ 5g. This behaviour is a direct consequence ofthe fact that at high partonic centre-of-mass energy the quarkluminosity Lqq dominates over the gluon flux Lgg. A simi-lar pattern, although less pronounced, can also be observed inthe qq→ 5g and gg→ 4q+ 1g channels. A cut in the trans-verse momentum can thus be used to change the mixture ofthe individual partonic channels and to provide additional in-formation on specific parton luminosities. From the abovediscussion we expect that different PDF sets should give verysimilar results for the rapidity distribution since each bin israther inclusive with respect to the partonic centre-of-massenergies where the luminosities are sampled. On the otherhand if any difference using PDF sets from different groups isobserved it will most likely show up in the transverse momen-tum distribution. In Fig. 13 the rapidity distribution is shownusing four different PDF sets. The PDF sets NNPDF2.3,CT10 and MSTW2008 lead to very similar results. A ma-jor difference is observed comparing the aforementioned PDFsets with ABM11. ABM11 leads to reduction of about 20%with respect to NNPDF2.3, CT10 and MSTW2008. Howeverone can see that the shape for the distribution predicted byABM11 agrees well with the other PDF sets. In Fig. 14 andFig. 15 we show results for the normalized distributions. Forthe rapidity distribution the four different PDF sets agree wellwithin ±5%. The rapidity distributions of the sub leading jetsshow a similar behaviour. In Fig. 15 the transverse momen-tum distribution is studied for different PDF sets. As expected

8
−2 −1 0 1 2
Jet rapidity
0.90
0.95
1.00
1.05
1.10(
1σ
8TeV
5dσ
8TeV
5/dη)/
(1
σ7TeV
5dσ
7TeV
5/dη)
Leading jet
2nd leading jet
3rd leading jet
4th leading jet
5th leading jet
FIG. 9. Comparison of LO rapidity distributions of the pT orderedjets for 7 and 8 TeV
one can observe a richer structure at large transverse momen-tum. While minor differences are visible between ABM11,MSTW08 and NNPDF they still give rather similar results atlarge pT at the level of 10−15%. However the CT10 PDF setleads to significantly larger results at large pT . In the high-est pT bin the normalised cross section is enhanced by about20−30 % compared to ABM11, MSTW08 and NNPDF. Un-fortunately it is not easy to distinguish the different predic-tions experimentally since the cross section for this bin is re-duced by several orders of magnitude. A significant amountof data is thus required to achieve the required statistical sen-sitivity.
IV. CONCLUSIONS
In this article we have presented first results for five-jet pro-duction at NLO accuracy in QCD. We find moderate correc-tions at NLO with respect to a leading order computation us-ing NLO PDFs. Typically corrections of the order of 10%are observed. Identifying renormalization and factorizationscale and using the total transverse momentum HT as dynam-ical scale leads to a flat K-factor for the differential distribu-tions. We have compared theoretical predictions for inclusivejet cross sections and jet rates with data from ATLAS. Withthe exception of quantities affected by the two jet rate we findgood agreement between theory and data. As a major uncer-tainty of the theoretical predictions we have investigated theimpact of using different PDF sets. While for rather inclusivequantities and distributions not sensitive to a specific partoniccentre-of-mass energy good agreement of different sets is ob-
100 200 300 400 500 600 700 800
Jet pT [GeV]
0.8
1.0
1.2
1.4
1.6
1.8
(1
σ8TeV
5dσ
8TeV
5/dpT
)/(
1σ
7TeV
5dσ
7TeV
5/dpT
)
Leading jet
2nd leading jet
3rd leading jet
4th leading jet
5th leading jet
FIG. 10. Comparison of LO pT distributions of the pT ordered jetsfor 7 and 8 TeV
served (in case of distributions this requires to study normal-ized predictions) significant differences are observed in thetransverse momentum distribution of the leading jet at largemomentum.
The analysis of the (n+ 1)/n jet ratios shows that the 4/3and 5/4 predictions appear to be perturbatively more stablethan the 3/2 predictions with modest correction at NLO. Thisindicates that these quantities are good candidates for futureextractions of αs from the LHC data, where reliable fixed or-der predictions are mandatory. We hope the results presentedhere will be useful in these and other analyses in the future.
ACKNOWLEDGEMENTS
This work is supported by the Helmholtz Gemeinschaft un-der contract HA-101 (Alliance Physics at the Terascale), bythe German Research Foundation (DFG) through the tran-sregional collaborative research centre “Computational Par-ticle Physics” (SFB-TR9) and by the European Commissionthrough contract PITN-GA-2010-264564 (LHCPhenoNet).We would also like to thank DESY Zeuthen theory group forproviding computer resources.
Appendix A: Differential distributions for sub-leading jets
In this appendix we present all rapidity and pT distribu-tions for jets ordered in pT . A complete set of histogramsand plots for
√s = 7 and 8 TeV can be obtained from https:
//bitbucket.org/njet/njet/wiki/Results/Physics.
9
−2 −1 0 1 2
Leading Jet Rapidity
10−7
10−6
10−5
10−4
10−3
10−2
10−1
dσ/dpη
[pb
]
qg → q+4g
gg → 5g
qq → 2q+3g
qg → 3q+2g
gg → 2q+3g
qq → 4q+1g
gg → 4q+1g
qg → 5q
qq → 5g
FIG. 11. Contribution of the different partonic channels to the lead-ing jet rapidity distribution.
100 200 300 400 500 600 700 800
Leading Jet pT [GeV]
10−6
10−5
10−4
10−3
dσ/dpT
[pb
/G
eV]
qg → q+4g
gg → 5g
qq → 2q+3g
qg → 3q+2g
gg → 2q+3g
qq → 4q+1g
gg → 4q+1g
qg → 5q
qq → 5g
FIG. 12. Contribution of the different partonic channels to the lead-ing jet pT distribution.
102
dσ/dη
[pb]
NJet + Sherpapp→ 5 jet at 7 TeV
NNPDF23
MSTW2008
ABM11
CT10
−2 −1 0 1 2
1st Leading Jet rapidity
0.75
0.80
0.85
0.90
0.95
1.00
FIG. 13. Comparison of different PDF sets on the rapidity distribu-tions. All sets use αs(MZ) = 0.118. The lower plot shows the ratioof the various PDF sets with respect to NNPDF2.3. Error bars in theupper plot are MC errors while shaded areas in the lower plot arePDF uncertainties.
10−1
100
1 σdσ/dη
NJet + Sherpapp→ 5 jet at 7 TeV
NNPDF23
MSTW2008
ABM11
CT10
−2 −1 0 1 2
1st Leading Jet rapidity
0.90
0.95
1.00
1.05
FIG. 14. Comparison of different PDF sets on the rapidity distribu-tions normalized to the total cross section. The lower plot shows theratio of the various PDF sets with respect to NNPDF2.3. Error barsin the upper plot are MC errors while shaded areas in the lower plotare PDF uncertainties.

10
10−6
10−5
10−4
10−3
10−21 σ
dσ/dpT
[GeV−
1]
NJet + Sherpapp→ 5 jet at 7 TeV
NNPDF23
MSTW2008
ABM11
CT10
100 200 300 400 500 600 700 800 900
1st Leading Jet pT [GeV]
0.90
0.95
1.00
1.05
1.10
1.15
1.20
FIG. 15. Comparison of different PDF sets on the pT distributionsnormalized to the total cross section. The lower plot shows the ratioof the various PDF sets with respect to NNPDF2.3. Error bars in theupper plot are MC errors while shaded areas in the lower plot arePDF uncertainties.
10−3
10−2
10−1
100
101
dσ/dpT
[pb/G
eV]
NJet + Sherpapp→ 5 jet at 7 TeV
LO
NLO
100 200 300 400 500 600 700 800 900
Leading jet pT [GeV]
0.0
0.5
1.0
1.5
2.0
FIG. 16. pT distribution of the leading jet. LO uses NNPDF2.1 withαs(MZ) = 0.119, NLO uses NNPDF2.3 αs(MZ) = 0.118.
10−3
10−2
10−1
100
101
dσ/dpT
[pb/G
eV]
NJet + Sherpapp→ 5 jet at 7 TeV
LO
NLO
100 200 300 400 500 600
2nd leading jet pT [GeV]
0.0
0.5
1.0
1.5
2.0
FIG. 17. pT distribution of the second leading jet.
10−3
10−2
10−1
100
101
dσ/dpT
[pb/G
eV]
NJet + Sherpapp→ 5 jet at 7 TeV
LO
NLO
100 150 200 250 300 350 400
3rd leading jet pT [GeV]
0.0
0.5
1.0
1.5
2.0
FIG. 18. pT distribution of the third leading jet.

11
10−3
10−2
10−1
100
101
dσ/dpT
[pb/G
eV]
NJet + Sherpapp→ 5 jet at 7 TeV
LO
NLO
100 150 200 250 300
4th leading jet pT [GeV]
0.0
0.5
1.0
1.5
2.0
FIG. 19. pT distribution of the fourth leading jet.
10−3
10−2
10−1
100
101
102
dσ/dpT
[pb/G
eV]
NJet + Sherpapp→ 5 jet at 7 TeV
LO
NLO
60 80 100 120 140 160 180 200
5th leading jet pT [GeV]
0.0
0.5
1.0
1.5
2.0
FIG. 20. pT distribution of the fifth leading jet.
100
101
102
103
dσ/dη
[pb]
NJet + Sherpapp→ 5 jet at 7 TeV
LO
NLO
−2 −1 0 1 2
Leading jet rapidity
0.0
0.5
1.0
1.5
2.0
FIG. 21. η distribution of the leading jet. LO uses NNPDF2.1 withαs(MZ) = 0.119, NLO uses NNPDF2.3 αs(MZ) = 0.118.
100
101
102
103
dσ/dη
[pb]
NJet + Sherpapp→ 5 jet at 7 TeV
LO
NLO
−2 −1 0 1 2
2nd leading jet rapidity
0.0
0.5
1.0
1.5
2.0
FIG. 22. η distribution of the second leading jet.

12
100
101
102
103
dσ/dη
[pb]
NJet + Sherpapp→ 5 jet at 7 TeV
LO
NLO
−2 −1 0 1 2
3rd leading jet rapidity
0.0
0.5
1.0
1.5
2.0
FIG. 23. η distribution of the third leading jet.
100
101
102
103
dσ/dη
[pb]
NJet + Sherpapp→ 5 jet at 7 TeV
LO
NLO
−2 −1 0 1 2
4th leading jet rapidity
0.0
0.5
1.0
1.5
2.0
FIG. 24. η distribution of the fourth leading jet.
100
101
102
103
dσ/dη
[pb]
NJet + Sherpapp→ 5 jet at 7 TeV
LO
NLO
−2 −1 0 1 2
5th leading jet rapidity
0.0
0.5
1.0
1.5
2.0
FIG. 25. η distribution of the fifth leading jet.
13
Appendix B: Numerical results for differential distributions
We provide numerical values for the histograms in figures7 and 8 in tables IV and V for ease of future comparisons.
pT1 (GeV) LO (pb) NLO (pb)80.0 — 98.4 21.4 (0.8) 20.6 (6.3)
98.4 — 119.7 56.1 (1.3) 51.0 (7.7)119.7 — 143.9 86.4 (1.4) 76.4 (7.5)143.9 — 171.0 92.1 (1.1) 94.9 (5.4)171.0 — 201.1 82.3 (1.1) 81.9 (4.1)201.1 — 234.0 66.8 (1.1) 73.7 (4.4)234.0 — 269.8 49.7 (0.7) 48.2 (3.5)269.8 — 308.5 35.1 (0.4) 38.8 (2.7)308.5 — 350.2 22.7 (0.3) 23.8 (1.4)350.2 — 394.7 14.2 (0.2) 13.5 (1.1)394.7 — 442.2 8.6 (0.2) 8.1 (0.7)442.2 — 492.5 4.96 (0.10) 6.4 (1.0)492.5 — 545.8 2.81 (0.06) 2.7 (0.3)545.8 — 602.0 1.58 (0.05) 1.9 (0.1)602.0 — 661.1 0.87 (0.03) 1.0 (0.1)661.1 — 723.0 0.50 (0.03) 0.5 (0.1)723.0 — 787.9 0.25 (0.02) 0.36 (0.04)787.9 — 855.7 0.13 (0.01) 0.12 (0.04)855.7 — 926.4 0.065 (0.007) 0.05 (0.02)926.4 — 1000.0 0.029 (0.005) 0.04 (0.01)
TABLE IV. Numerical values for the histograms in figure 7.
η1 (GeV) LO (pb) NLO (pb)−2.8 — (−2.2) 16.5 (1.3) 14.9 (4.5)−2.2 — (−1.7) 36.0 (0.9) 47.9 (6.4)−1.7 — (−1.1) 60.0 (0.9) 61.6 (6.9)−1.1 — (−0.6) 76.1 (0.8) 72.0 (4.3)−0.6 — 0.0 85.6 (0.8) 83.5 (4.3)0.0 — 0.6 84.6 (0.8) 79.1 (5.4)0.6 — 1.1 75.8 (0.8) 74.6 (3.6)1.1 — 1.7 60.8 (1.0) 55.9 (3.7)1.7 — 2.2 36.0 (0.8) 33.0 (3.8)2.2 — 2.8 15.2 (1.1) 21.1 (5.7)
TABLE V. Numerical values for the histograms in figure 8.
[1] S. Badger, B. Biedermann, P. Uwer, and V. Yundin, Com-put.Phys.Commun. 184, 1981 (2013), arXiv:1209.0100 [hep-ph].
[2] W. Giele, E. N. Glover, and D. A. Kosower, Nucl.Phys. B403,633 (1993), arXiv:hep-ph/9302225 [hep-ph].
[3] Z. Nagy, Phys.Rev.Lett. 88, 122003 (2002), arXiv:hep-ph/0110315 [hep-ph].
[4] W. B. Kilgore and W. Giele, Phys.Rev. D55, 7183 (1997),arXiv:hep-ph/9610433 [hep-ph].
[5] Z. Bern, G. Diana, L. Dixon, F. Febres Cordero, S. Hoeche,et al., Phys.Rev.Lett. 109, 042001 (2012), arXiv:1112.3940[hep-ph].
[6] S. Badger, B. Biedermann, P. Uwer, and V. Yundin, Phys.Lett.B718, 965 (2013), arXiv:1209.0098 [hep-ph].
[7] G. Aad et al. (ATLAS Collaboration), Eur.Phys.J. C71, 1763(2011), arXiv:1107.2092 [hep-ex].
[8] S. Alioli, K. Hamilton, P. Nason, C. Oleari, and E. Re, JHEP1104, 081 (2011), arXiv:1012.3380 [hep-ph].
[9] S. Hoeche and M. Schonherr, (2012), arXiv:1208.2815 [hep-ph].
[10] A. G.-D. Ridder, T. Gehrmann, E. Glover, and J. Pires,Phys.Rev.Lett. 110, 162003 (2013), arXiv:1301.7310 [hep-ph].
[11] S. Badger, B. Biedermann, and P. Uwer, Com-put.Phys.Commun. 182, 1674 (2011), arXiv:1011.2900[hep-ph].
[12] V. Hirschi, R. Frederix, S. Frixione, M. V. Garzelli, F. Maltoni,et al., JHEP 1105, 044 (2011), arXiv:1103.0621 [hep-ph].
[13] G. Bevilacqua, M. Czakon, M. Garzelli, A. van Hameren,A. Kardos, et al., (2011), arXiv:1110.1499 [hep-ph].
[14] G. Cullen, N. Greiner, G. Heinrich, G. Luisoni, P. Mastrolia,et al., Eur.Phys.J. C72, 1889 (2012), arXiv:1111.2034 [hep-ph].
[15] F. Cascioli, P. Maierhofer, and S. Pozzorini, Phys.Rev.Lett.108, 111601 (2012), arXiv:1111.5206 [hep-ph].
[16] S. Becker, D. Goetz, C. Reuschle, C. Schwan, and S. Weinzierl,Phys.Rev.Lett. 108, 032005 (2012), arXiv:1111.1733 [hep-ph].
[17] S. Actis, A. Denner, L. Hofer, A. Scharf, and S. Uccirati, JHEP1304, 037 (2013), arXiv:1211.6316 [hep-ph].
[18] G. Bevilacqua and M. Worek, JHEP 1207, 111 (2012),arXiv:1206.3064 [hep-ph].
[19] Z. Bern, L. Dixon, F. Febres Cordero, S. Hoeche, H. Ita, et al.,Phys.Rev. D88, 014025 (2013), arXiv:1304.1253 [hep-ph].
[20] G. Cullen, H. van Deurzen, N. Greiner, G. Luisoni, P. Mastrolia,et al., (2013), arXiv:1307.4737 [hep-ph].
[21] H. van Deurzen, G. Luisoni, P. Mastrolia, E. Mirabella, G. Os-sola, et al., (2013), arXiv:1307.8437 [hep-ph].
[22] T. Gehrmann, N. Greiner, and G. Heinrich, (2013),arXiv:1308.3660 [hep-ph].
[23] J. Alcaraz Maestre et al. (SM AND NLO MULTILEG and SMMC Working Groups), (2012), arXiv:1203.6803 [hep-ph].
14
[24] Z. Bern, L. J. Dixon, D. C. Dunbar, and D. A. Kosower,Nucl.Phys. B425, 217 (1994), arXiv:hep-ph/9403226 [hep-ph].
[25] Z. Bern, L. J. Dixon, D. C. Dunbar, and D. A. Kosower,Nucl.Phys. B435, 59 (1995), arXiv:hep-ph/9409265 [hep-ph].
[26] T. Gleisberg, S. Hoeche, F. Krauss, M. Schonherr, S. Schu-mann, et al., JHEP 0902, 007 (2009), arXiv:0811.4622 [hep-ph].
[27] T. Gleisberg and S. Hoeche, JHEP 0812, 039 (2008),arXiv:0808.3674 [hep-ph].
[28] T. Gleisberg and F. Krauss, Eur.Phys.J. C53, 501 (2008),arXiv:0709.2881 [hep-ph].
[29] S. Catani and M. Seymour, Phys.Lett. B378, 287 (1996),arXiv:hep-ph/9602277 [hep-ph].
[30] R. Britto, F. Cachazo, and B. Feng, Nucl.Phys. B725, 275(2005), arXiv:hep-th/0412103 [hep-th].
[31] R. Ellis, W. Giele, and Z. Kunszt, JHEP 0803, 003 (2008),arXiv:0708.2398 [hep-ph].
[32] D. Forde, Phys.Rev. D75, 125019 (2007), arXiv:0704.1835[hep-ph].
[33] C. Berger, Z. Bern, L. Dixon, F. Febres Cordero, D. Forde,et al., Phys.Rev. D78, 036003 (2008), arXiv:0803.4180 [hep-ph].
[34] G. Ossola, C. G. Papadopoulos, and R. Pittau, Nucl.Phys.B763, 147 (2007), arXiv:hep-ph/0609007 [hep-ph].
[35] W. T. Giele, Z. Kunszt, and K. Melnikov, JHEP 0804, 049(2008), arXiv:0801.2237 [hep-ph].
[36] S. Badger, JHEP 0901, 049 (2009), arXiv:0806.4600 [hep-ph].[37] F. A. Berends and W. T. Giele, Nucl. Phys. B306, 759 (1988).[38] G. van Oldenborgh, Comput.Phys.Commun. 66, 1 (1991).
[39] R. K. Ellis and G. Zanderighi, JHEP 0802, 002 (2008),arXiv:0712.1851 [hep-ph].
[40] T. Binoth, F. Boudjema, G. Dissertori, A. Lazopoulos, A. Den-ner, et al., Comput.Phys.Commun. 181, 1612 (2010), dedi-cated to the memory of, and in tribute to, Thomas Binoth, wholed the effort to develop this proposal for Les Houches 2009,arXiv:1001.1307 [hep-ph].
[41] S. Alioli, S. Badger, J. Bellm, B. Biedermann, F. Boudjema,et al., (2013), arXiv:1308.3462 [hep-ph].
[42] M. Cacciari, G. P. Salam, and G. Soyez, Eur.Phys.J. C72, 1896(2012), arXiv:1111.6097 [hep-ph].
[43] M. Cacciari, G. P. Salam, and G. Soyez, JHEP 0804, 063(2008), arXiv:0802.1189 [hep-ph].
[44] M. Whalley, D. Bourilkov, and R. Group, (2005), arXiv:hep-ph/0508110 [hep-ph].
[45] R. D. Ball et al. (NNPDF Collaboration), Nucl.Phys. B855, 153(2012), arXiv:1107.2652 [hep-ph].
[46] R. D. Ball, V. Bertone, S. Carrazza, C. S. Deans, L. Del Debbio,et al., Nucl.Phys. B867, 244 (2013), arXiv:1207.1303 [hep-ph].
[47] J. Andersen et al. (SM and NLO Multileg Working Group), ,21 (2010), arXiv:1003.1241 [hep-ph].
[48] H.-L. Lai, M. Guzzi, J. Huston, Z. Li, P. M. Nadolsky, et al.,Phys.Rev. D82, 074024 (2010), arXiv:1007.2241 [hep-ph].
[49] A. Martin, W. Stirling, R. Thorne, and G. Watt, Eur.Phys.J.C63, 189 (2009), arXiv:0901.0002 [hep-ph].
[50] S. Alekhin, J. Blumlein, and S. Moch, (2012),arXiv:1202.2281 [hep-ph].


![Corrections d’hadronisation aux jets QCD dans l’algorithme de … · 2014. 6. 18. · 1 .1 Diagrames de Feynman pour une émission à deux gluons avec des boucles[LaTeXDraw].....28](https://img.pdfslide.net/doc/110x75/611184da97740034d017cf96/corrections-dahadronisation-aux-jets-qcd-dans-laalgorithme-de-2014-6-18.jpg)