Embed Size (px)
Citation preview
NEXTGEN TECHNOLOGIES ON THE FAA’S STANDARD TERMINAL AUTOMATION REPLACEMENT SYSTEM
Kevin Witzberger, Harry Swenson, NASA Ames Research Center, Moffett Field, CA Lynne Martin, San Jose State University, San Jose, CA
Melody Lin, Optimal Synthesis, Los Altos, CA Jinn-Hwei Cheng, University of Santa Cruz, CA
Abstract
This paper describes the integration, evaluation, and results from a high-fidelity human-in-the-loop (HITL) simulation of key NASA Air Traffic Management Technology Demonstration – 1 (ATD-1) technologies implemented in an enhanced version of the FAA’s Standard Terminal Automation Replacement System (STARS) platform. These ATD-1 technologies include: (1) a NASA enhanced version of the FAA’s Time-Based Flow Management, (2) a NASA ground-based automation technology known as controller-managed spacing (CMS), and (3) a NASA advanced avionics airborne technology known as flight-deck interval-management (FIM). These ATD-1 technologies have been extensively tested in large-scale HITL simulations using general-purpose workstations to study air transportation technologies. These general-purpose workstations perform multiple functions and are collectively referred to as the Multi-Aircraft Control System (MACS).
Researchers at NASA Ames Research Center and Raytheon collaborated to augment the STARS platform by including CMS and FIM advisory tools to validate the feasibility of integrating these automation enhancements into the current FAA automation infrastructure. NASA Ames acquired three STARS terminal controller workstations, and then integrated the ATD-1 technologies. HITL simulations were conducted to evaluate the ATD-1 technologies when using the STARS platform. These results were compared with the results obtained when the ATD-1 technologies were tested in the MACS environment. Results collected from the numerical data show acceptably minor differences, and, together with the subjective controller questionnaires showing a trend towards preferring STARS, validate the ATD-1/STARS integration.
Introduction Future air traffic demand is expected to increase
throughout the U.S. National Airspace System [1]. To meet this expected increased demand, the FAA, in collaboration with NASA and industry partners, is transforming the airspace system with the Next Generation Air Transportation System (NextGen) [2]. NextGen is expected to increase capacity, and improve efficiency and safety. Because NextGen addresses all phases in the air traffic system from the departure, through the climb, cruise, descent and arrival phases of flight, the capabilities are broad. They include, for example, airport surface management improvements [3], automatic dependent surveillance-broadcast (ADS-B) [4], performance-based navigation (PBN) [5], and modernizing ground-based automation systems [6,7].
NASA’s Air Traffic Management Technology Demonstration – 1 (ATD-1) [8] is one such FAA/NASA/industry partner collaboration. ATD-1 technologies will be transferred to the FAA upon achieving the appropriate technology maturity. At NASA, the maturity of a technology is measured with technology readiness levels (TRLs) [9]. Generally, NASA technology is transferable after achieving TRL 6. For the ATD-1 technologies, currently at TRL 5, this transfer represents the transition from laboratory test environments to an operational environment [10]. To aid the FAA in its near-term investment decisions, a series of preliminary technology transfers began in October 2013 [11]. A one-time, NASA-FAA simulation, called the Operational Integration Assessment (OIA), at the FAA’s William J. Hughes Technical Center (WJHTC), is planned to start in 2015.
ATD-1 integrates three separate NASA developed technologies that are expected to improve operations in the terminal airspace. These NASA
technologies include: (1) an enhanced version of the FAA’s Time-Based Flow Management (TBFM) [7,12,13], (2) a ground-based automation technology known as controller-managed spacing (CMS) [14-16], and (3) an advanced avionics airborne technology known as flight-deck interval-management (FIM) [17-19]. ATD-1 technologies have been extensively tested in large-scale HITL simulations [20-27] using general-purpose workstations, collectively referred to as the Multi-Aircraft Control System (MACS) [28,29], to study air transportation technologies. MACS performs multiple functions, including emulating the FAA’s Standard Terminal Automation Replacement System (STARS) [30] radar display.
In order to be operationally viable, ATD-1 technologies required extending the capabilities of the Raytheon-developed STARS platform to display certain ATD-1 technologies (exactly which technologies will be discussed later) to the terminal radar approach control (TRACON) controllers (hereafter referred to as terminal controllers) on terminal controller workstations (TCWs). Beginning in 2012, researchers at NASA Ames Research Center (NASA Ames) and Raytheon collaborated to augment the STARS platform by including CMS and FIM advisory tools to validate the feasibility of integrating these automation enhancements into the current FAA automation infrastructure. In the spring of 2013, NASA Ames acquired three STARS TCWs, and then integrated the ATD-1 technologies. CMS algorithms were added to the NASA enhanced version of the FAA’s TBFM, and the advisories displayed on the STARS TCWs.
The objective of this paper is to describe the validation of the ATD-1/STARS integration. HITL simulations were conducted in the summer of 2013 to evaluate the performance and acceptability of the integrated ATD-1 technologies within the STARS platform. These results were compared with the results obtained when the ATD-1 technologies were tested using MACS to emulate the STARS radar displays for the terminal controllers.
The integration of the ATD-1 technologies within the STARS architecture represented a major technology maturation milestone and is a necessary and critical step prior to operational testing at WJHTC.
This paper is organized as follows: an overview of the ATD-1 concept of operations and technologies is provided next, followed by an overview of the STARS platform. Then, the various components of the simulation are summarized, and the results discussed. The paper ends with concluding remarks and planned future work.
ATD-1 Integrated Arrival Scheduling and Spacing Concept
The ATD-1 portfolio includes three distinct technologies that provide an integrated arrival concept [31] for scheduling, sequencing, and spacing. The first technology leverages the FAA’s TBFM [7], the successor to the Traffic Management Advisor (TMA) [12,13] and extends it to include terminal metering (TMA-TM) [32] for conflict-free schedules to the runway and TRACON metering points. The second technology, CMS, provides a set of decision support tools for terminal controllers to better manage aircraft delay using speed control. Airborne relative spacing is achieved with the third ATD-1 technology, FIM.
The integration of these three technologies enables an integrated arrival and spacing system with the following concept of operations. Beginning in air route traffic control center (ARTCC) airspace, prior to an aircraft’s top-of-descent (TOD) and about 200 nautical miles (NM) from the runway, four dimensional (4D) trajectory predictions, so-called due to 3D position and time, determine the aircraft’s arrival sequence and conflict-free scheduled times-of-arrival (STAs) at the TRACON boundary (usually the meter fix), meter points within the TRACON and the runway. The arrival sequence and STAs (referred to as the schedule) are frozen at about 130 NM from the meter fix and displayed to the ARTCC controllers (hereafter referred to as center controllers). The center controllers employ various tactical control strategies (e.g. speed and path assignments) to deliver the aircraft to the meter fix at or near its meter fix STA. Aircraft equipped with FIM avionics are issued a voice FIM clearance by the center controllers and begin automatically spacing (via speed control) behind a designated lead aircraft. Center controllers transfer responsibility of (hand-off) the aircraft to the terminal controllers prior to the meter fix. Terminal controllers make use of the CMS advisories and issue
speed clearances to non-FIM equipped aircraft as required to adjust for any minor perturbations.
TMA-TM and CMS are ground-based automation tools and when integrated together as a system have been evaluated in several HITL simulations and shown to have benefits in terms of increased throughput, decreased controller workload, and improved PBN operations [20-27]. The TMA-TM/CMS system is commonly called Terminal Area Precision Scheduling and Spacing (TAPSS) [21-25] in NASA parlance, and Terminal Sequencing and
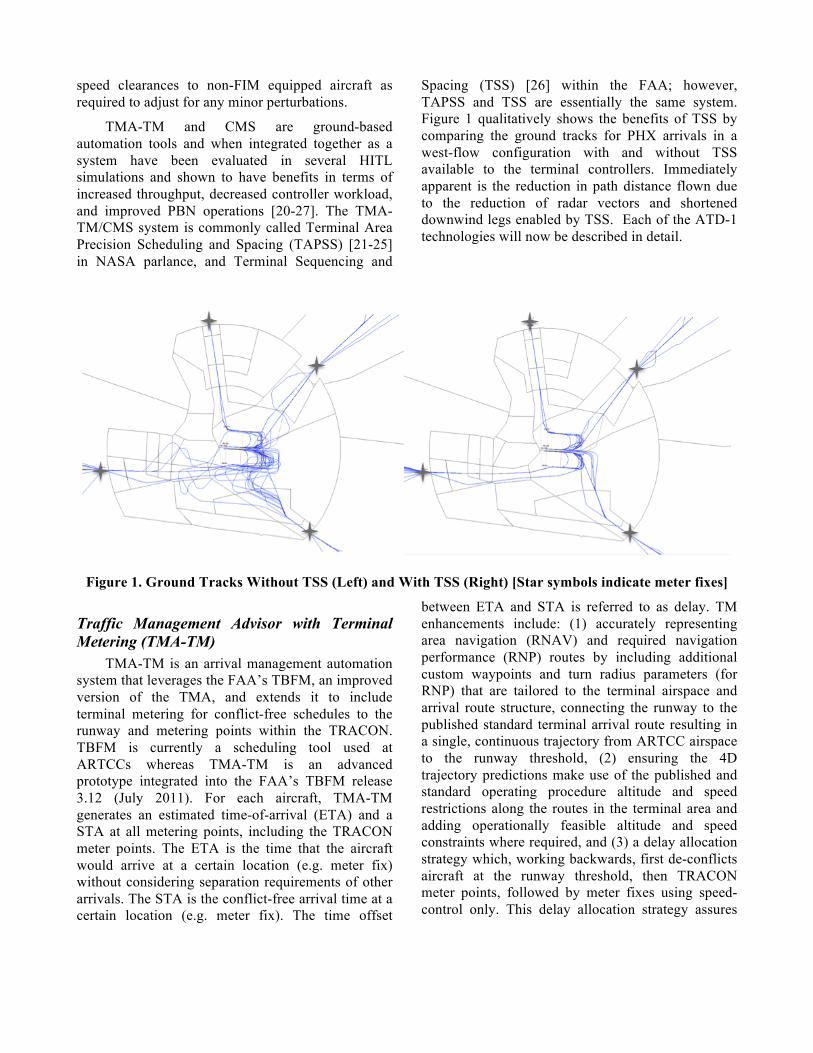
Spacing (TSS) [26] within the FAA; however, TAPSS and TSS are essentially the same system. Figure 1 qualitatively shows the benefits of TSS by comparing the ground tracks for PHX arrivals in a west-flow configuration with and without TSS available to the terminal controllers. Immediately apparent is the reduction in path distance flown due to the reduction of radar vectors and shortened downwind legs enabled by TSS. Each of the ATD-1 technologies will now be described in detail.
Figure 1. Ground Tracks Without TSS (Left) and With TSS (Right) [Star symbols indicate meter fixes]
Traffic Management Advisor with Terminal Metering (TMA-TM)
TMA-TM is an arrival management automation system that leverages the FAA’s TBFM, an improved version of the TMA, and extends it to include terminal metering for conflict-free schedules to the runway and metering points within the TRACON. TBFM is currently a scheduling tool used at ARTCCs whereas TMA-TM is an advanced prototype integrated into the FAA’s TBFM release 3.12 (July 2011). For each aircraft, TMA-TM generates an estimated time-of-arrival (ETA) and a STA at all metering points, including the TRACON meter points. The ETA is the time that the aircraft would arrive at a certain location (e.g. meter fix) without considering separation requirements of other arrivals. The STA is the conflict-free arrival time at a certain location (e.g. meter fix). The time offset
between ETA and STA is referred to as delay. TM enhancements include: (1) accurately representing area navigation (RNAV) and required navigation performance (RNP) routes by including additional custom waypoints and turn radius parameters (for RNP) that are tailored to the terminal airspace and arrival route structure, connecting the runway to the published standard terminal arrival route resulting in a single, continuous trajectory from ARTCC airspace to the runway threshold, (2) ensuring the 4D trajectory predictions make use of the published and standard operating procedure altitude and speed restrictions along the routes in the terminal area and adding operationally feasible altitude and speed constraints where required, and (3) a delay allocation strategy which, working backwards, first de-conflicts aircraft at the runway threshold, then TRACON meter points, followed by meter fixes using speed-control only. This delay allocation strategy assures
that the STAs can be met with speed reductions, not speed increases. Depending on the airspace topology and aircraft type, aircraft can absorb up to about two minutes of delay within the terminal area using only speed-control; any remaining delay will not be taken as TRACON vectors, but rather will need to be absorbed by the ARTCC.
Controller-Managed Spacing (CMS) Advisory Tools
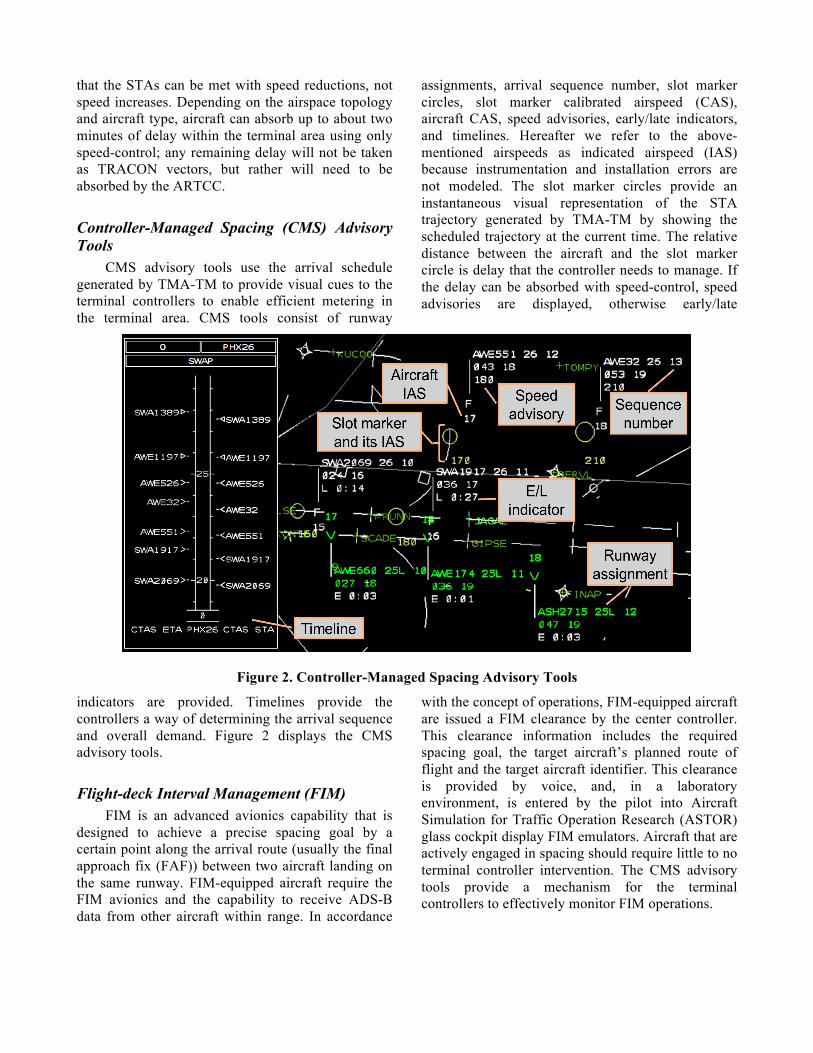
CMS advisory tools use the arrival schedule generated by TMA-TM to provide visual cues to the terminal controllers to enable efficient metering in the terminal area. CMS tools consist of runway
assignments, arrival sequence number, slot marker circles, slot marker calibrated airspeed (CAS), aircraft CAS, speed advisories, early/late indicators, and timelines. Hereafter we refer to the above-mentioned airspeeds as indicated airspeed (IAS) because instrumentation and installation errors are not modeled. The slot marker circles provide an instantaneous visual representation of the STA trajectory generated by TMA-TM by showing the scheduled trajectory at the current time. The relative distance between the aircraft and the slot marker circle is delay that the controller needs to manage. If the delay can be absorbed with speed-control, speed advisories are displayed, otherwise early/late
! Figure 2. Controller-Managed Spacing Advisory Tools
indicators are provided. Timelines provide the controllers a way of determining the arrival sequence and overall demand. Figure 2 displays the CMS advisory tools.
Flight-deck Interval Management (FIM) FIM is an advanced avionics capability that is
designed to achieve a precise spacing goal by a certain point along the arrival route (usually the final approach fix (FAF)) between two aircraft landing on the same runway. FIM-equipped aircraft require the FIM avionics and the capability to receive ADS-B data from other aircraft within range. In accordance
with the concept of operations, FIM-equipped aircraft are issued a FIM clearance by the center controller. This clearance information includes the required spacing goal, the target aircraft’s planned route of flight and the target aircraft identifier. This clearance is provided by voice, and, in a laboratory environment, is entered by the pilot into Aircraft Simulation for Traffic Operation Research (ASTOR) glass cockpit display FIM emulators. Aircraft that are actively engaged in spacing should require little to no terminal controller intervention. The CMS advisory tools provide a mechanism for the terminal controllers to effectively monitor FIM operations.
Multi-Aircraft Control System (MACS) MACS is real-time air traffic control (ATC)
simulation platform. Although it is not an ATD-1 technology itself, it is critical to the integration and evaluation of the ATD-1 technologies used in HITL simulations. MACS simulates long and short-range surveillance radar and provides realistic ARTCC and TRACON radar display emulators for ATC. For non-FIM aircraft, cockpit displays are emulated through desktop display monitors for the pilot simulation participants. Simulation manager user interfaces are provided for monitoring and control of the simulation. A MACS-based simulation begins with the generation of flight plans for each aircraft; these flight-plans use the aircraft’s initial location and scenario start time as the coordination fix and time, respectively, as well as the appropriate flight routing, altitude, and speed.
Standard Terminal Automation Replacement System (STARS)
Raytheon-developed STARS replaces older, outdated, hardware/software in the TRACON facilities and is currently being deployed through the FAA’s TAMR program [6]. Controllers interface with STARS through the TCWs. STARS offers several enhancements over the older systems: a key one being the improved capability of receiving and fusing tracks from multiple short- and long-range radars, and ADS-B, into a single, smooth one-second aircraft track update that is displayed to the controllers. STARS has two variants tailored to the size of the facility. A Local Integrated Terminal Equipment system (STARS-LITE) is intended for control towers without a TRACON. The second variant, Enhanced LITE (STARS-ELITE), is planned to be installed at small and medium size TRACON facilities. STARS-ELITE offers much of the same functionality and associated software as STARS, but with a smaller hardware footprint.
NASA Ames Research Center’s Prototype Enhanced LITE STARS (STARS-ELITE)
Beginning in 2012, engineers at NASA Ames and Raytheon collaborated on extending the STARS capabilities to display the CMS advisory tools on the TCWs. Early basic prototypes were designed and tested at Raytheon’s Mt. Laurel, New Jersey facility.
In the spring of 2013, the ATC laboratory at NASA Ames acquired a STARS-ELITE that consisted of three TCWs for terminal controllers and the software development environment (SDE) for STARS adaptation and software development. At the present time, the ATC lab is one of four sites with the SDE (the other three are Raytheon’s Marlborough, MA and Mt. Laurel, NJ sites and the FAA’s WJHTC) and one of three sites with the STARS-ELITE (the other two sites are McGuire Air Force Base, NJ and the FAA’s WJHTC).
To facilitate HITL simulations in the ATC lab, all the relevant systems were integrated: TMA-TM (scheduling and spacing), three ASTOR stations (FIM operations), CMS (advisory tools for terminal controller), three STARS-ELITE TCWs (displays CMS tools), and MACS (radar simulator, additional controller/pilot display emulators and traffic generator). Several system functional tests culminated in a week of HITL simulations. This HITL simulation used a prototype STARS-ELITE that had not yet implemented the assigned runways and sequence numbers of the CMS advisory toolset. Hereafter, for simplicity, we dispense with the distinction between STARS and STARS-ELITE, and just use the term STARS.
Human-in-the-loop (HITL) Simulation Overview
Nineteen one-hour HITL simulations (hereafter referred to as simulation runs or just runs for short) were conducted over the course of one week. The objective was to validate the performance and acceptability of using an advanced prototype operational ATC system (STARS) to display CMS advisories. FIM clearances were not issued during the runs because the newest speed control law algorithm, Airborne Spacing for Terminal Arrival Routes (ASTAR12) [33], was still in development. All previous ATD-1 HITL simulations had used the MACS platform to emulate the STARS display scope, thus the approach used in the validation (described in more detail in the Validation Strategy section) was to compare and contrast performance of the newly integrated STARS with the MACS STARS emulation.
Airspace Albuquerque ARTCC (ZAB) and Phoenix
TRACON (P50) are the primary facilities responsible for controlling aircraft arriving at PHX. The ATC laboratory at NASA Ames was configured to model simplified ZAB and P50 airspace. ZAB airspace was simplified by combining high and low altitude of the primary arrival sectors for four arrival directions. P50 airspace was modeled as a primary feeder and final sector: two sectors for the south and two for the north. Most aircraft entered P50 through one of the four arrival procedures: EAGUL5 and MAIER5 for the aircraft entering from the north and GEELA6 and KOOLY4 for aircraft entering from the south. PHX was configured for East Operations, with aircraft landing on runways 07R and 08.
All simulation runs, with one exception (discussed later), conducted independent arrival runway operations with aircraft flying instrument flight rules (IFR) flight plans; thus, terminal controllers were responsible for separation and clearances to the runway. Due to the predominance of good weather in PHX, operations are primarily visual flight rules (VFR) for independent runway operations and the pilots are responsible for separation once they have been cleared for approach and have their lead aircraft in sight; however, this is not practical in a laboratory. Reference [34] provides the PHX airport arrival rate (AAR) guidelines under various operational conditions (i.e. airport weather condition and runway configuration). The AAR for an east-flow configuration using VFR for two runways is 74 aircraft per hour. In actual PHX operations, aircraft flying IFR landing on two (dependent) runways are required to use staggered instrument landing system (ILS) approaches, reducing the AAR to 48-52 aircraft per hour. The last simulation run conducted staggered ILS approaches.
Large and heavy jets flew on the published standard RNAV routes; turboprops and small jets aircraft flew on non-RNAV arrival routes. Nominally, aircraft from the north are assigned to the northern most runway and aircraft from the south are assigned to the southern most runway. TMA-TM employs a runway-balancing algorithm to minimize system delay, potentially assigning some aircraft from the north to runway 07R (the southern runway) and arriving aircraft from the south to runway 08 (the northern runway). Most of these “crossover” aircraft
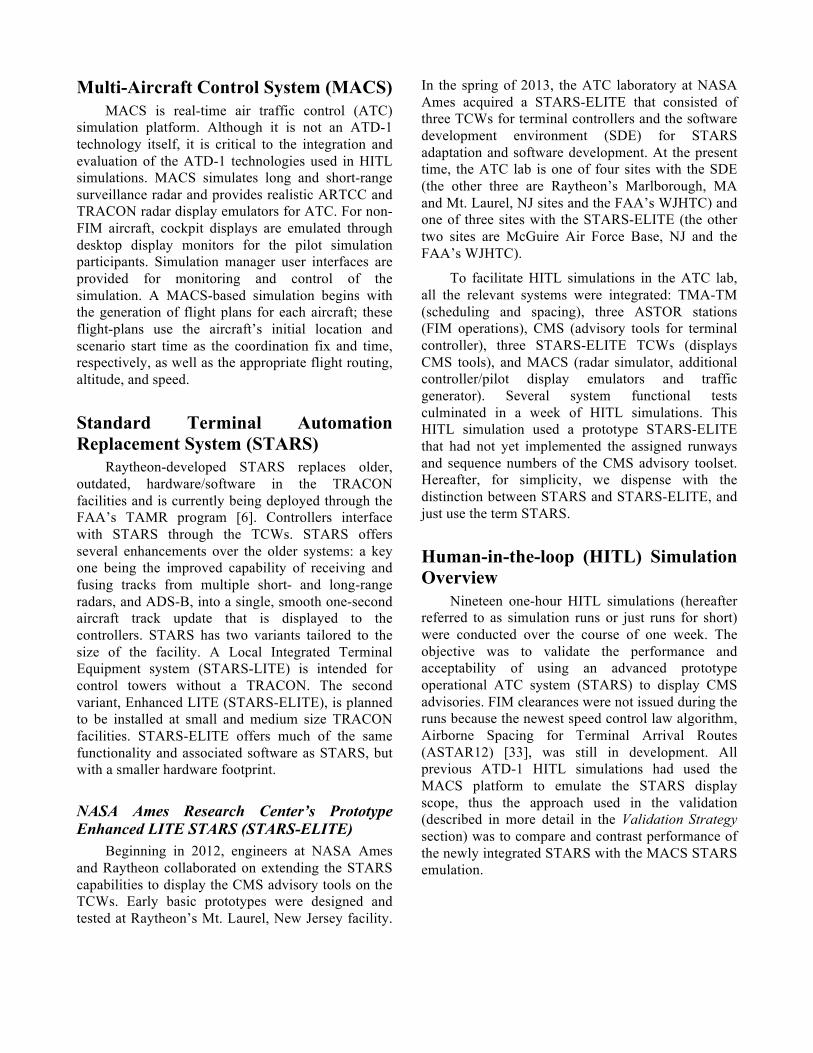
will need to cross over the airport (hence the term “crossover”) to land on their assigned runways; therefore, crossover routes were also designed with the assistance of P50 subject matter experts for RNAV and non-RNAV routes. The crossover routes were altitude separated (1,000 feet) to safely accommodate simultaneous north-to-south and south-to-north crossovers. Figure 3 shows a schematic of the P50 airspace model just described.
Figure 3. Modeled P50 Airspace—East Arrival Configuration
The RNAV route from the north, known as the MAIER5, is connected to the final approach course. The RNAV route from the northeast, called the EAGUL5, ends at a fix called BASBL; thus, ATC issues radar vectors for those EAGUL5 aircraft traveling on the downwind leg to turn to base well before BASBL. The RNAV route in the southwest, called GEELA6, is also connected to the final approach course. Aircraft flying on the KOOLY4 RNAV arrival from the southeast, similar to the EAGUL5, also require radar vectors to turn the aircraft from downwind to base well before NEELE. Aircraft equipped with avionics that monitor RNAV performance, known as RNP, were not included in this HITL simulation to limit the experimental complexity, but TSS does support RNP procedures and capabilities. Black dashed lines represent the RNAV crossover routes with an arrow indicating the direction of travel. For clarity, non-RNAV routes for turboprop and non-RNAV equipped aircraft are not shown. Luke Air Force Base operates in the
northwest region (to the west of BASBL) and its airspace is restricted, resulting in the irregular shape of the TRACON seen in the northwest of P50 between GEELA6 and MAIER5. Call-out symbols (e.g. Freeway, Quartz, etc.) denote the airspace sector name. The four meter fixes (GEELA, BRUSR, HOMRR, and SQUEZ) are also shown.
Scenarios Two different traffic scenarios were simulated.
The first scenario, referred to as east-flow #1 (EF1), was a snapshot of a 70-minute arrival rush period into PHX during 28 December 2011 simulating 50 arrivals including one turboprop aircraft. The second scenario was a higher demand scenario simulating 54 arrivals, six of which were turboprops, in a 60-minute period that is referred to as east-flow #2 (EF2). Four sets of winds were selected from a recent P50 wind analysis [35] that made use of nearly 8,700 one-hour, 40-km grid rapid update cycle (RUC) forecasts from 2011 [36]. The analysis binned the wind patterns according to their effect on flight time changes for turbojets on the four standard terminal arrival/RNAV routes and the magnitude of the headwinds on final approach. For simplicity, these winds are referred to ‘A’, ‘B’, ‘C’, and ‘D’ winds. EF1 made use of the ‘C’ and ‘D’ winds, whereas EF2 alternated between the ‘A’ and ‘B’ winds. The result was two traffic scenarios each with two different wind topologies. The wind field that the aircraft simulated flying through (the environmental winds) was a variant of the RUC forecast winds used by the scheduler (i.e. TMA-TM) to model the realistic wind speed and direction differences (within expected operational limits) between the forecast and actual winds.
Participants Thirteen pilots and eight controllers staffed 21
positions. Three of the thirteen pilot positions were ASTOR pilot workstations, each simulating a B757 aircraft. The other ten pilots staffed workstations using MACS generic cockpit display emulators; each pilot was responsible for entering heading/speed commands, as instructed by ATC, for several aircraft. Four retired center controllers, with an average of 26 years of experience, staffed the four ZAB airspace sectors. Two of the center controllers were recently retired ZAB controllers. Four retired terminal controllers, averaging 30 years of experience, staffed
the four TRACON positions that were configured as two feeder and two final positions. The QUARTZ/VERDE feeder/final pair controlled air traffic in the southern region of P50 and the APACHE/FREEWAY feeder/final pair was responsible for the northern half of P50 (see Fig. 3). All four terminal controllers who participated in the data collection HITL simulations were retired from the Southern California TRACON. Two of them were last-minute replacements for retired P50 controllers that were expected to, but could not, participate in the data collection HITL simulations. Three of the four terminal controllers had familiarity with CMS advisory tools, P50 airspace, and STARS from past HITL simulations. The fourth controller was new to CMS advisory tools, P50 airspace, and STARS; he received limited training during the first couple of simulation runs, and was considered reasonably trained by his peer controllers for this operation.
Controller and Pilot Procedures Controllers and pilots used headsets with a built-
in microphone to communicate on designated frequencies. Center controllers’ responsibilities included delivering the aircraft to the meter fix at or near its STA, keeping the aircraft safely separated, and issuing the expected runway assignments provided by TMA-TM. Center controllers issued optimized profile descent clearances (the phraseology is “DESCEND VIA”) for the turbojet aircraft that use the standard terminal arrival/RNAV routes. For turboprops, the center controllers issued routing, speeds, and altitude. Prior to the aircraft crossing the TRACON boundary, the center controllers handed-off aircraft, via keyboard entries into the MACS ARTCC display system replacement desktop emulators, to the south or north terminal feeder controller. The CMS advisory tools were available for the terminal controllers to efficiently manage the traffic from center hand-off to the runway threshold. Additions made to the flight data-block (FDB) included displaying the CMS speed advisory or an early/late indicator in seconds. Feeder controllers made use of the timelines to strategically assess aircraft sequence information because the sequence number algorithm was not yet implemented in the STARS prototype. To avoid clutter, timelines were not displayed on the final controllers scope. The feeder controllers used the P50 general guidelines
that aircraft arriving from the north would land on the north runway (08) and aircraft in the south would land on the south runway (07R). Aircraft that required crossing over the top of the airport (crossovers) were identified after the schedule was frozen and pointed out to the feeder controllers for proper coordination by a runway coordinator position. Feeder controllers handed-off aircraft to the final controllers prior to aircraft entering the final controller’s designated airspace. The final controllers were responsible for safely merging the aircraft for the final approach to the runway. They issued heading clearances to the pilots to turn the aircraft from the downwind leg onto base and then from base to final. The pilot participants entered the ATC clearances into the graphical user interfaces on the desktop displays and verified the routing and assigned runway. Pilot participants at MACS stations were each responsible for multiple aircraft whereas pilots at ASTOR stations were each responsible for just a single aircraft.
Validation Strategy To validate the performance and acceptability of
CMS advisory tools displayed on STARS, roughly half of the simulation runs made use of the STARS and the other half used MACS for the TRACON radar display, enabling straightforward performance and acceptability comparisons. Terminal controller participants have used MACS in many past HITL simulations, so its performance and acceptability are known and documented [23-30]. The three STARS TCWs were configured as QUARTZ (south feeder), VERDE (south final), and FREEWAY (north final). These TCWs were physically located side-by-side in the ATC laboratory in that order, from left to right. The fourth TRACON position, APACHE (north feeder), was a MACS station and was located to the right of FREEWAY. Located to the right of APACHE were three more MACS stations configured as (in this order): FREEWAY, VERDE, and QUARTZ. The terminal controller working APACHE sat at the same physical location for every simulation run. The other three terminal controllers each were responsible for the same separate airspace for each run, but sat at different physical locations depending on which TRACON radar scope was utilized (STARS or MACS). Prior to the first simulation run, information displayed to the terminal controllers on the MACS screens was customized to
exactly match the displays on the STARS (e.g. the aircraft’s FDB). Each station’s display settings, including the CMS advisories, remained fixed throughout all of the simulation runs.
Test Conditions To keep the participants stimulated, traffic and
winds were varied between simulation runs. For terminal controllers, the display scope (i.e. the station) was varied as part of the validation strategy. Each traffic scenario was paired with two different wind fields, resulting in four unique simulation runs on each TRACON display scope and repeated twice, resulting in eight simulation runs per station, as summarized in Table 1.
Table 1. Test Matrix
TRACON Scope
Number of Scenarios
(Traffic_Wind Type)
Minimum Number of Runs
STARS 4 (EF1_C, EF1_D, EF2_A, EF2_B)
8
MACS 4 (EF1_C, EF1_D, EF2_A, EF2_B)
8
Data Collection A total of 19 runs were conducted over five
days. The test conditions were varied in such a way that ensured that no two successive simulation runs had the same test conditions, and, that over the course of five days, the test conditions remained balanced. The four scenarios per station shown in Table 1 were repeated accounting for the first 16 runs (4 scenarios x 2 stations x 2 runs). The last three runs used STARS exclusively for additional experimentation and were not critical to the validation of STARS displaying CMS advisory tools, but are included in the results. Two of the last three simulation runs performed advanced STARS prototyping with a de-clutter mode feature, so-called because it turned off the CMS advisories for the last five minutes of flight (about the last 10 NM). The last run simulated IFR using staggered ILS approaches. Output log files and voice recordings were captured for all 19 runs. Terminal controllers filled out questionnaires after
each run and a separate end-of-simulation questionnaire at the end of week. As previously discussed in the HITL Simulation Overview section, FIM operations were not conducted; therefore, the results do not include FIM-specific metrics.
Results The results compare performance and terminal
controller feedback as a function of TRACON display scope (STARS versus MACS). Because one terminal controller was always stationed at a MACS position (APACHE), this participant’s responses to the questionnaires are excluded in the controller feedback section.
MACS and STARS Performance Comparisons Data generated from simulation runs when three
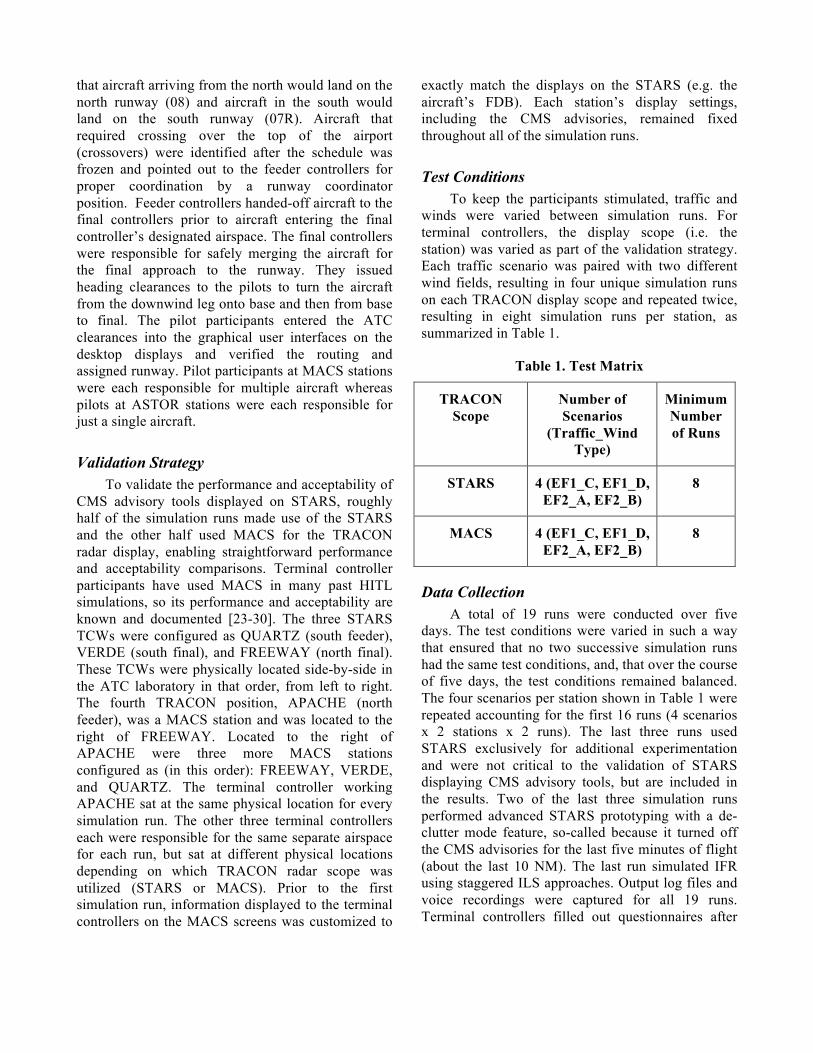
of the four terminal controllers used STARS stations are compared to data from when the same three controllers used MACS stations. Key metrics are compared for each simulation run and in the aggregate; the following plots display the aggregate results. The success rate for PBN measures the percentage of uninterrupted RNAV arrival procedures. A RNAV arrival procedure is considered uninterrupted if no radar heading vectors are given by ATC between the meter fix and the end of the RNAV procedure (turn to base for aircraft on EAGUL5 and KOOLY4 routes). The success rate ranged from 91 to 100%. The average PBN success rate based on terminal workstation (STARS or MACS) utilized during a particular run is shown in Fig. 4.
Figure 4. Average PBN Success Rate
Both averages are high—above 95%. The average for the MACS stations is 2% greater than the STARS, and is minor.
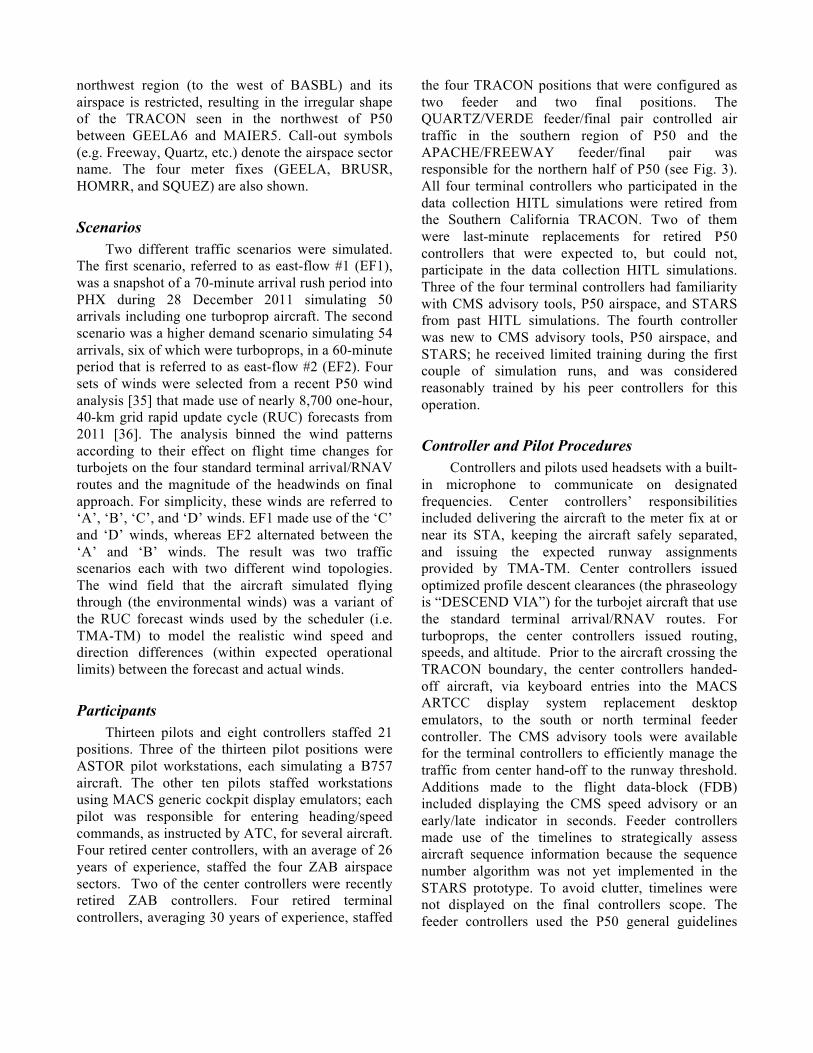
Whereas PBN success rate focuses on radar heading vectors issued to RNAV arrivals, ATC issues other types of clearances as needed such as speed and altitude. The average number of these three clearances (heading, speed, and altitude) for all flights (RNAV and non-RNAV) ranged from four to six clearances inside the terminal area. Figure 5 compares the average number of clearances for STARS and MACS and shows roughly the same average number of clearances (five) were required.
Figure 5. Average Number of Clearances Issued in TRACON
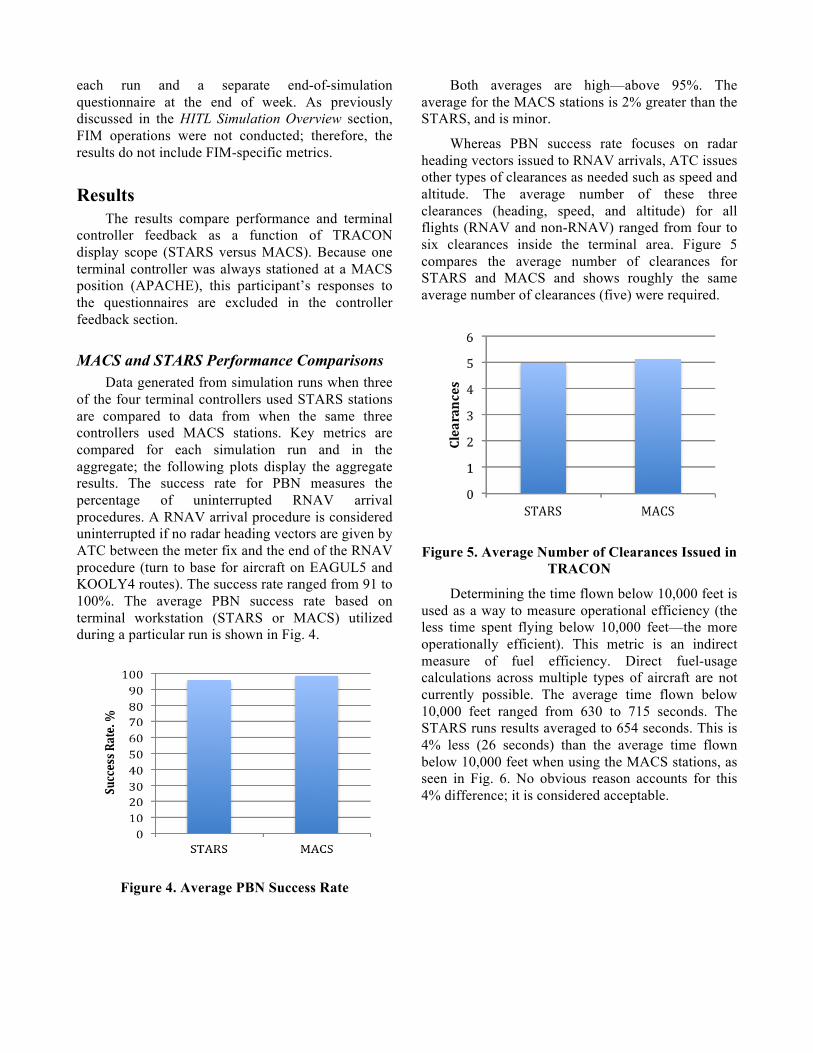
Determining the time flown below 10,000 feet is used as a way to measure operational efficiency (the less time spent flying below 10,000 feet—the more operationally efficient). This metric is an indirect measure of fuel efficiency. Direct fuel-usage calculations across multiple types of aircraft are not currently possible. The average time flown below 10,000 feet ranged from 630 to 715 seconds. The STARS runs results averaged to 654 seconds. This is 4% less (26 seconds) than the average time flown below 10,000 feet when using the MACS stations, as seen in Fig. 6. No obvious reason accounts for this 4% difference; it is considered acceptable.
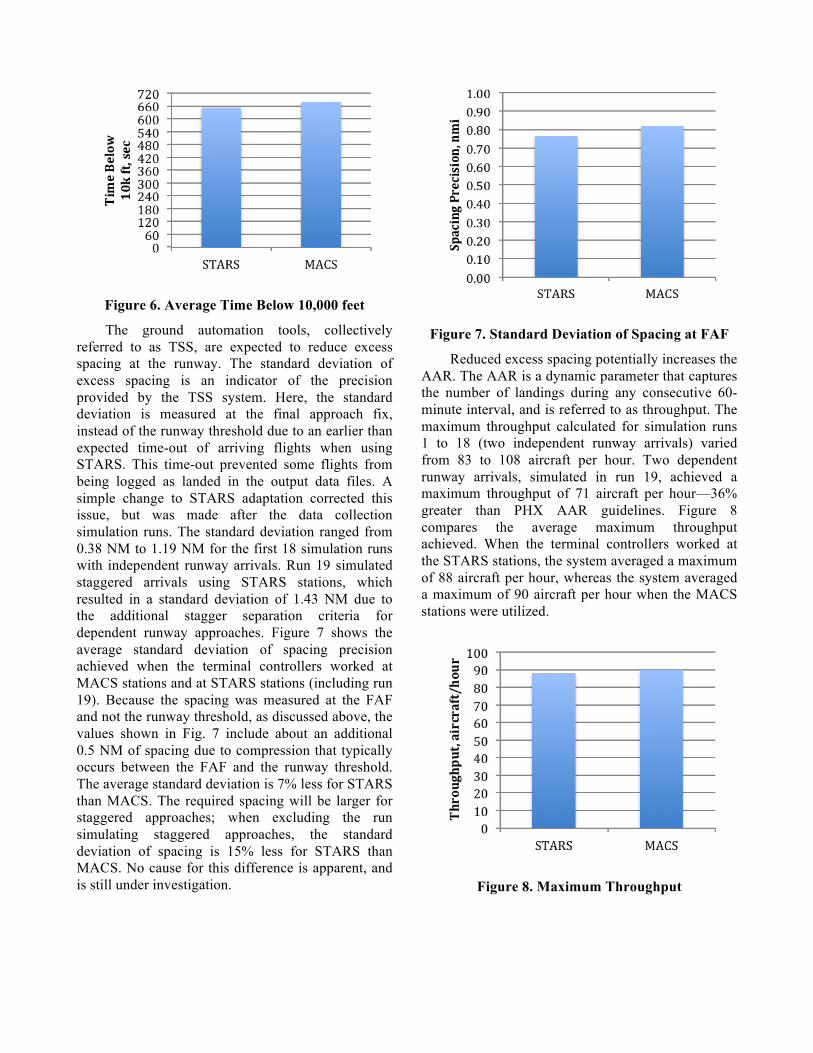
Figure 6. Average Time Below 10,000 feet
The ground automation tools, collectively referred to as TSS, are expected to reduce excess spacing at the runway. The standard deviation of excess spacing is an indicator of the precision provided by the TSS system. Here, the standard deviation is measured at the final approach fix, instead of the runway threshold due to an earlier than expected time-out of arriving flights when using STARS. This time-out prevented some flights from being logged as landed in the output data files. A simple change to STARS adaptation corrected this issue, but was made after the data collection simulation runs. The standard deviation ranged from 0.38 NM to 1.19 NM for the first 18 simulation runs with independent runway arrivals. Run 19 simulated staggered arrivals using STARS stations, which resulted in a standard deviation of 1.43 NM due to the additional stagger separation criteria for dependent runway approaches. Figure 7 shows the average standard deviation of spacing precision achieved when the terminal controllers worked at MACS stations and at STARS stations (including run 19). Because the spacing was measured at the FAF and not the runway threshold, as discussed above, the values shown in Fig. 7 include about an additional 0.5 NM of spacing due to compression that typically occurs between the FAF and the runway threshold. The average standard deviation is 7% less for STARS than MACS. The required spacing will be larger for staggered approaches; when excluding the run simulating staggered approaches, the standard deviation of spacing is 15% less for STARS than MACS. No cause for this difference is apparent, and is still under investigation.
Figure 7. Standard Deviation of Spacing at FAF
Reduced excess spacing potentially increases the AAR. The AAR is a dynamic parameter that captures the number of landings during any consecutive 60-minute interval, and is referred to as throughput. The maximum throughput calculated for simulation runs 1 to 18 (two independent runway arrivals) varied from 83 to 108 aircraft per hour. Two dependent runway arrivals, simulated in run 19, achieved a maximum throughput of 71 aircraft per hour—36% greater than PHX AAR guidelines. Figure 8 compares the average maximum throughput achieved. When the terminal controllers worked at the STARS stations, the system averaged a maximum of 88 aircraft per hour, whereas the system averaged a maximum of 90 aircraft per hour when the MACS stations were utilized.
Figure 8. Maximum Throughput
This difference is due to the lower throughput caused by dependent runway operations simulated in run 19.
Controller Feedback Of the 19 runs in the study that tested the two
station conditions, one run (the last run—run 19), was omitted from the data because it simulated different runway operations (staggered approaches) than the other 18 without tailoring the traffic scenario to account for the increased workload due to staggered approaches. There were 33 questions in the end-of-run survey asking about workload, acceptability, and utility of the stations and tools, resulting in a total of 72 sets of responses (4 x 18). Most questions asked for responses on a rating scale of 1 to 7 (usually very low to very high); some questions offered a choice of answers and some were free-response.
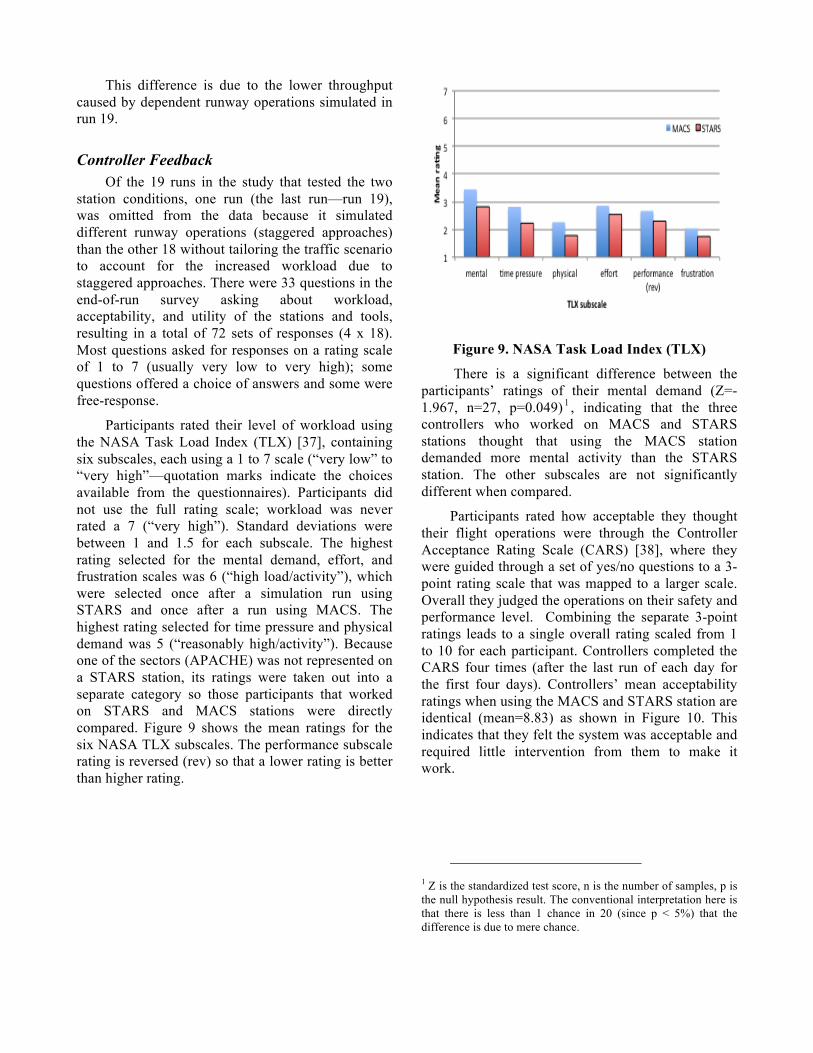
Participants rated their level of workload using the NASA Task Load Index (TLX) [37], containing six subscales, each using a 1 to 7 scale (“very low” to “very high”—quotation marks indicate the choices available from the questionnaires). Participants did not use the full rating scale; workload was never rated a 7 (“very high”). Standard deviations were between 1 and 1.5 for each subscale. The highest rating selected for the mental demand, effort, and frustration scales was 6 (“high load/activity”), which were selected once after a simulation run using STARS and once after a run using MACS. The highest rating selected for time pressure and physical demand was 5 (“reasonably high/activity”). Because one of the sectors (APACHE) was not represented on a STARS station, its ratings were taken out into a separate category so those participants that worked on STARS and MACS stations were directly compared. Figure 9 shows the mean ratings for the six NASA TLX subscales. The performance subscale rating is reversed (rev) so that a lower rating is better than higher rating.
Figure 9. NASA Task Load Index (TLX)
There is a significant difference between the participants’ ratings of their mental demand (Z=-1.967, n=27, p=0.049) 1 , indicating that the three controllers who worked on MACS and STARS stations thought that using the MACS station demanded more mental activity than the STARS station. The other subscales are not significantly different when compared.
Participants rated how acceptable they thought their flight operations were through the Controller Acceptance Rating Scale (CARS) [38], where they were guided through a set of yes/no questions to a 3-point rating scale that was mapped to a larger scale. Overall they judged the operations on their safety and performance level. Combining the separate 3-point ratings leads to a single overall rating scaled from 1 to 10 for each participant. Controllers completed the CARS four times (after the last run of each day for the first four days). Controllers’ mean acceptability ratings when using the MACS and STARS station are identical (mean=8.83) as shown in Figure 10. This indicates that they felt the system was acceptable and required little intervention from them to make it work.
1 Z is the standardized test score, n is the number of samples, p is the null hypothesis result. The conventional interpretation here is that there is less than 1 chance in 20 (since p < 5%) that the difference is due to mere chance.
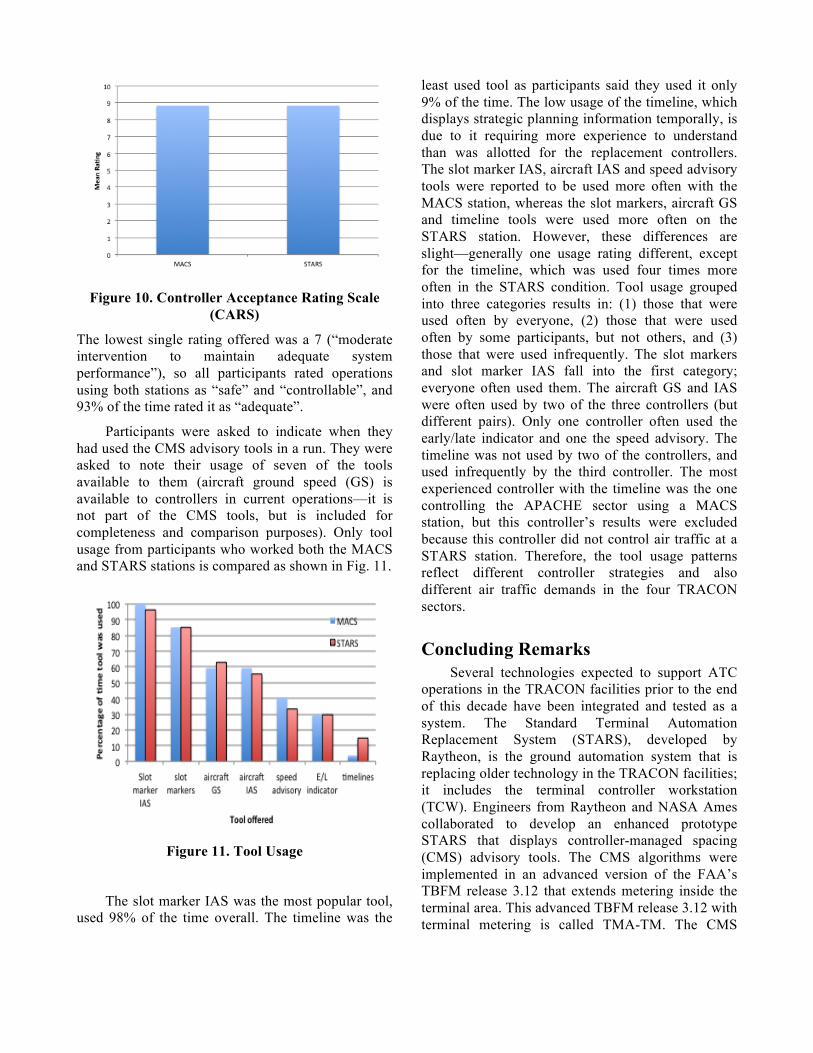
Figure 10. Controller Acceptance Rating Scale (CARS)
The lowest single rating offered was a 7 (“moderate intervention to maintain adequate system performance”), so all participants rated operations using both stations as “safe” and “controllable”, and 93% of the time rated it as “adequate”.
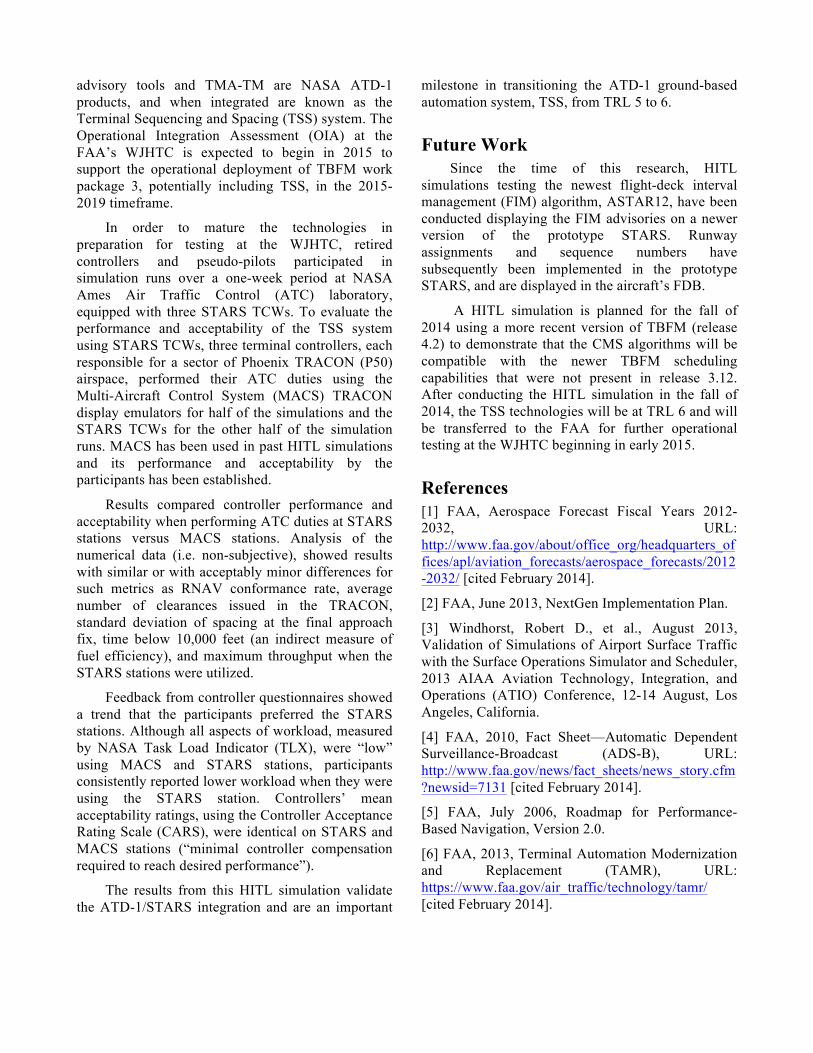
Participants were asked to indicate when they had used the CMS advisory tools in a run. They were asked to note their usage of seven of the tools available to them (aircraft ground speed (GS) is available to controllers in current operations—it is not part of the CMS tools, but is included for completeness and comparison purposes). Only tool usage from participants who worked both the MACS and STARS stations is compared as shown in Fig. 11.
Figure 11. Tool Usage
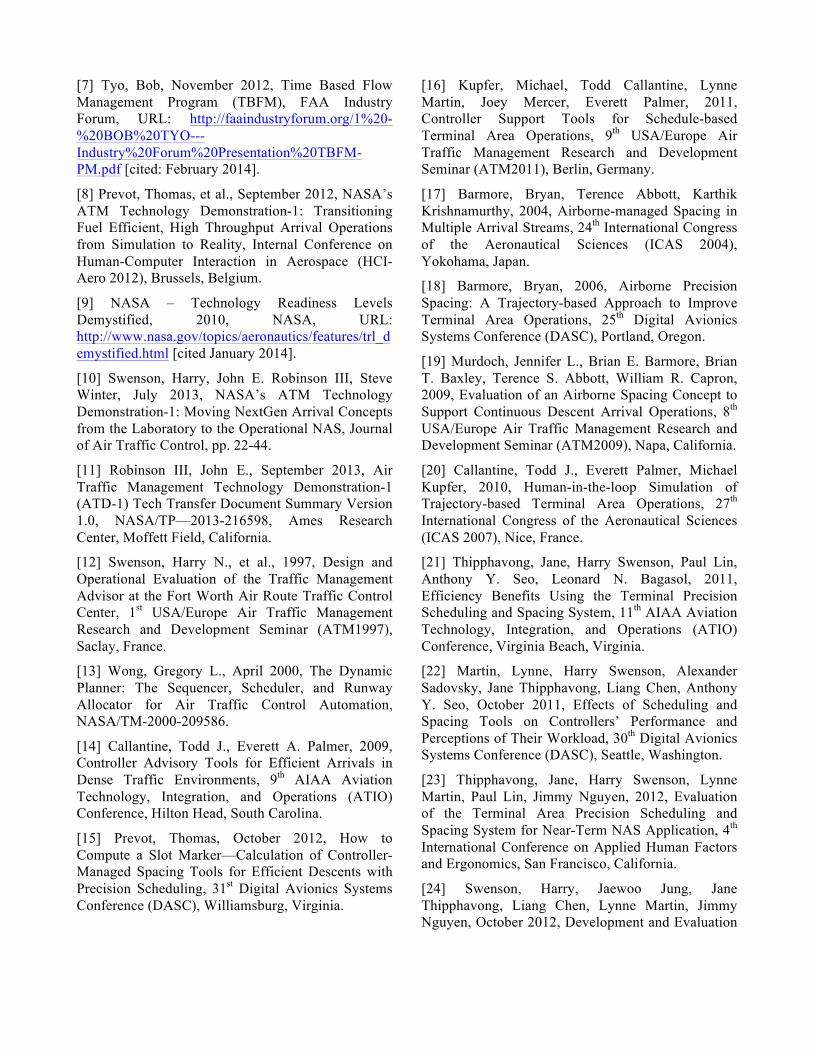
The slot marker IAS was the most popular tool, used 98% of the time overall. The timeline was the
least used tool as participants said they used it only 9% of the time. The low usage of the timeline, which displays strategic planning information temporally, is due to it requiring more experience to understand than was allotted for the replacement controllers. The slot marker IAS, aircraft IAS and speed advisory tools were reported to be used more often with the MACS station, whereas the slot markers, aircraft GS and timeline tools were used more often on the STARS station. However, these differences are slight—generally one usage rating different, except for the timeline, which was used four times more often in the STARS condition. Tool usage grouped into three categories results in: (1) those that were used often by everyone, (2) those that were used often by some participants, but not others, and (3) those that were used infrequently. The slot markers and slot marker IAS fall into the first category; everyone often used them. The aircraft GS and IAS were often used by two of the three controllers (but different pairs). Only one controller often used the early/late indicator and one the speed advisory. The timeline was not used by two of the controllers, and used infrequently by the third controller. The most experienced controller with the timeline was the one controlling the APACHE sector using a MACS station, but this controller’s results were excluded because this controller did not control air traffic at a STARS station. Therefore, the tool usage patterns reflect different controller strategies and also different air traffic demands in the four TRACON sectors.
Concluding Remarks Several technologies expected to support ATC
operations in the TRACON facilities prior to the end of this decade have been integrated and tested as a system. The Standard Terminal Automation Replacement System (STARS), developed by Raytheon, is the ground automation system that is replacing older technology in the TRACON facilities; it includes the terminal controller workstation (TCW). Engineers from Raytheon and NASA Ames collaborated to develop an enhanced prototype STARS that displays controller-managed spacing (CMS) advisory tools. The CMS algorithms were implemented in an advanced version of the FAA’s TBFM release 3.12 that extends metering inside the terminal area. This advanced TBFM release 3.12 with terminal metering is called TMA-TM. The CMS
advisory tools and TMA-TM are NASA ATD-1 products, and when integrated are known as the Terminal Sequencing and Spacing (TSS) system. The Operational Integration Assessment (OIA) at the FAA’s WJHTC is expected to begin in 2015 to support the operational deployment of TBFM work package 3, potentially including TSS, in the 2015-2019 timeframe.
In order to mature the technologies in preparation for testing at the WJHTC, retired controllers and pseudo-pilots participated in simulation runs over a one-week period at NASA Ames Air Traffic Control (ATC) laboratory, equipped with three STARS TCWs. To evaluate the performance and acceptability of the TSS system using STARS TCWs, three terminal controllers, each responsible for a sector of Phoenix TRACON (P50) airspace, performed their ATC duties using the Multi-Aircraft Control System (MACS) TRACON display emulators for half of the simulations and the STARS TCWs for the other half of the simulation runs. MACS has been used in past HITL simulations and its performance and acceptability by the participants has been established.
Results compared controller performance and acceptability when performing ATC duties at STARS stations versus MACS stations. Analysis of the numerical data (i.e. non-subjective), showed results with similar or with acceptably minor differences for such metrics as RNAV conformance rate, average number of clearances issued in the TRACON, standard deviation of spacing at the final approach fix, time below 10,000 feet (an indirect measure of fuel efficiency), and maximum throughput when the STARS stations were utilized.
Feedback from controller questionnaires showed a trend that the participants preferred the STARS stations. Although all aspects of workload, measured by NASA Task Load Indicator (TLX), were “low” using MACS and STARS stations, participants consistently reported lower workload when they were using the STARS station. Controllers’ mean acceptability ratings, using the Controller Acceptance Rating Scale (CARS), were identical on STARS and MACS stations (“minimal controller compensation required to reach desired performance”).
The results from this HITL simulation validate the ATD-1/STARS integration and are an important
milestone in transitioning the ATD-1 ground-based automation system, TSS, from TRL 5 to 6.
Future Work Since the time of this research, HITL
simulations testing the newest flight-deck interval management (FIM) algorithm, ASTAR12, have been conducted displaying the FIM advisories on a newer version of the prototype STARS. Runway assignments and sequence numbers have subsequently been implemented in the prototype STARS, and are displayed in the aircraft’s FDB.
A HITL simulation is planned for the fall of 2014 using a more recent version of TBFM (release 4.2) to demonstrate that the CMS algorithms will be compatible with the newer TBFM scheduling capabilities that were not present in release 3.12. After conducting the HITL simulation in the fall of 2014, the TSS technologies will be at TRL 6 and will be transferred to the FAA for further operational testing at the WJHTC beginning in early 2015.
References [1] FAA, Aerospace Forecast Fiscal Years 2012-2032, URL: http://www.faa.gov/about/office_org/headquarters_offices/apl/aviation_forecasts/aerospace_forecasts/2012-2032/ [cited February 2014].
[2] FAA, June 2013, NextGen Implementation Plan.
[3] Windhorst, Robert D., et al., August 2013, Validation of Simulations of Airport Surface Traffic with the Surface Operations Simulator and Scheduler, 2013 AIAA Aviation Technology, Integration, and Operations (ATIO) Conference, 12-14 August, Los Angeles, California.
[4] FAA, 2010, Fact Sheet—Automatic Dependent Surveillance-Broadcast (ADS-B), URL: http://www.faa.gov/news/fact_sheets/news_story.cfm?newsid=7131 [cited February 2014].
[5] FAA, July 2006, Roadmap for Performance-Based Navigation, Version 2.0.
[6] FAA, 2013, Terminal Automation Modernization and Replacement (TAMR), URL: https://www.faa.gov/air_traffic/technology/tamr/ [cited February 2014].
[7] Tyo, Bob, November 2012, Time Based Flow Management Program (TBFM), FAA Industry Forum, URL: http://faaindustryforum.org/1%20-%20BOB%20TYO---Industry%20Forum%20Presentation%20TBFM-PM.pdf [cited: February 2014].
[8] Prevot, Thomas, et al., September 2012, NASA’s ATM Technology Demonstration-1: Transitioning Fuel Efficient, High Throughput Arrival Operations from Simulation to Reality, Internal Conference on Human-Computer Interaction in Aerospace (HCI-Aero 2012), Brussels, Belgium.
[9] NASA – Technology Readiness Levels Demystified, 2010, NASA, URL: http://www.nasa.gov/topics/aeronautics/features/trl_demystified.html [cited January 2014].
[10] Swenson, Harry, John E. Robinson III, Steve Winter, July 2013, NASA’s ATM Technology Demonstration-1: Moving NextGen Arrival Concepts from the Laboratory to the Operational NAS, Journal of Air Traffic Control, pp. 22-44.
[11] Robinson III, John E., September 2013, Air Traffic Management Technology Demonstration-1 (ATD-1) Tech Transfer Document Summary Version 1.0, NASA/TP—2013-216598, Ames Research Center, Moffett Field, California.
[12] Swenson, Harry N., et al., 1997, Design and Operational Evaluation of the Traffic Management Advisor at the Fort Worth Air Route Traffic Control Center, 1st USA/Europe Air Traffic Management Research and Development Seminar (ATM1997), Saclay, France.
[13] Wong, Gregory L., April 2000, The Dynamic Planner: The Sequencer, Scheduler, and Runway Allocator for Air Traffic Control Automation, NASA/TM-2000-209586.
[14] Callantine, Todd J., Everett A. Palmer, 2009, Controller Advisory Tools for Efficient Arrivals in Dense Traffic Environments, 9th AIAA Aviation Technology, Integration, and Operations (ATIO) Conference, Hilton Head, South Carolina.
[15] Prevot, Thomas, October 2012, How to Compute a Slot Marker—Calculation of Controller-Managed Spacing Tools for Efficient Descents with Precision Scheduling, 31st Digital Avionics Systems Conference (DASC), Williamsburg, Virginia.
[16] Kupfer, Michael, Todd Callantine, Lynne Martin, Joey Mercer, Everett Palmer, 2011, Controller Support Tools for Schedule-based Terminal Area Operations, 9th USA/Europe Air Traffic Management Research and Development Seminar (ATM2011), Berlin, Germany.
[17] Barmore, Bryan, Terence Abbott, Karthik Krishnamurthy, 2004, Airborne-managed Spacing in Multiple Arrival Streams, 24th International Congress of the Aeronautical Sciences (ICAS 2004), Yokohama, Japan.
[18] Barmore, Bryan, 2006, Airborne Precision Spacing: A Trajectory-based Approach to Improve Terminal Area Operations, 25th Digital Avionics Systems Conference (DASC), Portland, Oregon.
[19] Murdoch, Jennifer L., Brian E. Barmore, Brian T. Baxley, Terence S. Abbott, William R. Capron, 2009, Evaluation of an Airborne Spacing Concept to Support Continuous Descent Arrival Operations, 8th USA/Europe Air Traffic Management Research and Development Seminar (ATM2009), Napa, California.
[20] Callantine, Todd J., Everett Palmer, Michael Kupfer, 2010, Human-in-the-loop Simulation of Trajectory-based Terminal Area Operations, 27th International Congress of the Aeronautical Sciences (ICAS 2007), Nice, France.
[21] Thipphavong, Jane, Harry Swenson, Paul Lin, Anthony Y. Seo, Leonard N. Bagasol, 2011, Efficiency Benefits Using the Terminal Precision Scheduling and Spacing System, 11th AIAA Aviation Technology, Integration, and Operations (ATIO) Conference, Virginia Beach, Virginia.
[22] Martin, Lynne, Harry Swenson, Alexander Sadovsky, Jane Thipphavong, Liang Chen, Anthony Y. Seo, October 2011, Effects of Scheduling and Spacing Tools on Controllers’ Performance and Perceptions of Their Workload, 30th Digital Avionics Systems Conference (DASC), Seattle, Washington.
[23] Thipphavong, Jane, Harry Swenson, Lynne Martin, Paul Lin, Jimmy Nguyen, 2012, Evaluation of the Terminal Area Precision Scheduling and Spacing System for Near-Term NAS Application, 4th International Conference on Applied Human Factors and Ergonomics, San Francisco, California.
[24] Swenson, Harry, Jaewoo Jung, Jane Thipphavong, Liang Chen, Lynne Martin, Jimmy Nguyen, October 2012, Development and Evaluation
of the Terminal Precision Scheduling and Spacing System for Off-nominal Condition Operations, 31st Digital Avionics Systems Conference (DASC), Williamsburg, Virginia.
[25] Jung, Jaewoo, Harry Swenson, Jane Thipphavong, Lynne Martin, Liang Chen, Jimmy Nguyen, 2013, Evaluation of the Terminal Area Precision and Spacing System for Performance-based Navigation Arrivals, 32nd Digital Avionics Systems Conference (DASC), Syracuse, New York.
[26] Thipphavong, Jane, Jaewoo Jung, Harry Swenson, Lynne Martin, Melody Lin, Jimmy Nguyen, October 2013, Evaluation of the Terminal Sequencing and Spacing System for Performance-based Navigation Arrivals, 32nd Digital Avionics Systems Conference (DASC), Syracuse, New York.
[27] Thipphavong, Jane, et al., 2013, Evaluation of the Controller-Managed Spacing Tools, Flight-deck Interval Management and Terminal Area Metering Capabilities for the ATM Technology Demonstration #1, 10th USA/Europe Air Traffic Management Research and Development Seminar (ATM2013), Chicago, Illinois.
[28] Prevot, Thomas, Todd Callantine, Paul Lee, Joey Mercer, Everett Palmer, N. Smith, July 2004, Rapid Prototyping and Exploration of Advanced Air Traffic Concepts, International Conference on Computational and Engineering Sciences (ICCES-04), Madeira, Portugal.
[29] Prevot, Thomas, August 2007, MACS: A Simulation Platform for Today’s and Tomorrow’s Air Traffic Operations, AIAA Modeling and Simulation Technologies Conference and Exhibit, Hilton Head, South Carolina.
[30] FAA, May 2012, Standard Terminal Automation Replacement System (STARS), URL: http://hf.tc.faa.gov/projects/stars.htm [cited February 2014].
[31] Baxley, Brian T., et al., July 2012, Air Traffic Management Technology Demonstration-1 Concept of Operations, NASA TM-2012-217585.
[32] Swenson, Harry, Jane Thipphavong, Alex Sadovsky, Liang Chen, Chris Sullivan, Lynne Martin, 2011, Design and Evaluation of the Terminal Area Precision Scheduling and Spacing System, 9th USA/Europe Air Traffic Management Research and Development Seminar (ATM2011), Berlin, Germany.
[33] Abbott, Terence S., 2013, An Overview of a Trajectory-Based Solution for En Route and Terminal Area Self-Spacing: Fourth Revision, NASA/CR-2013-TBD, Langley Research Center, Hampton, Virginia.
[34] FAA, 2007, Phoenix Airport Arrival Rate (AAR), Order P50 TRACON 7210.4B ZAB 7210.126B.
[35] Robinson III, John E., June 2013, 20130607 ATD-1 Wind Scenarios Description.docx, Version 2 (2013-06-07), NASA Ames, California.
[36] Benjamin, Stanley G., George A. Grell, John M. Brown, Tatiana G. Smirnova, February 2004, Mesoscale Weather Prediction with the RUC Hybrid Isentropic-Terrain-Following Coordinate Model, Monthly Weather Review, Volume 132, pp. 473-494.
[37] Hart, Sandra G., Lowell E. Staveland, 1988, Development of NASA-TLX (Task Load Index): Results of Empirical and Theoretical Research, P. A. Hancock and N Meshkati (Eds.) Human Mental Workload, Amsterdam, North Holland Press.
[38] Lee, Katharine K., Karol Kerns, Randall Bone, Monicarol Nickelson, December 2001, Development and Validation of the Controller Acceptance Rating Scale (CARS): Results of Empirical Research, 4th USA/Europe Air Traffic Management Research and Development Seminar (ATM2001), Santa Fe, New Mexico.
Acknowledgements The authors gratefully acknowledge Danny
Vincent and the Human Solutions, Inc. team for developing the controller training materials and assistance during the simulations. We also thank P50 subject matter experts John Nolan and Glen Kanow for their invaluable guidance and suggestions regarding P50 operations. George Lawton, Joe Cisek, Matt Ma, and Tom Prevot for their hard work and dedication in establishing the interconnections in the ATC laboratory.
33rd Digital Avionics Systems Conference October 5 - 9, 2014