Embed Size (px)
Citation preview
1
NGK Insulators, Ltd.
Oct. 2007
Today's Speaker
TitleName
Susumu Sakabe
Hiroshi Wada
Shun Matsushita
Vice PresidentFinance and Accounting Dept.
Director & Senior Vice President
President & Chief Executive Officer
2
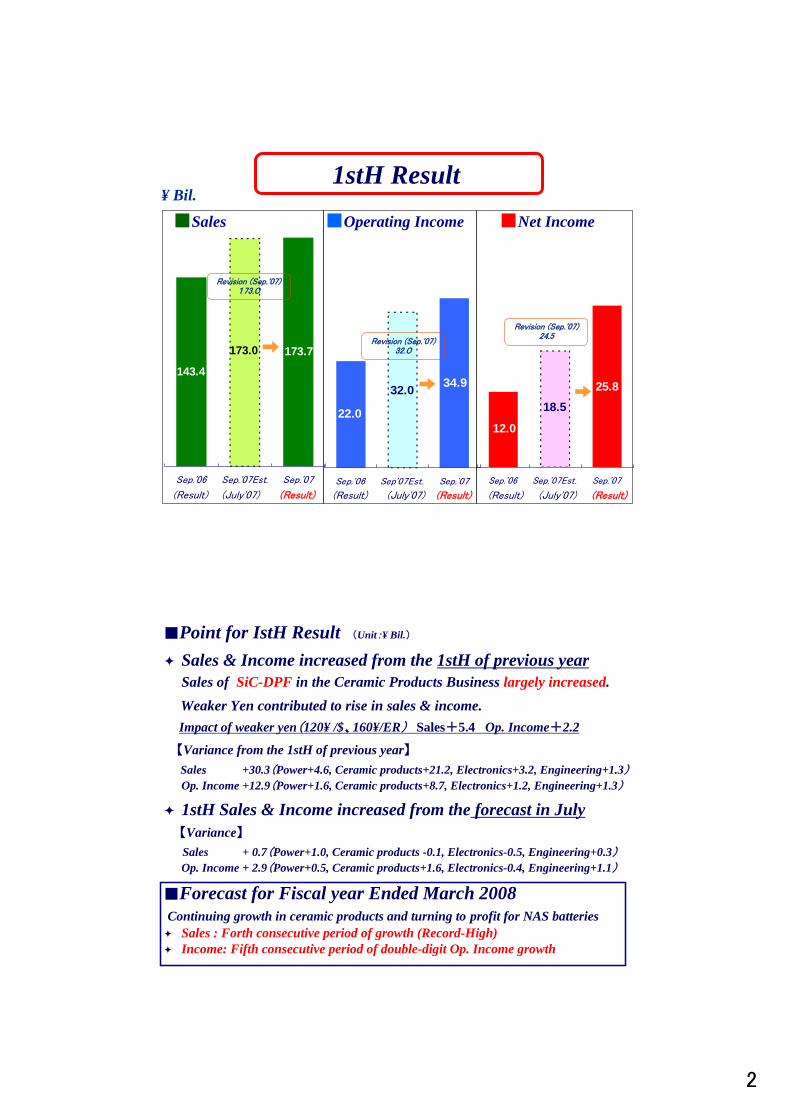
1stH Result
12.0
18.525.8
Sep.'06 Sep.'07Est. Sep.'07
34.932.0
22.0
Sep.'06 Sep'07Est. Sep.'07
173.7173.0
143.4
Sep.'06 Sep.'07Est. Sep.'07
(July'07)
Revision (Sep.'07)173.0
(Result)(Result)
■Sales ■Operating Income
(July'07) (Result)(Result)
■Net Income
(July'07) (Result)(Result)
¥ Bil.
Revision (Sep.'07)32.0
Revision (Sep.'07)24.5
■Point for IstH Result (Unit:¥ Bil.)
Sales & Income increased from the 1stH of previous yearSales of SiC-DPF in the Ceramic Products Business largely increased.
Weaker Yen contributed to rise in sales & income.Impact of weaker yen(120¥ /$、160¥/ER) Sales+5.4 Op. Income+2.2
【Variance from the 1stH of previous year】 Sales +30.3(Power+4.6, Ceramic products+21.2, Electronics+3.2, Engineering+1.3)
Op. Income +12.9(Power+1.6, Ceramic products+8.7, Electronics+1.2, Engineering+1.3)
1stH Sales & Income increased from the forecast in July 【Variance】 Sales + 0.7(Power+1.0, Ceramic products -0.1, Electronics-0.5, Engineering+0.3)
Op. Income + 2.9(Power+0.5, Ceramic products+1.6, Electronics-0.4, Engineering+1.1)
■Forecast for Fiscal year Ended March 2008 Continuing growth in ceramic products and turning to profit for NAS batteries
Sales : Forth consecutive period of growth (Record-High)Income: Fifth consecutive period of double-digit Op. Income growth
3
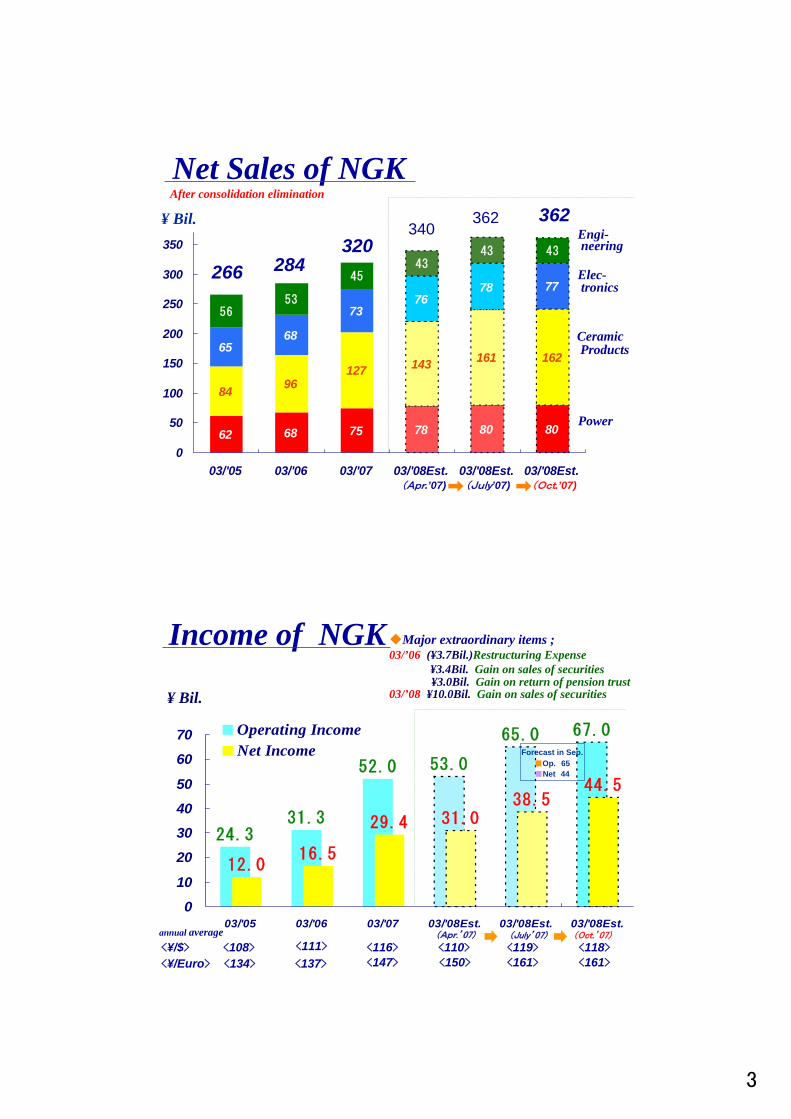
75 78 80
84
16265
7376
77
5653
4543
43
68 8062
143 161127
96
78
68
43
0
50
100
150
200
250
300
350
03/'05 03/'06 03/'07 03/'08Est. 03/'08Est. 03/'08Est.
284
¥ Bil.
Net Sales of NGK
Power
CeramicProducts
Engi-neering
Elec-tronics
266 320
After consolidation elimination
(Apr.’07) (Oct.’07)
362340
362
(July’07)
24.331.3
52.0 53.0
65.0 67.0
12.016.5
29.4 31.038.5
44.5
0
10
20
30
40
50
60
70
03/'05 03/'06 03/'07 03/'08Est. 03/'08Est. 03/'08Est.
Operating IncomeNet Income
¥ Bil.
Income of NGK
annual average
Major extraordinary items ;03/’06 (¥3.7Bil.)Restructuring Expense ¥3.4Bil. Gain on sales of securities
¥3.0Bil. Gain on return of pension trust03/’08 ¥10.0Bil. Gain on sales of securities
<147>
<116>
<137><134><¥/Euro>
<111><108><¥/$>
<161>
<118><110>
<150> <161>
<119>(Apr.’07) (July’07) (Oct.’07)
Forecast in Sep.■Op. 65■Net 44
4
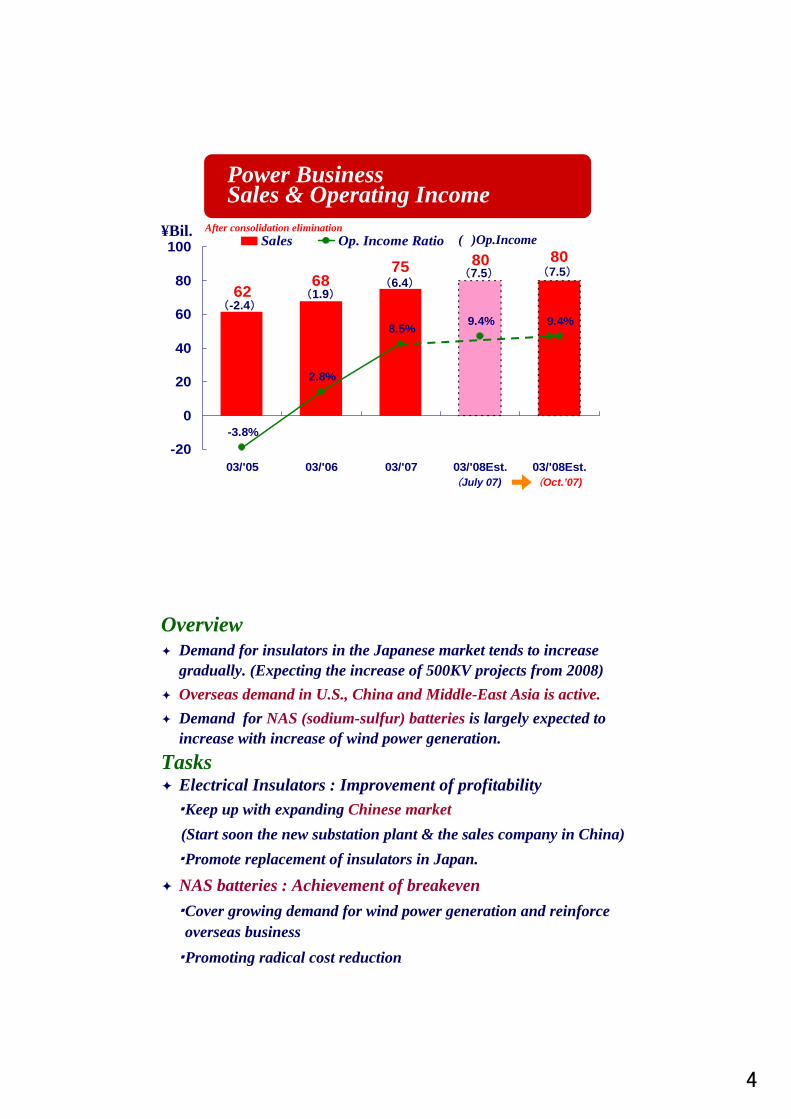
Power Business Sales & Operating Income
75 80 80
6268
-3.8%
2.8%
8.5% 9.4%9.4%
-20
0
20
40
60
80
100
03/'05 03/'06 03/'07 03/'08Est. 03/'08Est.-4.0
1.0
6.0
11.0
16.0
Sales Op. Income Ratio ¥Bil. ( )Op.Income
(6.4)
(-2.4)(1.9)
(7.5)
(July 07) (Oct.’07)
After consolidation elimination
(7.5)
OverviewDemand for insulators in the Japanese market tends to increase gradually. (Expecting the increase of 500KV projects from 2008)Overseas demand in U.S., China and Middle-East Asia is active.Demand for NAS (sodium-sulfur) batteries is largely expected to increase with increase of wind power generation.
TasksElectrical Insulators : Improvement of profitability・Keep up with expanding Chinese market(Start soon the new substation plant & the sales company in China)・Promote replacement of insulators in Japan.
NAS batteries : Achievement of breakeven・Cover growing demand for wind power generation and reinforceoverseas business
・Promoting radical cost reduction
5
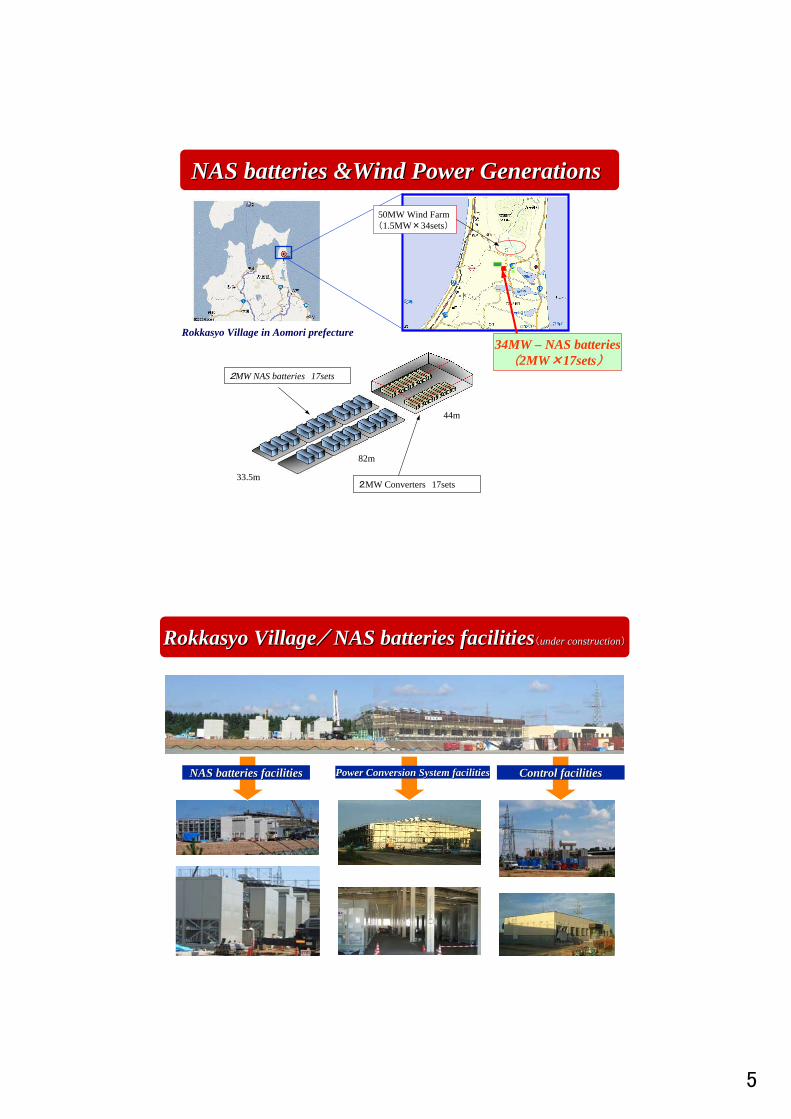
2MW NAS batteries 17sets
2MW Converters 17sets33.5m
82m
44m
50MW Wind Farm(1.5MW×34sets)
34MW – NAS batteries(2MW×17sets)
NAS batteries &Wind Power GenerationsNAS batteries &Wind Power Generations
Rokkasyo Village in Aomori prefecture
NAS batteries facilitiesNAS batteries facilities Power Conversion System facilitiesPower Conversion System facilities Control facilitiesControl facilities
RokkasyoRokkasyo VillageVillage/ / NAS batteries facilitiesNAS batteries facilities((under constructionunder construction))
6
¥Bil.
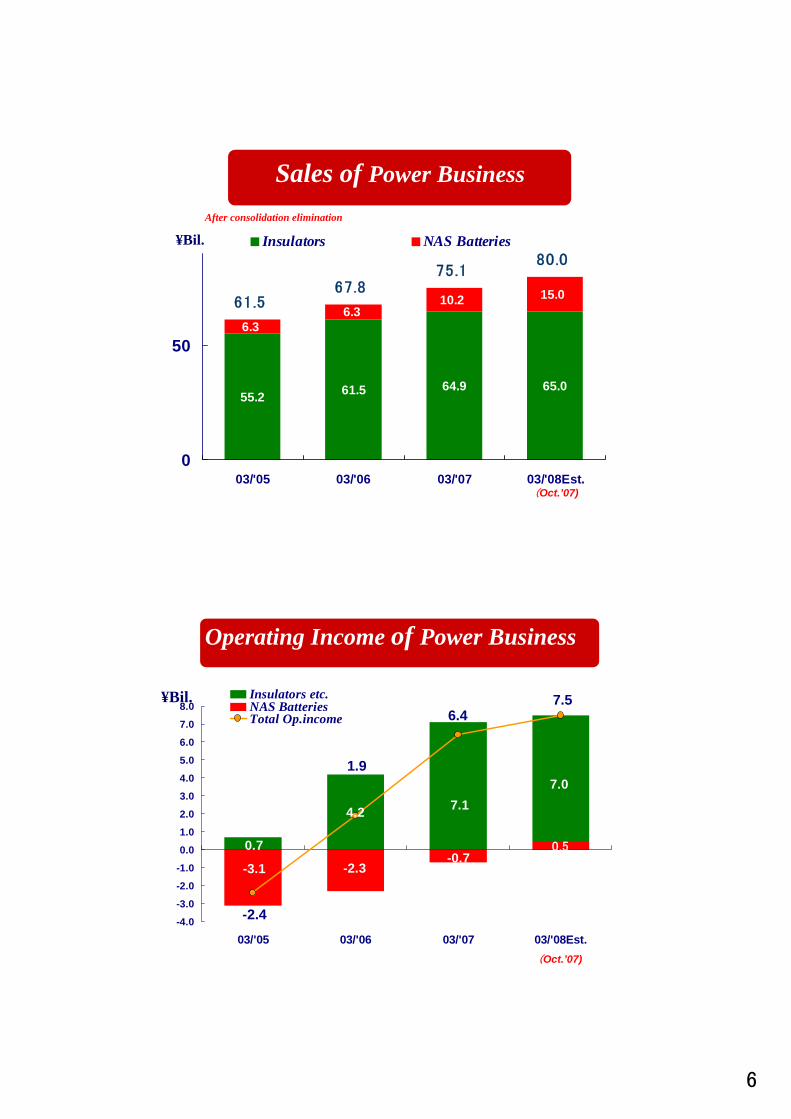
Sales of Power Business
55.2 61.5 64.9 65.0
6.36.3
10.2 15.067.875.1
80.0
61.5
0
50
03/'05 03/'06 03/'07 03/'08Est.
Insulators NAS Batteries
After consolidation elimination
(Oct.’07)
¥Bil.
-2.3-3.10.5
-0.70.7
4.2
7.07.1
-2.4
7.56.4
1.9
-4.0
-3.0
-2.0
-1.0
0.0
1.0
2.0
3.0
4.0
5.0
6.0
7.0
8.0
03/'05 03/'06 03/'07 03/'08Est.
Insulators etc.NAS BatteriesTotal Op.income
Operating Income of Power Business
(Oct.’07)
7
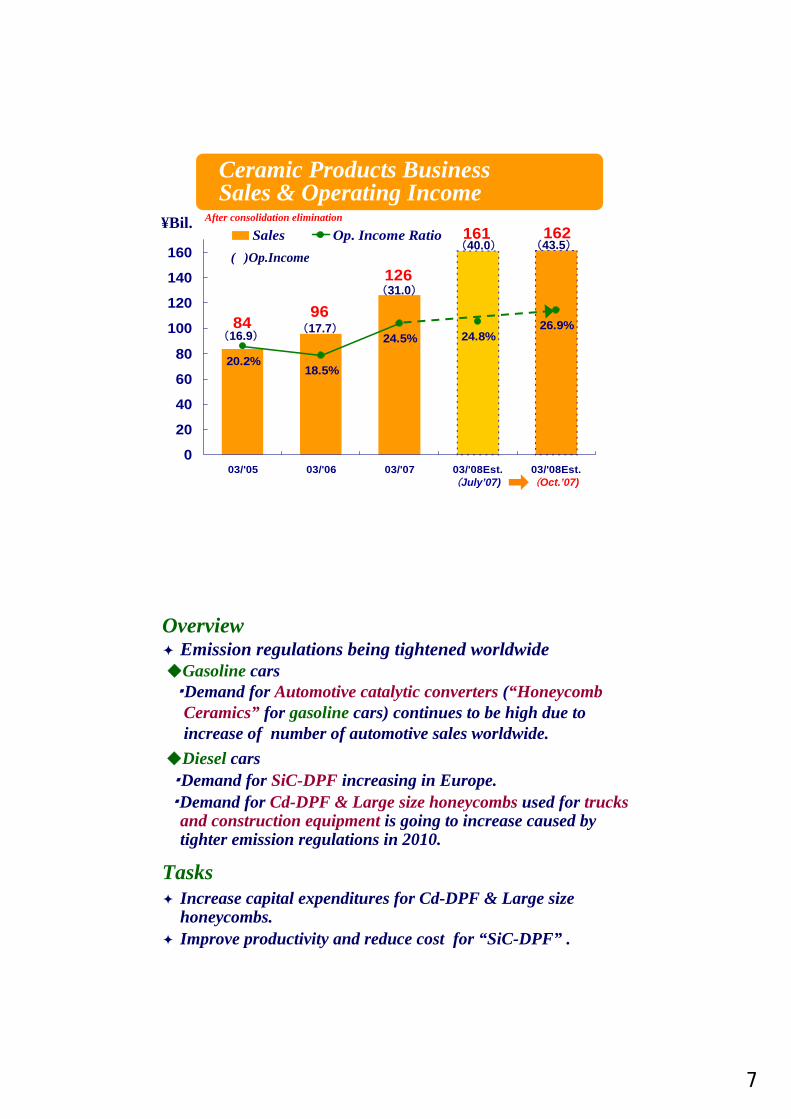
161 162
84
126
9624.8%
26.9%
18.5%
24.5%
20.2%
0
20
40
60
80
100
120
140
160
03/'05 03/'06 03/'07 03/'08Est. 03/'08Est.0.0
5.0
10.0
15.0
20.0
25.0
30.0
35.0
40.0Sales Op. Income Ratio
Ceramic Products Business Sales & Operating Income
¥Bil.
( )Op.Income
(17.7)(16.9)
(40.0)
(31.0)
(July’07) (Oct.’07)
After consolidation elimination
(43.5)
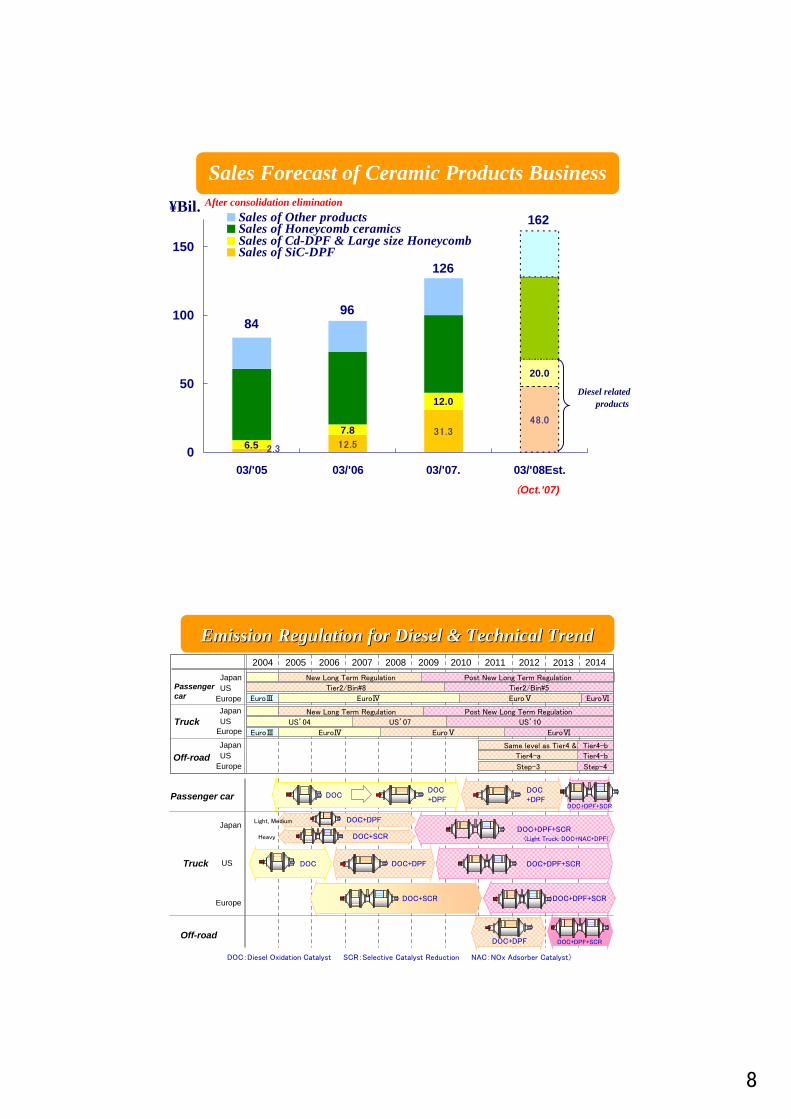
OverviewEmission regulations being tightened worldwide
◆Gasoline cars・Demand for Automotive catalytic converters (“Honeycomb Ceramics” for gasoline cars) continues to be high due to increase of number of automotive sales worldwide.
◆Diesel cars ・Demand for SiC-DPF increasing in Europe.・Demand for Cd-DPF & Large size honeycombs used for trucks
and construction equipment is going to increase caused by tighter emission regulations in 2010.
TasksIncrease capital expenditures for Cd-DPF & Large size honeycombs.Improve productivity and reduce cost for “SiC-DPF” .
8
12.5
31.348.0
2.3
20.0
12.0
7.86.5
162
126
9684
0
50
100
150
03/'05 03/'06 03/'07. 03/'08Est.
Sales of Other productsSales of Honeycomb ceramics Sales of Cd-DPF & Large size HoneycombSales of SiC-DPF
Sales Forecast of Ceramic Products Business¥Bil. After consolidation elimination
(Oct.’07)
Diesel related products
2004 2005 2006 2007 2008 2009 2010 2011 2012 2013 2014New Long Term Regulation Post New Long Term Regulation
Tier2/Bin#8 Tier2/Bin#5
EuroⅢ EuroⅣ EuroⅤ EuroⅥ
New Long Term Regulation Post New Long Term Regulation
US’04 US’07
EuroⅢ EuroⅣ EuroⅤ EuroⅥ
Same level as Tier4 & Tier4-b
US’10
Tier4-a Tier4-b
Step-3 Step-4
JapanUS
EuropeJapanUS
Europe
JapanUS
Europe
Passenger car
Truck
Off-road
Japan
US
Europe
Truck
Off-road
Passenger car
DOCDOC+DPF
DOC
Light, Medium
Heavy
DOC+DPF
DOC+DPF
DOC+SCR
DOC+DPF
DOC+DPF+SCR(Light Truck: DOC+NAC+DPF)
DOC+DPF+SCR
DOC+DPF+SCRDOC+SCR
DOC+DPF DOC+DPF+SCR
DOC+DPF+SCR
DOC:Diesel Oxidation Catalyst SCR:Selective Catalyst Reduction NAC:NOx Adsorber Catalyst)
EmissionEmission Regulation for Diesel & Technical TrendRegulation for Diesel & Technical Trend
9
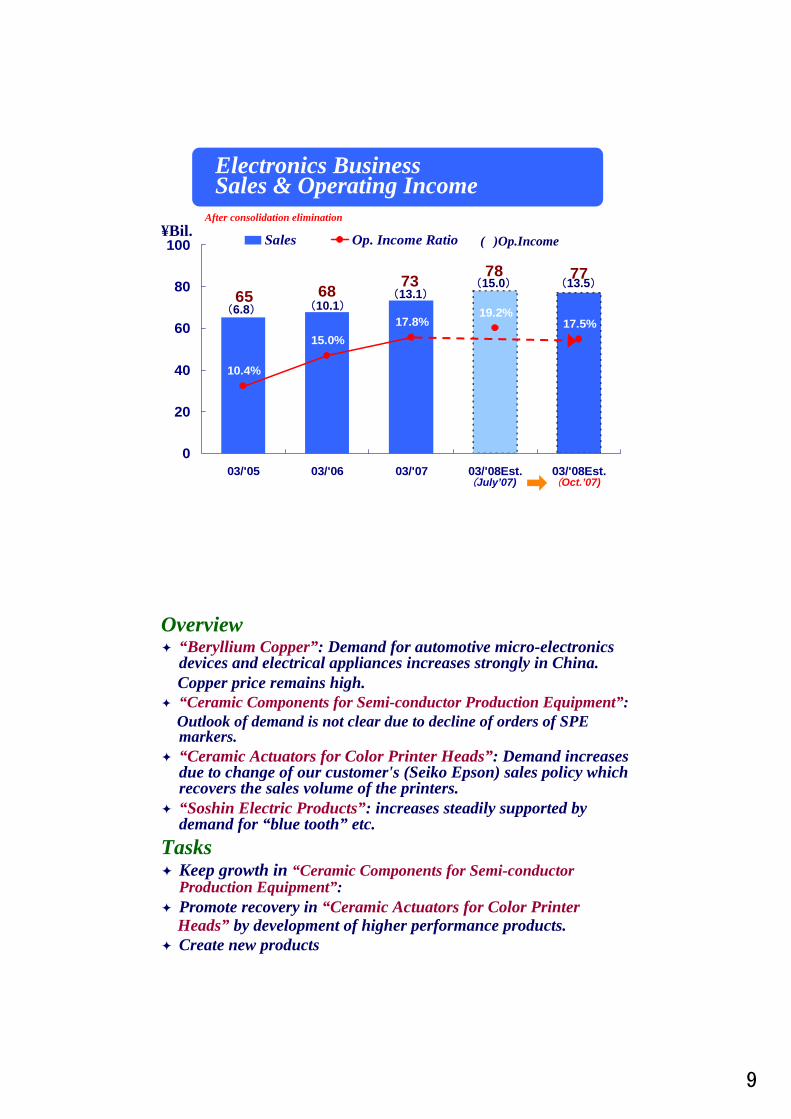
Electronics Business Sales & Operating Income
7778736865
10.4%
15.0%17.8% 17.5%
19.2%
0
20
40
60
80
100
03/'05 03/'06 03/'07 03/'08Est. 03/'08Est.
Sales Op. Income Ratio¥Bil.( )Op.Income
(10.1)(6.8)
(13.5)(13.1)
(July’07) (Oct.’07)
After consolidation elimination
(15.0)
Overview “Beryllium Copper”: Demand for automotive micro-electronicsdevices and electrical appliances increases strongly in China.Copper price remains high.“Ceramic Components for Semi-conductor Production Equipment”:Outlook of demand is not clear due to decline of orders of SPE markers. “Ceramic Actuators for Color Printer Heads”: Demand increases due to change of our customer's (Seiko Epson) sales policy whichrecovers the sales volume of the printers.“Soshin Electric Products”: increases steadily supported bydemand for “blue tooth” etc.
TasksKeep growth in “Ceramic Components for Semi-conductor Production Equipment”:Promote recovery in “Ceramic Actuators for Color PrinterHeads” by development of higher performance products.Create new products
10
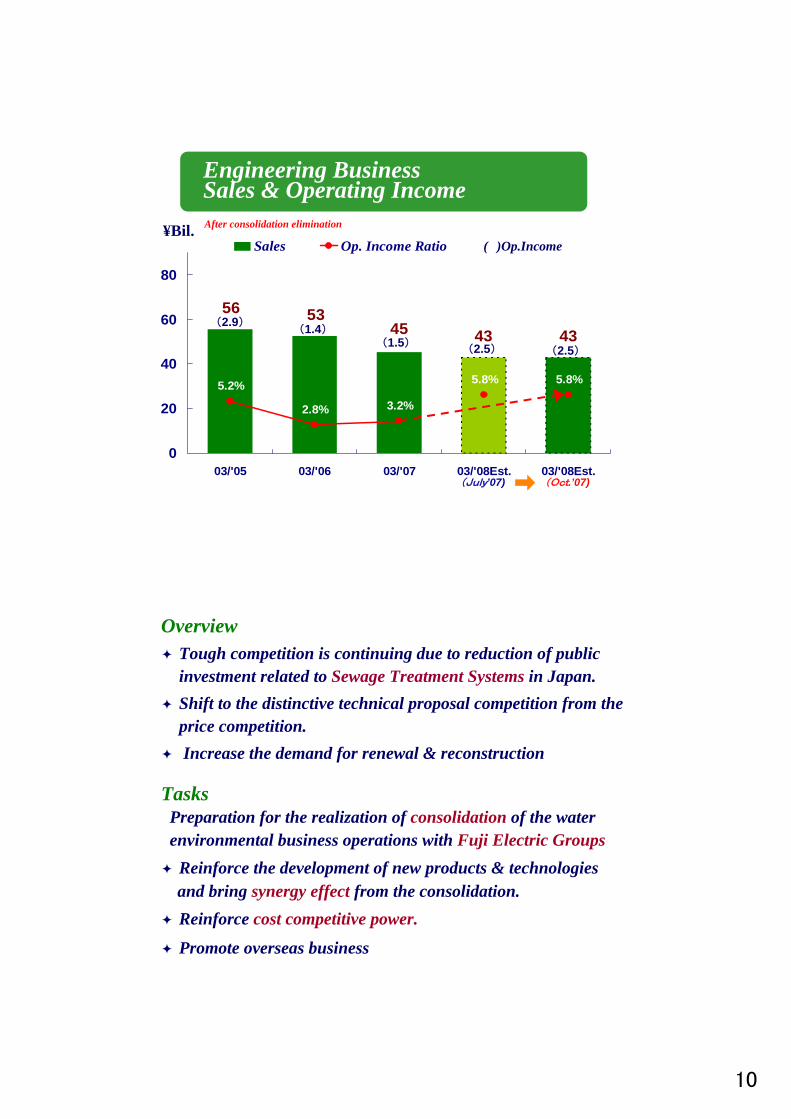
Engineering Business Sales & Operating Income
43 43
5645
53
5.2%
2.8% 3.2%
5.8% 5.8%
0
20
40
60
80
03/'05 03/'06 03/'07 03/'08Est. 03/'08Est.
Sales Op. Income Ratio¥Bil.
( )Op.Income
(1.4)(2.9)
(2.5)(1.5)
(July’07) (Oct.’07)
After consolidation elimination
(2.5)
OverviewTough competition is continuing due to reduction of public investment related to Sewage Treatment Systems in Japan.Shift to the distinctive technical proposal competition from theprice competition.Increase the demand for renewal & reconstruction
TasksPreparation for the realization of consolidation of the waterenvironmental business operations with Fuji Electric Groups
Reinforce the development of new products & technologies and bring synergy effect from the consolidation.
Reinforce cost competitive power.
Promote overseas business
11
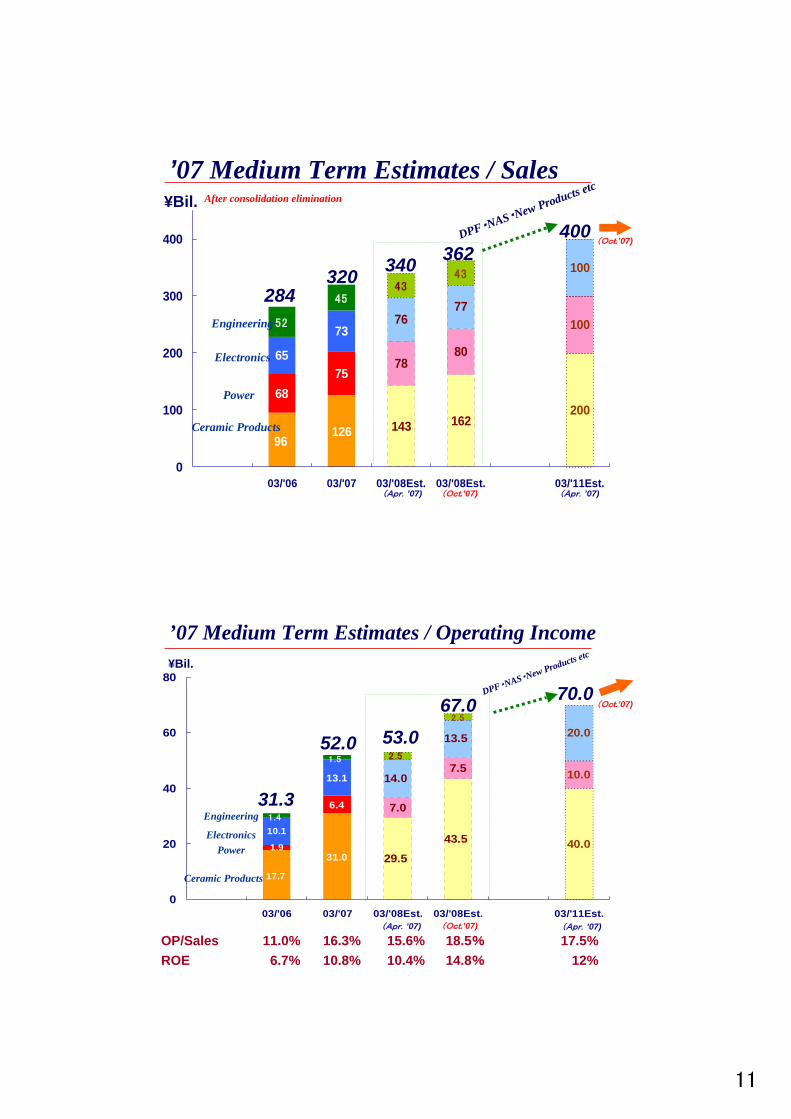
6875
73
200
96126
162143
100
8078
100
76
65
77
4343
52
45
0
100
200
300
400
03/'06 03/'07 03/'08Est. 03/'08Est. 03/'11Est.
320284
400
Electronics
Engineering
Ceramic Products
Power
¥Bil.
340
DPF・NAS・New Products etc’07 Medium Term Estimates / Sales
After consolidation elimination
362
(Apr.’07) (Oct.’07) (Apr.’07)
(Oct.’07)
40.0
17.7
31.0
43.5
29.5
10.07.5
7.0
1.9
6.4
20.0
14.0
10.1
13.5
13.1
2.5
2.5
1.4
1.5
0
20
40
60
80
03/'06 03/'07 03/'08Est. 03/'08Est. 03/'11Est.
52.0
31.3
70.0
Electronics
Engineering
Ceramic Products
Power
¥Bil.
53.0
DPF・NAS・New Products etc
’07 Medium Term Estimates / Operating Income
10.8%16.3%
6.7%11.0%
10.4%15.6%
14.8%
18.5%
12%17.5%
ROEOP/Sales
67.0
(Apr.’07) (Oct.’07) (Apr.’07)
(Oct.’07)
12
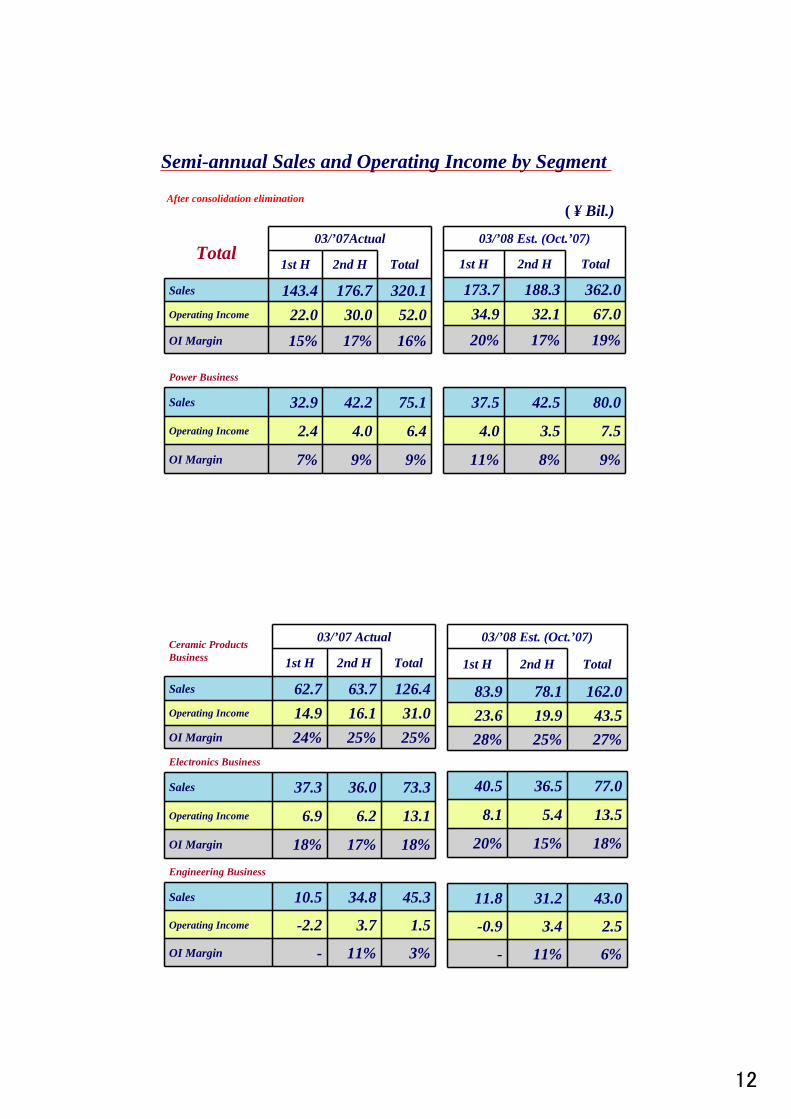
16%17%15%OI Margin
22.0143.4
1st H
03/’07Actual
52.0320.1
Total
30.0176.7
2nd H
Operating Income
Sales
Total
9%9%7%OI Margin
2.4
32.9
6.4
75.1
4.0
42.2
Operating Income
Sales
Power Business
19%17%20%34.9
173.7
1st H
03/’08 Est. (Oct.’07)
67.0362.0
Total
32.1188.3
2nd H
9%8%11%
4.0
37.5
7.5
80.0
3.5
42.5
Semi-annual Sales and Operating Income by Segment
( ¥ Bil.)After consolidation elimination
25%25%24%OI Margin
14.962.7
1st H
03/’07 Actual
31.0126.4
Total
16.163.7
2nd H
Operating Income
Sales
Ceramic Products Business
3%11%-OI Margin
-2.2
10.5
1.5
45.3
3.7
34.8Operating Income
Sales
Engineering Business
27%25%28%23.683.9
1st H
03/’08 Est. (Oct.’07)
43.5162.0
Total
19.978.1
2nd H
6%11%-
-0.9
11.8
2.5
43.0
3.4
31.2
18%17%18%OI Margin
6.9
37.3
13.1
73.3
6.2
36.0
Operating Income
Sales
Electronics Business
18%15%20%
8.1
40.5
13.5
77.0
5.4
36.5
13
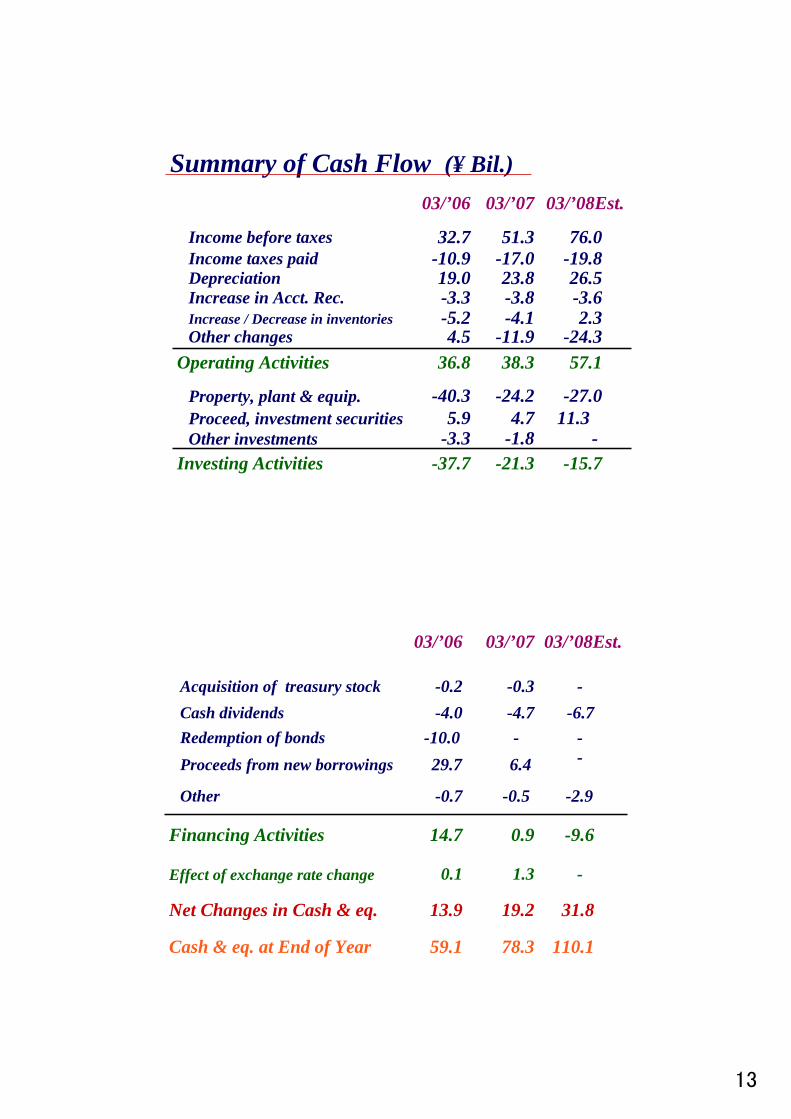
Summary of Cash Flow (¥ Bil.)
--1.8-3.3 Other investments11.3 4.75.9 Proceed, investment securities
-37.7
-40.3
36.84.5
-5.2-3.319.0
-10.932.7
03/’06
-21.3
-24.2
38.3-11.9
-4.1-3.823.8
-17.051.3
03/’07
-15.7
-27.0
57.1-24.3
2.3-3.626.5
-19.876.0
03/’08Est.
Investing Activities
Property, plant & equip.
Income taxes paid Income before taxes
Increase in Acct. Rec.
Other changesOperating Activities
Increase / Decrease in inventories
Depreciation
-6.429.7 Proceeds from new borrowings---10.0 Redemption of bonds
-1.30.1Effect of exchange rate change
110.178.359.1Cash & eq. at End of Year
13.9
14.7
-0.7
-4.0-0.2
03/’06
19.2
0.9
-0.5
-4.7-0.3
03/’07
31.8
-9.6
-2.9
-6.7-
03/’08Est.
Net Changes in Cash & eq.
Cash dividends Acquisition of treasury stock
Other
Financing Activities
14
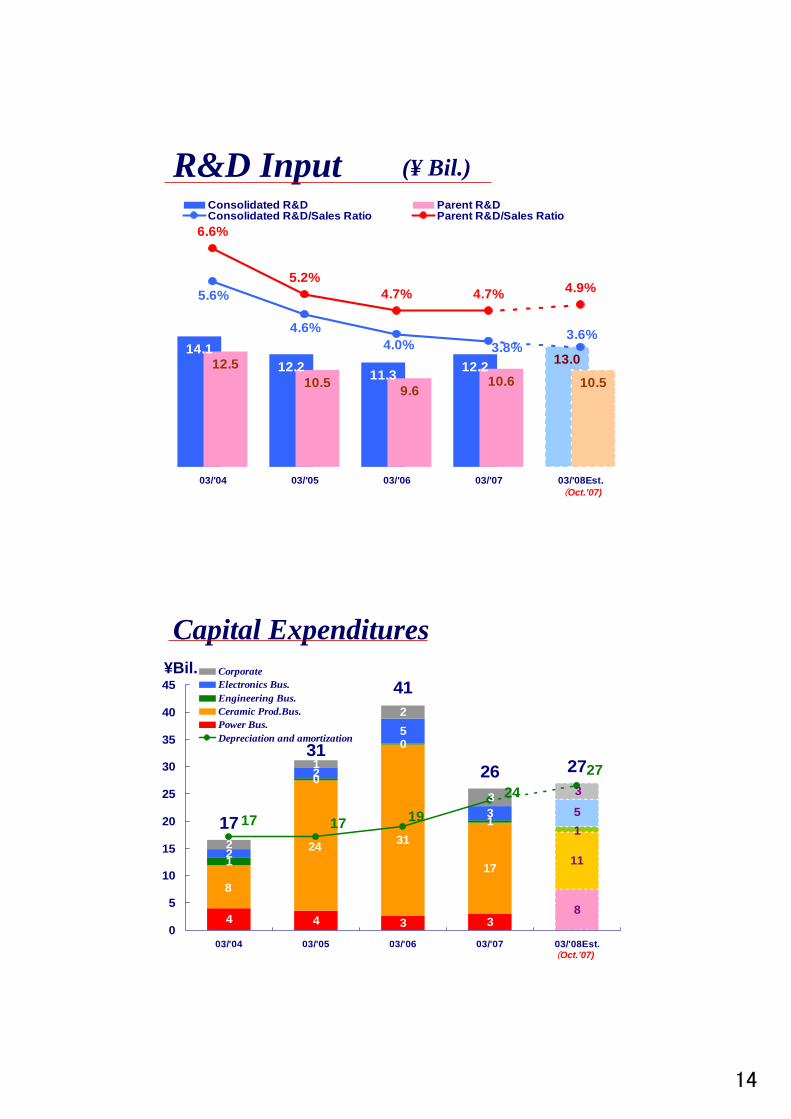
14.112.2 11.3 12.2 13.012.5
10.5 9.610.6 10.5
4.0%
5.6%
3.6%3.8%
4.6%
4.9%4.7%4.7%5.2%
6.6%
03/'04 03/'05 03/'06 03/'07 03/'08Est.
Consolidated R&D Parent R&DConsolidated R&D/Sales Ratio Parent R&D/Sales Ratio
R&D Input (¥ Bil.)
(Oct.’07)
3 3
1
0
0
1
2
5
3
2
1
2
48
4
17 11
3124
8
15
233
17
41
26 2731
27
17
241917
0
5
10
15
20
25
30
35
40
45
03/'04 03/'05 03/'06 03/'07 03/'08Est.
CorporateElectronics Bus.Engineering Bus.Ceramic Prod.Bus.Power Bus.Depreciation and amortization
¥Bil.
Capital Expenditures
(Oct.’07)
15
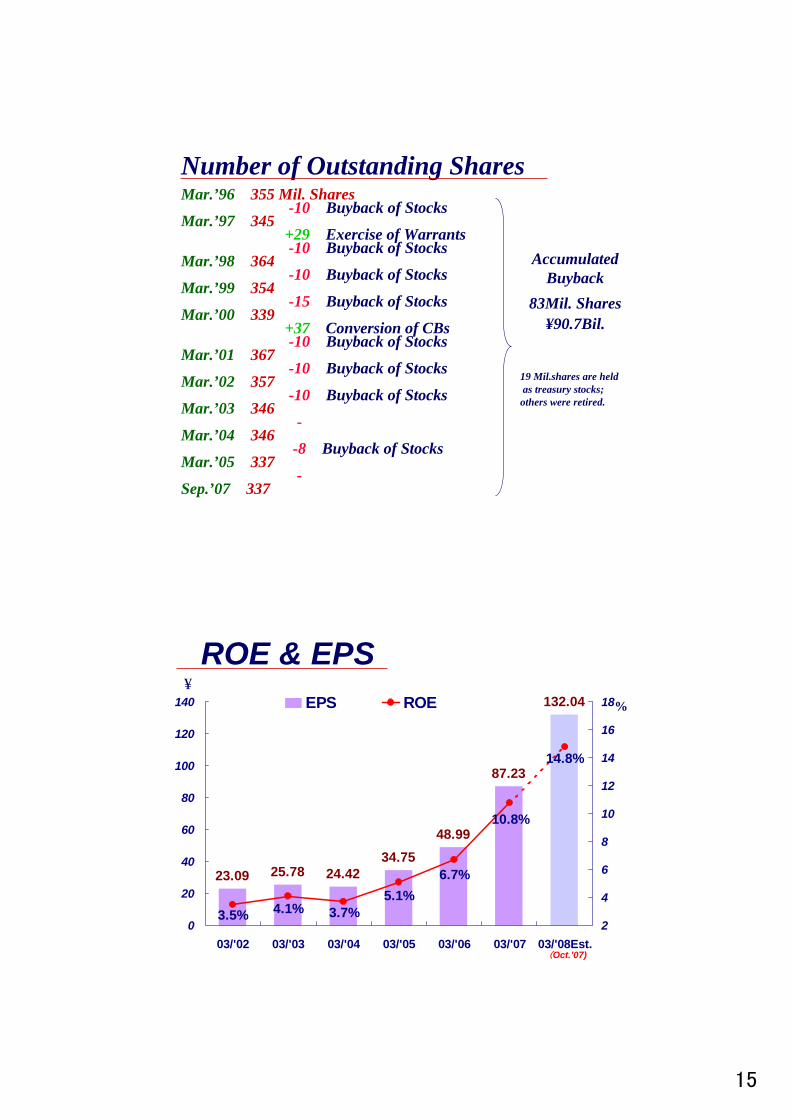
Number of Outstanding SharesMar.’96 355 Mil. Shares
-10 Buyback of StocksMar.’97 345
+29 Exercise of Warrants -10 Buyback of Stocks
Mar.’98 364-10 Buyback of Stocks
Mar.’99 354-15 Buyback of Stocks
Mar.’00 339+37 Conversion of CBs -10 Buyback of Stocks
Mar.’01 367-10 Buyback of Stocks
Mar.’02 357-10 Buyback of Stocks
Mar.’03 346-
Mar.’04 346-8 Buyback of Stocks
Mar.’05 337-
Sep.’07 337
AccumulatedBuyback
83Mil. Shares¥90.7Bil.
19 Mil.shares are heldas treasury stocks;others were retired.
ROE & EPS
24.4225.7823.0934.75
48.99
87.23
132.04
3.5% 4.1% 3.7%
10.8%
5.1%6.7%
14.8%
0
20
40
60
80
100
120
140
03/'02 03/'03 03/'04 03/'05 03/'06 03/'07 03/'08Est.2
4
6
8
10
12
14
16
18EPS ROE¥
%
(Oct.’07)
16
Disclaimer :This material is not an offer or a solicitation of an offer to buy or sell securities. Please note that although NGK has made careful efforts to update the contents in order toensure the accuracy, this material may not provide or reflect the latest information.NGK assumes no responsibility for losses that result from use of this material.Please be aware that decisions regarding investing are the responsibility of users themselves.
NGK Insulators, Ltd.2-56, Suda-cho, Mizuho-ku, Nagoya
467-8530, Japan
Finance & Accounting Department
Tel. : + 81-52-872-7186 Fax. : + 81-52-872-7160E-mail : [email protected]
NGK Homepage Address (English Version) :http://www.ngk.co.jp/english/ir/index.html