Embed Size (px)
Citation preview

7/22/2019 Ngn Business Plan
http://slidepdf.com/reader/full/ngn-business-plan 1/224
Business Plan
RII0-GD1
NoticeSmall sections o this
document have been
redacted or reasons
o condentiality.
NoticeSmall sections o this
document have been
redacted or reasons
o condentiality.

7/22/2019 Ngn Business Plan
http://slidepdf.com/reader/full/ngn-business-plan 2/224
This document is the business plan o Northern
Gas Networks (NGN) or the period rom April 2013
to March 2021.
Its primary purpose is to demonstrate to NGN’s
customers and other stakeholders that the
company has an eective and ecient business
plan or the eight years o the price control. The
plan sets out how NGN will continue to maintain the
physical network in optimal condition, how we will
invest wisely to ensure its continued saety, how we
will meet our customers’ expectations and continue
to deliver value or money. The plan meets therequirements o our economic regulator, Ogem, to
provide a high level o detail to support our business
case.
This price review period is the rst or gas
distribution which is based upon the principles
o RIIO (Revenue = Incentives + Innovation +
Outputs) and is known as RIIO-GD1. The RIIO
model replaces the previous RPI-X regime and
is designed to better meet the investment and
innovation challenge by placing more emphasis on
incentives to drive the innovation needed to deliver
a sustainable energy network, at value or money,
or existing and uture customers.
The document is divided into the ollowing sections.
Section 1 – Executive summary
This is a high-level overview o the entire document,
summarising the contents o each section.
Section 2 – Northern Gas Networks
NGN was created in June 2005 with the sale o
our o the eight gas distribution networks owned
by National Grid. This section explains how NGN
works to a corporate vision which is supported by
a range o perormance measures. It details how
NGN has perormed against these measures or
the past six years, delivering natural gas in the most
cost-ecient way to 2.6m users across Northern
England.
Section 3 – Business and operatingenvironment
NGN must operate within a legal and regulatory
ramework which dictates required perormance
levels. This brings with it a range o challenges:
some are specic to the gas distribution industry;
some are as a result o the economic situation; and
some are geographic issues. This section details
these challenges and NGN’s approach to managing
them.
Section 4 – Innovation strategy
Innovation allows a company to adapt the way in
which it delivers its services, reacting to a changing
environment to ensure it continues to deliver optimal
perormance. When NGN was created it chose to
operate a unique asset management model, which
it is now changing as the company reacts to the
challenges o a new price control period and the
move to a low carbon economy in the UK. This
section explains how NGN has and will continue to
use innovation.
Section 5 – Stakeholder engagement
The views o customers and other stakeholders are
important to NGN. They provide a vital direction
and ocus to improve our service delivery. For this
price control period we implemented an enhanced
engagement programme to ensure all stakeholders
were given an opportunity to engage with us and
their eedback has delivered a reduction in our initial
expenditure plans. This section explains how NGN
has historically gathered stakeholders’ views, what
we did or this business plan and our plans or the
uture.
Section 6 – RIIO-GD1 output forecasts
NGN has detailed 56 output measures in six
business activity areas in this business plan,
covering the eight years o the RIIO-GD1 price
control period. Section 6 contains detailed orecasts
o how NGN expects to perorm in these areas.
A guide to this document

7/22/2019 Ngn Business Plan
http://slidepdf.com/reader/full/ngn-business-plan 3/224
Section 7 – Expenditure forecasts
NGN needs to make signicant levels o investmentin the gas distribution network during
RIIO-GD1 to ensure we continue to deliver gas to
homes and businesses across the North o England
in a sae and ecient manner. Our expenditure
plans are explained in detail in this Section.
Section 8 – Revenue and nancialforecasts
I NGN is to continue to operate a sae and
secure gas distribution network it needs levelso revenue to match its expenditure plans. We
must attract the investment which is essential to
nance the business and balance the requirements
o customers. This section explains how we will
achieve this balance and the level o revenue we
need to operate.
Section 9 – Impact on customer bills
NGN’s business plan is based upon the principle
o continuing to deliver value or money or the
network’s customers whilst maintaining high
standards o saety, customer service and
environmental responsibility. The nancial impact o
this business plan on customers’ bills is detailed in
this section.

7/22/2019 Ngn Business Plan
http://slidepdf.com/reader/full/ngn-business-plan 4/224
Contents1
2
3
4 8
5
7
6Executivesummary 7
NorthernGasNetworks 13
2.1 Key Facts 15
2.2 Corporate vision 17
2.3 Perormance since 2005 18
Businessandoperatingenvironment 27
3.1 Background 29
3.2 Legal and regulatory ramework 29
3.3 RIIO 29
3.4 Longer term challenges 30
3.5 Regional economic outlook 32
3.6 The demand or gas on NGN’s network 33
3.7 Regional actors 35
Innovationstrategy 37
4.1 Background 39
4.2 NGN’s innovation strategy 40
4.3 Integrated business model 43
4.4 Total Network Management 46
4.5 Innovation investment programme 55
4.6 Benchmarking and best practice 65
4.7 Summary 69
Stakeholderengagement 71
5.1 Background 73
5.2 Key messages 74
5.3 Stakeholder engagement since 2005 79
5.4 Stakeholder input to RIIO-GD1business plan 80
RIIO-GD1outputorecasts 85
6.1 Background 87
6.2 Saety 88
6.3 Reliability 97
6.4 Customer service 107
6.5 Environment 112
6.6 Social obligations 120
6.7 Connections 124
Expenditureorecasts 129
7.1 Background 131
7.2 Key assumptions 132
7.3 Investment plans 139
7.4 Replacement expenditure 140
7.5 Capital expenditure 159
7.6 Operating expenditure 174
Revenueandfnancialorecasts 191
8.1 RIIO-GD1 revenue and nancialorecasts 193
8.2 Financial outcomes 194
8.3 Key nancial modelling assumptions 196
8.4 Requirement or transitionalarrangements 204
8.5 Proposed transitional arrangements 209
8.6 Rewards or rontier perormance 214
Page No. Page No.

7/22/2019 Ngn Business Plan
http://slidepdf.com/reader/full/ngn-business-plan 5/224
9
A
Impactoncustomerbills 217
9.1 Background 219
9.2 RIIO-GD1 revenue 219
9.3 Customer bills 219
9.4 Charging volatility and predictability 220
Appendicestothisdocument
A1 ENA Gas Futures scenarios
A2 TPA report on medium term economicoutlook
A3 Benchmarking and testing
A4 Innovation projects
A5 Stakeholder engagement
A6 EC Harris report on Real Price Eects
A7 First Economics report on productivity
A8 Expenditure orecast plan and tablereconciliation
A9 Pensions-Redacted
A10 Repex tier two risk threshold methodology
A11 Capex and asset health-Redacted
A12 NTS NGN capacity interaction
A13 Oxera report on cost o equity
A14 Oxera report on cash fow betas andcost o equity
A15 Oxera report on debt indexation
A16 Oxera report on long term equity returns
A17 Uncertainty and risk
A18 Regional actors
Page No.

7/22/2019 Ngn Business Plan
http://slidepdf.com/reader/full/ngn-business-plan 6/224

7/22/2019 Ngn Business Plan
http://slidepdf.com/reader/full/ngn-business-plan 7/224
7
Executivesummary 1
7/22/2019 Ngn Business Plan
http://slidepdf.com/reader/full/ngn-business-plan 8/224
8
Northern Gas Networks is thefrontier gas distribution networkin the UK.
For the past six years we have been consistently
measured by Ogem as the most cost-ecient o
the eight networks (GDNs), delivering industry-leading value or money or our 2.6m customers.
At the same time we have delivered signicant
improvements in our saety, customer service and
environmental perormance and have established
excellent levels o network reliability.
Our aim is to continue with this pace-setting
perormance as we transition rom the GDPCR1
period into RIIO-GD1. Our corporate vision is to be
consistently measured by Ogem and the Healthand Saety Executive (HSE) as a top two perormer
or saety, eciency and customer service. We are
achieving this vision and want to go urther - we
want to be measured as the best in class.
Our business plan or RIIO-GD1 is based upon
the most solid o oundations, our unrivalled track
record since 2005. But we are ambitious and plan
to set ever-improving benchmark perormances
by relentlessly improving saety, delivering better
customer service, reducing our impact upon the
environment and, most importantly, continuing to
provide excellent value or money.
We have made huge reductions in the level o risk
to our customers rom our network assets and are
the only GDN to have internationally recognised
accreditation or both saety and environmental
perormance. We are the clear leader or cost
eciency, saely delivering gas to homes and
businesses across Yorkshire, the North Eastand northern Cumbria around the clock without
interruption, even in the worst weathers. We have
also reduced the number o customer complaints
by 74% in recent years as we are committed to
getting the job right rst time, every time.
When the our GDNs were sold in 2005, Ogem
predicted a 15% reduction in controllable operating
expenditure (Opex) over the ollowing two regulatory
periods. This was on the basis o new ownersmoving into the sector and the introduction o
comparative competition.
At Northern Gas Networks (NGN) we have already
delivered an 18% saving in controllable Opex since
2005. This represents an early delivery o the ulldemerger dividend with customers beneting rom
2013/14 rather than the predicted 2018/19.
This demonstrable cost benet, together with
signicant improvements in saety and customer
service, has been delivered or the benet o gas
distribution customers across the UK, creating
signicant levels o long term value. This has been
achieved in spite o some unique challenges to our
business.
Unlike the other GDNs, or the last three years we
have not held major contracts to carry out domestic
metering work. This has resulted in an annual
stranded resource cost o around £10m, which we
have proactively managed down to £4m per year
o recurrent costs. No other GDN aces this cost
pressure and we believe this unique position should
be recognised in the setting o nancial allowances
and benchmarks.
Similarly, we ace specic regional actors which
add extra costs to our service delivery. These
include the Pennine bedrock which makes
working in our West Yorkshire conurbation more
challenging; and the engineering anomaly o double
rail secondary mains, traditionally laid in the rear
gardens o our mill towns, which increase our mains
replacement costs.
Additionally, whilst our geographic area contains
two o the six largest UK conurbations, our region
has the lowest level o population density outside
Scotland. This mixture o dense urban areas with
outlying rural centres o population at the edge o
our network adds a signicant cost burden to our
operational perormance.

7/22/2019 Ngn Business Plan
http://slidepdf.com/reader/full/ngn-business-plan 9/224
9
There are challenges to be aced rom the
Government’s desire to move to a low carbon
energy mix. We strongly believe that gas distribution
has a pivotal role to play as we transition to a low
carbon economy. The capability o our network will
be maintained – it is in the UK’s interest to retain
a strong and ecient gas distribution capability –to ensure we can meet any challenges which are
posed and to support the Government’s agenda.
This business plan is based upon what our
stakeholders have told us. Their views can largely
be broken down into three main subject areas: cost,
saety and impact upon the environment.
We have always engaged with our customers and
wider stakeholder audiences. For us it is not just
about listening to their views, it’s about involvingstakeholders.
We believe we have achieved this in developing
this business plan through one-to-one and one-
to-several conversations and meetings; not just
by asking a customer to ll in a survey orm or to
attend a public meeting. We have delivered a multi-
level engagement strategy to ensure we captured all
points o view.
Our stakeholders told us what was important tothem: delivering sae and reliable supplies o gas to
their homes and businesses at the lowest possible
price, without jeopardising saety, minimising our
eect on the environment and with high levels o
customer ocus.
When they suggested new ways o doing things
we costed them out, then went back and asked i
they wanted us to incorporate the suggestions into
our business operations. Sometimes it was yes,sometimes no. But they were involved, they made
the decisions.
We will continue with this approach, involving our
stakeholders in the decision-making processes o
our business.
We involved our stakeholders in the setting o our
overall nancial orecasts. When we presented
our initial proposals they told us they were too
expensive and highlighted the areas upon which
we should ocus. As a result, our plans have been
reduced by c.£30m a year, or c.£250m over the
RIIO-GD1 timerame. This will deliver improvementsin saety, eciency, customer service and in the
way in which we impact on the environment,
representing enhanced levels o value or money or
the users o our network.
Our stakeholders told us what they wanted us to
improve and what they were happy to maintain
at current perormance levels. Our business plan
contains 56 output measures. Based on what our
stakeholders told us, we plan to improve our current
perormance in 35 and to maintain current levels in
the remaining 21. We are proposing six voluntary
measures based upon what our stakeholders told
us was important to them, so they can track how
we perorm.
We are committed to delivering and maintaining
high levels o perormance in the most cost-ecient
way. Our stakeholders’ requirement or value or
money is directly refected in our overall expenditure
plans.
To achieve this we are taking a new approach to
network management: the Total Cost o Ownership.
This innovation will allow us to prioritise our expenditure
to manage risk and deliver the key outputs our
stakeholders demand. It will drive a higher level o
inormed decision-making about the most ecient way
o working, aligning geographic and asset perormance
data to give a greater ocus on when and where to
maintain, enhance and replace our assets.
Making this change is a natural progression rom
the strategic asset management model which
worked so successully or us in the past. A new
approach is needed to meet the resh challenges o
RIIO-GD1 and the move to a low carbon economy.

7/22/2019 Ngn Business Plan
http://slidepdf.com/reader/full/ngn-business-plan 10/224
10
We are already reshaping our organisation to
enable the Total Cost o Ownership approach to
be ully unctional ahead o the implementation o
RIIO. This integrated, customer-ocused business
model connects asset integrity management with
customer operations and programme investment.
They are intrinsically linked, working seamlesslyto place asset management and asset health at
the centre o the business, underpinning all our
investment decisions.
A new asset health model has been developed
which provides essential inormation on all the
types o asset we own, their condition and the risk
and consequence o ailure. This allows us to make
timely and ecient investment decisions and the
ability to assess the range o options available to
manage the identied risk. Our rst ull network-
wide analysis o asset health has been built into our
uture investment plans.
In order to deliver this holistic approach we are
giving a greater geographic ocus to our rontline
customer operations. This will drive higher levels o
perormance at a local level, closer to our assets
and customers, ensuring we have the right resource
available in the right place and at the right time.
To do all this requires our business to remain on
rm nancial oundations. This is a major challenge
as we move rom GDPCR1 into RIIO-GD1.
The nancial package which is required must
balance the critical nanceability actors with the
impact on customers’ bills.
We believe the nancial package contained within
this business plan achieves that balance between
customers and investors, including shareholders.
Our plan prioritises the need to minimise
customers’ exposure to signicant uture
increases in bills as a result o the capitalisation
o replacement expenditure and the move to
international nancial reporting standards (IFRS).
The transitional arrangements which we are
proposing will ensure customers are given longer
term assurances on the stability and transparency
o the costs they will incur.
Importantly, we believe our proposals will deliver
the stable regulatory ramework which is required
to attract the appropriate levels o investment
into our business in the RIIO-GD1 period and
beyond. There is also an appropriate balance to
be struck between risk and reward or customers
and investors. Shareholders continue to absorb asignicant element o risk in RIIO-GD1.
In developing the overall nancial package which
is required to deliver our business plan, we have
ensured that our proposals are compliant with
the RIIO principles including: the cost o equity;
the cost o debt; capitalisation policy; and asset
lives and depreciation. We broadly agree with the
regulator’s proposals or these parameters.
We strongly believe that as the GDN setting theeciency rontier, there will be an element o reward
or our past perormance. This has delivered
signicant cost savings or the users o our own
network and or gas distribution customers across
the UK as we have already moved the eciency
rontier beyond what was predicted at the time
o network sale. We see a sum o at least £10m
per year as being appropriate recognition or the
customer benets which we have delivered since
2005.
The key nancial parameters we have assumed
within this plan include: notional gearing at 62.5%;
a cost o equity o 7.2%; a cost o debt o 2.8%
(average); a notional equity return on Regulatory
Asset Value (RAV) o 5%; transitional arrangements
to maintain credit metrics; and a depreciation
prole based upon a sum o digits methodology.
Our revenue requirements are broadly in line with
those o GDPCR1 (excluding the impact o IFRS),
averaging c.£342m per year over the eight years o
the price control. Our overall nancial package will
support the investment o more than £1.2bn in the
network over the eight years o RIIO-GD1. (These
are in 2009/10 prices.)

7/22/2019 Ngn Business Plan
http://slidepdf.com/reader/full/ngn-business-plan 11/224
11
Our plan will see more than 4,100km o ageing
metal gas mains replaced with new, saer
plastic pipes; a reduction in carbon emissions
equivalent to 500,000 tonnes o carbon dioxide;
the recruitment o more than 250 apprentices
into our business; 6,500 homes connected to
the gas network and removed rom uel poverty;£25m invested in innovation; the removal o all
the gasholders in the North o England; and a 1%
per year improvement in the productivity o our
workorce.
This will demonstrably deliver better value or our
customers and signicant levels o investment in
the economy o the North o England. It will provide
a saer gas distribution network with ewer leaks,
reduced risk, improvements in customer service,
enhanced levels o innovation, reduced levels o uel
poverty and a signicant shit towards the low carbon
economy which the Government has committed to.
Our network is already driven by what our
customers tell us. That will increase in the
uture as we develop new ways o involving our
stakeholders. Our expenditure plans or RIIO-GD1
are derived rom our existing industry-leading levels
o eciency. We are committed to continuing to
deliver real improvements in productivity and cost-eciency.
Our nancial proposals balance the requirements
o all the stakeholders in our network: customers,
shareholders and other providers o nance who all
have a vested interest in ensuring risk and reward
are equalised, in the short, medium and longer term.
With the balancing o revenue and expenditure,
as proposed in this business plan, we will make
signicant improvements in our physical network,
enhancing its health, integrity and saety and
ensuring it is capable o playing its role in the UK’s
transition towards a low carbon economy. This
will be supported by our strategy or investment
in research and the development o innovative
technologies, processes and commercial
arrangements which will enable NGN, and the
wider gas distribution sector, to meet the signicant
challenges o the uture.
All these increased outputs can be delivered,
saely, eciently and sustainably, or a one penny
a day increase in our customers’ bills. In return, we
will continue to drive innovation in managing our
network; we will build upon our rontier position,
working closely with our stakeholders to ensure our
customers continue to get value or money; and wewill do this saely, eciently and sustainably.
Customers will receivesignicantly more value for anincrease in gas bills of one pennyper day. We believe this plandelivers tremendous value formoney for customers.

7/22/2019 Ngn Business Plan
http://slidepdf.com/reader/full/ngn-business-plan 12/224

7/22/2019 Ngn Business Plan
http://slidepdf.com/reader/full/ngn-business-plan 13/224
13
NorthernGasNetworks 2NGN was created in June 2005 with the sale of four of the eight gas
distribution networks owned by National Grid. This section explains
how NGN works to a corporate vision which is supported by a range of
performance measures. It details how NGN has performed against these
measures for the past six years, delivering natural gas in the most
cost-efcient way to 2.6m users across northern England.

7/22/2019 Ngn Business Plan
http://slidepdf.com/reader/full/ngn-business-plan 14/224
14
Executive summaryNGN is the most ecient gas distribution network
in the UK.
This is evident rom the benchmarking o the
nancial perormance o the eight GDNs since
2005/6 and has delivered signicant benet or gasdistribution customers across the North o England,
and or gas users across the UK as a whole. We
deliver a high value, cost-ecient service to our
customers.
The reductions in the cost o operating our network
total 18%, which represents early delivery o the
demerger dividend which was predicted at the time
o network sales in 2005. It was expected to take
two ull regulatory periods to deliver cost savings
o 15%, through the introduction o new network
owners and comparative competition. We have
delivered the benet in one regulatory period.
At the same time we have taken massive steps
orward in improving saety in our network,
removing the risk rom ageing metallic mains and
reducing the number o accidents in our network.
Customer service perormance has also seen a
signicant improvement, with a reduction in the
number o complaints o c.74% when compared
to 2007. Excellent levels o network asset reliability
underpin this perormance.
This level o perormance has been achieved
through the implementation o a challenging
network vision, which refects the primary
objectives o the business to be a top perormer
in eciency, saety and customer service while
at the same time recognising our environmental
responsibilities. That vision is being achieved.
We have a strong track record in delivering our
commitments to customers and have an industry
leading perormance which will continue to provide
a value or money service through the RIIO-GD1
period.

7/22/2019 Ngn Business Plan
http://slidepdf.com/reader/full/ngn-business-plan 15/224
15
2.1 Key factsNorthern Gas Networks is the licensed gas
transporter or the North o England. We are
responsible or the sae and ecient delivery o gas
to homes and businesses in West, East and North
Yorkshire, the North East and northern Cumbria.
• Our network
- has 37,000km o pipeline
- covers 25,000km2
- serves 2.6m customers.
• 50% o our customers are located in two o thelargest conurbations in the UK.
• The remainder are in sparsely populated rural
areas taking in our national parks.
• Our network transports 82,000 GWh o energy
annually.
• We are a signicant regional employer with a
highly skilled workorce o more than 1,200 sta
and 800 contractors.
• We invest £120m annually in the inrastructure o
the region.
Figure 2.1: The geographic area served by NGN
Workington
Carlisle
Newcastle-upon-Tyne
Berwick-upon-Tweed
Sunderland
Middlesbrough
Scarborough
York
Leeds
Hudderseld
Hull
< 23
148 - 322
323 - 866
867 - 2,337
> 2,337Key: Population density -number o people per km2 per local authority district.

7/22/2019 Ngn Business Plan
http://slidepdf.com/reader/full/ngn-business-plan 16/224
16
NGN is owned by a consortium o three partners.
The consortium constitutes a robust, well
capitalised shareholder group which has signicant
global experience in the ownership and operation
o utility and inrastructure businesses.
We have sought to exploit the synergies and
benets that come rom being part o this large,
multi-national group o companies and will continue
to leverage these commercial relationships to
deliver ongoing eciencies and productivity.
The strong, stable regulatory ramework in the UK
has been a key actor in attracting investors o the
stature o NGN’s ownership group. Such investors,
with signicant experience in international utilities
and inrastructure assets, who look to invest or
the longer term, will be key players in delivering thenecessary investment required to meet the UK’s
uture energy and environmental challenges.
All three owners are committed to building on the
network’s inheritance o providing sae and reliable
operations and to maintaining NGN as a socially
responsible corporate citizen in the region. These
will continue to be key elements o our business
plan as we meet the uture challenges over the
short, medium and longer term.
Figure 2.2: NGN’s ownership structure
Power Assets Holdings
Limited
NORTHERN GAS NETWORKS LIMITED
Northern Gas Networks
Holdings Limited
SAS Trustee Corporation
Northern Gas Networks
Finance Plc
Northern Gas Networks
Operations Limited
Cheung Kong Inrastructure
Holdings Limited

7/22/2019 Ngn Business Plan
http://slidepdf.com/reader/full/ngn-business-plan 17/224
17
2.2 Corporate vision
A corporate vision was introduced in 2005,
refecting the primary objectives o the business:
saely, eciently and sustainably delivering a secure
supply o gas to our customers.
The vision is based rmly within the scope o NGN’s
role as a monopoly utility service provider and has
provided a robust basis against which we have
successully addressed the challenges aced since
June 2005. This vision remains appropriate as NGN
adapts to the additional challenges that a changing
energy market will present as the UK moves towards
a low carbon economy.
Our corporate vision is supported directly by
our business values which refect the way our
employees deliver their roles and activities. The
consistent demonstration o our values in our dayto day business activities has helped build a culture
that drives sustainable business perormance.
• Believing in a workplace ree o accidents and
injuries.
• Valuing and rewarding our employees or their
contribution to the business.
• Motivating our contractor partners to
continuously improve perormance or mutualbenet.
• Treating customers as we would wish to be
treated.
• Maintaining high standards o corporate
governance.
• Taking pride in being a respected part o the
community.
• Achieving the expectations o our owners.
To be benchmarked by Ofgem andthe HSE consistently in the top twocomparable utilities for safety, efciencyand customer service.

7/22/2019 Ngn Business Plan
http://slidepdf.com/reader/full/ngn-business-plan 18/224
18
2.3 Performance since 2005
We have a strong record o industry leading
perormance since 2005.
• Set new benchmark standards or cost eciency
to drive increasing value or our customers.
• Improved saety perormance has reduced
the number o people injured in our network to
record low levels.
• Customer service perormance has improved
year on year as we drive down the number o
complaints.
2.3.1 NGN has already delivered the
demerger dividend
An assessment o our perormance since 2005
provides a very good benchmark o the eectiveness
o our corporate strategy and, importantly, NGN’s
ability to deliver the commitments set out in this
business plan or RIIO-GD1.
It was predicted that the sale o the gas networks
by National Grid in 2005 would result in signicant
reductions in controllable operating expenditure
(Opex) over two regulatory periods through new
ownership and comparative competition, reerred
to as the demerger dividend.
NGN has delivered this benet in just one
regulatory period, through driving consistent yearon year eciencies whilst improving customer
service and saety.
This represents early delivery o the ull demerger
dividend as the benet to customers o network sale.
Customers benet rom lower transportation
charges immediately and will continue to benet
rom 2013/14 instead o waiting until 2018/19.
This equates to an industry leading 18% real
reduction in controllable Opex since 2005.
Figure 2.3: Controllable operating expenditure (Opex)

7/22/2019 Ngn Business Plan
http://slidepdf.com/reader/full/ngn-business-plan 19/224
19
2.3.2 Efciency
At the start o GDPCR1 NGN was assessed to be
the most ecient GDN. By setting these rontier
levels o perormance, we have enabled Ogem
to set the benchmark or all GDNs, so delivering
signicant levels o value or all gas distribution
customers.
We have continued to set rontier levels o
perormance and provide the standard by which
other GDNs should be assessed. In using this
approach Ogem will be able to return urther
signicant amounts o value to customers during
RIIO-GD1.
Our perormance over the last six years has
demonstrated how the company has successullydeveloped a culture o continual improvement,
clearly driving corporate initiatives to improve
eciency.
2005/6 2006/7 2007/8 2008/9 2009/10 2010/11
Opex
Repex
Totex
Figure 2.4: Ogem’s eciency analysis o NGN
7/22/2019 Ngn Business Plan
http://slidepdf.com/reader/full/ngn-business-plan 20/224
20
R
e p e x a n d C a p e x
Top 25% National Grid - West MidlandsWales and West Utilities
Between
25% - 50%
National Grid - East o England
National Grid - North West
National Grid - North West
Wales and West Utilities
Between
50% - 75% National Grid - East o England National Grid - West Midlands
Scotland Gas Networks
Scotland Gas Networks
Bottom
25%National Grid - London
National Grid - London
Southern Gas Networks
Southern Gas Networks
Key
2009/10 perormance
2008/09 perormance
Bottom
25%
Between
50% - 75%
Between
25% - 50%Top 25%
Total Opex
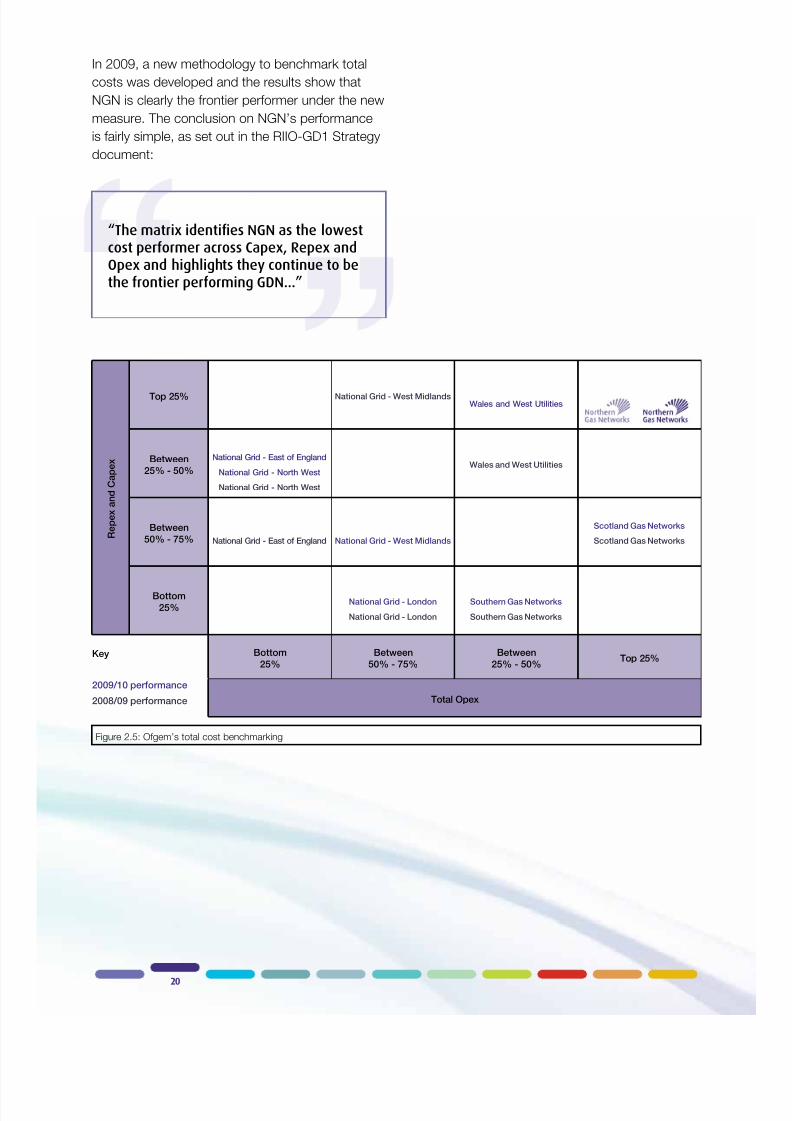
Figure 2.5: Ogem’s total cost benchmarking
In 2009, a new methodology to benchmark total
costs was developed and the results show that
NGN is clearly the rontier perormer under the new
measure. The conclusion on NGN’s perormance
is airly simple, as set out in the RIIO-GD1 Strategy
document:
“The matrix identies NGN as the lowestcost performer across Capex, Repex andOpex and highlights they continue to bethe frontier performing GDN...”

7/22/2019 Ngn Business Plan
http://slidepdf.com/reader/full/ngn-business-plan 21/224
21
NGN’s rontier perormance allows the regulatory
ramework to create enormous benet or gas
customers across the UK by moving all companies
to the benchmarked rontier level o eciency.
Setting all GDN expenditure allowances in line
with NGN’s rontier levels o eciency will reduce
costs or gas customers right across the RIIO-GD1period.
Based on a range o techniques, we can be seen
to have delivered signicant value or customers
through extending the rontier. This benet could
total in excess o £200m in RIIO-GD1. Rewards or
rontier perormers creates the correct incentive
ramework both within and across regulatory
periods. As an example, the graph below shows
the aggregate annual industry cost savings (using
2008/09 and 2009/10 industry costs) that NGN
has driven through operating as the most ecient
GDN rather than an average GDN.
In addition to Ogem’s analysis we have
corroborated NGN’s perormance throughout
this business plan with our own benchmarking,
including international benchmarking exercises with
gas distribution operators in the US and Japan,
and comparative assessment o various parts o
NGN’s operations. These conrm our status as a
rontier perormer within gas distribution and also in
comparison to other sectors.
2.3.3 Customer service
The importance o customer service to NGN is
demonstrated by our corporate vision. Together
with saety and cost-eciency, customer service
is prioritised as being a business-critical activity
which is crucial to the continued success o the
company.
Number of complaints
We have reduced the number o complaints
received by the business by c.74% since 2007.
We believe reducing the number o complaints is
a key perormance indicator. It is a measure o the
quality o our operational (ront line) delivery andcustomer service.
Reducing the number o complaints we receive will
continue to be a key ocus and a key indicator o
our customers’ overall satisaction with the service
we are providing.
Figure 2.6 : Value created by NGN rontier per ormance Figure 2.7: Number o complaints received
0
5
10
1520
25
30
35
40
Opex Repex Totex
A g g r e g a t e i n d u s t r y
a n n u a l c o s t s a v i n g s
( £ m 2
0 0 9 /
1 0 p r i c e s )
Annual value for customers created by
NGN’s frontier performance
14
23
37

7/22/2019 Ngn Business Plan
http://slidepdf.com/reader/full/ngn-business-plan 22/224
22
Customer satisfaction surveys (CSS)
Undertaking quarterly surveys o customers’
opinions was started in 2005, or customers
who had experienced an unplanned gas supply
interruption (repair and emergency) and or those
who had experienced a planned supply interruption
(replacement).
A survey o connections customers was started
in 2008. NGN’s customer service scores in the
surveys since 2008/9 are set out below.
Standards o customer service across the GDNs
are consistently high with customers rating
perormance across the three categories at an
average o 7.7 out o 10. The average ‘spread’
between the highest and lowest scoring GDNs is
typically less than one point.
Since 2008/9 (when scoring was introduced on
a consistent 1 - 10 basis) NGN has achieved
scores at or above the industry average or repair
and replacement. Whilst our perormance in
connections was initially below average, this hasimproved signicantly to where we are well above
average in 2010/11 and are now a consistent upper
quartile perormer.
We remain committed to consistently achieving
a top two level o perormance in the customer
service surveys.
Figure 2.8: Ogem CSS Repair & Emergency Figure 2.9: Ogem CSS Replacement
Figure 2.10: Ogem CSS Connections

7/22/2019 Ngn Business Plan
http://slidepdf.com/reader/full/ngn-business-plan 23/224
23
2.3.4 Health and safety
The importance o saety is highlighted by eedback
rom stakeholders, where it is consistently ranked
as an important element o our activities. NGN
is committed to protecting the saety, health and
welare o our employees, those who work directly
or us and on our behal. We believe it is our
responsibility to deliver our operations in a way
which protects public saety at all times.
In 2007 NGN achieved certication to the
Occupational Health and Saety Standard, OHSAS
18001, and we have an integrated health, saety
and environmental management system. OHSAS
18001 demonstrates NGN’s commitment to health
and saety including, amongst others, to:
• Lower or eliminate the risk o ill health or injury
to our employees, contractors, visitors and
members o the public;
• Comply with applicable laws, regulations and
other requirements;
• Continually improve our health and saety
perormance through the development o targets
and objectives; and
• Conorm to national health and saety best
practice.
Working to OHSAS 18001 means that NGN
can manage risk, demonstrate diligence, gain
assurance, prevent downtime, and potentially
reduce liability claims and insurance premiums.
We believe that all work-related injuries and
illnesses are preventable. We have integrated saety
and occupational health considerations into all our
business decisions to help ensure the saety o our
workorce and the public.
These principles, allied to a strong management
commitment to saety and a nancial incentive
ramework or all employees and contracting
partners, have resulted in a demonstrable
improvement in saety perormance.
Operational safety
Since taking ownership o the network we have
signicantly reduced the number o lost time
injuries (LTIs) within our workorce, both our direct
employees and those o our contract partners.
We have also signicantly reduced the number o
members o the public (MOP) injured as a result o
our works.
We have successully introduced initiatives such asthe It’s Your Call scheme that encourages sta and
members o the public to report to us directly any
incidents or practices that they believe pose a risk
to operational saety.
We have an overall objective to reduce the number
o LTIs and MOPs on our network to zero. We have
set ourselves stretching targets over the RIIO-GD1
period to achieve this objective.
Figure 2.12: Number o LTIs
Figure 2.11: Number o injuries to MOP

7/22/2019 Ngn Business Plan
http://slidepdf.com/reader/full/ngn-business-plan 24/224
24
Asset safety
Additionally, since 2006 we have almost halved the
amount o risk in the distribution network rom our
iron mains. By targeting our replacement programme
to address those iron mains that pose the greatest
risk to the public we have succeeded in removing a
higher percentage o risk per km o main.
We have ranked consistently in the top two
perormers in the percentage o repairs completedwithin 12 hours. Direct eedback rom HSE
representatives strongly indicates that NGN is
regarded as one o the best perorming networks
by the HSE across all gas distribution activities.
2.3.5 Environmental impact
NGN is ully aware o the impact that our
operations have upon the wider environment and
the local communities we serve. We are committed
to operating our business in an environmentally
responsible and sustainable manner, ensuring at all
times that any potential adverse impact upon the
environment is minimised.
We hold ISO 14001 certication. This internationally
recognised environmental management standard
delivers a ocus on the ollowing.
• Reducing adverse environmental impacts.
• Delivering continual environmental perormance
improvements.
• Complying with all applicable environmental
requirements.
• Conorming to national environmental best
practice.
Natural gas emissions
Methane, the main constituent o the natural gas
we transport, is a potent greenhouse gas. The
principal contribution we can make to improve the
environment is to reduce leakage rom our network.
This leakage occurs through pipeline joints, seams
and other assets as gas is transported through the
gas distribution network and represents around
0.06% o total throughput.
Since 2005, we have reduced leakage by more
than 10%, approximately 185,000 tonnes o carbon
equivalent (tCO2e). We have achieved this througha programme o pipeline replacement, reducing
system operating pressures, treatment o pipeline
joints and seals, the capture o gas vented during
street works and managing gas escapes within the
agreed standards o service.
Figure 2.14: Percentage o repairs completed within 12 hours
Figure 2.13: Target population and total risk remaining (normalised)

7/22/2019 Ngn Business Plan
http://slidepdf.com/reader/full/ngn-business-plan 25/224
25
Carbon emissions
We also actively measure, monitor and manage
our non-leakage business carbon ootprint
which in 2010/11 equated to 11,376 tCO2e. This
is the amount o carbon which we emit to the
atmosphere through the operation o our vehicle
feet, the energy we use in our oces and depots
and in the day-to-day operations o our business.
We have made signicant progress in reducing our
impact on the environment since 2005. There is
more we need to do over the next decade. We are
committed to making urther signicant progress inthe uture.
NGN has a strong track record of delivering its commitments since 2005. This businessplan is built directly upon the industry leading performance detailed above and deliversadditional and continual improvement across RIIO-GD1.
Figure 2.15: NGN’s business carbon emissions 2010/11

7/22/2019 Ngn Business Plan
http://slidepdf.com/reader/full/ngn-business-plan 26/224

7/22/2019 Ngn Business Plan
http://slidepdf.com/reader/full/ngn-business-plan 27/224
27
3Businessandoperatingenvironment
NGN must operate within a legal and regulatory framework which dictates
required performance levels. This brings with it a range of challenges:
some are specic to the gas distribution industry; some are as a result
of the economic situation; and some are geographic issues. This section
details these challenges and NGN’s approach to managing them.

7/22/2019 Ngn Business Plan
http://slidepdf.com/reader/full/ngn-business-plan 28/224
28
Executive summaryNGN’s purpose is to deliver natural gas to 2.6m
users across the North o England, saely, cost-
eciently and sustainably, at all times meeting the
legal and regulatory demands on our business.
The role o gas distribution will change as the UK transitions towards a low carbon economy, but
we believe that gas has a signicant role to play
in the uture energy mix. It is in the UK’s interest
to maintain strong and ecient gas distribution
networks in order to meet the Government’s
environmental objectives, at signicantly lower cost
than other alternatives.
Demand or gas has been reducing in our region
or several years and we orecast that this trend will
continue during RIIO-GD1. However, there will be
a need to reinorce the network to meet localised
organic changes in customers’ demand patterns
and to maintain a ocus on saety, reliability and
value or money.
The economic outlook presents a gloomy picture
in the short and medium term. Economic growth
in our region has remained below the UK average
since 1990 and the impact o the recession was,
and continues to be, more markedly elt in the
North. These key economic elements have been
included in our business plan. Additionally, there
are a range o unique regional actors which impact
upon NGN and add an additional cost burden to
the delivery o our operations. These include the
act that we have the lowest customer density
with the greatest network coverage o all the eight
GDNs. While we have two o the UK’s largest six
conurbations within our region, we have the lowest
population density o anywhere in England or
Wales.
We believe these additional costs should be
recognised and refected in our benchmarking and
cost allowances.

7/22/2019 Ngn Business Plan
http://slidepdf.com/reader/full/ngn-business-plan 29/224
29
3.1 BackgroundNGN has a unique role in the business environment
o the North o England. We are responsible or
the sae, continual delivery o natural gas to users,
transporting the uel over long distances, through
towns and cities, into the homes and businesses
o 2.6m customers. We are largely invisible, even
unrecognised, yet our role is o great importance to
those who rely on us or uninterrupted supplies o
gas or their daily use.
We are a critical element in the region’s
inrastructure and are the primary delivery route
or energy in the North o England. During periods
o peak demand our network is transporting up
to our times as much energy as the electricity
networks in our region.
The energy industry in the UK aces signicant
challenges i the issues o the environment,
sustainability and consumer energy requirements
are to be eectively addressed while maintaining
the historical ocus on reliability, saety and value or
money.
This plan takes ull consideration o the business
environment in which we operate, recognises the
key drivers or change in the short, medium and
longer term and the stern challenges which we ace
at regional and national level.
3.2 Legal and regulatoryframeworkNGN operates in a legislative and regulatory
ramework determined by three elements o
primary legislation: the Gas Act (1986), the
Health and Saety at Work Act (1974) and the
Environmental Protection Act (1990). We operate
under a Gas Transporter’s Licence granted by
Ogem which denes the broad range o licensed
activities and responsibilities and sets out the rules
and standards to which the company must adhere.
This ramework ocuses our obligations on quality
o service to customers, ensures the sae operation
o the network and regulates prices to ensure that
we carry out our activities in an ecient,
non-discriminatory manner.
3.3 RIIOIn 2009, the traditional RPI-X approach to network
price controls was updated with the introduction o
the RIIO principles. This provides a broader toolkit
with which networks and Ogem can address the
uture energy and environmental challenges aced
by the UK. These key principles are ully embeddedin our plan or RIIO-GD1 and beyond.
• Outputs ocused – at the heart o our plan is the
commitment to the ecient delivery o specied
outputs in RIIO-GD1.
• Stakeholder led – outputs, levels o expenditure
and the impact upon customer bills refect the
views expressed by our stakeholders.
• Strong incentives or ecient delivery – theplan is based upon industry leading levels o
eciency and signicant continuing productivity
and service improvements.
• Requirement or innovation – the plan includes
a strategy or innovation to address the key
challenges in RIIO-GD1 and into the uture.
• Ensuring investment is nanceable – the plan
includes a ully justied and nanceable package
that maintains strong investment grade creditratings.

7/22/2019 Ngn Business Plan
http://slidepdf.com/reader/full/ngn-business-plan 30/224
30
3.4 Longer term challenges The need or change in the energy industry has
been embraced by the Government and the extent
o the challenge rom climate change is widely
accepted. Legislation was introduced in 2008 to
create a legally binding, long term ramework to cut
greenhouse gas emissions. This means that the UK
cannot continue to produce and consume energy
into the uture as we do currently.
These policy developments raise the question o
what role gas has to play in the uture energy mix.
To help inorm this debate, NGN along with all other
GDNs and National Grid Gas Transmission, via the
Energy Networks Association Gas Futures Group
(ENA GFG), undertook a long-range scenario
based modelling study o the uture utilisation o gas to 2050, and the consequential impacts o
this or gas networks. The study analysed our key
scenarios with each identiying a separate pathway
to delivering the Government’s policy objectives to
cut greenhouse gas emissions by 2020 and urther
by 2050.

7/22/2019 Ngn Business Plan
http://slidepdf.com/reader/full/ngn-business-plan 31/224
31
Alongside these issues, international market
developments such as the discovery o large
resources o shale gas, have the potential toundamentally change the economics o the
energy mix in the UK and deliver reductions in
energy costs in the longer term. Additionally, there
are renewed uncertainties about the uture role
o nuclear energy in the UK. Given the level o
uncertainty that exists on all these issues, there
appears to be signicant value in retaining the
option or a ‘high gas’ uture both in the transition
to a low carbon economy and also as part o the
longer term energy mix.
This plan is based upon a core assumption that
gas and the gas distribution networks have a
signicant role to play in the transition to a low
carbon economy and a potentially signicant role
in the energy mix o the uture. Consequently, the
capabilities o the gas distribution networks must
be retained i the benets identied above are to be
delivered.
The key messages rom this analysis are as
detailed below.
• An ongoing role or gas is ully compatible with
achieving the Government’s environmental
objectives.
• Gas could oer a cost-eective solution or a low
carbon transition whilst meeting the signicant
peak heat demand (more than £700bn lower
than electrical revolution over the 2010 to 2050
period).
• All potential pathways to a low carbon uture will
require signicant investment in new technology,
including carbon capture and storage, bio-
methane injection, dual uel and/or district
heating systems.
• Maintaining gas will enhance the diversity o
the energy supply mix and provide necessary
fexibility at times o low renewable output.
Commercialisation o electricity and heat storage technologies
Low/slow High/rapid
C o m m e r c i a l i s a t i o
n o f c a r b o n c a p t u r e a n d s t o r a g e t e c h n o
l o g i e s
High/rapid
Green gas
Transmission-delivered gas 2050: HIGH
•Gas+CarbonCapture&Storage(CCS)•Someunabatedgasforbalancing
Distribution-delivered gas 2050: HIGH
•DualFuelfordomesticheating
•Bio-methanegridinjection
•Districtheating+CCS
•SomeuseofCompressedNaturalGas
(CNG) in transport
Storage solution
Transmission-delivered gas 2050: HIGH•Gas+CCS
•Smallamountofunabatedgas
•Additionalbalancingviaelectricitystorageand
demand side response
Distribution-delivered gas 2050: HIGH
•Heatingandtransportlargelyelectried
•Heatstorageusedtobalanceseasonalheat
Low/slow
Gas versatility
Transmission-delivered gas 2050: LOW
•Renewables/nucleardominate
•Someunabatedgasforbalancing
Distribution-delivered gas 2050: HIGH
•Bio-methaneatmaxpotential
•SomeuseofCNGintransport
Electrical revolution
Transmission-delivered gas 2050: NONE
•Renewables/nucleardominate
•Balancingviaelectricitystorage,exiblenuclear•interconnectionanddemand-sideresponse
Distribution-delivered gas 2050: NONE
•Heatingandtransportlargelyelectried
•Heatstorageusedtobalanceseasonalheat
Figure 3.1: Gas Futures Group scenario analysis

7/22/2019 Ngn Business Plan
http://slidepdf.com/reader/full/ngn-business-plan 32/224
32
3.5 Regional economic outlookDuring 2008/9 and 2009/10 the UK economy
experienced the most severe economic recession
since the 1930s, with six consecutive quarters o
negative GDP growth beore a nal return to growth
in 2010. The economic recovery in the period since
then has been ragile with output alling back during
late 2010. This period o tentative economic recovery
has also been characterised by a period o high
infation, uelled extensively by high energy and
commodity prices which have acted as a signicant
brake on urther recovery as disposable incomes
have allen in real terms.
Changes in national and regional economic
conditions have a direct and sometimes signicant
impact upon key aspects o our activities and thewider gas distribution network. The economic
downturn during 2009 and 2010 led directly to a
signicant reduction in the demand or gas with
throughput on our system alling by around 4%
in 2009 compared to 2008 beore recovering
modestly during 2010. Likewise, applications or
new connections to our network ell sharply during
2008, 2009 and 2010 as the impact o recession
slowed the development o new housing; high
energy prices seemingly deerring decisions toswitch to gas.
At the time o writing, the likely period o transition
rom recession to more sustained economic
growth is still highly uncertain. The Bank o England
projections o GDP growth are very widely spread
and to some degree refect the recent dip in the
economy. They could be viewed as presenting a
not overly optimistic picture in the very short term.
The key economic assumptions underlying this
plan include the ollowing.
• Gross Value Added (GVA) growth or our
network is assumed to remain fat at last year’s
rate (1.49%) or a urther two years as Britainstruggles to recover rom the recession. It is
then anticipated to return to the same three
year economic cycle that has been experienced
with an average rate equal to the long term
non-recessionary average. GVA growth in our
region has been below the average or Britain in
the period 1990 to 2009, with the impact o the
recession being marginally more severe in both
2008 and 2009.
• Gas prices have shown signicant increases
since 2002 or households and eectively rom
1999 in the non-domestic market. These have
been driven by the wholesale gas price, which
has in turn been driven by rising oil prices. Prices
are orecast to maintain 2011 levels (in real terms)
across the plan period.
• Ater a period o relative low increases in the
Retail Price Index (RPI), Consumer Price Index
(CPI) and RPIX (RPI minus mortgage payments)
during the rst three quarters o 2009, all indices
rose sharply in the last quarter o 2009 and
continued to rise during 2010 and into 2011. RPI
in this plan is orecast to remain above 4.5%
during 2011, alling to 3.3% by 2013 and settling
at 2.5% rom 2018 onwards.
Our region has one o the highest levels o uel
poverty in England with approximately 24% (660k)o all households in our region being classed as
uel poor. The current economic climate is likely
to see this rise. In partnership with a number o
parties, we help by providing access to lower cost
gas heating.

7/22/2019 Ngn Business Plan
http://slidepdf.com/reader/full/ngn-business-plan 33/224
33
3.6 The demand for gas onNGN’s network
The amount o gas being delivered through NGN’s
network has allen signicantly in recent years. Total
annual demand or gas was 14% lower in 2010/11
when compared to 2005/6. These reductions have
been driven largely by sustained high energy prices
and the economic recession which have stimulated
increased energy eciency and changes in the
patterns o usage o gas.
Peak demand, while estimated to have allen
over the same period, has been more resilient to
the drivers o change in annual throughput. Cold
winters in 2009/10 and 2010/11 in particular have
demonstrated that the relationship between annual
and peak demand is not linear and that periods o
very cold weather will see demand or gas increase
accordingly.
Our orecasts o throughput or the period to 2021
are based upon the likely economic scenario and
take account o the impact o continued high
energy prices and the wider environmental agenda
on the demand or gas on the network. Annual
throughput is orecast to continue to all over the
period as consumers continue to change the wayin which they consume energy, despite relatively
strong growth in underlying economic drivers. This
is shown below.
Figure 3.2: NGN orecast annual throughput Figure 3.3: NGN orecast peak day 1 in 20 demand

7/22/2019 Ngn Business Plan
http://slidepdf.com/reader/full/ngn-business-plan 34/224
34
Our demand orecasts have been derived against
three economic and energy eciency scenarios.
Each represents a valid background against which
to assess uture levels o demand across the
period, taking into consideration the large range o
uture uncertainties that surround key economic
drivers. We have chosen the central scenario asthe basis o our demand orecasts in RIIO-GD1.
These scenarios are set out in Appendix A2.
Annual demand is orecast to all a urther 5%
during the RIIO-GD1 timerame, largely driven by
reductions in the domestic sector as consumers
become more ecient in how they consume
their energy. The industrial and commercial
(I&C) and manuacturing sectors also expect
to see reductions in demand. This is against a
background o nationally increasing demand or
energy over the whole period.
Peak day demand (1:20) is orecast to all by only
3% over the period. Recent history has shown
that demand proles are becoming more ‘peaky’
in nature as consumers respond to economic
conditions and high energy prices. This trend is
orecast to continue over the next 10 years with
peak demand orecasts being more resilient than
average annual demand as consumers reversetheir more rugal behaviour during the periods o
coldest weather.
The investment programme set out within this
plan has been tested directly against the range
o peak demand orecasts outlined above. A key
point to consider is that none o the three scenarios
provides a requirement or any general network
reinorcement to support growth in demand.
However, the plan does refect a requirementor small localised, reinorcements to overcome
specic constraints on the network.
7/22/2019 Ngn Business Plan
http://slidepdf.com/reader/full/ngn-business-plan 35/224
35
3.7 Regional factorsOur operating environment contains a range o
geographic, social and commercial actors which
infuence the level, type and costs o activities we
carry out. These ‘regional actors’ can be identied
as those which impact upon NGN in a manner that
is not consistent with other GDNs and must be
addressed when drawing any direct comparisons
within the industry.
These include the ollowing.
• Geography and demographics Our network has the lowest customer density
with the greatest network coverage o all the
GDNs. We are also impacted by having some
o the largest conurbations in the UK on the
periphery o our region, in particular on the east
coast. This results in a requirement to provide a
higher level o resource and acilities to serve the
more remote regions. This imposes additional
operating costs to maintain the our ‘rural’
depots in the network. The NGN region has two
o the UK’s top six conurbations yet 97% o the
region has the lowest population density outside
Scotland and contains our national parks. We
calculate that maintaining higher resource levels
and depots to service these areas is equivalent
to a urther c.£4m per year, impacting our
operating costs.
• West Yorkshire There are unique combinations o actors in this
region, including ‘steel rail’ services (secondary
mains usually ound in back gardens). Pennine
bedrock and the street design o our mill towns
have added a clear premium to mains and
service replacement costs which can be clearlyseen in contractor rates when compared to
the north o our region. This equates to c.£3m
additional annual costs.
• Loss of meterworkMeterwork has been used historically by
the GDNs to oset the standing time o the
emergency response workorce. In 2008, NGN
was not successul in retaining these contractual
arrangements, leading to the stranding o
resource costs o c.£10m annually within the
regulated business. We have reduced these by
more than 60% by 2010/11 to ecient levels.
However NGN still aces c.£4m o recurring
costs annually. No other GDN has yet aced this
issue and can still allocate large elements o cost
rom the regulated business into non-regulated
activities.
Further details on these regional actors can beound in Appendix A18.

7/22/2019 Ngn Business Plan
http://slidepdf.com/reader/full/ngn-business-plan 36/224

7/22/2019 Ngn Business Plan
http://slidepdf.com/reader/full/ngn-business-plan 37/224
37
4Innovationstrategy
Innovation allows a company to adapt the way in which it provides its
services, reacting to a changing environment to ensure it continues to
deliver optimal performance. When NGN was created it chose to operate
a unique asset management model, which it is now changing as the
company reacts to the challenges of a new price control period and the
move to a low carbon economy in the UK. This section explains how NGN
has and will continue to use innovation.

7/22/2019 Ngn Business Plan
http://slidepdf.com/reader/full/ngn-business-plan 38/224
38
Executive summaryInnovation is the lieblood o a successul
organisation. It delivers the incremental and
sustainable changes in business perormance to
keep the organisation at the leading edge o its
capabilities.
NGN’s industry leading perormance over the last
six years was built upon our innovative approach
to setting the benchmark or ecient, sae and
customer-ocused service delivery. The way in
which we historically operated the business, using
the strategic asset management model, was a rst
in the gas industry. Now we ace the challenges
o moving to a low carbon economy against the
backdrop o a turbulent economic situation, we will
innovate to ensure we continue to manage a cost-ecient and customer-driven business.
Our organisation is evolving to give a clear ocus
on the Total Cost o Ownership (TCO). We are
implementing an integrated business model, taking
an holistic view o asset management to meet
the complex perormance challenges and cost
pressures o the uture. It will be driven by Total
Network Management (TNM) which provides a
deeper approach to asset management. Thiswill drive investment decisions across single and
multiple output measures to inorm expenditure
based upon providing the best value or money.
We will work inclusively with business and industry
partners, our employees and other stakeholders,
to benchmark ourselves against other leading
international businesses and ensure we remain the
most cost ecient, saest and customer ocused
GDN in the UK.
Our new business model and approach to
managing the network are wholly consistent with
the principles o RIIO. We will use innovation as a
tool to research, evaluate and implement new ways
o doing things, sustaining our rontier position
and driving increasing levels o value or our
stakeholders.

7/22/2019 Ngn Business Plan
http://slidepdf.com/reader/full/ngn-business-plan 39/224
39
4.1 BackgroundNGN has a strong track record in developing
and implementing targeted innovation. This is a
product o the unique challenges we ace in the
provision o our core services. Innovation has
encompassed corporate, commercial, technical
and process developments which have all delivered
signicant benets to customers and stakeholders
since 2005. This includes delivering the ‘demerger
dividend’ early and generating an 18% reduction in
controllable operating expenditure.
Time Period Pre - 2005 2005 to 2010 2011 to 2013 RIIO-GD1
Key business
challenges
•Day to daymanagement
o the network.
•Step change incommercialisation andeciencies to meetdemerger expectations.
•Disciplined control o demerger cost anddelivery o step changes inoperational perormance.
•Continue to meetstakeholder expectations.
•Continue to driveproductivity and value ormoney.
•Ensure the network cantransition to a low carboneconomy.
•Responding to new andsmarter technology.
•Other sources o gas in thenetwork.
•Potentially changing usagepattern o energy.
Key innovations•PE pipes.
•Insertion.
•Market-tested strategicasset managementmodel underpinned by acommercial asset servicesagreement.
•Partnering with a strongutility provider.
• Total Cost o Ownershipapproach.
•New business model.
•Measurable asset health.
• Total Network Management.
•International benchmarking.
• A variety o technology-ledsolutions.
•Potential new approachesto using smarter data anddistributed sources o gas.
I n n o v a t i o n
National Grid
Transco
Driving commercial value
Total Cost o Ownership
Smarterinvestment...
Figure 4.1: Innovation track record

7/22/2019 Ngn Business Plan
http://slidepdf.com/reader/full/ngn-business-plan 40/224
40
4.2 NGN’s innovation strategy-Total Cost of Ownership (TCO)
Innovation and the ability to respond eectively to
the evolving requirements o our customers and
stakeholders is and will remain, a key element o
the continued success o NGN.
As part o our business model we have a clear
perormance challenge or increased innovation
across the organisation. This perormance
challenge and the delivery o new innovative
solutions will become part o the process by which
we measure the eectiveness o our business, sta
and contracting partners.
A key element in the delivery o this strategy is a
thorough understanding and appreciation o the
range and variety o challenges that NGN as a
business must respond to in the short, medium
and longer term. Summarised below are the key
challenges that we will ace in the RIIO-GD1 period.
These will enable us to identiy the new technology,
commercial arrangements, processes and services
which will be required to address them.
Working in partnership to putinnovation at the heart of ourbusiness, to deliver our stakeholders’expectations in the short, medium andlong term.
The unique strategic asset management
business model which was implemented when
NGN acquired the network in 2005 was itsel a
signicant innovation in the UK’s energy sector.
It was specically targeted at managing the cost
pressures, uncertainties and service obligations
through a period o signicant change ollowingnetwork sales. Additionally, within this perormance
based ramework there existed strong incentive
arrangements to develop innovative responses
to these key challenges. These were a signicant
stimulus or challenging existing practices within the
business.
However, we recognise the signicant challenges
that the wider energy industry in the UK will ace
in the short, medium and long term. We have a
signicant role in ensuring our gas distribution
network can ully play its part in the move to a
low carbon economy. We must also maintain our
ocus on the continuing challenges o improving
overall levels o service, meeting our stakeholders’
expectations and delivering urther improvements
in eciency and productivity.
We also recognise that a step change is required
across the industry and within NGN in the scope
and level o innovation necessary to meet thesechallenges.
The changes we have already made to our
business model, and the approach we are taking
to our management o the network, (which are
described elsewhere in this plan), are clear
indications o how we are proposing to respond to
these challenges as part o our innovation strategy.
This strategy dovetails with NGN’s new approach
o Total Cost o Ownership by having a balancedportolio o projects which are reviewed and tested
prior to potential implementations.
This section sets out NGN’s innovation strategy
and also demonstrates how the use o unding,
research and development, trialling and
implementation, will be employed in RIIO-GD1.

7/22/2019 Ngn Business Plan
http://slidepdf.com/reader/full/ngn-business-plan 41/224
41
These challenges have been identied and
evaluated in partnership with a wide range o
stakeholders, including employees, customers,
contracting partners, suppliers, consumer groups
and local and national government representatives.
It is only by maintaining this level o dialogue
across all our stakeholder groups that we can be
certain that we are ully evaluating the issues and
identiying potential responses to these challenges.
This principle will orm a key element o ourstakeholder engagement strategy across RIIO-GD1.
To meet these challenges we have developed a
new approach: Total Cost o Ownership (TCO).
The TCO approach is at the heart o our innovation
strategy and has our main building blocks,
overlea.
• More ecient delivery o the replacement programme
• Emergency service
• Reduce gas escapes
• Reduce injuries rom our operations
• Comply with saety legislation
• Reduce carbon ootprint
• Reduce use o natural resources
• Facilitate connections o low carbon
sources o gas
• Maintain reliability o network
• Ensure security o supply
• Better investment decisions
• Risk based approach
• Deliver operational eciency
• Respond to changing requirements o the network
• Improve delivery o services
• Remain aware o changing customer and stakeholder
requirements
• Be more responsive to customer and stakeholder
requirements
• Ensure delivery o value or money
• Understand the impact o investment decisions on
customer bills (short and longer term)
• Identiy market developments and requirements o
the gas network
• Ensure the network maintains fexibility to deliver
energy requirements in the long term
• Respond to changing patterns o demand and input
to our system
Innovation
Saety
Environment
Asset & network
management
Customer
service
Value or
money
Future role
or gas
Figure 4.2: NGN’s key strategic challenges RIIO-GD1

7/22/2019 Ngn Business Plan
http://slidepdf.com/reader/full/ngn-business-plan 42/224
42
NGN’s TCO approach has provided the ocus or
our innovation strategy to support the challenges
in RIIO–GD1. This approach embraces the
management and operation o network assets and
drives inormed decisions to deliver in the most
ecient way the required outputs or customersand other stakeholders. TCO delivers an holistic
approach to asset stewardship which is necessary
to meeting the increasingly complex challenges
and cost-pressures GDNs will ace over the next
decade. In particular the business has to deliver:
• better customer service;
• a reduction in saety risks;
• ewer gas leaks and service interruptions;
• less impact on the environment;
• improved sustainability;
• improved asset health;
• urther operating cost eciencies; and
• investment in processes, skills and workorce
renewal.
The remainder o this section describes each
element o the TCO approach.
Figure 4.3: NGN’s innovation strategy – TCO approach
Integrated business modelFully integrated business model that
allows unctions to work together.
Total Network Management A deeper approach to assetmanagement using health indices.
Innovation investment programmeDetailed innovation plans including new ways o working,
new technologies and new processes.
Benchmarking An understanding o best practice
internationally and in other industries.
NGN’s innovation strategy is TCO, which assesses expenditure on the whole assetlife impact across the investment stream to ensure an overall holistic benet tooperations. By balancing our innovation investment across network integrity,customer operations and replacement activities we will ensure the greatest value isobtained.

7/22/2019 Ngn Business Plan
http://slidepdf.com/reader/full/ngn-business-plan 43/224
43
4.3 Integrated business modelWhen the network was purchased in June 2005,
NGN identied the specic challenges it aced in
delivering the corporate vision and operating the
new acquisition.
In particular NGN wished to drive a rapidimprovement in eciency and perormance, and
identied a need to bring external commercial
pressures to bear on as much o the business
as possible. An innovative business model was
selected under which the roles o asset ownership
and asset services were legally separated. In
this way it was possible or the larger part o the
business, asset services, to be outsourced to
the commercial market, whilst retaining in-house
the critical elements o asset management andownership.
Following a competitive procurement exercise,
United Utilities Operations Limited (UUOL) was
engaged under an Asset Services Agreement
(ASA), whereby UUOL managed the operations
and maintenance (Opex), as well as delivering
capital (Capex) and replacement (Repex)
programmes on behal o NGN. The ASA was
based on a target cost ‘open book’ commercial
ramework and contained incentive mechanisms to
deliver out-perormance o key targets.
This business model was in place rom June 2005,
to October 2010, and was an important element
in our achievement o rontier perormance within
GDPCR1. We reviewed the business model in
the context o uture challenges, specically the
capacity to deliver an integrated approach to asset
stewardship into the uture, and United Utilities’
decision to divest its non-core assets, including
UUOL. NGN brought the asset services activities,
carried out by UUOL, back in-house, integrating
1,200 sta in the process. Importantly, we will
retain the commercial ocus and continue to drive
incentive mechanisms aligned to out-perormance
through our supply chain and our direct labour
organisation.
By bringing asset services and asset management
and ownership together under the singular
management o NGN, it has been possible to
establish the new approach (TCO), and to deliver
the holistic approach to asset stewardship which is
required to meet increasingly complex challenges
and cost pressures over the next decade. In
particular the business has to meet the challenges
described in the previous section.
With these challenges in mind, we have adapted
our business model as described below.

7/22/2019 Ngn Business Plan
http://slidepdf.com/reader/full/ngn-business-plan 44/224
44
The business model is based on three closely-
coupled unctions working together to maintain or
improve asset perormance at lowest TCO.
The three unctions o Asset Risk Management,
Customer Operations, and Programme Investment
are supported by a Corporate Oce, as illustrated
in Fig 4.4 below.
As shown in the diagram, and described below, the
unctions are each responsible or specic work
processes, which have been designed to make
best use o relatively homogeneous skill sets within
each unction, and to have well dened criteria
or measuring success.
Interaction between the unctions is critical to the
success o the model and this is highlighted above
by the two cycles or perormance data and asset
data.
Figure 4.4: NGN’s new integrated business model
Asset Risk Management Programme InvestmentCustomer Operations
Corporate Oce
Emergency and repair Programme and commercial
management
Maintenance Supply chain and procurement
Connections Repex/Capex
System control
Data management
Asset strategy
Portolio and investment control
Asset data cycle
Perormance data cycle
Perormance data cycle
Asset data cycle
Customer and
stakeholder
management
Regulation FinanceCorporate
services
Legal and
corporate
governance
Health, saety
and environment

7/22/2019 Ngn Business Plan
http://slidepdf.com/reader/full/ngn-business-plan 45/224
45
4.3.1 Asset Risk Management (ARM)
The key goal is to become smarter about how
we operate and sustainably manage network
assets. This requires ARM to build strong asset
management systems, to exercise eective 24/7
system control room operations, and to collect
accurate data on asset condition and perormance.Its key interaces are with day-to-day operations
through the system control unction, which acts
as a primary source o network perormance data,
and with Programme Investment, where it provides
analysis o asset data to drive optimal investment
decision-making. Consequently, this unction is
responsible or identiying the overall scope o work
to be delivered across the network.
4.3.2 Programme Investment This unction takes the overall scope o work
rom Asset Risk Management and delivers
investment as eciently as possible. In particular
it optimises work packages based on, logistically-
ecient work packages in each area or zone,
solution-ecient investment through application
o innovative techniques, and cost-ecient
implementation through managing the supply
chain and procurement process. Through supply
chain management, Programme Investment is alsoable to leverage its commercial skills and work
scope synergies across the whole business, and
especially between Customer Operations and itsel.
Programme Investment manages the procurement
and supplier relationships to achieve a best overall
outcome in terms o cost, fexibility, risk, delivery
timescales and commercial terms. We incorporate
relevant line-o-sight perormance criteria or
customer service and saety.
4.3.3 Customer Operations
This is the part o our business which is most
visible to customers, dealing with emergencies,
repairs, maintenance and new connections to
our network. It is the prime deliverer o customer
service, ensuring that customers’ needs are
met on a day-to-day basis. In carrying outnetwork operations and maintenance activities,
it also has a key role in providing data to Asset
Risk Management about asset condition and
perormance.
A key strength o the business model is the
emphasis placed on linking the three core business
areas. Accurate and timely data and inormation
fows between Asset Risk Management,
Programme Investment and Customer Operations
drive the eectiveness o this model, ensuring
that investment, commercial and operational
requirements are being continuously optimised.
4.3.4 Corporate Ofce
The Corporate Oce supports the business as it
strives to be the best in sector. It is responsible or
legal, governance, and nancial control; running the
management systems or, and providing specialist
advice on health, saety and the environment;
customer and stakeholder engagement; interaces
with regulators; and human resources.
NGN places a strong emphasis on skills
development with some 250 skilled apprentices
planned to join the business in RIIO-GD1.
The reorganisation o NGN’s business into the
structure described above provides the platorm
or responding to the short, medium and longer
term challenges o RIIO-GD1, and is the key
underpinning o the commitments set out within
this business plan.

7/22/2019 Ngn Business Plan
http://slidepdf.com/reader/full/ngn-business-plan 46/224
46
4.4 Total NetworkManagement (TNM)
The development and implementation o this
new integrated business model has been carried
out alongside a new TCO ocused approach to
managing the network, we have termed this Total
Network Management (TNM). The challenges
presented by the RIIO-GD1 ramework, and by
the wider industry and economic environment,
require changes to the way in which we deliver
our services. Specically we are applying TCO to
prioritise network expenditure to manage risk and
to deliver the RIIO-GD1 outputs.
We have been progressing and developing this
approach since June 2005, including accreditation
or PAS 55 the internationally recognised standardor asset management.
Our asset management system requires a lie
cycle view; an optimal mixture o interventions
through capital investments, operational activities
and maintenance. The overall level o intervention
required is determined by perormance needs,
driven mainly by customer and environmental
impact, risk appetite - both internal and external,
and asset health and criticality.
We use systematic and co-ordinated activities and
practices to manage our physical assets in line with
PAS 55 principles. The standard, which also drives
new technology, innovation and best practice,
has been a key element in the development o our
network, ensuring it is t or purpose and ecientin delivering outputs.
These initial developments have provided the
necessary basis or the implementation o TNM
in RIIO-GD1. TNM specically takes an holistic
approach to managing assets and operating the
network, which is highly data-centric, and uses
inormed decisions to arrive at the most ecient
way to deliver the required outputs or customers
and stakeholders. The approach comprises several
key building blocks as described below.
• A geographical ocus supported by central
analysis, planning and scheduling.
• Ability to drive perormance at a local level,
close to the customer and the asset, ocusing
leadership on:
• the customer and eciency – planning the
right resource, in the right place, at the right
time; and
• supported by a relatively high resolution
o geographically mapped perormance
data, allowing targeting o resources and
investment.
1
2
3
4
65
7
89
NGN’s newgeographiccustomeroperationsstructure
Figure 4.5: NGN’s geographical patch structure

7/22/2019 Ngn Business Plan
http://slidepdf.com/reader/full/ngn-business-plan 47/224
47
4.4.1 Dening asset performancerequirements and asset health
NGN considers asset perormance both at
individual asset level (e.g. the required capacity
o a Pressure Reduction Installation (PRI), and at
network level (e.g. the level o leakage in an area o
network). We oten use the Network Area Polygon(NAP) zone as a unit o analysis when considering
network perormance. A NAP is a small unit rom
which we can obtain a range o statistics and
metrics. Our network is divided into 215 such
NAPs. Perormance criteria are dened or each
asset and condition or health data is then required
to determine whether or not an intervention is
required to bring the asset back within acceptable
levels o perormance.
Typically the lack o condition data has been a
major obstacle to carrying out a comprehensive
assessment o proactive asset management
programmes. Historically, replacement has been
based on age criteria, mandated replacement, or
run-to-ail. We have already collected a base-line
set o condition data or many o our assets and
will establish robust data across the entire asset
base during RIIO-GD1. We have data relating to
the health o assets, broken down into 22 separatecategories. For example, we hold inormation
relating to pressure, pipe material, leakage history,
pipe diameters, Monoethylene Glycol (MEG)
concentration levels and expenditure or each NAP.
4.4.2 Asset condition and criticalityassessment
In order to assess whether the risk o asset ailure
is critical, we consider the impact o ailure, taking
account o actors such as proximity to people or
buildings, seriousness o ailure mechanism, and
number o customers aected by loss o service.
The combination o asset health assessment and
criticality is then combined to orm an asset health
index. This then serves as a driver to prioritise
asset investment, or other orm o intervention.
Following completion o the asset health and
criticality assessments, network risk gures are
created or each asset category by mapping the
gures against a matrix to produce the asset healthindex as shown below.
Figure 4.7: Asset health and criticality risk index
Figure 4.6: Asset health index
Asset health index
Criticality index
Health index
Risk matrix
Investmentdecision
HI1 HI2 HI3 HI4 HI5
C1 RI4 RI3 RI2 RI1 RI1
C2 RI5 RI4 RI2 RI2 RI1
C3 RI5 RI5 RI3 RI2 RI2
C4 RI5 RI5 RI4 RI3 RI2
Asset health index
Risk matrix
C r i t i c a l i t y i n d e x

7/22/2019 Ngn Business Plan
http://slidepdf.com/reader/full/ngn-business-plan 48/224
48
The index can be used to inorm asset investment
decisions, specically to prioritise investment
within each class o asset. Increasingly, as the data
becomes more rened, it will be possible to use
the asset health indices as a basis or trade-os
between dierent asset categories.
These indices will act as output measures and orma major part o our asset management strategy
over the next decade.
We have developed a set o asset health indices
to support our TNM approach. O the 26 asset
categories that required reporting or RIIO-GD1,
we have assets within 22. For these categories we
have to date:
• Implemented an asset health methodology with
dened grading (HI1 to HI5);
• Implemented and asset criticality methodology
with dened grading (C1 to C4);
• Implemented an asset risk measure based on
the above health and criticality measures with
dened grading (RI1 to RI5); and
• Run a rst cut data population to identiy the
gaps in current asset data which we plan to
close by the end o 2012 (excluding telemetryand control).
We have linked all our planned network capital
expenditure in Section 7 to asset health indicators
and explicitly set out these links in Appendix A11.

7/22/2019 Ngn Business Plan
http://slidepdf.com/reader/full/ngn-business-plan 49/224

7/22/2019 Ngn Business Plan
http://slidepdf.com/reader/full/ngn-business-plan 50/224
50
4.4.4 Innovative solutions through TNM
Prioritising assets or improvement using TNM
enables us to take an innovative approach to
nding the optimal solution, which is not always
wholesale asset renewal. For example, network
leakage can be addressed in several ways, ranging
rom replacing large tracts o mains, through to
carrying out remedial work on joints or modiying
Pressure Reduction Installations (PRIs) to reduce
local network pressures. We also continually review
and innovate in the techniques and standards
that we apply. For example, the use o coring and
vacuum excavation and a revision to the minimum
separation distance between joints in the network
have recently been introduced.
4.4.5 TNM in action The overall TNM approach is il lustrated in Figure
4.9. Although it will require a period o time to be
totally embedded in the organisation, signicant
value rom TNM is built into our RIIO-GD1 business
plan, and TNM is already delivering signicant
benets or our customers.
TNM considers a wide range o actors to identiy
where it is most appropriate to ocus expenditure
to deliver improvements across single and multiple
output measures.
The approach allows clear trade-os to bemade between alternative solutions and types o
expenditure to deliver the best value or money.
A urther insight to TNM is best oered by
reerence to the examples which ollow.
4.4.6 TNM applied to leakagereduction
NGN uses data recovered rom the NAPs to
monitor asset perormance and health. Byanalysing the incidence o repairs in each NAP, it
is possible to correlate leakage against network
condition. In the past leakage has been reduced in
part as a by-product o the iron mains replacement
programme. As a consequence, it was not always
possible to take into account wider actors in
optimising expenditure across the whole network.
By taking a more holistic approach to managing the
iron mains replacement programme, we are able to
ocus investment more meaningully. Figures 4.10
and 4.11, opposite, show historical repair rates in
our main urban areas. The top chart shows data
or NGN (North) and the bottom chart or NGN
(South). Historically these two areas would have
attracted similar levels o investment, but through
TNM it is possible to ocus investment where
leakage is highest. It can be seen that the South
area has much higher repair rates (and leakage)
than the North.
Asset health
and risk
Total Network
Management
Mains
replacement
Leakageand repair
history
System
reinorcement
Environmental
emissions
Network pressure
management
Figure 4.9: Total Network Management

7/22/2019 Ngn Business Plan
http://slidepdf.com/reader/full/ngn-business-plan 51/224
51
Figure 4.10: North mains leakage repairs by NAP
Figure 4.11: South mains leakage repairs by NAP

7/22/2019 Ngn Business Plan
http://slidepdf.com/reader/full/ngn-business-plan 52/224
52
Figure 4.12: Leeds NAP
Figure 4.13: Hudderseld NAP
Re-ocusing investment in areas such as Leeds
and Hudderseld delivers a more eective return.
Further analysis o Leeds’ repair data by cause,
as shown in Figure 4.12, reveals that the key
drivers are ailures o steel pipes rather than cast
iron, which traditionally has been the ocus o
investment. It also shows that 4” spun iron (SI )
pipes are the single highest source o leakage.
Conversely, or Hudderseld, the main drivers
are 4” and 6” cast iron pipes, illustrating the
requirement or dierent solutions in dierent NAPs.

7/22/2019 Ngn Business Plan
http://slidepdf.com/reader/full/ngn-business-plan 53/224
53
By homing in on the precise asset class that is
under-perorming, and utilising operational data, (in
this case repair rates) to deduce asset condition,
it is now possible to design an appropriate
remedial programme. In practice the solution
entails a combination o pressure management,
replacement o pipes in problem hotspots, andpipe lining treatment.
By analysing asset data geographically and at high
resolution, it is also possible or the solution to be
implemented eciently rom a logistics perspective.
Leveraging multiple solutions
Leakage management is a good example o where
multiple solutions are applied in concert. Figure
4.14 illustrates the relationship between network
pressure and leakage.
Pressure is a unction o network demand, the
perormance o PRIs, and accuracy o pressure
control systems. It illustrates the importance
o our TNM approach in being able to identiy
opportunities to substitute one orm o investment
or another, in this case investment in control
systems or upstream assets in place o wholesale
investment in pipes.
Figure 4.15 shows the Hudderseld station zone o
infuence and the extent o upstream governors that
need to be considered in designing the pressure
management control system.
This smart solution demonstrates TNM in action.
The Hudderseld programme also neatly illustrates
the advantages o a zonal approach where
close engagement with stakeholders is more
eective when programmes are identied with
local geographic identities. In this particular case
Kirklees Council is a key stakeholder.
Figure 4.14: Relationship between network pressure and leakage
Figure 4.15: Hudderseld holder station zone o infuence under
winter settings
Leakage analysis has been undertaken or
Hudderseld, where 4” cast iron pipes have
been identied as the key issue. We consider the
problem could be solved over a period o one
to two years o concerted replacement eorts,
supplemented by active pressure management.
System pressures have risen in some areas by60% in order to meet demand. This carries an
inevitable increase in leakage rates, which can be
managed down through intelligent active pressure
control systems.

7/22/2019 Ngn Business Plan
http://slidepdf.com/reader/full/ngn-business-plan 54/224
54
4.4.7 TNM incorporated into this plan
This plan has been developed incorporating the
principles o TNM, seeking to minimise the overall
cost o delivering the core outputs in RIIO-GD1.
The impact can be seen in several key areas o our
proposals.
• Reduced cost or delivery o the Repex
programme.
• Reduced emergency, repair and maintenance
workloads and costs.
• Enhanced levels o network reliability and
asset health.
• Reduced leakage and environmental emissions.
• Signicant productivity improvements in
RIIO-GD1.
This new business model and the newapproach to the management of thenetwork is wholly consistent with the keyprinciples of RIIO. As a result NGN is wellplaced to address the industry challengesover the RIIO-GD1 timeframe and deliver
our commitments to customers.

7/22/2019 Ngn Business Plan
http://slidepdf.com/reader/full/ngn-business-plan 55/224
55
4.5 Innovationinvestment programme
Given our corporate vision, our wider perormance
challenge and the size and scope o the uture
issues we ace, we are proposing a step change in
our innovation activity and expenditure inRIIO-GD1. We plan to ully employ our annual
Network Innovation Allowance o 1% o total
regulated revenue, which is in excess o £25m
across the whole period. Additionally, the size and
scope o several projects that have been identied
or this programme are signicant both in terms o
scope and levels o expenditure. For these projects
we will be looking to actively bid or unding via
the Network Innovation Competition (NIC), in
collaboration with third parties.
Many o the issues and challenges that we, other
companies and the wider energy market will ace
are only now being ully realised and are in their
relative inancy in terms o understanding andwhat the appropriate response should be. As a
consequence, many o the projects identied to be
delivered in RIIO-GD1 are at the early research and
development stage o the process. However, as
we progress through the programme we anticipate
moving several o these projects through trialling
and into implementation within the RIIO-GD1 time
rame.
NGN’s innovation investment programme
Gas conditioning study
(MEG) Alternative fuel source for all vehicles
Cross-utility low carbon roadmap
Remote monitoring and control
Enabling bio methane sources to connect to grid
Carbon monoxide awareness and safety through alliances Alternative aerial/satellite surveillance
and gas detection
Sustainable and renewable sources of gas to grid
Turbo expanders in energy generation
Using carbon capture and storage across the network
Carbon monoxide atmospheric
testing at customer properties
Alternative risk reduction technologies
and methods
Local authority, utilities
and highways Alliances
Customer interface platforms
DLO resource management
and scheduling
Eliminating need for gas
interruption and restoration
Configuring for and managing assets on a Smart grid
Developing strategies for storage and leakage
Asset condition and health data and metrics
System control simulator
A s s e t a n d N e t w o r k M a n a g e m e n t
C u s t o m e r a n d P e o p l e
S a f e t y
E n v i r o n m e n t
2011/12 2012 /13 2013 /14 2014 /15 2015 /16 2016 /17 2017/18 2018 /19 2019 /20 2020 /21
Asset electronic tagging
Fully automated despatch centre
Excavation and reinstatement technologies
CCTV inspections
Inspection and detectiontechnologies
Automation of supply chain reporting
Using smart meter data to
manage the network Planning smart meter data capture
and using to inform leakage model
PE pipe maintenance needs and succession plan
Joint rehabilitation (spray lining)
Iron mains deterioration research
Figure 4.16: NGN’s proposed innovation investment programme RIIO-GD1

7/22/2019 Ngn Business Plan
http://slidepdf.com/reader/full/ngn-business-plan 56/224
56
Each o the proposed projects has been developed
as a direct response to the challenges we ace.
The programme includes a build-up o work in the
key areas rom 2011/12 continuing into the RIIO-
GD1 period and beyond. Further details o our
programme can be ound in Appendix A4.
4.5.1 Environment
The challenge or NGN in the environmental area is
threeold.
i Reduce Business CarbonFootprint (BCF)
We are looking at a range o initiatives to implement
in RIIO-GD1 which will reduce our BCF. There
are three areas within our innovation programme
that have been identied or urther research anddevelopment.
• Alternative uel sources or operational vehicles –
examining the potential or using alternative low
carbon uels or our feet, including bio-methane.
We will also examine the opportunity to work
with other utilities in our region to share the
benets o economies o scale and scope.
• Turbo expander energy generation – examining
the potential to use technology at our otakes
to utilise the energy currently wasted when
pressure is reduced in creating electricity. Also to
oset our on-site pre-heating requirements.
• Cross-utility low carbon roadmap – working with
other utilities in our region to identiy any overlap
in the delivery o carbon reduction programmes.
ii Reduce emissions of natural gas
• Gas conditioning - to optimise the use o MEGas a treatment o pipe joints on the network to
maximise potential or leakage reduction.
• Remote monitoring and control - to optimise
governor pressure settings to meet demand
based on short term orecasting and actual
recorded pressure proles; remotely manage
district pressures without the need to visit site;
use xed network pressure recorders to prole
network demands over hourly, weekly and
monthly settings.
iii Facilitating the broad environmental
agenda
We clearly have a role in delivering the transition
to a low carbon economy. We are already active
in addressing some o the main challenges and
will continue this work during RIIO-GD1 in two key
areas.
• Bio-methane and non-conventional gas injection
to grid – continue planned work in addressing
the technical, operational and commercial
challenges to bringing to ruition bio-methaneand other sources o non-conventional gas
injection schemes.
• Alternative uses o gas network – longer term
project to evaluate how the gas network can
be utilised in uture energy scenarios, including
localised gas grids, carbon capture and storage
technologies.

7/22/2019 Ngn Business Plan
http://slidepdf.com/reader/full/ngn-business-plan 57/224
57
4.5.2 Safety
There are three areas o saety we plan to address.
i Carbon monoxide awareness and testing
We are looking at innovative ways o deliveringcarbon monoxide (CO) and gas saety awareness
including the development o a smartphone
application. Additionally we propose to introduce
technology and procedures that allow our
emergency sta to test or the presence o CO
while in customers’ properties.
ii Alternative aerial/satellite surveillanceand gas detection
We will evaluate the use o geographic inormationsystems and modern satellite navigation systems
to survey our assets. This will include the easibility
o using unmanned aerial vehicles or monitoring
pipelines to detect possible intererence.
iii Iron mains risk management
We will investigate how the rate o deterioration
in iron mains is changing in dierent parts o the
network in order to anticipate uture risk levels
and manage them through the replacementprogramme. Additionally, we will examine
alternatives to replacing/abandoning pipe to
manage the risk o ailure.
4.5.3 Asset and network management
We will examine a range o key areas.
i Asset health data and metrics
To continue the development o our risk-based
approach to managing operational assets and
embed the process within the business.
ii Storage and leakage strategies
Implement plans to remove storage assets across
the network. We will implement the TNM approach
to ensure a more holistic view o network risk.
iii System control operation simulator
We will design and develop a sotware programme
to simulate the daily system control operation o our network with the ability to run scenarios and
analyse dierent uture usage models.
iv Smart metering
We will plan to utilise data rom smart meters to
inorm the network leakage model. We will also
examine the potential uses o smart metering data
in operating the uture gas network.
v PE pipe succession asset life andcondition
We need to understand the ull asset lie o rst,
second and third generation polyethylene (PE)
pipes, and determine suitable maintenance
programmes, as required by the Pipeline Saety
Regulations.

7/22/2019 Ngn Business Plan
http://slidepdf.com/reader/full/ngn-business-plan 58/224
58
vi Asset electronic tagging
We will test the easibility o tagging assets so
that historic asset perormance and maintenance
records can be accessed ‘live’ and kept up to date.
This technology is more advanced than barcode
technology and can hold more inormation.
vii Fully automated despatch system
We will develop an automated despatch system,
requiring minimal human input, to manage our
industrial workorce. This is likely to improve the
technology used by emergency and repair teams.
viii Innovative excavation andreinstatement technologies
We will use new technology to reduce the numbero excavations. We will also ocus on maximising
the use o recycled material, and maximise the use
o non-intrusive repairs.
ix Inspection and detection technologies
We will develop technologies that will detect aults
or locations relating to our assets. These include
but are not limited to: ground probing radar;
bell joint location; PE mains tracing; and GPS
pinpointing.
This programme refects our current thinking and
appreciation o the issues that exist at this time.
The programme will be augmented and extended
as we progress through the period and some
additional projects will be identied and others
discarded as the results o initial research and
investigation become available.
This represents a comprehensive plan to address
the key issues and challenges we will ace over theperiod supported by a robust ramework to identiy
and deliver signicant benets to customers and
stakeholders in the short, medium and longer term.
4.5.4 NGN’s innovation in bio-methane
entry connections to the gas
distribution network
NGN has already demonstrated its ability to
innovate to meet the uture requirements o the
network in working with the emerging bio-methanemarket. Our achievements to date include the
ollowing.
• NGN made the rst connection oer in the UK to
a commercial bio-methane scheme.
• NGN was the rst GDN to dene and publish a
process or dealing with bio-methane connection
enquiries including specied standards o
service or response times.
• NGN has established partnerships with a range
o bio-methane developers (e.g. individual arm
projects and water companies) and other parties
to work on initiatives which have increased
the industry’s understanding o bio-methane
connection.
• NGN’s work on bio-methane was recognised in
this year’s Discretionary Reward Scheme.

7/22/2019 Ngn Business Plan
http://slidepdf.com/reader/full/ngn-business-plan 59/224
59
In terms o uture innovation we detail three
examples o our work.
i Commercial/contractual innovation
We have been developing a connection agreement
and application process in partnership with
bio-methane developers to ensure they havemaximum fexibility to procure some or all
connection equipment making the process as
contestable as connectees desire. This approach
ensures barriers to entry are minimised whilst
delivering ecient connections.
ii Upwards compression
Bio-methane producers tend to be geographically
xed, linked to the anaerobic digester producing
the gas e.g. arms and sewage plants. This
means the plants have to connect to the part o
NGN’s network closest to them. I this is a rural
location there will be insucient capacity on the
gas network to accommodate such connections.
To overcome this problem we are trialling a new
technology, “upwards compression”.
This technology will enable bio-methane plants to
inject gas to the low pressure network, then it is
compressed and transported up the pressure tiers,alleviating potential constraints on the distribution
mains.
I successul, this would enable bio-methane plants
to connect anywhere on NGN’s network without
constraint throughout the year. Clearly this would
increase the scope or bio-methane connection on
NGN’s network and across the UK.
We are undertaking this work in partnership with
a commercial developer. A easibility study and
simulation using live system data were successully
completed in 2009 and 2010.
We are now about to start a eld trial o the
compressor equipment on an isolated area o
the network. I the eld trial is successul the
compressor will be tested on a commercial site
and can then be rolled out as a new technology. All
results will be shared with the other GDNs and the
wider industry.
iii Monitoring equipment test bed
Bio-methane connections comprise a number o
dierent assets. Some o this equipment is required
to ensure the quality o gas (and caloric value)
entering the distribution network is within standard
Gas Saety (Management) Regulations (GS(M)R).
At present only a limited number o types o
monitoring equipment have been approved or use
by Ogem. However, there is a much greater range
available on the market. Expanding the choice o
equipment should increase competition and drive
down costs in this market to the benet o bio-
methane developers.
To acilitate this we have designed a ‘test bed’
which will be installed at bio-methane connections
and run in parallel to the standard approved
equipment. This will allow NGN and other
collaborating parties to test alternative monitoring
equipment. The data generated will enable this
equipment to obtain the necessary approvals.
As we connect bio-methane plants over the
next ew years we will also install these test
beds to ensure the widest range o equipment is
trialled and approved. We will share all data and
inormation rom the trials with the wider industry.

7/22/2019 Ngn Business Plan
http://slidepdf.com/reader/full/ngn-business-plan 60/224
60
4.5.5 Governance and process
NGN view the innovation strategy as a dynamic
plan which is constantly added to, tested and
measured or success. For NGN this is not a one
- o exercise where a plan is created and ollowed
or the RIIO-GD1 period. Industry and network
challenges will change and a process needs to be
in place to allow NGN to respond to this.
Planning stage
Doing
Measuring & reviewing
Figure 4.17: NGN innovation cycle
Plan
Do
Review
4. Build & Test
6. Learn lessons
5. Implement & Measure
2. Ideas
3. Development
1. Issue & Challenge
NGN innovation cycle

7/22/2019 Ngn Business Plan
http://slidepdf.com/reader/full/ngn-business-plan 61/224
61
A clear governance structure and set o regular,
core activities allows NGN to keep robust control
o the expenditure and direction o innovation. The
core activities, their purpose and requency are
outlined below.
Figure 4.18: NGN innovation process monitor
Stage Area Actions Purpose When Responsibility
P l a n
I s s u e & C
h a l l e n g e
Supply Chain
Engagement
Gather new ideas or innovation topics and challenges and share
successQuarterly
Stakeholder
Manager
Employee Suggestions
Review
Business Areas to review all new suggestions and identiy issues.
Prioritise or implementationQuarterly
Business Area
Innovation Leader
Stakeholder Review Obtain eedback rom stakeholders AnnuallyStakeholder
Manager
I d e a s
Business Area Review
Each business area to report on how they will demonstrate they are
meeting the Innovation Perormance Challenge: Implemented Ideas
Short Term Plan
Long Term Plan
Hal Yearly
Business Area
Innovation Leader &
Chair o NIG
Senior Management
Review
Review completed work and progress o all projects, control and
monitor approved projectsHal Yearly Chair o NIG
Network Innovation
Group (NIG)
Ensure governance process is operating, review business areasperormance against challenge, monitor approved costs and spend,
review business cases, recommend projects or approval, manage
innovation budget, produce annual report
6 weekly meetings Annual Repor t to
Senior Management
Chair o NIG
D o
D e v e l o p m e n t
Business Case Approval
Develop idea into workable solution. Produce business case with
options and costs. Obtain necessary approval. Review NIC & Ogem
Innovation Plan
Quarterly Business
ReviewBusiness Sponsor
B u i l d & T e s t
Test SolutionUndertake trial, test idea, obtain eedback and measure benets.
Follow timescale set out in business plan
Stage Gate review
within Business
Case
Project Manager
R e v i e w
I m p l e m e n t &
M e a s u r e
Manage Implementation
Undertake ull implementation based on trial results with agreed
modications. Manage implementation, track spend and measure
results.
Stage Gate review
within Business
Case
Project Manager
L e a r n
L e s s o n s Post Investment
Appraisal
Review project costs and objectives against original plan. Develop
learning rom process eed back into issues and challenges. Report
outcomes to NIG
Submission
o Completion
Document
Project Sponsor &
Chair o NIG

7/22/2019 Ngn Business Plan
http://slidepdf.com/reader/full/ngn-business-plan 62/224
62
Customer Operations
Innovation Sponsor
Asset Risk
Management
Innovation Sponsor
Programme
Investment
Innovation Sponsor
Chairman
Group Secretary
(Innovation Manager)
Corporate Oce
Innovation Sponsor
Risk / Benets
Tracking/Stage Gate
Owner (Finance)
Figure 4.18: NIG structure
Network innovation group structure
The group draws upon expertise rom acrossthe business, ensuring that the pressures and
challenges that the company is acing are clearly
identied and our innovation portolio is robust and
ully representative. This rst step in the innovation
process is supported by a ramework which looks
to capture ideas and suggestions rom a wide base
o stakeholders.
NGN employees
We have an employee suggestion scheme where
ideas, comments and challenges are submitted
and reviewed by the NIG. Suggestions that meet
the assessment criteria are progressed to project
appraisal and submitted or approval. This orms
part o a culture o innovation which is being
developed across the organisation. Employees
receive rewards or ideas which are progressed to
deliver business and/or customer benets.
Contracting partners and suppliers
Our contracting partners and suppliers play a
signicant role in the delivery o our core services.
They bring with them valuable knowledge and
experience rom the wider market place. We
currently have very close working relationships with
all our major suppliers, operating a programme o
developing and introducing innovative products.
We look to share experiences in the use o
new techniques, technologies and commercialarrangements that can address the challenges we
ace.
International best practice
We have close ties with several international
utilities and seek to identiy areas o best practice
and evaluate how these can be translated to our
own operations. Additionally we also utilise the
signicant international experience o the wider
shareholder group o companies to identiy andevaluate alternative technologies, working practices
and commercial arrangements.
Network innovation group (NIG)
This group orms the main governance control
mechanism or all NGN’s innovation initiatives. It
reports to the NGN Senior Management Team via
the Director o Asset Risk Management, who is the
group’s sponsor.
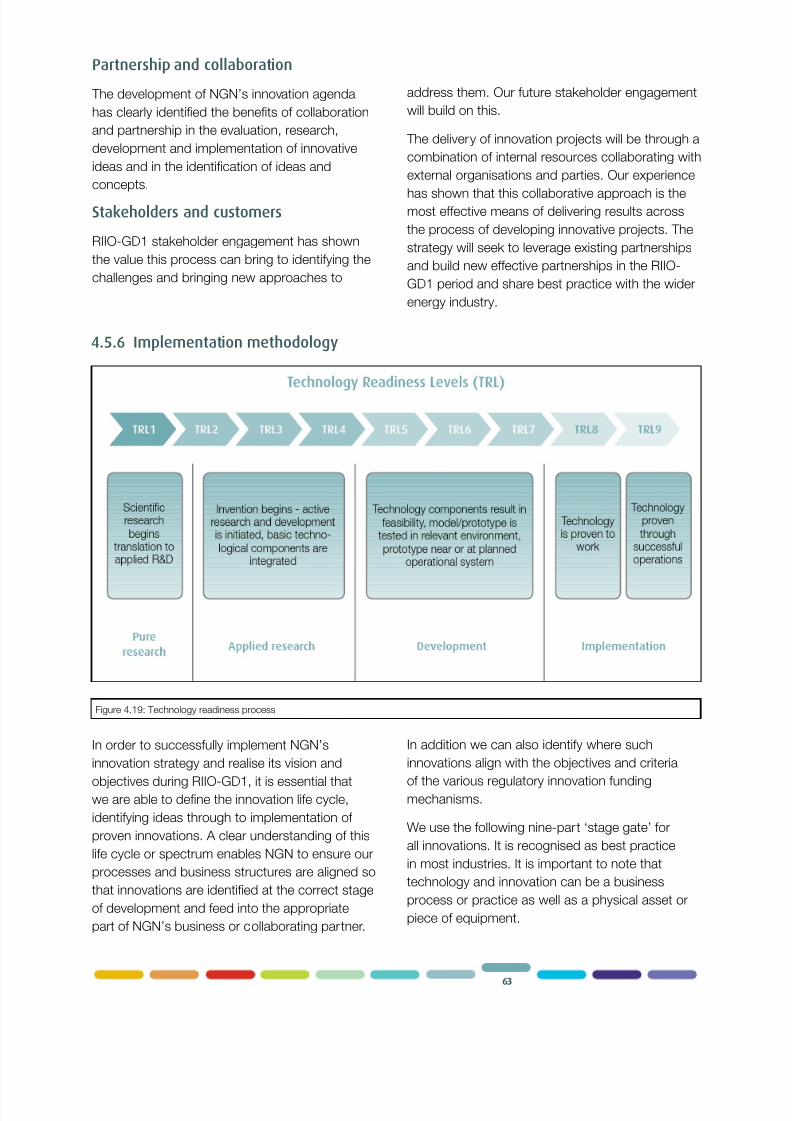
7/22/2019 Ngn Business Plan
http://slidepdf.com/reader/full/ngn-business-plan 63/224
63
In order to successully implement NGN’s
innovation strategy and realise its vision and
objectives during RIIO-GD1, it is essential that
we are able to dene the innovation lie cycle,
identiying ideas through to implementation o
proven innovations. A clear understanding o this
lie cycle or spectrum enables NGN to ensure our
processes and business structures are aligned so
that innovations are identied at the correct stage
o development and eed into the appropriate
part o NGN’s business or collaborating partner.
In addition we can also identiy where such
innovations align with the objectives and criteria
o the various regulatory innovation unding
mechanisms.
We use the ollowing nine-part ‘stage gate’ or
all innovations. It is recognised as best practice
in most industries. It is important to note that
technology and innovation can be a business
process or practice as well as a physical asset or
piece o equipment.
Figure 4.19: Technology readiness process
4.5.6 Implementation methodology
Partnership and collaboration
The development o NGN’s innovation agenda
has clearly identied the benets o collaboration
and partnership in the evaluation, research,
development and implementation o innovative
ideas and in the identication o ideas and
concepts.
Stakeholders and customers
RIIO-GD1 stakeholder engagement has shown
the value this process can bring to identiying the
challenges and bringing new approaches to
address them. Our uture stakeholder engagement
will build on this.
The delivery o innovation projects will be through a
combination o internal resources collaborating with
external organisations and parties. Our experiencehas shown that this collaborative approach is the
most eective means o delivering results across
the process o developing innovative projects. The
strategy will seek to leverage existing partnerships
and build new eective partnerships in the RIIO-
GD1 period and share best practice with the wider
energy industry.

7/22/2019 Ngn Business Plan
http://slidepdf.com/reader/full/ngn-business-plan 64/224

7/22/2019 Ngn Business Plan
http://slidepdf.com/reader/full/ngn-business-plan 65/224
65
Applied research and development
At this stage ideas are translated into tangible
applications. Such applications may come to NGN
in mid development or will be ideas passing the
assessment criteria at the pure research stage.
This is also the stage where international best
practice can be identied with a view or application
in NGN and the UK. The key is to ensure these
projects are developed by the part o the business,
or collaboration partner, with the most relevant
expertise and experience.
• Market testing and tendering
I NGN uses a collaboration partner at this stage
it can utilise its existing rameworks to ensure
the idea is developed as eciently as possible
and that the best ideas and most creativeapproaches are selected rom the market
place. NGN can also leverage relationships with
suppliers and equipment manuacturers who
have the capability and expertise to develop
such projects and prototypes.
• Continual evaluation and re-assessment
Another key challenge is to ensure projects
in this phase remain valid and are on track to
deliver the intended solutions. For example, itmay become evident that a similar innovation has
already been trialled and patented in which case
it will be prudent to cease development. The NIG
is key in managing this process. Where projects
are terminated, it is essential that all lessons are
extracted and disseminated across the business
and ed back into the stage gate process.
• Field trials
A key to developing technological projects will
be using the physical network to trial and test
equipment and other innovations in isolated and
live areas. Potentially data rom such trials can be
shared with the wider industry.
Implementation
At this stage in the process, the initiative or
technology is ully proven and ready or rollout in
NGN and the wider industry. Challenges will exist
around ecient manuacture, implementation
and distribution. At this stage NGN may need to
transition rom a specialist collaborative partner
ocused on innovation development to a specialist
manuacturer or distributor. We will utilise our
existing business structure and processes to roll
out the proven innovation within NGN eciently
and on time.
4.6 Benchmarking and bestpractice
As described elsewhere in the business plan,we have maintained our position at the eciency
rontier since we demerged rom National Grid
in 2005. We remain committed to retaining our
position at the rontier whilst continuing to operate
a sae, reliable network.
This section shows how we achieved this position
by using market testing, benchmarking and best
practices on a national and international basis.
Further detail o our systemic approach to
benchmarking can be ound in Appendix A3.

7/22/2019 Ngn Business Plan
http://slidepdf.com/reader/full/ngn-business-plan 66/224
66
4.6.1 Contractual expenditure
Our contractual spend across Opex, Capex and
Repex is annually c.£145m. It is critical that we test
the market to ensure our approach to procurement
is ecient and that we are at the leading edge o
innovation.
Once a denite business need or a product or
service has been identied and the procurement
process is initiated, contracts have to go through
various market testing processes dependant on
the contact value. All contracts above £25k go
to ull tender and the majority o those under that
level require three quotations. As a result, we
can be certain that we consistently achieve the
best solution, eciently, or at least 80% o our
expenditure in this area, whilst complying with theappropriate EU Utilities Procurement Directive, UK
legislation and known best practice.
Wherever possible, we carry out market testing
and benchmarking on an international level to
allow us to take advantage o market conditions
and international innovation. This includes recent
investigations into potential PE pipe suppliers
outside the UK (as ar aeld as the Asian markets),
our work with US and Japanese gas distribution
companies, which is detailed elsewhere in this
document, and ensuring that we are taking
advantage o the economies o scale available as a
result o being part o the wider shareholder group
(e.g. IS contracts). Nationally, we also work with
others who have a shared interest to maximise
eciency, such as our deals with Ford and
Vauxhall where we collaborated with several other
companies.
Our use o the Achilles system allows us toproactively identiy and contact suppliers with the
necessary skill sets at the prequalication stage.
Once the preerred supplier has been conrmed,
we continue to build eciencies at a contractual
level by implementing Key Perormance Indicators
(KPI’s) with pain/gain mechanisms, such as
those in the hugely innovative Strategic Asset
Management model, the replacement partnership
ramework agreements and acilities management
contracts. This is acilitated by our continued move
into NEC and JCT contracts, which are recognised
as best practice.
Internally, the drive or eciency continues
once goods have been delivered by proactively
managing operational stock rotation to minimise
the amount o capital tied up in latent stock at any
time.
Regular meetings are held with the other networksand shareholder group companies to allow
benchmarking to take place and ensure that we
take advantage o innovations and best practice.
We will continue to compare key supply contract
pricing and strategy best practices with the other
GDNs and shareholder group companies.
We will also seek to improve our business
intelligence through commodity market testing,
such as tracking the price o raw PE polymer (our
biggest single goods spend) to ensure cost savings
are being passed on rom suppliers. There will also
be a greater ocus on e-procurement.
In addition, sustainability will be a key driver moving
into the RIIO period, whereby ethical sourcing,
energy eciency and an increased ocus on
renewables will be balanced against maintaining
our core value o achieving the best solution or the
business at the best possible price.
We believe that this strategy is the best way to
ensure that we remain at the eciency rontier,
achieve our company vision and most importantly
meet the challenges o the RIIO model.

7/22/2019 Ngn Business Plan
http://slidepdf.com/reader/full/ngn-business-plan 67/224
67
4.6.2 Workforce
Our workorce is at the centre o all o our activities
and is critical or maintaining a sae and reliable gas
network. It is essential that we benchmark against
other companies to ensure we have a cutting
edge, fexible and ecient workorce and to identiy
innovative ways o ensuring our workorce exceed
the norm.
Operationally, we ensure that our sta are trained
to the standards set by Gas Sae and Energy
and Utility Skills, who use national benchmarking
data to recommend the best training available or
our employees to conorm to best practice whilst
maintaining a customer ocused, reliable, sae,
environmentally sound network at the oreront o
the eciency rontier. This in turn eeds into ourapprentice development and ongoing workorce
training.
All our customer acing sta undergo annual
customer training to ensure that the ocus remains
on customer service best practice.
To ensure our payroll costs are ecient and meet
best practice, The Hay Group are used to ensure
salary and benet benchmarking with similar roles
nationally and to improve succession planning. Thiscontinues to be introduced across the business.
We carry out an annual employee opinion survey,
benchmarking us against national and international
norms and helping us introduce international best
practices to improve workplace productivity.
We are currently trialling the Greenroad scheme,
which encourages driving best practice at all levels
across the business, thereby improving saety
through a reduction in road trac accidents andimproving uel eciency (thus improving cost
savings and carbon savings) through innovation.
It is envisaged that this trial will mature into a ull
programme by 2013.
NGN has engaged with the National Skills
Academy (Energy and Utility Skills) to benchmark
and model uture workorce requirements.
This is an employer-led collaborative solution
partnering with education and skills providers,
unding agencies and other stakeholders to
provide regionally ocused skills. These include the
ollowing.
• Ability to respond quickly and fexibly to thechanging recruitment and training needs o the
sector.
• Pooling overall industry skills demand to
command an economic price in the skills market
and overcome barriers to skills investment.
• Access to best practice pastoral care and
specialist training.
• Ability to recruit and train to meet uturerecognised demand.
• Multi-company attachments and rotation o work
placements.
• Supporting growth in the existing training
provision inrastructure.
4.6.3 Examples of benchmarking and best
practice comparison
As a company, we are more than aware o the
need to constantly compare ourselves to other
companies on a local, national and international
level i we are to retain our position as one o the
UK’s most ecient and saest gas networks.
Indeed, it is undamental that this occurs i the
challenges set under RIIO are to be met.
We regularly compare and share innovations
and best practices with the other utilities in our
operational area on a local level, other GDNs, utility
companies and ex-public companies on a national
level, and a range o companies on an international
level.
Evidence o our systematic approach to
benchmarking can be ound in Appendix A3 and in
the ollowing examples.
7/22/2019 Ngn Business Plan
http://slidepdf.com/reader/full/ngn-business-plan 68/224
68
With a Japanese gas distribution company we have
carried out compare, contrast and learn activities
on the ollowing.
• Workload planning methodology.
• Mains replacement/insertion methods/
pipeline technology, maintenance regimes and
technology.
• Leakage inspection.
• Mains location identication.
• The use o smart metering and slamshut
technology.
• Mains data recording/mapping.
• Pressure monitoring and control.
• Leakage/escape perormance and emergency
response.
• Major incident control and response.
• Workorce training.
The project has been a huge success and has
conrmed areas where we can learn rom each
other mutually. This will be repeated on a regular
basis, with a view to moving into an employee
exchange programme.
With a US gas distribution company the
discussions were along more tentative lines than
with the Japanese company but the detail covered
was broadly the same. There was however
considerable learning on winter responsiveness.
We plan to build on this relationship in the uture.
We have been used as a benchmark by other
companies, including an anonymous operator o
several UK, airports to compare capital expenditure
strategies.
We also regularly benchmark and share best
practice on an international level betweenshareholder group companies on eciency, social
obligations, saety, customer satisaction and
environmental perormance.
The Greenroad scheme encourages international
best practice or driving saety and uel eciency
thus reducing cost.
We understand that we are on track to be the rst
network, at a commercial scale, to inject bio-
methane into the gas network. Bio-methane is
carbon neutral, so this activity will help to reduce
our carbon ootprint and the carbon ootprints o
our customers, helping the UK reach its climate
targets.Our pioneering work on recycling the material
excavated rom our trenches rather than using
virgin aggregate continues to deliver eciencies
and minimise our impact on the environment.
We have also moved away rom using
hazardous substances in our mains sealant and
spillage treatment kits, which mean that any
waste produced has a minimal impact on the
environment.
We are an active member o the Institute o
Customer Service (ICS) whose code we use
to ensure that we are working to national best
practice. Going orward we will be working with the
ICS to benchmark ourselves at the highest level
against national and international companies. We
are committed to not only being the best GDN, but
amongst the best companies nationally.

7/22/2019 Ngn Business Plan
http://slidepdf.com/reader/full/ngn-business-plan 69/224
69
4.7 Summary The TCO approach is our innovation strategy. Our
new integrated business model has been designed
to enable TCO.
The new TNM processes are integral to NGN’s
TCO approach.Our innovation plans and approach to the use o
benchmarking and best practice will continue to
support our drive to build on our rontier position.

7/22/2019 Ngn Business Plan
http://slidepdf.com/reader/full/ngn-business-plan 70/224

7/22/2019 Ngn Business Plan
http://slidepdf.com/reader/full/ngn-business-plan 71/224
The views of our customers and other stakeholders are important to
NGN. They provide a vital direction and focus to improve our service
delivery. To develop this plan we implemented an enhanced engagement
programme to ensure all stakeholders were given an opportunity to
engage with us. This built on our existing stakeholder engagement
activities and has provided valuable input. This section explains how we
have incorporated stakeholder views into our business plan.
71
5Stakeholderengagement

7/22/2019 Ngn Business Plan
http://slidepdf.com/reader/full/ngn-business-plan 72/224
72
Executive summaryStakeholders require NGN to manage a value or
money, sae, reliable, customer and environmentally
ocused network. That is our experience based
upon six years o two-way communications and
reinorced by the engagement programme which
we delivered or this business plan.
Our stakeholder engagement process drew upon a
cross-section o customers, interested individuals,
groups and organisations. We have engaged with
them by email, the internet, letter, telephone and
ace-to-ace; individually, in small groups and in
large groups. Some were engaged just once; many
had several opportunities to become more closely
engaged.
This comprehensive strategy not only ensured that
we engaged with our stakeholders, but that they
were closely involved in the development o our
business plans. They were provided with multiple
opportunities to deliver their views. They told us
their priorities and directed us on where outputs
should improve and where they were content or
others to be maintained at current levels. They
emphasised the need or a value or money gas
distribution network, and when they understood
our initial spending plans, they clearly told us where
they were too expensive and directed where we
should make adjustments. This has reduced our
expenditure orecasts by c.£250m over the RIIO-
GD1 timerame.
Not everything which our stakeholders suggested
has been included in this business plan. The
stakeholders themselves have been inormed why
and some are described in this section.
Stakeholders have shaped this business plan and
delivered a clear message: continue to provide
a sae, reliable, customer and environmentally-
ocused business.
We are committed to delivering this or them and to
continuing our inclusive relationship with them.

7/22/2019 Ngn Business Plan
http://slidepdf.com/reader/full/ngn-business-plan 73/224
73
5.1 Background
To deliver NGN’s corporate vision, it is clear that
we must work closely with our various stakeholder
groups. We must proactively provide them with the
opportunity to comment and give eedback on our
services, and enable a productive two-way dialogue
to be established. The eedback rom stakeholders
directs and inorms operational business decisions,
allowing us to identiy areas where our services
are appreciated and recognised as best in class.
It identies areas where our service delivery ails to
meet the expectations o our various stakeholder
groups and provides an impetus to plans or continual
improvement.
We have, over the past six years, established a
robust and meaningul stakeholder engagement
strategy which delivers credible interaction across all
stakeholder audiences. This captures our customers’
views on what is important to them, how they rate our
perormance and how we can improve our service to
them in the uture. This strategy also includes an open,
two-way communication process, under which
eedback is reviewed and analysed and used to rene
our operational delivery.
As part o the development o this business plan, our
existing stakeholder engagement programme was
enhanced to include the slightly wider range o issues
and longer timescales associated with the RIIO-GD1
period.
Stakeholders were engaged on a range o issues
and asked to consider our existing services and
outputs, and a number o potential new services and
outputs which the company could deliver. We tested
the appetite or change by outlining the cost impact
o these potential new services. The stakeholder
engagement process delivered valuable eedback on
this across all customer groups.
NGN has engaged with 1,700 individual stakeholders
and groups to ask them what they need, value and
want rom a GDN. NGN will continue this critical
engagement as part o our on-going business
operations.
It is clear that customers want NGN to run a sae,
reliable and environmentally-ocused network
which continues to deliver value or money.
Figure 5.1: Stakeholder engagement summary
Stakeholders want NGN to deliver a sae,
reliable and environmentally ocused gas
distribution network which delivers value
or money.
These requirements have directly
impacted NGN’s business plan or
RIIO-GD1 including reducing the overall
cost.
We will continue to listen to the views o
stakeholders and adapt as a business to
meet their requirements.NGN has listened to its stakeholders in meetings
(ocus groups, one to one and customer panels) as well as
through specic phone calls and on-line technology.
•Customers
•Membersofthepublic
•Highwayauthorities
•Localauthorities
•Pressuregroups
•Businessgroups
•Charitiesandsupportgroups
•Gasshippers
•Consumergroups
•MPs
Stakeholders have given usclear messagesStakeholder Engagement Approach

7/22/2019 Ngn Business Plan
http://slidepdf.com/reader/full/ngn-business-plan 74/224
74
5.2 Key messages
The key messages delivered by the RIIO-GD1
stakeholder engagement exercise reconrmed
those gathered in our previous stakeholder
eedback. The top priority issues or the general
public and customers who have experienced our
services (i.e. gas emergency visit, gas mains/
service replaced, new gas connection) are set
out below. These results come rom the two large
customer surveys we undertook.
In an environment o very high energy prices and
depressed economic conditions it is not surprising that
the top priority across almost all groups o stakeholdersis a reduction in the cost o delivering our services
and our impact upon customers’ energy bills. In most
instances this was clearly against a background where
they did not wish to see any reduction o the levels o
service provided by NGN, particularly with reerence to
saety and reliability, and were seeking assurances that
our services represented good value or money.
It became apparent that stakeholders had not
previously understood how much o their gas and
energy bills refected network costs. The majority o
stakeholders identied that at approximately £130
per year (15-20% o the total gas bill), the services
provided by NGN represented overall good value or
money and the potential or NGN to impact the overallcost o the gas bill was limited. However, they clearly
expected NGN to continue to deliver value or money
and did not want to see any signicant increases in the
transportation element o their gas bill.
This message was urther underlined when a range
o the enhanced service options proposed by
stakeholders were costed and presented to customers
to represent the impact on their bill. In almost all cases
this simple willingness to pay exercise identied that
customers would preer to stay with current levels o
service i any improvement led to an increase in their
Figure 5.2: Top stakeholder priorities RIIO-GD1

7/22/2019 Ngn Business Plan
http://slidepdf.com/reader/full/ngn-business-plan 75/224
75
bills. This preerence and clear statement on presenting
value or money has been refected throughout this
plan.
Most stakeholders were aware o and clearly identied
the inherent saety issues involved in transporting
and delivering natural gas and placed a high value on
continued levels o saety. This was particularly the
case or stakeholders who had experience o NGN or
had previously been impacted by our activities. The
over-arching message was that current levels o saety
must be maintained.
Stakeholders were broadly aware o how our activities
impact upon the environment. Environmental concerns
and issues are relatively high on stakeholders’ list o
priorities. They would like NGN to do more to minimise
the impact o our activities on the environment, both interms o emissions and the use o natural resources,
but not at signicant additional cost to them.
Most stakeholders had not experienced an interruption
to their gas supply and the issue o reliability was not
high on their agenda. However, urther analysis has
identied that stakeholders valued the high levels o
reliability that the gas network currently provides and
that level should be at least maintained. In short, they
took or granted the sae and reliable delivery o gas.
There were several suggestions which stakeholders
made, which we evaluated but chose not to
implement.
One example which we have discounted was a
request to carry out planned mains replacement works
only between March and November and not in the
winter months.
We have discounted this, and explained our reasons to
the customers who requested it. This way o working
would place undue pressure to complete the required
levels o planned works in a shorter timerame each
calendar year. Removing the ability to work in our
months o the year would require a signicant increase
in the number o people employed or the remaining
eight months. This would increase contractor costs (as
they would only have work or their teams o engineers
or two-thirds o the year), increase pressure on local
authority highways planners, and lead to signicant
increased costs in our mains replacement works,
which ultimately would be passed on to our customers.
Another example was a suggestion to deliver a
aster service or customers requesting a new gas
connection. We discounted this because we already
greatly exceed the required standards and improving
this would require additional resources, and greater
costs, which would be passed to customers.
Some stakeholders also suggested that when an
emergency engineer attended a call to the home o
a vulnerable customer, the engineer should not leave
the property without a live gas supply. This was to
address the instances where an engineer had to isolate
an appliance, or even the entire supply, as a result o
a carbon monoxide problem or a problem with an
appliance or appliances requiring urther investigation
or service work.
We explored this suggestion by quantiying the numbero vulnerable customers in our network and worked
out a cost based on an estimated average time to
carry out the work and estimated costs or parts. In
addition there would be the cost o urther training or
our engineers. Another option was or us to bring in a
competent sub contractor to carry out the necessary
work. We calculated the increased cost per household
would average c.16p/year. Legislative changes would
also have been required. We decided not to pursue
the idea and communicated our response to thestakeholders.
In response to stakeholder eedback we have reduced
our orecast expenditure in RIIO-GD1.
Our current expenditure plans represent a reduction o
c.£30m per year (c.£250m in total in RIIO-GD1) when
compared to our previous plans (on a consistent basis)
whilst still delivering improvements in saety, eciency,
customer service and environmental perormance.
This reduction is shown in Figure 5.3 and Figure 5.4
overlea.
This has been achieved by assessing our expenditure
using a more holistic risk-based approach and
identiying the key trade-os between expenditure
categories and the delivery o outputs largely enabled
by the changes to the Repex proposals.
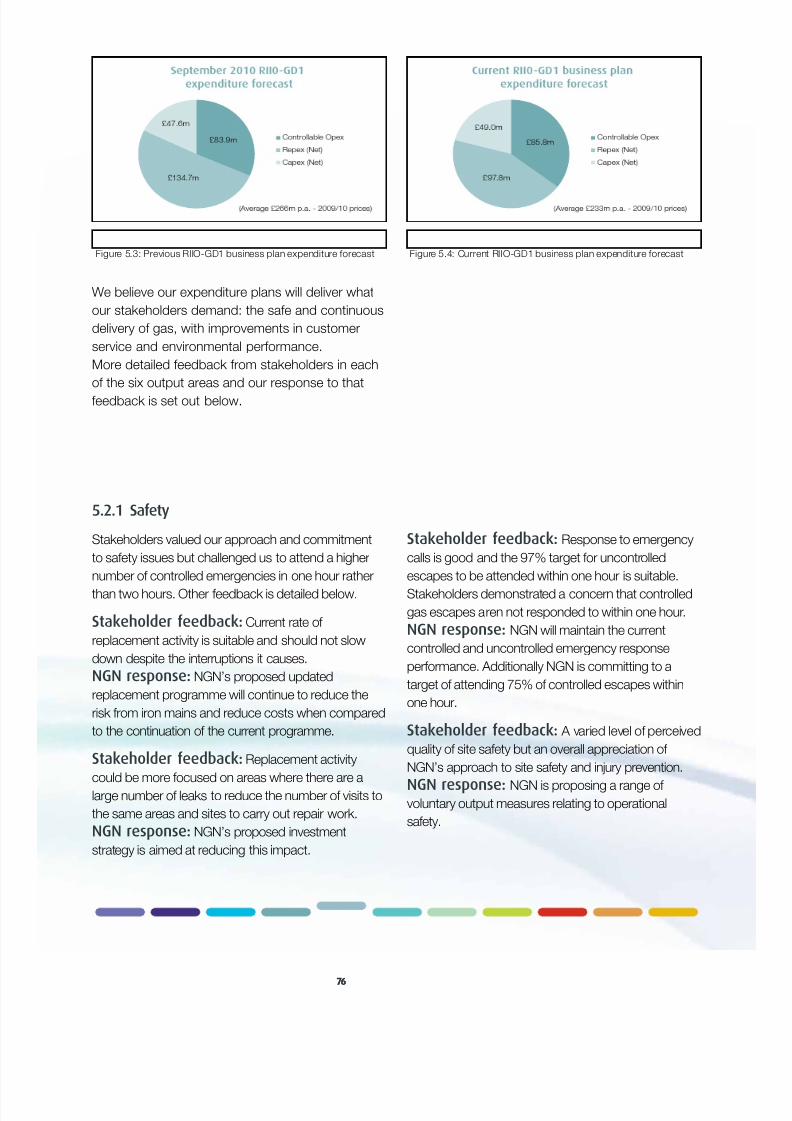
7/22/2019 Ngn Business Plan
http://slidepdf.com/reader/full/ngn-business-plan 76/224
7676
We believe our expenditure plans will deliver what
our stakeholders demand: the sae and continuous
delivery o gas, with improvements in customer
service and environmental perormance.
More detailed eedback rom stakeholders in each
o the six output areas and our response to that
eedback is set out below.
5.2.1 Safety
Stakeholders valued our approach and commitmentto saety issues but challenged us to attend a higher
number o controlled emergencies in one hour rather
than two hours. Other eedback is detailed below.
Stakeholder feedback: Current rate o
replacement activity is suitable and should not slow
down despite the interruptions it causes.
NGN response: NGN’s proposed updated
replacement programme will continue to reduce the
risk rom iron mains and reduce costs when comparedto the continuation o the current programme.
Stakeholder feedback: Replacement activity
could be more ocused on areas where there are a
large number o leaks to reduce the number o visits to
the same areas and sites to carry out repair work. NGN response: NGN’s proposed investment
strategy is aimed at reducing this impact.
Stakeholder feedback: Response to emergencycalls is good and the 97% target or uncontrolled
escapes to be attended within one hour is suitable.
Stakeholders demonstrated a concern that controlled
gas escapes aren not responded to within one hour.
NGN response: NGN will maintain the current
controlled and uncontrolled emergency response
perormance. Additionally NGN is committing to a
target o attending 75% o controlled escapes within
one hour.
Stakeholder feedback: A varied level o perceived
quality o site saety but an overall appreciation o
NGN’s approach to site saety and injury prevention.
NGN response: NGN is proposing a range o
voluntary output measures relating to operational
saety.
Figure 5.3: Previous RIIO-GD1 business plan expenditure orecast Figure 5.4: Current RIIO-GD1 business plan expenditure orecast

7/22/2019 Ngn Business Plan
http://slidepdf.com/reader/full/ngn-business-plan 77/224
7777
5.2.2 Reliability
Most o the stakeholders we engaged with had not
experienced a supply interruption and told us they
took or granted their access to gas. They asked us
to continue with this level o service. Other highlighted
issues are detailed below.
Stakeholder feedback: NGN should maximise
the utilisation/capacity o assets beore considering
upgrades and replacements.
NGN response: NGN has a good track record
in delivering an investment strategy based upon
only upgrading or replacing assets when absolutely
necessary. We have been developing this strategy
through our Total Network Management approach that
directly links accurate inormation about the condition
o that asset with the impact o asset ailure on servicedelivery. The investment programme in this plan is
based directly upon this approach.
Stakeholder feedback: Shippers would consider
contributing nancially to an increase in otake meter
accuracy and reliability; they would also like an audit
programme and a penalty or low service standards.
NGN response: NGN is committing to a target o
no errors above the classication o ‘low signicance’
during RIIO-GD1. To achieve this, we plan to invest tomodiy, update or replace assets to improve reliability
(e.g. ultrasonic meters), and will continue to improve
and amend policies and procedures and continue sta
training.
Stakeholder feedback: There should be no
degradation in the high levels o network reliability
provided by NGN.
NGN response: An investment programme which
delivers an increase in asset health in RIIO-GD1 will
improve the integrity and reliability o NGN’s network.
We have committed to a package o reliability outputs
that show improved perormance over the period.
5.2.3 Customer service
Customers requested some minor ne-tuning o our
customer service delivery but generally recognised our
inclusive approach. Some o their queries are detailed
below.
Stakeholder feedback: Provide key account
managers or large NGN customers and provide other
ront line sta with training to improve service levels.
This should include those dealing directly with industry
users.
NGN response: All ront line sta are being given
additional training on customer service. We are
placing more emphasis on our ront line sta to
deliver improvements in customer service. Account
management or large sites will be covered by our
stakeholder strategy.
Stakeholder feedback: Establish and develop
good working relationships with local authorities to
enable a synchronised approach to highway works to
minimise repeated disruption.
NGN response: This is already being pursued with
local authorities and other utilities operating within our
geographic area and we anticipate urther benets
during RIIO-GD1.
Stakeholder feedback: Simpliy external
communication to ully inorm all stakeholders and
use a variety o media, ormats and languages to
communicate.
NGN response: NGN has an ongoing programmeto review its communication strategy to ensure that
eedback rom stakeholders is addressed.
Stakeholder feedback: Customers are
comortable with complaint resolution within 10 days
so the D+1 and D+31 measures are suitable.
NGN response: NGN is committing to a 10%
year on year reduction in complaints in the RIIO-GD1
period. Additionally we are committing to a target that
20% o all complaints will be resolved within D+1. All
residual complaints are targeted to be resolved within
D+31.
Stakeholder feedback: Stakeholder engagement
and management has been viewed as inclusive
and useul throughout GDPCR1 and the RIIO-GD1
planning process; this should be maintained.
NGN response: NGN has a long term stakeholder
engagement strategy that is directly linked to its
customer service strategy and which builds upon the
successul engagement exercise undertaken as part o the development o this plan.

7/22/2019 Ngn Business Plan
http://slidepdf.com/reader/full/ngn-business-plan 78/224
7878
5.2.4 Environment
Most stakeholders want us to reduce the impact we
have on the environment.
We were originally requested to demolish our
gasholders and remediate the sites. However when
we inormed stakeholders o the cost they revised the
output to solely demolish without land remediation.
Other environmental issues are detailed here.
Stakeholder feedback: NGN should maintain
leakage reduction as a top priority throughout RIIO-
GD1.
NGN response: NGN is committed to the delivery
o a urther 20.5% reduction in the amount o gas
that leaks rom the network during RIIO-GD1. This
is equivalent to 280 GWh o energy or more than500,000 tonnes o carbon emissions (tCO2e).
Stakeholder feedback: Strong support or GDNs
to take an active role in assisting the development o
bio-methane technology but, do not expect GDNs to
nance or subsidise these schemes.
NGN response: NGN has introduced voluntary
standards o service or dealing with enquiries and
the provision o inormation. We are actively exploring
innovative approaches to address issues surroundingthe injection o bio-methane.
Stakeholder feedback: NGN sites with
contaminated land should be remediated. However,
stakeholders do not think that this should result in
higher costs.
NGN response: NGN is progressing the
commitment to manage our portolio o 114
contaminated sites. The portolio will be monitored,
high and medium-high risk sites remediated and the
environmental impact will be minimised.
Stakeholder feedback: Supportive o NGN’s
commitment to the use o recycled material and
recycling acilities.
NGN response: NGN will maintain the use o
recycled aggregate at 80% o total usage across the
RIIO-GD1 period.
Stakeholder feedback: Would like visibility o
NGN’s business carbon ootprint (BCF), including
the scope three emissions (e.g. business travel and
external contractors).
NGN response: NGN actively measures and
manages our BCF and we intend to reduce our non-
leakage carbon emissions. NGN is committing to a
reduction in its BCF over RIIO-GD1.
5.2.5 Social obligations
We were asked to continue with our work to address
uel poverty and to increase our promotion o carbon
monoxide (CO) awareness, as shown below.
Stakeholder feedback: When NGN engaged the
general public, 76% o those asked believed we have a
responsibility to do more about CO issues, such as:
• raising awareness o the risks o CO across the
network;
• ensuring the public understand how to prevent
the risks o CO;
• actively reduce the risks o CO on our network;
and
• stakeholders, such as local authorities, believe
NGN should carry out CO detection in propertiesand leave monitors with vulnerable customers.
NGN response: NGN is committing to delivering
two key initiatives relating to CO during RIIO-GD1.
• Delivering a customer awareness programme in
conjunction with strategic partners across the
network to enhance the understanding o the
risks and saety precautions relating to exposure
to CO in properties.
• Introducing new procedures that will seeengineers carry out atmospheric testing or the
presence o CO at every property attended
in response to a gas emergency call. NGN is
imminently trialling this approach.
7/22/2019 Ngn Business Plan
http://slidepdf.com/reader/full/ngn-business-plan 79/224
7979
Stakeholder feedback: Strong stakeholder
support or the continuation o an initiative to
connect uel poor customers to our network.
• The current programme or extending the gas
network into socially deprived areas is supported
by our stakeholders.
• NGN was challenged to extend the uel poor
scheme.
• It was also suggested that other sectors o
society, such as outlying rural areas, should be
considered or a similar scheme.
NGN response: NGN is committing to connecting
an additional 6,500 uel poor customers to our
network over the RIIO-GD1 period.
5.2.6 Connections
Stakeholders believed our connections service was
good but asked or a quicker service.
Stakeholder feedback: Our stakeholder
engagement on connections identied several key
issues.
• A quicker service, particularly in the scheduling
o jobs ollowing acceptance o quotation and
completion.• Providing an agreed plan date within ve days o
acceptance o quotation, would be a high quality
service.
• Current standard o providing a date within 20
days o acceptance is deemed inadequate; 10
days would be a more suitable period.
• New gas connections should be completed
within one week o payment.
NGN response: At this stage NGN does not believe
that there is a strong business case to increase theperormance target rom current standards. However,
this plan includes a commitment to challenge the time
taken to plan and schedule work ollowing acceptance
o a quote and to improve perormance where it is
ecient to do so.
5.3 Stakeholder engagementsince 2005
The additional stakeholder engagement work
which NGN undertook or RIIO-GD1 was a natural
progression o the work which was already well
established in the network.
The major routes o engagement which have been
used since 2005 include the ollowing.
Impression Cards - An Impression Card is
delivered to every property upon the completion o
replacement, repair and connections works. These
seek views rom customers o their experience while
our works were underway. We received more than
11,000 returned cards each year.
Complaints - We record and analyse all complaints
seeking to identiy the underlying cause and target
improvement initiatives. We have successully reduced
complaints by c.74% since 2007.
Enquiries - Telephony introduced in 2010 provided
the ability to record and monitor the number o
incoming telephone enquiries. During 2011 we
anticipate around 64,000 enquiries.
Customer liaison ofcers - The role o aCustomer Liaison Ocer (CLO) was introduced to be
the eyes and ears o the organisation in the planning
and pre-construction activities surrounding mains
replacement works and also around sensitive repair
and emergency work.
Public meetings - When we identiy a mains
replacement project which may be dicult to complete
without signicant impact upon the local population, a
public meeting was arranged to enable the delivery o
key messages about the work.
Website - The NGN website has the acility or
customers to contact the company to raise issues, ask
questions and make complaints. Annually we receive
approximately 850 contacts, o which around 10% are
complaints, and are included in the overall numbers
recorded in the network.

7/22/2019 Ngn Business Plan
http://slidepdf.com/reader/full/ngn-business-plan 80/224
80
5.4 Stakeholder input to RIIO-GD1business plan
RIIO-GD1 provided a timely opportunity or the
company to review its approach to both the
development o the business plan and or the next
decade.
NGN reviewed how stakeholder engagement was
delivered in the utility arena in the UK and around the
world, identiying areas o best practice to incorporate
into our own service delivery. An extensive review
was undertaken within the company to determine
who to engage with and at what level in the external
organisations. We also used an external consultancy to
provide expert insight into this area o work.
For the business plan, we developed a strategy whichwould deliver touch points with all our stakeholder
audiences, using the title Your Views Matter to give an
easily understood and unambiguous identity to the
work programme.
We identied that it was essential to engage with
all stakeholder audiences, representing the whole
o society: customers, gas users, suppliers and
contractors, charities, gas shippers, politicians, local
authorities and our own employees.
5.4.1 Stakeholder engagement approach
We developed a stakeholder engagement pyramid to
deliver eective engagement across all stakeholder
audiences and groups.
We identied the key stakeholders at each level and,
or levels two and three, asked each stakeholder
their preerred method o communication – mail,
email, telephone survey, mail survey, ace-to-ace,
one-to-one or one-to-groups. (The numbers involved
at level one mitigated against this approach.) Based
on this eedback, and that rom our benchmarking
work with other companies, we devised the ollowing
engagement programme.
We engaged 1,700 separate individuals and
organisations throughout the process via a range o
routes. Many stakeholders were engaged on several
occasions as we sought to ensure that we were
interpreting and refecting their preerences within our
proposals and to provide them with the opportunity to
see how our plans were developing over the period.

7/22/2019 Ngn Business Plan
http://slidepdf.com/reader/full/ngn-business-plan 81/224
81
Level 1: We engaged a market research company
to advise on the most eective way o garnering and
evaluating the views o the general public. The advice
they gave, which the company accepted and used,
was to select at random a representative number o customers who had completed an Impression Card
during 2010, and to write to them asking i they would
undertake a short telephone survey. This work was
carried out in February and March 2011, with 600
customers responding and delivering initial eedback.
A urther 200 dierent customers were surveyed in
April and May 2011, undertaking a survey based on a
willingness to pay or additional services.
Additionally, a urther 800 customers completed asurvey through YourSayPays, an internet-based email
process. This work was undertaken in February and
March 2011.
All users o the NGN website were also invited to
register their views. It was not possible to determine
which o the three groups these respondents
belong to.
Level 2: We wrote to and emailed a wide range o
stakeholders, o whom 76 responded, to open the
engagement process, delivering a bespoke ‘Our
services – Your views matter’ publication. Stakeholders
were asked i they would be willing to engage with us,
their preerred method o communication, and were
directed to a micro-site within the company website.
These stakeholders were: armers and landowners,
key senior directors in local government (chie
executives, directors o highways, education and
social services), leaders o national and regional
charities, suppliers and contractors and trades union
representatives o our employees.
We devised a bespoke solution to engagement with
this group o stakeholders; inviting a smaller group
o level two stakeholders to join our new customerpanels. This is an enhanced element o our stakeholder
engagement programme. We have established two
panels, the rst covers the North o the network area
and the second covers the Yorkshire part o our
network.
Figure 5.5: NGN’s approach to stakeholder engagement
High
Low
StakeholderengagementapproachKnowledge o gas
distribution
•Gasshippers
•Consumergroups
•MPs
•Customers•Membersofpublic
•Highwayauthorities
•Localauthorities
•Pressuregroups
•Businessgroups
•Charitiesandsupportgroups
Level 3
Level 2
Level 1
7/22/2019 Ngn Business Plan
http://slidepdf.com/reader/full/ngn-business-plan 82/224
82
Membership is by invitation, and consists o
contractors and suppliers, the emergency services,
representatives o the CBI, local authorities and the
third sector (charities). To date, the panels have met
three times and have provided key eedback on a wide
range o our business activities.
In uture, the panels will meet three or our times
annually, as decided by the members, and will discuss
business relevant issues and initiatives, plus wider
issues aecting the sector.
Level 3: We identied key stakeholders with
whom the company wished to engage, covering
gas shippers and MPs with particular interest in, or
detailed knowledge o energy. The renewable energy
sector was also represented at level three. These key
contacts were written to, asked their preerred methodo providing eedback, which was unanimously ace-
to-ace, and individual meetings then ollowed. Some
stakeholders’ requested several meetings as the
process developed.
Our engagement strategy at level two and three was
supplemented by an external public aairs agency
which provided ‘expert’ input on engagement at these
levels. Further detail o our stakeholder engagement
programme is contained in the Appendix A5.
5.4.2 Stakeholder engagement next steps
NGN is committed to engaging with our stakeholder
groups through the RIIO-GD1 price control.
We will continue to meet, discuss and debate with our
customers examining the way in which the company
meets its obligations and delivers its services. We will
also analyse our customers’ experiences to identiy
ways in which we can become more eective. NGN
will strive to deliver continuous improvement in our
service delivery and improvements in our customers’
experience o our works.
In order to deliver this continuous improvement, NGN
will actively source stakeholders’ views and opinions,
as already described. This data will then be ed into the
business and used as a catalyst or change. This will
be a continual process, embedded in our business,
to deliver incremental and sustainable year-on-year
improvements across all our activities.
We have already made undamental changes to the
ways in which we engage with stakeholders, based
upon the eedback we have received during the
processes described. A large number o stakeholders
told us they would preer to communicate with us in
person (ace-to-ace or by telephone) rather than via a
paper-based process.
So, in August 2011 we ceased to issue Impression
Cards to our customers. These customers now receive
a telephone call, asking them to rate our perormance.
Initially, we plan to source the same number o
eedback telephone calls as we had impression cards,
around 11,000 per year. This is a resource intensive
activity but one which NGN has committed to in
order to demonstrate that we not only source our
stakeholders’ views but also act upon them.
The results o the telephone surveys are analysed each
week to identiy trends and areas or improvement and
ocus.
We have sharpened the ocus o our customer
service delivery. During the summer o 2011 our
entire operational workorce, in replacement and
repair and emergency, has taken a bespoke training
package to enhance their ability to engage eectively
with customers. The purpose o this was to embed
responsibility or customer satisaction with our
employees (including contract partners) where the
touch points occur, at the local level, rather than rely
on experts being brought in to provide supplementary
support. We believe this investment will bring the
incremental and sustainable improvement in our
customer service perormance throughout the RIIO-
GD1 timerame.
In addition to the existing customer service action plan,
we have developed an over-arching stakeholder action
plan, identiying separate audiences, specic activities
and management engagement with them.
This action plan is the responsibility o a member o
the company’s Senior Management Team. It is tracked
and measured monthly to ensure the targets are met,
that process change is identied and delivered, and
that the views o our stakeholders are measured and
acted upon.
7/22/2019 Ngn Business Plan
http://slidepdf.com/reader/full/ngn-business-plan 83/224
83
For example, we will introduce a key account manager
whose responsibilities will include regular liaison
and meetings with our top 50 largest gas user sites;
we will use telephone surveys to gauge customers’
experience o operational delivery, rening this in the
light o eedback; we will continue to arrange meetings
o our Customer Panel, engaging on strategic,operational and local activities and issues; and we will
continue to deliver our educational programme with
schools across our geographic ootprint.
We remain committed to the business vision: to be
measured by Ogem and the HSE as a consistent top
two perormer or cost-eciency, saety and customer
service. In act, we have the ambition to be the best,
best in class o the eight GDNs.
To achieve this, we need to work with our customersand all stakeholders to nd out what is important to
them, ask them to measure our perormance against
what is important to them, analyse their eedback
and deliver an improved business perormance which
meets their expectations.
Only by delivering an eective and consistent two-way
communication process, sourcing data and using it to
drive improvements, can NGN meet its business vision
and progress to being best in class.

7/22/2019 Ngn Business Plan
http://slidepdf.com/reader/full/ngn-business-plan 84/224

7/22/2019 Ngn Business Plan
http://slidepdf.com/reader/full/ngn-business-plan 85/224
85
6Outputorecasts
NGN has detailed 56 output measures in six business activity areas in this
business plan, covering the eight years of the RIIO-GD1 price control period.
This section contains detailed forecasts of how NGN expects to perform in
these areas. They show what we will deliver for customers.

7/22/2019 Ngn Business Plan
http://slidepdf.com/reader/full/ngn-business-plan 86/224
86
Executive summaryOur stakeholders told us what was important to
them and what they expected us to deliver on their
behal. With this clear directive we have committed
to 56 business output measures or the eight years
o RIIO-GD1.
O these 56 measures, six are voluntary and we
will implement them as a direct result o what
stakeholders told us. We plan to improve our
perormance in 35 areas and to maintain current
perormance in the remaining 21.
This will ensure NGN continues to provide a sae
and secure gas distribution network, consistently
delivering a value or money service or our 2.6m
customers.
We will be measured against the challenging
targets we have set out in this business plan
and we will report our perormance regularly to
stakeholders.
The six output areas – saety, reliability, customer
service, the environment, social obligations and
connections – provide a comprehensive ramework
and, with the inclusion o our stakeholders’ views,
give a clear direction where to ocus our objectives
or RIIO-GD1. For example, we aim to improvecustomer satisaction by reducing complaints; we
will lessen our environmental impact by reducing
gas leakage rom our network and cutting our
overall carbon ootprint; we will take more people
out o uel poverty by connecting them to the gas
mains system; we will reduce the risk rom old
metal gas mains and cut the number o accidents
in our network; we will invest eciently; and we will
work to connect bio-methane producers and other
low carbon gas sources to our network.
NGN will meet the commitments contained in this
section and maintain high levels o perormance
throughout RIIO-GD1.

7/22/2019 Ngn Business Plan
http://slidepdf.com/reader/full/ngn-business-plan 87/224
87
6.1 Background The chapter is organised into six sections, each
covering one o the output areas. Each section
provides:
• a description and explanation o the individual
outputs in that category;
• NGN’s historic perormance or each individual
output;
• a high level summary o stakeholder eedback on
that category o output and an explanation as to
how this has been considered in setting uture
perormance; and
• NGN’s orecast perormance or each individual
output during the period 2011/12 to 2021/22.
The aims or each output are described below.
• Saety
Minimising the risks associated with operating
the gas distribution network or our stakeholders
and society.
• Reliability
Improving the reliability o our network with the
optimum level o expenditure.
• Customer service
Improving the service we oer customers by
engaging with them ully so their views direct the
way we operate our business.
• Social Obligations
Helping to alleviate uel poverty and actively
addressing the concerns and risks o CO.
• Environment
Reducing the environmental impacts o gas
distribution.
• Connections
Providing a high quality connections service or
both entry and exit customers.
These output categories refect those outlined in
the March 2011 Strategy document and includeall the individual outputs it contained. In places
we have supplemented the plan with voluntary
additional outputs which we consider important,
relating to our uture perormance and/or ollowing
eedback rom stakeholders. For ease o reerence
the additional outputs are shaded in white in the
diagrams at the start o each section.

7/22/2019 Ngn Business Plan
http://slidepdf.com/reader/full/ngn-business-plan 88/224
88
6.2 SaetyEnsuring the provision o a sae network in compliance with HSE saety standards, and
improving their asset knowledge to ensure companies develop well-justied investment plans.
6.2.1
Mains replacement
6.2.2
Emergency response
6.2.3
Repair
6.2.4Major accident hazard
prevention (MAHP)
6.2.5
Operational saety
Primary output measure Primary output measure Primary output measure Primary output measure Primary output measure
i Risk removed i Percentage o
uncontrolled gas
escapes attended within
one hour
i Total outstanding annual
repair risk
i Compliance with Control
o Major Accident
Hazards (COMAH)
regulations
ii Compliance with Gas
Saety (Management)
Regulations (GS(M)R)
i Number o Lost Time
Injuries (LTIs)
ii Number o injuries to
Members o the Public (MoP)Secondary deliverables
ii Gas in Buildings (GiB)
iii Length o pipe taken
‘o-risk’
iv Number o racture and
corrosion ailures
ii Percentage o controlled
gas escapes attended
within two hours
Secondary deliverables
ii Percentage o repairs
completed within 12
hoursSecondary deliverables
iii Percentage o controlled
gas escapes attended
within one hour
iii Percentage o repairs
completed within 7,
28 and 42 days
Additio nal NGN
output measures.
6.2 SafetySaety outputs are made up o the ollowing primary measures and secondary deliverables.
The ollowing table summarises what NGN will do in RIIO-GD1 against each o the output measures or
saety perormance, measured against stakeholder expectations.
Safety improvement summary
I m p r o v e
•Ironmainsriskremoved•NumberofGasinBuildings(GiB)
incidents
•Numberoffractureandcorrosion
incidents
•Percentageofcontrolledgas escapes attended within one hour
(voluntary measure)
•Percentageofrepairscompleted
within 12 hours
•Totaloutstandingrepairriskper
annum
•NumberofLostTimeInjuries(LTIs)
•NumberofinjuriestoMembersof
the Public (MoP)
M
a i n t a i n
•Percentageofuncontrolledgas
escapes attended within one hour
•Percentageofcontrolledgas
escapes attended within two hours
•Percentageofrepairscompleted
within 7, 28 and 42 days
•CompliancewithGS(M)R
•CompliancewithCOMAH
Regulations
•Lengthofpipetakenoffrisk.
R e d u c e
Reduce Maintain Improve
N G N
o u t p u t
c o m m i t m e n t s – R I I O - G D 1
Stakeholder requirements/expectations
Figure 6.1: Saety outputs
Figure 6.2: NGN saety improvement summary

7/22/2019 Ngn Business Plan
http://slidepdf.com/reader/full/ngn-business-plan 89/224
89
6.2.1 Mains replacement
The HSE initiated an Enorcement Policy in 2002 or the
decommissioning o iron gas pipes within 30 metres o
buildings. It prescribes a 30 year programme to reduce
the risk o injury to people arising rom re or explosion
as a consequence o the sudden ailure by racture or
corrosion o iron gas pipes. The risk is measured by
the modelling ramework or measuring iron main risk
(MRPS) which we use to prioritise the programme or
iron mains replacement.
During 2011 a series o changes have been agreed
to the HSE Enorcement Policy which will come into
eect in 2013. Instead o replacing all iron pipes based
on a modelled risk score, alternative approaches to
managing risk can be deployed or larger diameter
mains and actors other than the modelled risk scorecan be used or determining which smaller diameter
mains can be replaced.
The iron main decommissioning and maintenance
programme in this business plan is based on the
understanding that the HSE will ormally agree and
sign o this programme and in doing so provide
NGN with the same level o assurance under the
pipeline saety regulations.
Primary output
i Risk removed
For mains replacement, the primary output is the
measure o risk removed rom the network as a
direct result o this activity. Every pipe within NGN’s
network has a risk score, which is an indication o
historic perormance. The amount o risk removed
rom the network by the iron pipe replacement
programme is a key business measure. We are
committed to reducing the amount o risk associated
with iron gas pipes.
We have reduced the total remaining risk in the
network by around 40% whilst replacing around 20%
o the iron pipes. We have done this by replacing the
highest risk pipes rst.
Risk scores or individual pipes can change over time
based on the perormance and history o the pipe
or pipes in the immediate vicinity. This is known asdynamic growth.
Historic performance
We have almost halved the amount o risk in the
distribution network since the beginning o 2006.
However, the total iron mains risk within the network
has increased marginally since the middle o 2010 due
to dynamic growth driven by the exceptional winter in
2010/11.
Figure 6.3: Total population and total risk

7/22/2019 Ngn Business Plan
http://slidepdf.com/reader/full/ngn-business-plan 90/224
90
Target performance
Through RIIO-GD1 we will measure and track
perormance on the basis o risk removed. The key
objective o the replacement programme is to make
the network saer or customers and the public.
The delivery o the iron mains replacement programme
will remove a orecast prole o risk during RIIO-GD1,
as assessed in 2010/11.
This targeted reduction in risk does not account or
any movement in the total assessment o risk in the
iron mains population during RIIO-GD1. This target is
thereore against a static assessment o risk and does
not account or any dynamic movements in risk.
Even on a static basis, there is a degree o uncertainty
surrounding these gures as the actual risk removed
in any period will refect the specic pipes that are
selected or abandonment and their associatedindividual risk scores. However, we believe this to be
a robust central orecast o the risk removed by the
replacement programme in RIIO-GD1.
Secondary deliverables
The primary output measure or mains replacement is
supported by three secondary deliverables.
• Gas in Buildings (GiBs)
• Length o pipe taken o-risk
• Number o ractures and corrosion ailures
i Gas in Buildings (GiBs)
GiBs is a measure o the number o gas escapes
on a network pipe upstream o the emergency
control valve (ECV) which results in gas entering a
building. Gas can enter the building in a number o
ways: entering along the line o a service, having an
open escape near property or an escape within the
property.
ii Length of pipe taken off-risk
This is the amount o iron pipe abandoned (taken
out o service) during each regulatory year, in
accordance with the HSE’s approved selection
methods. Other iron pipe is abandoned and taken
o-risk because o other actors, such as condition.
Since 2005 we have consistently delivered or
exceeded the annual abandonment target agreed
with the HSE.
iii Number of fracture and corrosionfailures
The number o racture and corrosion ailures is the
number o times these incidents occur on metallic
gas mains. It is a key driver o gas escapes - the
resultant release o gas can potentially lead to an
incident.
Period GDPCR1 RIIO-GD1
Year 11/12 12/13 13/14 14/15 15/16 16/17 17/18 18/19 19/20 20/21
Calculated Risk Removed (Incidents/year) 0.081 0.049 0.0222 0.0148 0.0132 0.0132 0.0132 0.0144 0.0197 0.0113
Figure 6.4: Target perormance risk removed

7/22/2019 Ngn Business Plan
http://slidepdf.com/reader/full/ngn-business-plan 91/224
91
Historic performance
The table below shows our perormance against these
measures since 2005.
Target performance
Our orecast perormance against these three
deliverables are shown in the table below.
Year 2005/06 2006/07 2007/08 2008/09 2009/10 2010/11
Length o pipe taken o-risk (km) 482 523 529 533 535 532
Number o Gas in Buildings 137 97 150 167 154 168
Number o ractures and corrosion ailures 2,687 2,282 2,712 2,833 3,119 3,474
Figure 6.5: Historic perormance or mains replacement secondary deliverables
Period GDPCR1 RIIO-GD1
Year 11/12 12/13 13/14 14/15 15/16 16/17 17/18 18/19 19/20 20/21
Length o pipe taken o-risk (km) 526 506 506 506 506 506 506 506 506 506
Number o Gas in Buildings 153 151 150 148 147 145 144 142 141 140
Number o ractures and corrosion
ailures2,885 2,856 2,827 2,799 2,771 2,743 2,716 2,689 2,662 2,635
Figure 6.6: Target perormance or mains replacement secondary deliverables
Our orecast length o pipe taken o-risk is deriveddirectly rom the new approach to iron mains
replacement. The target mains abandoned lengths
are thereore ully consistent with the replacement
expenditure orecasts set out within this plan (more
detail is set out in Section 7).
The target perormance is based on the trend o GiBs
(number o GiBs per 1,000 km) data rom 2005/06 to
2010/11 against the orecast o the remaining length
o live iron pipe each year. We are orecasting thenumber o GiB incidents to all by around 7% over the
period. GiBs are driven by a wide range o external
actors including weather, ground conditions and the
deterioration o assets. This results in diculties in
identiying trends over time. There is thereore a range
o uncertainty around the target gures set out above.
However, we believe that this is a realistic orecast o
GiBs during RIIO-GD1.
In a similar way to GiBs, ractures and corrosion ailures
are infuenced by actors beyond the replacement
programme, such as material deterioration, change in
temperature and ground conditions. Since 2005/06there has been a general increase in the number o
ailures despite the replacement o over 500 km o iron
mains per year during the same period. However, we
are orecasting that like GiBs, ractures and corrosion
ailures will all by around 1% per year on average over
the period.

7/22/2019 Ngn Business Plan
http://slidepdf.com/reader/full/ngn-business-plan 92/224
92
6.2.2 Emergency response
NGN has a licence requirement to attend 97% o
uncontrolled gas escapes within one hour and 97% o
controlled gas escapes within two hours. We view the
response to gas escapes as an important element o
providing a sae gas network.
Primary outputs
NGN is proposing three key primary output measures
or our emergency response - percentage o
uncontrolled gas escapes attended within one hour,
percentage o controlled gas escapes attended within
two hours and percentage o controlled gas escapes
attended within one hour.
i Uncontrolled gas escapes
This reers to a situation where the means o turning
the gas o locally cannot be accessed by the individual
reporting it (usually because o limited access to a
property). The measure is the percentage o the total
number o all reported uncontrolled gas escapes
attended within one hour by one o NGN’s First Call
Operatives (FCOs). Perormance against this target
can be adversely aected by large incidents or very
severe winter weather conditions.
ii Controlled gas escapes
This reers to a situation where the means o turning the
gas o can be accessed by the individual reporting it
and the property can be isolated rom the gas network.
The measure is the percentage o the total number
o all reported controlled gas escapes responded to
within two hours by one o our FCOs. Stakeholders
challenged NGN whether we could attend a higher
percentage o controlled gas escapes within one hour
instead o two hours required by the licence standard.
In response, an additional output measure has been
included within the plan.
Historic performance
The table below shows our perormance against these
measures since 2005.
In the winter o 2010/11 NGN was aced with
exceptionally severe weather conditions which
signicantly impacted our ability to attend site within
one or two hours. We had the coldest temperatures
seen in the regional or 100 years and several weeks
o deep-lying snow. This meant travel conditions in
the region were severely hampered. This period also
coincided with a record number o emergency calls.
The combination o these actors resulted in us not
achieving the requisite standards. Lessons have been
learnt rom these exceptional events and actored into
our business plan.
Year 2005/06 2006/07 2007/08 2008/09 2009/10 2010/11
% o Uncontrolled gas escapes attended
within 1 hour 97.21% 96.53% 98.96% 97.69% 97.11% 91.57%
% o Controlled gas escapes attended
within 2 hours98.92% 98.5% 99.7% 99.1% 98.0% 94.3%
% o Controlled gas escapes attended
within 1 hour N/A 72.1% 79.3% 81.2% 77.4% 73.3%
Figure 6.7: Emergency response primary outputs current perormance

7/22/2019 Ngn Business Plan
http://slidepdf.com/reader/full/ngn-business-plan 93/224
93
Target performance
NGN has a licence obligation to attend 97% o all
controlled and uncontrolled gas escapes within one
and two hours respectively. We are proposing that this
target be maintained throughout RIIO-GD1. We are
also making a rm commitment to attend 75% o all
controlled gas escapes within one hour in response to
clear stakeholder preerences.
6.2.3 Repair
NGN employs specic approaches or the
management o risk associated with outstanding
gas escapes and the completion o a repair to an
identied escape. We ocus heavily on the prompt
repair o escapes due to the potential risk they
pose to public saety.
Primary output
i Total outstanding annual repair risk
This is the total risk score associated with all pipes
which require a repair, recorded on a daily basis
and totalled over a year. NGN has been developing
this new, more holistic risk-based measure since
2010. This approach calculates a risk score or
every escape, based upon a range o criteria.
The repair o these escapes is then prioritised
according to their scores. We now have one ullyear o data and rom this we estimate a baseline
total annual repair risk score to be 41,800,000 or
one calendar year.
Figure 6.9 shows the prole o repair risk under this
new measure during 2010.
NGN also believes it is important to complement
this measure with additional measures to ensure
all repairs are completed within a reasonable
timescale. Using the above measure alone could
potentially result in the very lowest risk escapes
never being completed. This does not alignwith stakeholder expectations to minimise road
disruption and reduce carbon emissions rom
escaping gas. We thereore also include additional
secondary deliverables related to the age o an
escape.
Target performance
The target is to reduce the annual outstanding
repair risk score by 1% per year in RIIO-GD1.
Figure 6.8: Target emergency response primary outputs perormance
Period GDPCR1 RIIO-GD1
Year 11/12 12/13 13/14 14/15 15/16 16/17 17/18 18/19 19/20 20/21
% o Uncontrolled gas escapes
attended within 1 hour 97% 97%
% o Controlled gas escapes
attended within 2 hours97% 97%
% o Controlled gas escapes
attended within 1 hour 75% 75%
97%
97%
75%
Figure 6.9: Daily outstanding repair risk 2010

7/22/2019 Ngn Business Plan
http://slidepdf.com/reader/full/ngn-business-plan 94/224
9494
Secondary deliverables
The primary output measure or the repair activity is
supported by our secondary deliverables.
i Percentage of repairs completed within12 hours
When an FCO has responded to an emergency
call and made the gas escape sae, additional
repair work may be required. NGN is committed
to completing the majority o these repairs
within 12 hours. We have consistently achieved
rontier levels o perormance in the percentage
o repairs completed within 12 hours, showing
a steady improvement in perormance over the
GDPCR1 period.
ii Percentage of repairs completed within7, 28 and 42 days
Any escape which is not permanently repaired
within 12 hours is recorded as an outstanding
escape. We monitor these on a daily basis
and measure when they are completed, in the
categories o within 7, 28 or 42 days o them
being reported. We complete the majority,
more than 80%, within seven days and more
than 99% are completed within 42 days. Any
escape going beyond this timerame is either in
a remote position and so o extremely low risk,
or in a trac-sensitive location requiring highway
authority approval. In both cases, the escape is
monitored regularly.
Historic performance
The table below shows our perormance against
these measures since 2005.
Year 2005/06 2006/07 2007/08 2008/09 2009/10 2010/11
% o repairs completed within 12 hours N/A N/A 50.4% 55.6% 57.9% 59.1%
% o Repairs completed within 7 days N/A 87.3% 77.6% 85.7% 85.2% 81.7%
% o Repairs completed within 28 days N/A 99.0% 96.9% 98.0% 98.6% 96.8%
% o Repairs completed within 42 days N/A 99.9% 99.7% 99.3% 99.0% 98.7%
Figure 6.10: Percentage o repairs completed within 12 hours, 7, 28 and 42 days
Target performance
We are committed to improving perormance to62.5% o all repairs being carried out within 12
hours by the end o the RIIO-GD1 period. We are
targeting a continued increase in perormance
throughout RIIO-GD1 in line with our commitment
to saety.
We are targeting a consistent level o perormance
in RIIO-GD1 or the 7, 28 and 42 day repair targets.
We believe they are easible without increasingcosts to our customers. Stakeholders agree that
this level o perormance is acceptable. We will
commit to having the signicant majority o repairs
completed within 42 days by upholding a 99%
target. This is not 100% because some repair jobs
are inaccessible, or example in the middle o major
highways or those which present very little risk in
open countryside.

7/22/2019 Ngn Business Plan
http://slidepdf.com/reader/full/ngn-business-plan 95/224
9595
6.2.4 Major Accident HazardPrevention
The existing saety requirements or Major Accident
Hazard Prevention (MAHP) are set out in legislation
and monitored by the HSE and are an essential
part o operational saety.
Primary outputs
There are two primary outputs.
i Compliance with the Control ofMajor Accident Hazards Regulations(1999) (COMAH)
This requires NGN to have a major accident
prevention policy backed by a robust saetymanagement system. To comply with COMAH,
we submit a saety report or our top tier sites;
a document written by us and sent to the
Competent Authority (CA) to demonstrate that:
•We have implemented all the necessary
measures to prevent major accidents; and
•NGN has limited the consequences o major
accidents to people and the environment.
The CA is responsible or checking that site
operators take steps to prevent and limit the
eects o major accidents.
ii Compliance with Gas Safety(Management) Regulations (GS(M)R)
The Gas Saety (Management) Regulations
(1996) (GS(M)R) require gas conveyors to
prepare a Saety Case containing the inormation
required by the regulations and have it ormally
accepted by the HSE beore conveying gas.
Under GS(M)R, NGN investigates two key areas.
•Explosions due to a gas escape rom a
domestic gas installation, regulation 7(12).
• Actual or potential explosions due to a gas
escape rom the network, regulation 7(13).
NGN liaises closely with the HSE on all aspects
o Saety Case management. Regular interace
meetings are held where material and non-
material changes are discussed, agreed and
documented as appropriate. The HSE has a
rolling programme o intervention visits under
GS(M)R.
Historic performance
There have been no signicant non-compliance
issues with GS(M)R or COMAH since we took ownership o the network. This underlines our
absolute commitment to saety issues.
Target performance
We are targeting continued ull compliance with
COMAH and GS(M)R. This will be achieved
through the continued application o our robust,
well understood and thoroughly audited processes.
Figure 6.11: Target perormance percentage o repairs completed within 12 hours, 7, 28 and 42 days
Period GDPCR1 RIIO-GD1
Year 11/12 12/13 13/14 14/15 15/16 16/17 17/18 18/19 19/20 20/21
% o repairs completed within 12
hours59.5% 59.8% 60% 60.25% 60.5% 60.75% 61% 61.5% 62% 62.5%
% o Repairs completed within 7
days85.0% 85.0%
% o Repairs completed within 28days
98.0% 98.0%
% o Repairs completed within 42
days99.0% 99.0%
85%
98%
99%

7/22/2019 Ngn Business Plan
http://slidepdf.com/reader/full/ngn-business-plan 96/224
96
6.2.5 Operational safety
NGN recognises there is an inherent risk o injury
when we are working on the network. NGN has a
continuing commitment to protect the saety, health
and welare o all our employees and any members
o the public who come into contact with our works
and address this by reducing the targets or avariety o measures.
NGN believes that all work-related injuries and
illnesses are preventable. Our long term objective is
that no one is injured as a result o our operations
and we are committed to ultimately having zero
accidents on the network.
Our stakeholders told us very clearly that they
strongly support our objective and value NGN’s
approach to all saety-related issues.
Primary outputs
We are proposing two voluntary primary outputs in
this category.
i Number of lost time injuries (LTIs)
LTIs reer to instances where an individual has to
be absent rom work or more than one day dueto an injury received whilst carrying out activities
or NGN. These injuries typically happen to our
industrial employees working on the network,
where risks are higher than those carrying out
oce-based roles.
ii Number of injuries to members of thepublic (MOP)
An injury to a member o the public is any injury
that is reported by a member o public which hasbeen suered as a direct result o activity by our
direct labour or contractor sta.
Historic performance
The table below shows our perormance against
these measures since 2005.
Year 2005/06 2006/07 2007/08 2008/09 2009/10 2010/11
Number o LTIs 17 12 12 7 5 6
Number o MOPs 16 23 10 24 4 4
Figure 6.12: Current number o lost time injuries and injuries to members o the public
Figure 6.13: Operational saety target perormance
Period GDPCR1 RIIO-GD1
Year 11/12 12/13 13/14 14/15 15/16 16/17 17/18 18/19 19/20 20/21
Number o LTIs 5 5 5 5 4 4 3 3 2 2
Number o MOPs 4 4 3 3 3 3 2 2 2 2
Target performance
NGN is committed to a workplace ree o injuries
and the long term objective is to reduce the
number o LTIs and MOPs to zero. RIIO-GD1 will
see us take signicant steps towards achieving
this objective, reducing the number o LTIs by a
urther 60% to just two per year, and a urther 50%
reduction in the number o MOPs resulting rom
NGN’s activities beore the end o the period.

7/22/2019 Ngn Business Plan
http://slidepdf.com/reader/full/ngn-business-plan 97/224
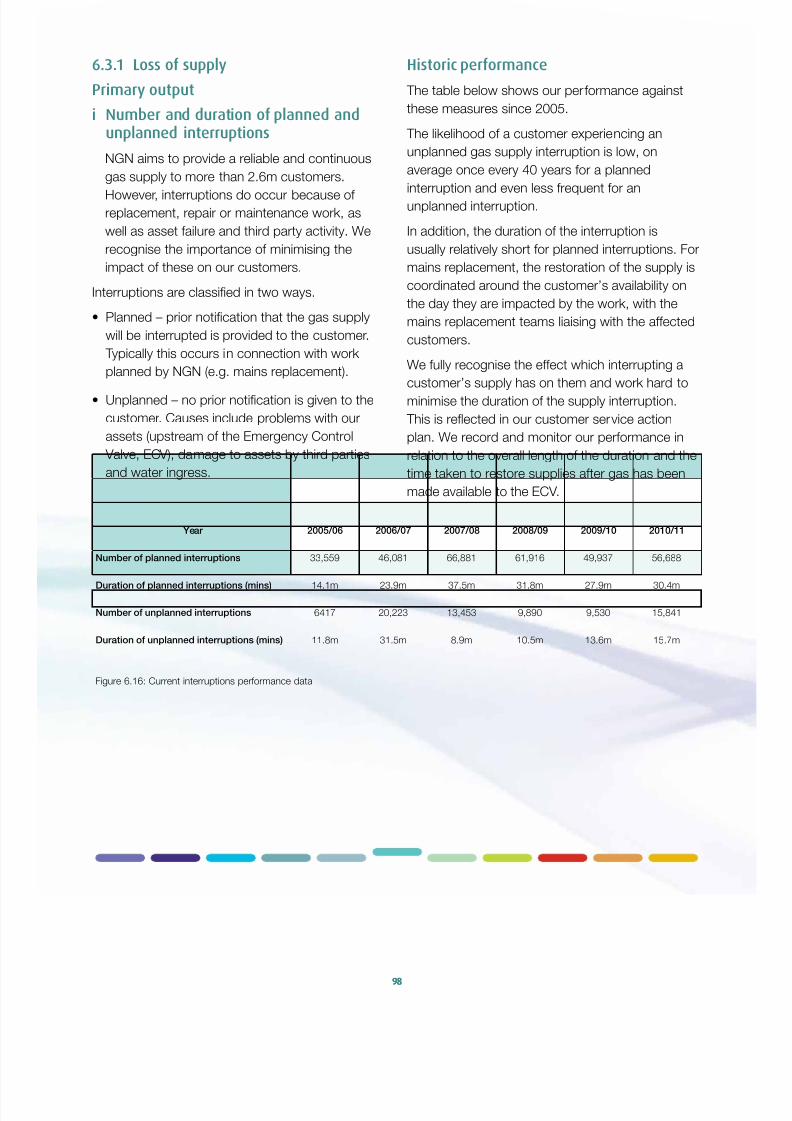
7/22/2019 Ngn Business Plan
http://slidepdf.com/reader/full/ngn-business-plan 98/224
9898
6.3.1 Loss of supply
Primary output
i Number and duration of planned andunplanned interruptions
NGN aims to provide a reliable and continuous
gas supply to more than 2.6m customers.However, interruptions do occur because o
replacement, repair or maintenance work, as
well as asset ailure and third party activity. We
recognise the importance o minimising the
impact o these on our customers.
Interruptions are classied in two ways.
• Planned – prior notication that the gas supply
will be interrupted is provided to the customer.
Typically this occurs in connection with work planned by NGN (e.g. mains replacement).
• Unplanned – no prior notication is given to the
customer. Causes include problems with our
assets (upstream o the Emergency Control
Valve, ECV), damage to assets by third parties
and water ingress.
Historic performance
The table below shows our perormance against
these measures since 2005.
The likelihood o a customer experiencing an
unplanned gas supply interruption is low, on
average once every 40 years or a planned
interruption and even less requent or an
unplanned interruption.
In addition, the duration o the interruption is
usually relatively short or planned interruptions. For
mains replacement, the restoration o the supply is
coordinated around the customer’s availability on
the day they are impacted by the work, with the
mains replacement teams liaising with the aected
customers.
We ully recognise the eect which interrupting a
customer’s supply has on them and work hard to
minimise the duration o the supply interruption.
This is refected in our customer service action
plan. We record and monitor our perormance in
relation to the overall length o the duration and the
time taken to restore supplies ater gas has been
made available to the ECV.
Year 2005/06 2006/07 2007/08 2008/09 2009/10 2010/11
Number o planned interruptions 33,559 46,081 66,881 61,916 49,937 56,688
Duration o planned interruptions (mins) 14.1m 23.9m 37.5m 31.8m 27.9m 30.4m
Number o unplanned interruptions 6417 20,223 13,453 9,890 9,530 15,841
Duration o unplanned interruptions (mins) 11.8m 31.5m 8.9m 10.5m 13.6m 15.7m
Figure 6.16: Current interruptions perormance data

7/22/2019 Ngn Business Plan
http://slidepdf.com/reader/full/ngn-business-plan 99/224
9999
Target performance
Stakeholders have told us they want to see a
reduction in the number and duration o supply
interruptions. Unortunately however, we can only
commit to the ollowing.
• Planned – maintain current perormance as we
need to continue our programme to replace iron
mains over the period.
• Unplanned – maintain perormance based on
the historic average number and duration o
interruptions because the majority are caused
by third parties which we cannot infuence
signicantly.
Figure 6.17: Target perormance interruptions data
Period GDPCR1 RIIO-GD1
Year 11/12 12/13 13/14 14/15 15/16 16/17 17/18 18/19 19/20 20/21
Number o planned interruptions 52,619 52,619 52,619 52,619 52,619 52,619 52,619 52,619 52,619 52,619
Duration o planned interruptions
(mins)28.7m 28.7m 28.7m 28.7m 28.7m 28.7m 28.7m 28.7m 28.7m 28.7m
Number o unplanned interruptions 13,287 13,287 13,287 13,287 13,287 13,287 13,287 13,287 13,287 13,287
Duration o unplanned interruptions(mins)
11.5m 11.5m 11.5m 11.5m 11.5m 11.5m 11.5m 11.5m 11.5m 11.5m

7/22/2019 Ngn Business Plan
http://slidepdf.com/reader/full/ngn-business-plan 100/224
100
Secondary deliverable
i Asset health and risk matrices
As outlined in Section 4 asset health indices are
a key component o our TNM approach.
Asset health indices and risk matrices provide a
ramework or collating inormation on the conditiono network assets. This demonstrates a measure
o the consequence o ailure o assets typically
measured in terms o system, saety and the
environmental implications. By combining asset
health and criticality we have developed a risk
matrix that in uture, with urther development, can
be used to inorm asset investment decisions and
be used as a basis or trade-os between dierent
asset categories. These indices will act as output
measures and orm a major part o our assetmanagement strategy over the next decade.
NGN has completed a base set o asset health
indices or each category o asset present on the
NGN network. In order to populate these initial
indices, data has been collected and reviewed
or each asset health category. This has then
been coupled with expert opinion and industry
standards to develop the core data. Documented
assumptions have been made to determine with/
without investment options, taking into account
both risk and condition based replacement as well
as capacity driven upgrades.
This exercise has included an assessment o asset
health and risk or:
• the current reporting year, 31 March 2011;
• the last year o GDPCR1, 31 March 2013;
• with investment 31 March 2017;
• with investment 31 March 2021;• without investment 31 March 2017; and
• without investment 31 March 2021.
The detailed asset health indices showing current
and target perormance are set out in Appendix A11.
6.3.2 Network capacity
Primary output
i Achievement of the 1:20 planningstandard
NGN is required to meet peak customer demand
on a 1:20 winter day. This requires our network to have sucient capacity to ensure that
customers’ demand or gas is not interrupted
during those periods o highest demand. We
have consistently met peak demand on our
system since taking ownership o the network in
2005.
Even in the winter o 2010/11, with the most
severe challenges due to bad weather and high
demand, we were able to satisy our customers’
requirements or gas.
Estimates o peak customer demand in the 1:20
weather conditions have been alling since 2005
as the impact o high energy prices, the economic
downturn and increased levels o energy eciency
have reduced our customers’ requirements. We
are orecasting urther reductions in the levels o
demand on a 1:20 winter day during RIIO-GD1
as a combination o continued high uel prices, a
sluggish recovery rom the economic downturnand urther energy eciency initiatives reduce
customers’ requirements or gas on the coldest
days o the year.
The RIIO-GD1 investment programme has ully
considered the overarching responsibility to meet
the 1:20 requirement. We have not identied any
requirement or general system reinorcement to
continue to meet this obligation. However, capacity
constraints can develop across the network, even
in the scenario o alling demand, as localised
demand patterns change and require investment
decisions to be made on how best to address
these constraints.

7/22/2019 Ngn Business Plan
http://slidepdf.com/reader/full/ngn-business-plan 101/224

7/22/2019 Ngn Business Plan
http://slidepdf.com/reader/full/ngn-business-plan 102/224
102
iv NTS offtake and pressure reductioninstallations (PRI) utilisation
NGN must meet the 1:20 day supply obligation.
NTS otakes enable gas to be taken rom
the National Grid system into NGN’s high
pressure pipeline network. PRIs enable onward
transportation in the network and ultimately tocustomers. To meet the supply obligation, our
otakes and PRIs need to be technically compliant
and capable o meeting the required throughput
volumes over time. I they cannot, we invest in
upgrade or replacement work.
Historic performance
There are currently 167 PRIs and 23 otakes within
NGN’s network. The diagrams below show the
utilisation o these assets at the start and nish o GDPCR1 period.
Throughout GDPCR1, our ocus or otake and
PRI investment has been to make critical assets
compliant in terms o integrity and capacity within
our overall nancial and manpower constraints.
The 13 sites which carry over into RIIO-GD1represent work in progress. An annual appraisal
o all PRIs and otake capacities ensures that the
current work in progress list is updated and any
changing supply/demand impacts are built into
the dynamic upgrading programme. In this way
investment is targeted to the sites when and where
it is most needed and the 1 in 20 supply obligations
are met.
Figure 6.20: Sites operating at each capacity utilisation level as at
1/4/2008
Figure 6.21: Sites operating at each capacity utilisation level as at
1/4/2013

7/22/2019 Ngn Business Plan
http://slidepdf.com/reader/full/ngn-business-plan 103/224

7/22/2019 Ngn Business Plan
http://slidepdf.com/reader/full/ngn-business-plan 104/224
104
6.3.3 Network reliability
Primary output
The primary output associated with network
reliability is maintaining levels o operational
perormance across the network. This will be
measured by our secondary deliverables.
Secondary deliverables
i Number and value of offtake metererrors
NGN is responsible or measuring and reporting
meter accuracy or the delivery o gas rom
the National Grid transmission system into our
network. There is a process in place, through the
Joint Oce o Gas Transporters, which requires
the identication and reporting o potential metererrors as part o a measurement error notication
process.
Historic performance
There are a range o actors which have resulted
in, or have the potential to generate, a meter error.
Error aults can indicate non-compliance with
industry standards. NGN had 11 meter errors
between 2006 and 2010, ve o which occurred in
2009/10. All our meter errors are classed as low
signicance which is the least severe o the three
classication categories.
• Low signicance - less than 30 GWh hours.
• Medium signicance - between 30 and 50 GWh
hours.
• Signicant over 50 GWh hours.
Details o the type o error are shown in gure 6.26.
The nancial impact on NGN o these errors has
been low because they all into the low signicance
category. However, we are aware that the impact
o the otake meter errors can be very signicant
or gas shippers. There have been instances inother GDNs o signicant category incidents.
Our stakeholder eedback indicated very strong
preerences rom gas shippers to improve the
accuracy o otake meters and avoid where
possible any errors.
Otake meter error type, number and scale 2005/06 2006/07 2007/08 2008/09 2009/10
Total number o otake errors N/A 2 1 3 5
Total scale o otake errors (GWh) N/A 8.60 1.78 2.67 14.82
Estimated commodity charge impact on
NGN in year N/A £2.0k £0.4k £0.6k £3.4k
Network throughput (GWh) N/A 40,536 39,304 37,768 37,980
Total as % o throughput N/A 0.02% 0.005% 0.007% 0.04%
Figure 6.26: Current number and value o otake meter errors
Target performance
Our target is to have no errors above the
classication o low signicance with an overall
estimated commodity charge relating to errors o
less than o £10k per year until 2021.
This target perormance will be achieved by
continuing with the ollowing.
• Investment to modiy, update or replace assets
using new technology to improve levels o
reliability (e.g. ultrasonic meters).
• Investment in duplication o metering systems.
• Continue to improve and amend policies and
procedures to ensure NGN remains at the
oreront o industry standards.
• Continue training o sta – prompt action by
system control sta can mitigate the impact o a
meter error.
Expenditure orecasts or a programme to upgrade
otake meters are included within this plan. This
investment is primarily driven by outputs rom
asset health indices because otake meters willbe upgraded according to criticality, reliability and
condition, as inormed by the asset health work.

7/22/2019 Ngn Business Plan
http://slidepdf.com/reader/full/ngn-business-plan 105/224
105
ii Number and duration of Pressure SystemSafety Regulations (PSSR) faults
Addressing PSSR aults allows us to limit
the deterioration o network assets. Faults
are reported by reliability categories, with A1
(imminent danger) being most serious, ollowed
by A2 (signicant ault).
Historic performance
The table below shows our perormance against
these measures since 2005.
PSSR aults 2005/06 2006/07 2007/08 2008/09 2009/10
A1 aults 0 0 0 0 0
A2 aults 120 96 115 97 113
Closed out to timescale set by competent
person100% 100% 100% 100% 100%
Number o AGIs and PRS sites 212 212 212 213 214
Fault measure (PSSR) 0.57 0.45 0.54 0.46 0.53
Figure 6.27: Current number and duration o PSSR aults
Figure 6.28: Target perormance number and duration o PSSR aults
Period GDPCR1 RIIO-GD1
Year 11/12 12/13 13/14 14/15 15/16 16/17 17/18 18/19 19/20 20/21
Fault measure (PSSR) 0.52 0.52 0.51 0.51 0.50 0.50 0.49 0.49 0.48 0.47
Target performance
A target o reducing the number o aults by the
end o RIIO-GD1 to match levels experienced in
2009 has been set and is detailed below.
iii Number and duration of telemeteredfaults
By ocusing on reducing telemetered aults
we can ensure a greater certainty o network
perormance and a greater ability or our
operations sta to correct aults as quickly as
possible. Telemetered aults are raised through
the alarm mechanism in NGN’s control centre
and have a set o required (priority) responses;
those which are ‘now’ require an onsite response
within two hours.
Historic performance
The table below shows our perormance against
these measures since 2005.
Figure 6.29: Number and duration o telemetered aults
Telemetered aults 2005 2006 2007 2008 2009 2010
A – Number o ‘now’ aults N/A N/A N/A 401 550 737
B – Total hour to resolve N/A N/A N/A 39,326 41,220 50,934
C – Number o telemetered sites N/A N/A N/A 269 269 269
Ogem measure (telemetered) = A*B/C N/A N/A N/A 58,624 84,279 139,548
Average hours to resolve N/A N/A N/A 98.1 74.9 69.1

7/22/2019 Ngn Business Plan
http://slidepdf.com/reader/full/ngn-business-plan 106/224
106
Figure 6.32: Target RIIO-GD1 perormance o PSSR inspections detecting a ault
Period GDPCR1 RIIO-GD1
Year 11/12 12/13 13/14 14/15 15/16 16/17 17/18 18/19 19/20 20/21
% PSSR inspections
identiying a ault
6% 6% 6%
Target performance
For the additional voluntary measure, we are
committing to keeping the percentage o PSSR
aults identied through inspection to below 6%.
This result o the investment programme set out
within this plan, and the orecast improvement in
asset health, is the key driver o the perormance
over the period.
Figure 6.30: Target perormance number and duration o telemetered aults
Period GDPCR1 RIIO-GD1
Year 11/12 12/13 13/14 14/15 15/16 16/17 17/18 18/19 19/20 20/21
Number o telemetered ‘now’ aults 750 750 700 650 600 550 500 450 425 400
Total hours to resolve 60,750 60,750 56,700 52,650 48,600 44,550 40,500 36,450 34,425 32,400
Average hours to resolve 81 81 81 81 81 81 81 81 81 81
Ogem measure (telemetered) 168,768 169,377 147,546 127,221 108,401 91,087 75,279 60,976 54,389 48,178
Target performance
Our orecast perormance is set out below. We are
planning to reduce the number o aults.
This ‘now’ aults target will be achieved by investing
in improved alarm management systems and
improving the health o the underlying assets. Other
aults will be reduced through a range o other
initiatives identied within this plan. The average
time to resolve aults remains constant over the
period. As ault numbers decrease, their nature
and the action required to resolve them could
vary. To orecast a change is not possible due to
the number o variables, so a constant average isproposed during RIIO-GD1.
Figure 6.31: Current perormance o PSSR inspections detecting a ault
iv Percentage of PSSR inspections
detecting a fault
NGN is proposing an additional voluntary
measure or PSSR aults which allows us to
measure the percentage o PSSR inspectionsthat result in an A1 or A2 ault. We eel this
accounts or the variance in the number o
inspections and will give an accurate indication o
the perormance o the asset.
Historic performance
The table below shows our perormance againstthis measure since 2005.
Year 2005 2006 2007 2008 2009 2010
Number o PSSR inspections N/A 1,707 1,725 1,821 1,853 1,909
% Inspections giving a ault N/A 7.03% 5.57% 6.32% 5.23% 5.92%

7/22/2019 Ngn Business Plan
http://slidepdf.com/reader/full/ngn-business-plan 107/224

7/22/2019 Ngn Business Plan
http://slidepdf.com/reader/full/ngn-business-plan 108/224
108
Figure 6.36: Target perormance customer survey scores
Target performance
Overall, the target perormance or customer
satisaction surveys refects our strategy to improve
perormance across the network on an annual
basis, incrementally and sustainably. To achieve
this, we are reocusing the delivery o the customer
service unction – placing it right at the centre
o the organisation and delivered directly by the
Customer Operations team. This is the most visible
part o our business dealing with emergency,
repair, maintenance activities and connections to
our network. This unction is responsible or the
customer interace and management, ensuring that
the customer is at the heart o everything we do.
Perormance is tracked and reported on a weekly
basis to ensure appropriate managerial input and
engagement across the network.
Additionally, the network’s customer service action
plan includes a wide-ranging customer training
programme or all operational sta. Training is
carried out annually. The ocus o the training will
evolve as we analyse the trends o our stakeholders
eedback.
6.4.1 Customer satisfaction
Customer satisaction is measured by the
results o three surveys carried out covering
customer experience with our emergency service,
replacement activities and connections service.
The output ramework or customer service covers
three areas: customer satisaction as measured by
the surveys; complaint handling; and stakeholder
engagement. We have supplemented this with
an additional measure, which is the number o
complaints we receive.
Standards o customer service across the gas
distribution networks are consistently high with
customers rating perormance across the three
categories at an average o 7.7 out o 10. The
average ‘spread’ between the highest and lowestscoring GDNs is typically less than one point.
Since 2008/09 (when scoring was introduced on a
consistent 1 - 10 basis) we have achieved scores
at or above the industry average in repair and
replacement. Our perormance in connections has
improved signicantly to achieve above average
perormance in 2010/11.
Historic performance
We remain committed to consistently achieving
a top two level o perormance in the customer
surveys within the current GDPCR1 period and
across the RIIO-GD1 period to 2021, in line with our
corporate strategy.
Figure 6.35: Customer survey scores
Ogem quarterly service score 2008/09 2009/10 2010/11
Replacement 7.35 7.70 7.96
Repair 8.25 8.20 8.10
Connections 6.62 7.35 7.77
Period GDPCR1 RIIO-GD1
Year 11/12 12/13 13/14 14/15 15/16 16/17 17/18 18/19 19/20 20/21
Ogem quarterly service score
Planned interruptions customer
satisaction score (replacement)8.02 8.04 8.10 8.20 8.30 8.40 8.45 8.50 8.55 8.60
Unplanned interruptions customer
satisaction score (repair)7.82 8.50 8.55 8.57 8.59 8.61 8.63 8.65 8.67 8.69
Connections customer satisaction
score7.51 7.63 7.65 7.85 8.05 8.25 8.35 8.45 8.55 8.65

7/22/2019 Ngn Business Plan
http://slidepdf.com/reader/full/ngn-business-plan 109/224
109
6.4.2 Complaints handling
The current target or resolution o a complaint
is 10 days when a site visit is not required and
20 days when a site visit is needed. Should the
customer be unsatised by the response there is
an escalation procedure, rst to a NGN customer
service manager or director and then on to theEnergy Ombudsman where objections are either
rejected or upheld.
i Complaints received
We believe reducing the number o complaints is
a benecial ocus as it will enable us to respond
to complaints in less time on average. It is also
a measure o the quality o our operational (ront
line) delivery and customer service.
Historic performance
We have reduced the number o complaints
received by the business by more than 70%
since 2007.
This has been a key ocus or the business and
we believe that managing the total number o
complaints is a key measure o evaluating customer
satisaction and driving improvements in customer
service in the uture.
Figure 6.37: Current complaints received
Year 2007/08 2008/09 2009/10 2010/11
Total number o complaints 2,591 1,371 825 776
Figure 6.38: Target perormance complaints received
Period GDPCR1 RIIO-GD1
Year 11/12 12/13 13/14 14/15 15/16 16/17 17/18 18/19 19/20 20/21
Total number o complaints 730 657 591 532 492 455 421 400 380 361
Target performance
The main initiative to continue reducing the number
o complaints is the customer ocus training
programme. This will have an impact across NGN
as it provides a ocus on customer service or all
our employees, including senior management,
operations sta and including our contract
partners.
We are targeting reducing the number o
complaints received over the whole period by a
urther 50%.

7/22/2019 Ngn Business Plan
http://slidepdf.com/reader/full/ngn-business-plan 110/224
110110
ii Percentage of complaints unresolvedafter one and thirty one working days(D+1 and D+31)
We view the time it takes to resolve complaints
as a key measure o the quality o our customer
service. We aim to reduce the number o
complaints received annually and to improve theresolution time o those received.
NGN has previously worked to a target o 10 and
20 days or complaint handling so we do not have
historic data or this measure.
Target performance
Target perormance or the new D+1 and D+31
measures are set out below. NGN will have a target
o 20% o complaints resolved within the rst day
and having 99% o all complaints resolved within
31 days. The orecast requires signicant annual
improvement in the time taken to resolve customer
complaints. It is anticipated that as current areas o
ocus or service level improvement are managed,
the improvements will become business as usual. This will allow a continuous cycle where the
ocus will shit rom area to area pushing overall
perormance on to new and higher levels year on
year, incrementally and sustainably.
The initiatives in place, primarily the customer
training programme, will improve our scores in the
Ogem customer satisaction surveys and also
improve NGN’s complaints handling perormance.
Figure 6.39: Target perormance percentage o complaints unresolved ater D+1 and D+31
Period GDPCR1 RIIO-GD1
Year 11/12 12/13 13/14 14/15 15/16 16/17 17/18 18/19 19/20 20/21
Percentage o complaints
unresolved at D+1 (%)80% 80%
Percentage o complaints
unresolved at D+31 (%)1% 1% 1%
80%
iii Percentage of repeat complaintsWe want to have condence that our improvement
initiatives are limiting the causes o complaints
to prevent reoccurrence and to demonstrate
that we are listening to and acting upon what
our customers tell us. The percentage o repeat
complaints is a suitable measure or this and we
can track i the complaint is a repeat by using
customer addresses and postcodes. Minimising
repeat complaints is also a way o reducing overall
customer complaints and generally improving ourcustomer service.
Target performance
We will keep the number o repeat complaints
below 5% and reduce this to 2% in RIIO-GD1. NGN
can track complaints by type (category) and so,
whilst some repeat complaints will occur, we aim to
ensure they are not or the same type o incident or
service ailure.
Figure 6.40: Target perormance o repeat complaints
Period GDPCR1 RIIO-GD1
Year 11/12 12/13 13/14 14/15 15/16 16/17 17/18 18/19 19/20 20/21
Number o complaints received 730 657 591 532 492 455 421 400 380 361
Percentage o repeat complaints (%) 5% 5% 5% 5% 4% 4% 4% 3% 3% 2%
Total number o repeat complaints 37 33 30 27 20 18 17 12 11 7

7/22/2019 Ngn Business Plan
http://slidepdf.com/reader/full/ngn-business-plan 111/224

7/22/2019 Ngn Business Plan
http://slidepdf.com/reader/full/ngn-business-plan 112/224
112
6.5 Environment
Environmental outputs are made up o the ollowing primary measures and secondary deliverables.
Figure 6.42: Environment outputs
6.5 EnvironmentReducing the environment impacts o gas distribution
6.5.1
Broad environmental objective
6.5.2
Shrinkage & leakage
6.5.3
Other emissions & natural
resource use
6.5.4
Business Carbon Footprint
(BCF) excluding shrinkage
i Total capacity o bio-methane
connectedPrimary output measure
i Statutory and low risk Land
Remediationi Reporting against a common
Carbon Reduction Commitment
(CRC) ramework with other
GDNs
ii Total number o bio-methane
enquiries/applications in
progress
i Reductions in shrinkage and
leakageii Volume o Aggregate extraction
iii Volume o spoil to landll
Figure 6.43: NGN environment improvements summary
Environment improvement summary
I m p r o v e
•Totalcapacityofbio-methane
connected
•Totalnumberofbio-methane enquiries/applications in progress
•VolumeofgasemittedfromNGN’s
network
•BusinessCarbonFootprint(BCF)
M a i n t a i n •Statutoryandlowriskland
remediation
•Volumeofaggregateextraction
•Volumeofspoiltolandll
R e
d u c e
Reduce Maintain Improve
Stakeholder requirements/expectations
N G N o u t p u t c o m m i t m e n t s – R I I O - G D 1
The ollowing table summarises what NGN will do in RIIO-GD1 against each o the output measures or
environmental perormance, measured against stakeholder expectations.

7/22/2019 Ngn Business Plan
http://slidepdf.com/reader/full/ngn-business-plan 113/224
113
6.5.1 Broad environmental objective
The Government’s commitment to a long-term
ramework or the reduction o greenhouse gas
emissions introduces signicant challenges or the
wider economy and energy industries, in particular
in developing and implementing the policies,
technologies, systems and workorce required toachieve the proposed targets by 2050.
NGN believe that the most viable scenario or the
transition is one in which gas continues to play a
signicant role in the energy mix. However, this
scenario still requires a step change in the role
o the gas distribution networks and in particular
involves the development and connection o a
signicant scale o bio-methane sources into
the gas distribution system. It is clear that we
and the other GDNs have a signicant role to
play in enabling the ecient development o this
technology.
i Total capacity of connected bio-methane
The proposal to require GDNs to report and
publish the total capacity o bio-methane
connected to each network is a very welcome
addition to the outputs ramework. It provides a
quantitative ocus whether we are doing enough
to support the connection o bio-methane.
We will measure the total capacity we are
connecting to the distribution network in standard
cubic metres per hour (scm/h). NGN has not yet
connected a bio-methane source o gas to the
distribution grid but we do have one scheme,
o 350 scm/h capacity, progressing towards
completion and potential connection in 2012.
NGN has been working with prospective bio-
methane producers since 2009 to better
understand the role we have to play with respect to
bio-methane and the work required to address any
prospective barriers to entry that exist. Some o the
current barriers include the ollowing.
• Access to accurate and timely inormation onnetwork entry locations.
• Detailed inormation on network capacity and
availability.
• Gas quality and saety management
requirements and inormation.
• High network entry costs associated with the
limited availability o alternative gas quality
monitoring equipment.
• Availability o low cost solutions to address entry
capacity constraints at specic network entry
points.
We have identied initiatives to address these,
some o which we have started to implement, as
described below.
Target performance
The connection o the 350 scm/h acility is shownin 2011/12. NGN has currently received enquiries
or applications or bio-methane injection o 9,500
scm/h. Our expectation is that we will connect, on
average, 1 in 5 enquiries or applications per year
during RIIO-GD1.
Figure 6.44: Target perormance or capacity o bio-methane connections
Period GDPCR1 RIIO-GD1
Year 11/12 12/13 13/14 14/15 15/16 16/17 17/18 18/19 19/20 20/21
Total capacity o schemes
connected (scm/h)350 250 250 250 250 250 250 250 250 250

7/22/2019 Ngn Business Plan
http://slidepdf.com/reader/full/ngn-business-plan 114/224
114
The likely level o connection will be dependent
upon a range o actors outside our control, in
particular the Renewable Heat Incentive (RHI),
published in March 2011. The detail o this incentive
package is currently being reviewed by producers
but we expect it will act as a signicant driver or
the development o projects.We have identied suitable initiatives which begin
to address the low volume o bio-methane being
connected to the GDN, and which will support
our role as an enabler to the development o this
technology within the wider energy market. These
include the ollowing.
• Aprocedurethatgovernstheprocessofdealing
with enquiries and applications or bio-methane
connections.
• Inormation published on our website giving
general inormation, contact details and services
we oer to assist prospective bio-methane
connections. We provide location and capacity
inormation to bio-methane producers.
• Develop inormation relating to gas quality
monitoring requirements and likely costs o
connection.
• A scheme expected to go live in 2012 that willcreate a test bed acility on a live bio-methane
plant. This will be used to identiy and approve
alternative gas quality monitoring equipment
aimed at bringing down the cost o connection.
• A scheme examining an innovative use o
compression within the network to address
capacity constraints or bio-methane plant
connecting at network locations with low fow
conditions across the year.
We will look to bring orward schemes and
initiatives aimed at addressing the issues and
constraints currently experienced in this area. This
will continue to be an important element o our
innovation strategy throughout RIIO-GD1.
ii Total number of bio-methane enquiries/applications in progress
Historic performance
The total capacity o bio-methane enquiries and
applications (but not yet connected) provides
additional data on whether we are meeting
the levels o bio-methane network connection
needed to meet the environmental targets. It also
incentivises GDNs and relevant policymakers to
address any issues that are seen to be constraining
development in this area.
Target Performance
A orecast or the bio-methane enquiries and
applications received (scm/h) is based on the
capacity o enquiries we have received in recentyears. This averages approximately 2,500 scm/h,
per year.
This target could increase as the Government’s
new Renewable Heat Incentive becomes better
understood and the work that GDNs are doing to
address the issues described above.
Figure 6.45: Total number o bio-methane enquiries/applications in
progress
Capacity (scm/h) Comment
Total capacity o bio-
methane enquiries andapplications received (but
not yet connected)
9,500 scm/h
Made up o 22
separate schemes(Average -300
scm/h)

7/22/2019 Ngn Business Plan
http://slidepdf.com/reader/full/ngn-business-plan 115/224

7/22/2019 Ngn Business Plan
http://slidepdf.com/reader/full/ngn-business-plan 116/224

7/22/2019 Ngn Business Plan
http://slidepdf.com/reader/full/ngn-business-plan 117/224

7/22/2019 Ngn Business Plan
http://slidepdf.com/reader/full/ngn-business-plan 118/224
118
iii Volume of spoil to landll
A separate part o our compliance with ISO
14001 is to minimise the amount o excavated
spoil that is disposed to landll. This can be
aected by the proximity o suitable recycling
acilities to the location o works, primarily
replacement and repair jobs.
Historic performance
The table below shows our perormance against
these measures since 2007/08.
We have reduced the total volume o excavated
spoil over the last our years, despite a variable
replacement and repair workload. Whilst ISO
14001 has driven us to continually improve and has
resulted in robust reporting, it has not enabled us
to reduce our environmental impact through the
disposal o reduced amounts o spoil to landll.
Figure 6.50: Current spoil to landll perormance
Year 2007/08 2008/09 2009/10 2010/11
Excavated spoil recycled (tonnes) 179,056 170,364 150,987 142,188
Excavated spoil to landll (tonnes) 4,999 9,698 12,872 13,997
Excavated spoil exempt (tonnes) 1,339 1,065 1,305 1,770
Total excavated spoil (tonnes) 185,394 181,127 165,164 157,955
Target performance
The orecast perormance is based on a marginalimprovement rom 2010/11 levels and a steady
state uture perormance. By their nature, the
location o repair and replacement work is beyond
the direct control o NGN. For this reason, and the
issue o proximity o recycling plants in relation to
these work activities, this orecasting approach has
been adopted.
Figure 6.51: Target perormance or spoil to landll
Period GDPCR1 RIIO-GD1
Year 11/12 12/13 13/14 14/15 15/16 16/17 17/18 18/19 19/20 20/21
Excavated spoil recycled (tonnes) 143,000 143,000 143,000 143,000 143,000 143,000 143,000 143,000 143,000 143,000
Excavated spoil to landll (tonnes) 13,000 13,000 13,000 13,000 13,000 13,000 13,000 13,000 13,000 13,000
Excavated spoil exempt (tonnes) 1,770 1,770 1,770 1,770 1,770 1,770 1,770 1,770 1,770 1,770
Total excavated spoil (tonnes) 157,770 157,770 157,770 157,770 157,770 157,770 157,770 157,770 157,770 157,770

7/22/2019 Ngn Business Plan
http://slidepdf.com/reader/full/ngn-business-plan 119/224
119
6.5.4 Business Carbon Footprint
(BCF) excluding shrinkage
i Carbon reduction commitment
Saeguarding the environment is a legal
requirement as well as having a signicant
bearing on our reputation as a responsiblecompany. We believe that it is our responsibility
to conduct our operations in ways which
have the minimum adverse impact on the
environment.
NGN is committed to the protection and
enhancement o the environment, always seeking
new ways to minimise the environmental impacts
o our past, present and uture activities. In order
to demonstrate this, we will report annually on
our CO2 equivalent emissions, using a standard
ramework or reporting BCF.
Historic performance
We actively record and monitor our BCF (excluding
shrinkage volumes) which includes scope one, two
and three as per the World Resources Institute’s
protocol guidelines and invest to reduce our
non-leakage carbon emissions. This equates to
approximately 11,330 tCO2e in 2010/11.
We are committed to reducing the impact we have
on the environment. We are examining a wide
range o initiatives aimed at delivering a low carbon
roadmap or the next 10 years and also reducing
the non-shrinkage BCF in RIIO-GD1.
Target performance
NGN is targeting a reduction o 5% in total BCF in
RIIO-GD1.
Many o the initiatives we have identied or
consideration are not yet developed to a stage
where the business case has been proven and so
they cannot be implemented prior to RIIO-GD1. Additionally we will be looking to urther research
and develop innovative approaches to
delivering some o these projects with the aid o the
innovation unding initiatives created by the RIIO
ramework.
NGN’s targeted reductions in non-shrinkage BCF
over the period are set out below.
Figure 6.52: Carbon perormance or NGN leakage and non leakageBCF 2010/11
Figure 6.53: NGN non-shrinkage BCF
Period GDPCR1 RIIO-GD1
Year 11/12 12/13 13/14 14/15 15/16 16/17 17/18 18/19 19/20 20/21
NGN non-shrinkage BCF (scope 1,
2 and 3) – tCO2e11,273 11,217 11,161 11,105 11,050 10,994 10,939 10,885 10,830 10,776

7/22/2019 Ngn Business Plan
http://slidepdf.com/reader/full/ngn-business-plan 120/224
120
Figure 6.54: Social objectives outputs
6.6 Social obligationsExtending the gas network to communities who are uel poor where it is ecient to do so
(and where it is not, working with other parts o the energy industry to meet the needs to the uel poor),
and introducing measures to address incidents o carbon monoxide (CO) poisoning.
6.6.1
Fuel poor network extension
6.6.2
Carbon monoxide
i Increasing the number o uel poor customers with access to gas
i Improving public saety and awareness regarding CO
ii Atmospheric testing or CO
Figure 6.55: Social obligations improvements summary
Social obligations improvement summary
I m p r o v e
•Increasingthenumberoffuelpoor
customers with access to gas
•Improvingpublicsafetyand
awareness regarding CO
•TestingforpresenceofCOin
properties
M a i n t a i n
R e d u c e
Reduce Maintain Improve
Stakeholder requirements/expectations
N G N o u t p u t c o m m i t m e n t s – R I I O - G D 1
6.6 Social obligationsOur outputs in this area are made up o the ollowing primary measures and secondary deliverables.
The ollowing table summarises what NGN will do in RIIO-GD1 against each o the output measures or
social obligations, measured against stakeholder expectations.

7/22/2019 Ngn Business Plan
http://slidepdf.com/reader/full/ngn-business-plan 121/224
7/22/2019 Ngn Business Plan
http://slidepdf.com/reader/full/ngn-business-plan 122/224

7/22/2019 Ngn Business Plan
http://slidepdf.com/reader/full/ngn-business-plan 123/224

7/22/2019 Ngn Business Plan
http://slidepdf.com/reader/full/ngn-business-plan 124/224

7/22/2019 Ngn Business Plan
http://slidepdf.com/reader/full/ngn-business-plan 125/224
125
6.7.1 Exit connectionsi Guaranteed Standards of Service (GSOS)
A range o seven service standards are in place
or all stages o the exit connections process.
Historic performance
Perormance since 2008 has been good, with
customers receiving consistently high standards o
Figure 6.59: Current Standards o Service (GSOS) or connections
Year 2008/09 2009/10 2010/11
Issue standard connection quotation within 6 working days 99.4% 99.7% 99.6%
Issue non-standard connection quotation or connection below
275 kWh within 11 working days99.0% 98.9% 99.6%
Issue non-standard connection quotation or connection above
275 kWh within 11 working days99.0% 99.2% 99.7%
Respond to land enquiry within 5 working days 99.6% 100.0% 99.4%
Provide connection commencement and completion dates or
connections below 275 kWh within 20 working days99.7% 99.2% 99.8%
Provide connection commencement and completion dates or
connections above 275 kWh within 20 working days97.4% 100.0% 100.0%
Substantially complete connection by date agreed 98.2% 92.2% 95.2%
service and timely responses to enquiries.
We have consistently outperormed the licence
standards by a signicant margin; in some
instances 100% has been achieved, as illustrated inthe table below.

7/22/2019 Ngn Business Plan
http://slidepdf.com/reader/full/ngn-business-plan 126/224

7/22/2019 Ngn Business Plan
http://slidepdf.com/reader/full/ngn-business-plan 127/224
127
6.7.2 Entry connectioni Standards of service
The emergence o alternative sources o gas and
the potential or its connection to the network
has an important role in the energy mix o the
uture – contributing directly to the goals o energy security, sustainability and the transition
to a low carbon economy.
We recognise the role we have to play in acilitating
the development o these emerging customer
connections and the importance o working
collaboratively with these groups to connect
them to the network. We agree that minimum
perormance standards have a key role to play
in ensuring this objective is achieved and have
introduced new standards o service ollowing
discussions with potential new entry connection
customers.
• Respond to initial inormation requests within 10
working days.
• Respond to request or capacity study within 20
working days.
• Respond to request or indicative connection
and quality monitoring costs within 10 working
days.
• Issue connection quotation within 21 working
days.
At this stage, there is currently not enough
experience in this area to accurately identiy
measures and standards. However, ourperormance against these standards will be
published and reported to customers on an annual
basis. NGN will continue to work with emerging
customer groups, Ogem and the other GDNs to
identiy the relevant voluntary standards to apply on
a national basis.
Target performance
Our target perormance against the new standards
is show in the table below.
NGN has made a commitment to work with the
wider industry to agree national standards o
service or the issuing o quotations, the scheduling
o works and the completion o works. This will
be supported by a reporting ramework so that
perormance can be monitored and compared
across the industry.
Figure 6.61: Target perormance standards o service or distributed gas customers
Provision o relevant inormation on GDN entry and process Minimum target perormance
Respond to initial inormation request (location) within 10 working days 95%
Respond to request or capacity study within 20 working days 95%
Respond to request or indicative connection and quality monitoring costs within 10 working days 95%
Issue connection quotation within 21 working days 95%

7/22/2019 Ngn Business Plan
http://slidepdf.com/reader/full/ngn-business-plan 128/224

7/22/2019 Ngn Business Plan
http://slidepdf.com/reader/full/ngn-business-plan 129/224
129
7Expenditureorecasts
This sets out the key assumptions behind our forecasts and describes
the new activities that we will carry out. It explains in detail the main
components of our capital expenditure (Capex), replacement expenditure
(Repex) and operating expenditure (Opex) plans.

7/22/2019 Ngn Business Plan
http://slidepdf.com/reader/full/ngn-business-plan 130/224
130
Executive summaryNGN will spend a total o £2.4bn in RIIO-GD1,
investing £1.2bn in the network and a urther
£1.2bn in continuing to operate an ecient, sae
and reliable network. This will be underpinned by
extensive investment in new apprentices to ensure
we maintain the necessary skills in our workorce.
The overall level o total expenditure is consistent
with that allowed under GDPCR1.
Key elements o our cost base will increase at a
greater rate than RPI due to the real price eects
aecting the specialist labour and materials we use.
We are responding aggressively to these pressures
by improving productivity in real terms during each
year o this plan.
We will spend c.£100m each year on replacing
more than 580km o metallic mains and more
than 55,000 metallic services. This will signicantly
reduce the potential saety risk rom these assets
and lead to year-on-year reductions in gas
escapes and repairs which will in turn signicantly
reduce carbon emissions rom the network. Our
replacement programme will embrace the revised
HSE rules within our Total Network Management
approach and use cost benet methodology to
determine which mains are replaced.
We will spend c.£50m each year on capital
investment on the network. This will deliver
measureable and demonstrable improvements in
asset health. All our operational Capex is linked
directly to our newly developed asset health
indices. We will also invest to remove 47 low
pressure gasholders rom the network and deliver
an additional 6,500 uel poor connections.
We will spend c.£150m each year on operating thenetwork and delivering services to our customers.
An additional 257 apprentices will be recruited
to replace members o our workorce who will
retire during RIIO-GD1. Our service to customers
will improve and we will see reductions in our
operating costs as the gasholders are removed
rom the network and the benets o our targeted
replacement and capital expenditure reduce gas
escapes and leakage.

7/22/2019 Ngn Business Plan
http://slidepdf.com/reader/full/ngn-business-plan 131/224

7/22/2019 Ngn Business Plan
http://slidepdf.com/reader/full/ngn-business-plan 132/224
132
7.2 Key assumptions The expenditure orecasts within the plan
have been developed against a number o
assumptions which are set out in this section.
These assumptions impact across all categories o expenditure in RIIO-GD1.
Additionally, there are specic large work
programmes included within the plan that have an
impact across several categories o expenditure.
Our orecasts also refect the regional actors that
impact NGN and are set out in Section 3 and
Appendix A18.
The detail o the core assumptions and
programmes are set out below to provide the
necessary background to the detailed orecasts in
the remainder o this section.
7.2.1 Real Price Effects (RPE)
The basket o goods and services which we
procure in our normal activities are signicantly
dierent rom those that make up the general
measure o prices in the economy – the Retail
Prices Index (RPI). These include higher
proportions o specialist labour and materials.
This results in certain elements o NGN’s cost base
increasing at rates that are signicantly higher than
that implied by the RPI over the same period.
These dierences have been recognised in
previous regulatory settlements. However, the
rate at which these prices dier rom the RPI are
aected by a range o actors including prevailing
economic conditions and levels o market activity.
NGN, working with our independent consultantEC Harris, has carried out a detailed assessment
o real price eects or RIIO-GD1. The
analysis has been prepared in line with Ogem
recommendations relating to methodology and
data sources.
Our assessment o both labour and materials RPE
are based on time series spanning rom the mid-
1970s to 2008 – covering three ull business cycles.
The analysis considered RPE or direct labour,
contract labour and materials across the three
broad categories o expenditure.
• Directlabour - The assessment analysed
real average earnings data over the period
1976-2008, taking in three economic cycles.
The compound annual average or the whole
economy o this period is 1.64% (real).
• Contractlabour - Market evidence and NGN’s
experience shows that contractors in gas
distribution, who are generally more specialised,
highly mobile, are subject to higher marketdemand and can more easily achieve their higher
wages.
• Materials- The analysis examined the price
index or the whole data series, 1976-2008, to
calculate the compound annual real average
price increases or both PE pipe and steel.
The overall outcome o this analysis is shown
in the table below and is incorporated into our
expenditure orecasts rom 2013/14. The impact o the current economic recession is refected in zero
RPE assumed or the period 2011 to 2013.
Further details o the analysis and evidence
supporting this outcome can be ound in
Appendix A6.
Figure 7.1: Real price eects
Annual % impact
above RPIOpex Capex Repex
Direct labour 1.5% 1.5% 1.5%
Contract labour
(construction)2.0% 2.0% 2.0%
Materials 0.4% 0.3% 0.3%

7/22/2019 Ngn Business Plan
http://slidepdf.com/reader/full/ngn-business-plan 133/224

7/22/2019 Ngn Business Plan
http://slidepdf.com/reader/full/ngn-business-plan 134/224

7/22/2019 Ngn Business Plan
http://slidepdf.com/reader/full/ngn-business-plan 135/224
135
7.2.4 Gasholder decommissioningprogramme
NGN currently has 47 low pressure gasholders
at 35 sites on the network. All are extremely old,
some were originally constructed more than 100
years ago. These holders are no longer required
to operate the network under current present dayoperating parameters. The associated maintenance
and repair costs have been steadily increasing over
the years and the condition o some holders is likely
to require signicant repairs in RII0-GD1. Many o
these holders are located in urban areas and as
such they pose a potentially increasing saety risk
which NGN will have to manage.
Based on their condition, saety, environmental
risk, network criticality and other criteria, we have
assessed all the gasholders as high risk (RI1)
in our asset health assessment. In addition to
enduring Opex savings, removal o the gasholders
will deliver associated gas leakage reductions,
improved saety and reduced environmental risks,
and improvement to security o supply. Using
cost benet analysis we determined that there is a
signicant overall benet to customers in removing
all the holders rom the network as set out below.
The programme o works to remove the gasholders
and the associated works to acilitate this will take
place throughout RIIO-GD1.
The costs within our business plan or the
decommissioning do not include ull land
remediation o the operating site as our stakeholder
research indicated that customers do not consider
this to be value or money. Further details, and the
underlying evidence to support the programme,
can be ound in Appendix A11.
Figure 7.2: Summary o cost benet analysis o the gasholder
demolition programme
Summary o cost benet analysis o gasholder demolition
programme (£m 2009/10 prices)
Costs
Holder demolition (Opex) (19.2)
Upgrade o otakes and PRIs (Capex) (14.0)
Rationalisation o mains and governors (Capex) (7.6)
Current maintenance/repairs/painting (Opex) (11.6)
Total cost (52.4)
Benets
Saved current maintenance and painting 39.5
Avoided incremental repairs without demolition 73.1
Reduced leakage 4.2
Total benet 116.8
Net benet 64.4

7/22/2019 Ngn Business Plan
http://slidepdf.com/reader/full/ngn-business-plan 136/224
136
7.2.5 TMA costs
RIIO-GD1 will impose additional constraints on our
business and operations with the introduction by
local authorities (LAs) o the TMA permit schemes.
In addition, we expect LAs to implement other
sanctions available to them under the New Roads
and Streetworks Act (NRSWA) notably lane rentalschemes. Clearly such schemes will impose costs
and restrictions on our operations, primarily mains
replacement, repairs and emergency response
activities. There will also be an impact on NGN’s
connections and mains reinorcement works.
We recognise that despite these constraints,
customers require us to minimise the overall cost
impact and manage these costs as eciently as
possible. We can draw on our achievements in
GDPCR1, successully reducing costs associated
with existing schemes, notably xed penalty notices
(FPNs) and overstay nes.
In addition, NGN is presently developing a strategy
and approach to mitigating other streetworks costs.
The key ocus o this is the Yorkshire Common
Permit Scheme (YCPS), which will commence with
seven LAs in 2012. NGN will be subject to TMA
permit costs with the introduction o the YCPS.
The orecast or the impact o YCPS on our costs
are set out below.
The orecast to 2020/21 is based on:
• the YCPS operating in seven LAs;
• FPNs levied by the present 11 LAs;
• current levels o overstay ne activity; and
• recruitment o an additional 4.5 FTEs to deal with
the rollout o the YCPS.
These orecasts refect our intention to mitigate
as ar as possible the impact o the YCPS on our
operations. The key aspects are detailed below.
1) NGN will ensure wherever possible that planned
works have minimal impact on permit roads (there
are just over 2,000 in the YCPS), this will include;
• utilising the fexibility o the HSE’s new three
tier ramework to re-schedule some pipes to
minimise intrusion on permit roads;
• re-despatching repair jobs to ensure permit
terms are complied with; and
• actoring TMA costs into in the cost benet
assessment undertaken under our TNM
approach.
2) All permit roads are being incorporated into
NGN’s IS system so they are available in our
planning and scheduling applications.
3) We have initiated a number o actions to ensure
that our eld operations incur the minimal level o
permit related costs:
•NGN’s direct labour workorce and contractors
are undergoing training and awareness
programmes to ensure they understand the
implications o the YCPS and how they areexpected to minimise costs;
• ensuring NGN’s key contractor partners are
suciently incentivised to reduce such costs,
and as ar as possible the contractors absorb
them in existing rates;
• proactive engagement with the relevant LAs by
our NRSWA team and operational sta in the
eld; and
• utilising existing IS applications or use in
minimising streetworks e.g. digital photography
and time stamps to demonstrate compliance
with permits.
Figure 7.3: YCPS cost orecast 2013 to 2021
£m 2009/10
prices
Forecast cost YCPS only
13/14 14/15 15/16 16/17 17/18 18/19 19/20 20/21
Opex 0.6 0.6 0.7 0.7 0.7 0.7 0.7 0.7
Repex 1.3 1.3 1.4 1.4 1.4 1.4 1.4 1.4
Capex 0.4 0.4 0.4 0.4 0.4 0.4 0.4 0.4
Total 2.3 2.3 2.5 2.5 2.5 2.5 2.5 2.5

7/22/2019 Ngn Business Plan
http://slidepdf.com/reader/full/ngn-business-plan 137/224
137
We are condent that we will be able to
demonstrate we will only incur an ecient level
o costs under the YCPS and NGN will be well
positioned to deal with other permit schemes and
lane rentals.
In summary, our business plan includes c.£2.5m
per year or the initial impact o the new YCPS TMA permit scheme only. At this stage we are not aware
o any denitive plans by other LAs so are unable
to provide reasonable estimates o additional costs
outside YCPS within our business plan.
7.2.6 Impacts of the smartmetering rollout
NGN recognises the importance o smart
metering in the UK utilities sector and it being a
powerul tool in achieving Governmental targets
on carbon reduction. We also recognise that
this is a supplier-led programme. However, thereplacement o all 22m gas meters in this country
wide programme will have a major impact on the
GDNs.
The start date or implementation has been
announced as 2014. We are working with other
GDNs and suppliers in an attempt to mitigate any
issues related to the implementation programme.
It is hoped that we will be able in some way to
coordinate the rollout phasing plans o each
supplier in a way that will minimise the impact on
the supplier, on NGN, and most importantly on
customers.
As a member o ENA, we have been involved in
the creation o a “Hierarchy o Gas” Issues. This is
a list o all the potential situations that may occur
during the installation o a smart meter, along with
the associated party responsible or the resolution
o these issues, and an estimation o the requency
rate o each issue per 1,000 smart meters installed.NGN has gone urther and has commissioned
a programme o site surveys in an attempt to
corroborate the estimated requency rates.
Using this data we have orecast the ollowing two
impacts into our business plan.
i Emergency service
The increased emergency workloads we estimate
will cost c.£3m annually. This is based on:
• an extra 9,600 one-hour response calls annually,
amounting to an additional 10% o the average
annual workload;
• an extra 24,000 two-hour response calls
annually, amounting to an additional 80% o the
average annual workload; and
• an extra 10,080 other work type calls, amounting
to over 100% o the average annual workload.

7/22/2019 Ngn Business Plan
http://slidepdf.com/reader/full/ngn-business-plan 138/224
138
These workloads assume the implementation o
smart meters is uniormly spread over 4.5 years
and that the Hierarchy o Gas Issues will be used to
mitigate and reduce the requency rate o issues by
inorming the training o smart metering installers as
the programme matures.
ii Replacement programmeMeter re-xing and meter repositioning as a result
o mains/service replacement will become more
complicated and may involve increased costs. The
programme will identiy services that will require
replacement as a result o a range o actors
including non-standard ttings, non-standard
material types and steel services. This will be an
acceleration o work that would otherwise need
to be carried out as part o the replacement
programme. In addition to this, suppliers will charge
NGN to ‘reboot’ the communications array o the
smart meter installation, ater the meter has been
disconnected and reconnected as part o a service
relay. We estimate this combined cost will be c.£1m
annually.
There are a number o potential impacts which
have not been costed into our plan. These are as
ollows.
• Training - There could be a need to provide
additional training to FCOs and engineering
teams or working on smart meters as part o
both the emergency service and the replacement
programme. Any training requirements are
currently unknown but we believe some orm o
training may be required.
• ProvisionofEmergencyMeteringServices
(PEMS) - NGN may be required to source and
stock smart meters. FCOs would also haveto carry both smart and standard meters to
meet the PEMS obligations; there would be the
associated increase in held stock costs. NGN
thereore believes suppliers should now provide
a ull 24 hour, seven day emergency meter
service and there should not be an obligation on
GDNs to provide PEMS.
• Increasedresources - There may be the
need to increase the number o resourcesto cover the additional workload. This would
include both industrial and oce-based support
sta. The number o resources, and the type
(contractor/direct labour) will depend greatly
on the decisions o the suppliers as to the role
o the GDN in supporting the smart metering
implementation, (e.g. will the supplier have ‘in-
house’ capability to carry out meter relocations).
Also the training o the smart metering installer(as detailed in the emergency services impacts)
will also infuence the number o resources
required. We are thereore unable to estimate the
potential cost impact at this time.
• Strandedmeters - NGN currently has a meter
supplier o last resort licence obligation which
obliges NGN to provide and install meters on
request. Since 2005 NGN has installed more
than 28,000 meters under this regulatory
requirement. As a result o the smart meter
implementation these meters will become
stranded by being replaced earlier than their
normal working lie. It is imperative that the lost
income stream associated with this should be
compensated to NGN.
In summary, our business plan thereore includes
a c.£3m per year impact on our operating costs
or the duration o the smart meter implementation
programme and c.£1m per year on our Repexcosts, based on our current understanding o the
programme.

7/22/2019 Ngn Business Plan
http://slidepdf.com/reader/full/ngn-business-plan 139/224
139
7.3 Investment plansIn September 2010 we submitted our orecast
expenditure or 2013/14 to 2018/19 based on our
initial view o the likely requirements o the next
price control period. These orecasts included a
proposal to invest c.£180m/year over the period
and ormed the basis o our discussions with
stakeholders.
Since that time we have signicantly developed our
new TNM approach and consulted
widely with our stakeholders. Consequently, we
now have a much clearer picture o what we
should be aiming to deliver balanced against the
overall impact on customers. We have reviewed
and challenged these orecasts and rened our
business plan to refect customers’ views.
During RIIO-GD1 we now plan to invest
c.£150m/year in the gas distribution network a
signicant reduction rom our previous orecast.
The high level breakdown o this investment is
shown below.
Figure 7.4: Total RIIO-GD1 investment orecasts
£m 2009/10 prices 13/14 14/15 15/16 16/17 17/18 18/19 19/20 20/21 Total
Mains replacement 63.1 61.0 61.2 63.0 64.1 64.4 66.1 66.6 509.4
Non-mains replacement 33.8 35.1 35.4 35.7 36 36.3 35.6 35.9 283.8
Totalnetreplacement
expenditure96.9 96.2 96.6 98.7 100.1 100.7 101.7 102.5 793.3
LTS and storage 10.8 11.4 12.7 17.2 13.6 20.1 10.9 11.2 107.8
Mains and governors 5.4 5.4 5.3 5.3 5.1 4.9 4.9 4.7 40.9
Governors (replacement) 1.8 1.7 1.8 1.8 1.8 1.8 1.8 1.8 14.2
Connections 6.7 6.6 6.7 6.7 5.9 6.1 6.3 6.5 51.6
Other Capex 24.5 29.0 26.2 28.2 16.9 17.2 20.0 20.6 182.6
Total net Capex 49.2 54.1 52.7 59.1 43.3 50.1 43.9 44.8 397.1
Total net investment 146.1 150.2 149.3 157.8 143.4 150.8 145.5 147.2 1,190.4

7/22/2019 Ngn Business Plan
http://slidepdf.com/reader/full/ngn-business-plan 140/224
140
7.4 Replacement expenditure(Repex)
Since 2005 we have consistently been the most
cost ecient GDN in delivering the replacement
programme, whilst consistently meeting the HSE
abandonment targets.
7.4.1 Overall forecast
We intend to remain as one o the rontier
perormers by embracing the revised three tier
strategy or iron mains replacement within our
TNM approach. We will use innovative tools and
techniques, some developed under the existing
price control period, others to be established,
to deliver the required outputs, targeting the
aspirations o our stakeholders. Our overall Repex
orecast or RIIO-GD1 is summarised below.
Figure 7.5: Total RIIO-GD1 Repex
£m 2009/10 prices 13/14 14/15 15/16 16/17 17/18 18/19 19/20 20/21 Total
HSE programme 46.1 46.5 46.4 48.0 49.0 49.0 50.4 50.7 386.0
Other policy and condition 9.9 8.9 9.0 9.1 9.2 9.4 9.5 9.6 74.6
Non-rechargeable diversions 6.3 4.9 5.0 5.0 5.1 5.2 5.3 5.4 42.2
Total incentivised mains 62.3 60.2 60.4 62.1 63.3 63.5 65.3 65.7 502.8
Rechargeable diversions 0.8 0.8 0.8 0.8 0.8 0.8 0.8 0.9 6.6
Total mains Repex 63.1 61.0 61.2 63.0 64.1 64.4 66.1 66.6 509.4
Replacement services-domestic 32.8 33.3 33.6 33.9 34.1 34.4 33.6 33.9 269.6
Replacement services non
-domestic0.3 0.3 0.3 0.3 0.3 0.3 0.3 0.3 2.1
Total multiple occupancy buildings
(risers >20 metre length)0.5 0.8 1.5 1.6 1.6 1.6 1.7 1.7 1.7
Total services Repex 33.8 35.1 35.4 35.7 36.0 36.3 35.6 35.9 283.8
Total Repex (Net) 96.9 96.2 96.6 98.7 100.1 100.7 101.7 102.5 793.3

7/22/2019 Ngn Business Plan
http://slidepdf.com/reader/full/ngn-business-plan 141/224
Actuals Forecast
£m 2009/10 prices 2008/09 2009/10 2010/11 2011/12 2012/13 Total
HSE programme 50.2 51.7 48.6 48.8 49.5 248.8
Other policy and condition 2.0 3.7 3.0 4.0 4.1 16.8
Non-rechargeable diversions 1.1 0.7 0.8 2.3 3.3 8.2
Total incentivised mains 53.3 56.1 52.4 55.1 56.9 273.8
Rechargeable diversions 0.7 0.5 0.8 0.8 0.8 3.6
Total mains Repex 54 56.6 54.6 55.9 57.7 278.8
LTS pipelines and installations 0.2 0.3 1.3 0.0 1.2 3.0
Replacement services-domestic 26.8 29.0 29.2 30.2 31.5 146.7
Replacement services non
-domestic0.3 0.7 0.3 0.3 0.3 1.9
Total multiple occupancy buildings
(risers >20 metre length)0.0 0.0 0.0 0.3 0.5 0.8
Total services Repex 27.1 29.7 29.5 30.8 32.3 149.4
Total Repex (net) 81.1 86.3 84.1 86.7 90.0 428.2
141
The table below shows our Repex during GDPCR1.
Figure 7.6: GDPCR1 Repex
As can be seen the overall level o Repex will
increase by c.10% in RIIO-GD1 refecting an
increase in condition based replacement, the
transer o more Repex work into the southern part
o our network and RPEs.

7/22/2019 Ngn Business Plan
http://slidepdf.com/reader/full/ngn-business-plan 142/224
142
7.4.2 Application of TotalNetwork Management tothe Repex programme
Section 4 outlines how we have developed
our organisation to deliver a Total Network
Management (TNM) approach to investment
decisions. The recent changes to the iron mainsreplacement programme will enable NGN to apply
this new approach to this major area o investment.
Our approach is driven by ully utilising the
additional fexibility to innovate and improve mains
replacement. This has enabled us to develop
a Repex programme that delivers signicant
additional benet to customers. The key eatures
are summarised below.
• Mandated volumes in tier one will be deliveredat lower unit cost, despite the cost pressures
we ace. This is due to greater fexibility in the
delivery o projects and the potential to exploit
greater economies o scale by more mains being
replaced in an area under a single scheme.
• Our approach to the setting o ‘seed’ thresholds
in tier one, together with our process used or
identiying other iron pipes or replacement
on the basis o their requirement, eciency,condition and perormance, will ensure that
year-on-year we will continue to deliver ull
compliance with the HSE’s requirements whilst
minimising our overall tier one iron workload.
• We have worked with the other GDNs and the
HSE to develop a risk threshold or tier two iron
pipes which we believe delivers an appropriate
balance between workload and risk exposures.
Additionally, we have driven down our orecast
volume o below-threshold pipes to include only
those which will provide an overall net benet. As
a result, our total mandated and non-mandated
workload volume in tiers two and three has been
reduced rom almost 80km/year (based on a
straight line prole o replacement o remaining
live iron pipe out to 2032) to 35km/year – a
reduction o nearly 60%.
• A targeted replacement strategy which uses a
cost benet methodology to determine whichmains will be replaced.
• A reduced requirement or replacing large
diameter iron mains pipes where it is accepted
by HSE that a programme o monitoring,
maintenance and remediation developed by
NGN can manage risk within acceptable levels.
Taken together, these are the key drivers o our
RIIO-GD1 replacement programme and they
will deliver additional and broader benets to
customers.
7.4.3 Targeted replacement strategy andcost benet methodology
Many o the additional benets which will be
delivered by our replacement expenditure will
derive directly rom the specic targeting o mains
replacement as part o our approach to TNM.
At the heart o this strategy is a cost benetmethodology to assessing where the replacement
programme will deliver maximum overall benet
when assessed against a wide range o criteria.
The methodology considers the characteristics
o the network at each o 215 individual Network
Analysis Polygons (NAPs) which make up our
network. For each NAP within the network we can
analyse nancial and non-nancial data or a range
o criteria.
• System pressure.
• Pipe material.
• Risk prole.
• Leakage history.
• Repair history.
• Pipe diameters.
• MEG concentration levels.
• Impact on customer (interruptions).
• Impact on local community (e.g. road closures).
This process and detailed localised analysis
allows us to identiy those NAPs which present
customers with the highest levels o network risk
and the highest impact on the cost o operating
the network. Solutions to most eciently deliver
sustainable improvements on standards o
perormance can then be assessed by considering

7/22/2019 Ngn Business Plan
http://slidepdf.com/reader/full/ngn-business-plan 143/224
143
a range and mix o alternative options including the
ollowing.
• Replacement(includingtheabilitytodevelop
ecient projects).
• Mainsandgovernorreinforcement.
• Pressuremanagement.• MEGapplication.
• Repair.
Specically or replacement expenditure, those
NAPs with the highest likelihood o leakage
and mains repair with the consequent highest
associated operating expenditure will be used
to identiy the required size and shape o the
programme. This will allow the specic geographic
targeting o the mandated elements o theprogramme to those higher priority areas and the
identication o specic mains replacement projects
that can be justied on a true cost-benet analysis.
As an example, we show below the application
o this approach on two o our highest priority
NAPs, in Leeds and Hudderseld. The analysis in
Section 4 shows these areas have some o our
worst perorming assets. Individual pipes can be
categorised as high, medium or low priority against
a range o criteria including associated payback
periods.

7/22/2019 Ngn Business Plan
http://slidepdf.com/reader/full/ngn-business-plan 144/224
144
Figure 7.7: Sample analysis Leeds and Hudderseld NAPs 2011
The table above shows a cost benet analysis
(less than 10 year payback) in replacing pipes
shaded in green. There is no cost benet in
replacing pipes shaded in red. Pipes shaded in
amber would be kept under review as these pipes
have demonstrated signicant deterioration in the
previous 12 months.
This analysis and its key principles have been usedin directly developing our replacement and wider
investment and operating plans. Detailed orecasts
on a scheme by scheme basis cannot be derived
at this time or all NAPs over a 10 year time horizon
using this process. However, it can and has been
used to accurately identiy the required scale o the
programme or non-mandatory tier two and three
pipes.
The methodology will continue to be developed
and employed directly as part o our investment
strategy or the prioritisation and scheduling o
tier one pipes or incorporation into ecient andeective projects. It will also be used or the
identication o non-mandatory tier two and tier
three pipes where their replacement would be
justied on a net-benet business case approach.
Route Material SizeLength
(metres)Total escapes
Average
annual cost o
escapes
Replacement
Cost
Payback
period based
on escapes in
last 12mths
payback
period
(last year)
Payback
period based
on average
escapes
over last
5yrs payback
period (avg)
Leeds 1 CI 10” 41 31 £10,150 £138k 13.2 13.7
Leeds 2 CI 24” 248 12 £16,800 £102k 6.1 6.1
Leeds 3 SI 14” 171 7 £4200 £35k 4.0 8.5
Leeds 4 SI/ST 14-24” 802 15 £11,800 £338k 6.0 28.7
Hudd 1 CI 3” 556 6 £750 £24k 6.4 31.8
Hudd 2 CI 14-24” 5312 166 £251,000 £2029k 3.1 8.1
Hudd 3 DI 12” 139 9 £3,600 £45.5k 11.4 12.6
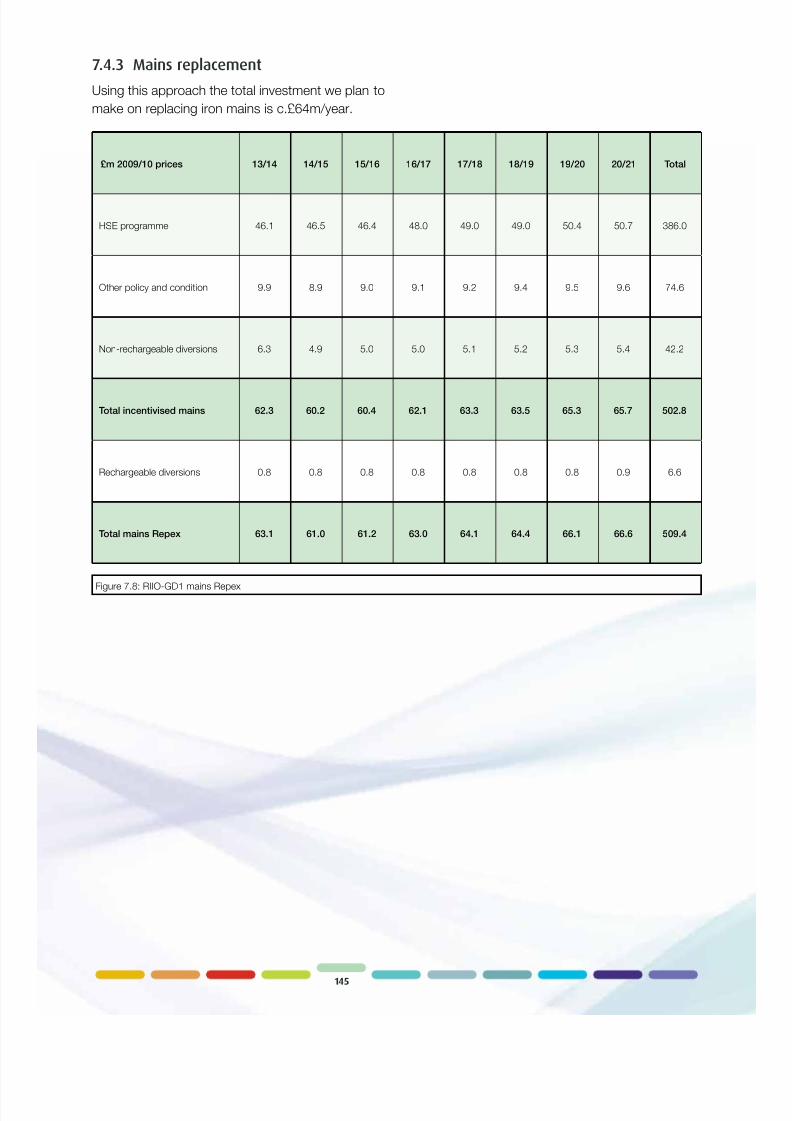
7/22/2019 Ngn Business Plan
http://slidepdf.com/reader/full/ngn-business-plan 145/224
145
7.4.3 Mains replacement
Using this approach the total investment we plan to
make on replacing iron mains is c.£64m/year.
Figure 7.8: RIIO-GD1 mains Repex
£m 2009/10 prices 13/14 14/15 15/16 16/17 17/18 18/19 19/20 20/21 Total
HSE programme 46.1 46.5 46.4 48.0 49.0 49.0 50.4 50.7 386.0
Other policy and condition 9.9 8.9 9.0 9.1 9.2 9.4 9.5 9.6 74.6
Non-rechargeable diversions 6.3 4.9 5.0 5.0 5.1 5.2 5.3 5.4 42.2
Total incentivised mains 62.3 60.2 60.4 62.1 63.3 63.5 65.3 65.7 502.8
Rechargeable diversions 0.8 0.8 0.8 0.8 0.8 0.8 0.8 0.9 6.6
Total mains Repex 63.1 61.0 61.2 63.0 64.1 64.4 66.1 66.6 509.4

7/22/2019 Ngn Business Plan
http://slidepdf.com/reader/full/ngn-business-plan 146/224
146
The ollowing sections provide additional detail
regarding the orecast investment in each tier o
mains, and the underlying cost and workload
drivers.
i Tier one – iron pipes 8” in diameter andbelow
Tier one is the largest element o the Repex
programme with c.95% o the total mains workload
and c.90% o the total cost o mains replacement.
The HSE minimum requirement is that iron pipes
o 8” and below should continue to be abandoned
at a rate that will deliver completion o this part o
the Repex programme by 2032. We have set our
workload target in this category to achieve this
requirement.
A minimum o 20% o the highest scoring tier one
pipes under the risk model must be replaced.
This will deliver the required primary output o risk removal, with the remaining 80% being utilised to
develop ecient projects using criteria other than
the risk score model or mains replacement.
Our orecast costs and workload are shown in the
table below.
Figure 7.9: RIIO-GD1 tier one mains Repex and workload volumes
£m 2009/10 Prices 13/14 14/15 15/16 16/17 17/18 18/19 19/20 20/21 Total
HSE programme 43.8 44.2 44.5 46.1 47.0 46.9 48.6 48.9 370.0
Other policy and condition 5.2 4.1 4.1 4.2 4.3 4.3 4.4 4.4 34.9
Non-rechargeable diversions 6.3 4.9 5.0 5.0 5.1 5.2 5.3 5.4 42.2
Total incentivised mains 55.3 53.2 53.5 55.3 56.4 56.4 58.3 58.7 447.2
Rechargeable diversions 0.7 0.7 0.7 0.8 0.8 0.8 0.8 0.8 6.1
Total mains Repex 56.0 53.9 54.3 56.1 57.2 57.2 59.1 59.5 453.3
Workload (kms abandoned)
HSE programme 502 502 502 502 502 502 502 502 4,016
Other policy and condition 41 31 31 31 31 31 31 31 258
Non-rechargeable diversions 26 16 16 16 16 16 16 16 138
Total incentivised mains 569 549 549 549 549 549 549 549 4,412
Rechargeable diversions 15 15 15 15 15 15 15 15 120
Total tier one mains Repex 584 564 564 564 564 564 564 564 4,532

7/22/2019 Ngn Business Plan
http://slidepdf.com/reader/full/ngn-business-plan 147/224
147
Workload drivers
The tier one iron mains abandoned during RIIO-
GD1 will be c.550km per year. This workload has
been determined by the requirement to completely
replace all tier one iron mains by 31 March 2032,
and consists o three elements.
• Strategicallyplannedprojects – This
includes all seed pipes (the highest scoring
pipes, which make up 20% o the required
workload), with the remainder being utilised to
develop ecient projects and deliver the required
outputs associated with pipes in this category.
Development o this workload will be delivered
using data rom multiple sources. This will be a
resource-intensive activity, with the designers
utilising existing expertise and developing new
tools and techniques to optimise the selected
mix o projects to deliver the best balance o
desired outputs and making ull use o the
additional fexibility available to them.
• Conditioniron – These volumes are based
on historic rates o mains abandoned in this
category, and are pipes which were identied
as requiring replacement ater completion o the
strategic planning workload development.
• Non-rechargeablediversions –These are
based on historic rates o diversions since 2005.
As with condition iron, these are pipes that are
identied as requiring replacement outside the
strategic planning cycle and which cannot be
deerred to the next cycle.
By ensuring that seed thresholds are set based
on the ull HSE target length, and that all o these
pipes are included within the strategically planned
workload, we will be able to ensure that iron pipes
abandoned on the basis o condition or non-
chargeable diversions can be included as countingtowards the overall HSE target. In this way, we
have been able to minimise our orecast workload
whilst remaining ully compliant with our HSE
requirements.
The RIIO-GD1 programme shows a signicant
shit in the geographical dispersion o workload
between the North and Yorkshire LDZs when
compared to GDPCR1. This is as a direct result
o the targeted replacement programme and the
methodology employed to identiy appropriate
projects using a TNM approach. The map ollowing
compares the split o repair-related operating costs
with the percentage o iron mains in that area. The
majority o these costs are triggered by the iron
mains rather than PE mains.

7/22/2019 Ngn Business Plan
http://slidepdf.com/reader/full/ngn-business-plan 148/224
148
Figure 7.10: Iron mains population and associated operating costs by geographic area
This analysis demonstrates the Yorkshire region
has a signicantly higher percentage o escapes,
repairs and leakage on iron mains than the North.
Consequently, we will ocus our Repex investment
on the poorest perorming assets, which are in
the Yorkshire region. Figure 7.12 shows the typical
annual workload split or RIIO-GD1.
% o total NGN iron mains located within that area
% o total NGN repair related operating costs incurred in that area
16%
17%
11%27%24%
5%
19%
21%
11%27%17%
5%
As a consequence, associated steel abandonment
will increase to a rate o 37km/year as Yorkshire
has a signicantly higher proportion o associated
small diameter steel mains than the North. These
pipes orm part o the planned workload and are an
integral element in delivering ecient projects.
Key:

7/22/2019 Ngn Business Plan
http://slidepdf.com/reader/full/ngn-business-plan 149/224
149
The majority o these were ailures o the pipe
barrel through corrosion. This indicates that these
pipes are deteriorating to the end o their useullie and as time progresses the requency o ailure
has increased Opex spend. There is an increased
likelihood o disruption/disturbance or local
residents, environmental impact o leakage and o
supply ailure due to water ingress.
Figure 7.11: Repair history in specic Leeds NAP
We also plan to replace 15km per year o condition
steel o diameter >2” across the network. These
volumes are driven by our TNM approach. For
example, we have identied that several estates in
Leeds which are served by all-steel inrastructures
and are experiencing increasing levels o corrosion
ailures leading to continual supply disruption. This would be most eectively addressed by a
programme o planned replacement rather than
continuing with the current repair/replace on ailure
strategy. This is clearly shown rom the example
below.
In Figure 7.11 escape repairs (red dots) since 2006
are shown plotted on mains pipes which have
been colour-coded by material – grey being plastic,
green is iron and orange is steel. It can clearly be
seen that there have been signicantly more repairs
required on the steel pipes than the neighbouring
PE or iron pipes.

7/22/2019 Ngn Business Plan
http://slidepdf.com/reader/full/ngn-business-plan 150/224
150
The overall benets o replacing these pipes with
PE in a well-managed, planned and ecient
manner outweigh the costs o carrying out the
repair work, and so there is a justication or
including this as part o our overall replacement
strategy.
Other potential areas or proactive replacementwill be assessed and prioritised using the targeted
replacement methodology set out above.
The table below shows the breakdown o more
typical annual combined tier one workload.
Cost drivers
Minimising the amount o PE pipe laid to replace
iron pipe is a signicant cost driver. The less pipe
laid generally the lower the cost. NGN has been
able to maintain high abandonment to lay ratios
during GDPCR1.
For RIIO-GD1 we orecast that iron mains lay to
abandonment ratios will decrease gradually when
compared to GDPCR1. This is as a result o the
reduced availability o higher-ratio projects that
have been successully targeted through GDPCR1.
The orecast lay to abandonment ratios are set out
below.
Figure 7.13: RIIO-GD1 lay to abandonment ratios
Lay to abandonment ratios 2013/14 2020/21
Iron 1:1.05 1:1.025
Associated steel
North 1:1.18 1:1.18
Yorkshire 1:1.39 1:1.39
Condition (steel) 1:1 1:1
Condition (iron) 1:1 1:1
Non-rechargeable diversions 1:1 1:1Figure 7.12: Tier one iron mains abandonment workload
kms Total Yorkshire North
Total iron mains abandon-
ment496 398 98
Strategically planned
projects
464 382 82
Condition 16 8 8
Non rechargeable
diversions16 8 8
Associated steel 37 33 4
Condition (steel) 15 10 5
Total incentivised mains 549 442 107

7/22/2019 Ngn Business Plan
http://slidepdf.com/reader/full/ngn-business-plan 151/224
151
For associated steel pipes we have recorded very
high lay to abandonment ratios, particularly in
Yorkshire. This is because a signicant number
o these are back garden steel rails which are
addressed by cutting o the steel pipe and relaying
the services to the parent main at the ront o the
property. We are orecasting that this practice willcontinue, and this eciency has been included
within our plan.
All expenditure orecasts have been set with
reerence to the latest unit cost rates that already
represent the rontier or eciency across the
industry. This level o perormance is driven by
a range o initiatives and processes within NGN.
These include: strong commercial arrangements
with contractors; advanced systems and processes
that allow the development o very ecient
schemes that make up the whole programme;
and procedures that employ ecient delivery
techniques that minimise the cost o deliverysuch as pipe insertion. We currently use insertion
techniques in more than 90% o all iron mains
abandoned. As such, and when combined with the
ongoing productivity improvements included in this
plan, these unit costs represent a continuation o
this industry-leading perormance.
Figure 7.14: Tier one - unit rates
However, the geographic shit in the workload
to Yorkshire has an impact on the unit costs o
delivering the programme. Contractor rates in Yorkshire attract a premium over those in the North
refecting a range o actors including more dicult
ground and working conditions and the availability/
mobility o contract labour.
ii Tier two – mains greater than 8” andless than 18”
For this tier, the programme is based upon a
orecast o the volumes o mains that will exceed
the agreed risk threshold, plus those pipes belowthe risk threshold that will deliver positive value
or customers based on a cost/benet analysis o
targeted replacement.
£/metre 2009/10 prices 13/14 14/15 15/16 16/17 17/18 18/19 19/20 20/21
HSE programme 93.4 94.1 94.3 97.4 99.0 98.4 101.7 101.9
Other policy and condition 130.5 134.2 135.0 137.4 140.0 140.7 143.3 145.1
Non-rechargeable diversions 314.7 320.1 323.3 327.8 332.6 335.8 340.7 344.8
Rechargeable diversions 316.5 319.6 324.0 327.8 332.0 336.8 340.2 344.6

7/22/2019 Ngn Business Plan
http://slidepdf.com/reader/full/ngn-business-plan 152/224
152
Our proposed tier two programme orms only a
small percentage o our overall programme – 4% o
workload and 9% o total replacement expenditure.
The three tier approach and the additional fexibility
it provides, along with our holistic targeted
approach, has produced signicant savings or tier
two when compared to the previous ramework.
Our orecast costs and workload are show in the
table below.
Figure 7.15: RIIO-GD1 tier two mains Repex and workload volumes
Workload drivers
The RIIO-GD1 workload consists o 10km o
mandatory abandonment and 20km o non-
mandatory abandonment.
The mandatory workload has been derived rom
our assessment o the minimum length o iron
pipe that will need to be abandoned in order to
achieve a risk threshold o 93*10-6 incidents/
km/year, with the annual workload volume set to
achieve abandonment o these pipes by the end
o RIIO-GD1. Details o the process adopted and
the analysis employed to derive this threshold areincluded as Appendix A10. This threshold and the
associated workload require agreement with HSE
– any changes required to the risk threshold will
change the volumes o work to be carried out in
this category.
The non-mandatory workload has been derived
rom our assessment o projects that orm part
o an ecient overall package o work, given the
mandated workload volumes in both tier one
and tier two. This takes into account the cost-
benet analysis across our network, assessing
where these projects could be targeted to deliver
additional signicant nancial and non-nancial
benets to customers. These projects will deliver a
signicant improvement in the overall health o this
category o assets across the network.
£m 2009/10 prices 13/14 14/15 15/16 16/17 17/18 18/19 19/20 20/21 Total
HSE programme 2.3 2.2 1.9 1.9 1.9 2.1 1.8 1.8 16.0
Other policy and condition 3.4 3.4 3.5 3.5 3.5 3.6 3.7 3.7 28.3
Rechargeable diversion 0.1 0.1 0.1 0.1 0.1 0.1 0.1 0.1 0.5
Total mains Repex 5.7 5.7 5.5 5.5 5.5 5.7 5.5 5.6 44.7
Workload (kms abandoned)
HSE programme 10 10 10 10 10 10 10 10 82
Other policy and condition 20 20 20 20 20 20 20 20 159
Rechargeable diversion 1 1 1 1 1 1 1 1 5
Total tier two mains Repex 31 31 31 31 31 31 31 31 245

7/22/2019 Ngn Business Plan
http://slidepdf.com/reader/full/ngn-business-plan 153/224
153
Figure 7.16: Tier two - unit rates
Cost drivers
Lay to abandonment ratios or tier two pipes are
consistent with those or tier one and as set out in
Figure 7.13 above.
Expenditure orecasts have been set based on
modest overall volumes leading to short project
lengths. This is driven by a desire to deliver our
mandatory pipe requirement in tier two at the
lowest total cost to the customer, and to only
schedule non-mandatory pipes or abandonment
where there is an overall justiable benet.
Although this may have a negative impact on unit
rates, it delivers the lowest overall spend and is
consistent with our goal to minimise our total cost
o operation.
As with tier one, we are orecasting a geographic
shit in workload towards Yorkshire which will also
have an adverse impact on costs. Despite these
eects, we have held our orecast unit rates or tier
two pipes close to our current costs.
£/metre 2009/10 prices 13/14 14/15 15/16 16/17 17/18 18/19 19/20 20/21
HSE programme 188.1 188.9 184.0 184.0 186.5 192.2 188.6 190.3
£m 2009/10 prices 13/14 14/15 15/16 16/17 17/18 18/19 19/20 20/21 Total
Other policy and condition 1.4 1.4 1.4 1.4 1.4 1.5 1.5 1.5 11.4
Total mains Repex 1.4 1.4 1.4 1.4 1.4 1.5 1.5 1.5 11.4
Workload (kms abandoned)
Other policy and condition 5 5 5 5 5 5 5 5 40
Total tier three mains Repex 5 5 5 5 5 5 5 5 40
Figure 7.17: RIIO-GD1 tier three mains Repex and workload volumes
iii Tier three – mains equal to and greaterthan 18”
Our proposed tier three programme represents the
smallest element o our overall programme with
1% o workload and 2% o total mains replacement
expenditure.
This tier o iron mains contains no mandated
workloads. Iron mains within this tier have been
included where they deliver positive value or
customers and the most cost eective way o
delivering the outputs set out within the plan.
Our orecast costs and workload are shown in the
table below.

7/22/2019 Ngn Business Plan
http://slidepdf.com/reader/full/ngn-business-plan 154/224
154
Workload drivers
These workload gures have been derived rom
our analysis o those projects that orm part o
an ecient overall package o work, given the
mandated workload volumes in both tier one
and tier two. They take into account the cost-
benet analysis across our network, assessingwhere these projects could be targeted to deliver
additional signicant nancial and non-nancial
benets. These projects will deliver a signicant
improvement in the overall health o this category o
assets across the network.
Figure 7.18: RIIO-GD1 tier three workload split
Figure 7.19: Tier three - unit rates
Workload (km) Total Yorkshire North
Total 5.0 3.0 2.0
18” 3.4 2.0 1.4
24” 1.6 1.0 0.6
Cost drivers
All expenditure orecasts have been set with
reerence to the latest unit cost rates that already
represent the benchmark or eciency across the
industry.
These rates ully refect both the diameter band
split and the geographical allocation o these
projects across the period.
£/metre 2009/10 prices 13/14 14/15 15/16 16/17 17/18 18/19 19/20 20/21
Tier three mains 298.6 302.2 305.9 309.6 313.4 317.2 321.2 325.1
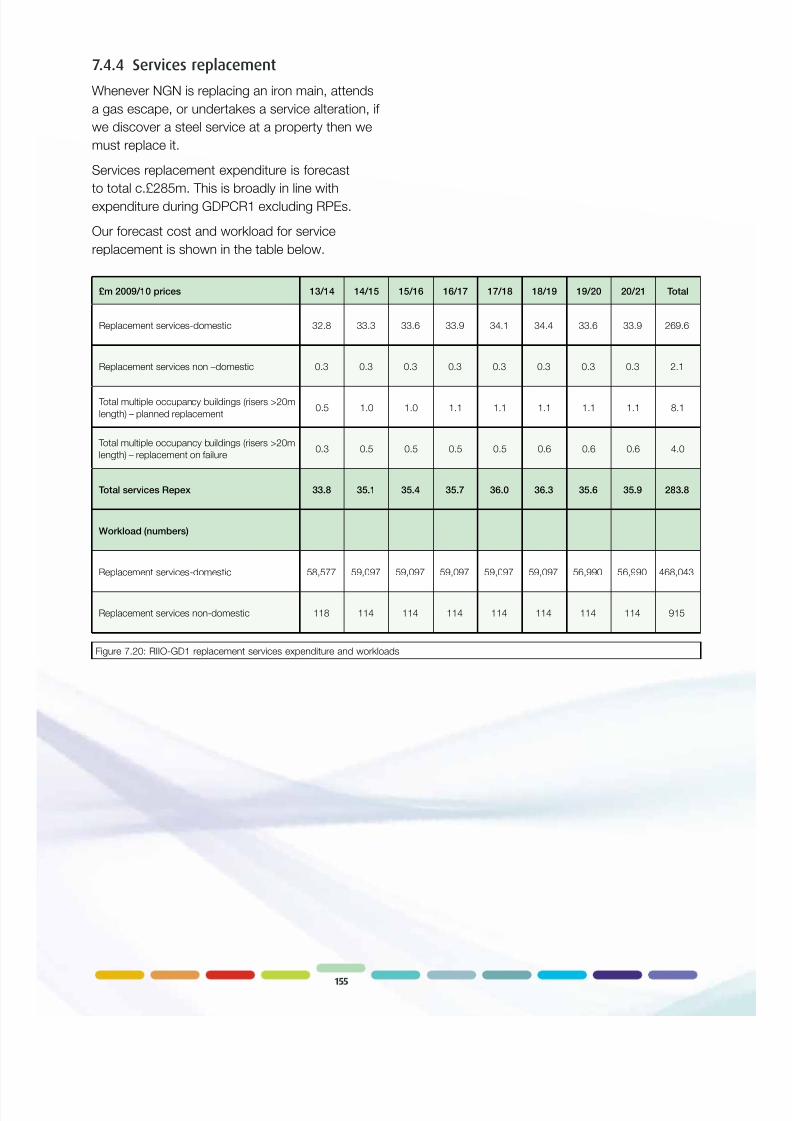
7/22/2019 Ngn Business Plan
http://slidepdf.com/reader/full/ngn-business-plan 155/224
155
Figure 7.20: RIIO-GD1 replacement services expenditure and workloads
7.4.4 Services replacement
Whenever NGN is replacing an iron main, attends
a gas escape, or undertakes a service alteration, i
we discover a steel service at a property then we
must replace it.
Services replacement expenditure is orecast
to total c.£285m. This is broadly in line with
expenditure during GDPCR1 excluding RPEs.
Our orecast cost and workload or service
replacement is shown in the table below.
£m 2009/10 prices 13/14 14/15 15/16 16/17 17/18 18/19 19/20 20/21 Total
Replacement services-domestic 32.8 33.3 33.6 33.9 34.1 34.4 33.6 33.9 269.6
Replacement services non –domestic 0.3 0.3 0.3 0.3 0.3 0.3 0.3 0.3 2.1
Total multiple occupancy buildings (risers >20m
length) – planned replacement0.5 1.0 1.0 1.1 1.1 1.1 1.1 1.1 8.1
Total multiple occupancy buildings (risers >20m
length) – replacement on ailure0.3 0.5 0.5 0.5 0.5 0.6 0.6 0.6 4.0
Total services Repex 33.8 35.1 35.4 35.7 36.0 36.3 35.6 35.9 283.8
Workload (numbers)
Replacement services-domestic 58,577 59,097 59,097 59,097 59,097 59,097 56,990 56,990 468,043
Replacement services non-domestic 118 114 114 114 114 114 114 114 915

7/22/2019 Ngn Business Plan
http://slidepdf.com/reader/full/ngn-business-plan 156/224
156
i Domestic services
We orecast that the volume o domestic service
replacement will be remain at c.58,000 throughout
RIIO-GD1.
Workload drivers
This orecast workload is derived rom the ollowing
core assumptions.
RIIO-GD1 workloads are derived rom those
experienced during GDPCR1. There is no evidence
to suggest that these workload rates and core
assumptions will dier to 2020/21.
Figure 7.21: Domestic services workload
Figure 7.22: RIIO-GD1 domestic service assumptions
Figure 7.23: Domestic services - unit rates
Workload (number) 13/14 14/15 15/16 16/17 17/18 18/19 19/20 20/21 Total
Replacement
services-domestic58,577 59,097 59,097 59,097 59,097 59,097 56,990 56,990 468,043
Assumption Explanation
Services rate 1 per 12.6 metres o main
replaced
Historically, we encounter one domestic service or every 12.6 metres o
metallic main replaced.
Relays : transers 59% Relays : 41% transers During mains replacement works, where an existing service is ound
to be steel it must be ully replaced in PE; however an existing PE
service attached to the metallic main being replaced can be tested and
transerred to the new PE main without being replaced. During mains
replacement activities, 59% o the services encountered are steel and
must be replaced.
Relays ater escapes 7,700 per year Following a gas escape call, i the source o the escape is ound to be a
leaking steel service it must be ully replaced in PE rom the main to the
ECV.
Other services 4,100 per year including an
additional 2,100 per year or 5
years commencing 2014/15 driven
by the smart meter programme
Services which are replaced or other purposes, or example when
associated with altered meter positions or service alterations.
£/service
2009/10 prices13/14 14/15 15/16 16/17 17/18 18/19 19/20 20/21
Relay 573 578 583 588 593 598 603 608
Transer 326 329 332 335 337 340 343 346
Relay ater escapes 1,122 1,132 1,141 1,150 1,160 1,170 1,180 1,190
Other 492 496 500 504 508 512 517 521
Cost drivers
Expenditure orecasts have been derived using
latest unit cost inormation. These rates have been
extended over the whole period with the core
assumptions o real productivity improvements andRPE incorporated.

7/22/2019 Ngn Business Plan
http://slidepdf.com/reader/full/ngn-business-plan 157/224
157
Figure 7.24: Non-domestic services workload
Figure 7.25: Non-domestic service - unit rates
ii Non-domestic services
Workload drivers
We orecast that the volume o non-domestic
service replacement will continue at the rate
experienced in GDPCR1 at c.115 per year.
Cost drivers
Non-domestic service replacement unit costs have
been derived using the latest cost inormation.
Workload (number) 13/14 14/15 15/16 16/17 17/18 18/19 19/20 20/21 Total
Replacement services - non-
domestic118 114 114 114 114 114 114 114 915
£/service 2009/10 prices 13/14 14/15 15/16 16/17 17/18 18/19 19/20 20/21
Replacement non-domestic
services2,239 2,258 2,276 2,295 2,314 2,333 2,353 2,373

7/22/2019 Ngn Business Plan
http://slidepdf.com/reader/full/ngn-business-plan 158/224
158
Figure 7.26: RIIO-GD1 riser costs
iii Risers and laterals replacement
The RIIO-GD1 period includes a programme o
work to replace a number o risers and laterals in
high rise buildings at a cost o c.£12m during RIIO-
GD1.
Figure 7.28: RIIO-GD1 risers and laterals replacement workload
Workload (number) 13/14 14/15 15/16 16/17 17/18 18/19 19/20 20/21 Total
Buildings 3 6 6 6 6 6 6 6 45
Supply points 31 65 65 65 65 65 65 65 486
Workload drivers
A signicant amount o survey work has beencompleted in GDPCR1 to collect and analyse data
relating to the condition o risers and laterals on our
network.
We have identied 12,764 supply points on the
network that can be classied as risers and they
have been sub-categorised as set in Figure 7.27.
This survey work has identied that a number o
these risers will require replacement in RIIO-GD1. The orecast or replacement o laterals and risers
is driven by the outputs o a bespoke risk model
being developed or these specic assets, together
with outputs rom the asset health and criticalityassessments underpinning our asset management
strategy.
Cost driver
NGN has limited internal data on the costs
associated with replacing risers and laterals in high
rise buildings.
We have undertaken high level benchmarking and
market testing to derive the unit cost estimates
shown below.
£k 2009/10 prices 13/14 14/15 15/16 16/17 17/18 18/19 19/20 20/21
Risers replacement cost 253 257 261 265 269 274 278 283
Figure 7.29: RIIO-GD1 risers and laterals replacement - unit rate
Number o supply points
Meter points connected to
risers <20m3,824
Meter points connected to
risers 20m-40m4,043
meter points connected to
risers >=40m4,897
Total multiple occupancy
building supply points12,764
Figure 7.27: NGN riser population
£m 2009/10 prices 13/14 14/15 15/16 16/17 17/18 18/19 19/20 20/21 Total
Total multiple occupancy buildings (risers >20m
length) – planned replacement0.5 1.0 1.0 1.1 1.1 1.1 1.1 1.1 8.0
Total multiple occupancy buildings (risers >20m
length) – replacement on ailure0.3 0.5 0.5 0.5 0.5 0.6 0.6 0.6 4.1

7/22/2019 Ngn Business Plan
http://slidepdf.com/reader/full/ngn-business-plan 159/224
159
7.5 Capital expenditure (Capex)7.5.1 Overall summary
We plan to invest c.£400m o Capex during
RIIO-GD1.
We have linked all our operational network capital
expenditure in RIIO-GD1 to asset health measures,showing the status in 2013 and impacts with, and
without investment in 2017 and 2021. Appendix A11
provides more detail o our investment plan and
shows the linkage to the asset health indices.
We have been through an extensive process with
the Gas Transmission Operator to ensure our
business plans (particularly our Capex plan) are co-ordinated and deliver the most economic solution
or customers. Neither company is planning
investments or initiatives that could be done more
eciently on the other company’s network. More
details can be ound in Appendix A12.
Figure 7.30: RIIO-GD1 total capital investment
This programme directly refects the key business
drivers we are acing and the changing ocus o
Capex in RIIO-GD1. The move away rom meeting
growth in demand to ocusing on the asset health
indices to maintain saety and reliability outputs
is refected in the size and prole o the proposed
programme.
£m 2009/10 prices 13/14 14/15 15/16 16/17 17/18 18/19 19/20 20/21 Total
LTS and storage 10.8 11.4 12.7 17.2 13.6 20.1 10.9 11.2 107.8
Reinorcement (Mains and
Governors)5.4 5.4 5.3 5.3 5.1 4.9 4.9 4.7 40.9
Governors (Replacement) 1.8 1.7 1.8 1.8 1.8 1.8 1.8 1.8 14.2
Connections 6.7 6.6 6.7 6.7 5.9 6.1 6.3 6.5 51.6
Total Other Capex 24.5 29.0 26.2 28.2 16.9 17.2 20.0 20.6 182.6
Other Capex 12.0 18.0 12.6 12.8 9.2 9.2 9.4 9.3 92.4
Vehicles 3.4 2.7 5.6 0.1 0.8 2.3 3.0 2.4 20.3
IS and telecoms 8.7 6.7 6.3 13.6 6.5 5.6 7.0 8.2 62.8
Xoserve 0.5 1.6 1.7 1.7 0.4 0.1 0.5 0.7 7.2
Total net Capex 49.2 54.1 52.7 59.1 43.3 50.1 43.9 44.8 397.1

7/22/2019 Ngn Business Plan
http://slidepdf.com/reader/full/ngn-business-plan 160/224
160160
Overall levels o capital investment are orecast toincrease in RIIO-GD1 primarily due to a number o
one-o investments we plan to make in RIIO-GD1.
These include investments in: PRIs; governors
and mains to support the removal o the low
pressure gasholders; security upgrade o sites
recommended by the Centre or the Protection
o National Inrastructure(CPNI); the introduction
o remote pressure control; and monitoring and
removal o high pressure storage vessels rom the
network. The diagram below shows that when theimpact o these one-o investments are removed,
then investment levels are consistent with those in
GDPCR1.
Figure 7.31: GDPCR1 total capital investment
Figure 7.32: RIIO-GD1 total capital investment
The current capital expenditure during GDPCR1 is
shown in the table below.
£m 2009/10 prices 2008/9 2009/10 2010/11 2011/12 2012/13 Total
LTS and storage 2.9 3.8 6.7 6.5 8.5 28.4
Mains and Governors 4.0 6.9 4.8 4.9 8.5 29.1
Other Capex 12.0 10.4 12.6 6.7 12.2 53.9
Vehicles 2.5 4.9 0.0 0.4 2.8 10.6
Connections 6.3 7.2 5.9 6.8 6.5 32.7
IS and telecoms 3.5 8.3 1.8 6.2 6.3 26.1
Xoserve 1.4 0.3 0.6 0.6 0.1 3.0
Total 32.6 41.8 32.4 32.1 44.9 183.8
70
60
50
40
30
20
10
0
0 8 / 0 9
0 9 / 1 0
1 0 / 1 1
1 1 / 1 2
1 2 / 1 3
1 3 / 1 4
1 9 / 2 0
1 4 / 1 5
2 0 / 2 1
1 5 / 1 6
1 6 / 1 7
1 8 / 1 9
1 7 / 1 8
£ m 2
0 0 9 / 1 0 p r i c e s
Total Capex Total Capex less RIIO-GD1 projects
GDPCR1 RIIO-GD1
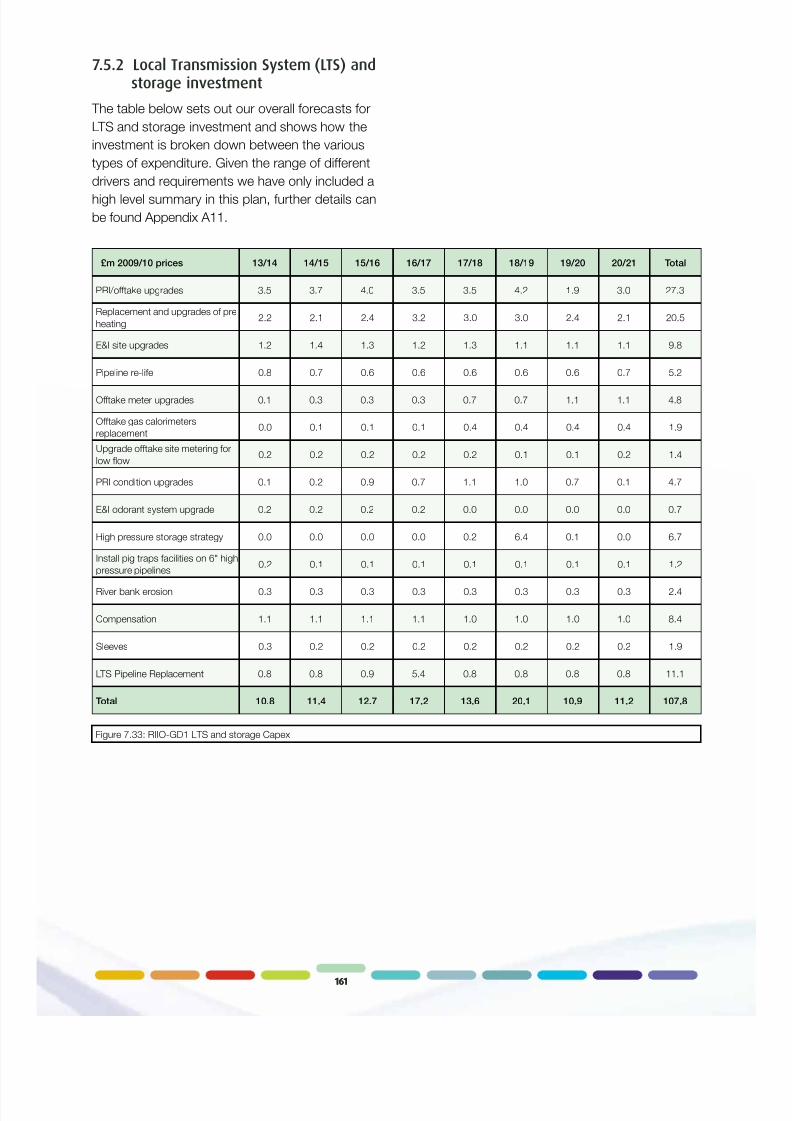
7/22/2019 Ngn Business Plan
http://slidepdf.com/reader/full/ngn-business-plan 161/224
161161
Figure 7.33: RIIO-GD1 LTS and storage Capex
7.5.2 Local Transmission System (LTS) andstorage investment
The table below sets out our overall orecasts or
LTS and storage investment and shows how the
investment is broken down between the various
types o expenditure. Given the range o dierent
drivers and requirements we have only included ahigh level summary in this plan, urther details can
be ound Appendix A11.
£m 2009/10 prices 13/14 14/15 15/16 16/17 17/18 18/19 19/20 20/21 Total
PRI/otake upgrades 3.5 3.7 4.0 3.5 3.5 4.2 1.9 3.0 27.3
Replacement and upgrades o pre
heating2.2 2.1 2.4 3.2 3.0 3.0 2.4 2.1 20.5
E&I site upgrades 1.2 1.4 1.3 1.2 1.3 1.1 1.1 1.1 9.8
Pipeline re-lie 0.8 0.7 0.6 0.6 0.6 0.6 0.6 0.7 5.2
Otake meter upgrades 0.1 0.3 0.3 0.3 0.7 0.7 1.1 1.1 4.8
Otake gas calorimeters
replacement0.0 0.1 0.1 0.1 0.4 0.4 0.4 0.4 1.9
Upgrade otake site metering or
low fow0.2 0.2 0.2 0.2 0.2 0.1 0.1 0.2 1.4
PRI condition upgrades 0.1 0.2 0.9 0.7 1.1 1.0 0.7 0.1 4.7
E&I odorant system upgrade 0.2 0.2 0.2 0.2 0.0 0.0 0.0 0.0 0.7
High pressure storage strategy 0.0 0.0 0.0 0.0 0.2 6.4 0.1 0.0 6.7
Install pig traps acilities on 6" high
pressure pipelines0.2 0.1 0.1 0.1 0.1 0.1 0.1 0.1 1.2
River bank erosion 0.3 0.3 0.3 0.3 0.3 0.3 0.3 0.3 2.4
Compensation 1.1 1.1 1.1 1.1 1.0 1.0 1.0 1.0 8.4
Sleeves 0.3 0.2 0.2 0.2 0.2 0.2 0.2 0.2 1.9
LTS Pipeline Replacement 0.8 0.8 0.9 5.4 0.8 0.8 0.8 0.8 11.1
Total 10.8 11.4 12.7 17.2 13.6 20.1 10.9 11.2 107.8

7/22/2019 Ngn Business Plan
http://slidepdf.com/reader/full/ngn-business-plan 162/224
162
RIIO-GD1 requires a total investment o c.£108m in
LTS and storage assets. This investment is driven
by the requirement to replace assets which pose
a risk to network integrity and security o supply
due to age, condition or obsolescence. The asset
health assessments which we have completed
conrm that the proposed programme will delivera signicant improvement in the integrity o the
assets.
A brie outline o each area o expenditure is set out
below.
i PRI/otake upgrades
This comprises two major programmes o work
associated with low pressure gasholder removal,
described in Section 7.2.4 and capacity upgrades
or asset integrity, set out below.
We plan to upgrade the capacity o 22
installations in line with output measures set
out in Section 6. This proposal will ensure
the respective plant is utilised appropriately
and that the level o investment is balanced
with meeting the licence obligations. We have
considered alternatives to the proposed minimal
upgrade o the sites identied. The alternative
option would be to undertake ull upgrading
rebuilds o each o the 22 sites. This would
provide an over-engineered solution and would
unnecessarily increase costs by c.£13m in RIIO-
GD1. Consideration was also given to building
Local Distribution Zone storage capacity within
the NGN local transmission system rather than
securing and utilising NTS fex capacity. This
option was discarded as it would cost more than
double the chosen solution.
ii Replacement and upgrades o preheating units
A large number o preheating units on sites are
now approaching the end o their useul lie,
having been installed over the past 30 years.
The units are generally o the Water Bath Heater
(WBH) type, and are airly crude in design, with
no provision to suit the modern requirements
o eciency and environmental perormance.
Replacement o these WBH units will normally
be by the use o a package boiler and heat
exchanger, rather than a like or l ike replacement.
This will give better perormance and eciency
savings by utilising modern burner management
systems and controls.
In addition to the replacement o obsolete WBH
units, we plan to upgrade a number o existing
modular unit housings to modern standards.
The expected lie o a modular unit is about
15 years, and a number o our early sites havenow reached this age and require upgrading/
replacing.
iii Electrical and Instrumentation (E&I) site upgrades
The E&I equipment on these LTS sites varies in
complexity but the basic electrical distribution
and instrumentation hardware was installed more
than 30 years ago and is now obsolete or has
reached the end o its useul lie. Sites are now
beginning to degrade to a point where thereare potential saety risks and security o supply
implications i power was lost at the site.
iv Pipeline re-lie
A range o pipeline works is required, covering
IGEM/TD/1 inringements (buildovers), cathodic
protection, ground beds and transormer
rectiers. The drivers or this work are either
statutory requirements or the need to maintain
the eectiveness o equipment.v Offtake meter upgrades
Shippers have indicated that more security and
greater accuracy is required on otake meter
measurement as any errors on such meters can
have a signicant impact on shippers. We plan to
install new ultrasonic meters on 13 o our major
otake sites.
vi Otake gas calorimeters
The current gas calorimeters on our otakes
are reaching the end o their lie and cannot be
guaranteed to maintain the level o accuracy
required and need to be replaced.
vii Upgrade otake site metering or low
fow
In uture with bio-methane connections it is
important to understand and have accurate
minimum fow data. The current metering does
not provide low fow data and will be upgraded.

7/22/2019 Ngn Business Plan
http://slidepdf.com/reader/full/ngn-business-plan 163/224
163
viii PRI condition upgrades
This will be upgrade work ollowing compliance
inspections and the replacement o some
obsolete equipment.
ix E&I odorant system upgrade
The current odorisation equipment is reachingthe end o its operational lie at various sites and
requires replacing.
x High pressure storage strategy
Our High Pressure (HP) storage acility at Clay
Flats in Cumbria supports the network at a point
o geographic extremity and is a strategic part
o the network. The vessels were constructed in
the 1960s and are at the end o their natural lie.
By removing these ageing assets our customerswill benet rom the proposed scheme to
replace the xed storage with linepack. This has
been balanced with the otake upgrades to
maximise total investment benets. The storage
will be acilitated by otake/PRI upgrades, with
the remainder provided by linepack storage,
providing a more reliable system and improving
security o supply or customers at the extremity
o the network.
xi Install Pig traps acilities on 6” highpressure pipelines
We plan to install new acilities to inspect 6”
pipelines by using the latest advances in Pig
technology. This will give us greater accuracy in
measuring the integrity o 6” pipes with the ability
to ully optimise the use o these pipes, urther
ensuring security o supply to our customers.
xii River bank erosion
Many pipelines cross a watercourse on their
route. Rather than building an over-crossing, they
are submerged beneath the river. Changes in
climatic conditions are aecting these crossings
more regularly. These conditions are exposing
our pipelines, increasing the risk o damage and
interruption to the supply our customers. We
thereore need to invest to counteract the impact
o erosion.
xiii Compensation
NGN is experiencing increased exposure to
the loss o mineral extraction and development
compensation claims particularly due to the
development o wind arms close to our high
pressure pipelines. Our IGEM/TD/1 policy sets
out proximity guidance or such developmentthat can initiate compensation claims rom
developers and land owners. As the Government
is establishing a greener energy portolio
we estimate the number o compensation
applications will rise signicantly.
Treatment o these costs is in line with current
regulatory policy and their treatment within the
‘quarry and loss’ arrangements or the NTS.
Mitigation options must also be consideredas part o the overall scheme, including
additional block valves and impact protection.
Our assessment suggests we will make
compensation payments during RIIO-GD1 or
about 10 sites.
xiv Sleeves
To ensure LTS pipeline integrity, particularly at
vulnerable points (e.g. road crossings), we have
an ongoing plan to upgrade the integrity o thesesleeves.
xv LTS pipeline and installations
replacement
The programme includes a requirement or a
small amount o replacement o LTS pipelines
and installations. An annual baseline volume
o 0.8km refects the workload patterns and
volumes we have seen in GDPCR1.
Within the programme, as well as the relativelyshort year-on-year non-chargeable diversions
driven typically by mineral extraction, we have
also included one major non-chargeable
diversion towards the middle o the period.
We believe that there is a high probability o
signicant construction in our main conurbation
area o West Yorkshire which will require us to
carry out a long-length diversion at our cost.

7/22/2019 Ngn Business Plan
http://slidepdf.com/reader/full/ngn-business-plan 164/224
164
7.5.3 Reinforcement(mains and governors)
The table below sets out our orecast reinorcement
mains and governor investment.
Figure 7.35: RIIO-GD1 replacement governors
Figure 7.34: RIIO-GD1 reinorcement mains and governors
7.5.4 Replacement governors The table below sets out NGN’s overall orecasts
or replacement governors investment in RIIO-GD1.
A signicant number o existing governors are
deteriorating due to age prole and are becoming
obsolete. On the basis o our asset health
assessment, the RIIO-GD1 work programme will
upgrade or replace critical units in the ollowing
volumes.
• District governors - 22 per year
• Industrial or commercial governors - 3 per year
• Domestic service governors - 150 per year
£m 2009/10 prices 13/14 14/15 15/16 16/17 17/18 18/19 19/20 20/21 Total
Reinorcement mains and
governors5.4 5.4 5.3 5.3 5.1 4.9 4.9 4.7 40.9
Reductions in annual and peak demand in
GDPCR1 have not led to signicant reductions in
the requirement or local network reinorcement
to ensure security o supply during 1 in 20 winter
levels o demand. We are currently carrying out
around 66 reinorcement projects a year o thisnature. We continue to evaluate the most cost
eective solution between increasing pressures
and system reinorcement.
However, as many parts o our network are
operating at or close to the maximum operating
pressure, RIIO-GD1 will require ongoing
reinorcement o the network to meet localised
load growth even within an overall prole o alling
demand. We orecast to invest c.£40m during theperiod on localised reinorcement projects including
a number o governors, which will ensure we meet
our capacity obligations during 1 in 20 winter
demand conditions.
£m 2009/10 prices 13/14 14/15 15/16 16/17 17/18 18/19 19/20 20/21 Total
Replacement governors 1.8 1.7 1.8 1.8 1.8 1.8 1.8 1.8 14.2

7/22/2019 Ngn Business Plan
http://slidepdf.com/reader/full/ngn-business-plan 165/224
165
Figure 7.36: RIIO-GD1 net connections expenditure
£m 2009/10 prices 13/14 14/15 15/16 16/17 17/18 18/19 19/20 20/21 Total
Connections (net) 4.6 4.4 4.5 4.5 4.5 4.7 4.9 5.1 37.4
Fuel Poor connections 2.1 2.2 2.2 2.2 1.4 1.4 1.4 1.4 14.2
Total 6.7 6.6 6.7 6.7 5.9 6.1 6.3 6.5 51.6
£m 2009/10 prices 13/14 14/15 15/16 16/17 17/18 18/19 19/20 20/21 Total
Gross expenditure 12.0 12.4 12.8 13.1 13.6 14.1 14.7 15.4 108.1
Workload 7,680 7,834 8,067 8,204 8,427 8,647 8,975 9,320 67,154
Recovery rate 62.3% 63.9% 64.7% 65.5% 66.2% 66.7% 67.0% 67.0% 65.5%
Income 7.5 7.9 8.3 8.6 9.0 9.4 9.8 10.3 70.8
Net expenditure 4.6 4.4 4.5 4.5 4.5 4.7 4.9 5.1 37.2
i Connections
Over recent years there has been a decline in the
number o new gas connections due to actors
such as increased competition or new housing
connections, a general declining housing market
and poor economic conditions. Against this
background, RIIO-GD1 volumes refect a gradual
increase in connection volumes. Following a period
o orecast consolidation as the economy improves,employment levels increase and household income
improves.
Income recovery rates are orecast to improve
steadily and reach 67% by the end o the period.
Consequently, income is orecast to improve as a
proportion o total cost. As a result, net expenditure
remains relatively stable throughout the price
control period due to the improved recovery rates
eectively counter balancing the increased gross
costs generated via higher volumes.
Figure 7.37: RIIO-GD1 net connections expenditure and workload
7.5.5 Connections
We orecast a modest recovery in the number
o new connections as the national and regional
economy recovers rom recession and returns to
trend levels o growth.
Additionally, the number o Fuel Poor connections
is orecast to increase in the rst hal o the period
as NGN’s programme is extended more widely
across the region.
NGN’s orecast connections net capital expenditure
is shown below.

7/22/2019 Ngn Business Plan
http://slidepdf.com/reader/full/ngn-business-plan 166/224
166
7.5.6 Other capital expenditure
The table below gives our orecasts or other
capital expenditure during RIIO-GD1. Given the
range o dierent drivers and requirements we have
only included high summary evidence in this plan.
Further details can be ound in Appendix A11.
Figure 7.38: RIIO-GD1 total other capital expenditure
ii Fuel Poor connections
Over the GDPCR1 period, the number o Fuel Poor
connections completed by NGN has increased
signicantly as the various schemes and portolio o
services has been expanded. Recent independent
market research undertaken by the Energy Audit
Company and unded by NGN has indicated thatthere are 55,000 householders in uel poverty who
are currently o the gas grid. We are developing
plans to assist such customers where we are able.
It is orecast that the volume o work we are able to
carry out reduces at the back end o the period as
there are ewer properties where it is economic to
connect to the gas network under the current Fuel
Poor scheme.
£m 2009/10 prices 13/14 14/15 15/16 16/17 17/18 18/19 19/20 20/21 Total
Aggregated expenditure other (projects
<£0.5m)0.2 0.2 0.3 0.4 0.1 0.1 0.1 0.1 1.7
Rationalise mains and governors to
support storage strategy0.6 0.7 0.8 0.9 1.1 1.2 1.3 1.4 8.0
Gascoseeker replacement with CO
detection capability1.2 1.2 0.0 0.0 0.0 0.0 0.0 0.0 2.4
Over crossings 0.3 0.3 0.3 0.3 0.3 0.3 0.3 0.3 2.4
Remote pressure monitoring and control 0.7 2.6 2.5 2.5 0.0 0.0 0.0 0.0 8.4
Replace network loggers 0.7 0.7 0.7 0.0 0.0 0.0 0.0 0.0 2.2
Replace ancillary obsolete equipment 1.2 1.2 1.2 1.2 1.2 1.2 1.2 1.2 9.9
Buildings / civils rebuild and
reurbishments1.9 2.4 1.9 2.4 1.9 1.8 1.6 1.6 15.4
Gas treatment 0.1 0.1 0.1 0.1 0.1 0.1 0.1 0.1 0.8
NDM dataloggers 0.3 0.0 0.0 0.0 0.0 0.0 0.5 0.5 1.3
Site security 2.0 5.1 0.9 0.9 0.9 0.9 0.9 0.9 12.8
System control - otake reorm/alarm and
demand management0.0 0.8 0.6 1.0 0.8 0.8 0.8 0.6 5.3
Telemetery hilltop/satellite system 0.0 0.0 0.5 0.5 0.2 0.1 0.0 0.0 1.4
Furniture and ttings 0.1 0.1 0.1 0.1 0.1 0.1 0.1 0.1 0.8
Plant and equipment 0.6 0.6 0.6 0.6 0.6 0.6 0.6 0.6 4.8
Auxiliary equipment 0.3 0.3 0.3 0.3 0.3 0.3 0.3 0.3 2.1
Environmental land remediation 1.6 1.6 1.6 1.6 1.6 1.6 1.6 1.6 12.5
Total 12.0 18.0 12.6 12.8 9.2 9.2 9.4 9.3 92.4

7/22/2019 Ngn Business Plan
http://slidepdf.com/reader/full/ngn-business-plan 167/224
167
The RIIO-GD1 period requires a total investment o
c.£92m in Other Capex. This category includes a
very wide range o schemes with diering drivers
and associated outputs, providing signicant
benets in environment, saety, reliability and
security o supply to our customers.
A brie outline o each area o expenditure is set outbelow.
i Buildings/civils
A large number o network sites were
constructed in the 1960s, 1970s and 1980s and
now require substantial civil works to maintain
them in a t or purpose condition. In some
cases the site inrastructure has deteriorated and
will require replacement during RIIO-GD1; 195
o which are PRS and otake sites with higherlevels o equipment and additional buildings,
such as electric, telemetry and odorant housings.
In addition, many o the structures also contain
asbestos which requires removal and disposal by
specialist contractors.
ii Installation and upgrading of networksite security systems
The network has a substantial number o sites in
a large geographical area including both urbanand rural locations. Due to this spread o assets,
locations are under varying levels o threat rom
illegal activities. I people succeed in breaching
security measures they are at risk o injuring
themselves, but also pose a risk to the public
at large and a very real threat to the supply
and control o the gas distribution system. The
increased value o metals has resulted in random
and opportune break-ins increasing across all
industries. To deter this, the business will investin ways to prevent such attacks on our assets.
Pannal and Bishop Auckland have been listed
and recognised as category three locations
by the Centre or the Protection o National
Inrastructure (CPNI) and as such all under
the remit o the Department or Energy and
Climate Change (DECC), as it looks at improving
increasing security and deterrents to possible
terrorist attack. These sites need signicant
security upgrades which will include the
installation o passive detection devices and
surveillance equipment. This will also lead to
increased costs or monitoring and maintenance.
Only the Pannal site has been included in this
plan as the Bishop Auckland site is within an
NTS site operated by National Grid.
iii Rationalise mains and governors to
support gasholder strategy As part o the work to remove low pressure
gasholders we will carry out work to relocate
mains and governors associated with such sites.
iv Remote pressure monitoring and control
NGN’s low and medium pressure regulator sites
and network modelling points are controlled by a
series o systems which control the low pressure
distribution network, provide alarm monitoring or
pressure excursions, capture pressure recording
and provide vital data or monitoring the network.
During GDPCR1 we have installed a new
system that centralises data rom all pressure
control and monitoring locations without the
need or personnel to return to a depot. This
new pressure monitoring system provides NGN
with an opportunity to adopt a new pressure
management and control strategy. This strategy
moves rom the control being undertaken on siteby an operative to one o controlling pressure
settings remotely by a centralised team. This will
result in a more dynamic and proactive response
to matching supply needs based on short term
orecasting projections.
Currently pressures are controlled via a xed
telephone line to around 300 low pressure
regulator stations. More than 1,600 sites require
pressure to be adjusted by an operative visiting
site. Fixed telephone lines are expensive to
install and maintain, mobile technology oers
a more cost eective solution to controlling
regulators. During RIIO-GD1 we plan to invest in
this technology so that all district governors are
remotely monitored and controlled using mobile
technology.
7/22/2019 Ngn Business Plan
http://slidepdf.com/reader/full/ngn-business-plan 168/224
168
v Replace ancillary obsolete equipment
We have a number o plans to replace and
upgrade equipment, including preheating pilots
and regulator control cabinets.
vi Offtake reform/alarm management/demand management
Investment will be required in RIIO-GD1 in
operational support systems to enable more
accurate reporting o alarm activity, manage any
potential risks associated with otake capacity
overrun charges, manage the eective use o
interruption, and update the existing Time to Fail
programme which orecasts when there would
be insucient gas to meet demand on any
given day.
vii Plant and equipment
This includes expenditure on mobile assets
and tools used to support operational activities,
including water pumps and metering gauges.
viii Gascoseeker replacement
The existing gascoseekers used by our
emergency workorce are due or replacement
early in the RIIO-GD1 period. As set out
in Section 6, we plan to replace them with
equipment which incorporates the capability
to undertake CO detection alongside natural
gas. There was strong eedback rom our
stakeholders that our emergency sta should
have this capability. We are currently trialling
suitable equipment.
ix Overcrossings
This covers upgrading o support structures o
pipelines and mains to ensure security o supply
(e.g. bridge supports).
x Replace network loggers
We currently use network validation loggers,
which are moved rom site to site to deliver
the requirements o the validation process. We
plan to purchase additional loggers to provide
equipment at all sites, to reduce costs and also
improve compliance and integrity.
xi Telemetry /hilltop/ satellite system
NGN owns ve hilltop satellite sites which
require upgrades to ensure we maintain secure
communications across network assets.
xii Non-daily metered (NDM) dataloggers
All NDM dataloggers are anticipated to be obsoleteby the end o RIIO-GD1 and will be replaced.
xiii Gas treatment
This investment is or an additional series o
condition treatments designed to reduce leakage
rom gas mains.
xiv Furniture and ttings
A small amount o investment is made every
year to replace urniture and ttings at a range o
operational and non-operational sites.
xv Auxiliary equipment
This is the upgrading o auxiliary equipment
to ensure integrity o site assets and prevent
derioration rom corrosion.
xvi High rise building valves
We plan to install live saety valves in high rise
buildings where these are currently not installed.
xvii Sleeves (mains)
This will ensure the integrity o distribution
mains particularly at vulnerable points (e.g. road
crossings). We have an ongoing programme to
upgrade the integrity o these sleeves.
xviii Environment land remediation
We are committed to the protection and
enhancement o the environment, the protection
o land rom uture pollution and addressingthe past legacy o contamination which has
arisen rom historical activities where this is
causing unacceptable impacts on health or the
environment.
Our contaminated land strategy is to manage
the risk associated with the statutory liability
o the portolio o 114 sites with known historic
contamination. The land quality ramework
considers protection and enhancement o land
quality with appropriate action to deal with

7/22/2019 Ngn Business Plan
http://slidepdf.com/reader/full/ngn-business-plan 169/224
169
Figure 7.39: RIIO-GD1 operational vehicle Capex
historical contamination to the extent that it may
aect health or the environment.
Since the ormation o NGN in 2005, we have
taken a responsible, though principally reactive,
approach to managing the land portolio. We work
with regulators where a potential unacceptable
impact on human health or the environment isidentied and pursue voluntary action to control
and eliminate such impacts.
We have taken a pragmatic approach to the level
o required expenditure in RIIO-GD1 to manage the
contaminated land portolio and only orecasting
to undertake statutory remediation as outlined in
Section 6.
Expenditure identied or RIIO-GD1 is c.£12.5m.
• c.£8.5m or the statutory remediation o high and
medium/high risk environmentally sensitive sites.
• c.£2m or statutory remediation o any lower risk sites identied and required by regulators.
• c.£1m or monitoring.
• c.£1m or decommissioning/re-commissioning o
plant associated with remediation projects.
£m 2009/10 prices 13/14 14/15 15/16 16/17 17/18 18/19 19/20 20/21 Total
Operational vehicles 3.4 2.7 5.6 0.1 0.8 2.3 3.0 2.4 20.3
7.5.7 Vehicles
The table below sets out capital expenditure
on vehicles. We are planning to invest c.£20m
in renewing our operational feet, based on age
related requirements, and take into account trade-
os relating to maintenance or replacement.
NGN operates more than 500 vehicles and
this level will be maintained across the period.
Operational eciencies will be delivered by this
programme with targeted improvements in uel
eciency and reduced carbon emissions, which
also lower vehicle licensing rates. We also plan toincrease the level o vehicles with 4x4 capability
within the feet in light o recent severe winters.

7/22/2019 Ngn Business Plan
http://slidepdf.com/reader/full/ngn-business-plan 170/224
170
Figure 7.40: IS and telecoms expenditure
7.5.8 IS and telecoms
The table below sets our IS and telecoms capital
expenditure or RIIO-GD1. We are planning to
invest c.£63m in our IS and telecoms inrastructure
and systems.
£m 2009/10 prices 13/14 14/15 15/16 16/17 17/18 18/19 19/20 20/21 Total
IS and telecoms 8.7 6.7 6.3 13.6 6.5 5.6 7.0 8.2 62.8
Since 2005 we have developed a series o
solutions to address commercial issues driven by
external priorities (e.g. to exit rom National Grid
systems in a timely manner). This has resulted in
tactical solutions not delivering in all cases the most
eective and enduring benet. Recognising this,
a strategy was developed and agreed in 2010, in
eect a blueprint or consolidation and virtualisation
o our IS assets.
This provides a more holistic approach to
inrastructure, applications and support, which
will bring improved business continuity and
service management. It will also support more
ecient processes through greater understanding
o business and customer needs, mappedon to improved technology platorms to drive
eciency and innovation. The IS investment
programme refects the necessary expenditure
to maintain and upgrade this critical element o
NGN’s inrastructure, in line with best practice
around upgrades o desktop, inrastructure and
applications.
In general, desktop and server based inrastructure
warranty periods are three and ve years
respectively. Whilst NGN evaluates the cost o maintaining and extending warranties on hardware
and associated support and maintenance (S&M)
contracts versus the productivity and cost ree
operation o new equipment, we largely look to
operate hardware to its optimum level in line with
manuacturers warranties. Further, Microsot
conrm the optimum desktop reresh cycle as three
years whilst server based inrastructure optimum
levels are set between ve and six years.
RIIO-GD1 will see the evolution o our IS strategy
which will play a signicant supporting and
enabling role in NGN being better able to address
the key challenges it will ace over the period and
beyond. The planned investment programme is
ocused on delivering eight key objectives.
• Consolidation o services – applications and data
centres.
• Improved support model - simplication o
helpdesks.
• Hardware upgrades - a structured approach to
the replacement o assets.
• Innovation - support the NGN innovation strategy
and the initiatives developed.
• Application upgrades - a more proactiveapproach to regular upgrade o application.
• Security - meet increased requirements or
systems and data security.
• Green IT - processes and hardware are in place
to minimise environmental impact.
• Smart networks - ensure we can eectively
utilise increased data in operating and managing
our network.
The investment programme will ocus on three key
areas as discussed below.

7/22/2019 Ngn Business Plan
http://slidepdf.com/reader/full/ngn-business-plan 171/224
171
Figure 7.41: RIIO-GD1 IS asset investment
This element o the programme will implementbest practice across hardware reresh cycles and
maintain our inrastructure capabilities. Best value
will be ensured via a competitive procurement
process with ve established ramework partners.
Assurance will be provided via external validation o
changes and upgrades through our independent
technical architects TSG. Key schemes within the
programme include the ollowing.
• Increase in the Tough Book estate by 200machines to allow the management and
despatch o work directly to replacement teams
and contractors. This will bring greater eciency,
visibility and perormance monitoring capability,
and supports a standardised approach to work
management.
• Whilst the norm or laptop replacement wouldbe three years, given the nature and use o eld
devices we will replace Tough Books every ve
years. This provides better value or customers
and avoids problems with equipment moving out
o manuacturers’ support.
• Desktop hardware will be rereshed on a three
year cycle to ensure capability is maintained.
The exception will be equipment that is in use
24/7, which will be replaced or rolled out morerequently.
• Reresh inrastructure on a ve year cycle or
all aspects o the business including system
operations, corporate and connections.
£m 2009/10 prices 13/14 14/15 15/16 16/17 17/18 18/19 19/20 20/21 Total
IS asset 4.1 1.0 1.9 8.0 1.6 1.0 1.8 2.1 21.5
i Assets
£m 2009/10 prices 13/14 14/15 15/16 16/17 17/18 18/19 19/20 20/21 Total
Applications and data 4.2 5.3 4.0 4.3 4.5 3.3 4.6 4.5 35.0
ii Applications and data
This element o the programme will ensure
maximum eciency is maintained rom key
applications with upgrades generally developed
to bring enhanced capability and process
improvement. Key schemes within the programme
include the ollowing.
• A phased approach to upgrading ront oce,
back oce and system control applications. This
will minimises business change, bring improved
service and provides a greater continuity o
service.
• Processes improvements to deliver operational
and environmental improvements.
• Ongoing and sustained review o integrity o our
systems.
• Regular review and validation o data harvesting,retention and usage to ensure compliance.
Figure 7.42: RIIO-GD1 applications and data
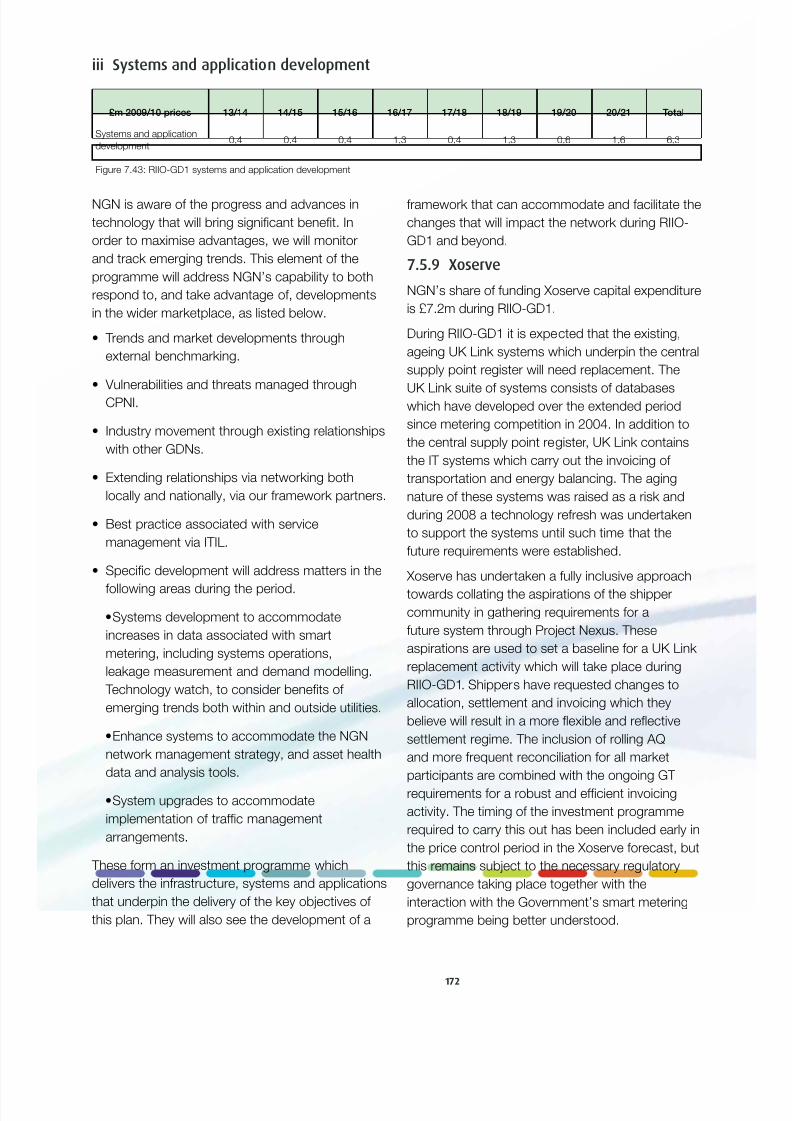
7/22/2019 Ngn Business Plan
http://slidepdf.com/reader/full/ngn-business-plan 172/224
172
NGN is aware o the progress and advances in
technology that will bring signicant benet. In
order to maximise advantages, we will monitor
and track emerging trends. This element o the
programme will address NGN’s capability to both
respond to, and take advantage o, developments
in the wider marketplace, as listed below.
• Trends and market developments through
external benchmarking.
• Vulnerabilities and threats managed through
CPNI.
• Industry movement through existing relationships
with other GDNs.
• Extending relationships via networking both
locally and nationally, via our ramework partners.
• Best practice associated with service
management via ITIL.
• Specic development will address matters in the
ollowing areas during the period.
•Systems development to accommodate
increases in data associated with smart
metering, including systems operations,
leakage measurement and demand modelling.
Technology watch, to consider benets o
emerging trends both within and outside utilities.
•Enhance systems to accommodate the NGN
network management strategy, and asset health
data and analysis tools.
•System upgrades to accommodate
implementation o trac management
arrangements.
These orm an investment programme which
delivers the inrastructure, systems and applications
that underpin the delivery o the key objectives o
this plan. They will also see the development o a
ramework that can accommodate and acilitate the
changes that will impact the network during RIIO-
GD1 and beyond.
7.5.9 Xoserve
NGN’s share o unding Xoserve capital expenditure
is £7.2m during RIIO-GD1.
During RIIO-GD1 it is expected that the existing,
ageing UK Link systems which underpin the centralsupply point register will need replacement. The
UK Link suite o systems consists o databases
which have developed over the extended period
since metering competition in 2004. In addition to
the central supply point register, UK Link contains
the IT systems which carry out the invoicing o
transportation and energy balancing. The aging
nature o these systems was raised as a risk and
during 2008 a technology reresh was undertaken
to support the systems until such time that theuture requirements were established.
Xoserve has undertaken a ully inclusive approach
towards collating the aspirations o the shipper
community in gathering requirements or a
uture system through Project Nexus. These
aspirations are used to set a baseline or a UK Link
replacement activity which will take place during
RIIO-GD1. Shippers have requested changes to
allocation, settlement and invoicing which they
believe will result in a more fexible and refective
settlement regime. The inclusion o rolling AQ
and more requent reconciliation or all market
participants are combined with the ongoing GT
requirements or a robust and ecient invoicing
activity. The timing o the investment programme
required to carry this out has been included early in
the price control period in the Xoserve orecast, but
this remains subject to the necessary regulatory
governance taking place together with the
interaction with the Government’s smart metering
programme being better understood.
iii Systems and application development
£m 2009/10 prices 13/14 14/15 15/16 16/17 17/18 18/19 19/20 20/21 Total
Systems and application
development0.4 0.4 0.4 1.3 0.4 1.3 0.6 1.6 6.3
Figure 7.43: RIIO-GD1 systems and application development

7/22/2019 Ngn Business Plan
http://slidepdf.com/reader/full/ngn-business-plan 173/224
173
This plan includes Xoserve’s estimated costs
o delivery o the initial requirements or smart
metering. It is widely accepted that the Data
Communications Company (DCC) will not hold
extensive databases and that the access control
that will be required to ensure data accuracy and
privacy will be achieved by interacting with theexisting supply point registers or both electricity
and gas. The exact scope and timing o this is
currently unknown and Xoserve has engaged with
the DECC programme to ensure they are ready to
undertake a capital programme to acilitate DCC
access to data. The costs o this (£17.6m across all
GDNs) is consistent with the Xoserve response to
the DECC inormation requests.
Other investment activity that NGN will contribute to
in the Xoserve plan relates to the reresh o non UK Link systems over the period in line with the policy
o planning or technology rereshes to take place
every ve years and the costs o inrastructure
upgrades that will be required to support the wider
IS estate.
Further details can be ound in the Xoserve
business plan submission.

7/22/2019 Ngn Business Plan
http://slidepdf.com/reader/full/ngn-business-plan 174/224
174
Figure 7.46: RIIO-GD1 Opex plan
Figure 7.44: RIIO-GD1 Opex orecast requirements
7.6 Operating expenditure(Opex)
NGN has consistently been a rontier perormer on
operating costs.
NGN will seek to maintain this rontier level o
perormance throughout RIIO-GD1. We recognisethis will involve seeking urther eciencies and
introducing innovative ways o delivering the
outputs and service levels that our customers and
stakeholders expect. Nevertheless the RIIO-GD1
period will be impacted by a number o actors
that will increase the overall level o operating
expenditure.
Our orecast Opex costs or the RIIO-GD1 period
are shown in the table below.
£m 2009/10 prices 13/14 14/15 15/16 16/17 17/18 18/19 19/20 20/21 Total
Controllable Opex
Work management 16.0 16.1 16.2 16.3 16.5 16.5 16.5 16.5 130.6
Emergency 9.6 12.7 12.6 12.4 12.4 12.4 9.7 9.9 91.6
Repairs 17.8 18.1 18.0 18.1 17.9 18.0 18.0 17.9 143.9
Maintenance 9.6 9.6 9.7 9.3 9.3 9.2 9.2 9.2 75.1
Other direct activities (including Xoserve) 12.4 12.7 13.3 13.8 13.3 13.1 13.7 13.4 105.6
Total direct activities 65.4 69.2 70.0 70.0 69.3 69.2 67.1 66.9 546.8
Business support 18.0 20.2 20.5 20.4 20.1 19.8 19.4 19.0 157.5
IT and Telecoms 7.1 7.0 7.1 7.2 7.3 7.4 7.4 7.5 57.9
Property management 1.8 1.8 1.8 1.8 1.8 1.8 1.8 1.8 14.1
Total indirect activities 26.8 29.0 29.4 29.4 29.2 28.9 28.6 28.3 229.6
Total controllable Opex 92.1 98.2 99.2 99.4 98.5 98.1 95.7 95.2 776.3
Non-controllable Opex
Shrinkage 9.0 8.6 8.3 8.0 7.8 7.6 7.4 7.2 63.9
Network rates 30.1 30.1 30.1 30.1 30.1 30.1 30.1 30.1 240.5
Pensions decit 2.0 2.0 2.0 2.0 2.0 2.0 2.0 2.0 16.0
NTS pensions 4.3 4.3 4.3 4.3 4.3 4.3 4.3 4.3 34.1
Otake 10.2 10.2 10.2 10.2 10.2 10.2 10.2 10.2 81.6
PPF levy 0.5 0.5 0.5 0.5 0.5 0.5 0.5 0.5 4.0
Ogem licence and Joint Oce 1.1 1.1 1.1 1.1 1.1 1.1 1.1 1.1 8.8
Total non-controllable Opex 57.2 56.8 56.5 56.2 56.0 55.8 55.6 55.4 448.9
Total Opex 149.3 155.0 155.7 155.6 154.5 153.9 151.3 150.6 1,225.2

7/22/2019 Ngn Business Plan
http://slidepdf.com/reader/full/ngn-business-plan 175/224
175
Our actual and orecast Opex costs during
GDPCR1 are shown in the table below.
Figure 7.45: Current GDPCR1 Opex costs
£m 2009/10 prices 08/09 09/10 10/11 11/12 12/13 Total
Controllable Opex
Work management 18.3 16.6 15.9 15.9 15.8 82.5
Emergency 9.2 8.9 8.7 9.1 9.5 45.4
Repair 15.2 15.1 15.8 16.8 17.8 80.7
Maintenance 9.1 8.0 7.8 9.7 9.1 43.7
Other direct 5.4 5.2 5.0 5.6 7.4 28.6
Total Direct 57.2 53.8 53.2 57.1 59.6 280.9
Business support 10.0 10.5 11.0 13.0 15.0 59.5
IS and telecoms 6.3 5.7 5.1 6.0 7.0 30.1
Property 1.8 1.6 1.6 1.7 1.8 8.5
Total indirect 18.1 17.8 20.7 23.8 24.8 98.1
Total controllable Opex 75.3 71.6 70.9 77.8 83.4 379.0
Non-controllable Opex
Shrinkage 9.0 4.9 7.6 9.0 8.9 39.4
Network rates 33.2 34.7 31.4 30.4 30.1 159.8
Pensions decit 3.8 4.6 4.6 5.0 5.0 23
NTS pensions 3.1 3.1 3.0 3.0 4.3 16.5
Otake 0.0 0.0 0.0 0.0 5.0 5.0
PPF levy 0.0 0.0 0.5 0.5 0.5 1.5
Ogem licence and Joint Oce 1.4 1.1 1.0 1.1 1.1 5.7
Non-controllable Opex 50.5 48.4 48.1 49 54.9 250.9
Total Opex 125.8 120 119 127.2 139.3 631.3
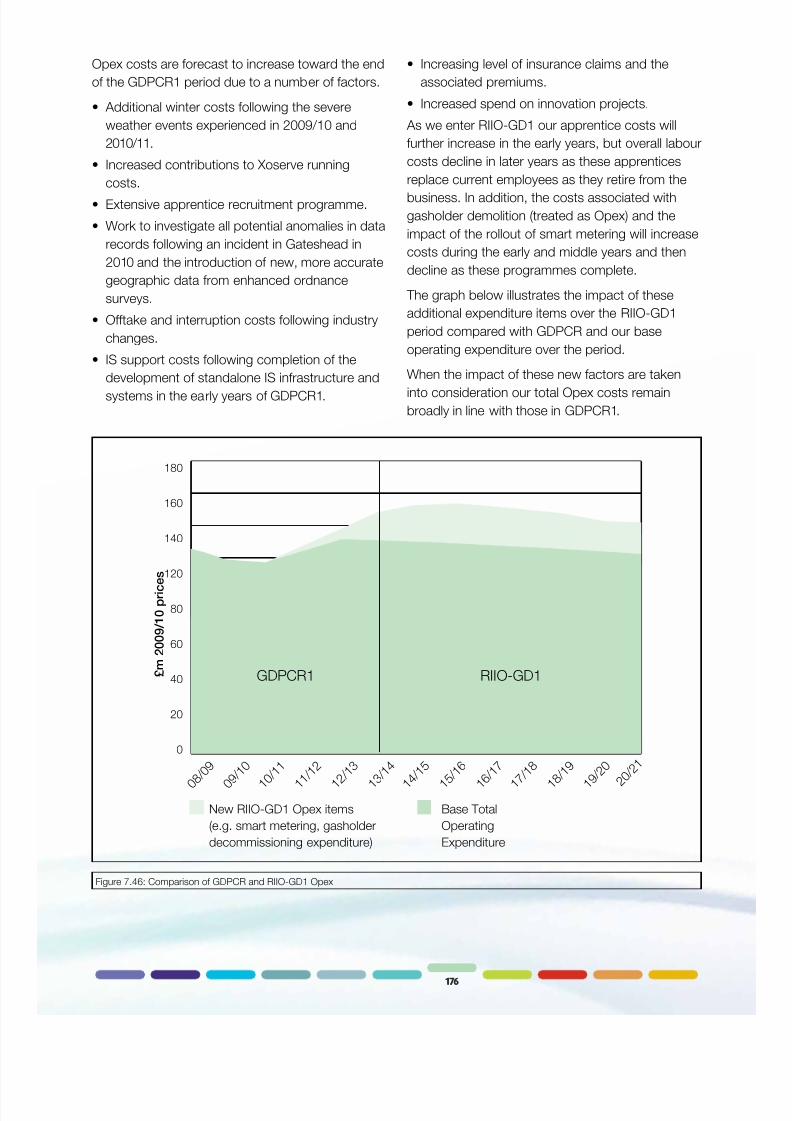
7/22/2019 Ngn Business Plan
http://slidepdf.com/reader/full/ngn-business-plan 176/224
176176
Opex costs are orecast to increase toward the end
o the GDPCR1 period due to a number o actors.
• Additional winter costs ollowing the severe
weather events experienced in 2009/10 and
2010/11.
• Increased contributions to Xoserve running
costs.
• Extensive apprentice recruitment programme.
• Work to investigate all potential anomalies in data
records ollowing an incident in Gateshead in
2010 and the introduction o new, more accurate
geographic data rom enhanced ordnance
surveys.
• Otake and interruption costs ollowing industry
changes.
• IS support costs ollowing completion o thedevelopment o standalone IS inrastructure and
systems in the early years o GDPCR1.
• Increasing level o insurance claims and the
associated premiums.
• Increased spend on innovation projects.
As we enter RIIO-GD1 our apprentice costs will
urther increase in the early years, but overall labour
costs decline in later years as these apprentices
replace current employees as they retire rom thebusiness. In addition, the costs associated with
gasholder demolition (treated as Opex) and the
impact o the rollout o smart metering will increase
costs during the early and middle years and then
decline as these programmes complete.
The graph below illustrates the impact o these
additional expenditure items over the RIIO-GD1
period compared with GDPCR and our base
operating expenditure over the period.
When the impact o these new actors are taken
into consideration our total Opex costs remain
broadly in line with those in GDPCR1.
Figure 7.46: Comparison o GDPCR and RIIO-GD1 Opex
0 8 / 0 9
0 9 / 1 0
1 0 / 1 1
1 1 / 1 2
1 2 / 1 3
1 3 / 1 4
1 9 / 2 0
1 4 / 1 5
2 0 / 2 1
1 5 / 1 6
1 6 / 1 7
1 8 / 1 9
1 7 / 1 8
New RIIO-GD1 Opex items
(e.g. smart metering, gasholder
decommissioning expenditure)
Base Total
Operating
Expenditure
GDPCR1 RIIO-GD1 £ m 2
0 0 9 / 1 0 p r i c e s
180
160
140
120
80
60
40
20
0

7/22/2019 Ngn Business Plan
http://slidepdf.com/reader/full/ngn-business-plan 177/224
177177
7.6.1 Controllable Opex
The table below shows the detailed breakdown o
our controllable Opex orecasts.
Figure 7.47: RIIO-GD1 controllable Opex
£m 2009/10 prices 13/14 14/15 15/16 16/17 17/18 18/19 19/20 20/21 Total
Controllable Opex
Work management total 16.0 16.1 16.2 16.3 16.5 16.5 16.5 16.5 130.6
Emergency 9.6 12.7 12.6 12.4 12.4 12.4 9.7 9.9 91.6
Repairs 17.8 18.1 18.0 18.1 17.9 18.0 18.0 17.9 143.9
Maintenance 9.6 9.6 9.7 9.3 9.3 9.2 9.2 9.2 75.1
Other direct activities (including Xoserve) 12.4 12.7 13.3 13.8 13.3 13.1 13.7 13.4 105.6
Total direct activities 65.4 69.2 70.0 70.0 69.3 69.2 67.1 66.9 546.8
R&D 3.0 3.0 3.0 3.0 3.0 3.0 3.0 3.0 24.0
IT and telecoms 7.1 7.0 7.1 7.2 7.3 7.4 7.4 7.5 57.9
Property management 1.8 1.8 1.8 1.8 1.8 1.8 1.8 1.8 14.1
Training and apprentices 3.5 5.5 5.6 5.5 5.3 4.9 4.6 4.2 39.2
Insurance 4.2 4.4 4.6 4.5 4.5 4.5 4.4 4.4 35.4
HR 0.5 0.5 0.5 0.5 0.5 0.5 0.5 0.5 4.3
Finance, audit and regulation 2.8 2.8 2.8 2.8 2.8 2.9 2.9 2.8 22.6
Procurement 0.2 0.2 0.2 0.2 0.2 0.2 0.2 0.2 1.7
CEO 3.7 3.8 3.8 3.8 3.8 3.8 3.8 3.9 30.4
Total indirect activities 26.8 29.0 29.4 29.4 29.2 28.9 28.6 28.3 229.6
Total controllable Opex 92.1 98.2 99.2 99.4 98.5 98.1 95.7 95.2 776.3
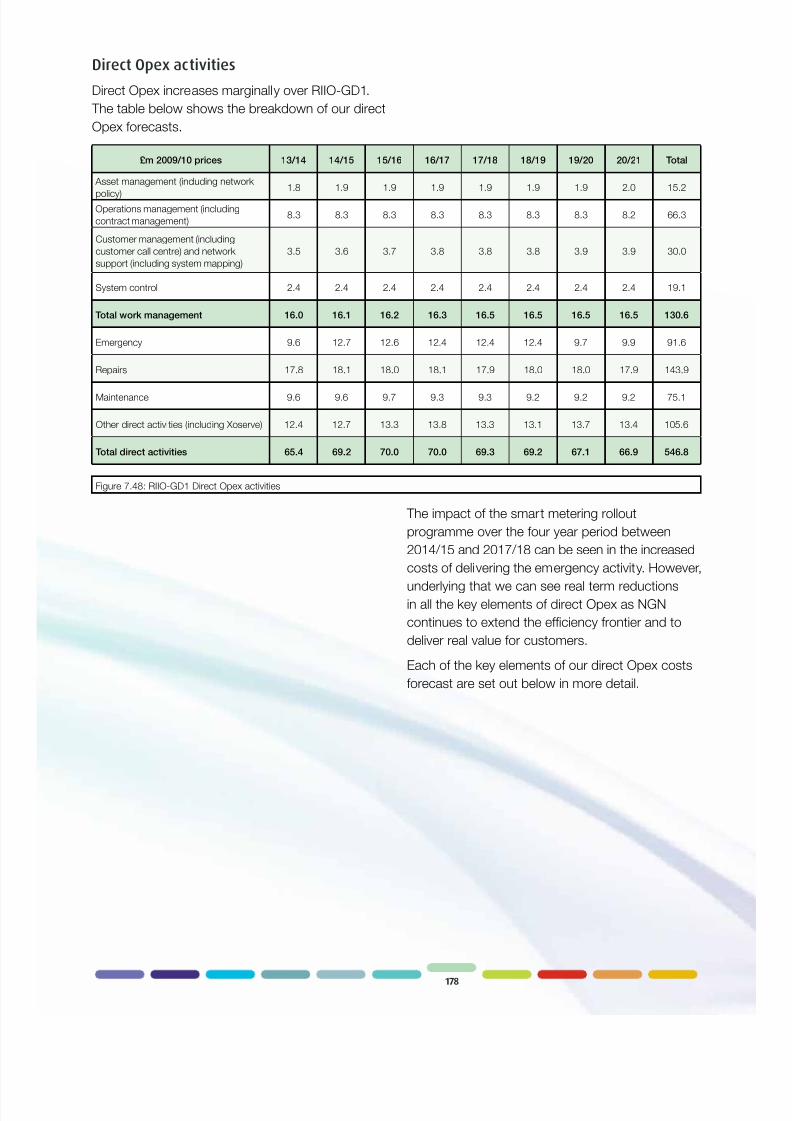
7/22/2019 Ngn Business Plan
http://slidepdf.com/reader/full/ngn-business-plan 178/224
178
Figure 7.48: RIIO-GD1 Direct Opex activities
Direct Opex activities
Direct Opex increases marginally over RIIO-GD1.
The table below shows the breakdown o our direct
Opex orecasts.
£m 2009/10 prices 13/14 14/15 15/16 16/17 17/18 18/19 19/20 20/21 Total
Asset management (including network policy)
1.8 1.9 1.9 1.9 1.9 1.9 1.9 2.0 15.2
Operations management (including
contract management)8.3 8.3 8.3 8.3 8.3 8.3 8.3 8.2 66.3
Customer management (including
customer call centre) and network
support (including system mapping)
3.5 3.6 3.7 3.8 3.8 3.8 3.9 3.9 30.0
System control 2.4 2.4 2.4 2.4 2.4 2.4 2.4 2.4 19.1
Total work management 16.0 16.1 16.2 16.3 16.5 16.5 16.5 16.5 130.6
Emergency 9.6 12.7 12.6 12.4 12.4 12.4 9.7 9.9 91.6
Repairs 17.8 18.1 18.0 18.1 17.9 18.0 18.0 17.9 143.9
Maintenance 9.6 9.6 9.7 9.3 9.3 9.2 9.2 9.2 75.1
Other direct activities (including Xoserve) 12.4 12.7 13.3 13.8 13.3 13.1 13.7 13.4 105.6
Total direct activities 65.4 69.2 70.0 70.0 69.3 69.2 67.1 66.9 546.8
The impact o the smart metering rollout
programme over the our year period between2014/15 and 2017/18 can be seen in the increased
costs o delivering the emergency activity. However,
underlying that we can see real term reductions
in all the key elements o direct Opex as NGN
continues to extend the eciency rontier and to
deliver real value or customers.
Each o the key elements o our direct Opex costs
orecast are set out below in more detail.

7/22/2019 Ngn Business Plan
http://slidepdf.com/reader/full/ngn-business-plan 179/224
179
Figure 7.49: RIIO-GD1 work management orecast
i Work management
Work management includes all asset management
activities within NGN including our system control
centre. Our orecast work management costs are
detailed below.
£m 2009/10 prices 13/14 14/15 15/16 16/17 17/18 18/19 19/20 20/21 Total
Asset management (including network
policy)1.8 1.9 1.9 1.9 1.9 1.9 1.9 2.0 15.2
Operations management (including
contract management)8.3 8.3 8.3 8.3 8.3 8.3 8.3 8.2 66.3
Customer management (including
customer call centre) and network
support (including system mapping)
3.5 3.6 3.7 3.8 3.8 3.8 3.9 3.9 30.0
System control 2.4 2.4 2.4 2.4 2.4 2.4 2.4 2.4 19.1
Total work management 16.0 16.1 16.2 16.3 16.5 16.5 16.5 16.5 130.6
Our Asset Risk Management unction is now a
central ocus or delivery o our TNM approach. We
do not orecast any signicant changes to the cost
o this activity during RIIO-GD1.
ii Emergency
The emergency unction handles our rst line
response to any reports o gas escapes or loss
o gas supply. Our orecast emergency costs andworkload are shown below. Details o our smart
metering cost orecast can be ound in Section
7.2.6.
£m 2009/10 prices 13/14 14/15 15/16 16/17 17/18 18/19 19/20 20/21 Total
Baseline costs 9.6 9.7 9.6 9.4 9.4 9.4 9.6 9.6 76.6
Smart metering costs 0.0 3.0 3.0 3.0 3.0 3.0 0.0 0.0 15.0
Total emergency costs 9.6 12.7 12.6 12.4 12.4 12.4 9.7 9.9 91.6
Publicly reported gas escape
(000s)120 119 118 116 115 114 113 112 927
Figure 7.50: RIIO-GD1 emergency cost and workload orecasts

7/22/2019 Ngn Business Plan
http://slidepdf.com/reader/full/ngn-business-plan 180/224
180
The emergency workload is orecast overall to
reduce by approximately 1% per year as our
investment expenditure targets those areas o high
escapes and leakage. However, we anticipate that
increased awareness o gas saety and in particular
heightened awareness o CO will partly oset the
reductions rom our investment expenditure leadingto increased volumes o work.
Our emergency sta will be equipped with new
‘gascoseekers’ to detect CO as well as natural
gas when undertaking emergency work. This will
increase the amount o work carried out but we
have not increased our cost orecasts as we will
manage this impact through productivity savings.
NGN has experienced two very severe winters,
in 2009/10 and 2010/11, which signicantly
impacted the peak emergency daily workloads
and consequently our perormance against the
emergency response standards. In 2010/11 NGN
spent more than £2.5m in additional emergency
and repair costs to deal with a record peak o
emergency calls which coincided with the worst
weather conditions experienced in parts o the
region or over 100 years.
We have not based our uture orecast emergency
and repair costs on this very exceptional event buton the costs experienced in 2009/10 which was
a more severe winter than had been experienced
or the preceding ew years with some additional
targeted contingencies. These include additional
contractor emergency and repair sta and hire o
additional 4x4 vehicles.
The commercial feet replacement programme
identied in our investment plans will deliver
additional cost savings over the period. Running
and operating costs will reduce, along with more
ecient uel consumption levels. Fuel costs are
assumed to continue to increase above RPI.
iii Repair
The repair activity carries out all work to
permanently x any gas escapes rom our network.
Our orecast costs and workload are shown below.
Figure 7.51: RIIO-GD1 repair cost and workload orecasts
£m 2009/10 prices 13/14 14/15 15/16 16/17 17/18 18/19 19/20 20/21 Total
Total repair costs 17.8 18.1 18.0 18.1 17.9 18.0 18.0 17.9 143.9
Mains repairs 14,000 13,860 13,721 13,584 13,448 13,314 13,181 13,049 108,157
Total number o repairs 32,000 31,680 31,363 31,050 30,739 30,432 30,127 29,826 247,217

7/22/2019 Ngn Business Plan
http://slidepdf.com/reader/full/ngn-business-plan 181/224
181
The number o repairs is orecast to all by around
1% per year in RIIO-GD1 as the Repex programme
and our TNM approach targets those areas o high
levels o escapes.
Current repair team numbers are maintained
throughout the plan. However, through recruitment
the opportunity will be taken to better matchworkload with available resources i.e. to make sure
we have the right people in the right place at the
right time. The analysis set out earlier demonstrates
the need or more resources in the southern part o
our region.
The repair costs orecast associated with winter
have been derived on the same basis as the
emergency costs described above.
As with emergency, the replacement o the
commercial feet will provide reduced running and
operating costs within the repair activity as reduced
levels o maintenance and servicing along withmore ecient uel consumption levels are attained.
Fuel costs are assumed to continue to increase
above RPI.
iv Maintenance
The maintenance activity includes all the activities
associated with ensuring that all our assets operate
eciently. Our orecast costs are detailed below.
£m 2009/10 prices 13/14 14/15 15/16 16/17 17/18 18/19 19/20 20/21 Total
Total maintenance cost 9.6 9.6 9.7 9.3 9.3 9.2 9.2 9.2 75.1
Our TNM approach, with targeted investment,will generally reduce maintenance requirements
and reduce operating costs. For example, as we
remove the low pressure gasholders rom the
network there will no longer be a need to maintain
those assets.
However, under the revised Repex programme
NGN will use maintenance measures to gather data
on the condition o non-mandated tier two and
tier three iron mains and manage the overall saety
risks rom such pipes. For tier two pipes this will
include the ollowing.
• Response to public reports o ‘smell o gas’,
repair o escapes where ound and replacement
o pipes ound to be in poor condition.
• MRPS survey o all iron pipes to determine their
calculated risk score.
• Winter and trigger surveys o iron pipes (o
any diameter) scoring above the appropriate
thresholds, plus repair o escapes where ound
and replacement o pipes in poor condition.
• Local surveys ollowing ductile iron barrel or bolt
corrosion ailures, repair o escapes where ound
and replacement o pipes ound to be in poor
condition.
For tier three pipes this will include the ollowing.
• All iron pipes to have a leakage survey every
12 months, with repair o escapes where ound
and replacement o pipes ound to be in poorcondition.
• All ductile iron pipes to have an interim six-
monthly leakage survey, with repair o escapes
where ound and replacement o pipes ound to
be in poor condition.
• A report to be produced or all pipe barrel ailures
and/or ailures due to corrosion detailing, where
appropriate, i the ailure was due to a specic
local circumstance.
Figure 7.52: RIIO-GD1 maintenance costs
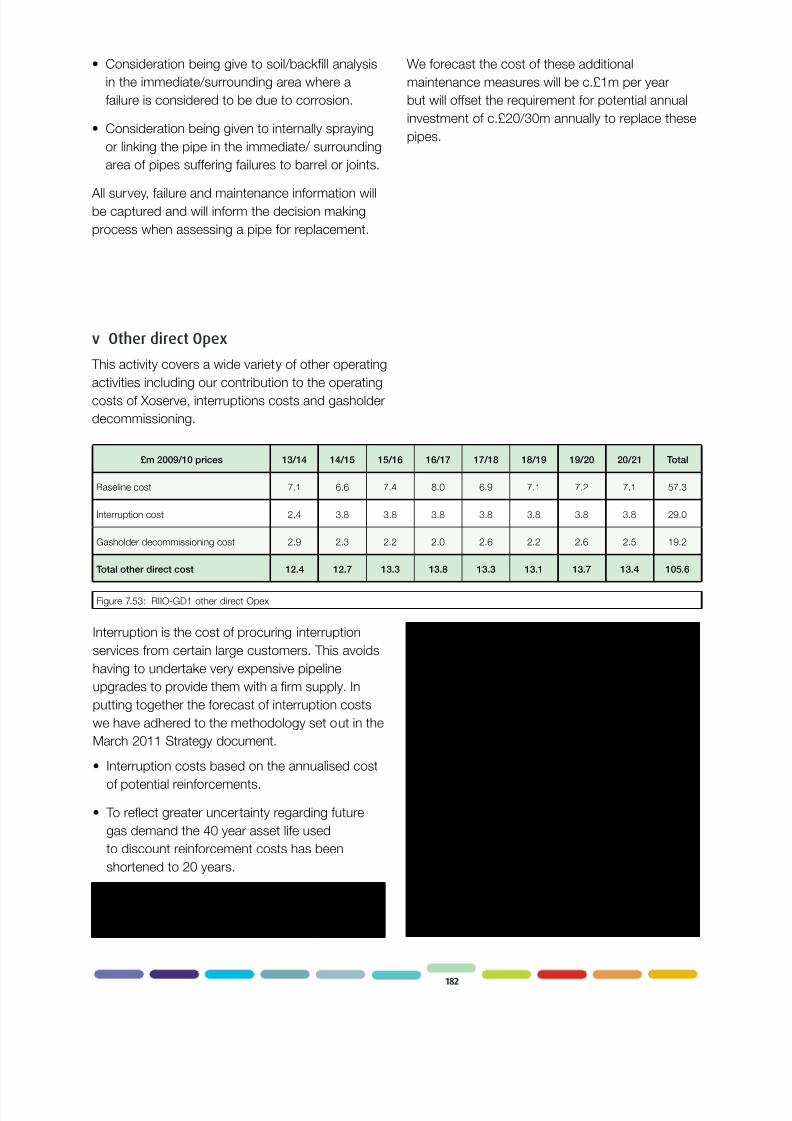
7/22/2019 Ngn Business Plan
http://slidepdf.com/reader/full/ngn-business-plan 182/224
182
• Consideration being give to soil/backll analysis
in the immediate/surrounding area where a
ailure is considered to be due to corrosion.
• Consideration being given to internally spraying
or linking the pipe in the immediate/ surrounding
area o pipes suering ailures to barrel or joints.
All survey, ailure and maintenance inormation will
be captured and will inorm the decision making
process when assessing a pipe or replacement.
We orecast the cost o these additional
maintenance measures will be c.£1m per year
but will oset the requirement or potential annual
investment o c.£20/30m annually to replace these
pipes.
v Other direct Opex
This activity covers a wide variety o other operating
activities including our contribution to the operating
costs o Xoserve, interruptions costs and gasholder
decommissioning.
£m 2009/10 prices 13/14 14/15 15/16 16/17 17/18 18/19 19/20 20/21 Total
Baseline cost 7.1 6.6 7.4 8.0 6.9 7.1 7.2 7.1 57.3
Interruption cost 2.4 3.8 3.8 3.8 3.8 3.8 3.8 3.8 29.0
Gasholder decommissioning cost 2.9 2.3 2.2 2.0 2.6 2.2 2.6 2.5 19.2
Total other direct cost 12.4 12.7 13.3 13.8 13.3 13.1 13.7 13.4 105.6
Figure 7.53: RIIO-GD1 other direct Opex
Interruption is the cost o procuring interruption
services rom certain large customers. This avoids
having to undertake very expensive pipeline
upgrades to provide them with a rm supply. In
putting together the orecast o interruption costs
we have adhered to the methodology set out in the
March 2011 Strategy document.
• Interruption costs based on the annualised cost
o potential reinorcements.
• To refect greater uncertainty regarding uture
gas demand the 40 year asset lie used
to discount reinorcement costs has been
shortened to 20 years.
NGN is basing orecasts on existing requirementsat West Cumbria and Vale o York. In addition we
have included 50% o the costs o a scheme at
Elton on the basis it may not retain NTS fexibility
capacity during RIIO-GD1. This is realistic given
the indications rom the NTS in its RIIO-T1 plan
that fex is becoming increasingly scarce. The
NTS previously rejected NGN’s application or fex
at our Elton otake. The orecasts or RIIO-GD1
will start with costs or 2013/14 having already
been determined through the 2010 auctions.
These are largely interruption contracts supporting
West Cumbria. We have recently become aware
that our major customer necessitating network
reinorcement may reduce its registered capacity.
Further discussion on the treatment o this
development may thereore be necessary.

7/22/2019 Ngn Business Plan
http://slidepdf.com/reader/full/ngn-business-plan 183/224
183
Figure 7.54: RIIO-GD1 indirect Opex
£m 2009/10 prices 13/14 14/15 15/16 16/17 17/18 18/19 19/20 20/21 Total
Research and development (innovation) 3.0 3.0 3.0 3.0 3.0 3.0 3.0 3.0 24.0
IT and telecoms 7.1 7.0 7.1 7.2 7.3 7.4 7.4 7.5 57.9
Property management 1.8 1.8 1.8 1.8 1.8 1.8 1.8 1.8 14.1
Training and apprentices 3.5 5.5 5.6 5.5 5.3 4.9 4.6 4.2 39.2
Insurance 4.2 4.4 4.6 4.5 4.5 4.5 4.4 4.4 35.4
HR 0.5 0.5 0.5 0.5 0.5 0.5 0.5 0.5 4.3
Finance, audit and regulation 2.8 2.8 2.8 2.8 2.8 2.9 2.9 2.8 22.6
Procurement 0.2 0.2 0.2 0.2 0.2 0.2 0.2 0.2 1.7
Store and logistics 0.0 0.0 0.0 0.0 0.0 0.0 0.0 0.0 0.0
CEO 3.7 3.8 3.8 3.8 3.8 3.8 3.8 3.9 30.4
Total indirect cost 26.8 29.0 29.4 29.4 29.2 28.9 28.6 28.3 229.6
Indirect Opex activities
Indirect Opex costs are orecast to increase
predominantly due to the increased apprentice
recruitment programme.
Each o the key elements o our indirect operating
cost orecast is set out in more detail below.
i Research and development (innovation)
RIIO-GD1 requires a much greater level o
innovation rom network operations. Section 4 sets
out our approach to innovation and the basis o our
orecast expenditure.
ii IT and telecoms
The costs o the provision o IT and telecoms
support services are orecast to increase
compared to GDPCR1 and remain constant during
RIIO-GD1.
The ull go-live o the DNCS system in 2011 and
the withdrawal rom the direct link with the legacy
National Grid systems requires arrangements
or the continuing support o the new systems.
This represents a signicant increase in workload
when compared to current arrangements andincreases our costs by c.£0.8m per year. In
addition the in-sourcing o all operational activities
previously contracted out under the Asset Services
Agreement leads to increased costs to support the
operational business. Future costs have been
market tested through competitive tender and are
driven by revised terms, service levels, and refect
the relative value and size o the services required.
A key part o our IS strategy is market testing.
• Allmaterialprojectsandupgradesareputoutto
tender to NGN’s established ramework suppliers.
• NGNobtainsratecardsforalltenderedprojects
which allows NGN to pick individual unit costs rom
dierent suppliers and use them to reduce unit
costs or other projects.
• NGNusesexternalmarketdatatocheckthatits
internal unit costs and those o ramework suppliers
remain ecient compared to what is available on
the wider market.
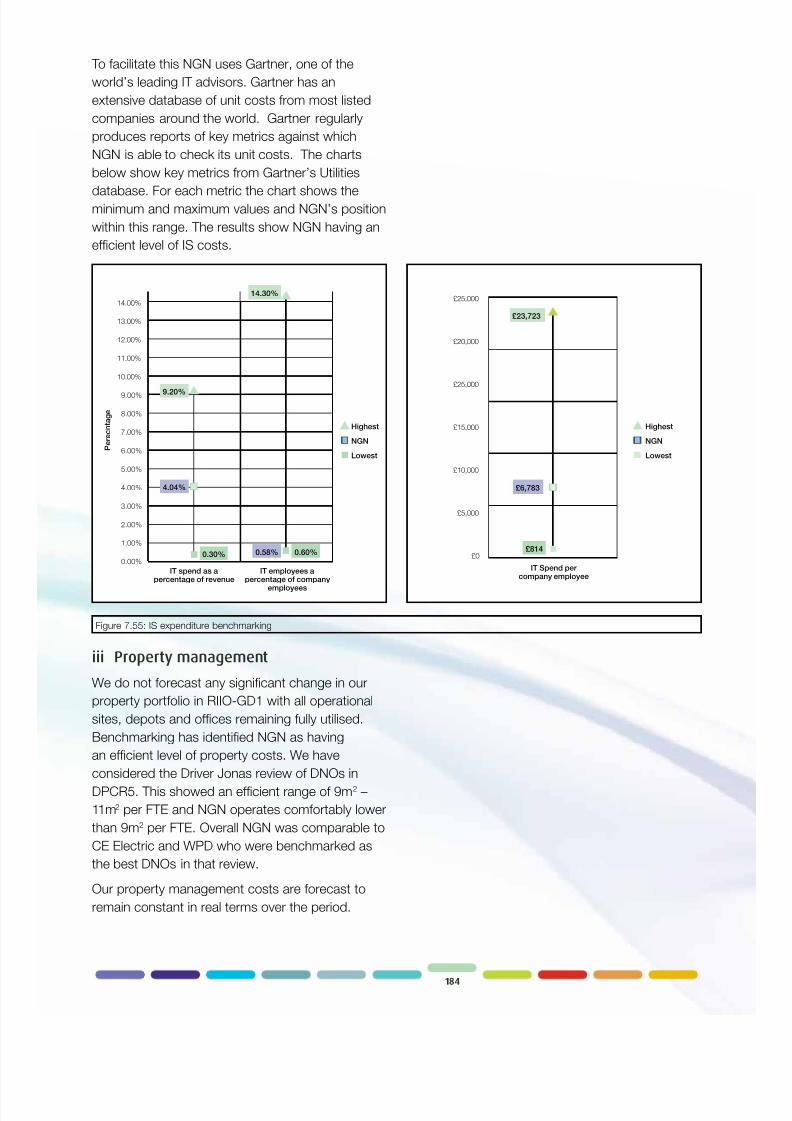
7/22/2019 Ngn Business Plan
http://slidepdf.com/reader/full/ngn-business-plan 184/224
184
To acilitate this NGN uses Gartner, one o the
world’s leading IT advisors. Gartner has an
extensive database o unit costs rom most listed
companies around the world. Gartner regularly
produces reports o key metrics against which
NGN is able to check its unit costs. The charts
below show key metrics rom Gartner’s Utilitiesdatabase. For each metric the chart shows the
minimum and maximum values and NGN’s position
within this range. The results show NGN having an
ecient level o IS costs.
14.00%
13.00%
12.00%
11.00%
10.00%
9.00%
8.00%
7.00%
6.00%
5.00%
4.00%
3.00%
2.00%
1.00%
0.00%
9.20%
4.04%
0.30% 0.58% 0.60%
Highest
NGN
Lowest
14.30%
IT spend as apercentage o revenue
IT employees apercentage o company
employees
P e r e c n t a g e
£814
Highest
NGN
Lowest
£23,723
£6,783
IT Spend per company employee
£25,000
£20,000
£25,000
£15,000
£10,000
£5,000
£0
Figure 7.55: IS expenditure benchmarking
iii Property management
We do not orecast any signicant change in our
property portolio in RIIO-GD1 with all operational
sites, depots and oces remaining ully utilised.Benchmarking has identied NGN as having
an ecient level o property costs. We have
considered the Driver Jonas review o DNOs in
DPCR5. This showed an ecient range o 9m2 –
11m2 per FTE and NGN operates comortably lower
than 9m2 per FTE. Overall NGN was comparable to
CE Electric and WPD who were benchmarked as
the best DNOs in that review.
Our property management costs are orecast to
remain constant in real terms over the period.

7/22/2019 Ngn Business Plan
http://slidepdf.com/reader/full/ngn-business-plan 185/224
185
iv Apprentices and training
The cost o the planned recruitment o c.260
additional apprentices is contained within business
support until they have graduated (ater three
years).
This represents average expenditure o c.£5m
per year throughout RIIO-GD1. It is necessary to
make this investment because NGN has an ageing
industrial workorce with an average age
now approaching 50. Since 2005, NGN has been
investing in young people through our apprentice
recruitment programme. Despite this the average
age has increased and there is a need to increase
the level o apprentice recruitment during RIIO-
GD1.
The age prole o NGN’s existing workorce is
shown in the graph below.
Proportional accumulative age profile of NGN workforce
0%
10%
20%
30%
40%
50%
60%
70%
80%
90%
100%
15 20 25 30 35 40 45 50 55 60 65
P e r c e n t a g e o f w o r k f o r c e y o u n g e r t h a n a g e
Age (years)
Team Leader
First Call Operative
Gas Operative
Overall - Net. Maint., Emergency and
Repair
Entire Workforce
Figure 7.56: Number o NGN employees expected to retire over RIIO-GD1
As the graph demonstrates, more than 60% o
current team leaders and FCOs are 50 years o
age or older and within the workorce only 25% are
below 40 years o age.
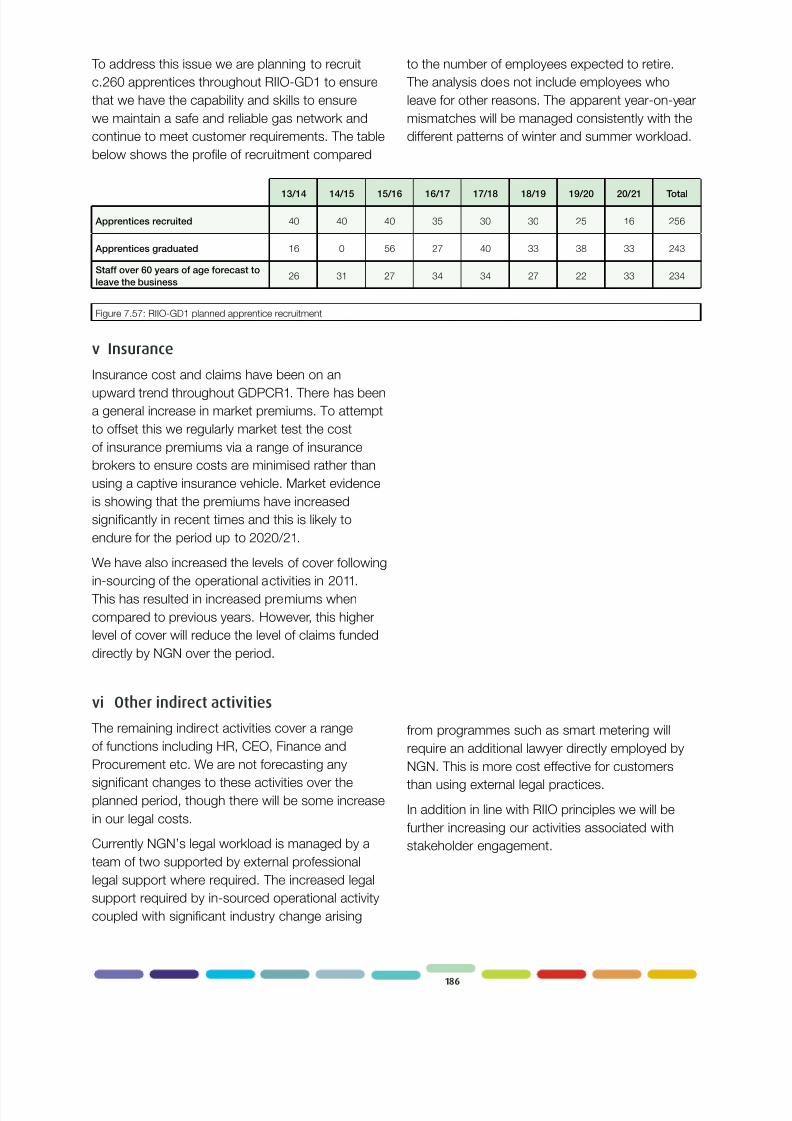
7/22/2019 Ngn Business Plan
http://slidepdf.com/reader/full/ngn-business-plan 186/224
186
To address this issue we are planning to recruit
c.260 apprentices throughout RIIO-GD1 to ensure
that we have the capability and skills to ensure
we maintain a sae and reliable gas network and
continue to meet customer requirements. The table
below shows the prole o recruitment compared
to the number o employees expected to retire.
The analysis does not include employees who
leave or other reasons. The apparent year-on-year
mismatches will be managed consistently with the
dierent patterns o winter and summer workload.
Figure 7.57: RIIO-GD1 planned apprentice recruitment
v Insurance
Insurance cost and claims have been on an
upward trend throughout GDPCR1. There has been
a general increase in market premiums. To attempt
to oset this we regularly market test the cost
o insurance premiums via a range o insurance
brokers to ensure costs are minimised rather than
using a captive insurance vehicle. Market evidence
is showing that the premiums have increased
signicantly in recent times and this is likely to
endure or the period up to 2020/21.
We have also increased the levels o cover ollowing
in-sourcing o the operational activities in 2011.
This has resulted in increased premiums when
compared to previous years. However, this higher
level o cover will reduce the level o claims unded
directly by NGN over the period.
vi Other indirect activities
The remaining indirect activities cover a range
o unctions including HR, CEO, Finance and
Procurement etc. We are not orecasting any
signicant changes to these activities over the
planned period, though there will be some increase
in our legal costs.
Currently NGN’s legal workload is managed by a
team o two supported by external proessional
legal support where required. The increased legal
support required by in-sourced operational activitycoupled with signicant industry change arising
rom programmes such as smart metering will
require an additional lawyer directly employed by
NGN. This is more cost eective or customers
than using external legal practices.
In addition in line with RIIO principles we will be
urther increasing our activities associated with
stakeholder engagement.
13/14 14/15 15/16 16/17 17/18 18/19 19/20 20/21 Total
Apprentices recruited 40 40 40 35 30 30 25 16 256
Apprentices graduated 16 0 56 27 40 33 38 33 243
Sta over 60 years o age orecast to
leave the business26 31 27 34 34 27 22 33 234

7/22/2019 Ngn Business Plan
http://slidepdf.com/reader/full/ngn-business-plan 187/224
187
7.6.2 Non-controllable Opex
Our non-controllable Opex in RIIO-GD1 is orecast
to total c.£450m as shown in the table below.
£m 2009/10 prices 13/14 14/15 15/16 16/17 17/18 18/19 19/20 20/21 Total
Shrinkage 9.0 8.6 8.3 8.0 7.8 7.6 7.4 7.2 63.9
Network rates 30.1 30.1 30.1 30.1 30.1 30.1 30.1 30.1 240.5
Pensions decit 2.0 2.0 2.0 2.0 2.0 2.0 2.0 2.0 16.0
NTS pension 4.3 4.3 4.3 4.3 4.3 4.3 4.3 4.3 34.1
NTS otake 10.2 10.2 10.2 10.2 10.2 10.2 10.2 10.2 81.6
PPF levy 0.5 0.5 0.5 0.5 0.5 0.5 0.5 0.5 4.0
Ogem license and Joint Oce 1.1 1.1 1.1 1.1 1.1 1.1 1.1 1.1 8.8
Total cost 57.2 56.8 56.5 56.2 56.0 55.8 55.6 55.4 448.9
Figure 7.58: RIIO-GD1 non-controllable Opex
i Shrinkage gas
Shrinkage gas is the amount o gas that escapes
due to leakage or thet and that which is used to
operate the network itsel. Our shrinkage orecasts
thereore is based on the orecast volume o shrinkage gas and an assumed wholesale price o
gas.
We are orecasting signicant reductions (14%)
in shrinkage gas volumes when compared to
2011/12 estimates. Our TNM approach to deliver
wider benets, including leakage reduction, and
specic investment to allow more eective network
pressure management, will be the key driver o this
reduction.
The price o the gas used is the average wholesale
price in 2010/11. The actual costs will vary in line
with movements in wholesale prices.
ii Network business rates
We have been successul in achieving a reduction
in network business rates or 2013/14 when
compared to GDPCR1. The reduction in cost
ollows a rates revaluation in 2010 where higher
rateable values were compensated by lower
valuations or rate in the pound. The orecast is
held constant at c.£30m or the whole period.
iii Pensions decit
Please see Section 7.2.3 o this plan or urther
details.
iv NTS pension
Our plan contains the latest orecast o these costs
rom National Grid o c.£4m per year.
v NTS otake
From 1 October, 2012, we will begin to pay the
NTS exit costs or fat and fex otake capacity to
National Grid (NG). Previously these charges were
paid directly by shippers.
These charges are set by NG, and NGN’s orecast
costs are based on indicative charges containedwithin the NG otake pricing statements, which
currently orecast out to 2014/15. Costs rom this
point are orecast to remain constant.
vi PPF pension levy
NGN actively manage and control our D&B ailure
scores to maintain the PPF levy incurred by the
business, associated with the dened benet
scheme, to an absolute minimum.
The PPF has published a policy statement on the2012/13 levy, part o which details how the average
D&B ailure score over the previous 12 months

7/22/2019 Ngn Business Plan
http://slidepdf.com/reader/full/ngn-business-plan 188/224
188
will be used to place employers into one o 10 risk
bands. NGNOL would be placed in band two,
which is expected to produce a risk based levy
which is approximately 50% higher than the current
2011/12 level, leading to the total PPF levy or
2012/13 increasing to c.£0.5m per year. This has
been refected throughout RIIO-GD1 under the newramework.
vii Ogem licence and joint oce costs
Current cost levels o £1.1m are orecast to remain
constant throughout RIIO-GD1.

7/22/2019 Ngn Business Plan
http://slidepdf.com/reader/full/ngn-business-plan 189/224
189

7/22/2019 Ngn Business Plan
http://slidepdf.com/reader/full/ngn-business-plan 190/224
7/22/2019 Ngn Business Plan
http://slidepdf.com/reader/full/ngn-business-plan 191/224
This section sets out the revenues NGN will need in order to deliver this
business plan. It shows how these revenues have been calculated and the
underlying assumptions behind these calculations. It demonstrates how
we balance the requirements of customers with those of investors.
8Revenueandfnancialorecasts
191

7/22/2019 Ngn Business Plan
http://slidepdf.com/reader/full/ngn-business-plan 192/224
Executive summaryNGN’s proposed nancial package represents an
appropriate balance between the short and long
term requirements o customers and providers o
nance. The level o revenues we require is broadly
in line with those in GDPCR1 at c.£340m per year
when the impact o moving to IFRS accounting
is excluded. This level o revenue will allow NGN
to invest more than £1.2bn in our network by
continuing to attract the necessary unding rom
shareholders and other providers o nance. It
represents an increase in domestic gas bills o one
penny a day.
Our business plan is compliant with the RIIO
nancial principles and works within the guidance
provided by the March 2011 Strategy document.Our required cost o equity is 7.2% based on a
62.5% notional gearing, indexed cost o debt and
transitional arrangement o a c.7.5% per annum
adjustment to the Fast:Slow Money split.
Without transition, this plan is not nanceable. The
transition arrangement will allow NGN to maintain
our strong investment grade credit ratings, raise
the necessary nance to und required investment,
reduce the volatility o customer bills between
regulatory periods and deliver this within an overall
lower cost o capital than we have in GDPCR1. We
believe this plan delivers the most ecient all round
nancial package with an equitable balance o risk
and reward.
As a rontier company we should have the
opportunity to earn higher returns through a reward
consistent with previous regulatory precedents.
We do not propose any additional uncertainty
mechanisms to those set out in the March 2011Strategy document.
192

7/22/2019 Ngn Business Plan
http://slidepdf.com/reader/full/ngn-business-plan 193/224
8.1 Revenue and nancialforecasts
Ensuring that ecient companies are able to
nance their activities is a key principle under both
the GDPCR1 and RIIO regulatory rameworks. This
is essential in order to enable the delivery o the
large amounts o investment required in the UK’s
energy inrastructure to acilitate a move to a low
carbon economy.
Adequate revenue streams have to be key
components to this, enabling companies to deliver
business plans that pass the key credit and equity
metrics used to assess nanceability and attract
continued investment. However, NGN recognises
that nanceability should not be the only criterion
when assessing revenue streams and nancialorecasts. In deriving our nancial proposals we
have assessed the impact on our key criteria,
incorporating the short and longer term impact
upon customers, investors and providers o nance
as set out below.
• Impact on customer bills
The proposals must consider the impact upon
customer bills in the short and long term. In
an environment o potentially lower uture gas
demand, deerring revenues would lead to
signicant increases in uture customer bills.
• Long term market condence to attract
investment
A stable regulatory ramework with a well
understood risk prole is essential to continuing
to attract the signicant investment required
in UK energy networks over the longer term.
Extending cash fows signicantly into the uture
will increase the perceived risk o the regulatory
ramework and increase the returns required by
investors.
• Ability to nance RIIO-GD1 investment
The nancial strategy must ensure that the key
credit and equity metrics are satised and that
the RIIO-GD1 investment requirements can be
nanced eciently. It must also recognise the
potential impact upon the perception o the
relative risk o the regulatory ramework and thelonger term cost o debt and equity nance.
• Appropriate balance o risk and reward between
customers and shareholders
Shareholders continue to share the burden o
risk with customers over the RIIO-GD1 periodand take responsibility or those risks that the
company is best placed to manage. This should
be achieved with reerence to the overall impact
on the required cost o capital.
Our nancial strategy represents an appropriate
balance between the short and long term impacts
on investors, providers o nance and customers.
This should reduce the overall costs o nancing,
by maintaining the condence in the UK’s stable
regulatory ramework and consequently supporting
the ability to attract the signicant levels o
investment required in the longer term.
Our nancial proposals are ully compliant with the
key parameters set out in the March 2011 Strategy
document, including cost o equity, cost o debt,
capitalisation policy, asset lives and regulatory
depreciation.
193

7/22/2019 Ngn Business Plan
http://slidepdf.com/reader/full/ngn-business-plan 194/224

7/22/2019 Ngn Business Plan
http://slidepdf.com/reader/full/ngn-business-plan 195/224
195
Figure 8.1: Key nancial outcomes o NGN’s business plan
IFRS
£m 2009/10 prices 12/13 13/14 14/15 15/16 16/17 17/18 18/19 19/20 20/21 Total
Closing RAV Value 1,595 1,630 1,688 1,734 1,785 1,817 1,853 1,881 1,909
Return on RAV 71 72 74 77 79 80 80 80 614
Depreciation 79 82 87 91 95 98 101 105 737
Fast Pot 130 108 116 116 115 115 112 110 922
Other 60 83 85 85 85 85 86 86 656
Revenue 339 340 345 362 368 374 379 379 381 2,929
Costs (244) (153) (154) (153) (152) (152) (149) (148) (1,306)
EBITDA 96 193 209 215 222 227 230 232 1,623
Interest Paid (61) (57) (57) (58) (59) (60) (60) (59) (470)
Capex & Repex Paid (49) (150) (149) (158) (144) (151) (146) (147) (1,094)
Other (6) (15) (27) (29) (29) (30) (30) (30) (195)
Net Operating Cash
Flow(20) (30) (25) (29) (10) (14) (5) (4) (137)
Debt Movement 50 62 57 63 44 48 40 40 405
NotionalEquity Injection
102 -
Dividend (31) (32) (33) (33) (34) (35) (35) (36) (268)
Fast Money % 54.7% 43.4% 46.6% 45.1% 47.7% 46.3% 46.4% 45.4% 46.9%
Slow Money % 45.3% 56.6% 53.4% 54.9% 52.3% 53.7% 53.6% 54.6% 53.1%
FFO/Interest (X) 3.1 3.1 3.2 3.2 3.3 3.3 3.4 3.4 3.2
Adjusted FFO/Interest
(X)1.8 1.7 1.7 1.7 1.7 1.7 1.7 1.7 1.7
RCF/Total Capex (X) 2.0 0.6 0.6 0.6 0.7 0.7 0.7 0.7 0.8
RCF/Net Debt 9.5% 8.4% 8.5% 8.5% 8.8% 8.9% 9.1% 9.2% 8.9%
FFO/Net Debt 12.5% 11.5% 11.5% 11.5% 11.8% 11.9% 12.1% 12.2% 11.9%
Net Debt/Closing RAV 62.3% 62.1% 62.2% 62.4% 62.2% 62.1% 61.8% 61.5% 62.1%
TWDV/RAV 14.1% 20.4% 26.1% 31.7% 36.5% 41.2% 45.4% 49.6% 33.1%
Tax Charge / PBT -95.0% 24.5% 24.1% 23.7% 23.8% 23.6% 23.6% 23.6% 9.0%
PMICR using RAV dep'n 1.8 1.7 1.7 1.7 1.7 1.7 1.7 1.7 1.7
Reg Equity/Reg
Earnings6.3 3.2 3.1 3.1 3.0 3.0 3.0 3.1 3.5
Reg Equity/EBITDA 1.8 1.7 1.7 1.7 1.7 1.7 1.7 1.7 1.7

7/22/2019 Ngn Business Plan
http://slidepdf.com/reader/full/ngn-business-plan 196/224
196
Overall, we believe the nancial package
underpinning our business plan represents an
appropriate balance between the short and long
term impact upon customers and providers o
nance. The ollowing sections set out how we
have determined our nancial package and the
evidence to support why this represents the correctbalance.
8.3 Key nancial modellingassumptions
The orecast allowed revenues required to deliver
this business plan during RIIO-GD1 are based on a
range o key nancial assumptions set out below.
8.3.1 Cost of equity
It is essential that the cost o equity is set at theright level, taking account o the risks aced by
equity holders under the new RIIO ramework.
Setting a cost o equity too low relative to this risk
prole will deter investors and we will not be able to
deliver our business plan.
The cost o equity relies upon a range o actors
and may vary between sectors and even individual
companies within a sector. However, there is a
clear case that proposals contained within the RIIO
ramework materially increase the returns that will
be required by equity investors in regulated energy
networks in the UK going orward.
The RIIO ramework introduces a greater role
or equity, not only in securing the short term
nanceability o investment plans, but also in
delivering the signicant levels o investment
required in UK energy inrastructure in the uture.
This obviously places the discussion o the
appropriate returns or equity investors at the hearto the regulatory ramework.
To determine the correct cost o equity or our
business plan we have considered a range o
issues which are set out below.
i Evidence from the Capital Asset PricingModel (CAPM)
NGN, along with other members o the Energy
Networks Association (ENA), commissioned an
independent report rom Oxera into the cost
o equity or gas transmission and distribution
networks in RIIO-GD1, which is attached as Appendix A13.
The traditional assessment o the appropriate cost
o equity using the Capital Asset Pricing Model
(CAPM) identied an upper range o 7.5% or the
cost o equity as shown in Figure 8.2 below.
The report identied that estimates at the top o
this range were relevant or the RIIO-GD1 period
due to the ollowing:
• There is no evidence to suggest that the risksaced by the gas distribution companies have
allen signicantly since GDPCR1; and
• The analysis included strong market evidence o
recent history which was adversely aected by
unprecedented market conditions. In particular
this aected the low end o the range shown in
Figure 8.2. It was concluded that it was thereore
more appropriate to consider a period o time o
ve years or more within the analysis, which is
broadly consistent with the estimates at the top
o this range.
Figure 8.2: Appropriate cost o equity or gas transmission and
distribution networks in RIIO-GD1
Low High
Real risk ree rate 1.5% 2.0%
Equity risk premium 4.5% 5.5%
Equity beta 0.8% 1.0%
Real cost o equity 5.2% 7.5%

7/22/2019 Ngn Business Plan
http://slidepdf.com/reader/full/ngn-business-plan 197/224
197
The impact o the recent signicant economic
downturn and the volatility experienced in world
nancial markets have been refected in the analysis
underpinning Figure 8.2. To the extent that utilities
have represented a more attractive investment
during these periods (which is undoubtedly the
case) equity betas would have reduced belowlonger term averages. Analysis o longer term
equity returns is included in Appendix A16. This
urther supports the argument that the top end o
this range is a more appropriate indicator o the
cost o equity or RIIO-GD1.
ii Duration of cash ows
The RIIO proposals introduce a range o changes
to the regulatory ramework which imply an
increase in the risk prole aced specically by gas
distribution companies. In particular, the increase in
the duration o cash fows implied by a change to
the policy o ull capitalisation o Repex.
Analysis prepared by Oxera (Appendix A14)
examined in detail the theoretical and empirical
evidence to support the assumption that required
equity returns would increase as a result o an
increase in cash fow duration. This includes
analysis using the Brennan and Xia ramework
(2006), the results o their analysis o US marketdata, as well as specic empirical analysis o cash
fow betas or UK utilities.
The analysis shows a positive relationship between
cash fow duration and required returns, and clearly
reinorces the point that the increase o cash fow
durations implied by the RIIO ramework would be
expected to materially increase the cost o equity
or regulated energy networks in the UK.
iii Indexation of debtHistorically, the allowed cost o debt has included
a premium to deal with uncertainty in actual costs
o debt over the period. The implied assumption
within RIIO-GD1 o a move to allowances based on
an indexed cost o debt is that companies will be
able to hedge perectly the debt index and hence
there will be no residual exposure to risk rom
changes to market cost o debt.
Our own experience, supported by analysiscarried out by Oxera, (Appendix A15) shows that
i this core assumption does not hold, then the
companies will be exposed to signicant residual
risk, and this residual risk under an indexed debt
model accrues directly to equity.
In addition to this residual risk, the proposed
debt indexation methodology also exposes all
companies to additional debt costs arising rom
the infation mismatch. Ogem’s methodology orsetting the cost o debt index is, in simple terms,
to defate nominal debt costs by an infation rate
derived rom infation breakevens (the dierence
between nominal and index-linked gilt yields). In
calculating the company’s allowed return Ogem
then refates this allowance using actual RPI
infation. To the extent that implied breakeven
infation and outturn RPI dier (which is the case in
reality) this then creates a mismatch where nominal
debt costs are not accurately compensated or bynominal revenues.
This is a particular major issue as opportunities
to issue index-linked debt (other than ‘tap’ issues)
are currently, and will remain or the oreseeable
uture, very limited, so most new debt issued by
companies is likely to be issued at a nominal rate.
Historic evidence shows that infation breakevens
are invariably higher than actual RPI infation so
the mismatch is expected to be adverse rom
NGN’s point o view. Since breakevens theoretically
incorporate an infation risk premium to incentivise
investors to buy nominal rather than index-linked
gilts, it is reasonable to assume that breakevens will
continue to outpace actual RPI rates.
iv. Risk and uncertainty
The appropriate cost o equity has been assessed
against the risk prole we ace in RIIO-GD1. Our
assessment o the key risks and our analysis o
whether it is appropriate or these risks to be borne
by NGN or customers is set out in Appendix A18.
Based on this analysis, we are not proposing any
additional uncertainty mechanisms above those set
out in the March 2011 Strategy document. NGN
will thereore manage the impact o any risk outside
these mechanisms.
Our risk analysis indicates that the appropriate cost
o equity lies towards the top end o the Oxera
identied range.

7/22/2019 Ngn Business Plan
http://slidepdf.com/reader/full/ngn-business-plan 198/224
198
These orecasts have been calculated using a
methodology described below.
Historic data has been derived rom a combination
o Ogem’s indexation model, the Bank o
England’s website and Bloomberg. Forward swaprates have been derived rom internal models
maintained by one o our key UK relationship banks
and are based on observable market swap rates.
• The average maturity o the two indices is:
- iBoxx ‘BBB’ index – currently approximately 17
years; and
- iBoxx ‘A’ index – currently approximately 21
years.
• For modelling purposes, orecast uture
underlying interest rates are based on a single
maturity swap, (namely 20 years). Swap market
rates are used to imply orward 20-year swap
rates at the beginning and end o each calendar
year. The average or the year is taken as a
simple average o the two valuations.
• A credit spread is added to the average swap
rate to derive a orecast average iBoxx index
yield or each calendar year. In 2010 the average
o the iBoxx ‘A’ index was 1.37% above the 20-
year swap rate. In 2010 the average o the iBoxx
‘BBB’ index was 1.70% above the 20-year swap
rate. This implies an average credit spread over
swaps o 1.54%.
• Using the Fisher Equation, the nominal orecastaverage iBoxx yield is defated by the orecast
breakeven infation or the corresponding year
to derive a projected real index value or the
year. The di erential between historic 10-year
breakevens (dierence between 10-year nominal
gilts and 10-year real gilts) and 10-year zero
coupon infation swaps averaged 0.22% over the
period January 2005 to March 2011. Projected
breakevens are thereore derived by implying
orward infation swap rates rom swap markets
and adjusting downwards or the assumed
0.22% dierential. A simple average o opening
and closing rates or each year is used as the
defating rate.
This approach gives a projected real cost o debt
value or each year o RIIO-GD1 as shown in
Figure 8.3. A 10-year trailing average o actual and
projected rates is then calculated to derive a real
cost o debt index or each year.
Figure 8.3: RIIO-GD1 iBoxx cost o debt orecast
Taken together, our plan thereore includes a cost
o equity o 7.2% which lies within the range o
the March 2011 Strategy document but below the
current cost o equity in GDPCR1.
8.3.2 Cost of debtIn the March 2011 Strategy document it stated that
the cost o debt allowance in the WACC or RIIO-
GD1 would be based on a 10-year simple trailing
average index to be updated annually during the
price control. It is proposed that the cost o debt
allowance will be calculated as an average o the
iBoxx GBP Non-Financials Indices o 10+ years
maturity, with credit ratings o broad ‘A’ and broad
‘BBB’ issuers, defated by 10-year breakeven
infation data published by the Bank o England.
Figure 8.3 details our orecast or the value o this
trailing average index or each year o RIIO-GD1.
This prole has been used throughout our nancial
analysis.
13/14 14/15 15/16 16/17 17/18 18/19 19/20 20/21
Cost o Debt (iBoxx) 2.91% 2.85% 2.83% 2.83% 2.87% 2.86% 2.73% 2.60%

7/22/2019 Ngn Business Plan
http://slidepdf.com/reader/full/ngn-business-plan 199/224
199
The key assumptions underpinning this modelling
are detailed below:
• Future credit spreads are assumed to remain in
line with observed spreads in 2010;
• The uture dierential between 10-year gilt
breakevens and 10-year zero coupon infation
swaps is assumed to be consistent with
observed data rom 2005 to 2011;
• The average maturity o bonds across the two
relevant iBoxx indices is assumed to remain
close to 20 years. The move to a 10-year trailing
average index in reality is likely to push debt
issuance by network operators towards shorter
tenors; and
• Average uture swap rates (both 20-year nominaland 10-year infation) are based on a simple
average o opening and closing rates in each
calendar year. Forecasting daily, weekly or
monthly rates was considered too onerous or
this exercise.
Whilst we have based our nancial proposals
upon the cost o debt index methodology, we still
consider there are some signicant issues with this
approach, as set out below.
i Debt costs not funded by the cost of debtindex
The orecasts set out in Figure 8.3 or the
suggested uture level o the indexed cost o debt
allowance assume that no adjustment is made
to compensate companies or additional costs
o carrying and issuing debt not captured by the
index itsel. The March 2011 Strategy document
stated that such costs are implicitly allowed or
by the act that UK utilities have historically been
able to raise debt at rates lower than general
corporates (the proposed iBoxx indices being a
general corporate index). It is not necessarily the
case that this position will continue to the same
degree and we believe that it is essential that
some orm o mechanism should exist to cater
or this given the alling cost o debt allowance
evidenced above.
For the avoidance o doubt the additional costs areexpected to include:
• Costs associated with maintaining adequate
liquidity (loan acility commitment ees and/or
cost o carry where debt issuance proceeds
are held as cash deposits, attracting associated
rates o interest materially lower than the cost o
the corresponding debt);
• Direct costs arising rom issuing bonds,
arranging loan acilities or otherwise sourcing
new debt (e.g. arrangement ees and legal ees);
and
• Ongoing costs necessary to maintain unding
arrangements (e.g. rating agency and other
agents’ ees).
Furthermore, new debt issues generally require
issuers to pay a new issue premium which in
the current market amounts to c.30bps above
secondary spreads captured by the index. There
are numerous market deals in 2011 which point
to 30bps not being a generous level and could be
higher at the time o issue.
ii Constituents of the iBoxx indices
Markit, the provider o iBoxx indices, announced
during September 2011, that rom 31 December
2011, it will reclassiy Whole Business
Securitisation (WBS) bonds issued by utilities
and inrastructure providers. The WBS bonds
will thenceorth be classied as ‘corporate
bonds’. As a consequence, up to 37 ‘A’ band
rated bonds and up to 10 ‘BBB’ band rated
bonds may be added to the iBoxx indices used
to calculate the indexed cost o debt allowance
under RIIO-GD1. Historically the yields on WBS
bonds have been lower than those on ‘vanilla’
corporate bonds which NGN has in issue, in
the same ratings bands. We estimate that the
reclassication o the WBS bonds will result in an
immediate and ongoing reduction in the iBoxx
indices o c.12 bps in the case o ‘A’ non-nancial
corporates and less than 2bps in the case o
‘BBB’ non-nancial corporates (i.e. around
10bps when considered in the context o the
average o the indices as used to determine the
cost o debt allowance).
With just one exception, the GDNs are issuers o unsecured ‘vanilla’ corporate, rather than WBS
bonds and so do not benet rom the lower cost

7/22/2019 Ngn Business Plan
http://slidepdf.com/reader/full/ngn-business-plan 200/224
200
inherent in secured bonds. Consequently the
inclusion o WBS bonds in the iBoxx corporate
indices will generate a debt cost mismatch, which
should be refected in the RIIO-GD1 settlement.
We suggest that a 10bps uplit, based on the
analysis above, is applied to the trailing average
index calculation or each year o the price controlin order to compensate the GDNs adequately or
this clear ongoing cost mismatch which has arisen
since the March 2011 Strategy document.
Recent substantial alls in gilt yields, particularly
at the shorter end o the yield curve, have led to
a signicant proportion o recent corporate bond
issues in sterling markets being clustered around
a maturity o 10 years. I this trend continues, this
will likely skew the average maturity o the pertinent
iBoxx indices downwards rom the currentaverages o c.17-21 years as set out in Section
8.3.2. This would lead to a consequential lowering
o the index yields to the detriment o the GDNs
whose natural preerence has been to nance long
term assets with long term debt.
iii Other limitations of the proposedmethodology
As already detailed in discussing the cost o
equity, there is a mismatch between the rateo infation used to derive a real cost o debt
allowance and the actual RPI infation rates that
will be used to calculate allowed revenue. The
mismatch will be disadvantageous to the GDNs
in that it will result in nominal debt costs not
being adequately refected in nominal revenue
allowances.
This business plan is compliant with the March
2011 Strategy document on the use o the iBoxx
index or determining the actual cost o debt
allowance. However, outstanding issues with the
ability o companies to hedge the index eectively
means there is a signicant transer o risk to equity
under these proposals.
We estimate that the additional unding costs not
captured by the current indexation approach total
at least 85bps, as set out below.
The cost o equity o 7.2% set out in Section 8.3.1
is not wholly consistent with this additional risk
implied by the approach to setting the allowed cost
o debt. We believe that supplementary allowances
should be added to the cost o debt index to
refect additional unding costs not captured by the
index itsel and remove the upward pressure this is
placing on the cost o equity to move outside o the
range in the March 2011 Strategy document.
8.3.3 Notional gearing
We recognise that we should set our notional
gearing level on the basis o our level o exposure
to cash fow risk. Our initial assumption within
this business plan maintains notional gearing at
the current level o 62.5%. Whilst this remains
unchanged rom GDPCR1, we eel the reasons or
increasing gearing are oset by the increased risks
we ace in the uture. Factors that would indicate
a potentially higher level o notional gearing are
detailed below.
• Our capital structure results in actual gearing
higher than notional. Last year our debt:RAV
ratio was 67% and we achieved a strong
investment grade credit rating o BBB+ with
S&P and Baa1 with Moody’s, both with stable
outlook. NGN has an internal target to maintain
debt:RAV at or below 70% in order to maintain
current credit metrics and these strong
investment grade ratings.
• We note notional gearing levels in electricity
have increased to 65% and evidence shows that
Figure 8.4: Additional debt unding costs
Impact on cost
o debt
Maintenance o liquidity 20bps
Issuance costs and ongoing costs o maintaining unding arrangements
10bps
Infation risk premium mismatch 30bps
Impact o inclusion o WBS bonds in index 10bps
New issue premia 15bps
Total 85bps

7/22/2019 Ngn Business Plan
http://slidepdf.com/reader/full/ngn-business-plan 201/224
201
companies have maintained their credit ratings at
this higher level o gearing.
However, during RIIO-GD1 there are very dierent
market and regulatory conditions than those
encountered in GDPCR1. The actors that would
indicate a potentially lower gearing are detailed
below.
• Weaknesses o highly geared companies were
highlighted during the nancial crisis.
• A sucient equity buer is needed to manage
short term nanceability issues, in particular
during times o market instability, where the
costs o raising debt could be prohibitive.
• Regulatory methodology changes (primarily the
Repex capitalisation) result in longer duration o
cash fows and thereore increase risk, as well
as the potential infexibility o what is now also a
signicantly longer price control.
In line with RIIO principles, we analysed the
impact o notional gearing on the equity returns
by evaluating its impact on Return on Regulatory
Equity (RORE) and the cash fow risks presented
by the RIIO ramework and the incentive proposals
or the RIIO-GD1 price control.
R O R E R a n g
e
Gearing
Environemntal
emissions incentive
Stakeholder
engagement
incentive
Customer service
incentive
Shrinkage
Costs
RORE
Inormation quality
incentive
Cost o debt
Pensions
Return on Regulatory Equity (RORE)National gearing scenarios
11%
10%
9%
8%
7%
6%
5%
4%
3%
2%
1%
0%
55%Gearing
62.5%Gearing
70%Gearing
Figure 8.5: RIIO-GD1 Return on Regulatory Equity-notional gearing scenarios

7/22/2019 Ngn Business Plan
http://slidepdf.com/reader/full/ngn-business-plan 202/224
202
A notional gearing level o 62.5% gives a
corresponding RORE range (based on a 7.2% cost
o equity) o 3.1-10.0%. Reducing notional gearing
below the current level o 62.5% would increase the
equity wedge o RAV and impact on RORE.
With a notional gearing o 55.0%, the relevant
RORE range narrows to 3.8-9.3%. We believe thisrepresents too narrow a range o potential returns
and penalties which may undermine the perception
o the stability o the regulatory ramework. This
is in part due to the act it is outside o regulatory
precedent that allows the best perorming
companies to earn double digit returns.
Additionally, reducing notional gearing in turn
increases the WACC, which increases allowed
revenues within the regulatory period without any
compensating reduction in uture years. This would
increase the burden on customers in the longer
term.
Increasing notional gearing to 70% would
increase the relevant RORE range to 2.1-10.3%.
This represents an unacceptable RORE range
particularly as it skews the return prole towards
downside risk extending this signicantly.
8.3.4 Capitalisation policy
Based on the RIIO principles o equalising
incentives and the rate o capitalisation beingclosely aligned to the actual split between
operating and investment expenditure, this plan
has ully considered the ollowing Fast:Slow Money
splits which are a product o the March 2011
Strategy document. The impact o this change on
capitalisation ratios is shown in the table below.
The starting point or our consideration o the
necessity o transitional arrangements has
thereore been to begin with a Fast:Slow Money
split o 39.5%: 60.5% averaged across RIIO-GD1,
consistent with the March 2011 Strategy document,
and consideration o the associated impact on our
cash fows and resultant credit/equity metrics.
8.3.5 Asset lives and depreciation
The assumed asset lives and depreciation
treatments in our plan are ully consistent with the
March 2011 Strategy document and the Ogem
nancial model.
Figure 8.6:Fast:Slow Money split as a result o the March 2011
Strategy document
Figure 8.7: Asset depreciation prole as a result o the March 2011
Strategy document
Having taken all factors into account, ourbusiness plan assumption is that notionalgearing should remain at the current levelof 62.5%.
RIIO - GD1
Average p.a.
Controllable Opex and Non Operational Capex (£m) 83.7
Capex (£m) 46.5
Repex (£m) 96.8
Totex Denition 227.0
50% Capitalisation o Repex Fast : Slow Money split
consistent with GDPCR1 treatment
Fast % 58%
Slow % 42%
100% Capitalisation o Repex Fast : Slow Money split as now
proposed by the RIIO proposals
Ogem proposed base Fast % 39.5%
Ogem proposed base Slow % 60.5%
Asset category (age)Depreciation
prole
Pre 200256 years sum
o digits
2002-201345 years sum
o digits
(Accelerated depreciation) 8 year straight line
2013 – 202145 year sum
o digits

7/22/2019 Ngn Business Plan
http://slidepdf.com/reader/full/ngn-business-plan 203/224
203
The position on the treatment o accelerated
depreciation relating to the change to a ront-
loaded depreciation prole or existing post 2002
assets is consistent with the methodology set out
within the Ogem nancial model. However, we
believe the above approach is inconsistent with
Ogem’s statement in the March 2011 Strategydocument where it stated that: “Our expectation
is that network operators will propose in their well
justied business plan whether they would intend to
release this additional amount or retain it in RAV”
We believe that the most ecient way to release
these additional sums would be to apply a ront
loaded prole based on an eight-year sum o digits
approach.
This approach would signicantly reduce the
requirement or transitional arrangements,
particularly in the early years o RIIO-GD1. We
suggest that the sum o digits methodology isapplied to catch up depreciation though our plan is
not calculated on this basis. However, we have not
made this change within this business plan or the
Ogem nancial model.
Figure 8.8: Contrasting ‘catch up’ depreciation proles during RIIO-GD1
8.3.6 Return on equity RAV
Across all o our nancial proposals we have usedan assumption o a notional 5% o equity RAV
dividend distribution level. This is consistent with
the modelling assumptions set out within both the
Ogem nancial model and the nancial modelling
or the DPCR5 nal determination.
There are several key drivers underpinning this
modelling assumption.
• A 5% notional distribution level is well below the
actual cost o equity (7.2%), and thereore ineect acts as a type o additional shareholder
equity nancing injection which equates to
c.£90m in RIIO-GD1.
• The proposed growth in equity RAV in RIIO-GD1
is at a level broadly consistent with GDPCR1 at
only c.2.0% per year and is thereore consistent
with a distribution level o above 5.0%.
• In this context, a lower distribution level would
represent a signicant urther increase in the
notional equity injection and would urther
increase the duration o cash fows experiencedby equity investors. This would in turn need to
be refected in an increase in the cost o equity
and thereore refected in higher required risk
premium.
‘Catch up’ prole during RIIO-
GD1 £m 2009/10 prices2013/14 2014/15 2015/16 2016/17 2017/18 2018/19 2019/20 2020/21 Total
Straight line (current Ogem
approach) 8.9 8.9 8.9 8.9 8.9 8.9 8.9 8.9 71.5
Alternative eight-year sum o
digits (NGN’s preerred approach)15.9 13.9 11.9 9.9 7.9 6.0 4.0 2.0 71.5
Dierence 7.0 5.0 3.0 1.0 (1.0) (3.0) (5.0) (7.0) -

7/22/2019 Ngn Business Plan
http://slidepdf.com/reader/full/ngn-business-plan 204/224
204
8.3.7 Acceptable key credit metrics to benanceable
All the key credit metrics, shown in Figure 8.9
opposite are adversely aected by the March 2011
Strategy document proposals as they are all “cash”
metrics. From the extensive modelling we have
undertaken, interest cover ratios, primarily PostMaintenance Interest Coverage Ratio (PMICR)
is the “limiting” actor in assessing nanceability.
This is clearly evident rom the nancial outcomes
presented in Figure 8.10 and clearly shows the
need or transition arrangements. In NGN’s case,
PMICR and net debt:RAV are also the two main
nancial covenants embedded within our liquidity
acilities within our bank lending group. Our
analysis below shows that PMICR is the primary
“limiting” ratio under the RIIO-GD1 proposals or
NGN beore any transitional arrangements are
incorporated and i not addressed clearly needs
to nanceabilty issues as well as removing any
headroom against key nancial covenants.
NGN thereore targets credit metric ratios post
transitional arrangements that will ensure we retain
our strong investment grade credit ratings.
Moody’s Standard and Poor’s
Baa A BBB A
PMICR 1.4 – 2.0x 2.0 – 4.0x
Net debt:RAV 60 – 75% 45 – 60% > 70% < 70%
FFO net debt 8 – 12% 12 – 20% 8 – 12% > 12%
RCF/Capex 1.0 – 1.5x 1.5 – 2.5x
FFO Interest Cover2.0x to
3.0x *3.0x to 5.0x
Figure 8.9: Moody’s and Standard & Poor’s (S&P) indicative ranges
or investment grade credit ratings
8.4 Requirement for transitionalarrangements
The key nancial assumptions detailed in the
sections above, along with the expenditure
orecasts set out in Section 7, have been analysed
using the Ogem nancial model.
The results o this analysis are shown in the tableopposite.
The table overlea shows the key nancial
outcomes by way o:
• an abbreviated income statement;
• net operating cash fow position; and
• the impact on the key nancial, credit and equity
metrics used to assess nanceability.

7/22/2019 Ngn Business Plan
http://slidepdf.com/reader/full/ngn-business-plan 205/224
205
Figure 8.10: Key nancial and credit outcomes based on orecast RAV and allowed revenue with no transition
IFRS
£m 2009/10 prices 12/13 13/14 14/15 15/16 16/17 17/18 18/19 19/20 20/21 Total
Closing RAV Value 1,595 1,668 1,734 1,795 1,860 1,905 1,954 1,994 2,031
Return on RAV 72 74 77 80 82 84 85 85 639
Depreciation 79 84 89 93 98 102 106 110 761
Fast Pot 92 98 99 99 98 98 96 95 776
Other 58 69 79 79 80 80 80 81 605
Revenue 339 301 325 343 351 358 364 367 371 2,782
Costs (244) (153) (154) (153) (152) (152) (149) (148) (1,306)
EBITDA 57 172 190 198 206 212 218 223 1,475
Interest Paid (61) (59) (60) (61) (63) (65) (65) (65) (500)
Capex & Repex Paid (49) (150) (149) (158) (144) (151) (146) (147) (1,094)
Other (2) (8) (18) (24) (25) (25) (26) (26) (154)
Net Operating Cash
Flow(55) (46) (38) (45) (25) (29) (19) (16) (272)
Debt Movement 86 78 71 80 61 65 56 54 553
Equity Injection 102 -
Dividend (2009/10) (31) (33) (34) (35) (36) (37) (37) (38) (280)
Fast Money % 38.7% 39.5% 39.9% 38.6% 40.7% 39.4% 39.6% 39.3% 39.5%
Slow Money % 61.3% 60.5% 60.1% 61.4% 59.3% 60.6% 60.4% 60.7% 60.5%
FFO/Interest (X) 2.5 2.8 2.9 2.9 2.9 2.9 2.9 3.0 2.8
Adjusted FFO/Interest
(X)1.2 1.4 1.4 1.3 1.3 1.3 1.3 1.3 1.3
RCF/Total Capex (X) 1.2 0.5 0.5 0.5 0.6 0.6 0.6 0.6 0.6
RCF/Net Debt 5.7% 6.6% 6.8% 6.5% 6.7% 6.8% 7.0% 7.1% 6.7%
FFO/Net Debt 8.7% 9.5% 9.8% 9.5% 9.6% 9.7% 9.9% 10.0% 9.6%
Net Debt/Closing RAV 63.1% 63.4% 63.6% 64.2% 64.3% 64.5% 64.4% 64.4% 64.0%
TWDV/RAV 13.8% 19.9% 25.3% 30.5% 34.8% 39.0% 42.9% 46.6% 31.6%
Tax Charge / PBT 0.0% 15.2% 24.3% 23.9% 23.9% 23.7% 23.8% 23.7% 19.8%
PMICR using RAV dep'n 1.2 1.4 1.4 1.3 1.3 1.3 1.3 1.3 1.3
Reg Equity/Reg
Earnings10.8 3.7 3.5 3.5 3.4 3.4 3.4 3.4 4.4
Reg Equity/EBITDA 1.2 1.4 1.4 1.3 1.3 1.3 1.3 1.3 1.3

7/22/2019 Ngn Business Plan
http://slidepdf.com/reader/full/ngn-business-plan 206/224
206
The most signicant impact is the material
reduction (by over 10%) in allowed revenue, alling
rom c.£340m in 2012/13 to c.£301m in 2013/14.
The key drivers o this downward movement are:
• the 100% capitalisation o Repex, resulting in all
Repex costs being unded over 45 years, rather
than unded 50% in year;
• reduced WACC, based on lower assumed
cost o equity and debt, which reduces the
associated return on RAV; and
• rebasing the price control cost allowances.
This reduction in allowed revenue is partially oset
by the proposed change to the depreciation
o all assets rom 2002/03 to a sum o digits
basis, rather than on a straight line basis. Thisbrings orward the recovery o some o the asset
investment cost, and increases the depreciation
allowance in the year. Linked to the above,
associated ‘catch up’ depreciation will also be
recovered, or the dierence in the depreciation
charge already received on a straight line basis or
assets added to RAV between 2002/03 to 2012/13
and that amount that would have been received i
they had been depreciated on a sum o digits basis
over this period.
The reduction in NGN’s allowed revenue, coupled
with the increase in operating costs, reduces
EBITDA by c.£53m in 2013/14 to c.£57m rom
c.£110m (in 2012/13) under UK GAAP. This in turn
generates signicant negative net operating cash
fow activities o c.£58m in 2013/14, and operating
cash fow remains negative in all other years o theprice control.
Such a base outcome would create signicant
nancing issues as explained below.
8.4.1 Financeability assessment
As set out in Figure 8.9 net operating cash fow is
a key dynamic o the majority o credit metrics. The
generation o cash is key to being able to invest
in Capex, service debt nance and pay returns to
shareholders.
Constant negative net operating cash fow, such
as that delivered by the RIIO base proposals
prior to any transitional arrangements, materially
impacts the nanceability o the proposals. In this
situation, debt must increase year on year simply
to cover the negative operating cash position and
to maintain the status quo. Any return to the equity
holders must be ully unded rom debt. This is
clearly not a sustainable long term operating model
or a base outcome which shareholders could
accept.
This is refected in the assessment o this scenario
against our key nanceability criteria analysed
below which shows the importance o the PMICR
measure.

7/22/2019 Ngn Business Plan
http://slidepdf.com/reader/full/ngn-business-plan 207/224
207
Metric
Outcomes
post IFRS
adoption
Comment
PMICR 1.3
This ratio measures the ability to pay interest rom net operating cash fows, and shows anunacceptable position o 1.3x over RIIO-GD1, driven by the reduced net operating cash fows as
a result o the proposals without transition arrangements. This is at the bottom end o potential
outcomes and provides no headroom to accommodate cost shocks and would not be a
nanceable position. In turn this compares with levels o PMICR o c.1.8x
delivered in GPCR1 by NGN.
Notional net debt to RAV 64%
Notional net debt to RAV increases year on year in RIIO-GD1, rom c.63.4% to c.64.4% refecting
the need to borrow increasing amounts to und the negative net operating cash fow position year-
on-year. This is within the overall target o actual net debt to RAV o c.70% but ater c.£102m o
notional equity injection.
FFO interest cover c.2.9x
This ratio measures the ability to pay interest rom operating cash fows, and shows an average
position in RIIO-GD1 o c.2.9x under the proposals without transition. This is within the acceptable range.
FFO to net debt c.9.6x This ratio measures the ability to pay interest rom net operating cash fows, and shows an average
position during RIIO-GD1 o c.9.6x. This represents an acceptable position.
RCF to Capex c.0.6x
This ratio measures the ability to und investment plans rom net operating cash fows, and shows
a worsening position in RIIO-GD1 rom greater than 1.0x to c.0.6x without transition arrangements.
This does not represent an acceptable position.
Regulated equity over EBITDA c.1.3xRegulated equity over EBITDA alls in RIIO-GD1 and is not an acceptable position
without transition arrangements.
Figure 8.11: Key credit and equity metrics without transition arrangements
8.4.2 Assessment of key creditrating and equity metrics
Overall, under the base RIIO-GD1 proposals,
without transitional arrangements the key equity
and credit metrics show a materially worsening
position rom those currently maintained in
GDPCR1. In particular huge strain is placed on
interest cover ratios as evidenced by PMICR,
which has a very high weighting when assessing
nanceability by our external credit rating agencies,
our lenders and by our shareholders.
Such outcomes would severely limit NGN’s ability
to obtain nance rom the banks, debt capital
markets and equity holders. Thereore, under the
base RIIO-GD1 proposals, without transitional
arrangements NGN could potentially breach keynancial covenants in our loan acility provisions,
as a result o the removal o all nancial headroom
and could suer an associated downgrade o our
strong corporate credit ratings.
This base case o RIIO-GD1 proposals without
transition arrangements consequently does notrepresent a nanceable position or NGN and
would not support the delivery o this business
plan.

7/22/2019 Ngn Business Plan
http://slidepdf.com/reader/full/ngn-business-plan 208/224
208
8.4.3 Longer term impact
The diagram below shows RAV growth and return
on RAV over three price control periods, assuming
50% Repex capitalisation (as per GDPCR1
methodology) and 100% Repex capitalisation with
no transition (as per the base RIIO-GD1 proposals).
This highlights that RAV will grow at a quickerrate under the RIIO-GD1 proposals than under
the current GDPCR1 methodology. This urther
highlights the potential or sunk costs, as well as
the increasing returns that will need to be unded
by uture customers on an increasing asset base.
Indeed, at the end o the third price control, RAV
would be c.£250m higher and customers will have
paid out an extra c.£200m in nancing costs (both
in 2009/10 prices) i not addressed now through
adoption o transitional arrangements.
Given this overall position, we believe that an
onerous and unair burden should not be placed
on uture generations o customers to pay back the
capital investment and higher returns on a higher
asset base. This is particularly relevant when the
long-term uncertainties o uture gas demand are
considered.
Figure 8.12: RAV return on capitalisation
8.4.4 Impact of IFRS A key assumption o this plan is that IFRS will be
implemented in ull rom the start o the 2014/15
regulatory year. Recent comment rom the main
UK accountancy rms has stated that the likely
adoption date will be on or ater 1 January 2014,
(in eect the 31 December 2014 statutory nancial
year end or NGN).
The primary impact rom the adoption o IFRS is
that Repex would become a capitalised item roma statutory accounting perspective. In addition,
connections customer contributions become
revenue in the IFRS income statement in the year
received under the guidance provided by IFRIC
18. Previously under the UK GAAP accounting
rules these contributions were taken to the balance
sheet and released over the appropriate asset lie.
This has a material impact on revenue and EBITDA
in the income statement, but importantly not on the
net operating cash fow line.
RAV @ 50% Capitalisation of
Repex
RAV @ 100% Capitalisation of
Repex
Return on RAV @ 50%
Capitalisation of Repex
Return on RAV @ 100%
Capitalisation of Repex
60
70
80
90
100
110
120
0
500
1,000
1,500
2,000
2,500
13/14 14/15 15/16 16/17 17/18 18/19 19/20 20/21 21/22 22/23 23/24 24/25 25/26 26/27 27/28 28/29 29/30 30/31 31/32 32/33 33/34 34/35 35/36 36/37
Return £mRAV £m

7/22/2019 Ngn Business Plan
http://slidepdf.com/reader/full/ngn-business-plan 209/224
209
Under IFRS, revenue increases rom c.£301m to
c.£325m rom 2013/14 to 2014/15. The primary
drivers or this are:
• An increase in the tax allowance as the ull costs
o Repex are no longer treated as an operating
expense and no longer act as a tax shield. This
equates to an increase o c.£23m in 2014/15.However, this is oset by increased tax paid and
so gives no benet to NGN.
• Connections customer contributions crediting
revenue in year, which equates to a urther c£6m
increase.
The balance o the increase is driven primarily
by increased return as the RAV grows, and
movements in Fast:Slow Money split.
Following assumed adoption o IFRS or 2014/15,
EBITDA signicantly increases. This is primarily
driven by Repex no longer being an operating
expenditure item. However, the Repex costs still act
as an ‘in year’ cash expense when considering net
operating cash fow. Together with the increased
tax paid, net operating cash fow still remains
negative in 2014/15 and throughout RIIO-GD1,
which is clearly an unacceptable position, and
highlights the need or ‘transitional’ arrangements.8.4.5 Conclusions
Without transitional arrangements there are several
signicant implications.
• Deerment o revenues which eectively
‘mortgage’ uture customers bills.
• Deterioration o credit ratings, reducing NGN’s
ability to raise nance.
• Erosion o any nancial headroom in thebusiness which will also reduce our ability to
raise nance.
• Investors in UK energy networks will look or
greater returns to compensate or the additional
risk o delayed cash fows.
The case or transition is thereore very clear. Our
proposals to address this issue are set out in more
detail below.
8.5 Proposed transitionalarrangements
It is important to recognise that the nanceability
issues are driven by a methodology change or
Repex which is outside the control o the GDNs.
The March 2011 Strategy document recognised
this as a key issue, and looked to partially rectiy
this position by changing the depreciation
methodology rom straight line to sum o digits. In
eect this orward weights the recovery o the initial
asset costs by recovering proportionally more o
the costs earlier in the assets’ lie.
Previously, when spending c.£85m on Repex in
any given year, NGN recovered 50% o the cost
in the year, and the other 50% by addition to the
RAV. Moving to 100% capitalisation, with no otherchanges, would immediately decrease NGN’s
revenue in year one by c.£42.5m. This would
partially be oset due the impact o the increasing
RAV, generating additional revenue. However,
by the end o RIIO-GD1 this osetting income
would only total c.£19m per year compared to
the annual c.£42.5m reduction. The impact o this
change would be largely oset by 2022/23. This
also means that transition arrangements should
be required or no more than one and a hal pricecontrol periods, and the need or transitional
arrangements reduces each year on a sliding
scale. Consequently the need or transitional
arrangements could be reassessed at the end o
RIIO-GD1.
There is a clear requirement or transitional
arrangements to ensure nanceability criteria
continue to be met. We believe that as a minimum
these arrangements should ully compensate or
the Repex capitalisation impact highlighted above,
but should also be used to ensure that appropriate
nancing and credit metrics are maintained
consistently across the period.
The revenue impact o RIIO-GD1 proposals
in eect creates a short term dip in allowed
revenue that will be more than compensated or
in the uture. At a time when there is increasing
uncertainty over the use o the gas networks,
where gas usage is expected to all, this will put anincreasing burden on uture generations to und the
sunk costs i not addressed now within RIIO-GD1.

7/22/2019 Ngn Business Plan
http://slidepdf.com/reader/full/ngn-business-plan 210/224
210
8.5.1 Options for transition
There are a range o options which could deliver
the required transitional arrangements. However,
each option will deliver these improvements via
dierent mechanisms and directly impact the
balance between providers o nance, equity
investors and our customers. A summaryassessment o several alternative options is set out
below.
Adjustment mechanism Assessment
Decrease in asset lives NGN agree with the work completed by Ogem in evaluating the appropriate economic lives in gas
distribution and that 45 years remains the appropriate basis or depreciating these assets. Shortening these
asset lives and increasing depreciation represents a permanent pull orward o allowed revenue rom uture
periods at the expense o current customers and is not an appropriate mechanism or addressing the
transitory nanceability eects o Repex capitalisation. It may also impact investor perception about the long
term uture o gas distribution networks.
Increase in weighted average
cost o capital (WACC)
An increase in the weighted average cost o capital would provide the necessary increase in allowed
revenues to address the negative operating cash fow position presented. However this simply represents
a transer o unds directly rom customers to shareholders without any compensating reduction in uture
customer bills. As such it does not represent an equitable mechanism or addressing our short term
nanceability requirements.
Decrease in notional gearing Reductions in notional gearing, or a given cost o equity, will increase the WACC and provide additional
allowed revenue to address nanceability issues. This change does however provide an increased role
or equity providers in nancing the investment programme but must be assessed against the ability o
providers o equity to achieve appropriate returns.
Change in capitalisation rate
(increasing the Fast:Slow Money
split)
Adopting a capitalisation rate that increases the percentage o Fast money (consequently reducing the
amount allocated to RAV) represents a pull orward o money rom uture periods to within RIIO-GD1.
Importantly this will be compensated by lower allowed revenue and customer bills in uture periods ensuring
that the longer term benet or customers is maximised. These arrangements can be implemented on a
short term basis to refect the relatively short time to accommodate the period o transition required to
address the impact o the capitalisation o Repex.
Figure 8.13: Options or transition arrangements

7/22/2019 Ngn Business Plan
http://slidepdf.com/reader/full/ngn-business-plan 211/224
211
8.5.2 Capitalisation rate and notional gearing
Based on this analysis we consider that the best
options or transition would be either through
changes to notional gearing and/or capitalisation
ratios. The matrix below summarises our analysis
to determine the potential mix o Fast:Slow
Money and notional gearing that could deliveran acceptable PMICR ratio o 1.7x (highlighted in
orange), which is one o the key requirements in
determining the nanceability o our business plan.
Figure 8.14: Capitalisation rate and notional gearing
Notional Gearing 62.50% 60.00% 57.50% 55.00%
PMICR Debt:RAV PMICR Debt:RAV PMICR Debt:RAV PMICR Debt:RAV
Fast Money %
37% 1.2 63.8% 1.3 60.9% 1.4 58.0% 1.5 55.1%
39% 1.3 63.5% 1.4 60.5% 1.5 57.6% 1.7 54.7%
41% 1.4 63.1% 1.5 60.1% 1.6 57.2% 1.8 54.2%
43% 1.5 62.7% 1.6 59.7% 1.7 56.8% 1.9 53.8%
45% 1.6 62.4% 1.7 59.3% 1.8 56.3% 2.0 53.3%
47% 1.7 62.1% 1.8 58.9% 1.9 55.9% 2.1 53.0%
49% 1.8 61.6% 1.9 58.5% 2.0 55.6% 2.2 52.5%

7/22/2019 Ngn Business Plan
http://slidepdf.com/reader/full/ngn-business-plan 212/224
212
Figure 8.15 clearly demonstrates that either
changing notional gearing or capitalisation rates,
or a combination o the two, could be used
to manage transition. The exact mix clearly
depends on whether one option has undamental
advantages over the other when considering the
impact on all stakeholders, and these options arediscussed below.
i Change in notional gearing
In order to mitigate the cash fow and
nanceability issues highlighted in Section 8.3,
notional gearing would need to decrease rom
the current 62.5%. The table below summarises
what happens when notional gearing is
decreased by 2.5% in incremental steps down to
55.0%.
As can be seen, successive reductions in notional
gearing have a positive impact on PMICR. This is
driven by the ollowing actors:
• The WACC increases, which drives a c.£2m p.a.
increase in return on RAV;
• Notional interest payments reduce which
increases the tax allowance by a urther c.£1m
per year; and
• Equity RAV increases, which increases potential
returns on equity RAV by c.£2m per year and
partially osets the points above.
When calculating PMICR, the increase in returns
does not impact the ratio in year, as it does not
aect net operating cash fow. It will, however, have
some impact in subsequent years as it will lead to
higher debt and thereore increased interest costs
in the PMICR ratio. Thereore the overall impact
is to provide an extra c.£3m o allowed revenue
annually which drives the improving PMICR
position shown in the table above.However, the drawbacks o this approach are
signicant. The transer o money rom customers
to shareholders without any compensating
reduction in charges in uture years is in our view
clearly inequitable. Furthermore, we have already
identied that reducing notional gearing beyond
62.5% will drive reducing returns on regulatory
equity to levels that are unacceptable to equity
investors. This is in turn likely to increase the
perception o risk within the regulatory ramework and place upward pressure on the long term cost
o equity or the sector.
ii Change in capitalisation rate
Increasing the relative Fast Money split would
increase allowed revenue and return more cash
to the company, improving the net cash fow
rom operating activities and in turn improve the
PMICR ratio.
The key advantages to using Fast Money as
the primary mechanism o transition include the
ollowing:
• It reduces the amount o expenditure going
into the RAV, reducing any burden on uture
generations o customers to pay back sunk
costs, and reducing the perceived risk in the
eyes o investors.
• It also reduces the return on RAV due to this
lower RAV, reducing the long term nancing
costs unded by customer bills.
• It does not decrease the tax shield rom interest
payments in the tax allowance.
Figure 8.15: Notional gearing transition
Notional gearing % 62.5% 60.0% 57.5% 55.0%
WACC 4.44% 4.55% 4.66% 4.77%
Return on RAV 77 79 80 82
Tax allowance 26 27 28 29
Allowed revenue 367 370 373 376
Equity injection 102 142 181 221
5% return on equity RAV 34 36 38 40
PMICR 1.7x 1.8x 1.9x 2.1x

7/22/2019 Ngn Business Plan
http://slidepdf.com/reader/full/ngn-business-plan 213/224
213
Our business plan shows an increase in the Fast
Money rate rom 39.5% to an average o 47% over
the ull RIIO-GD1 period.
This will ensure strong interest coverage within
PMICR o c.1.7x in each year (consistent with
the level delivered in GDPCR1) to ensure this
business plan is ully nanceable. This is driven by
the improved EBITDA and stronger net operating
cash fow. However, both o these measures still
show reductions rom those achieved at the end o GDPCR1.
Even with our proposed transition arrangements,
net operating cash fow despite the improved
EBITDA constantly remains negative, moving
NGN rom a position o being a cash generator, to
consistently having a net cash outfow. This implies
that debt must increase year-on-year to maintain
the status quo, and that any return to the equity
holders must be ully unded rom debt.
Compared to the base RIIO-GD1 proposals without
transition, there is improvement in all credit ratios
due to the increase in cash generated by the
marginal increase in allowed revenue.
Figure 8.16: RIIO-GD1 Fast:Slow Money split
Using notional gearing or transition has none
o these positives. Importantly, rom a customer
perspective, reducing notional gearing simply
increases the WACC and increases the real cost to
the customer, whereas increasing the relative Fast
Money split returns capital earlier to the investors,
which importantly reduces the real cost to thecustomer.
Thereore we consider using the Fast Money split
as the most appropriate mechanism to deliver
transitional arrangements within this business plan.
RIIO-GD1 proposals Base 13/14 14/15 15/16 16/17 17/18 18/19 19/20 20/21
Fast Money (%) 39.5 54.5% 43.3% 46.7% 45.3% 47.8% 46.5% 46.5% 45.4%
Slow Money (%) 60.5 45.5% 56.7% 53.3% 54.7% 52.2% 53.5% 53.5% 54.6%
8.5.3 Transitional arrangements
in this business plan
Based upon the analysis in Section 8.5.2, our
nancial proposals include a requirement ortransition which is achieved through an adjustment
to the Fast:Slow Money split over the period. The
proposed adjustments are set out below.
MetricOutcome
- Ogem base
Outcome NGN
proposals
PMICR 1.3x 1.7x
Notional net debt to RAV 64% 62.5%
FFO interest cover c.2.8x c.3.3x
FFO to net debt c.9.6x c.12x
RCF to Capex c.0.6x c.0.8x
Regulated equity over EBITDA c.2.4x 9.1 – 2.3x
Figure 8.17: Equity and credit metrics

7/22/2019 Ngn Business Plan
http://slidepdf.com/reader/full/ngn-business-plan 214/224
214214
8.5.4 Summary
Overall, under this scenario all o NGN’s key equity
and credit metrics should deliver the minimum
required to maintain our existing strong investment
grade ratings. NGN would continue to comply with
the critical terms o its current loan provisions, and
achieve ratios commensurate with its current creditratings, but with limited headroom.
In summary thereore, the transitional arrangements
in this business plan will allow NGN to:
• maintain our current investment grade credit
ratings;
• raise the necessary additional nance to deliver
planned investment during RIIO-GD1;
• reduce the volatility in customers’ bills betweenregulatory periods; and
• deliver this within an overall lower cost o capital.
The outcome o our transitional arrangements on
the nancial outcomes o our business plan are set
out in Section 8.2.
8.6 Rewards for frontierperformance
One o the key strengths o the UK regulatory
ramework is the strong eciency incentives that
it provides companies both within regulatory
periods and also importantly across regulatory
periods. NGN has consistently achieved rontier
levels o perormance in Opex, Repex and Totex
expenditure since 2005. This continual extension o
the eciency rontier has created signicant value
or customers within NGN’s area and across theUK.
Ogem has recognised this explicitly in previous
regulatory decisions where it has provided or
the most ecient companies to earn a base rate
o return in excess o the industry average cost
o equity. This provides very clear incentives or
companies to continue to drive cost eciencies
over the whole o the price control period.
There are a number o ways in which the overallvalue o the customer benet delivered by NGN’s
rontier perormance can be quantied.
• Apply the same rewards in RORE terms as or
the rontier companies during the last electricity
distribution network price control (DPCR5).
• Quantiy the cost reductions NGN has driven
rom all GDNs since GDPCR1 by operating at
the eciency rontier rather than as an average
perormer.
• What additional allowances NGN would receive
using an upper quartile benchmarking approach.
As an example, Figure 8.18 below uses the second
o these techniques and shows the aggregate
annual industry cost savings (using 2008/09 and
2009/10 industry costs) that NGN has driven
through operating as the most ecient GDN ratherthan as an average GDN.
Figure 8.18: Value created by NGN’s rontier perormance
0
5
10
15
20
25
30
35
40
Opex Repex Totex
A g g r e g a t e i n d u s t r y a n n u a l c o s t s a v i n g s
( £ m 2
0 0 9 / 1 0 p r i c e s )
Annual value for customers created by
NGN’s frontier performance
14
23
37

7/22/2019 Ngn Business Plan
http://slidepdf.com/reader/full/ngn-business-plan 215/224
215215
This analysis shows NGN has created c.£40m
per year o value across the gas industry through
extending the eciency rontier, (i.e. c.£200-300m
across RIIO-GD1). This is delivered to customers
through lower regulated revenues which have been
determined by moving all companies towards the
benchmarked levels o eciency set by NGN.When applying the alternative methodologies and
comparing them to previous regulatory precedents
we obtain similar results. We believe this approach
must be maintained under the RIIO-GD1
ramework and rewards should be set to refect
the value that NGN as the rontier company has
created. Similar to the approach taken by Ogem
at DPCR5, allowances that mean NGN can earn
base returns in excess o the determined cost
o equity must be considered or RIIO-GD1. This
would equate to a c.1.5% increase in base returns
on regulatory equity or c.£10-15m per year during
the period.
The RORE graph below in Figure 8.19 illustrates
the result o rewarding NGN or our historic
perormance and the value created or UK gascustomers. The RORE range increases rom 3.1-
10% to 3.1-11.3%. We believe this represents a
more appropriate RORE range and risk-reward
ramework or a rontier perorming company.
This approach is wholly consistent with Ogem’s
regulatory precedent and the core incentive
principles o RIIO and a rontier reward should be
refected in NGN’s nal allowances.
Figure 8.19: Return On Regulatory Equity (RORE)
Gearing
Environemntal
emissions
incentiveStakeholder
engagement
incentive
Complaints
Customer service
incentive
Shrinkage
Costs
Frontier
RORE
Information quality
incentive
Cost of debt
Pensions
NGN-GDPCR1 RIIO-GD1 RIIO-GD1
(inc.Frontier)
12%
11%
10%
9%
8%
7%
6%
5%
4%
3%
2%
R O R E R a n g e

7/22/2019 Ngn Business Plan
http://slidepdf.com/reader/full/ngn-business-plan 216/224
7/22/2019 Ngn Business Plan
http://slidepdf.com/reader/full/ngn-business-plan 217/224
NGN’s business plan is based upon the principle of continuing to deliver
value for money for the network’s customers whilst maintaining high
standards of safety, customer service and environmental responsibility.
The nancial impact of this business plan on customers’ bills is detailed
in this section.
217
9Impactoncustomerbills

7/22/2019 Ngn Business Plan
http://slidepdf.com/reader/full/ngn-business-plan 218/224
218
Executive summaryOur stakeholders have told us we must continue
to deliver value or money, achieving high
perormance at minimal cost. This has been the
key challenge throughout the development o this
business plan.
We have committed to achieve 56 business
output measures, improving perormance in 35
and maintaining current perormance levels in the
remaining 21. Our commitment to saety, reliability,
environmental sustainability and customer service
underpins our objective to meet our customers’
demands and to remain the most cost-ecient
GDN. This is predicated upon the need or nancial
stability, giving the correct balance o risk and
reward between customers and investors.
We believe our new Total Network Management
approach will provide the ocus and direction
or the successul delivery o this business plan,
providing a gas distribution network which
continues to deliver energy, saely and securely,
to 2.6m homes and businesses across the North
o England. We will continue to provide signicant
levels o value or our customers by extending the
eciency rontier which we have set or the past six
years.
This business plan represents the most ecient
way o meeting our customers’ needs and can be
delivered or an increase in bills o one penny a day.

7/22/2019 Ngn Business Plan
http://slidepdf.com/reader/full/ngn-business-plan 219/224
219
9.1 Background As we have demonstrated throughout this plan, we
are acutely aware o the impact that our operations
have upon customers in terms o the level o
service provided, the saety and reliability o our
system and particularly the cost o providing our
services has upon customers’ overall energy bills.
The impact on customer bills and the overall value
or money o this business plan were highlighted
very clearly during our stakeholder engagement
or RIIO-GD1. We have ensured that expenditure is
directly linked to the outputs we are proposing to
deliver and that customers can clearly identiy that
they are receiving a value or money service.
This section sets out the impact o our proposals
on customers’ energy bills, highlighting the
increased service levels that will be delivered in
RIIO-GD1. In particular we set out analysis o:
• RIIO-GD1revenuecomparedtoGDPCR1
revenue; and
• Averageimpactuponannualdomesticgasbills.
We also discuss proposals to try and address a
major concern rom one o our key stakeholder
groups (gas shippers) in relation to charging
volatility.
9.2 RIIO-GD1 revenueNGN’s regulated revenues are orecast to average
c.£366m per year (2009/10 prices) post IFRS
during RIIO-GD1, which represents an increase o
8% on average when compared to the nal year o
allowed revenue o GDPCR1 (2012/13).
The single largest driver o this increase is the
change to the implementation o IFRS accounting
principles which is due to take place in 2014/15.
The largest impact upon NGN’s revenues derives
rom the accounting treatment o Repex which
moves to being treated as Capex. This leads to
NGN receiving a signicantly higher tax liability, and
a corresponding revenue allowance to match the
liability. Our regulated revenue unds an ecient
level o this liability and requires an increase o
c.£26m annually throughout RIIO-GD1.
Neither o these items will generate any benet
to NGN, and both are outside our control.
Consequently, when evaluating the impact on
customer bills and value or money over RIIO-GD1,account must be taken o these changes and
adjusted so a valid comparison can be made. I
we exclude the impact o IFRS, average annual
revenue reduces rom c.£366m to c.£342m.
9.3 Customer billsWhen the impact o IFRS is removed then the
underlying increase in customer bills is one penny a
day increase by the end o RIIO-GD1 as illustrated
below.
Figure 9.1: NGN’s orecast allowed revenue
Figure 9.2: NGN annual allowed revenue excluding IFRs (pence/day
per customer)
Including IFRS
Excluding IFRS
GDPCR1
0
50
100
150
200
250
300
350
400
450
2 0 0 8
/ 0 9
2 0 0 9
/ 1 0
2 0 1 0
/ 1 1
2 0 1 1
/ 1 2
2 0 1 2
/ 1 3
2 0 1 3
/ 1 4
2 0 1 4
/ 1 5
2 0 1 5
/ 1 6
2 0 1 6
/ 1 7
2 0 1 7
/ 1 8
2 0 1 8
/ 1 9
2 0 1 9
/ 2 0
2 0 2 0
/ 2 1
£ m ( 2
0 0 9 / 1 0 P r i c e s ) GDPCR1
RII0-GD1
NGN’s annual allowed revenue
0
5
10
15
20
25
30
35
40
2 0 0
8 / 0 9
2 0 0
9 / 1 0
2
0 1 0 / 1 1
2
0 1 1 / 1 2
2 0 1
2 / 1 3
2 0 1
3 / 1 4
2 0 1
4 / 1 5
2 0 1 5 /
1 6
2 0 1
6 / 1 7
2 0 1 7 /
1 8
2 0 1
8 / 1 9
2 0 1
9 / 2 0
2 0 2
0 / 2 1
£ m ( 2
0 0 9 / 1 0 P r i c e s )
P e n c e / d a y p e r c u s t o m e r
GDPCR1 RII0-GD1
NGN annual allowed revenue - Excluding IFRS(Pence/day per customer)
Excluding IFRS
GDPCR1

7/22/2019 Ngn Business Plan
http://slidepdf.com/reader/full/ngn-business-plan 220/224
220
This analysis is based upon the ollowing
assumptions.
• The energy component o annual customer bills
stays constant over the period at around £625.
• Customer SOQs (refecting the capacity element
o transportation charges) all in line with NGN’s
orecast o reduction in demand.
Overall, when including the impact o IFRS,
customer bills will increase by an average o £11
per year, or 3p/day. The size o these overall
changes in customer bills directly highlights the
reasons we have sought throughout this plan to
consider and limit the impact o our proposals on
gas customers.
These small increases in revenue must be viewedagainst the levels o expenditure and commitments
made in the rest o this plan which aim to deliver
enhanced outputs and levels o service throughout
RIIO-GD1.
This commitment will deliver a gas distribution
network with signicantly higher standards o
saety, improved network integrity and security o
supply, and considerable reductions in emissions
into the environment.
NGN has continually challenged the level o
orecast costs that will apply or RIIO-GD1 and
is committing to a 1% annual real productivity
improvement or the whole timerame. This
represents a commitment to continual
improvement and the maintenance o industry
leading perormance which are consistent with our
corporate strategy.
9.4 Charging volatility andpredictability
Charging volatility is a key issue or GDNs and
shippers, with both parties seeking stable and
predictable pricing structures. NGN is inherently
aware o this industry-wide concern and has
ully acknowledged recent concerns raised
rom shippers. NGN has worked hard in the
current price control period to provide stable
and predictable prices, identiying key drivers o
charging volatility and ocusing specic attention
on these areas. As a result NGN has provided
some o the most stable and consistent price
changes amongst the GDNs throughout GDPCR1.
Throughout RIIO-GD1 we will continue to work to
mitigate any issues creating charging volatility.NGN welcomes the decision, published in July
2011, on RPI indexation o allowed revenue, under
which RPI orecasts published by HM Treasury
are to be used with a two year lagged true-up
adjustment to the actual outturn RPI or that year.
Uncertainty regarding infation during the economic
downturn in the current price control period has
had a signicant impact on orecasting allowed
revenues and this approach will mitigate any such
impact in RIIO-GD1.
In addition to the change to RPI, NGN is keen
to consult on a number o issues pertaining to
charging volatility, which include the ollowing.
• Consideration on the timing and implementation
date o SOQ changes on network capacity,
established as part o the AQ Review carried out
each ormula year. Around 97% o transportation
charges are based on the capacity o the
network and any SOQ changes, which havehistorically been very dicult to orecast, can
potentially have a signicant impact on charges
as any reduction to the network requires an
increase in transportation charges to ensure
the GDNs receive their allowed revenues. NGN
believes that dissociating the requirements o
SOQs or planning purposes rom those involved
in the pricing process could be a credible
solution.

7/22/2019 Ngn Business Plan
http://slidepdf.com/reader/full/ngn-business-plan 221/224
221
• Delaying the impact o certain revenue
adjustments to ensure actual rather than orecast
gures are incorporated into allowed revenue
each ormula year, thereore removing the
requirement to use orecast gures when GDNs
set their prices in January each year.
• Increased collaboration and engagement with
the NTS in price setting, particularly ollowing
Exit Reorm in October 2012.
We believe that debating these issues oers the
most suitable and practical approach to ensuring
charging volatility is reduced throughout RIIO-
GD1. However, this is an ongoing process andthere needs to be fexibility, particularly given the
unknown impacts o initiatives, such as smart
metering and bio-methane entry, on charging
volatility.
Other proposals which have been discussed
recently, either as part o RIIO-GD1 or through
charging methodology ora, include placing cap/
collars on allowed revenues and the smoothing o
any under or over recovery in each ormula year.
NGN has modelled scenarios based on these
dierent approaches and determined that they
only add to uncertainty and volatility rather than
providing the required stable and predictable
charges.
We are, consequently, opposed to both these
suggestions. However, NGN remains ully
committed to working with and assisting shippers
on this dicult issue in appropriate charging
consultations and other groups.

7/22/2019 Ngn Business Plan
http://slidepdf.com/reader/full/ngn-business-plan 222/224
222

7/22/2019 Ngn Business Plan
http://slidepdf.com/reader/full/ngn-business-plan 223/224
223

7/22/2019 Ngn Business Plan
http://slidepdf.com/reader/full/ngn-business-plan 224/224

![[PPT]RTMM, VoIP, VVoIP, NGN? - Rhodes · Web viewRTMM, VoIP, VVoIP, NGN, Convergence? Alfredo Terzoli / Mosioua Tsietsi PLAN Admin Real time communication today: your experience A](https://img.pdfslide.net/doc/110x75/5aa1f8287f8b9a1f6d8c9bee/pptrtmm-voip-vvoip-ngn-rhodes-viewrtmm-voip-vvoip-ngn-convergence-alfredo.jpg)


![[PPT]NGN Management Specifications - Internet · Web viewAnnex 2 to NGN Management Specification Roadmap NGN Management Specifications Annex 2 to NGNMFG-OD-013-R2, NGN](https://img.pdfslide.net/doc/110x75/5aa1f8287f8b9a1f6d8c9bec/pptngn-management-specifications-internet-viewannex-2-to-ngn-management.jpg)