Embed Size (px)
Citation preview
7/27/2019 NHIỆT ĐỘ PHÂN CẮT
http://slidepdf.com/reader/full/nhiet-do-phan-cat 1/11
International Journal of Engineering & Technology IJET-IJENS Vol:12 No:06 36
1210606-3939-IJET-IJENS © December 2012 IJENS I J E N S
Determination of Optimal Cut PointTemperatures at Crude Distillation Unit using the
Taguchi MethodSyed Faizan Ali , Nooryusmiza Yusoff
Abstract — This paper proposes a technique for optimizingcrude cut points . Taguchi method is applied in the selection of thesignificant variables and their respective optimal levels for afractionation process. The variables considered were the cutpoint temperatures of products, namely, naphtha, kerosene, lightand heavy diesels, atmospheric gas oil and the residue. Thevariables were assigned lower and upper bounds with adifference of ± 13.9°C (± 25°F) from the standard straight-runcut points. A steady-state model of a Crude Distillation Unit
(CDU)is used as a virtual plant to carry out the fractionation of 100 kilo barrels per day of crude oil. S traight-run casescomprising of three Malaysian crude oils, namely, Bunga Kekwa,Bintulu and Tembungo, were analyzed as single, binary andternary crude feeds. In each case, an optimal configuration of variables was determined by minimizing the energy required forthe production of one kilo barrel/day of diese l.
I ndex Term-- Crude Distillation Unit, Cut-point Optimization,Diesel Production, Taguchi Method
I. I NTRODUCTION Petroleum refineries have advanced periodically with the passage of time. Refinery operations for the creation of products such as Naphtha, Diesel, Kerosene and Gasolinehave grown complex affecting the refinery profit. Limitationssuch as safety and environmental regulations , for maintaining plants to run at cleaner proces ses, are some constraints toachieve such profits [1].
Crude oil trapped in different reservoirs of the world of aspecific field hold unique characteristics from one another ona physical and chemical basis [2]. The first classification of crude can be done in „light and „heavy crude s havingrespective importance with regard to profit extraction.
Classification of crude oil is based upon the difference inspecific gravities and the proportion with which they form.Product demand is met by proportioned blending of crude.
Seasonal scheduling of the crudes is carried out in order to produce opt imized cuts [3]. The type of product requiringgreater operating cost resulting in lesser profit is subtractedfrom the crude to meet the demand supply.
Syed Faizan Ali and Nooryusmiza Yusoff are with the Chemical Engineerin gDepartment, Universiti T eknologi PETRONAS, 31750 Tronoh, P erak,
Malaysia (email:[email protected])
Refineries fractionate these barrels of crude by their boilin points in order to obtain high value products such as gasolindiesel, jet fuel, heating oil, fuel oil, lubricants, asphalt, cokewax, and chemical feed stocks [4].
Many studies have been published related to cruddistillation unit (CDU) study with reference to refinery planning and scheduling [5]-[7], estimat ion of produc properties [8]-[9] and process control, modeling, simulatioand optimization [10]-[12]. Optimization of a crudedistillation unit using a binary feed was carried out on th bas is of the gross profit instead of the cos ts inferred by energand raw materials [10]. An atmospheric distillation unsubjected to transient behavior due to changes in the operatinconditions can be improved by a suitable control strategy tobtain better operations [11]. An expert system was designefor a CDU to predict the product flow and temperature value by minimizing the model output error by genetic algorith mframework and maximizing the oil production subjected tcontrol parameters [12].
Optimization has been previously carried out by devising process control strategy, rigorous modeling and improvedesign specifications. The performance of the CDU usinstraight run cut points for several types of crude oil such aTapis (44.8), Bintulu (36.0) and Terengganu (47.4) where thoptimization objective was a profit function (total producvalue – feed cost – utility cost) using AspenTech DMC+ (anAPC technology) [13]. The literature cited above deduces ththe optimization based on the crude cut points have not beegiven much importance. Previously, straight run temperaturehave been applied on every type of crude in order to optimiza crude distillation system. The objective of this article is detailed design constituting the crude cut points to minimizthe amount of energy utilized to produce a kilo-barrel per da
of a product (for e.g. diesel) using optimized cut pointemperatures.This study can be regarded valuable for the operation
personnel concerned with the planning and scheduling of thcrude feed involving the blending of d ifferent crudes to reducthe supply-demand gap of the refinery products. It deals withcrude distillation unit modeled in Aspen HYSYS environmenThe methodology devised for the crude optimization is baseon a design of experiments technique known as Taguchmethod. The optimization variable involved is the overal
7/27/2019 NHIỆT ĐỘ PHÂN CẮT
http://slidepdf.com/reader/full/nhiet-do-phan-cat 2/11
International Journal of Engineering & Technology IJET-IJENS Vol:12 No:06 37
1210606-3939-IJET-IJENS © December 2012 IJENS I J E N S
energy required in order to produce a kilo barrel of a product,which in this study is diesel.
Section II deals with the background study of the crudeassays considered followed with the process description for simulating the process. Section III discusses the methodologyof the paper formulated, initiating from the c rude specification procedure in HYSYS, an overview to the Taguchi design of study and the devised case studies. In Section IV, theoptimized results are outlined with emphasis on determiningthe cut-point recipe and shifting of TBP curves to producesuch beneficial results. Finally, the last section concludes thestudy of this work and recommended future studies to thiswork.
II. BACKGROUND A. Crude Assay
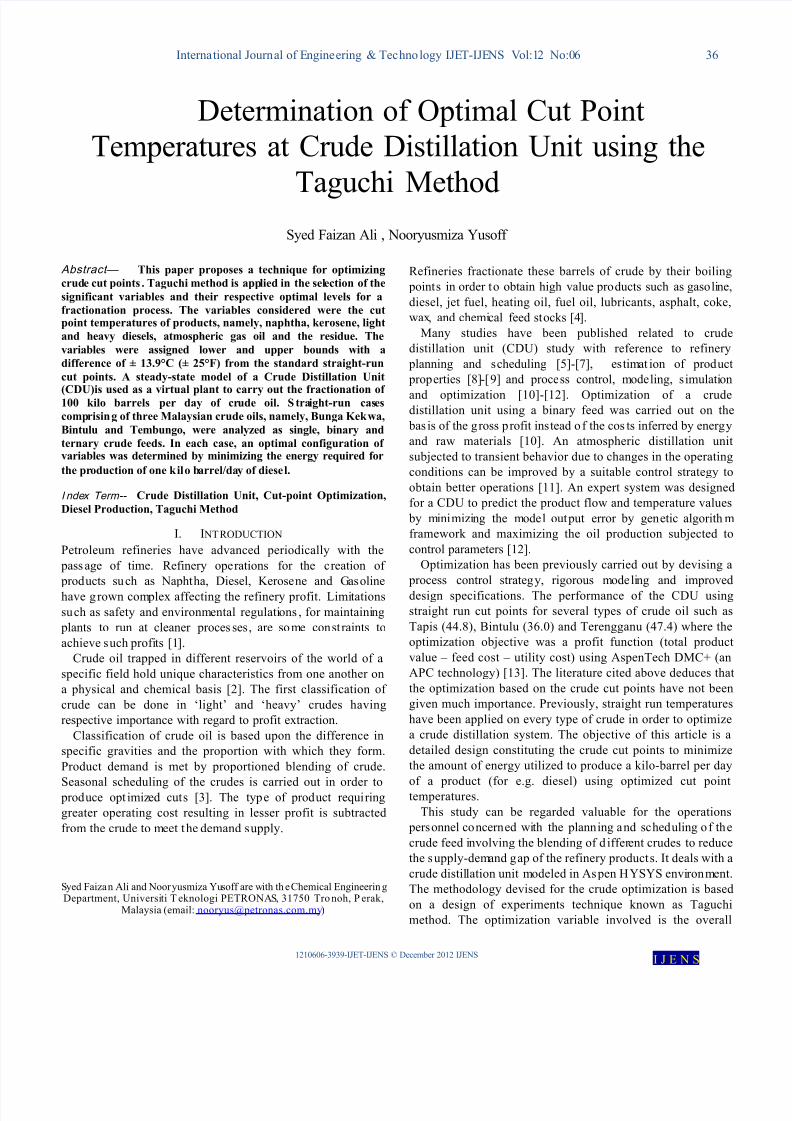
Refining engineers analyze the True Boiling Points (TBP)curves of the cuts present to determine the behavior of thecrude distilled and various saleable products [14]. The crudeassays considered are taken from the different fields of Malaysia namely Bintulu, Tembungo and Bunga Kekwa.
These crude assays have been obtained from the Assaymanual published in December 2003 by KBC AdvancedTechnologies Inc. The samples date back to October 1994(Bintulu), November 1997 (Bunga Kekwa) and October 1986(Tembungo). With 0.5% sulfur content as a limit, sweet crudehas been observed ranging from 0 to 0.08% by weight. Thespecific gravities and the sulfur content are shown in Tab. I:
TABLE I CRUDEDATA
Crude Assay APIValues
SpecificGravity (15°C)
Sulfur content(wt. %)
Bintulu 36.0 0.8445 0.020Tembungo 36.6 0.8415 0.064
Bunga Kekwa 36.9 0.8400 0.049
Fig. 1. True boiling point curves
From the HYSYS oil manager, the straight run analyses yield25.6% diesel from Bintulu crude, 37.6% from Tembungocrude and 29.1% from the Bunga Kekwa crude; thus
indicating that the Tembungo crude produces more diesel acompared to other two crudes. Fig. 1 shows that Bintulu anTembungo have comparable TBP profiles whereas BungKekwa crude comprises heavier components .
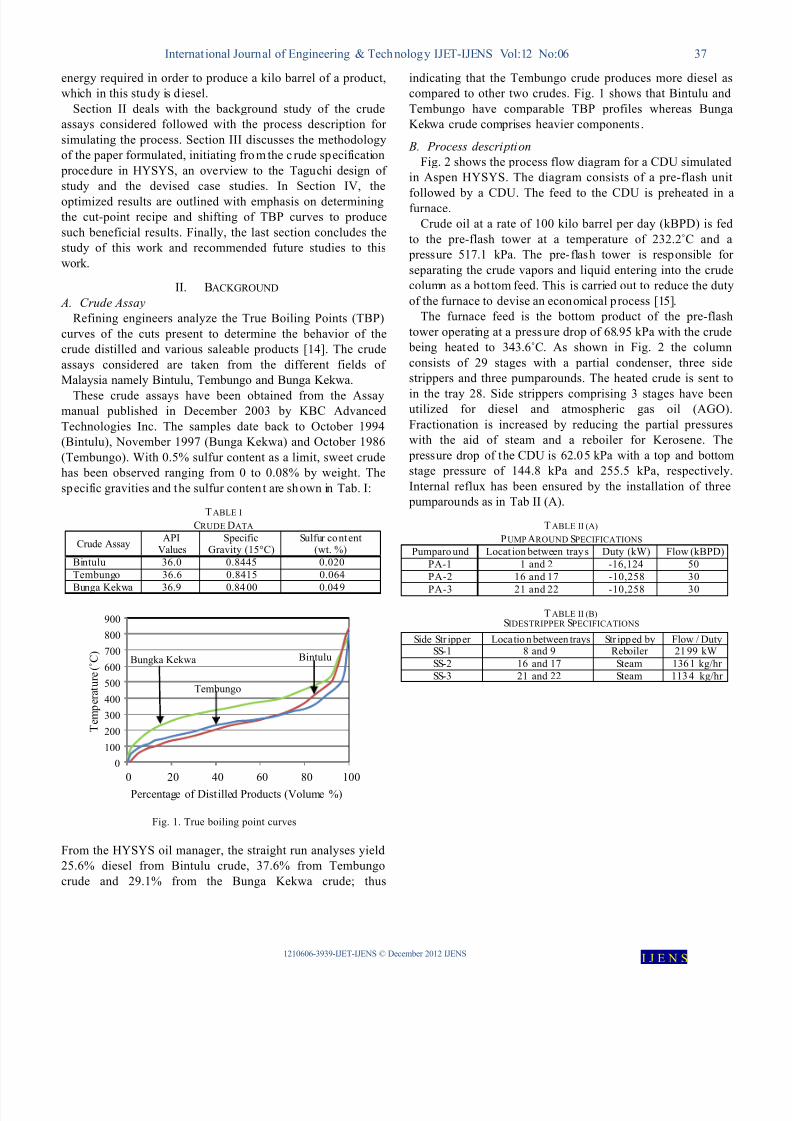
B. Process descriptionFig. 2 shows the process flow diagram for a CDU simulate
in Aspen HYSYS. The diagram consists of a pre-flash un
followed by a CDU. The feed to the CDU is preheated in furnace.Crude oil at a rate of 100 kilo barrel per day (kBPD) is fe
to the pre-flash tower at a temperature of 232.2˚C and a pressure 517.1 kPa. The pre-flash tower is responsible foseparating the crude vapors and liquid entering into the crudcolumn as a bottom feed. This is carried out to reduce the duof the furnace to devise an economical process [15].
The furnace feed is the bottom product of the pre-flastower operating at a pressure drop of 68.95 kPa with the crud being heated to 343.6˚C . As shown in Fig. 2 the columnconsists of 29 stages with a partial condenser, three sidstrippers and three pumparounds. The heated crude is sent tin the tray 28. Side strippers comprising 3 stages have beeutilized for diesel and atmospheric gas oil (AGO)Fractionation is increased by reducing the partial pressurewith the aid of steam and a reboiler for Kerosene. Th pressure drop of the CDU is 62.05 kPa with a top and bottostage pressure of 144.8 kPa and 255.5 kPa, respectivelyInternal reflux has been ensured by the installation of thre pumparounds as in Tab II (A).
TABLE II (A)PUMPAROUNDSPECIFICATIONS
Pumparound Locat ion between trays Duty (kW) Flow (kBPD)PA-1 1 and 2 -16,124 50PA-2 16 and 17 -10,258 30
PA-3 21 and 22 -10,258 30
TABLE II (B) SIDESTRIPPER SPECIFICATIONS
Side Str ipper Locatio n between trays Str ipped by Flow / DutySS-1 8 and 9 Reboiler 2199 kWSS-2 16 and 17 Steam 1361 kg/hr SS-3 21 and 22 Steam 1134 kg/hr
0100200300400500600700800900
0 20 40 60 80 100
T e m p e r a t u r e
( ˚ C )
Percentage of Distilled Products (Volume %)
Bungka Kekwa
Tembungo
Bintulu
7/27/2019 NHIỆT ĐỘ PHÂN CẮT
http://slidepdf.com/reader/full/nhiet-do-phan-cat 3/11
International Journal of Engineering & Technology IJET-IJENS Vol:12 No:06 38
1210606-3939-IJET-IJENS © December 2012 IJENS I J E N S
Fig. 2. Process Flow Diagram of CDU
The partial condenser is operated at a pressure of 135.83kPa with waste water as the side product. The distillate(naphtha) rate is maintained at 20 to 25 kBPD. The refluxratio is fixed at 1.7 corresponding to a reflux flow rate of 34to 42 kBPD. The bottom steam entering at tray 28 isexchanging heat twice, i.e. absorbing heat from the liquidflowing down the trays and then exchanging heat with theupward flowing vapors, entered at a rate 3402 kg/hr at190.6˚C and 1034 kPa. The over flash is spe cified at the tray27 with 3.5% of the feed.
Straight run analyses have been carried out to determinethe volume percent of the distilled products namely Off-gas, Naphtha, Kerosene, Diesel, AGO and Residue. These products are further subjected to physical and che micalseparation processes for better quality in, for example; thevacuum distillat ion unit (VDU), fluid catalytic cracking unit(FCCU) and hydrocracker. The summary of the processconfiguration is shown in the Tab. III.
TABLE IIICDU SPECIFICATIONS
Parameter Value
No. of ideal tray sTemperature
Pressure
No. of pumparounds No. of side strippersFeed rateFeed Locat ionFeed TemperatureFeed PressureReflux rat ioCondenser type
29169.2˚C (top stage) 355.6˚C (bottom stage) 144 .8 kPa (top stage)255.5 k Pa (bottom stage)33100 kBPDTray 28343.6˚C 448.2 kPa1.7Part ial Condenser
III. METHODOLOGY A. HYSYS Crude Specification
In HYSYS, components and the thermodynamic fluid package (Peng-Robinson) are defined to create thesimulation basis. In HYSYS Oil manager characterizes thecrude assay to generate the hypothetical components withtheir respective physical and critical properties. Thecorrelations and calculations performed in the oil manager are all in accordance with the API technical data book.
The crude assay is defined with the TBP assay type togenerate an internal TBP curve at atmospheric conditions
AtmosphericDist illati on Unit
Furnace Residue AGO
Diesel
Kerosene
Naph tha
Crude
Middle . Pumparound
Top Pumparound
Bottom Pumparound
Condenser
Cooling Water
SS - 1
SS - 2
SS - 3
Reboiler
Reflux
Separator
Crude Vapor
Tower feed Mixer
Bottom Steam
Steam
Steam
1
28
29
7/27/2019 NHIỆT ĐỘ PHÂN CẮT
http://slidepdf.com/reader/full/nhiet-do-phan-cat 4/11
International Journal of Engineering & Technology IJET-IJENS Vol:12 No:06 39
1210606-3939-IJET-IJENS © December 2012 IJENS I J E N S
for the characterization method. The assay definition is based on the API gravity, dist illation data and the inputcomposition of the components from Methane- Pentane (C1-C5). However, sulfur contents are not specified in this work.The extreme ends of the distillation TBP curve areextrapolated.
Aspen HYSYS calculates the blend of a single or multip lecrudes with their respective flow rates defined. The numbersof cuts are defined using the values for boiling point rangesas shown in the Tab. IV. It generates the hypotheticalcomponents on the „light ends free basis to obtain moreaccurate results. Half of the crude is fractionated into thecuts ranging from gas oil to a low boiling point gas. Initial boiling point (IBP) has been determined as a weightedaverage boiling point from the components present in thefirst volume percent if the distilled crude. The boiling pointsof these components are utilized as 1% of the IBP and 98%of the final boiling point (FBP). The FBP is determinedsimilarly using the components found from 98-100% of thedistilled crude. Later the assay is distributed by specifyingthe cut input information before it can be installed into thesimulation environment.
The calculation of the energy per diesel product flow has been carried out by considering the pure energy streamsentering and exiting into the system and not by the energywithheld by the material streams, thus only accounting for the energy consumption due to utilities only.
TABLE IV TBP RANGES ANDCUTS[6]
TBP range ΔT No. of cuts< 38°C (<100°F) Pent anes and Lighter 38 – 427°C (100-800°F) 14 °C 28
427 – 649°C (800-1200°F) 28 °C 8649 – 871 °C (1200-1600°F) 56 °C 4
B. Taguchi Method Taguchi design is a statistical technique to optimize the
process design problems in d ifferent engineering disciplines.It implies the formation of a layout of the experiments bythe combination of factors to obtain the nu mber of tests to be performed. Besides Taguchi method, the factorial des ignmethods are also utilized to examine the combination of factors involved to arrive at the best product. It has certainshortfalls with respect to the number of parameters involved,which are as follows:
Time consuming and costly Different outputs of the different configuration
of the same experiment Influence of factors cannot be determined
Taguchi method is considered as an off-line optimizationmethod for the designing of system from the parametersinvolved. System design can be considered as the formationof the experiments on the basis the engineering principles
employed and process limitations. Parametric designdetermines the optimum state due to the design factors at aspecific point.
In the beginning, Taguchi design has been only used inthe manufacturing sector to devise the most economical wayof building equipments with the best performance. Later it
evolved and proved quite helpful in the process industry tocharacterize the performance of an operation and has been proven highly effective in order to study the effects of themultip le factors involved and the influence of the factors onthe performance of an experiment.
Reliable results can be obtained via standard tablesknown as orthogonal arrays which are helpful in designingthe experiments . The factors represent the design parametersthat influence the performance whereas levels a re the values by which an expe riment is conducted. With two levels of factors the behavior is fundamentally assumed to be linear where the non-linear response can be observed with thelatter levels [16].
Taguchi method is used for the selection of optimizationvariables to minimize the energy consumption in crudedistillation unit [17]. A systematic procedure was designedfor the selection of optimization variables in a refrigeratedgas plant (RGP), later validated on HYSYS, and showednoteworthy concurrence amongst all cases [18]. It was proposed that the concentration of a surfactant, zeolite bedheight and flow rate of the waste water are the significantfactors in detecting color removal from textile dye batheffluents in a zeolite fixed bed reactor [19].
The consistency of the performance is analyzed bydetermining the effects of the factors involved and obtainingthe optimum configuration for the best performance byanalysis of means (ANOM) or analysis of variance(ANOVA). The model factors are found by calculating theSignal to Noise (S/N) ratio or weight factors to come upwith a robust design [20]. The measured result of theseexperiments constitutes a quality characteristic which in thiscase is the minimum energy requirement for the unit production of diesel.
In the current research, Taguchi method has been used todevise a recipe for increased diesel production in a c rude oilas in Fig. 3. The objective (Eqn. 1) is to select the optimalcut point temperatures for maximizing diesel yield at thelowest energy utilization. In this case, 3 levels namely
nominal as well as lower and upper bounds have beenconsidered.
V
E
FlowProductDieselEnergy (1)
7/27/2019 NHIỆT ĐỘ PHÂN CẮT
http://slidepdf.com/reader/full/nhiet-do-phan-cat 5/11
International Journal of Engineering & Technology IJET-IJENS Vol:12 No:06 40
1210606-3939-IJET-IJENS © December 2012 IJENS I J E N S
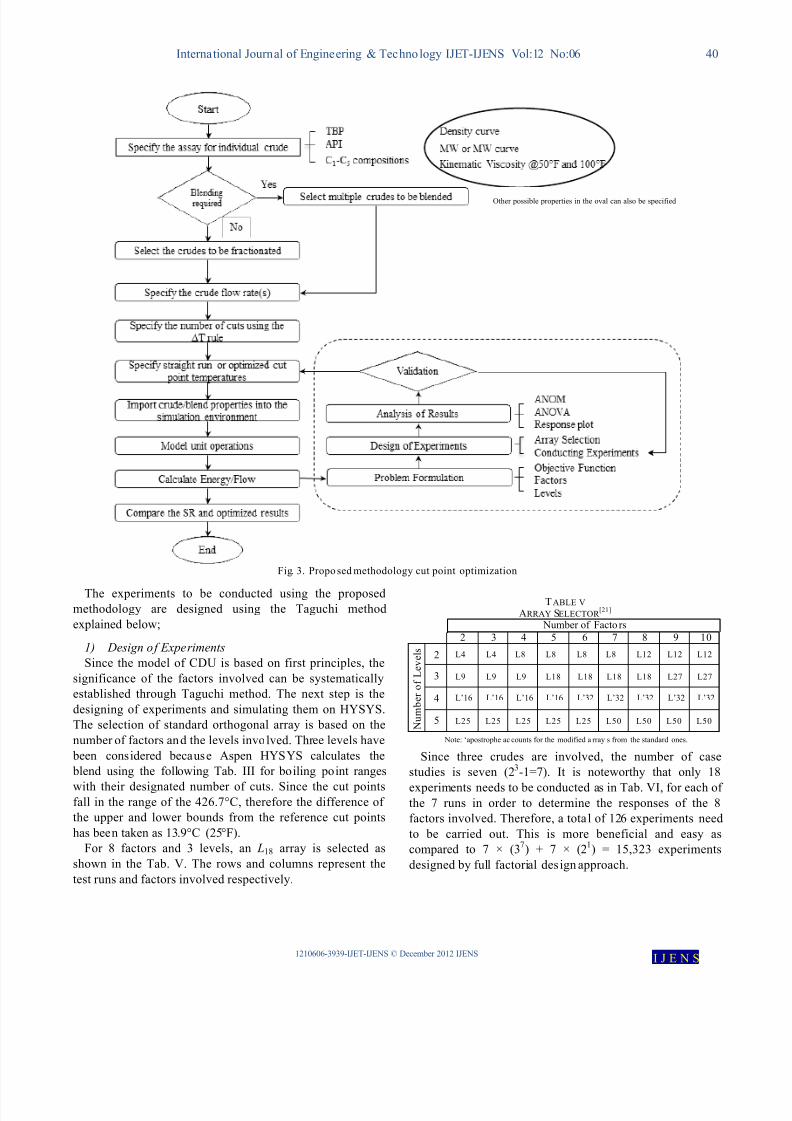
Fig. 3. Propo sed methodology cut point optimization
The experiments to be conducted using the proposedmethodology are designed using the Taguchi methodexplained below;
1) Design of ExperimentsSince the model of CDU is based on first principles, the
significance of the factors involved can be systematicallyestablished through Taguchi method. The next step is thedesigning of experiments and simulating them on HYSYS.The selection of standard orthogonal array is based on thenumber of factors and the levels involved. Three levels have been considered because Aspen HYSYS calculates the blend using the following Tab. III for boiling point rangeswith their designated number of cuts. Since the cut pointsfall in the range of the 426.7°C, therefore the difference of the upper and lower bounds from the reference cut pointshas been taken as 13.9°C (25°F).
For 8 factors and 3 levels, an L18 array is selected asshown in the Tab. V. The rows and columns represent thetest runs and factors involved respectively.
TABLE VARRAY SELECTOR [21]
Number of Facto rs2 3 4 5 6 7 8 9 10
N u m
b e r o f
L e v e l s
2 L4 L4 L8 L8 L8 L8 L12 L12 L12
3 L9 L9 L9 L18 L18 L18 L18 L27 L27
4 L 16 L 16 L 16 L 16 L 32 L 32 L 32 L 32 L 32
5 L25 L25 L25 L25 L25 L50 L50 L50 L50
Note: „apostrophe ac counts for the modified a rray s from the standard ones.
Since three crudes are involved, the number of casestudies is seven (23-1=7). It is noteworthy that only 18experiments needs to be conducted as in Tab. VI, for each of the 7 runs in order to determine the responses of the 8factors involved. Therefore, a total of 126 experiments needto be carried out. This is more beneficial and easy ascompared to 7 × (37) + 7 × (21) = 15,323 experimentsdesigned by full factorial design approach.
Other possible properties in the oval can also be specified
7/27/2019 NHIỆT ĐỘ PHÂN CẮT
http://slidepdf.com/reader/full/nhiet-do-phan-cat 6/11
International Journal of Engineering & Technology IJET-IJENS Vol:12 No:06 41
1210606-3939-IJET-IJENS © December 2012 IJENS I J E N S
TABLE VI L18 ARRAY
Experiments T1 T2 T3 T4 T5 T6 T7 T81 1 1 1 1 1 1 1 12 1 1 2 2 2 2 2 23 1 1 3 3 3 3 3 34 1 2 1 1 2 2 3 35 1 2 2 2 3 3 1 1
6 1 2 3 3 1 1 2 27 1 3 1 2 1 3 2 38 1 3 2 3 2 1 3 19 1 3 3 1 3 2 1 2
10 2 1 1 3 3 2 2 111 2 1 2 1 1 3 3 212 2 1 3 2 2 1 1 313 2 2 1 2 3 1 3 214 2 2 2 3 1 2 1 315 2 3 3 1 2 3 2 116 2 3 1 3 2 3 1 217 2 3 2 1 3 1 2 318 2 3 3 2 1 2 3 1
2) Analysis of Results
The fina l step is the analysis of results with the help of thestatistical means such as ANOM and ANOVA, averages of factor k at level l in case m, m
kl x is taken as sum of respective
factorial values.m
kl
m
kl x x
k =1,…, K ; l =1, …, L; m=1, …, M (2)
Where;K= 7 and L=3 are correspondingly numbers of factors and
levels.Average of factor k in each casem, xk is calculated as :
K k l x xL
kl
m
kl
m
kl ,,1; (3)
These two averages are used to calculate mk V . The
denominator is called degrees of freedo m of factor k over alllevels L in casem, m
k DOF )( .
m
k
l
m
kl
m
kl m
k DOF
x xV
)(
)(2
1 (4)
Percentage contribution m
k C is determined as follows:
K k V
V C
k
m
k
m
k m
k ,,1;)(
100
1
(5)
The validation of the optimized recipe obtained is basedupon the ANOM and the ANOVA rankings. If the rankingsare in compliance with each other, an optimized run is
performed subjected to the optimal configuration of the cut point temperatures to calculate the objective function for arespective case.
C. Case Studies
The cases cons idered for the optimization of the CDU are: Single crude: Bintulu (Case I), Tembungo (Case II)
and Bunga Kekwa (Case III)
Binary crudes: Bintulu – Tembungo (Case IV),Tembungo – Bunga Kekwa (Case V) and BungaKekwa – Bintulu (Case VI)
Ternary crudes: Bintulu-Tembungo – Bunga Kekwa(Case VII)
The amount of different flow rates calculated for crude blending is based on the ratio of the diesel production of thecrudes considered in order to produce maximum amount of diesel. From the s traight run analysis of the different crudesthat Tembungo was found to be the best crude for diesel production followed by Bunga Kekwa and Bintulu.
IV. R ESULTS ANDDISCUSSIONS The s imulations have been performed us ing specifications
such as product flow rate constraints and duties of condenser, pumparounds and reboiler. All experiments areconducted using steady-state model developed under HYSYS environment. Consistency has been maintained inthe units prior to the calculations. The experiments areconducted using the default cut point temperatures in theHYSYS environment as shown in the Tab. VII. Thetemperature difference between the cuts in Tab. IV isconsidered as a reference for setting the lower and the upper bound for the experiments.
TABLE VIICUT POINTTEMPERATURES ANDVALUE S AT EACHLEVEL
Products Factor S.R Cut poin ts ( ˚C)
Level 1(˚C)
Level 2(˚C)
Level 3(˚C)
Off-gas A 10 10 23.9 -Light S.R B 70 56 70 84 Naphtha C 180 166 180 194Kerosene D 240 226 240 254
Light Diesel E 290 276 290 304Heavy Diesel F 340 326 340 354Atmospheric
Gas Oil G 370 356 370 384
Residue H 1200 1144.5 1175 1200 Note: S.R: Straight run me thod
These cut-point temperatures are used to predict theamount of extract of the petroleum fraction to be made, anddefine the pseudo component as midpoint normal boiling point (NBP).
A. Taguchi ResultsFor the base case, the objective function values (Eq. 1)
are 1714.8, 2646.2, 1762.3, 2146.8, 2321.3, 2003.3 and
2191.2 in kW/kBPD. To calculate the optimal recipe, thefactors are ranked using the analysis of mean (ANOM)results. This way the significance of factors can bedetermined. Eqs. (2) and (3) are used to calculate theaverages of the factors k which are ranked from 1 to 9.Theranking is based on the difference of the lowest from theglobal mean. This difference is noted as Dk , where highestvalue of Dk is ass igned the highest ranking.
7/27/2019 NHIỆT ĐỘ PHÂN CẮT
http://slidepdf.com/reader/full/nhiet-do-phan-cat 7/11
International Journal of Engineering & Technology IJET-IJENS Vol:12 No:06 42
1210606-3939-IJET-IJENS © December 2012 IJENS I J E N S
Case I Case II
Case III Case IV
Case V Case VI
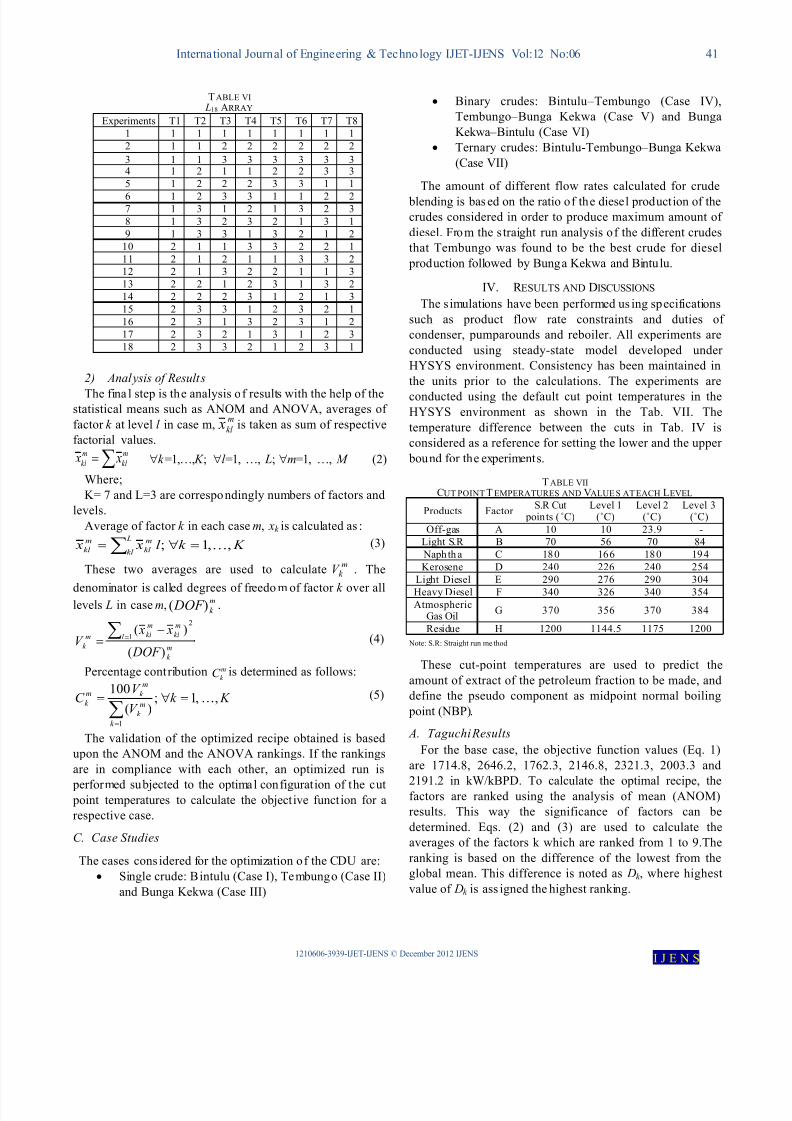
Case VIIFig. 4. Response plots for Cases: (I) Tembungo , (II ) Bintulu , (III) Bunga Kekwa, (IV) Tembungo – Bintulu, (V) Tembungo – Bunga Kekwa, (VI) Bunga
Kekwa – Bintulu, (VII) Tembungo – Bintulu – Bunga Kekwa
Ranking from ANOM is verified from the (analysis of variance) ANOVA results. The sum of the squares of thefactor involved, represent the variation of the experimentalresult from the data average where the larger valuerepresents a significant factor and vice versa. The degree of freedom (DOF)k is calculated to be one less than the number of levels. It is used to obtain the population variance of allthe possible experiments. Finally, the relative important
factor k is indicated with regard to the percentagecontribution.The optimal configurat ion of the cut point temperatures was
bas ed upon the „the lower the better principle of qualitythrough averaged energy/product response plots. Thus,another set of experiments subjected to the optimalconfiguration has been performed known as the optimizedrun. Optimal recipe shown in Fig. 4 infer that steep slopes
1500
1600
1700
1800
1900
2000
2100
2200
A B C D E F G H
E n e r g y /
P r o d u c t F l o w ( k W
/ k B P D )
2000
2200
2400
2600
2800
3000
3200
A B C D E F G H
1700
1800
1900
2000
2100
2200
2300
A B C D E F G H
E n e r g y / P r o d u c t F l o w
( k W / k B
P D )
1800
1925
2050
2175
2300
2425
2550
2675
2800
A B C D E F G H
1800
1900
2000
2100
2200
2300
2400
2500
2600
A B C D E F G H
E n e r g y / P r o d u c t F l o w ( k W
/ k B P D )
1700
1800
1900
2000
2100
2200
2300
2400
A B C D E F G H
1700
1800
1900
2000
2100
2200
2300
2400
A B C D E F G H
E n e r g y / P r o d u c t F l o w ( k W / k B P D )
Average Factors at Respective Levels
7/27/2019 NHIỆT ĐỘ PHÂN CẮT
http://slidepdf.com/reader/full/nhiet-do-phan-cat 8/11
International Journal of Engineering & Technology IJET-IJENS Vol:12 No:06 43
1210606-3939-IJET-IJENS © December 2012 IJENS I J E N S
can reveal the significance of the factors involved. Thesteeper the slope the more significant a variable is. Theaverages of the energy/product flow (kW/kBPD) are basedupon the ANOM results. The optimal configuration of thecut point temperatures are shown in Tab. VIII.
TABLE VIII
R ECIPE FOR OPTIMUMDIESEL YIELD Cases Recipe
Factors A B C D E F G HBase Case 1 2 2 2 2 2 2 3
I 1 3 1 1 3 3 3 2II 1 3 1 1 3 3 1 2III 2 3 1 1 1 3 1 1IV 2 3 1 1 3 3 3 3V 1 3 3 1 1 3 2 2VI 1 3 1 1 3 3 3 3VII 2 3 1 1 3 3 1 3
Tab. VIII shows great deal of consistency from a specific
level involved of the factors B, D, and F. These factorscorrespond to cut point temperatures of the light straight run,kerosene and heavy diesel, respectively. The contributingfactors calculated from the ANOM results revealed that onlythe cut-point temperature of kerosene and heavy diesel areresponsible for the optimization of diesel in a crudedistillation unit. This can also be validated from thesteepness of the slopes shown by the two factors. Theshifting of the levels caused the diesel range to expandmuch wider as compared to their base cases. The final boiling point of the kerosene cut was reduced and for heavydiesel it increased. This resulted in the higher production of diesel resulting and the vapors climbing up to the condenser
discharged much greater energy from the system.The minimum value of energy/product flow (kW/kBPD)for the optimum configuration for the all the cases wascalculated after conducting simulation of similar processconfiguration but different cut-points as shown in Tab. VII.Thorough inspection of the above configuration reveal thatthe optimum recipe of the Case I and II are alike exceptfactor G which switches from level 3 to 1. This trend isobserved due to the fact that the TBP curves for Bintulu andTembungo are quite alike. And later in their TBP curvesthey deviate from one another, thus causing the switching of the level G. Similarly Case VI also comprises of identicallevel of factors with Case I except for factor H whichchanges from level 2 to 3. The resemblance of these twocases deduces an interesting point that Case I has the bestoptimum value in the category of single crude feed.Similarly, Case VI shows the finest results amongst binarycrude feed in terms of energy utilization for a kilo-barrel of production. On the contrary Case II reflects higher object ivefunction because the straight run analysis of Bintulu crude produced the lowest amount of diesel production incomparison to the other two crudes .
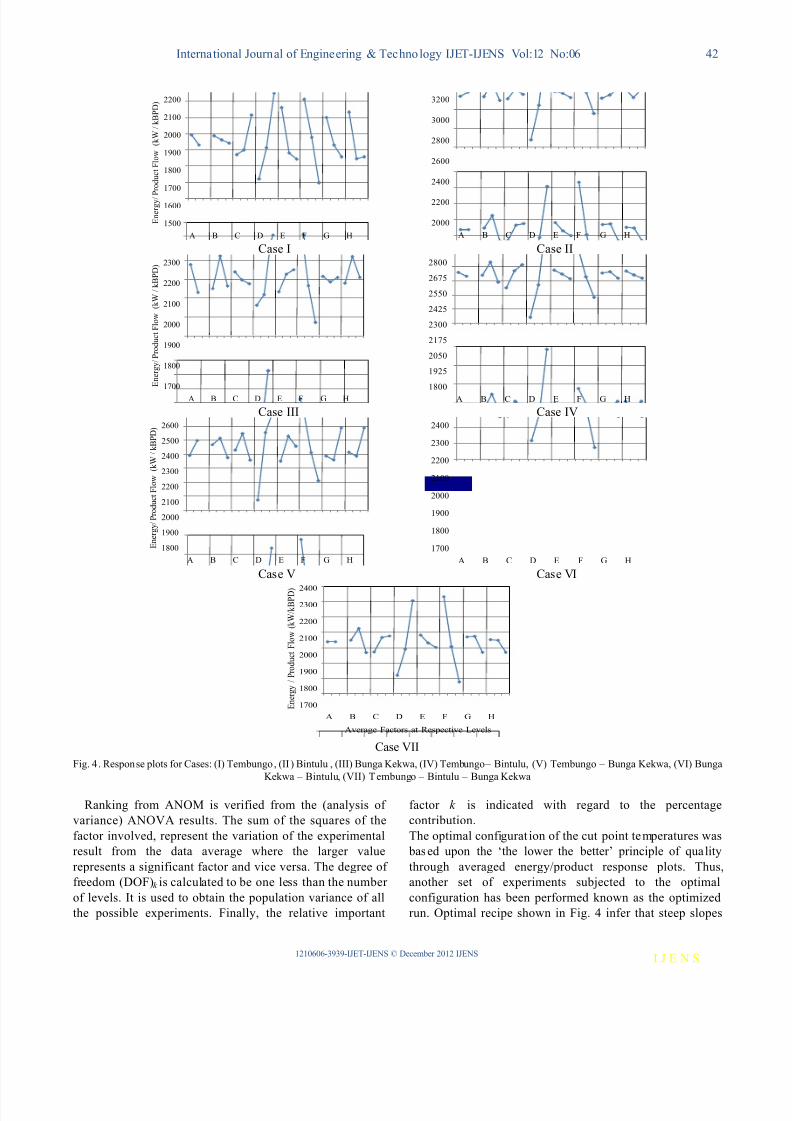
B. Cases StudiesThe global means for the cases of single crude feed (I, II
and III) were 1861.2, 2563.8 and 2003.2, respectively, in theunit of kW/kBPD. The diesel production increased up by6.9, 7.4 and 8.9 kBPD respectively. For optimal runs inCases I and II the energy usage was reduced by 32.4% and
22.9%, respectively. Case III reported an increase by 25.5%from its straight run analysis as shown in the Fig. 5.The global mean for the binary crude feed Cases (IV, V
and VI) were found to be 2230.3, 2243.3 and 2036.9respectively in kW/kBPD. As for the ternary crude feed(Case VII), the objective function was calculated as 2256kW/kBPD from the 18 experiments performed. The dieselyield was also increased by 7.5kBPD because the usage of such crude feed to a comparatively greater federate ascompared to the others. This ratio was calculated on the bas is of the S.R analysis of the single crude feed. Tembu ngocrude was kept 27.3% and 27.5% higher than Bintulu andBunga Kekwa respectively. Bunga Kekwa feed was kept47.5% higher than Bintulu to produce greater diesel.
According to the HYSYS oil manager, the first two caseshave shown commendable increase in the light dieselfraction. The remaining of the cases notified a greater increase in the heavy diesel fract ion as compared to the lightdiesel fraction off the entire diesel production.
Fig. 5. Trends of energy requirement for a barrel of product for variouscase studies
Since diesel is fractionated through n-cetane, it is
recognized with its cetane index, which is a measure of itsknocking tendency. The cetane index has been kept within arange of 49 to 55 with the percentage change to itscorresponding straight run is Tab. VII.
The pour points for the diesel stream were estimatedusing the ASTM D97 method. The pour points for thestraight run experiments are reported in Tab. XI along withthe temperature deviation of the optimized runs with their respective straight runs.
0
500
1000
1500
2000
2500
3000
I II III IV V VI VII
E n e r g y / P r o d u c t ( k W
/ k B P D )
Straight run Optimized run
7/27/2019 NHIỆT ĐỘ PHÂN CẮT
http://slidepdf.com/reader/full/nhiet-do-phan-cat 9/11
International Journal of Engineering & Technology IJET-IJENS Vol:12 No:06 44
1210606-3939-IJET-IJENS © December 2012 IJENS I J E N S
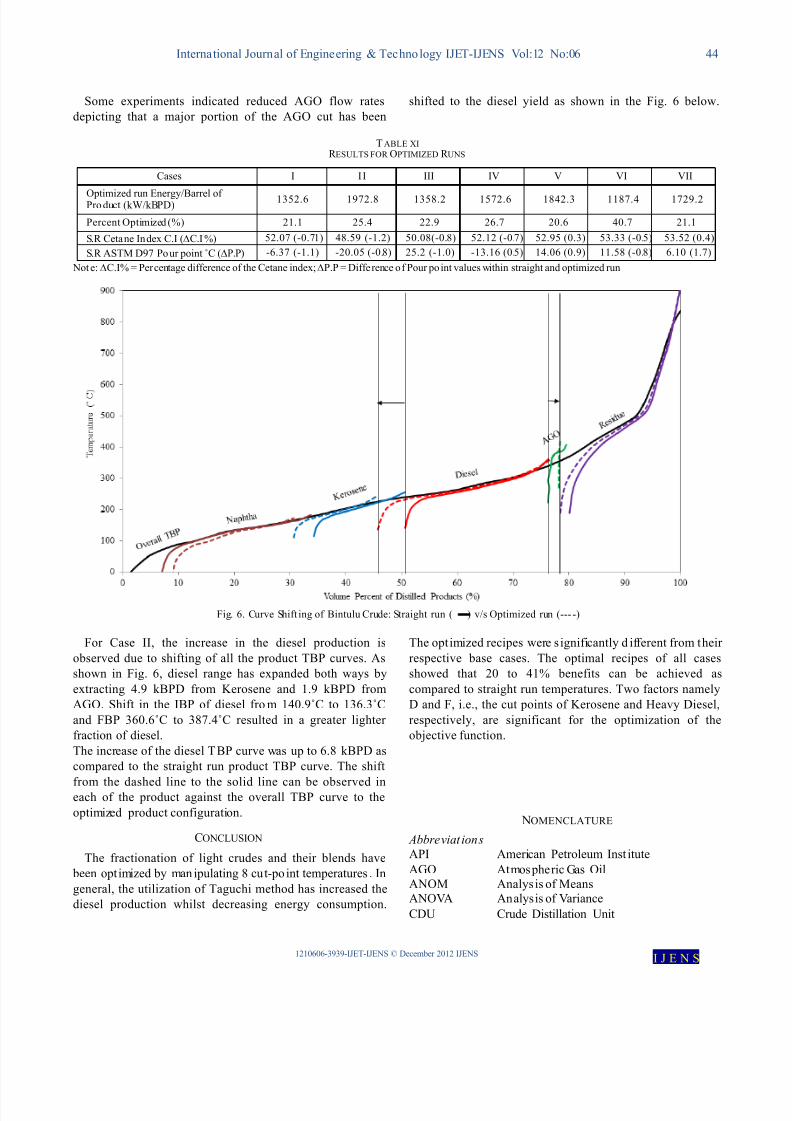
Some experiments indicated reduced AGO flow ratesdepicting that a major portion of the AGO cut has been
shifted to the diesel yield as shown in the Fig. 6 below.
TABLE XIR ESULTS FOR OPTIMIZEDR UNS
Cases I II III IV V VI VII
Optimized run Energy/Barrel of Product (kW/kBPD) 1352.6 1972.8 1358.2 1572.6 1842.3 1187.4 1729.2
Percent Optimized (%) 21.1 25.4 22.9 26.7 20.6 40.7 21.1S.R Cetane Index C.I ( C.I %) 52.07 (-0.71) 48.59 (-1.2) 50.08(-0.8) 52.12 (-0.7) 52.95 (0.3) 53.33 (-0.5) 53.52 (0.4)S.R ASTM D97 Pour point ̊ C ( P.P) -6.37 (-1.1) -20.05 (-0.8) 25.2 (-1.0) -13.16 (0.5) 14.06 (0.9) 11.58 (-0.8) 6.10 (1.7)
Not e: C.I% = Percentage difference of the Cetane index;P.P = Difference of Pour point values within straight and optimized run
Fig. 6. Curve Shift ing of Bintulu Crude: Straight run ( ) v/s Optimized run (--- -)
For Case II, the increase in the diesel production isobserved due to shifting of all the product TBP curves. Asshown in Fig. 6, diesel range has expanded both ways byextracting 4.9 kBPD from Kerosene and 1.9 kBPD fromAGO. Shift in the IBP of diesel from 140.9˚C to 136.3˚Cand FBP 360.6˚C to 387.4˚C resulted in a greater lighter fraction of diesel.The increase of the diesel TBP curve was up to 6.8 kBPD ascompared to the straight run product TBP curve. The shift
from the dashed line to the solid line can be observed ineach of the product against the overall TBP curve to theoptimized product configuration.
CONCLUSION The fractionation of light crudes and their blends have
been optimized by man ipulating 8 cut-point temperatures . Ingeneral, the utilization of Taguchi method has increased thediesel production whilst decreasing energy consumption.
The optimized recipes were s ignificantly d ifferent from their respective base cases. The optimal recipes of all casesshowed that 20 to 41% benefits can be achieved ascompared to straight run temperatures. Two factors namelyD and F, i.e., the cut points of Kerosene and Heavy Diesel,respectively, are significant for the optimization of theobjective function.
NOMENCLATURE Abbreviat ionsAPI American Petroleum Inst ituteAGO Atmospheric Gas OilANOM Analysis of MeansANOVA Analysis of VarianceCDU Crude Distillation Unit
7/27/2019 NHIỆT ĐỘ PHÂN CẮT
http://slidepdf.com/reader/full/nhiet-do-phan-cat 10/11
International Journal of Engineering & Technology IJET-IJENS Vol:12 No:06 45
1210606-3939-IJET-IJENS © December 2012 IJENS I J E N S
BPD Barrels per dayFBP Final Boiling PointFCCU Fluid Catalytic Cracker UnitIBP Initial Boiling PointTBP True Boiling Point NBP Normal Boiling PointVDU Vacuum Distillation Unit
Variables
Percentage contribution of factor k in casem (%)
Dk Difference between the lowest and theglobal mean
(DOF) k m Degree of Freedom at levelk in each casem
k Number of factors K Total number of factorskW kilo Wattl Number of levels
L Total number of levelsm Number of experiments in an array
M Total number of experiments Variance of factor k at level l
Average of objective function value due tofactor k at level l in each casem
Average of objective function value due tofactor k over all levels L in each casem
xm Average of objective function value in eachcasem
ACKNOWLEDGMENT The authors appreciate the financial supports from theUniversiti Teknologi PETRONAS and MOSTI (ScienceFund 03-02-02-SF0113).
R EFERENCES [1] M. A. Fahim, T. A. Al-Sahhaf and A. S. Elkilani, Fundamentals of
Petroleum Processing , 1st ed., Elsevier, Oxford, 2010.[2] R.Boulet, “ Composition of Crude Oil and Petroleum Products”, in
Crude Oil Petroleum Products Process Flow sheets , Ch. 1,TECHNIP, France, 2001.
[3] J. H. Gary and G. E. Hendwerk, Petroleum Refining: Technology an Economics , 5th ed., CRC Press, Florida, 2007.
[4] R. E. Young, “Petroleum refining process control and real-timeoptimization”,Control Systems, IEEE , 26(6), pp. 73-83, Dec. 2006.
[5] B. A. I. Liang, Y. Jiang, D. Huang and X. Liu,“ A Novel SchedulingStrategy for Crude Oil Blending”, Chinese Journal of Chemical
Engineering , 18(5), pp. 777-86, Oct. 2010.[6] G. Robertson, A. Palazoglu and J. A. Romagnoli, “ Refining
Scheduling of Crude Oil Unloading, Storing, and ProcessingConsidering Production Level Cost”, Computer Aided Chemical
Engineering , vol. 28, pp. 1159-64, 2010.[7] G. K. D. Saharidis,M. Minoux and Y. Dallery, “ Scheduling of
loading and unloading of crude oil in a refinery using event -baseddiscrete time formulation”, Chemical Engineering , 33(8), pp. 1413-26, Aug. 2009.
[8] P. Behrenbruch and T. Dedigama, “ Classification andcharacterization of crude oils based on distillation properties”,
Journal of Petroleum Science and Engineering , 57(1-2), pp. 166-80,May 2007.
[9] T. Chatterjee and D. N. Saraf,“On-line estimation of product properties for crude distillation units”, Journal of Process Control , 1st Ed., vol. 14 , pp. 61-77, Feb. 2004.
[10] R. K. More, V. K. Bulasara, R. Uppaluri and V. R.Banjara,“Optimization of crude distillation system using aspen plus:Effect of binary feed selection on grass-root design”, Chemical
Engineering Research and Design , 88(2), pp. 121-34, Feb. 2010.[11] D. D. Gonçalves and F. G. Martins,“Dynamic Simulation and
Control: Application to Atmospheric Distillation Unit of Crude OilRefinery”, Computer Aided Chemical Engineering , vol. 28, 2010.
[12] S. Motlaghi, F. Jalali and M. Nili Ahmadabadi,“ An expert systemdesign for a crude oil distillation column with the neural networksmodel and the process optimization using genetic algorithmframework ”, Expert Systems with Applications , 35(4), pp. 1540-45, Nov. 2008.
[13] M. Tran, D. K. Varvarezos and M. Nasir,“The importance of first- principles, model-based steady-state gain calculations in model predictive control – a refinery case study”, Control Engineering Practice , vo l. 13, pp. 1369-82, 2005.
[14] Marvin and S. Rakow, Petroleum Oil Refining. In Fuels and lubricants handbook: technology, properties, performance, and testing , Ch.1 , ASTM International, U.S.A, 2003.
[15] T.Benali, D. Tondeur and J.N. Jaubert, “An improved crude oilatmospheric distillation process for energy integration: Part II: Newapproach for energy saving by use of residual heat”, Applied Thermal
Engineering , vol. 40, pp. 132-44, 2012.[16] R. K. Roy, Design of Experiments Using the Taguchi Approach: 16
Steps to Product and Process Improvement , John Wiley and Sons, New York, 2001.
[17] M. Zainal Abidin, and N. Yusoff,“ Selection of OptimizationVariables to Minimize Energy Consumption in Crude DistillationUnit using Taguchi Method”, ICPEAM 2012.
[18] N. Yusoff, M. Ramasamy and S. Yusup,“Taguchi s parametric designapproach for the selection of optimization variables in a refrigeratedgas plant”, Chemical Engineering Research and Design , vol. 89, pp.665-75, 2011.
[19] A. B. Engin, O. Özdemir, M. Turan and Z. T. Abdullah,“ Color
removal from textile dye bath effluents in a zeolite fixed bed reactor:Determination of optimum process conditions using Taguchimethod”, Journal of Hazardous Materials , 159(2), pp. 348 – 53, Nov.2008.
[20] R. K. Roy, A Primer on the Taguchi Method , Society of Manufacturing Engineers, Dearborn, Michigan, 1990.
[21] S. Fraley, M. Oom, B. Terrien and J. Zalewski, viewed at 3 July201 2, UMICH, https://controls.engin.umich.edu, 2007.
S. Faizan Ali is an MSc. Research Scholar in thedepartment of Chemical Engineering, UniversitiTeknologi PETRONAS (UTP), Malaysia since November 2011. He received his Bachelors degreein Chemical Engineering from NED University of Engineering and Technology, Karachi, Pakistan in2010.Currently, he has been working as a TeachingAssistant to his research supervisor, Dr. Nooryusmiza Yusoff, for Chemical Process
Dynamics and Control and Process Optimization courses in the departmentof Chemical Engineering, UTP. Previously, he worked as a ProcessEngineer for Zishan Engineers Pvt. Ltd., Karachi, Pakistan in the year 2011.

7/27/2019 NHIỆT ĐỘ PHÂN CẮT
http://slidepdf.com/reader/full/nhiet-do-phan-cat 11/11
International Journal of Engineering & Technology IJET-IJENS Vol:12 No:06 46
1210606-3939-IJET-IJENS © December 2012 IJENS I J E N S
Nooryusmiza Yusoff graduated from NorthwesternUniversity, USA with BSc Degree in ChemicalEngineering (1997) and subsequently became amember of the American Chemical EngineeringHonors Society “Omega Chi Epsilon”. He receivedMSc Degree (2001) from the University of Calgary,Canada with a thesis on applying geostatisticalanalyses in predicting ozone temporal trends. He
obtained PhD (2010) from the Universiti Teknologi PETRONAS (UTP),Malaysia after completing a research work on the integrated framework of scheduling and real-time optimization in a large industrial plant. His areasof research interest centers on process modeling and simulation as well as process systems engineering.


![[BTL] Cảm biến nhiệt độ](https://img.pdfslide.net/doc/110x75/55c52335bb61ebc0488b45d6/btl-cam-bien-nhiet-do.jpg)