Embed Size (px)
Citation preview

www.parliament.uk/commons-library | intranet.parliament.uk/commons-library | [email protected] | @commonslibrary
BRIEFING PAPER
CBP0724, 13 April 2018
NHS Funding and Expenditure
By Rachael Harker
Contents: 1. The UK NHS 2. NHS England 3. Data tables

2 NHS Funding and Expenditure
Contents Summary 3
1. The UK NHS 4 1.1 Structure 4 1.2 Sources of funding 4 1.3 Total expenditure 5 1.4 Expenditure by devolved administrations 7
2. NHS England 8 2.1 Funding process 8 2.2 Total expenditure 8 2.3 Funding pressures 9
3. Data tables 11
Cover page image copyright Click & browse to copyright info for stock image

3 Commons Library Briefing, 7 June 2017
Summary Expenditure on the NHS has risen substantially since it was established on 5th July 1948. In the first full year of its operation, the Government spent £11.4bn on health in the UK. In 2016/17, the figure was over ten times that amount: £144.3bn. Growth in health expenditure has far outpaced the rise in both GDP and total public expenditure: each increased by a factor of around 4.8 over this period.
The average annual expenditure increase since 1955/56 is 3.9%. However, between 2000/01 and 2004/05 average annual spending growth was 8.6% which is higher than at any other time in the history of the NHS.
Responsibility for health services is devolved to the Scottish, Welsh and Northern Irish administrations. In 2016/17 health services expenditure per head was highest in Scotland (£2,332 per head) and lowest in England (£2,169 per head).
The focus of this briefing is on the structure, funding process and expenditure of the NHS in England. The structure and expenditure of the UK NHS is described briefly in Section 1. Expenditure in England is dealt with in Section 2.
In 2016/17, NHS England held a budget of £107 billion. The majority of this budget (72%, £76.5 billion) was allocated to Clinical Commissioning Groups (CCGs) according to a population and needs-based formula. NHS England retains around 28% of the budget (£30.5 billion in 2016/17) for the direct commissioning of specialised healthcare, primary care and military and offender services.
When looking at five yearly periods, in England the largest increase in real terms spending growth (+8.7%) since 1950 occurred over the period 1999/2000 to 2003/04. Based on inflation figures published with the Spring Statement 2018 Budget, the lowest change occurred over the 2010/11 to 2014/15 period (+1.1%).
FIGURE 1: UK EXPENDITURE ON HEALTH
0%
1%
2%
3%
4%
5%
6%
7%
8%
1955-561958-591961-621964-651967-681970-711973-741976-771979-801982-831985-861988-891991-921994-951997-982000-012003-042006-072009-102012-132015-16
As
% o
f G
DP
0
30
60
90
120
150
1956/57 1966/67 1976/77 1986/87 1996/97 2006/07 2016/17
£bn
, 201
6/17
pri
ces
4 NHS Funding and Expenditure
1. The UK NHS
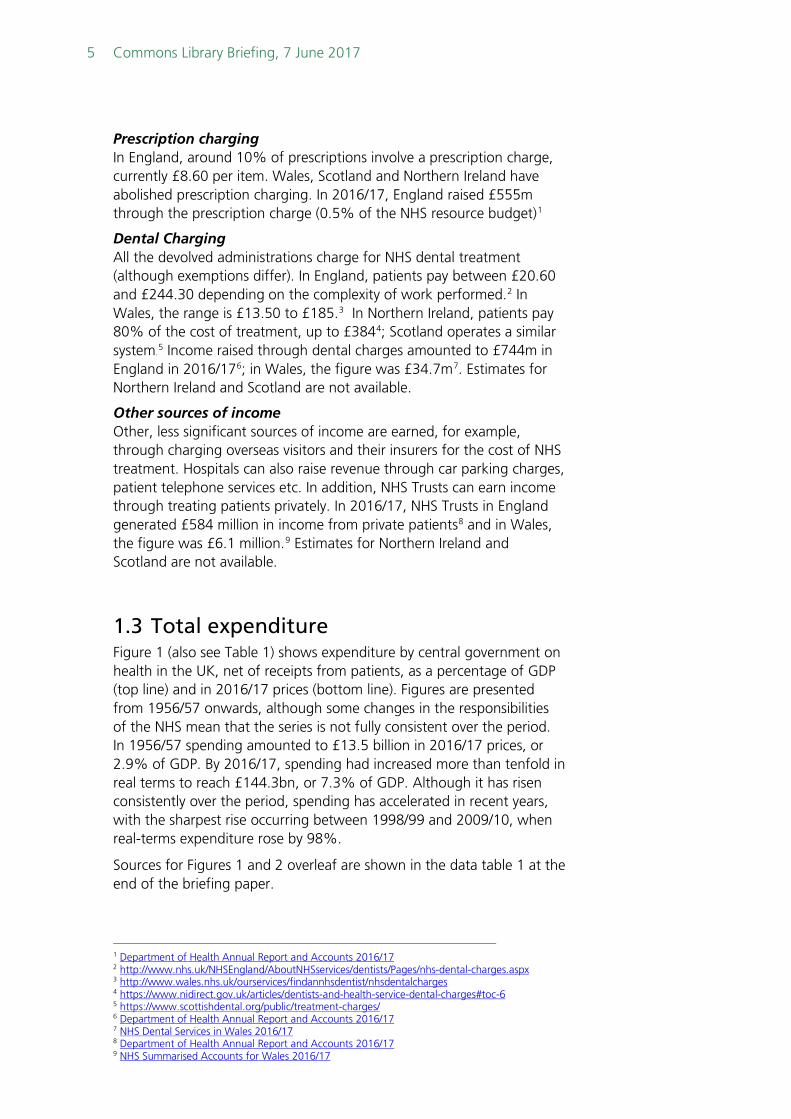
1.1 Structure The NHS was established on 5 July 1948, with the aim of providing a comprehensive range of health services to all UK citizens, financed by general taxation and free at the point of use. The responsibility for the provision and development of health services lies ultimately with the Secretary of State for Health in England, the Minister for Health and Community Care for Scotland, the Minister for Health and Social Services for Wales and the Minister for Health, Social Services and Public Safety for Northern Ireland. They are supported by the Department of Health in England, the Scottish Executive Department of Health in Scotland, the NHS Directorate in Wales and the Department of Health, Social Services and Public Safety in Northern Ireland. The Scottish Parliament has competence over health and the National Assembly for Wales (NAW) has powers to shape the delivery of health services. However, unlike the Scottish Parliament, the NAW does not have law-making power over the running of the NHS. The Northern Ireland Assembly is intended to take an active role in shaping health services. Each country has chosen to structure its National Health Service differently. A common theme of NHS funding across the countries is the allocation of a significant proportion of the NHS budget to local organisations (Clinical Commissioning Groups or Health Boards), which are responsible for meeting local need. Another common strand is for allocations to these organisations to be informed (but not entirely determined) by a needs-based funding formula, on the principle that it is desirable to achieve equal access to healthcare for people at equal risk across the country The key difference between the countries lies in the role of the internal market. England and Northern Ireland have a ‘purchaser/provider split’, whereby one part of the health service (the purchaser) is responsible for contracting with the NHS and independent-sector organisations (the providers) to supply services for patients. Scotland and Wales have moved away from these market-orientated models since devolution: they dismantled the purchaser-provider split in 2004 and 2009 respectively. Local health boards in these countries are now responsible for both funding and provision of NHS services.
1.2 Sources of income The vast majority of NHS funding ultimately derives from central (UK) taxation. Within the block grant allocated to each devolved administration (via the Barnett formula), each country is free to decide how much to spend on the NHS. The NHS can also raise income from patient charges, sometimes known as ‘co-payments’. Devolved administrations have control over the level at which these are set.
For more details on the current structure of the NHS see Commons Library Briefing CBP 7206 The Structure of the NHS in England
5 Commons Library Briefing, 7 June 2017
Prescription charging In England, around 10% of prescriptions involve a prescription charge, currently £8.60 per item. Wales, Scotland and Northern Ireland have abolished prescription charging. In 2016/17, England raised £555m through the prescription charge (0.5% of the NHS resource budget)1
Dental Charging All the devolved administrations charge for NHS dental treatment (although exemptions differ). In England, patients pay between £20.60 and £244.30 depending on the complexity of work performed.2 In Wales, the range is £13.50 to £185.3 In Northern Ireland, patients pay 80% of the cost of treatment, up to £3844; Scotland operates a similar system.
5 Income raised through dental charges amounted to £744m in England in 2016/176; in Wales, the figure was £34.7m7. Estimates for Northern Ireland and Scotland are not available.
Other sources of income Other, less significant sources of income are earned, for example, through charging overseas visitors and their insurers for the cost of NHS treatment. Hospitals can also raise revenue through car parking charges, patient telephone services etc. In addition, NHS Trusts can earn income through treating patients privately. In 2016/17, NHS Trusts in England generated £584 million in income from private patients8 and in Wales, the figure was £6.1 million.9 Estimates for Northern Ireland and Scotland are not available.
1.3 Total expenditure Figure 1 (also see Table 1) shows expenditure by central government on health in the UK, net of receipts from patients, as a percentage of GDP (top line) and in 2016/17 prices (bottom line). Figures are presented from 1956/57 onwards, although some changes in the responsibilities of the NHS mean that the series is not fully consistent over the period. In 1956/57 spending amounted to £13.5 billion in 2016/17 prices, or 2.9% of GDP. By 2016/17, spending had increased more than tenfold in real terms to reach £144.3bn, or 7.3% of GDP. Although it has risen consistently over the period, spending has accelerated in recent years, with the sharpest rise occurring between 1998/99 and 2009/10, when real-terms expenditure rose by 98%.
Sources for Figures 1 and 2 overleaf are shown in the data table 1 at the end of the briefing paper.
1 Department of Health Annual Report and Accounts 2016/17 2 http://www.nhs.uk/NHSEngland/AboutNHSservices/dentists/Pages/nhs-dental-charges.aspx 3 http://www.wales.nhs.uk/ourservices/findannhsdentist/nhsdentalcharges 4 https://www.nidirect.gov.uk/articles/dentists-and-health-service-dental-charges#toc-6 5 https://www.scottishdental.org/public/treatment-charges/ 6 Department of Health Annual Report and Accounts 2016/17 7 NHS Dental Services in Wales 2016/17 8 Department of Health Annual Report and Accounts 2016/17 9 NHS Summarised Accounts for Wales 2016/17

6 NHS Funding and Expenditure
Figure 2 shows the annual percentage changes in real terms central government expenditure over the past 60 years. Negative change has occurred on just five occasions; with the largest decrease (-3.0%) occurring in 1977/78. Since 1958/59, the five-year moving average has always been positive. The average annual expenditure increase since 1955/56 is 3.9%. However, between 2000/01 and 2004/05 average annual spending growth was 8.6% which is higher than at any other time in the history of the NHS.
FIGURE 1: UK EXPENDITURE ON HEALTH
0%
1%
2%
3%
4%
5%
6%
7%
8%
1955-561958-591961-621964-651967-681970-711973-741976-771979-801982-831985-861988-891991-921994-951997-982000-012003-042006-072009-102012-132015-16
As
% o
f G
DP
0
30
60
90
120
150
1956/57 1966/67 1976/77 1986/87 1996/97 2006/07 2016/17
£bn
, 201
6/17
pri
ces
FIGURE 2: REAL TERMS PERCENTAGE CHANGE IN UK HEALTH EXPENDITURE2016/17 prices
-4%
-2%
+2%
+4%
+6%
+8%
+10%
+12%
1956/57 1962/63 1968/69 1974/75 1980/81 1986/87 1992/93 1998/99 2004/05 2010/11 2016/17
5 year rolling average
7 Commons Library Briefing, 7 June 2017
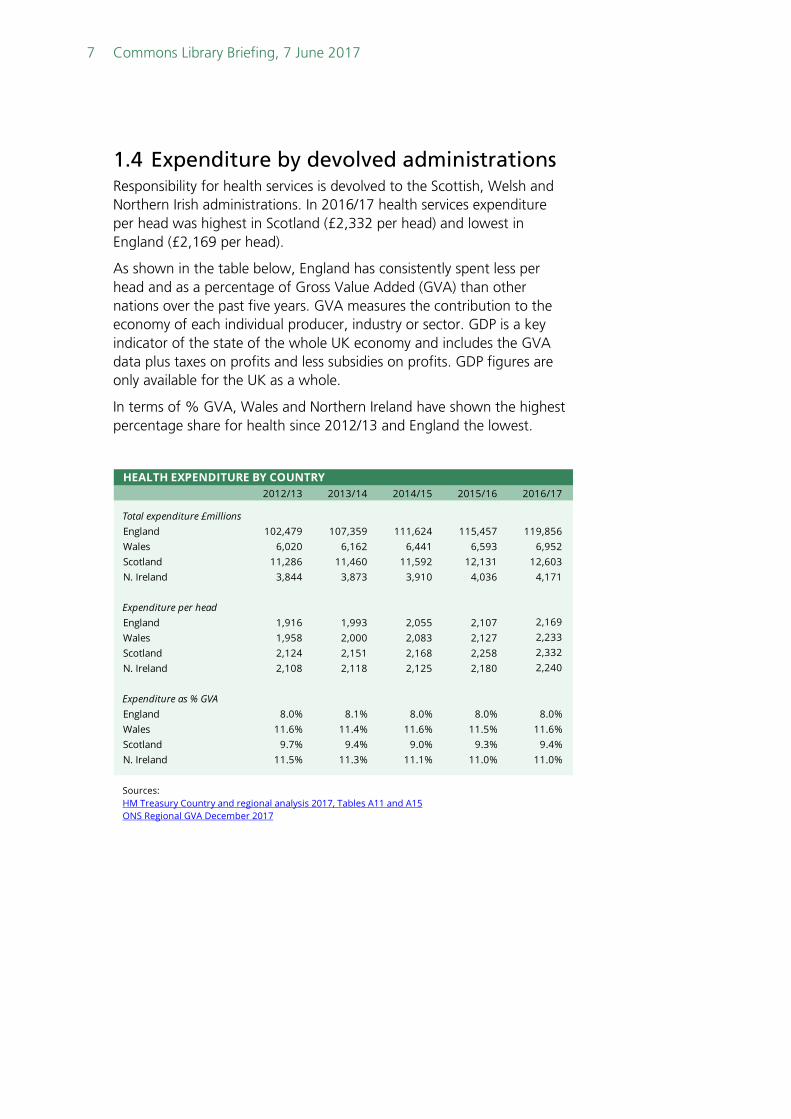
1.4 Expenditure by devolved administrations Responsibility for health services is devolved to the Scottish, Welsh and Northern Irish administrations. In 2016/17 health services expenditure per head was highest in Scotland (£2,332 per head) and lowest in England (£2,169 per head).
As shown in the table below, England has consistently spent less per head and as a percentage of Gross Value Added (GVA) than other nations over the past five years. GVA measures the contribution to the economy of each individual producer, industry or sector. GDP is a key indicator of the state of the whole UK economy and includes the GVA data plus taxes on profits and less subsidies on profits. GDP figures are only available for the UK as a whole.
In terms of % GVA, Wales and Northern Ireland have shown the highest percentage share for health since 2012/13 and England the lowest.
Sources: HM Treasury Country and regional analysis 2017, Tables A11 and A15 ONS Regional GVA December 2017
HEALTH EXPENDITURE BY COUNTRY2012/13 2013/14 2014/15 2015/16 2016/17
Total expenditure £millionsEngland 102,479 107,359 111,624 115,457 119,856Wales 6,020 6,162 6,441 6,593 6,952Scotland 11,286 11,460 11,592 12,131 12,603N. Ireland 3,844 3,873 3,910 4,036 4,171
Expenditure per headEngland 1,916 1,993 2,055 2,107 2,169Wales 1,958 2,000 2,083 2,127 2,233Scotland 2,124 2,151 2,168 2,258 2,332N. Ireland 2,108 2,118 2,125 2,180 2,240
Expenditure as % GVAEngland 8.0% 8.1% 8.0% 8.0% 8.0%Wales 11.6% 11.4% 11.6% 11.5% 11.6%Scotland 9.7% 9.4% 9.0% 9.3% 9.4%N. Ireland 11.5% 11.3% 11.1% 11.0% 11.0%

8 NHS Funding and Expenditure
2. NHS England
2.1 Funding process Funding for health services comes from the total budget for the Department of Health and Social Care (DHSC). The NHS England revenue and capital budgets are announced in the Department of Health and Social Care’s expenditure plans, published as part of each Spending Review (and amended by budget announcements). In 2016/17 the total allocated budget for the DHSC was £121 billion.10 The majority of this budget (£107 billion) was transferred to NHS England with the remainder divided between DH’s other agencies and programmes, including funding for Public Health England, and Arm’s Length Bodies like the Care Quality Commission, NHS Improvement and NICE. NHS England’s budget is used to deliver its mandate from the DH. NHS England is responsible for allocating resources to local commissioners of health services: clinical commissioning groups (CCGs) and local authorities. Most of the commissioning resource allocations go to CCGs (£76.5 billion in 2016/17). Of the remaining resources (£30.5 billion in 2016/17) NHS England directly commissions certain services on a national level, covering specialised services (£15 billion), primary care and military and offender services. The remainder of NHS England’s budget is spent on centrally administered projects and services, including some public health responsibilities on behalf of Public Health England, which broadly comprise immunisation and screening programmes.11
Funds flow from CCGs to NHS hospitals and other providers either via contracts, or through a system known as Payment by Results, which uses a “tariff” based on national average costs for each type of treatment. More details on the commissioning role of CCGs and the organisation of the NHS in England can be found in the Library Standard Note The Structure of the NHS in England.
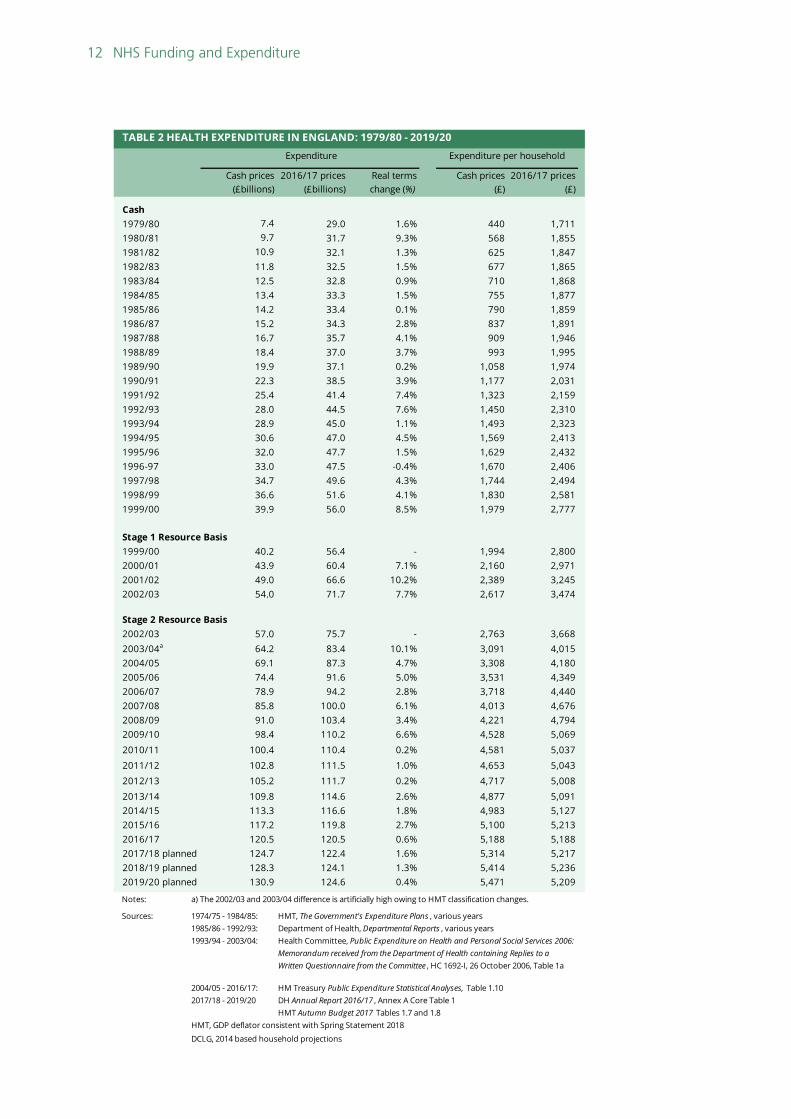
2.2 Total expenditure Table 2 at the end of this note shows health expenditure and planned expenditure in England from 1979/80 to 2019/20 (including additional health funding announced in the Autumn 2017 Budget). Earlier data is not available on a consistent basis. Although real-terms expenditure has risen from £29.0 billion in 1974/75 to £120.5 billion in the 2016/17 (the latest outturn expenditure), changes in accounting procedures preclude consistent comparisons of spending over long periods. However, year-on-year real-term increases can be quoted on a consistent basis:
10 HM Treasury, Public Expenditure Statistical Analyses 2017, Table 1.10 11 NHS England Annual Report 2016/17
9 Commons Library Briefing, 7 June 2017
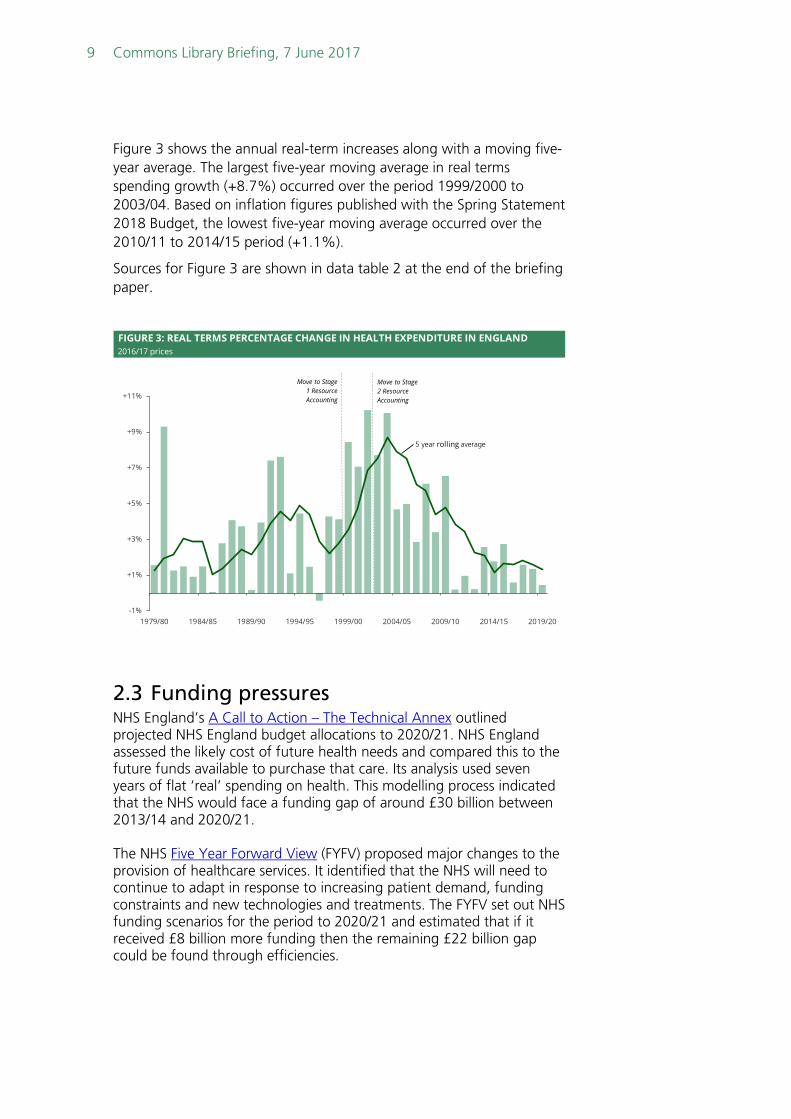
Figure 3 shows the annual real-term increases along with a moving five-year average. The largest five-year moving average in real terms spending growth (+8.7%) occurred over the period 1999/2000 to 2003/04. Based on inflation figures published with the Spring Statement 2018 Budget, the lowest five-year moving average occurred over the 2010/11 to 2014/15 period (+1.1%).
Sources for Figure 3 are shown in data table 2 at the end of the briefing paper.
2.3 Funding pressures NHS England’s A Call to Action – The Technical Annex outlined projected NHS England budget allocations to 2020/21. NHS England assessed the likely cost of future health needs and compared this to the future funds available to purchase that care. Its analysis used seven years of flat ‘real’ spending on health. This modelling process indicated that the NHS would face a funding gap of around £30 billion between 2013/14 and 2020/21. The NHS Five Year Forward View (FYFV) proposed major changes to the provision of healthcare services. It identified that the NHS will need to continue to adapt in response to increasing patient demand, funding constraints and new technologies and treatments. The FYFV set out NHS funding scenarios for the period to 2020/21 and estimated that if it received £8 billion more funding then the remaining £22 billion gap could be found through efficiencies.
FIGURE 3: REAL TERMS PERCENTAGE CHANGE IN HEALTH EXPENDITURE IN ENGLAND2016/17 prices
-1%
+1%
+3%
+5%
+7%
+9%
+11%
1979/80 1984/85 1989/90 1994/95 1999/00 2004/05 2009/10 2014/15 2019/20
Move to Stage1 Resource Accounting
Move to Stage2 Resource Accounting
5 year rolling average

10 NHS Funding and Expenditure
The 2015 Spending Review set out that NHS funding in England is planned to reach £119.9 billion by 2020/21. This represents a £8.4 billion real terms increase from 2015/16 (a £10 billion increase if measured from 2014-15). The NHS in England is also committed to deliver its £22 billion in efficiency savings by 2020-21.
However, there are concerns that efficiency savings may not be met. As noted in the Health Committee report on The Impact of the Spending Review on health and social care finances, a number of organisations believed the required scale of efficiency savings to be made was unprecedented.
NHS England acknowledged this in the Five Year Forward View:
The NHS’ long run performance has been efficiency of 0.8% annually, but nearer to 1.5%-2% in recent years. For the NHS repeatedly toa chieve an extra 2% net efficiency/demand saving across its whole funding base each year for the rest of the decade would represent a strong performance -compared with the NHS' own past, compared with the wider UK economy, and with other countries' health systems. 12
Around £6 billion of additional health funding up to 2019/20 was announced in the Autumn Budget 2017. Even with these additional funds, concerns remain that the NHS will continue to face considerable pressures. A joint statement in response to the Autumn Budget by the King’s Fund, Health Foundation and Nuffield Trust13 argued that with NHS funding growth slowing to just 0.4%, planned expenditure is not enough to maintain standards of care and meet the rising demand for health services. They estimate that NHS spending requires a 4.3% average annual increase to keep pace with demographic and cost pressures.
.
12 NHS England Five Year Forward View 13 King's Fund Response to Autumn Budget 2017

11 Commons Library Briefing, 7 June 2017
3. Data tables
TABLE 1 GOVERNMENT EXPENDITURE ON HEALTH SERVICES: 1950/51-2016/17: UK
A B C A B C A B C A B C
1950/51 0.46 14.34 +1.8% 3.5%1951/52 0.47 13.69 -4.5% 3.2%1952/53 0.52 13.83 +1.0% 3.2%1953/54 0.50 12.91 -6.6% 2.9%1954/55 0.52 12.72 -1.5% 2.9%1955/56 0.57 13.13 +3.2% 2.9%1956/57 0.62 13.51 +2.9% 2.9%1957/58 0.66 13.75 +1.8% 2.9%1958/59 0.71 14.41 +4.8% 3.0%1959/60 0.73 14.83 +2.9% 2.9%1960/61 0.82 16.29 +9.9% 3.1%1961/62 0.85 16.19 -0.6% 3.0%1962/63 0.89 16.59 +2.5% 3.0%1963/64 0.97 1.07 17.70 19.53 +6.7% 3.0% 3.3%1964/65 1.06 1.16 18.50 20.29 +4.6% +3.9% 3.0% 3.3%1965/66 1.20 1.32 19.90 21.85 +7.5% +7.7% 3.2% 3.5%1966/67 1.32 1.45 1.42 20.79 22.82 22.40 +4.5% +4.5% 3.3% 3.6% 3.5%1967/68 1.44 1.59 1.56 22.13 24.37 23.91 +6.4% +6.8% +6.7% 3.4% 3.7% 3.6%1968/69b 1.55 1.71 1.68 22.58 24.95 24.47 +2.0% +2.4% +2.4% 3.3% 3.6% 3.6%1969/70 1.80 1.76 24.59 24.11 -1.5% -1.5% 3.5% 3.5%1970/71 2.11 2.07 26.28 25.78 +6.9% +7.0% 3.6% 3.6%1971/72 2.41 2.36 27.84 27.34 +5.9% +6.1% 3.7% 3.7%1972/73 2.75 2.70 29.29 28.76 +5.2% +5.2% 3.7% 3.6%1973/74c 3.10 3.06 30.39 29.94 +3.8% +4.1% 3.7% 3.7%1974/75 4.10 33.40 +11.6% 4.2%1975/76 5.47 35.84 +7.3% 4.5%1976/77 6.25 35.95 +0.3% 4.4%1977/78 6.90 34.87 -3.0% 4.2%1978/79 7.84 35.63 +2.2% 4.1%1979/80 9.20 35.77 +0.4% 4.0%1980/81 11.94 39.00 +9.0% 4.5%1981/82 13.27 39.20 +0.5% 4.5%1982/83 14.39 39.61 +1.1% 4.4%1983/84 15.38 40.44 +2.1% 4.3%1984/85 16.31 40.55 +0.3% 4.2%1985/86 17.43 41.02 +1.2% 4.1%1986/87 18.98 42.88 +4.6% 4.2%1987/88 20.30 43.45 +1.3% 4.0%1988/89 22.40 45.02 +3.6% 3.9%1989/90 24.20 45.18 +0.3% 3.9%1990/91 27.10 46.77 +3.5% 4.0%1991/92 30.90 50.44 +7.8% 4.3%1992/93 34.20 54.46 +8.0% 4.6%1993/94 36.60 56.95 +4.6% 4.7%1994/95 39.40 60.59 +6.4% 4.8%1995/96 41.40 61.79 +2.0% 4.8%1996/97 42.80 61.65 -0.2% 4.7%1997/98 44.50 63.63 +3.2% 4.6%1998/99 46.90 66.12 +3.9% 4.7%1999/00 49.40 69.34 +4.9% 4.7%2000/01 54.20 74.53 +7.5% 4.9%2001/02 59.80 81.23 +9.0% 5.2%2002/03 66.20 87.87 +8.2% 5.5%2003/04 74.90 97.29 +10.7% 5.9%2004/05 82.90 104.77 +7.7% 6.3%2005/06 89.80 110.60 +5.6% 6.4%2006/07 94.70 113.09 +2.3% 6.4%2007/08 101.10 117.81 +4.2% 6.5%2008/09 108.70 123.46 +4.8% 7.0%2009/10 116.90 130.87 +6.0% 7.6%2010/11 119.90 131.82 +0.7% 7.5%2011/12 121.30 131.46 -0.3% 7.4%2012/13 124.30 131.97 +0.4% 7.3%2013/14 129.40 135.08 +2.4% 7.3%2014/15 134.10 137.99 +2.2% 7.2%2015/16 138.50 141.56 +2.6% 7.3%2016/17 144.30 144.30 +1.9% 7.3%Notes: a) Minor inconsistencies in the figures presented in the Annual Abstract mean that figures must be presented as three overlapping series.
b) From April 1969 some services transferred to personal social services.
Sources: ONS, Annual Abstract of Statistics: 2007 , Table 10.22, and earlier editions
ONS database, series YBHA , ABMI and YBGB
HMT, GDP deflator consistent with Spring Statement 2018
HM Treasury Public Expenditure Statistical Analyses Table 4.2
c) Expenditure by local authorities on provision of health centres, health visiting, home nursing, ambulance services, vaccination and immunisation etc. was transferred to central government on 1 April 1974.
Net expenditure (£billion)a
Net expenditure (£ billion at 2016/17 prices)
Annual % increase in real terms
Net expenditure as a proportion of GDP
12 NHS Funding and Expenditure
TABLE 2 HEALTH EXPENDITURE IN ENGLAND: 1979/80 - 2019/20
2016/17 prices(£billions)
Real terms change (%)
Cash prices (£)
2016/17 prices (£)
Cash1979/80 29.0 1.6% 440 1,7111980/81 31.7 9.3% 568 1,8551981/82 32.1 1.3% 625 1,8471982/83 32.5 1.5% 677 1,8651983/84 32.8 0.9% 710 1,8681984/85 33.3 1.5% 755 1,8771985/86 33.4 0.1% 790 1,8591986/87 34.3 2.8% 837 1,8911987/88 35.7 4.1% 909 1,9461988/89 37.0 3.7% 993 1,9951989/90 37.1 0.2% 1,058 1,9741990/91 38.5 3.9% 1,177 2,0311991/92 41.4 7.4% 1,323 2,1591992/93 44.5 7.6% 1,450 2,3101993/94 45.0 1.1% 1,493 2,3231994/95 47.0 4.5% 1,569 2,4131995/96 47.7 1.5% 1,629 2,4321996-97 47.5 -0.4% 1,670 2,4061997/98 49.6 4.3% 1,744 2,4941998/99 51.6 4.1% 1,830 2,5811999/00 56.0 8.5% 1,979 2,777
Stage 1 Resource Basis1999/00 56.4 - 1,994 2,8002000/01 60.4 7.1% 2,160 2,9712001/02 66.6 10.2% 2,389 3,2452002/03 71.7 7.7% 2,617 3,474
Stage 2 Resource Basis2002/03 75.7 - 2,763 3,6682003/04a 83.4 10.1% 3,091 4,0152004/05 87.3 4.7% 3,308 4,1802005/06 91.6 5.0% 3,531 4,3492006/07 94.2 2.8% 3,718 4,4402007/08 100.0 6.1% 4,013 4,6762008/09 103.4 3.4% 4,221 4,7942009/10 110.2 6.6% 4,528 5,069
2010/11 100.4 110.4 0.2% 4,581 5,037
2011/12 102.8 111.5 1.0% 4,653 5,043
2012/13 105.2 111.7 0.2% 4,717 5,008
2013/14 109.8 114.6 2.6% 4,877 5,0912014/15 113.3 116.6 1.8% 4,983 5,1272015/16 117.2 119.8 2.7% 5,100 5,2132016/17 120.5 120.5 0.6% 5,188 5,1882017/18 planned 124.7 122.4 1.6% 5,314 5,2172018/19 planned 128.3 124.1 1.3% 5,414 5,2362019/20 planned 130.9 124.6 0.4% 5,471 5,209
Notes:
Sources: 1974/75 - 1984/85: HMT, The Government's Expenditure Plans , various years1985/86 - 1992/93: Department of Health, Departmental Reports , various years1993/94 - 2003/04:
2004/05 - 2016/17: HM Treasury Public Expenditure Statistical Analyses, Table 1.102017/18 - 2019/20 DH Annual Report 2016/17 , Annex A Core Table 1
HMT Autumn Budget 2017 Tables 1.7 and 1.8HMT, GDP deflator consistent with Spring Statement 2018
DCLG, 2014 based household projections
7.49.7
Expenditure per household
Cash prices (£billions)
Expenditure
28.928.0
19.9
14.2
10.911.812.513.4
15.216.718.4
22.325.4
36.639.9
40.243.9
30.632.033.034.7
Health Committee, Public Expenditure on Health and Personal Social Services 2006: Memorandum received from the Department of Health containing Replies to a Written Questionnaire from the Committee , HC 1692-I, 26 October 2006, Table 1a
a) The 2002/03 and 2003/04 difference is artificially high owing to HMT classification changes.
49.054.0
57.064.269.1
98.491.085.878.974.4
BRIEFING PAPER Number CBP0724 7 June 2017
About the Library The House of Commons Library research service provides MPs and their staff with the impartial briefing and evidence base they need to do their work in scrutinising Government, proposing legislation, and supporting constituents.
As well as providing MPs with a confidential service we publish open briefing papers, which are available on the Parliament website.
Every effort is made to ensure that the information contained in these publicly available research briefings is correct at the time of publication. Readers should be aware however that briefings are not necessarily updated or otherwise amended to reflect subsequent changes.
If you have any comments on our briefings please email [email protected]. Authors are available to discuss the content of this briefing only with Members and their staff.
If you have any general questions about the work of the House of Commons you can email [email protected].
Disclaimer This information is provided to Members of Parliament in support of their parliamentary duties. It is a general briefing only and should not be relied on as a substitute for specific advice. The House of Commons or the author(s) shall not be liable for any errors or omissions, or for any loss or damage of any kind arising from its use, and may remove, vary or amend any information at any time without prior notice.
The House of Commons accepts no responsibility for any references or links to, or the content of, information maintained by third parties. This information is provided subject to the conditions of the Open Parliament Licence.