Embed Size (px)
Citation preview
Nigerian oil and gas industry local content development: A stakeholder analysis De Vita, G. , Lagoke, O. and Adesola, S. Author post-print (accepted) deposited in CURVE May 2016 Original citation & hyperlink: De Vita, G. , Lagoke, O. and Adesola, S. (2016) Nigerian oil and gas industry local content development: A stakeholder analysis. Public Policy and Administration, volume 31 (1): 51-79. http://dx.doi.org/10.1177/0952076715581635 Copyright © and Moral Rights are retained by the author(s) and/ or other copyright owners. A copy can be downloaded for personal non-commercial research or study, without prior permission or charge. This item cannot be reproduced or quoted extensively from without first obtaining permission in writing from the copyright holder(s). The content must not be changed in any way or sold commercially in any format or medium without the formal permission of the copyright holders. This document is the author’s post-print version, incorporating any revisions agreed during the peer-review process. Some differences between the published version and this version may remain and you are advised to consult the published version if you wish to cite from it.
CURVE is the Institutional Repository for Coventry University http://curve.coventry.ac.uk/open

Nigerian oil and gas industry local content development:
a stakeholder analysis
by Glauco De Vita, Oluwatosin Lagoke and Sola Adesola
Public Policy and Administration 05/2015; DOI:10.1177/0952076715581635
Abstract
This paper undertakes the first stakeholder analysis of the Nigerian oil and gas industry local
content development (LCD) policy to gain a better understanding of the extent of
stakeholders’ interactions and how such interactions align to conditions conducive to LCD.
Drawing from policy documents and semi-structured interviews, 15 stakeholder groups are
identified, and seven of them categorized as key ‘players’. A social network analysis then
reveals that: (i) a significant proportion of relationships between key players are
unidirectional; (ii) a marginal role is played by higher education institutions within the
network; (iii) it is international oil companies rather than indigenous operators that exhibit
‘global centrality’ within the industry network, with the former stakeholder group pivotally
determining industry activities. Our findings provide a valuable first step towards the
development of a polycentric framework for the appraisal of the Nigerian LCD policy.
Keywords
local content development, Nigeria, oil and gas industry, social network analysis, stakeholder
theory, stakeholder analysis
Introduction
The Nigerian local content development (LCD) policy is an initiative by the Federal
Government to help develop local capacity building in the Nigerian oil and gas industry and

to enable Nigerians to participate actively. LCD has been defined by many authors in
different ways but essentially refers to the
quantum of composite value added or created in the Nigerian economy
through the utilization of Nigerian human and material resources for the
provision of goods and services to the petroleum industry within acceptable
quality, health, safety and environmental standards in order to stimulate the
development of indigenous capabilities. (NOGIC Act, 2010: 26)
LCD in Nigeria has generated a large body of literature, with its focus ranging from
the development of theoretical frameworks (Heum, 2008; Heum et al., 2003; Ihua, 2010;
Omenikolo and Amadi, 2010) to surveys and early empirical work aimed at appraising LCD
policy objectives (Bakare, 2011; Ihua et al., 2011). However, to our knowledge, to date, no
study has conducted a rigorous analysis of the key stakeholders in the Nigerian oil and gas
industry who are in a position to ‘affect and be affected by’ the LCD policy, and the
relational structure that characterizes this network.
This gap is striking when considering the potential contribution of such knowledge for
a polycentric understanding of the Nigerian oil and gas industry, and for the identification of
ways in which the effectiveness of the LCD policy could be increased. Drawing from
stakeholder theory, we aim to fill this gap and thus contribute to the development of a more
comprehensive framework for the appraisal of the efficacy of the Nigerian LCD policy. As
suggested by Bryson:
Governmental and non-profit reforms across the world are also prompting the
need for more attention to stakeholder analyses […] An emphasis on markets,
participation, flexibility and deregulation all imply the need for more focused
attention on a wider array of stakeholders. (2004: 24)

Our primary rationale for undertaking the first stakeholder analysis of the
Nigerian oil and gas industry LCD policy is to gain a better understanding of the
stakeholders involved and, in particular, the extent of the actual involvement in policy-
making and implementation of non-state actors in such process. Key questions we aim
to address through such analysis, therefore, include ‘who are the key industry players?’
and ‘how do interactions among such key players align to conditions conducive to
LCD?’ The latter question, to be investigated through an application of social network
analysis (SNA) techniques, should be particularly informative since, as elaborated later
in the paper, for LCD to come to fruition considerable coordination of and collaboration
among the multiplicity of stakeholders that characterize the relational structure of this
network is required.
A brief review of the history and objectives of Nigeria’s LCD policy
The history of the LCD policy in Nigeria is traceable to the Petroleum Act of 1969, which
stated that ‘the entire ownership and control of all petroleum in, under or upon any lands [...],
shall be vested in the State’ (Petroleum Act, 1990: 2), notwithstanding allowances for
foreign-owned companies to provide services or operate directly in the sector. The Act also
entails a directive that obliges owners of oil drilling leases to ensure that - within ten years
from the time the lease is granted - at least 75% of the workers employed in their operations
are Nigerians.
The Petroleum Act of 1969 was later amended by the Petroleum (Drilling and
Production) Amendment Regulations Act. Such legislation was followed by the Joint
Operating Agreement (JOA) and Production Sharing Contracts (PSCs) Act, which became
effective from 1971 (Ameh, 2006). These legislative arrangements mandated the Nigerian

government to acquire a 33.3% participation interest in AGIP (‘Azienda Generale Italiana
Petroli’ – General Italian Oil Company). The government’s stake in AGIP rose to 60% in
1979, a transaction undertaken through the Nigerian National Oil Corporation (NNOC),
which had been established in 1972.
The Petroleum Training Institute (PTI) Act of 1972 led to the establishment of the PTI
in 1973. Although the institute was established as a prerequisite for the membership of the
Organization of Petroleum Exploring Countries (OPEC), it was also set up to train Nigerians
to meet the labor force requirement of the Nigerian oil and gas industry. The objective was,
and still is:
... to deliver quality education and provide efficient technological manpower
to build a competent and committed workforce that will sustain and service
the continental oil and gas industry. (Petroleum Training Institute, 2011: 13)
In 1973, the Gulf Oil Company Fund was repealed by the promulgation of the
Petroleum Technology Development Fund (PTDF) Act No. 25, which established the PTDF
specifically to build indigenous capability as well as in-country technological development
through training of Nigerians in various industry fields.
The development of the Marginal Field Programme as contained in the Petroleum
(Amendment) Decree No. 23 of 1996 was also geared towards the development of LCD. A
‘marginal field’ is defined as any field that has reserves booked and reported annually to the
Department of Petroleum Resources (DPR) and which has remained unattended to for a
period of ten years (Ayodele and Frimpong, 2003).
This law was promulgated to help recover marginal fields from various international
oil companies (IOCs) and re-allocate them to indigenous firms. The conditions for this re-
allocation were such that current holders of oil prospecting licenses (OPLs) and oil mining

licenses (OMLs) were excluded from applying, owning, operating or acquiring participatory
interests in any marginal field (Emole, 1996). However, indigenous companies that desired
allocation of these oil fields were only eligible if they relinquished their OPLs and OMLs. In
view of this, IOCs were made to farm-out these oil fields only to citizens of Nigeria who
owned registered companies, with sound knowledge of the industry as well as financial and
technical capabilities. Invariably, this decree prevented IOCs already operating in Nigeria
from ‘farming-in’ because they would have had to relinquish their licenses for probably
smaller quantities of oil wells. This was to enable Nigerians to get more involved in the
industry upstream and midstream sectors, thereby increasing local content. However, aimed
at creating a ‘win-win’ situation, the guidelines stipulated that ‘the farmee’ (the person who
the marginal field is farmed out to) may form a business relationship with a foreign partner
(with the latter having a maximum of 40% equity).
In 2003 the National Committee on LCD was established by the Federal House of
Assembly. The Committee was charged with the responsibility of developing a Local Content
Bill. The Bill was passed by Senate in 2006, ratified by the House of Representatives in
March 2010, and finally signed into law in April 2010 and renamed as ‘Nigerian Oil and Gas
Industry Content Development Bill 2010’ with the acronym NOGIC Act (2010).
The main thrust of the NOGIC Act (2010) is value addition. Having realized that the
lifeblood of Nigeria resides in the oil and gas sector, the Nigerian government aims to utilize
in-country human and material resources to add value to the economy. Five specific
objectives are highlighted in the policy document.
The first objective (NOGIC Act, 2010, Section 3.1) stipulates that Nigerians are to be
considered ‘first’ in the award of exploration and contractual rights, though quality, cost and
timely delivery would still be considered as part of the competitive process. The second
objective (ibid, Section 51.1 & 52.1) mandates that all operators and contractors requiring
legal or financial services shall retain only the services of Nigerian firms. The third
objective (ibid, Section 28.1) extends the principle of ‘first consideration’ to training and
employment.
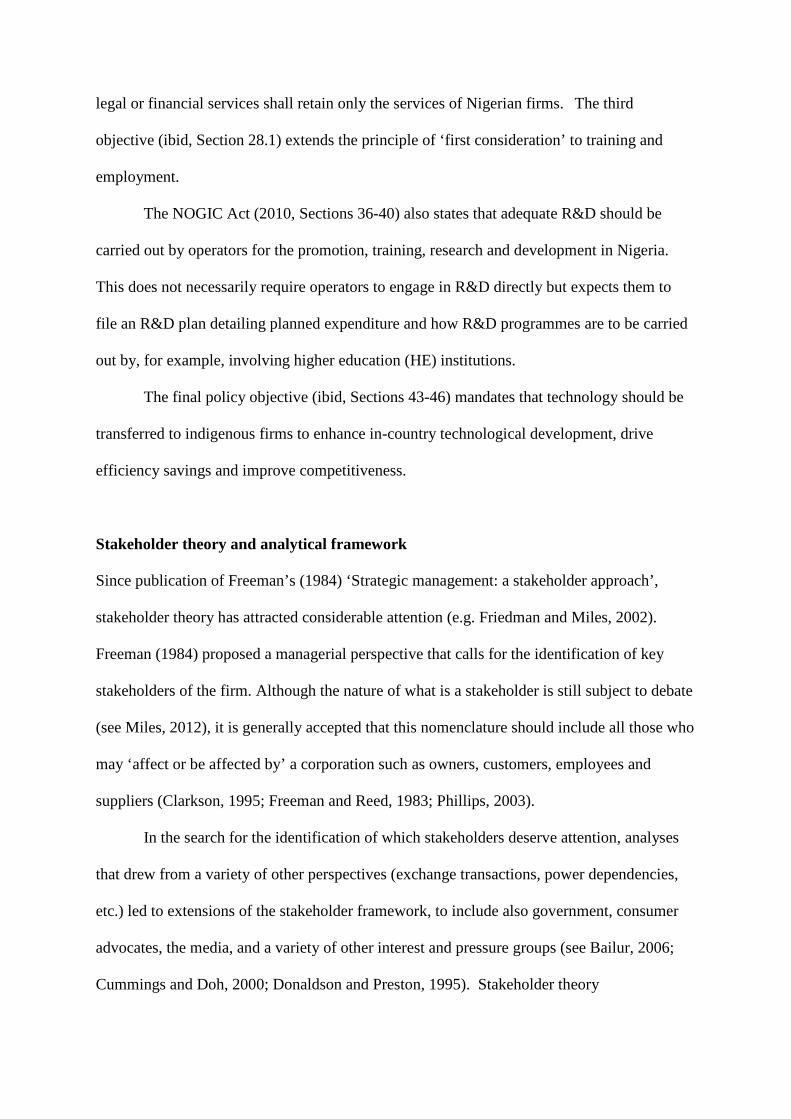
The NOGIC Act (2010, Sections 36-40) also states that adequate R&D should be
carried out by operators for the promotion, training, research and development in Nigeria.
This does not necessarily require operators to engage in R&D directly but expects them to
file an R&D plan detailing planned expenditure and how R&D programmes are to be carried
out by, for example, involving higher education (HE) institutions.
The final policy objective (ibid, Sections 43-46) mandates that technology should be
transferred to indigenous firms to enhance in-country technological development, drive
efficiency savings and improve competitiveness.
Stakeholder theory and analytical framework
Since publication of Freeman’s (1984) ‘Strategic management: a stakeholder approach’,
stakeholder theory has attracted considerable attention (e.g. Friedman and Miles, 2002).
Freeman (1984) proposed a managerial perspective that calls for the identification of key
stakeholders of the firm. Although the nature of what is a stakeholder is still subject to debate
(see Miles, 2012), it is generally accepted that this nomenclature should include all those who
may ‘affect or be affected by’ a corporation such as owners, customers, employees and
suppliers (Clarkson, 1995; Freeman and Reed, 1983; Phillips, 2003).
In the search for the identification of which stakeholders deserve attention, analyses
that drew from a variety of other perspectives (exchange transactions, power dependencies,
etc.) led to extensions of the stakeholder framework, to include also government, consumer
advocates, the media, and a variety of other interest and pressure groups (see Bailur, 2006;
Cummings and Doh, 2000; Donaldson and Preston, 1995). Stakeholder theory

assesses stakeholders’ identity on the basis of the possession of one or more of three
relationship attributes: power, legitimacy, and urgency. According to Mitchell et al. (1997),
the greater the possession of these attributes, the more stakeholders’ claims should be taken
into account.
Perspectives on stakeholder theory have developed around three different approaches,
namely descriptive, normative and instrumental. As argued by Donaldson and Preston
(1995), the descriptive approach is merely used to explain the characteristics of stakeholders.
The instrumental approach is more empirical in nature, aiming to identify the connections
that exist among stakeholders, and how these relations align to overall goals. Finally, the
normative approach critically examines the functioning of these relationships with the aim of
providing guidelines for successful coordination and/or implementation.
Donaldson and Preston (1995) add that descriptive stakeholder analysis acts as a
necessary precursor to the normative and instrumental approaches; a proposition which
precisely characterizes the modeling stages of the analysis carried out by the present study.
Even though stakeholder theory was originally conceived with reference to the private
sector firm, it has now begun to be applied to public sector organizations as well as
government policies. The relevance of the theory to public policy is confirmed by the fact
that some (albeit still few) studies have already concerned themselves with conducting a
stakeholder analysis of government projects. For example, Bailur (2006) applied stakeholder
theory to a public sector policy program, by analyzing the Gyandoot telecenter projects in
Madhya Pradesh (India). Reed et al. (2009) applied stakeholder theory to participatory natural
resource management by performing an exemplary stakeholder analysis of the Rural
Economy and Land Use (RELU) program. Mandarano (2009) provided a novel, state-of-the-
art application of a series of social network analysis (SNA) methodologies to evaluate the

social capital resulting from the U.S. Environmental Protection Agency National Estuary
Program, an ecosystem-based collaborative planning program.
Against this backdrop, and drawing broadly from the templates developed by previous
applications, our stakeholder analysis follows the process sketched in Figure 1.
< Figure 1 here >
Several authors (e.g., Ackerman and Eden, 2011) have suggested different methods
for identifying stakeholders, including focus groups, interviews, and secondary sources.
Given our aim, and to remain faithful to the policy documentation, secondary evidence (in the
form of documentary material) provided a valuable initial tool, though interviews via snow-
ball sampling were our main instrument to identify successive respondents from a cross-
section of stakeholder groups, as well as to collect network data to inform our analysis of
existing relationships within the oil and gas industry.
For the stakeholder identification and differentiation, we adopt the stepwise
framework suggested by Bryson (1995). Bryson’s approach enables us to identify each of the
various stakeholder groups within the industry, and draw distinctions in terms of their level of
interest and influence with respect to key LCD policy objectives.
The identified stakeholders are then mapped onto the power-interest framework of
Ackermann and Eden (2011), which allows for the categorization of relevant actors as
‘subjects’, ‘players’, ‘crowd’, and ‘leaders’ or ‘context-setters’ on the basis of two variables,
‘interest’ and ‘power’. Given the context and purpose of our study, the ‘power’ variable was
operationalized in terms of ‘degree of involvement in LCD policy implementation’ (the
closed question required interviewees to answer either ‘direct’ or ‘indirect’ involvement), the
‘power of employment within the industry’ of each stakeholder group surveyed (using a
three-point scale rating such power as ‘weak’, ‘medium’ or ‘strong’), and the level
‘influence’ through a question probing ‘the extent to which a stakeholder group can exert

influence on the development of emerging indigenous entrepreneurs’ (similarly rated on a
three point scale ranging from ‘weak’ to ‘strong’). ‘Interest’ was operationalized with
specific reference to ‘the level of interest vested by each stakeholder group in the outcomes
of the LCD policy’ (again, rated as ‘weak’, ‘medium’ or ‘strong’). Key ‘players’ are those
who have a high interest and high power (Reed et al., 2009), with at least three of the four
items that make up the ‘power’ and ‘interest’ constructs rated on the upper bound of the
measurement scales. According to Ackermann and Eden (2011), it is ‘players’ in a network
that warrant the nomenclature of ‘stakeholders’. Although ‘context setters’ are highly
influential, they tend to have low interest. ‘Subjects’ are seen to have high interest but low
power. However, there are occasions whereby ‘subjects’ may form coalitions to enhance their
influence. On this account, interest and influence can and often do change over time.
We then investigate the relational structure that exists among stakeholder groups
populating the oil and gas industry ‘network’ (linkage and structure), and the strengths of
such ties, by means of SNA. Although the origins of social network theory can be traced back
to the work of Moreno (1934), it wasn’t until 1956 that Cartwright and Harary (1956)
formalized the use of graph theory as the official tool to conduct SNA.
As noted by Serrat (2009), SNA employs a unique set of measurements by utilizing
structural information to study social networks. Social networks are ‘nodes’ of individuals,
groups, organizations, agencies, and related systems that tie in one or more sets of
interdependencies. As such, we see the applicability of SNA to our quest for a better
understanding of both the relationships among key stakeholders in the oil and gas industry,
and the extent to which the current operational connectivity of this network appears to be
conducive to the achievement of the LCD policy objectives, as self evident.
Drawing from interview data, our SNA entails the computation of several descriptive

indices of the social structure constituted by the stakeholders populating the network. This
process involves the presentation of matrix data in both ‘valued’ and ‘binary’ form from
which analyses of local and global ‘centrality’, ‘betweenness’, and overall network ‘density’
are conducted. These analyses will be complemented by sociograms, which are visual
representations of the network structure (Hatala, 2006).
Methodology
The data collected for this study were obtained from semi-structured interviews though
documentary evidence based on policy documents also complemented the analysis at the
stakeholder identification stage.
Interviews were preferred to focus groups because there are clear cut responsibilities
(as detailed in the NOGIC Act) of each stakeholder group within the oil and gas industry.
Moreover, assembling a focus group of executives alongside government officials would not
have been feasible given their busy schedules. This approach is consistent with ego network
analysis. Hatala (2006) argues that ego network analysis aims to gauge the perspective at
each end of a relationship, since it is the independent information they individually supply
that counts as data. On the other hand, complete network analysis deliberately brings
individuals that are part of a network together, to exchange their views. For this study, ego
network analysis was preferred since we wanted to let stakeholders speak freely on existing
relationships, with no external influence.
Interviews were conducted by telephone rather than face-to-face. This approach
offered several advantages, including greater personal safety/security and reduced costs of
transport. Data collection began with a pilot study (with eight respondents, drawn from across
the stakeholder groups identified for the main study) aimed at ensuring both face and content
validity of the interview questions to be posed during the interviews. The primary reason for
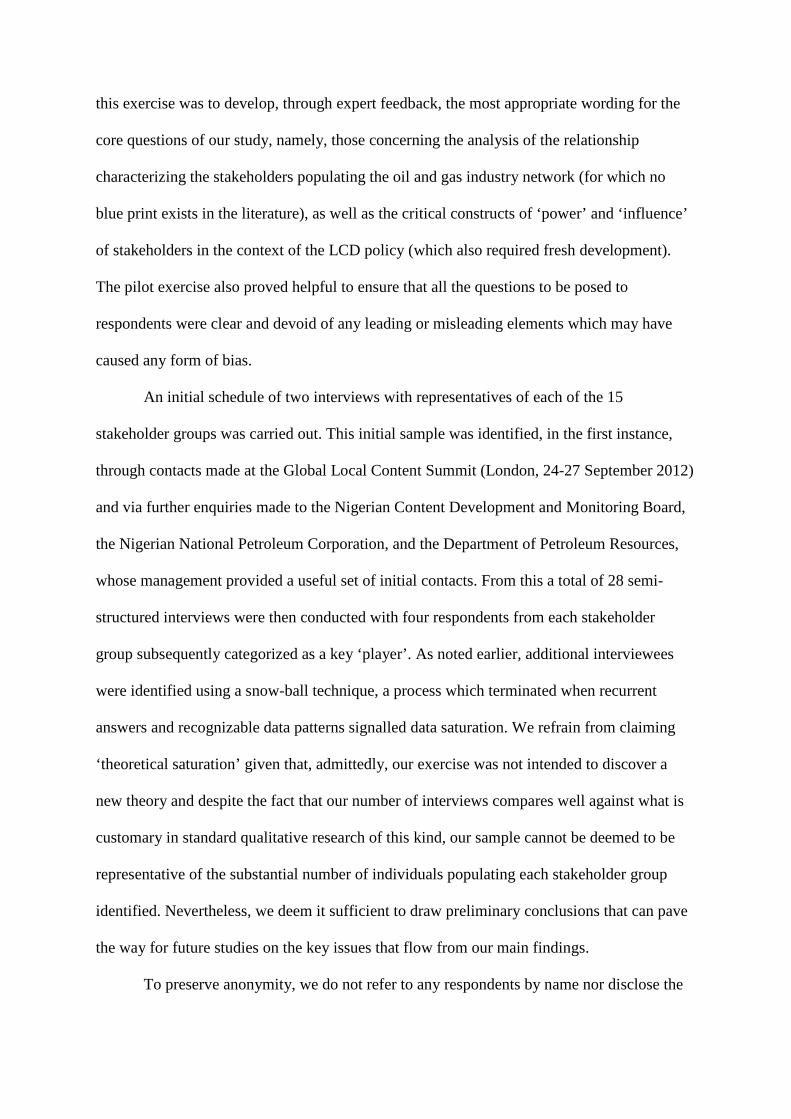
this exercise was to develop, through expert feedback, the most appropriate wording for the
core questions of our study, namely, those concerning the analysis of the relationship
characterizing the stakeholders populating the oil and gas industry network (for which no
blue print exists in the literature), as well as the critical constructs of ‘power’ and ‘influence’
of stakeholders in the context of the LCD policy (which also required fresh development).
The pilot exercise also proved helpful to ensure that all the questions to be posed to
respondents were clear and devoid of any leading or misleading elements which may have
caused any form of bias.
An initial schedule of two interviews with representatives of each of the 15
stakeholder groups was carried out. This initial sample was identified, in the first instance,
through contacts made at the Global Local Content Summit (London, 24-27 September 2012)
and via further enquiries made to the Nigerian Content Development and Monitoring Board,
the Nigerian National Petroleum Corporation, and the Department of Petroleum Resources,
whose management provided a useful set of initial contacts. From this a total of 28 semi-
structured interviews were then conducted with four respondents from each stakeholder
group subsequently categorized as a key ‘player’. As noted earlier, additional interviewees
were identified using a snow-ball technique, a process which terminated when recurrent
answers and recognizable data patterns signalled data saturation. We refrain from claiming
‘theoretical saturation’ given that, admittedly, our exercise was not intended to discover a
new theory and despite the fact that our number of interviews compares well against what is
customary in standard qualitative research of this kind, our sample cannot be deemed to be
representative of the substantial number of individuals populating each stakeholder group
identified. Nevertheless, we deem it sufficient to draw preliminary conclusions that can pave
the way for future studies on the key issues that flow from our main findings.
To preserve anonymity, we do not refer to any respondents by name nor disclose the

specific organization or government department where they work. The analysis is carried out
on a ‘stakeholder group’ basis. We have simplified our nomenclature by choosing a ‘3 letter
abbreviation’ for each stakeholder group as follows: ‘GOV’ for government; ‘IOC’ for
international operating companies; ‘INO’ for indigenous operators; ‘MSP’ for multinational
oil and gas companies; ‘ISP’ for indigenous oil and gas service providers; ‘EPC’ for
engineering, procurement and commissioning (EPC) contractors and fabricators; and ‘TUT’
for HE engineering and geo-science tutors.
The four respondents from GOV consisted of three senior managers in the LCD
division, and one LCD coordinator. These respondents were drawn from various parastatals
of the Federal Government of Nigeria. Each respondent had at least seven years of experience
in government and had been involved in ensuring due process for LCD policy
implementation.
The four respondents from the IOCs were all LCD managers. Each respondent had
over nine years of experience and had the opportunity to work for various oil and gas
divisions before managing the LCD division for at least three years. Their experiences span
from writing and evaluating LCD strategies to ensuring full compliance with the directives
contained in the NOGIC Act (2010). Their responsibilities also entailed reviewing tenders to
ensure conformity with the LCD plan regarding the procurement of materials and equipment
leasing.
The four participants from INOs were all LCD managers with at least seven years of
industry experience. Although this stakeholder group is made up of indigenous companies
which mostly benefit from OMLs farmed out by IOCs, they still partner with foreign firms
especially in the areas where they lack capability.
The respondents from the MSPs were all LCD managers with an average of seven
years of industry experience. Their main responsibilities entailed building indigenous

capacity as well as ensuring that the LCD element contained in their bids conforms to the
requirements of the NOGIC Act (2010).
The respondents from the ISPs were all senior executives with at least 11 years of
industry experience. Of particular interest is that each of the respondents also played a role as
LCD manager/advisor, given their in-depth knowledge of LCD affairs.
The respondents from the EPC stakeholder group were all LCD managers. These
participants had spent at least five years in the engineering industry before managing their
LCD division. The four engineering and geo science tutors (TUT) were all experienced
academics from reputable Nigerian universities involved in engineering and geo science
courses that have been fully accredited by the National Universities Commission (NUC). The
respondents were veterans in their fields and knowledgeable about the LCD policy. Three of
them also had oil and gas industry experience before joining academia.
In order to examine stakeholders’ relationships, we base our analysis on the responses
to one of our core interview questions which asked: ‘Can you please rate your working
relationship with each of these stakeholder groups on a scale of 1 to 5, where 1 is very weak
and 5 is very strong’. Based on the feedback from our pilot study, by working relationship,
the respondents were made to understand that this encompassed contract awards, corporate
social responsibility (CSR) activities, and any other meaningful interaction and/or form of
collaboration. Follow-up questions then probed on qualitative aspects of the relationships
identified, also in terms of the ‘direction’ of these linkages and relative strength so as to allow
us to determine whether the underlying exchanges or joint activities were based on ‘a two-
way relationship’ or, instead, were ‘primarily driven, initiated or managed by one stakeholder
group’.
The analysis of social network data was carried out using the software package
‘UCINET 6’ (see Borgatti et al., 2013). Our findings from the SNA are presented in both

matrix and sociogram form. The matrices are developed by transforming qualitative data
(obtained from participants’ responses) into quantitative form, to enable a quick overview of
all the data across the stakeholder groups analyzed to be formed. From these matrices,
sociograms are generated.
Findings
Identification and categorization of stakeholders
Scrutiny of the NOGIC Act (2010) reveals that the policy document identifies only four main
stakeholder groups which should work together towards the achievement of the LCD policy
objectives. These are: (i) government; (ii) operators (IOCs and INOs); (iii) the legal service
sector; and (iv) the financial services sector.
The roles and responsibilities of the above mentioned stakeholders, as identified in the
NOGIC Act (2010), are highlighted in Table 1. Evidently, incestuous responsibilities and
conflicts of interest aside, the Act provides only a limited representation of those ‘actors’
likely to ‘affect and be affected by’ the LCD policy, calling for a more in-depth analysis of
those who have a stake in, and the capacity for influencing LCD in Nigeria.
< Table 1 here >
Following Bryson’s stepwise approach, as shown by the additional findings reported
in Table 1, our further analysis (based on field survey and interviews) allowed us to identify
15 stakeholders in total, including first and second tier suppliers, fabricators, HE institutions,
local resident pressure groups, etc.
< Figure 2 here >
From the analysis we conducted, the stakeholder groups that we deem fit to be
classified within the ‘players’ category are IOCs, indigenous operators, international
(multinational) oil and gas service companies (first tier suppliers), indigenous oil and gas

service companies (second tier suppliers), EPC contractors and fabricators, HE institutions
and, of course, the Federal Government. Indeed, these are the only stakeholder groups who
according to our operationalization of the ‘power/influence’ and ‘interest’ constructs, record
sufficiently high scores (see also the third, fourth, fifth and sixth columns of Table 1,
alongside our concluding remarks in the final column). Given their insufficient scores for
‘power/influence’ and/or ‘interest’, the other stakeholders, including the residents of the
Niger Delta region, fall within the ‘subjects’, ‘crowd’ and ‘context setters’ quadrants of the
Akermann and Eden’s (2011) matrix, as shown in Figure 2.
Some may view our findings as evidence confirming the typical critique of stakeholder
analysis; that it involves a lot of rigmarole that produces not too surprising and rather thin
results. Yet, we consider these findings significant in at least two important respects.
First, they complement previous analyses of the Nigerian oil and gas industry by
highlighting the importance of a multiplicity of ‘actors’, many of which, in spite of
considerable interest in both the activities of the Nigerian oil and gas industry and the LCD
policy, are found to exert limited influence, having no power roles to instigate a change in the
current state of affairs (best exemplified by the fact that a very large proportion of jobs within
the industry is still carried out by non-nationals and most of the profit generated by the
industry is repatriated abroad). This observation resonates with Phillips’ (2003) call for a
normatively legitimate redefinition of ‘stakeholders’; one that going beyond the traditionally
derivatively legitimate stakeholder status, accounts for the actors to whom an organization or
even more so, a government (as in our case), holds a moral obligation. Opening the analysis
of the sector to consideration of all the constituencies that have a stake in the industry and to
whom the government may have a moral or social responsibility towards is, in this sense, an
endeavour that promotes transparency by encouraging further scrutiny through the lens of
stakeholder groups that have had, traditionally, no voice in shaping policy. In this respect, the

findings also call for a greater empowering of Nigerian citizens, by instilling a sense of
ownership of their natural resources that would enable, in turn, a more vigorous demand for
accountability. As eloquently emphasized by one of our interviewees:
We are still deprived of a rightful share of the benefits that the natural
resources of our land should offer to us, and of the opportunity to develop a
collective, social conscience capable of fuelling public demand for the
government to be transparent and accountable on how substantial revenues
from control over such resources are distributed. (Representative of local
residents of the Niger Delta region)
Second, the findings of our stakeholder categorization analysis reveal the extent to
which industry experts and well as academics that have already devoted attention to Nigerian
LCD, have systematically neglected the importance, at the very least, of actors that aside
from the government and operators can and do play a key player role for LCD in Nigeria. On
this account, it is worth noting that the various theoretical frameworks that have emerged to
date in relevant literature to evaluate the efficacy of Nigerian LCD policy (see Bakare, 2011;
Heum et al., 2003; Ihua, 2010; etc.), though of considerable merit in many respects, appear to
have focused almost exclusive attention to - at most - two stakeholders, namely the
government and/or the operators. For example, Ihua (2010) restricted his framework to
operators alone. Heum et al. (2003) extended the model but only by considering the
additional role of the government. Bakare’s (2011) framework too concerns itself exclusively
with the role of the government and operators, with particular emphasis on indigenous
participants.
We would argue that to enhance local capacity so as to deliver proactive strategies to
sustain the Nigerian common interest requires soliciting the support and cooperation of a

much wider array of stakeholders. In short, what is required is ‘community participation’ in
LCD policy, which is currently conspicuous by its absence.
Social network analysis (SNA)
Our stakeholder analysis would be incomplete without an in-depth investigation of the
relationships between the key players in the industry, and the resulting context effects of the
linkages among them.
< Table 2 here >
Given that our data for the SNA is based upon Likert scale measurements, we begin
by presenting our results in matrix ‘valued’ form. The matrix depicted in Table 2 is bi-
directional in nature, with columns depicting each stakeholder group in the capacity of
‘receiver’ of the content of the exchange pertaining to the identified relationships with other
stakeholders, and rows listing stakeholders as ‘senders’. The numbers displayed in the cells
of Table 3 report the average rating (based on interviewees’ responses) of the strength of each
possible relationship among stakeholders in the network on a scale from 1 (very weak) to 5
(very strong), in terms of both ‘receivers’ and ‘senders’. This implies that the strength of the
relationship that stakeholder A claims to be in existence with stakeholder B does not
necessarily correspond to that perceived by stakeholder B. For example, the ‘valued’
measurement for the TUT < GOV relationship, with TUT as the ‘receiver’, scored an average
rating of ‘2’ (weak relationship), but an average rating of ‘3’ (moderate strength) when
viewed from the perspective of the government as the ‘receiver’ of the GOV < TUT
relationship. Though informative for reference purposes, evidently the ‘valued’ matrix format
is not particularly reader-friendly, and does not lend itself to easy interpretation. In order to
comment and elaborate on the significance of these results, therefore, we swiftly proceed to
dichotomize the data in order for it to take a binary, and more easily interpretable format (this
process is also necessary since for some of the structural indices utilized it is required that a
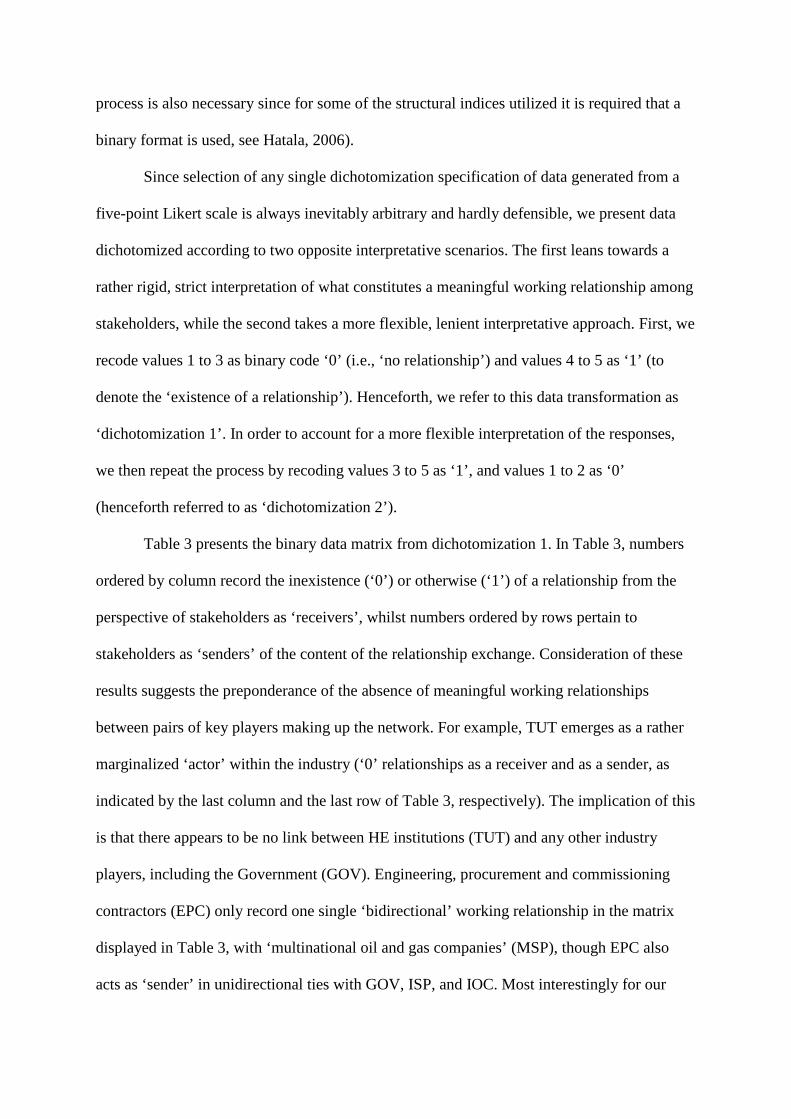
binary format is used, see Hatala, 2006).
Since selection of any single dichotomization specification of data generated from a
five-point Likert scale is always inevitably arbitrary and hardly defensible, we present data
dichotomized according to two opposite interpretative scenarios. The first leans towards a
rather rigid, strict interpretation of what constitutes a meaningful working relationship among
stakeholders, while the second takes a more flexible, lenient interpretative approach. First, we
recode values 1 to 3 as binary code ‘0’ (i.e., ‘no relationship’) and values 4 to 5 as ‘1’ (to
denote the ‘existence of a relationship’). Henceforth, we refer to this data transformation as
‘dichotomization 1’. In order to account for a more flexible interpretation of the responses,
we then repeat the process by recoding values 3 to 5 as ‘1’, and values 1 to 2 as ‘0’
(henceforth referred to as ‘dichotomization 2’).
Table 3 presents the binary data matrix from dichotomization 1. In Table 3, numbers
ordered by column record the inexistence (‘0’) or otherwise (‘1’) of a relationship from the
perspective of stakeholders as ‘receivers’, whilst numbers ordered by rows pertain to
stakeholders as ‘senders’ of the content of the relationship exchange. Consideration of these
results suggests the preponderance of the absence of meaningful working relationships
between pairs of key players making up the network. For example, TUT emerges as a rather
marginalized ‘actor’ within the industry (‘0’ relationships as a receiver and as a sender, as
indicated by the last column and the last row of Table 3, respectively). The implication of this
is that there appears to be no link between HE institutions (TUT) and any other industry
players, including the Government (GOV). Engineering, procurement and commissioning
contractors (EPC) only record one single ‘bidirectional’ working relationship in the matrix
displayed in Table 3, with ‘multinational oil and gas companies’ (MSP), though EPC also
acts as ‘sender’ in unidirectional ties with GOV, ISP, and IOC. Most interestingly for our

purposes, EPC displays no relationship whatsoever with ‘indigenous operators’ (INO). INO
themselves only appear to have established a single bidirectional working relationship, with
‘indigenous oil and gas service providers’ (ISP), and only one additional tie with government
(GOV), for which INO acts as ‘sender’ in the flow of the information exchange, further
denoting the limited collaboration and joint coordination of activities between indigenous and
foreign (multinational) members of the wider industry network.
< Table 3 and Figure 3 here >
An even clearer representation of the results obtained from ‘dichotomization 1’ data, is
provided in the sociogram represented in Figure 3. The absence of a relationship between HE
institutions (TUT) and other stakeholder groups is seen even more clearly in this sociogram
format as there is no line (tie) that connects the TUT node with any other stakeholder group.
The visual structure reveals that some sort of relationship, either unidirectional or
bidirectional, exists between some other stakeholders. However, the government only
exhibits a bidirectional relationship (recorded by arrowheads at both ends of a line) with IOC
and MSP, suggesting that there is still a significant level of foreign dominance within the
Nigerian oil and gas industry. This finding is of critical importance as it reveals that for local
content to be fully developed there is a need for additional bidirectional relationships,
particularly between the government and HE institutions, indigenous operators and service
providers, so as to promote indigenous capacity and capability development.
< Table 4 and Figure 4 here >
The binary data matrix from ‘dichotomization 2’ is presented in Table 4.
Unsurprisingly (given the benevolent specification of this particular data transformation) a
slightly improved picture emerges, as we now see, for example, the government accounting
for more relational ties. TUT now also exhibits some connections. Specifically, it has a
relationship with GOV, IOC and MSP. Yet, as shown by Table 4 and the associated

sociogram (Figure 4), the TUT ties with the IOC and MSP stakeholder groups are
unidirectional (with TUT merely acting as the ‘receiver’ in such relationships), and so is the
tie with GOV, though in this case TUT acts as the ‘sender’ of the flow of exchange.
Evidently, there is a need for these ties to become stronger, and for more relationships to be
forged by and with HE institutions.
Section 57 of the NOGIC Act (2010) formed the platform for the Nigerian Content
Consultative Forum (NCCF), which was set up primarily to enhance collaboration among
stakeholders, but the extent to which this collaboration is being facilitated requires critical
appraisal. As Omenikolo and Amadi (2010) argue, the R&D ties between Nigerian
universities and the oil and gas industry constitute an important weak link. This is an issue
that came out strongly also from our wider interview data, with one interviewee from the
TUT stakeholder group explicitly stating:
To drive LCD, the government itself should establish a strong path linking
Nigerian universities’ capacity to supply first class graduates with proper,
large-scale apprenticeships programs (to be co-sponsored by the State) in
foreign-owned as well indigenous operators in the oil and gas industry.
Instead, Nigerian universities continue to be highly underfunded, and the
scale of such programs is so small so as to make hardly any difference. (Geo-
science university tutor)
Further scrutiny of our findings of ‘dichotomization 2’ data (Table 4 and Figure 4), further
reveal that some bidirectional relationships are present between other industry ‘players’.
Unsurprisingly given its institutional role, GOV records the highest number of such
relationships (with IOC, INO, MSP, ISP and EPC), but international players (IOC) are not far
behind, recording four bidirectional relationships (with GOV, INO, MSP and ISP). Indeed,
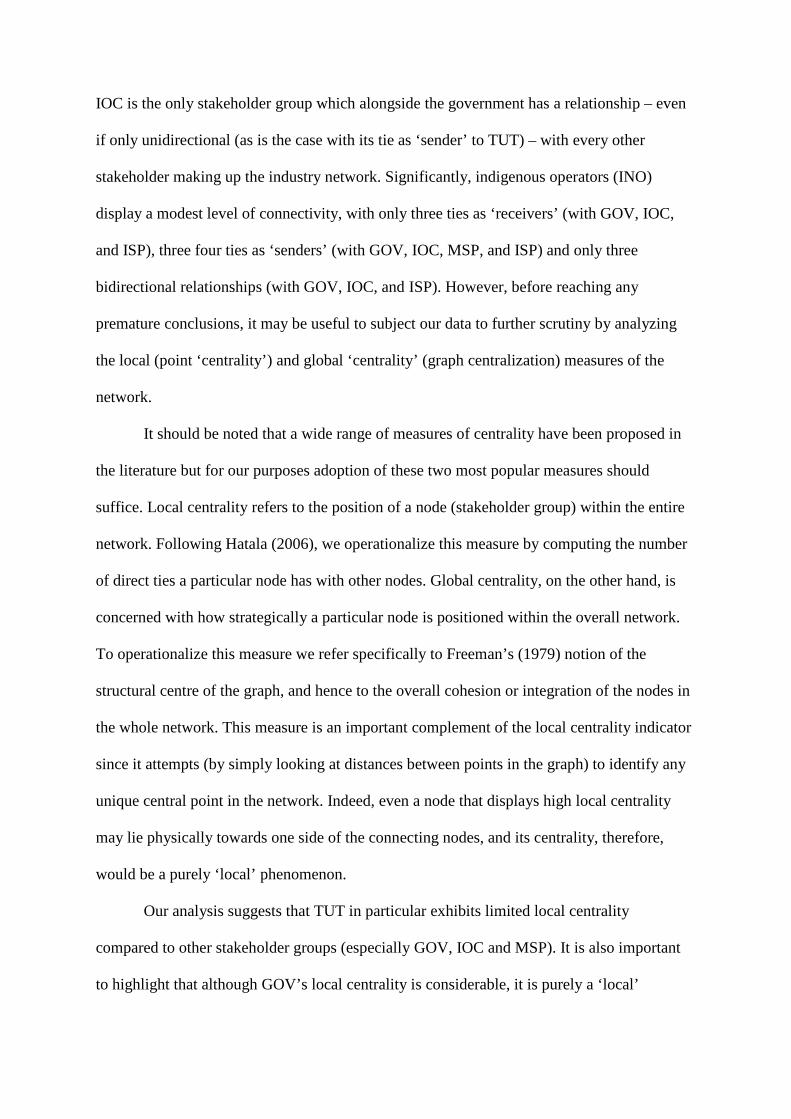
IOC is the only stakeholder group which alongside the government has a relationship – even
if only unidirectional (as is the case with its tie as ‘sender’ to TUT) – with every other
stakeholder making up the industry network. Significantly, indigenous operators (INO)
display a modest level of connectivity, with only three ties as ‘receivers’ (with GOV, IOC,
and ISP), three four ties as ‘senders’ (with GOV, IOC, MSP, and ISP) and only three
bidirectional relationships (with GOV, IOC, and ISP). However, before reaching any
premature conclusions, it may be useful to subject our data to further scrutiny by analyzing
the local (point ‘centrality’) and global ‘centrality’ (graph centralization) measures of the
network.
It should be noted that a wide range of measures of centrality have been proposed in
the literature but for our purposes adoption of these two most popular measures should
suffice. Local centrality refers to the position of a node (stakeholder group) within the entire
network. Following Hatala (2006), we operationalize this measure by computing the number
of direct ties a particular node has with other nodes. Global centrality, on the other hand, is
concerned with how strategically a particular node is positioned within the overall network.
To operationalize this measure we refer specifically to Freeman’s (1979) notion of the
structural centre of the graph, and hence to the overall cohesion or integration of the nodes in
the whole network. This measure is an important complement of the local centrality indicator
since it attempts (by simply looking at distances between points in the graph) to identify any
unique central point in the network. Indeed, even a node that displays high local centrality
may lie physically towards one side of the connecting nodes, and its centrality, therefore,
would be a purely ‘local’ phenomenon.
Our analysis suggests that TUT in particular exhibits limited local centrality
compared to other stakeholder groups (especially GOV, IOC and MSP). It is also important
to highlight that although GOV’s local centrality is considerable, it is purely a ‘local’

phenomenon since the GOV node is located at the margin of the network illustrated in Figure
4 and, after TUT, it is the node displaying the lowest degree of ‘global centrality’, being
placed at the greatest distance from the other nodes (stakeholder groups) that make up the
network. According to the sociogram depicted in Figure 4 – it is IOC that stands out as the
stakeholder group exhibiting global centrality within the network given its ‘central’ position
of considerable strategic significance in the overall structure. As such, it is reasonable to
conclude that IOCs play a pivotal role as far as oil and gas activities are concerned,
irrespective of the exploration and production (E&P) arrangement (JOA and PSCs) they have
with the Nigerian government and the Nigerian National Petroleum Corporation (NNPC). It
is also striking that the government itself (the regulators) does not exhibit global centrality, as
should be expected given their institutional responsibilities in driving the LCD policy.
Instead, IOCs still appear to play such a central role. Effectively, all the main activities in the
upstream (E&P) - which determine midstream and downstream activities - are still primarily
under the steering control of IOCs.
Another way of measuring how close network members are to the ‘centre of the
action’ in the network (industry), is the determination of ‘betweenness’ of a node, simply
measured by computing the number of times a node (stakeholder group) lies between each
other pair of nodes who lack a direct connection. Scott (2000: 86) defines betweenness as ‘the
extent to which an agent can play the part of a “broker” or “gatekeeper” with a potential for
control over others’. Figure 4 indicates that, alongside GOV, IOCs play such part, acting de
facto as the intermediary between other stakeholder groups in the network (e.g. ISP < > IOC
> TUT; INO < > IOC < EPC), most significantly, between INO (indigenous operators) and
EPC (engineering, procurement and commissioning contractors and fabricators). This
measure, which corroborates the global centrality results, additionally suggests that

indigenous operators are dependent on the IOCs for carrying out industry activities, and
perhaps even for their survival.
These disconcerting findings are also backed up by Freeman’s (1979) approach to
‘betweenness’ that is built around the concept of ‘local dependency’, according to which a
node in a network is dependent upon another if the paths which connect it to other nodes pass
through it (Scott, 2000). This is shown clearly in Figure 4, where IOCs appear to be the
middle node, with several points intersecting this stakeholder group to connect to other
nodes. Our analyses of centrality and betweenness, therefore, show that IOCs play a pivotal
role in the industry and, invariably, without this stakeholder group, oil and gas activities at
midstream and downstream level could not take place.
Our analysis of the level of ‘connectivity’ within the network concludes with the
computation of the ‘network density index’ (Hatala, 2006: 56) using the formula {L / [n(n-1)
/ 2]}, where L represents the number of lines (ties) and n the number of nodes present within
the network. The value of the density ranges from 0 to 1, where 1 depicts a situation whereby
100% of network members have formed direct relationships with all other members. As noted
by Mandarano (2009), the density index can be used as an indicator of the community’s
social capital, which Mandarano defines as an important outcome of collaborative planning
and ‘a precursor to collaborative planning success’ (Mandarano, 2009: 245). For
dichotomization 1, we obtained a density of 0.43. In other words, the actual number of ties
present within the network is 43% of the potential number of possible ties. For
dichotomization 2, a density of 0.76 was obtained. From these two values, a mean density of
59.5% can be determined. We agree with Mandarano (2009) who suggests that different
network types have different densities. Hence de-contextualized comparisons can be
misleading. Being the present SNA the first carried out in the context of LCD, we are,
unfortunately, unable to benchmark our density index against that obtained in comparable

studies in a similar setting. However, in this context, a mean density just short of 60% would
seem to indicate a highly inadequate level of connectivity to generate the kind of shared
information, collaborative efforts and consensus building required for network participants to
act effectively in pursuing LCD objectives. Hence, much work still needs to be done by
stakeholders to ensure a shared and interrelated modus operandi that would aid and hence
facilitate the achievement of the LCD policy objectives.
Concluding discussion
This paper aimed at identifying the key industry ‘players’ in the Nigeria oil and gas industry,
and the existing process of interaction among them. The findings of our stakeholder analysis
unveil a wider array of actors besides those typically identified in relevant literature
(government and operators). However, in spite of considerable interest and involvement in
the activities of the Nigerian oil and gas industry, most of these additional stakeholders are
found to exert a limited influence, having no real power to instigate the much needed change.
Our investigation of the relational structure that exists among the stakeholders also
highlights that in spite of the existence of some relationships among key industry players, a
significant percentage of these relationships are unidirectional. Bidirectional relationships
found were mostly between the government on one side, and international operating
companies and multinational service providers on the other.
Another significant finding is the marginal role played by HE institutions, as
evidenced, for example, by the minimal level of local ‘centrality’ displayed by this
stakeholder group vis-à-vis others. This is particularly striking when it is acknowledged that
HE institutions are responsible for providing the knowledge base to fuel the development of
in-country capacity and competence-based capabilities.

Significantly, our data showed that it is IOCs rather than indigenous operators that
exhibit global centrality within the network, suggesting that in spite of the ratification of the
NOGIC Act (2010), this stakeholder group still pivotally determines the activities of the
Nigerian oil and gas industry. Our analysis of ‘betweenness’ further revealed that other
stakeholders, including indigenous companies, are dependent on the IOCs for their survival in
the industry.
So, what implications and recommendations can be drawn from our findings to
increase the efficacy of the LCD policy? First and foremost, our analysis underscores that the
achievement of the LCD policy objectives is a collective responsibility, with each stakeholder
group’s contribution being singularly necessary but individually insufficient for the
operational efficiency of the network. Computation of the mean density index of the network
revealed a very modest level of connectivity, thus underscoring that considerable effort is still
required by all stakeholder groups to strengthen their ties, and forge new ones.
Notwithstanding the above, the coordination and facilitation of the collaboration
needed for LCD to come to fruition is evidently the main responsibility of the regulators, i.e.
the government. Yet the inability of the government to ensure that indigenous oil companies
alongside local oil and gas service providers exhibit global centrality in the industry network
is a major weakness, particularly when it is acknowledged that this role is currently still being
played by the very stakeholder group that is meant to benefit the least from the successful
achievement of LCD, i.e. IOCs.
Our findings contribute to a more in-depth analysis of the Nigerian oil and gas
industry and, contextually, provide a valuable first step towards a more comprehensive
framework for the appraisal of the efficacy of the Nigerian LCD policy. Indeed, consistent
with a much overdue shift towards a polycentric understanding of policy making and
assessment, our novel application of stakeholder analysis to Nigerian LCD can be seen as an

essential blueprint for any policy analysis aimed at establishing its effectiveness.
By way of acknowledgement of limitations, some caveats should be borne in mind.
First, within the confines of a journal article we had by necessity to be selective in both the
range of analytical tools used to examine our data, and our treatment of issues. For example,
empirical tractability demanded limiting the adoption of the centrality indicator with
reference to the two most important and relevant measure of centrality in SNA (local and
global centrality). However, future studies could employ additional centrality indicators
(eigenvector centrality, beta centrality, etc.), alongside further quantitative analyses to
accompany the visual representation of the network, in order to draw a wider range of
statistical inferences. Future studies could also extend our coverage of the issues by
considering, for example, the political economy connotations of the ‘resource-curse’
dichotomy that the wealth of Nigerian oil and gas resources represent, and the way in which
such connotations interact with the well documented legacy of corruption that ‘affects and is
affected by’ the intricate power networks not only across industry sectors that are part of the
network but also within societal structures. Second, replication studies across countries,
including countries at different stages of both socio-economic development and LCD, would
offer a profitable extension, both for comparative purposes and to aid the development of the
policy application of stakeholder analysis to different contextual settings.
References
Ackermann F and Eden C (2011) Making Strategy: Mapping Out Strategic Success.
London: Sage.
Ameh MO (2006) The Shift from Joint Operating Agreements to Production Sharing
Contracts in the Nigerian Oil Industry: Any Benefits for the Players? Centre for
Energy, Petroleum and Mineral Law and Policy, 1–15.

Ayodele OR and Frimpong S (2003) Economics of Nigerian Marginal Oil Fields SPE
Hydrocarbon Economics and Evaluation Symposium. Dallas: Texas Society of
Petroleum Engineers.
Bailur S (2006) Using stakeholder theory to analyze telecenter projects. Information
Technologies and International Development 3(3): 61–80.
Bakare AS (2011) Local content policy in oil sector and the capacity utilization in
Nigerian manufacturing industry. Business and Management Review 1(6): 82–92.
Borgatti S, Everett M and Johnson J (2013) Analyzing Social Networks. London: Sage.
Bryson JM (1995) Strategic Planning for Public and Non-Profit Organizations. San
Francisco, CA: Jossey-Bass.
Bryson JM (2004) What to do when stakeholders matter. Stakeholder Identification
and analysis techniques. Public Management Review 6(1): 21–53.
Cartwright D and Harary F (1956) Structural balance: a generalization of Heider's theory.
Psychological Review 63(5): 277–293.
Clarkson M (1995) Stakeholder framework for analyzing and evaluating corporate social
performance. Academy of Management Review 20(1): 92–117.
Cummings JL and Doh JP (2000) Identifying who matters: mapping key players in multiple
environments. California Management Review 42(2): 83–104.
Donaldson T and Preston LE (1995) The stakeholder theory of the corporation: concepts,
evidence and implications. Academy of Management Review 20(1): 65–91.
Emole CE (1996) The petroleum (Amendment) decree of Nigeria. Journal of African Law
41(2): 239–245.
Freeman LC (1979) Centrality in social networks: conceptual clarification. Social Networks
1(3): 215–239.
Freeman ER (1984) Strategic Management: A Stakeholder Approach. Boston: Pitman.

Freeman ER and Reed DL (1983) Stockholders and stakeholders: a new perspective in
corporate governance. California Management Review 25(3): 88–106.
Friedman AL and Miles S (2002) Developing stakeholder theory. Journal of Management
Studies 39(1): 1–21.
Hatala J-P (2006) Social network analysis in human resource development: a new
methodology. Human Resource Development Review 5(1): 45–71.
Heum P (2008) Local content development: experiences from oil and gas activities in
Norway. SNF Working Paper 02/08SNF. Project 1285, 1–21.
Heum P, Quale C, Karlsen JE, Kragha M and Osahon G (2003) Enhancement of local
content in the upstream oil and gas industry in Nigeria: a comprehensive and
viable policy approach. Joint Study by SNF Institute for Research in Economics
and Business Administration. Bergen, Norway SNF Report No. 25/03 (August).
Ihua UB (2010) Local content policy and SMEs sector promotion: the Nigerian oil industry
experience. International Journal of Business and Management 5(5): 1-11.
Ihua UB, Olabowale OA, Eloji KN and Ajayi C (2011) Entrepreneurial implications
of Nigeria’s oil industry local content policy perceptions from the Niger Delta region.
Journal of Enterprising Communities 5(3): 223–241.
Mandarano LA (2009) Social network analysis of social capital in collaborative planning.
Society & Natural Resources 22(3): 245–260.
Miles S (2012) Stakeholder: essentially contested or just confused? Journal of Business
Ethics 108(3): 285–298.
Mitchell R, Agle B and Wood D (1997) Towards a theory of stakeholder identification and
salience: defining the principle of who and what really counts. Academy of
Management Review 22(4): 853–886.
Moreno JL (1934) Who Shall Survive? Washington, DC: Nervous and Mental Disease

Publishing Co.
NOGIC Act (2010) Nigeria Oil and Gas Industry Content Bill. Explanatory Memorandum
1-33.
Omenikolo IA and Amadi RO (2010) Challenges facing Nigerian local content in oil
and gas industry. Continental Journal of Renewable Energy 1: 15–20.
Petroleum Act (1990) Laws of the Federation of Nigeria. Chapter 10 (350 LFN 1990).
Petroleum Training Institute (2011) Vision and Mission Statement. Available at:
http://ptinigeria.org/
Phillips R (2003) Stakeholder Theory and Organizational Ethics. San Francisco: Berrett-
Koehler Publishers.
Reed MS, Graves A, Dandy N, Posthumus H, Hubacek K, Morris J, Prell C, Quinn CH and
Stringer LC (2009) Who’s in and why? A typology of stakeholder analysis methods
for natural resource management. Journal of Environmental Management 90(5):
1933–1949.
Scott J (2000) Social Network Analysis: A Handbook. London: Sage.
Serrat O (2009) Social Network Analysis. Washington, DC: Asian Development Bank.

Rationale
Typology
Methods
Figure 1. Framework for stakeholder analysis of Nigerian LCD policy
Source: Framework adapted by the authors from the blueprints developed by Reed et al.
(2009: 1936) and Bailur (2006: 69–73).
(i) Identification and categorization of stakeholders (ii) Analysis of stakeholders’ relationships
(i) Documentation and interview data (ii) Analytical power-interest categorization (iii) Social network Analysis (SNA)
Descriptive, instrumental and normative

Interest
Figure 2. Application of Ackermann and Eden’s (2011) power-interest framework
SUBJECTS
Local resident pressure
groups; Financial sector;
Legal sector.
PLAYERS International oil companies (IOC); Indigenous operators (INO); 1st tier (multinational) providers (MSP); 2nd tier (indigenous) providers (ISP); Engineering, procurement and commissioning contractors & fabricators (EPC); HE institutions (TUT); Federal Government (GOV)
CROWD
Journalists
LEADERS OR CONTEXT-SETTERS
Independent marketers; Independent refiners; Pipeline companies; Trade unions.
Power

Figure 3. Sociogram of industry network (from dichotomization 1)
Source: Authors’ interview data.
Notes: In the absence of a relationship, no line appears (e.g. TUT-; GOV-ISP; IOC-ISP; IOC-INO;
INO-EPC; INO-MSP). If the relationship is unidirectional, the line has only one arrowhead pointing
to the ‘receiver’ in the relationship (e.g. INO > GOV; EPC > IOC; EPC > ISP). If the relationship is
bidirectional, the line has arrowheads at both ends (e.g. GOV < > MSP; EPC < >MSP; MSP < > ISP).

Figure 4. Sociogram of industry network (from dichotomization 2) Source: Authors’ interview data.
Notes: In the absence of a relationship, no line appears (e.g., ISP-TUT; INO-EPC; TUT-EPC). If the
relationship is unidirectional, the line has only one arrowhead pointing to the ‘receiver’ in the
relationship (e.g., INO > MSP; IOC > EPC). If the relationship is bidirectional, the line has
arrowheads at both ends (e.g., ISP < > GOV; INO < > IOC; ISP < > MSP; INO < > GOV).

Table 1. Identification of and differentiation between stakeholders Stakeholder Responsibilities to oil & gas industry Involvement
and power in influencing LCD
Level of power on employment
Level of influence on emerging local firms
Level of interest
Remarks Overall assessment
International operating companies
(i) Ensuring Nigerians are given first consideration for employment & training (NOGIC Act, 2010, Section 10.1.b); (ii) Developing indigenous capacity in compliance with the Act by employing Nigerian nationals (ibid, Section 11.3); (iii) Submitting a Nigerian Content Plan to the Board setting out how they will give first consideration to Nigerian goods & services (ibid, Section 12); (iv) Developing indigenous firms through partnerships and JVs (ibid, Section 13); (v) Providing the Board with Employment & Training Plan for every project to be undertaken and declaration of expatriate quota (ibid, Sections 29-34); (vi) Employment of Nigerians in junior and intermediate cadres (ibid, Section 35); (vii) Submission of R&D plan and R&D reports to the Board (ibid, Sections 38 & 39).
Direct Strong Strong Strong IOCs are critical to the industry because they are involved in exploration and production of crude oil and other major activities. They have a strong influence on employment and on emerging entrepreneurs.
Player
Indigenous operators
(i) Development of manpower and equipment to globally competitive standards through JVs with IOCs and MSPs (NOGIC Act, 2010, Sections 13 & 15); (ii) Providing all fabrication and welding activities (ibid, Section 53).
Direct Strong Medium Strong INOs are important since they are involved in exploration and production of oil, and because of their recruitment potential (though they have less influence on the development of entrepreneurs than IOCs).
Player
Multinational oil and gas service companies (1st tier suppliers)
1st tier, multinational suppliers (MSPs) offer procurement and other technical services to operators.
Direct
Strong Medium Strong MSPs are a significant stakeholder since they provide services ranging from technical procurement to supplies. Hence, they have a direct involvement. Oil & gas services are provided to the operators by the service companies and as such, they require more labor than the operators to execute contract projects. In view of this, their level of interest is deemed high.
Player
Indigenous oil and gas service
2nd tier, indigenous suppliers (ISPs) offer procurement and other technical services to operators.
Direct
Strong Medium Strong ISPs also bear strong relevance because they provide similar services to 1st tier suppliers. 1st tier suppliers also subcontract services to them. In as much as 2nd
Player

companies (2nd tier suppliers)
tier suppliers may offer fewer services than 1st tier suppliers, they are also deemed to have strong influence on employment.
Financial sector
(i) Providing advice on appropriate framework and tax incentives for all oil & gas companies (NOGIC Act, 2010, Section 48); (ii) Insuring all oil & gas and other related businesses, and handling their financial services (ibid, Sections 49, 50 & 52).
Indirect Weak Medium Medium Compared to operators and service companies, they do not bear as much importance. However, the Act mandates that all financial activities within the sector be carried out in-country but with the waiver window being given to operators and service companies (not yet being fully complied with). The financial sector is deemed to have indirect involvement in the industry since it services a wide range of industries. Their influence on employment is limited. However, more attention is currently being paid to loan awards for entrepreneurs within the oil industry. Because of this, we consider their level of interest and influence on employment as medium.
Subjects
Legal sector Handling all legal services within the industry (NOGIC Act, 2010, Section 51).
Indirect Weak Medium Medium The legal sector is yet to be strengthened after the expiration of the waiver window which mandates the domiciliation of all legal services. Although this group is more involved than the financial sector, its level of industry engagement is still not as strong as that of operators. Legal firms do not have currently a strong stake in terms of employment within the industry. Nevertheless, their influence on the industry as well as interest is deemed as moderate.
Subjects
Engineering, procurement and commissioning contractors & fabricators
(i) Fabrication of oil & gas equipment (pipelines, drill bits, etc.) in line with operators and service company requirements; (ii) Providing all fabrication and welding activities.
Direct Strong Medium Strong The NOGIC Act (2010) seeks to improve domestication of activities and domiciliation. Hence EPCs are highly relevant for the manufacturing of oil & gas equipment required by operators, service providers, etc. With the ratification of the Act, new fabrication yards have been established and old ones revamped. Fabricators have a direct link with the industry, a strong influence on employment, and a strong level of interest.
Player
Local resident pressure groups
These include: Movement for the Emancipation of the Niger Delta; Militant Ijaw Youths; and Movement for the Survival of Ogoni People. They claim to fight for their community and ethnic
Indirect Medium Weak Strong This stakeholder group has indirect involvement, in spite of their community element. However, their power cannot be underestimated especially when they agitate for welfare support. This group can only
Subjects

rights, and to protect their environment. influence employment by exerting pressure on operators and service companies. However, they do not have direct influence on entrepreneurial development. They have a strong interest since the largest deposit of crude oil is found within their community.
HE institutions
(i) Providing knowledge and skills; (ii) Training manpower; (iii) Keeping up-to-date with industry developments so as to ensure the ‘currency’ of the HE curriculum.
Indirect Strong Medium Medium Although HE institutions (TUT) may not have a direct involvement they are expected to play a major role on employment since they should supply industry with an educated and skilled workforce and by this they are considered to have a strong influence.
Player
Federal Government
(i) Monitoring, coordinating and implementing the Act provisions via the Nigerian Content Development Monitoring Board (NCDMB) and other parastatals (NOGIC Act, 2010, Section 4); (ii) Protection of domestic industries (ibid, Section 3.2); (iii) Setting targets for LCD and growth of R&D (ibid, Section 36); (iv) Setting up the NCCF to provide a platform for industry collaboration (ibid, Section 57); (v) Regular assessment of LCD performance (ibid, Section 62).
Direct Strong Strong Strong The government (GOV) is the regulators of the oil & gas industry and, as such, it is directly involved. It also regulates employment within the industry whilst enforcing compliance of the LCD policy. Undoubtedly, the government has a strong interest because the oil & gas industry constitutes its main source of revenues.
Player
Independent marketers
Purchasing and selling of refined products. Indirect Medium Medium Medium This group is solely involved in downstream activities hence their level of involvement is minimal.
Context setters
Independent refiners
Purchasing and processing of crude oil. Indirect Medium Medium Medium This group is solely involved in downstream activities hence its level of involvement is minimal.
Context setters
Pipeline companies
Transporting crude oil, refined products, natural gas and liquids.
Indirect Medium Medium Medium Pipeline companies perform mainly downstream activities hence their involvement upstream is minimal.
Context setters
Journalists Reporting on industry activities. Indirect Weak Weak Medium The media appears to play a marginal role. Crowd Trade Unions Protecting employees’ rights in the workplace. Direct Medium Medium Medium Although they are directly involved, Unions’
jurisdiction is limited to upholding employees’ rights. Context setters
Source: Authors’ findings based upon scrutiny of NOGIC Act (2010) and field survey (interviews).

37
Table 2. Matrix of ‘valued’ data
Receivers → Senders ↓
GOV IOC INO MSP ISP EPC TUT
GOV 4 3 4 3 3 2 IOC 5 3 4 3 2 3 INO 4 3 3 4 2 1 MSP 4 5 2 4 4 3 ISP 3 3 4 4 3 2 EPC 4 4 2 4 4 2 TUT 3 1 1 2 2 1
Note: Acronyms refer to Government (GOV), International Operating Companies (IOC), Indigenous Operators (INO), Multinational Companies (MSP), Indigenous Oil & Gas Service Providers (ISP), Engineering, Procurement & Commissioning Contractors (EPC), and HE Engineering & Geo-science Tutors (TUT). The numbers in Table 2 report the average rating of the strength of each possible relationship among stakeholders in the network on a scale from 1 (very weak) to 5 (very strong), in terms of both ‘receivers’ and ‘senders’ of the content of the exchange pertaining to the identified relationships.
Table 3. Matrix of ‘dichotomization 1’ data
Receivers → Senders ↓
GOV IOC INO MSP ISP EPC TUT
GOV 1 0 1 0 0 0 IOC 1 0 1 0 0 0 INO 1 0 0 1 0 0 MSP 1 1 0 1 1 0 ISP 0 0 1 1 0 0 EPC 1 1 0 1 1 0 TUT 0 0 0 0 0 0
Note: Acronyms refer to Government (GOV), International Operating Companies (IOC), Indigenous Operators (INO), Multinational Companies (MSP), Indigenous Oil & Gas Service Providers (ISP), Engineering, Procurement & Commissioning Contractors (EPC), and HE Engineering & Geo-science Tutors (TUT). The numbers in Table 3 are ‘dichotomization 1’, binary data transformations. ‘0’ denotes ‘no relationship’ whilst ‘1’ denotes the ‘existence of a working relationship’. Numbers ordered by column record the existence or otherwise of a relationship by stakeholders as ‘receivers’, whilst numbers ordered by rows pertain to stakeholders as ‘senders’ of the content of the exchange pertaining to the identified relationships.

38
Table 4. Matrix of ‘dichotomization 2’ data
Receivers → Senders ↓
GOV IOC INO MSP ISP EPC TUT
GOV 1 1 1 1 1 0 IOC 1 1 1 1 0 1 INO 1 1 1 1 0 0 MSP 1 1 0 1 1 1 ISP 1 1 1 1 1 0 EPC 1 1 0 1 1 0 TUT 1 0 0 0 0 0
Note: Acronyms refer to Government (GOV), International Operating Companies (IOC), Indigenous Operators (INO), Multinational Companies (MSP), Indigenous Oil & Gas Service Providers (ISP), Engineering, Procurement & Commissioning Contractors (EPC), and HE Engineering & Geo-science Tutors (TUT). The numbers in Table 3 are ‘dichotomization 2’, binary data transformations. ‘0’ denotes ‘no relationship’ whilst ‘1’ denotes the ‘existence of a working relationship’. Numbers ordered by column record the existence or otherwise of a relationship by stakeholders as ‘receivers’, whilst numbers ordered by rows pertain to stakeholders as ‘senders’ of the content of the exchange pertaining to the identified relationships.