Embed Size (px)
Citation preview
1
Nigro-Thalamic Projection Controls Timing of Action Initiation
Julien Catanese and Dieter Jaeger.
Department of Biology, Emory University, Atlanta, GA, USA.
SUMMARY
The nigro-thalamic pathway is one of the main outputs from the basal ganglia and
provides a critical link in the brain circuitry involved in motor decision making and
movement planning. However, the detailed function of this pathway remains unclear, and
it could be involved in selecting specific action plans, and/or control the timing of action
initiation.
Using a combination of in vivo electrophysiological recordings from motor thalamic
neurons and optogenetic activation of nigral inputs, we determined that this pathway is
primarily involved in the proper timing of the release of goal directed actions.
author/funder. All rights reserved. No reuse allowed without permission. The copyright holder for this preprint (which was not peer-reviewed) is the. https://doi.org/10.1101/2020.01.12.903500doi: bioRxiv preprint
2
INTRODUCTION
The basal ganglia (BG) have been implicated in action selection (Donahue and Kreitzer,
2015; Mink, 1996), motor learning (Graybiel, 2008), in the control of movement vigor
(Turner and Desmurget, 2010), and timing of movement initiation (Buhusi and Meck,
2005). The classic conceptual model of basal ganglia circuitry posits that these functions
are conveyed through a cortico-basal ganglia thalamocortical loop (Alexander and
Crutcher, 1990). A critical link in the classic loop pathway is the motor thalamus, where
in the rodent, inhibitory BG output from the Substantia nigra reticulata (SNr) and
entopeduncular nucleus (EP) converges onto ventromedial (VM) and ventro-antero-
lateral (VAL) thalamic nuclei (Guo et al., 2018; Sakai et al., 1998). GABAergic basal
ganglia neurons have high tonic firing rates in vivo (Delong, 1971; Lobb and Jaeger, 2015;
Ruskin et al., 2002), resulting in tonic thalamic inhibition through powerful GABA-A
synapses (Bodor et al., 2008). Therefore, the motor thalamus is a key structure at the
cross road between the BG-thalamo-cortical (Bosch-Bouju et al., 2013) and cortico-
thalamic loops (Guo et al., 2017; Theyel et al., 2010).
Recent studies in mice show that the VM thalamic nucleus forms a closed loop with
anterolateral premotor cortex (ALM) and that this loop is required for persistent activation
of neural activity related to movement preparation and decision making during the delay
period of a cued left/right lick task (Guo et al., 2017). However, the processes by which
the basal ganglia interact with this cortico-thalamic motor planning loop and may influence
specific aspects of decision making remain unknown.
To address this important question on how the basal ganglia may influence thalamo-
cortical processing, we recorded neural activity in VM/VAL with 4-shank silicon probes,
while optogenetically activating BG terminals in this structure during distinct periods of
task performance. In order to build on previous work, we adopted a version of the delayed
left/right lick task used previously to discern thalamo-cortical dynamics in decision making
and movement initiation (Guo et al., 2014a, 2017). We found that stimulating BG GABA
release in VM/VAL just before the GO signal at the nigro-thalamic synapse lead to a
decrease in impulsive licks (defined as premature action resulting in task failure) as well
as an increase in the amount of omissions (defined as licking too late or not at all).
Detailed analysis of neuronal activity revealed that the optogenetic stimulation produced
spike rate changes in VM thalamus that were very similar to the signature of
spontaneously occurring omission trials. These results indicate that this specific pathway
controls the timing of action initiation and action release.
author/funder. All rights reserved. No reuse allowed without permission. The copyright holder for this preprint (which was not peer-reviewed) is the. https://doi.org/10.1101/2020.01.12.903500doi: bioRxiv preprint
3
RESULTS
Optogenetically targeting a specific nigro-thalamic pathway
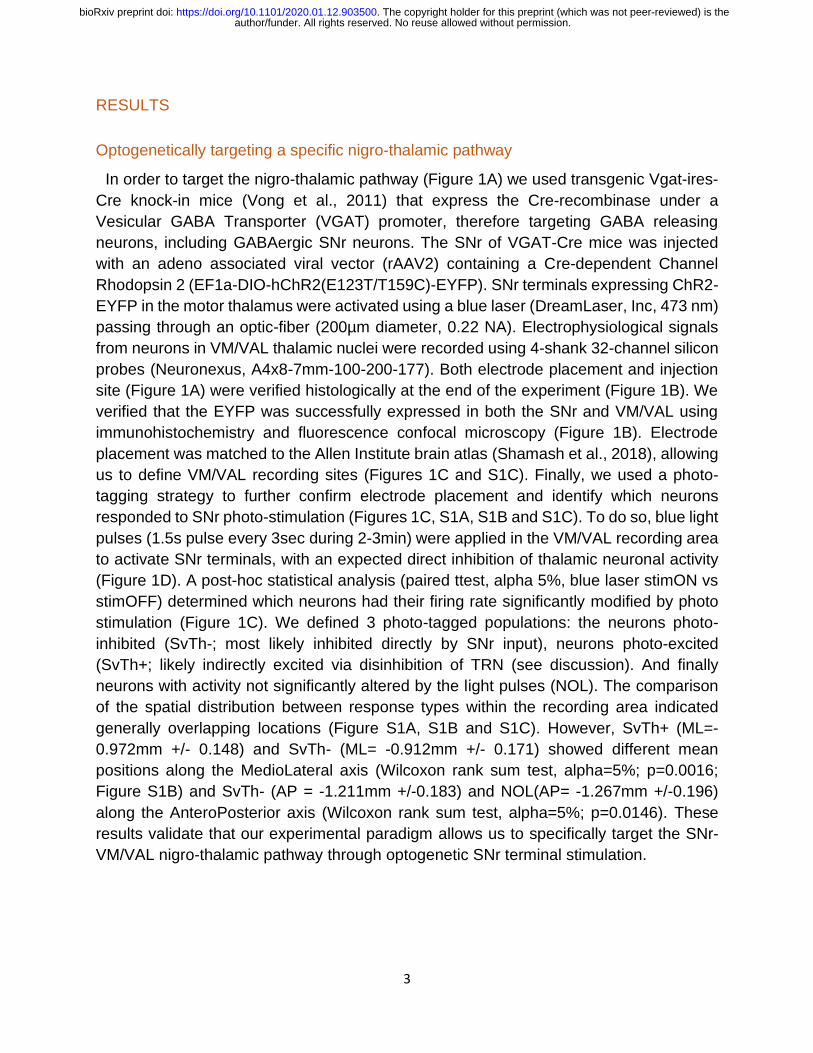
In order to target the nigro-thalamic pathway (Figure 1A) we used transgenic Vgat-ires-
Cre knock-in mice (Vong et al., 2011) that express the Cre-recombinase under a
Vesicular GABA Transporter (VGAT) promoter, therefore targeting GABA releasing
neurons, including GABAergic SNr neurons. The SNr of VGAT-Cre mice was injected
with an adeno associated viral vector (rAAV2) containing a Cre-dependent Channel
Rhodopsin 2 (EF1a-DIO-hChR2(E123T/T159C)-EYFP). SNr terminals expressing ChR2-
EYFP in the motor thalamus were activated using a blue laser (DreamLaser, Inc, 473 nm)
passing through an optic-fiber (200µm diameter, 0.22 NA). Electrophysiological signals
from neurons in VM/VAL thalamic nuclei were recorded using 4-shank 32-channel silicon
probes (Neuronexus, A4x8-7mm-100-200-177). Both electrode placement and injection
site (Figure 1A) were verified histologically at the end of the experiment (Figure 1B). We
verified that the EYFP was successfully expressed in both the SNr and VM/VAL using
immunohistochemistry and fluorescence confocal microscopy (Figure 1B). Electrode
placement was matched to the Allen Institute brain atlas (Shamash et al., 2018), allowing
us to define VM/VAL recording sites (Figures 1C and S1C). Finally, we used a photo-
tagging strategy to further confirm electrode placement and identify which neurons
responded to SNr photo-stimulation (Figures 1C, S1A, S1B and S1C). To do so, blue light
pulses (1.5s pulse every 3sec during 2-3min) were applied in the VM/VAL recording area
to activate SNr terminals, with an expected direct inhibition of thalamic neuronal activity
(Figure 1D). A post-hoc statistical analysis (paired ttest, alpha 5%, blue laser stimON vs
stimOFF) determined which neurons had their firing rate significantly modified by photo
stimulation (Figure 1C). We defined 3 photo-tagged populations: the neurons photo-
inhibited (SvTh-; most likely inhibited directly by SNr input), neurons photo-excited
(SvTh+; likely indirectly excited via disinhibition of TRN (see discussion). And finally
neurons with activity not significantly altered by the light pulses (NOL). The comparison
of the spatial distribution between response types within the recording area indicated
generally overlapping locations (Figure S1A, S1B and S1C). However, SvTh+ (ML=-
0.972mm +/- 0.148) and SvTh- (ML= -0.912mm +/- 0.171) showed different mean
positions along the MedioLateral axis (Wilcoxon rank sum test, alpha=5%; p=0.0016;
Figure S1B) and SvTh- (AP = -1.211mm +/-0.183) and NOL(AP= -1.267mm +/-0.196)
along the AnteroPosterior axis (Wilcoxon rank sum test, alpha=5%; p=0.0146). These
results validate that our experimental paradigm allows us to specifically target the SNr-
VM/VAL nigro-thalamic pathway through optogenetic SNr terminal stimulation.
author/funder. All rights reserved. No reuse allowed without permission. The copyright holder for this preprint (which was not peer-reviewed) is the. https://doi.org/10.1101/2020.01.12.903500doi: bioRxiv preprint
4
Figure 1. An experimental design combining electrophysiology and optogenetic to
target a specific nigro-thalamic pathway. A. Schematic of the experimental paradigm. Slc32a transgenic mice were injected with AAV-DIO-ChR2-
EYFP in the SNr to express ChR2. Single unit activity in VM and VAL thalamus was recorded using silicon
probes. SNr terminals were optogenetically activated by illumination with blue light through an optic fiber
attached to the silicon probe. Neurons were recorded in head-fixed mice performing a cued left/right licking
task.
B. Histology was performed to locate the position of the electrodes (top row) and injection sites (bottom
row). Nissl staining (left column), immunohistochemistry with anti-GFP revealed with horserasdish
peroxidase (middle column), and confocal mucroscopy (right column). Notice in those representative
examples that the fluorescence (green) indicate that GFP was expressed in the soma of SNr neurons
(bottom right pannel) but not in the soma of VM neurons, as GFP in the VM area was only expressed in
GABAergic SNr terminals (top right pannel). Scale bars: black = 2mm; white = 20µm.
C. Example of electrode track reconstruction in VM (red area) and VAL (blue area). Channels excluded for
analysis (black dots), analysed VAL channels (purple dots) analysed VM channels (green dots), channels
with optogentically responsive cells (yellow rings).
D. Example of a channel in VM for which the photo-stimulation (blue 473 nm laser, 10mW, 1.5 sec ON,
then 1.5 sec OFF) significantly reduced the multi-unit activity recorded in-vivo (Wilcoxon test; P<0.00001).
author/funder. All rights reserved. No reuse allowed without permission. The copyright holder for this preprint (which was not peer-reviewed) is the. https://doi.org/10.1101/2020.01.12.903500doi: bioRxiv preprint
5
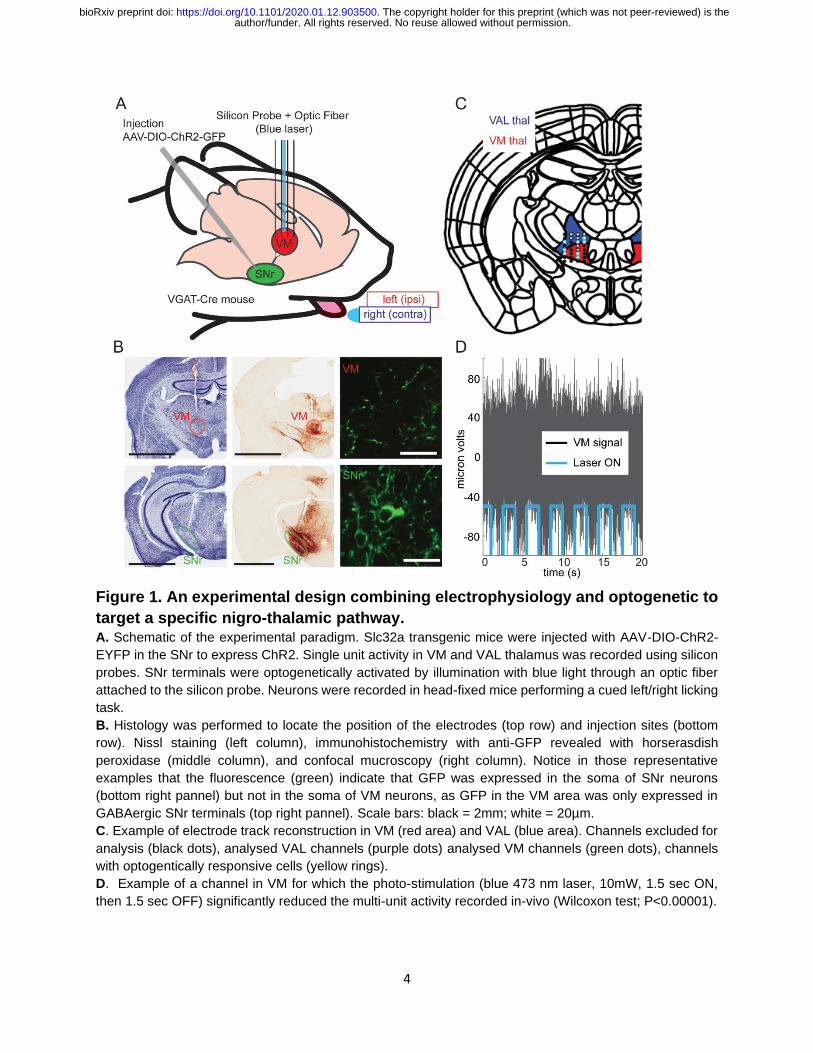
Impulsive and omission trials remain after successful learning of a bi-directional delayed
licking decision task.
In order to better understand the role of the nigro-thalamic pathway in decision making,
we used a licking task in which mice had to make a binary choice based on a sensorial
discrimination and with a delay separating perception and action. Similar tasks have been
used and validated by previous studies in head fixed mice (Guo et al., 2014ab, 2017; Li
et al., 2015). In our version of the task (Figure 2A), the mice received a mild air puff
(750ms) on left or right whiskers and withheld their response during the delay period
(750ms). A sound Go-cue indicated the end of the delay and the start of the response
period (1500ms). During the response period the mouse had to indicate that they
remembered the side of the previous air-puff stimulation by licking into the lick-port
located on the same side. A water reward was obtained, only if the first lick was to the
correct side and not later than 1.5 seconds after the Go cue. An inter-trial-interval (ITI) of
a minimum of 3 seconds was given between trials and the next trial started only after the
mice stopped licking for 2 seconds (Figure 2A). The mice could succeed (correct trials,
‘cor’) or commit 3 types of errors (Figure 2B), lick too early (impulsive trials, ‘imp’), lick too
late (omission trials, ‘omi’), or lick on the wrong side (error side trials, ‘eSi’). Five mice
were successfully trained for 6-7 weeks for an average of 25+/-3 40 minute sessions, until
they reached a 70% criterion performance for licking the correct side. After training, the
mice were licking the correct side first in 87% of trials (Figure 2C, one sample ttest, n=5,
P=0.009). During the combined recording sessions across mice, only 13% +/-10% of side
errors sides were observed across 2060 trials, with an average of 137+/-40 trials per
session, a total of 15 recording sessions, 3+/-2 sessions per mouse (mean +/- SD; Figure
2C, top panel). Importantly, omission and impulsive trials did not vanish after training, and
were significantly different from zero (one sample ttest, n=5, Pimp = 0.044 and Pomi = 0.023;
Figure 2C, bottom panel). The proportion of these impulsive and omissive trials gave us
an important window on assessing the timing of lick initiation with respect to optogenetic
nigral terminal stimulation.
author/funder. All rights reserved. No reuse allowed without permission. The copyright holder for this preprint (which was not peer-reviewed) is the. https://doi.org/10.1101/2020.01.12.903500doi: bioRxiv preprint
6
Figure 2. Cued choice Delayed Response Task. A. Schematic time course of a task trial. At the start of each trial, a mild air puff (sample period) was
delivered pseudo-randomly on the left or on the right whiskers of the head fixed mouse. After the sample
period, the mouse had to withhold licking during the delay period. The end of the delay was indicated by a
Go signal after which the mouse could initiate the response lick. If the mouse first licked the correct spout
during the response period, a water reward was delivered. Trials were separated by a 3 s minimum intertrial
interval (ITI). Any licks during the ITI lead to a restart of the counter to starting the next trial to 2 s, ensuring
that at the onset of each trial the mice had completely stopped licking from the previous trial.
B. Schematic of the four possible trial outcomes: 1-Error impulsive lick (before Go cue), 2-Correct lick 3-
Error lick wrong side, 4-Error no lick (omission).
C. Bar graph (mean and SEM) of the behavioral results (15 sessions from 5 mice, 2060 trials) obtained
after training periods, during electrophysiologycal recording. Top pannel: Two sample ttest (alpha 5%),
***P<0.0001, with 87.4% +/- 10.4% correct trials (mean +/- SD). Bottom pannel: One sample ttest (alpha
5%), **PeSi < 0.005; ***Pimp and Pomi < 0.00005. The amount of error related to timing of action (omi + imp;
43.2%+/- 14.7%) were significantly higher than the amount of errors related to directionality (eSi; 8.9% +/-
8.1%), two sample ttest (alpha 5%), ***P<0.00005
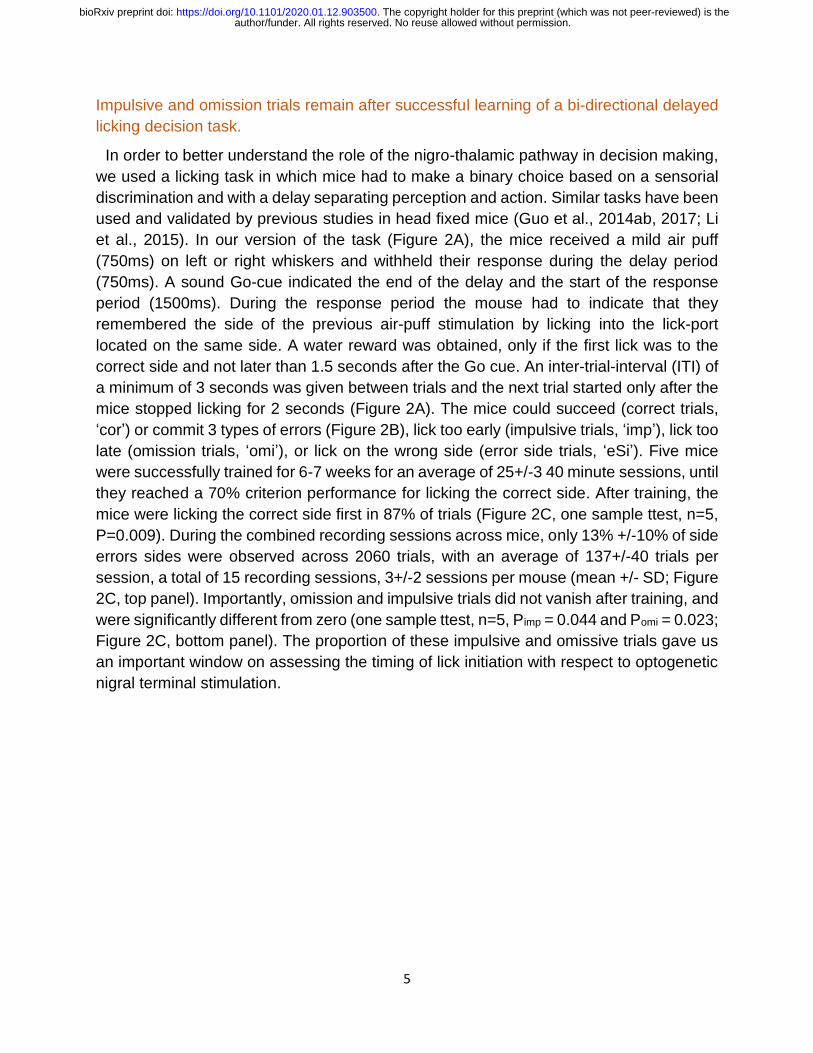
Nigro-thalamic neurons displayed task related firing rate changes that were sequentially
organized but non-homogeneously distributed in time.
To determine the relation of VM/VAL activity to our delayed response task, we recorded
the activity of 462 VM/VAL thalamic neurons during the task from five trained animals (15
sessions, Figure 3A and 3B). First, we wanted to determine how VM/VAL neurons were
overall modulated during the corrects trials of the task (Figure 3). We found that more
than 80% of the neurons responded by increasing their firing rate to one or multiple
periods of the task (Figure 3A, B). Due to the low number of inhibitory responses we
decided to only further analyze the 338 neurons that exclusively increased their firing rate
in relation to behavior (z-scored firing rate changes > 3). As we categorized neuronal
responses by strongest-response period, we noticed that a large part of the population
was task-modulated in a combination of periods (Figure 3A right and 3B right), with either
author/funder. All rights reserved. No reuse allowed without permission. The copyright holder for this preprint (which was not peer-reviewed) is the. https://doi.org/10.1101/2020.01.12.903500doi: bioRxiv preprint
7
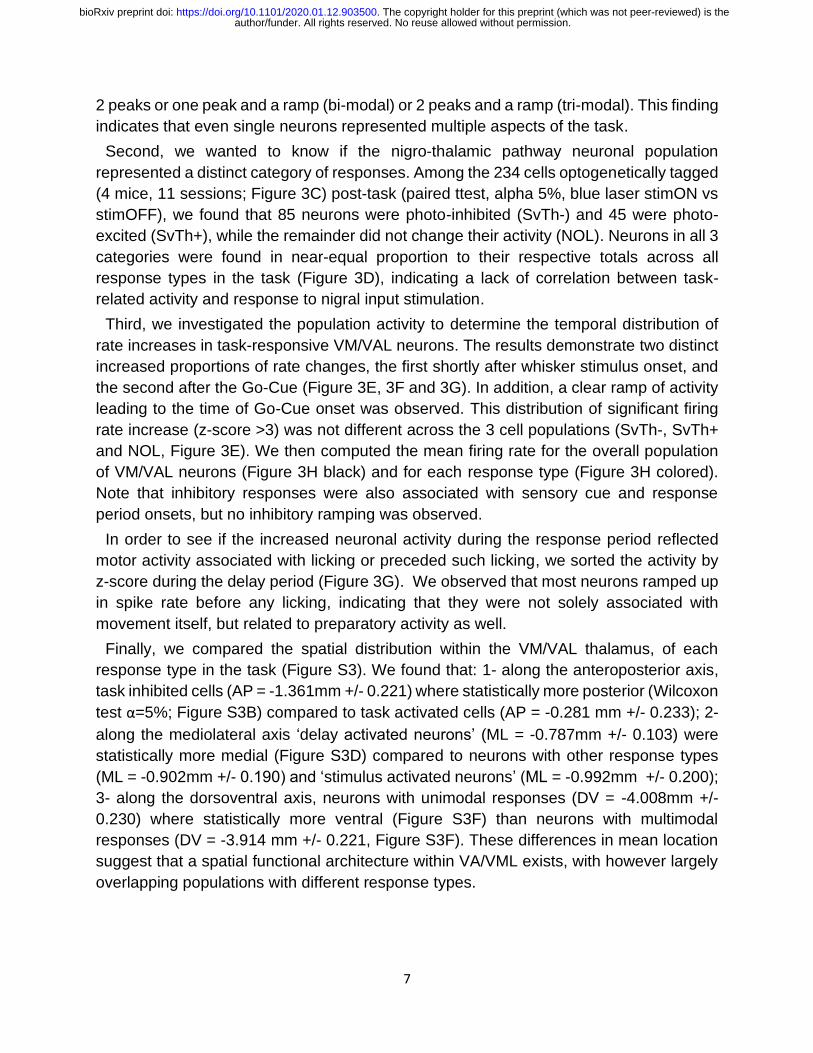
2 peaks or one peak and a ramp (bi-modal) or 2 peaks and a ramp (tri-modal). This finding
indicates that even single neurons represented multiple aspects of the task.
Second, we wanted to know if the nigro-thalamic pathway neuronal population
represented a distinct category of responses. Among the 234 cells optogenetically tagged
(4 mice, 11 sessions; Figure 3C) post-task (paired ttest, alpha 5%, blue laser stimON vs
stimOFF), we found that 85 neurons were photo-inhibited (SvTh-) and 45 were photo-
excited (SvTh+), while the remainder did not change their activity (NOL). Neurons in all 3
categories were found in near-equal proportion to their respective totals across all
response types in the task (Figure 3D), indicating a lack of correlation between task-
related activity and response to nigral input stimulation.
Third, we investigated the population activity to determine the temporal distribution of
rate increases in task-responsive VM/VAL neurons. The results demonstrate two distinct
increased proportions of rate changes, the first shortly after whisker stimulus onset, and
the second after the Go-Cue (Figure 3E, 3F and 3G). In addition, a clear ramp of activity
leading to the time of Go-Cue onset was observed. This distribution of significant firing
rate increase (z-score >3) was not different across the 3 cell populations (SvTh-, SvTh+
and NOL, Figure 3E). We then computed the mean firing rate for the overall population
of VM/VAL neurons (Figure 3H black) and for each response type (Figure 3H colored).
Note that inhibitory responses were also associated with sensory cue and response
period onsets, but no inhibitory ramping was observed.
In order to see if the increased neuronal activity during the response period reflected
motor activity associated with licking or preceded such licking, we sorted the activity by
z-score during the delay period (Figure 3G). We observed that most neurons ramped up
in spike rate before any licking, indicating that they were not solely associated with
movement itself, but related to preparatory activity as well.
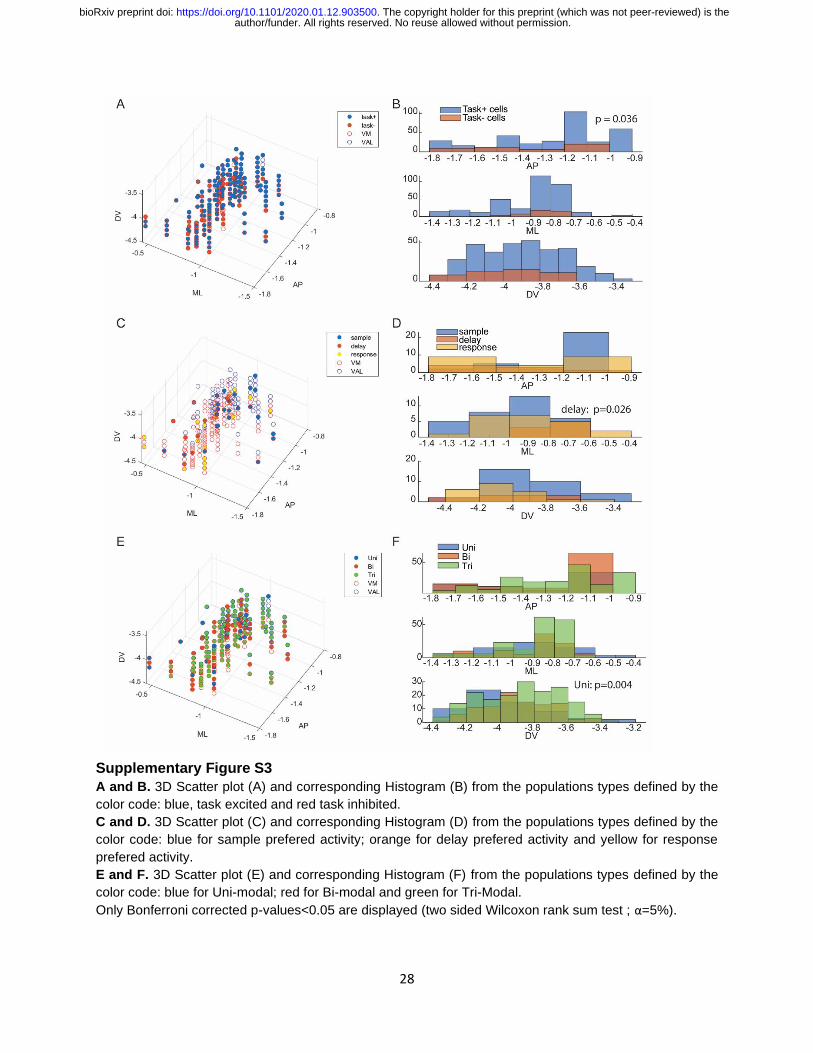
Finally, we compared the spatial distribution within the VM/VAL thalamus, of each
response type in the task (Figure S3). We found that: 1- along the anteroposterior axis,
task inhibited cells (AP = -1.361mm +/- 0.221) where statistically more posterior (Wilcoxon
test α=5%; Figure S3B) compared to task activated cells (AP = -0.281 mm +/- 0.233); 2-
along the mediolateral axis ‘delay activated neurons’ (ML = -0.787mm +/- 0.103) were
statistically more medial (Figure S3D) compared to neurons with other response types
(ML = -0.902mm +/- 0.190) and ‘stimulus activated neurons’ (ML = -0.992mm +/- 0.200);
3- along the dorsoventral axis, neurons with unimodal responses (DV = -4.008mm +/-
0.230) where statistically more ventral (Figure S3F) than neurons with multimodal
responses (DV = -3.914 mm +/- 0.221, Figure S3F). These differences in mean location
suggest that a spatial functional architecture within VA/VML exists, with however largely
overlapping populations with different response types.
author/funder. All rights reserved. No reuse allowed without permission. The copyright holder for this preprint (which was not peer-reviewed) is the. https://doi.org/10.1101/2020.01.12.903500doi: bioRxiv preprint
8
Figure 3. Classification of task related responses and their distribution across
nigral responsive and non-responsive neurons.
A. Venn-diagrams. Left: VM/VAL neurons with firing rate significantly changed during the correct trials of
the task (abs(z-score)>3), increased only (red), decreased only (green), both increases and decreases
(orange), and not significantly modulated (grey). Right: VM/VAL neurons (Among the 338 task-excited) with
firing rate significantly changed during the 3 periods of the task, sample, delay, response (z-score>3).
B. Examples of raster plots and their corresponding Peri Stimulus Time Histogram (PSTH) centered on the
Go cue for all correct trials. Each panel represents the spiking activity of a single unit recorded in VM/VAL
during the task. Dashed lines represent the onset of task epochs. (Shaded:1 SEM.).
C. Percentage of opto-tagged cells (among 234 cells tested post-task). SvTh+: optogenetically activated
neurons (magenta). SvTh-: optogenetically inhibited neurons (cyan). ThalNOL: thalamic no optical
response cells (grey).
D. Scatter plot comparing baseline and period specific average firing rates for a specific subpopulation of
cells. SvTh-(cyan), SvTh+(magenta), ThalNOL (grey).
E. Percentage of cells with a significant (z-score>3) modulation in rate during the task. The shaded area
represents the limit of the confidence interval (5% two-sided) resulting from a bootstrap (500 iterations , 30
cells randomly picked). 75 ms Gaussian Kernel convolution.
F . Distribution of the peak normalized firing rate across time (sorted by time of the peak) for the 338 task-
excited VM/VAL neurons.
G. same as F but using z-score across time (sorted by first occurrence of z>3 during the delay).
H. Z-score average in function of time for neuronal groups defined in A based on their firing rate properties.
author/funder. All rights reserved. No reuse allowed without permission. The copyright holder for this preprint (which was not peer-reviewed) is the. https://doi.org/10.1101/2020.01.12.903500doi: bioRxiv preprint
9
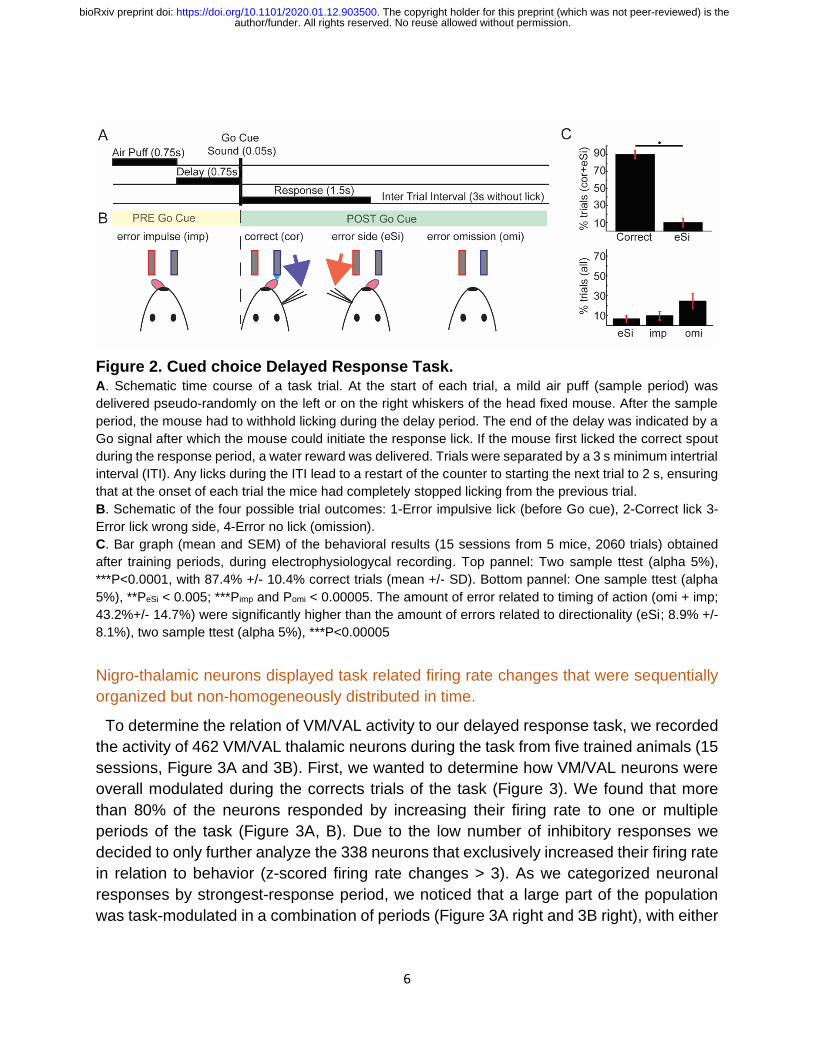
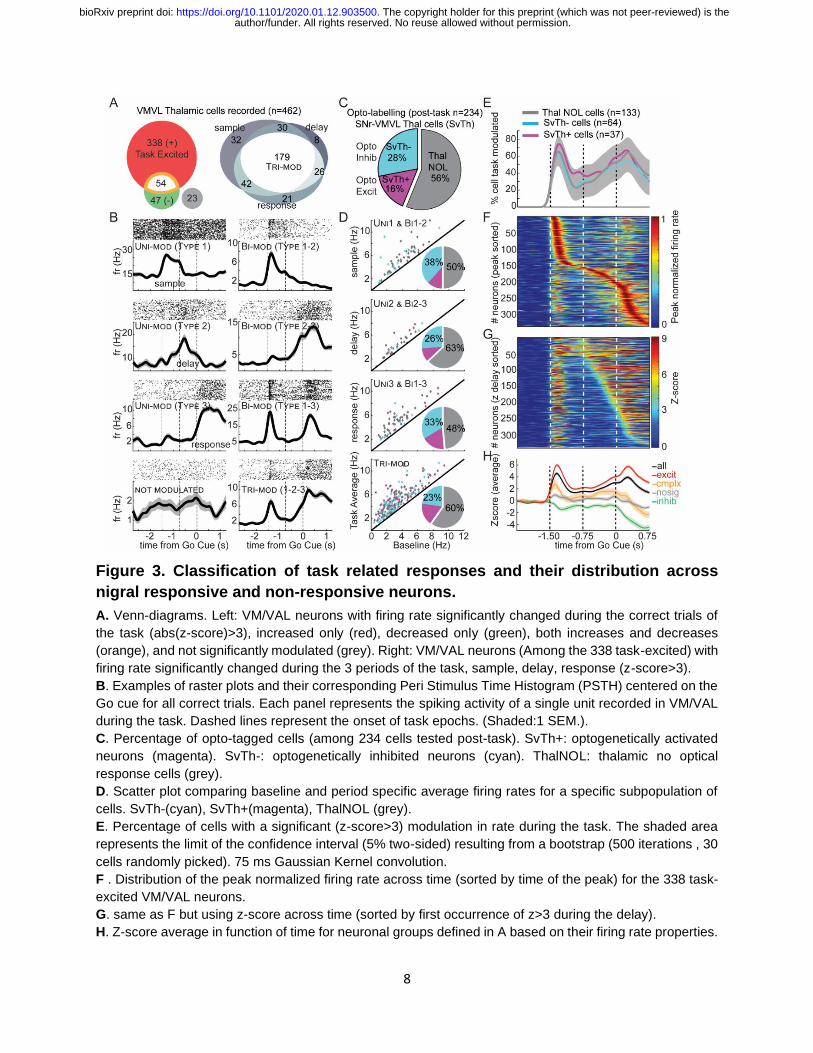
Optogenetic stimulation of SNr terminals in VM/VAL reduces impulsive trials and
increases omission trials.
The results from the previous sections showed a ramping of activity before Go-Cue
presentation, which may be related to preparation of movement initiation.
We hypothesized that higher levels of ramping activity may be associated with earlier
movement onset (impulsive movement), and low levels with a failure to move (lick
omissions). In order to test this hypothesis, we stimulated the SNr GABAergic terminals
during the delay period of the task (20% of the trials, randomly selected; Figure 4A). If
there is a link between VM/VAL activity and the likelihood of lick initiation, activation of
this inhibitory input should reduce the amount of impulsive trials and increase omissions.
We indeed found a significant reduction in the amount of impulsive trials during opto-
stimulated trials compared to non-opto trials as well as a significant increase in omission
trials (optoON vs optoOFF, two tailed paired ttest for 11 sessions, 4 mice, Pcor = 0.056,
PeSi = 0.076, Pimp = 0.030 Pomi=0.025, Figure 4B). Interestingly our optogenetic
manipulation could not be detected by only analyzing the correct trials, indeed the
increase in omissions denotes an increase in failures whereas the decrease in impulsive
trials allows for an increase in correct trials. This opposite effect on the probability of a
correct trial allowed for an overall statistically insignificant change in correctly executed
trials (Figure 4B, ‘cor’). Note that the ratio of left (ipsilateral) and right (contralateral) trial
outcomes remains statistically unchanged by the optogenetic manipulations (Figure
S4D).
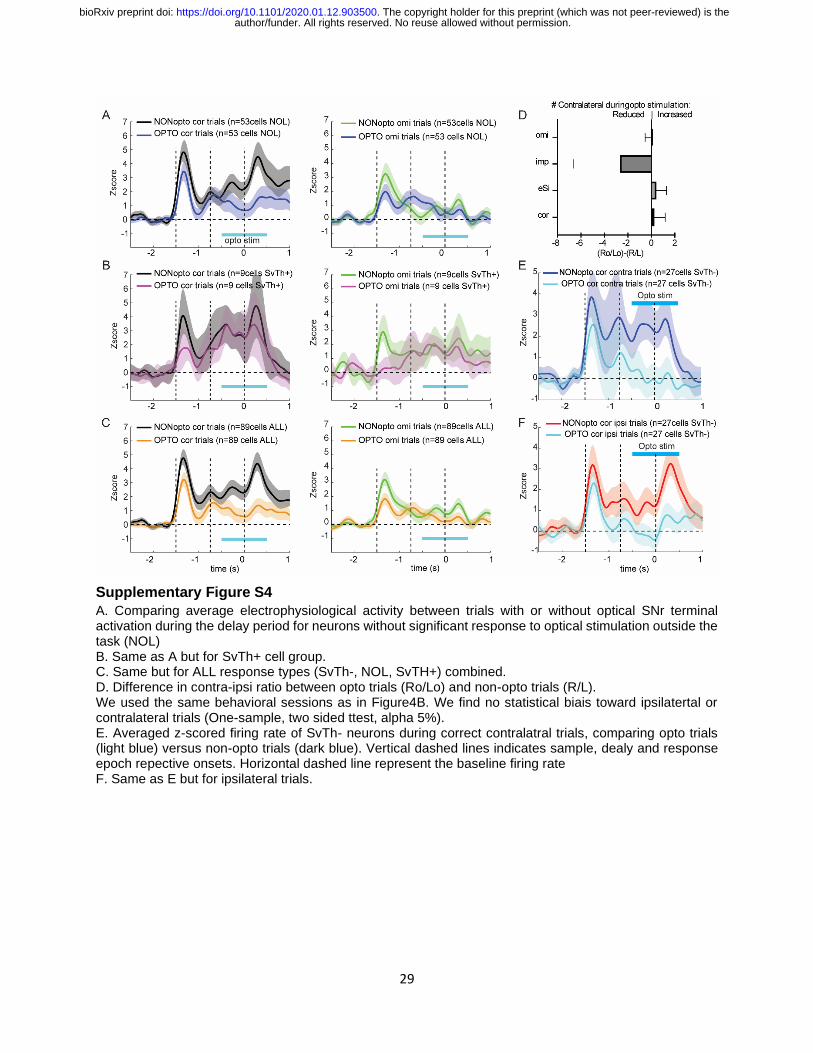
We then assessed the effect of the optogenetic manipulation during the task on the
population activity for the VM/VAL neurons (n=89, 3 mice, 5 sessions) that were
previously photo-labeled outside of the task. The photo-inhibited neurons (‘SvTh-‘, n=27)
presented a clear reduction in firing rate specific to the opto-stimulation epoch during the
delay period of both the correct trials (Figure 4C) and omission trials of the task (Figure
4D). The non-photo-modulated neurons (‘NOL‘, n=53) showed a lesser reduction of firing
rate, therefore contributing to the decrease of ramping that explains the changes in
behavior (Figure S4A). The photo-activated neurons (SvTh+ n=9) did not display
photomodulation during the task (Figure S4B). The grand average of all neurons tested
(n=89) overall showed a robust overall decrease firing in rate during the delay and
response periods (Figure S4C). In addition, we analyzed the SvTh- population average
firing rate change separately for contralateral and ipsilateral trials with or without opto-
stimulation. We found that in both cases the firing rate was reduced to baseline during
the stimulation, indicating that the photo-inhibition was not specific for left or right trials
(Figure S5E and S5F).
These results show that the opto-stimulation prevented the nigro-thalamic neurons from
ramping up during the delay epoch, in agreement with our hypothesis that such activity
may induce impulsive licking, and the lack of this activity induce omissions. These results
author/funder. All rights reserved. No reuse allowed without permission. The copyright holder for this preprint (which was not peer-reviewed) is the. https://doi.org/10.1101/2020.01.12.903500doi: bioRxiv preprint
10
indicate that during movement preparation, the level of activity in VM/VAL modulates the
timing of lick initiation.
Figure 4: Optogenetic
activation of SNr terminals
in VM/VAL reduced
premature licking and
increased omissions. A. Schematic time course of a trial
with optogenetic stimulation (blue
line). Stimulation occurred in 20% of
the trials (selected in a
pseudorandom manner). A blue
laser was turned on continuously for
1 second during the delay period 500
ms before the Go cue.
B. Behavioral results with
photostimulation: We tested the
effect of the photostimualtion of the
occurrence of each trial outcome
type (two tailed paired ttest). The
photostimulation reduced the
occurrence of impulsive trials and
increased the occurrence of
omission trials. (4 mice, 11 sessions)
C. nigro-thalamic population (SvTh-
n=27) averaged z-scored firing rate
across correct trials with or without
photostimulation (Opto stim). Only
session with at least 7 correct opto
trials were used (3 mice, 5 sessions).
The neuronal activity is strongly
suppressed during the delay period
and subsequent response periods
while the laser is ON (blue curve)
compared to when the laser is OFF
(black curve). Shaded: 2 SEM.
D. Same as C, but for omission trials.
author/funder. All rights reserved. No reuse allowed without permission. The copyright holder for this preprint (which was not peer-reviewed) is the. https://doi.org/10.1101/2020.01.12.903500doi: bioRxiv preprint
11
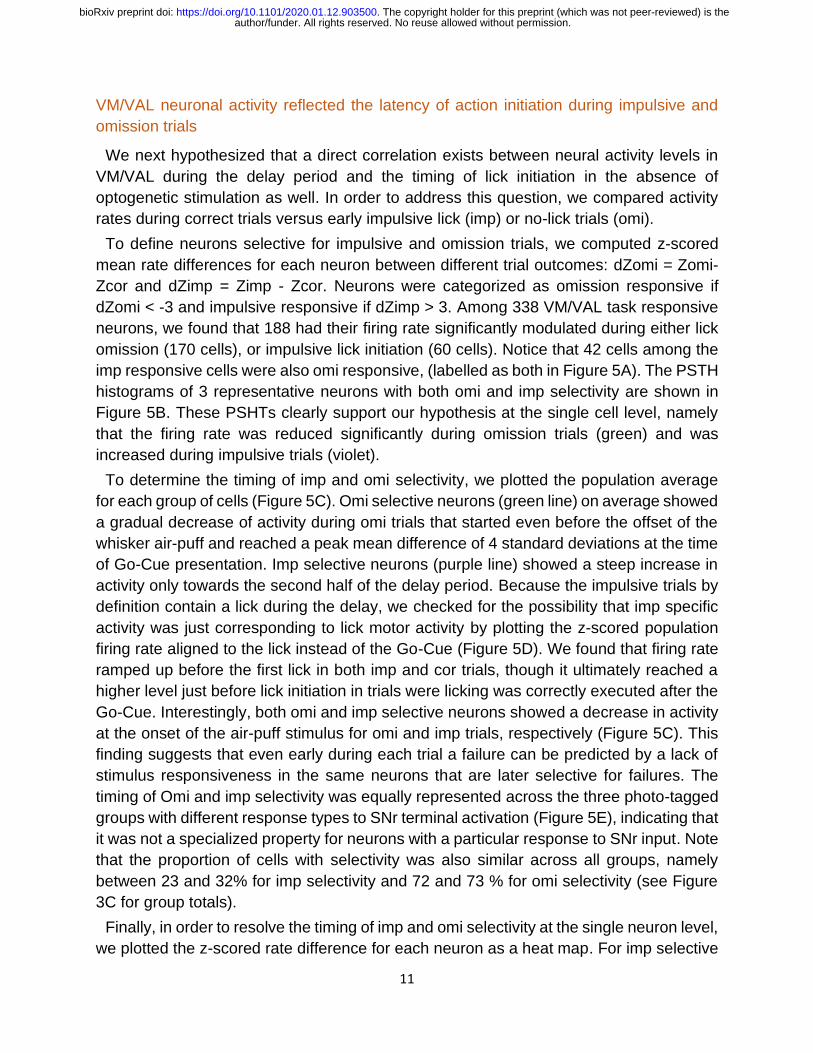
VM/VAL neuronal activity reflected the latency of action initiation during impulsive and
omission trials
We next hypothesized that a direct correlation exists between neural activity levels in
VM/VAL during the delay period and the timing of lick initiation in the absence of
optogenetic stimulation as well. In order to address this question, we compared activity
rates during correct trials versus early impulsive lick (imp) or no-lick trials (omi).
To define neurons selective for impulsive and omission trials, we computed z-scored
mean rate differences for each neuron between different trial outcomes: dZomi = Zomi-
Zcor and dZimp = Zimp - Zcor. Neurons were categorized as omission responsive if
dZomi < -3 and impulsive responsive if dZimp > 3. Among 338 VM/VAL task responsive
neurons, we found that 188 had their firing rate significantly modulated during either lick
omission (170 cells), or impulsive lick initiation (60 cells). Notice that 42 cells among the
imp responsive cells were also omi responsive, (labelled as both in Figure 5A). The PSTH
histograms of 3 representative neurons with both omi and imp selectivity are shown in
Figure 5B. These PSHTs clearly support our hypothesis at the single cell level, namely
that the firing rate was reduced significantly during omission trials (green) and was
increased during impulsive trials (violet).
To determine the timing of imp and omi selectivity, we plotted the population average
for each group of cells (Figure 5C). Omi selective neurons (green line) on average showed
a gradual decrease of activity during omi trials that started even before the offset of the
whisker air-puff and reached a peak mean difference of 4 standard deviations at the time
of Go-Cue presentation. Imp selective neurons (purple line) showed a steep increase in
activity only towards the second half of the delay period. Because the impulsive trials by
definition contain a lick during the delay, we checked for the possibility that imp specific
activity was just corresponding to lick motor activity by plotting the z-scored population
firing rate aligned to the lick instead of the Go-Cue (Figure 5D). We found that firing rate
ramped up before the first lick in both imp and cor trials, though it ultimately reached a
higher level just before lick initiation in trials were licking was correctly executed after the
Go-Cue. Interestingly, both omi and imp selective neurons showed a decrease in activity
at the onset of the air-puff stimulus for omi and imp trials, respectively (Figure 5C). This
finding suggests that even early during each trial a failure can be predicted by a lack of
stimulus responsiveness in the same neurons that are later selective for failures. The
timing of Omi and imp selectivity was equally represented across the three photo-tagged
groups with different response types to SNr terminal activation (Figure 5E), indicating that
it was not a specialized property for neurons with a particular response to SNr input. Note
that the proportion of cells with selectivity was also similar across all groups, namely
between 23 and 32% for imp selectivity and 72 and 73 % for omi selectivity (see Figure
3C for group totals).
Finally, in order to resolve the timing of imp and omi selectivity at the single neuron level,
we plotted the z-scored rate difference for each neuron as a heat map. For imp selective
author/funder. All rights reserved. No reuse allowed without permission. The copyright holder for this preprint (which was not peer-reviewed) is the. https://doi.org/10.1101/2020.01.12.903500doi: bioRxiv preprint
12
neurons during imp trials, a consistent strong increase in spike rate was present during
the second half of the delay period, while about 50% of these neurons also showed a
strong decrease of firing during the stimulus period (Figure 5F). Omi selective neurons
during omi trials showed a reduction in activity that could start at varying time points
beginning with the stimulus onset, and generally lasted beyond Go-Cue presentation. We
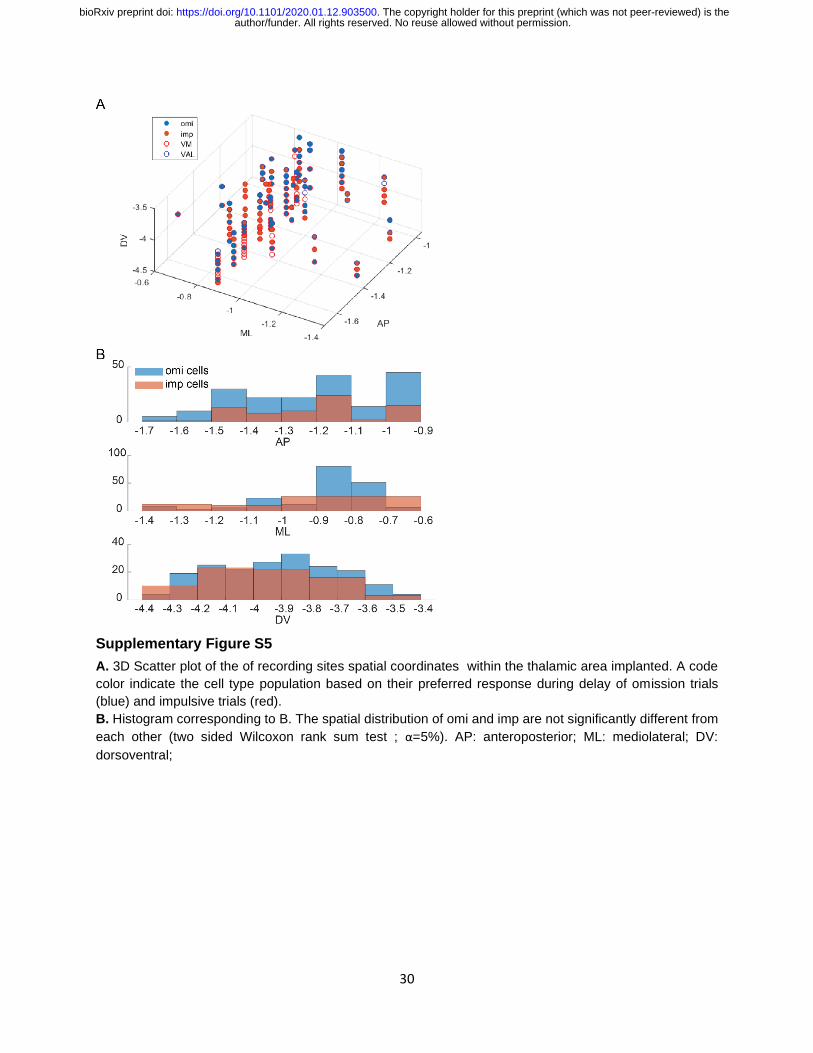
also examined the spatial distribution of imp and omi selective neurons but found no
significant differences in spatial distribution (Figure S5).
Figure 5: VM/VAL neuronal activity during delay is reduced during omission and
increased before premature licking. A. Venn Diagram of 234 VM/VAL task-excited neurons with a firing rate difference during the delay epoch
(dZ>3) either between cor trials and omi trials (green), imp trials (violet), both omi and imp (white) or no
difference (Grey).
B. Example of single unit activity separated by trials type, impulsive (violet), omission (green) and correct
(black). Each panel represent a raster plot and a PSTH for each type of trials for an example VM/VAL
neuron. Shaded: 2 SEM
author/funder. All rights reserved. No reuse allowed without permission. The copyright holder for this preprint (which was not peer-reviewed) is the. https://doi.org/10.1101/2020.01.12.903500doi: bioRxiv preprint
13
C. Population average change in firing rate (mean dZ in function of time align to GoCue) during imp and
omi trials compare to correct trial for two groups of neurons defined previously as imp and omi responsive
during the delay epoch. The horizontal dashed lines at zero dZ indicate no difference to correct trials. Notice
how during the delay the two population diverge from zero on opposite side indicating that impulsive
responsive neurons tend to over-activate during delay of impulsive trials, while the omi neurons tends to
hypoactivate during the delay of an omission trial. Shaded: 2 SEM
D. Mean z-score in function of time, align to the lick, between cor and imp trials. Both ramp up before the
lick. Shaded: 2 SEM.
E. Average distribution of activity difference between correct and impulsive trials (dZ>3; top panel) or
omission trials (dZ<3; bottom panel) for each imp and omi responsive neurons respectively subdivided into
3 populations SvTh- (cyan; 25% of the imp cells; 28% of omi cells), SvTh+ (magenta, 20% of imp cells,
16% of omi cells) and ThalNOL (grey, 55% of imp and 55% of omi cells). The temporal distributions of their
modulation were not significantly different across groups (shaded grey area represent the bootstraped i.c.
obtained by averaging over 1000 iterations with 10 cells picked randomly among all group at each iteration).
F. Cell by cell distribution of activity difference between correct and impulsive trials (dz=Zimp-Zcor; top
panel) or omission trials (dz=Zomi-Zcor; bottom panel) for each imp and omi responsive neurons
respectively sorted by dz value. Each line is one neuron.
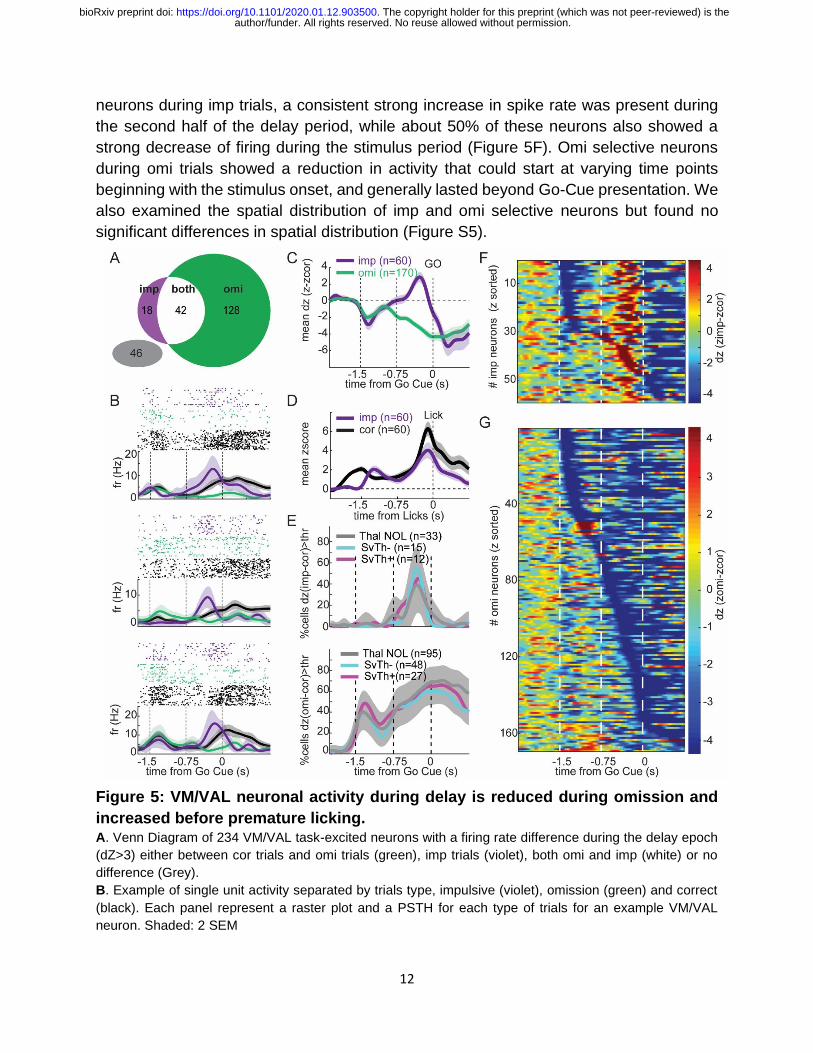
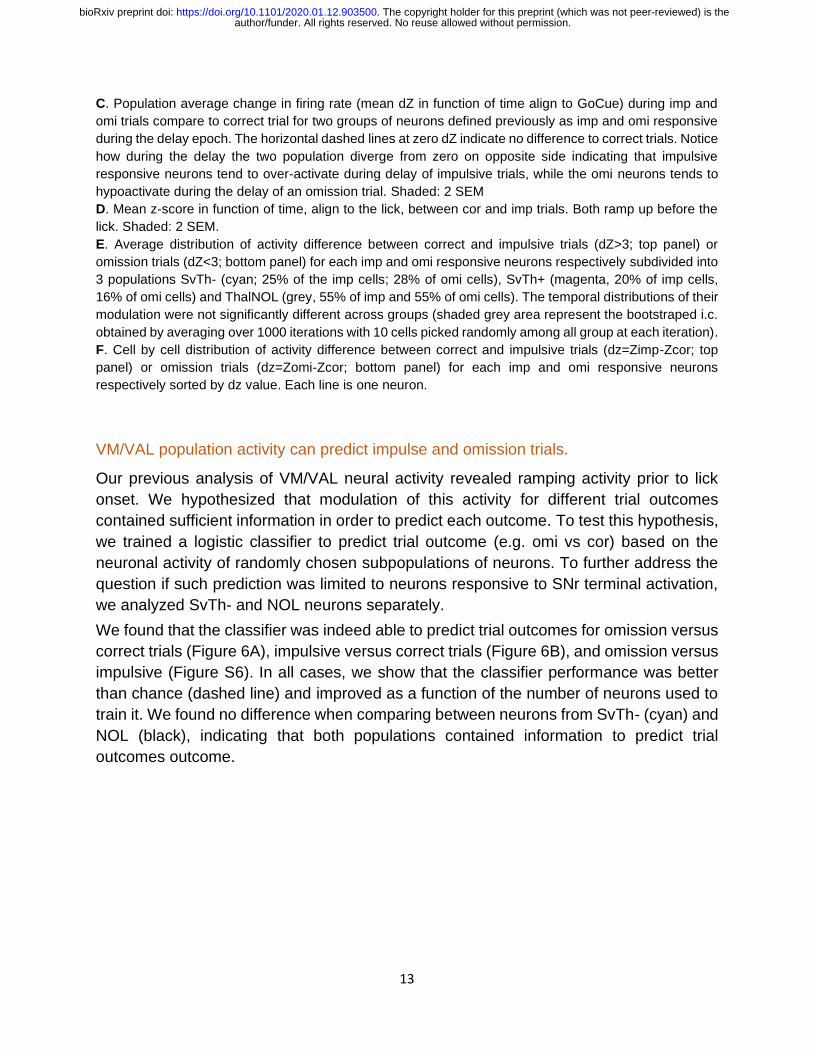
VM/VAL population activity can predict impulse and omission trials.
Our previous analysis of VM/VAL neural activity revealed ramping activity prior to lick
onset. We hypothesized that modulation of this activity for different trial outcomes
contained sufficient information in order to predict each outcome. To test this hypothesis,
we trained a logistic classifier to predict trial outcome (e.g. omi vs cor) based on the
neuronal activity of randomly chosen subpopulations of neurons. To further address the
question if such prediction was limited to neurons responsive to SNr terminal activation,
we analyzed SvTh- and NOL neurons separately.
We found that the classifier was indeed able to predict trial outcomes for omission versus
correct trials (Figure 6A), impulsive versus correct trials (Figure 6B), and omission versus
impulsive (Figure S6). In all cases, we show that the classifier performance was better
than chance (dashed line) and improved as a function of the number of neurons used to
train it. We found no difference when comparing between neurons from SvTh- (cyan) and
NOL (black), indicating that both populations contained information to predict trial
outcomes outcome.
author/funder. All rights reserved. No reuse allowed without permission. The copyright holder for this preprint (which was not peer-reviewed) is the. https://doi.org/10.1101/2020.01.12.903500doi: bioRxiv preprint
14
Figure 6: Thalamic Cell assembly encode the type of action that are prepared
during the delay of the task. A. Average performance of Logistic classifer on discriminating omission vs correct trials based on the firing
rate of neuronal assemblies of different sizes (randomly selected across the VM/VAL populations SvTh- or
NOL) during the delay of correct trials only (no licking during delay). 10 cross validation. 1000 iterations for
each group size. Cells were randomly selected at each iteration. For a shuffle control, trial outcomes were
randomly assigned to each trial spike train.
B. Same as A but comparing impulsive trial vs correct trials. Note that because the mouse licks during delay
in imp trials this classifier uses the neuronal activity of the 750ms before the lick.
author/funder. All rights reserved. No reuse allowed without permission. The copyright holder for this preprint (which was not peer-reviewed) is the. https://doi.org/10.1101/2020.01.12.903500doi: bioRxiv preprint
15
DISCUSSION
Summary of results
In this study we showed that firing rates in basal ganglia input recipient motor thalamic
nuclei (VM/VAL) in a task with a delayed Go-Cue predict the timing of response licks to
determine correct trial outcomes, or error trials with impulsive early licks or lick omission.
On the population level, omission trials were associated with a clear firing rate reduction
during the delay period between sensory and Go-Cue, whereas impulsive lick trials
showed a pronounced increase in firing rate over correctly executed trials. Single neurons
showed highly significant rate increases during several distinct periods of the behavioral
task, often peaking shortly after trial onset and again after the Go-Cue. Optogenetic
activation of SNr GABAergic terminals in VM/VAL resulted in an increase of omissions
and decrease in impulsive licking. Spontaneously occurring impulsive trials could be
predicted by a linear decoder based on enhanced firing rate increase during the delay
period, which could reflect a natural over-motivation for the reward. Vice versa,
spontaneously occurring lick omissions could be predicted based on firing rate decreases
in task related responses.
An interpretation of optogenetic responses
When optogenetically stimulating GABAergic terminals in VA/VAL thalamus outside of
the task we observed the expected decrease in thalamic neural firing in a proportion of
28% of neurons, while 56% showed no significant spike rate change and 16% showed an
increase. However, no functional separation in terms of task responses was observed
between these populations, and the non-responsive neurons on average did show a firing
rate decrease when stimulated during the delay period in the task. It seems therefore
likely that nominally unresponsive neurons did not have sufficient ChR2 expression in the
stimulated SNr terminals rather than not receiving nigral input. Neurons that showed
increases with stimulation outside of the task were most likely not directly excited by
GABAergic nigral input but received indirect excitation through network interactions. The
most likely candidate for these network effects in motor thalamus is presented by the
reticular nucleus of thalamus (RTN), which is excited by thalamocortical (TC) neurons,
and in turn inhibits these neurons (Ando et al., 1995). Our optogenetically inhibited TC
neurons therefore are likely to lead to reduced RTN excitation, which in turn would broadly
disinhibit TC neurons that are not themselves inhibited by the SNr. Nevertheless, we
observed a decrease in the total average activity of all neurons when stimulated during
the delay period, supporting the interpretation of the behavioral outcome of increased lick
omissions as a failure of increased nigral activity to trigger movement initiation.
author/funder. All rights reserved. No reuse allowed without permission. The copyright holder for this preprint (which was not peer-reviewed) is the. https://doi.org/10.1101/2020.01.12.903500doi: bioRxiv preprint
16
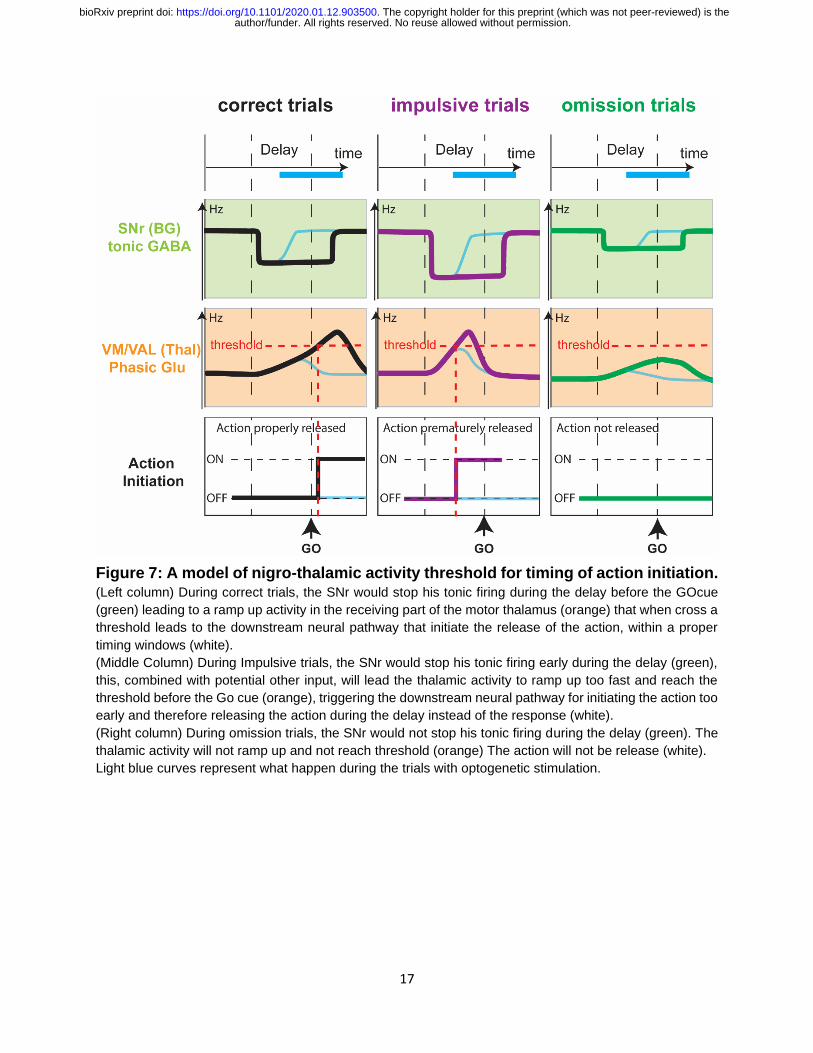
A threshold model for timing of movement initiation
Taken together, our electrophysiological and optogenetic results lead us to propose a
functional model of basal ganglia input to VM/VAL, in which ramping activity leading to
movement initiation is dampened by inhibitory SNr input (Figure 7). In this model,
movement will be initiated at the time at which a threshold in VM/VAL population activity
is reached (Figure 7, correct trials). If this ramp-up reaches the threshold too early it will
trigger a premature action (Figure 7, impulsive trials), finally if it does never reach the
threshold the prepared action will not occur (Figure 7, omission trials). Our model also
explains how the opto-activation of nigral terminals in VM/VAL helps to substantially
reduce impulsive trials and increased the occurrence of omission trials. This model overall
generates a timing function for basal ganglia input to motor thalamus. Because basal
ganglia output neurons have a high spontaneous firing rate (Delong, 1971; Lobb and
Jaeger, 2015; Ruskin et al., 2002), the natural mode of basal ganglia action is to prevent
premature movement initiation by dampening a thalamo-cortical feedback loop previously
identified between VM/VAL and ALM cortex in the control of cued licking (Guo et al.,
2017). This function is consistent with previous work showing that SNr neurons decrease
in activity for action initiation, and such decreases are countermanded by subthalamic
excitation when an action needs to be canceled (Schmidt et al., 2013).
author/funder. All rights reserved. No reuse allowed without permission. The copyright holder for this preprint (which was not peer-reviewed) is the. https://doi.org/10.1101/2020.01.12.903500doi: bioRxiv preprint
17
Figure 7: A model of nigro-thalamic activity threshold for timing of action initiation. (Left column) During correct trials, the SNr would stop his tonic firing during the delay before the GOcue
(green) leading to a ramp up activity in the receiving part of the motor thalamus (orange) that when cross a
threshold leads to the downstream neural pathway that initiate the release of the action, within a proper
timing windows (white).
(Middle Column) During Impulsive trials, the SNr would stop his tonic firing early during the delay (green),
this, combined with potential other input, will lead the thalamic activity to ramp up too fast and reach the
threshold before the Go cue (orange), triggering the downstream neural pathway for initiating the action too
early and therefore releasing the action during the delay instead of the response (white).
(Right column) During omission trials, the SNr would not stop his tonic firing during the delay (green). The
thalamic activity will not ramp up and not reach threshold (orange) The action will not be release (white).
Light blue curves represent what happen during the trials with optogenetic stimulation.
author/funder. All rights reserved. No reuse allowed without permission. The copyright holder for this preprint (which was not peer-reviewed) is the. https://doi.org/10.1101/2020.01.12.903500doi: bioRxiv preprint
18
Timing and motor vigor hypotheses
Overall, our data support a model according to which the basal ganglia input to a
thalamo-cortical feedback loop is responsible for the timing of action initiation in learned
reward-based tasks. While our work focused on the final output of the basal ganglia to
motor thalamus, previous work has shown similar ramping activity in relation to movement
initiation in striatal during cued preparatory delays (Jaeger et al., 1994; Mello et al., 2015)
or prior to self-initiated movements (Lee and Assad, 2003), as well as in pallidal neurons
(Jaeger et al., 1994). These activities likely lead a reduction of SNr activity to release
movement initiation, while in contrast subthalamic excitation of the nigra may favor
stopping of movement initiation (Schmidt et al., 2013). SNr activity, in turn, is likely
controlled by striatal input from the direct pathway. Indeed, optogenetic inhibition of the
direct pathway (disinhibiting SNr) leads to a delay in the time of motor execution
(Tecuapetla et al., 2016) in agreement with our timing model.
The vigor hypothesis posits that BG output is controlling movement vigor, as measured
by an impact of basal ganglia output on action speed (Desmurget and Turner, 2008;
Turner and Desmurget, 2010). This effect has also been referred to as a control of
‘movement gain’ (Anderson and Horak, 1985), which may be related to motivation
(Catanese et al., 2013; McGinty et al., 2013) and cost of action (Shadmehr and Krakauer,
2008; Turner and Desmurget, 2010). Clinically, movement gain is diminished in
hypometric basal ganglia disorders including Parkinson’s disease, often leading to
bradykinesia and hypometria (Desmurget et al., 2004).
In our task, pre-mature actions (impulsive trials) could be seen as over-vigorous while
lack of action (omission trials) can be seen as lacking vigor. We found that reduction of
the BG recipient thalamic activity increase the amount of omissions and reduces the
amount of impulsive trials, which is compatible with the idea of a reduction of
vigor/motivation transmitted by an over-activation of the BG output leading to a
dysregulation of the VM/VAL population activity as shown in Figure 7. Notably, rate
increases in VM/VAL neurons in our data often lasted through the response period, and
therefore our data are also compatible with a correlation between population firing rate
and the vigor of the action. However, in contrast to reaching movements in primates, the
speed of licking is most likely controlled by a brainstem central pattern generator for
licking (Travers et al., 1997).
Our threshold hypothesis suggests that the level of neuronal activity in VM/VAL once
past a certain threshold will trigger the actions even though the action was supposed to
happen later, as if the motivation/vigor level went so high that the action become
irresistible. On the contrary if the level of activity never reaches a certain threshold then
the action will not be release at all. Therefore, in the frame of the threshold hypothesis
model presented in Figure 7, the activity level in VM/VAL could be a function of a
gain/vigor/motivation for a given action. This gain function combined with an adjustable
threshold values, could serve as a timer for action release, as well as a system for
author/funder. All rights reserved. No reuse allowed without permission. The copyright holder for this preprint (which was not peer-reviewed) is the. https://doi.org/10.1101/2020.01.12.903500doi: bioRxiv preprint
19
selection based on activity level. Indeed it is possible that other actions compete (Boraud
et al., 2018; Leblois et al., 2006) for the highest motivation value, and that a winner take
all mechanism is implemented. Such a possibility is also compatible with our proposed
mechanism (Figure 7), in which the first action to reach the threshold would be released.
ACKNOWLEDGMENTS:
We thank Dr. Adriana Galvan for helping with histological procedures. We thank Dr.
Nick-Steinmetz for his help with the 3D analysis of electrode track. We thank Dr. Hidehiko
Inagaki for his insightful comments on the draft. We thank members of the Jaeger lab Dr.
Li Su, Dr. Arthur Morissette, Chelsea Leversedge and Jacqueline Zhu for their technical
help. This work was supported by NIH 1UO1NS094302 (Jaeger, PI) and 1R01NS111470
(Jaeger, PI) under the BRAIN Initiative.
AUTHOR CONTRIBUTIONS:
JC and DJ designed experiments, JC carried out experiments, JC analyzed data, JC and
DJ wrote manuscript.
DECLARATION OF INTERESTS:
The authors declare no competing interests.
REFERENCES
Alexander, G., and Crutcher, M. (1990). Functional architecture of basal ganglia circuits: neural substrates of parrallel processing. Trends Neurosci. 266–271.
Anderson, M.E., and Horak, F.B. (1985). Influence of the globus pallidus on arm movements in monkeys. III. Timing of movement-related information. J. Neurophysiol. 54, 433–448.
Ando, N., Izawa, Y., and Shinoda, Y. (1995). Relative contributions of thalamic reticular nucleus neurons and intrinsic interneurons to inhibition of thalamic neurons projecting to the motor cortex. J. Neurophysiol. 73, 2470–2485.
Bodor, A.L., Giber, K., Rovo, Z., Ulbert, I., and Acsady, L. (2008). Structural correlates of efficient GABAergic transmission in the basal ganglia-thalamus pathway. J. Neurosci. 28, 3090–3102.
Boraud, T., Leblois, A., and Rougier, N.P. (2018). A natural history of skills. Prog. Neurobiol. 171, 114–124.
Bosch-Bouju, C., Hyland, B.I., and Parr-Brownlie, L.C. (2013). Motor thalamus integration of cortical, cerebellar and basal ganglia information: implications for normal and parkinsonian conditions. Front. Comput. Neurosci. 7, 163.
Buhusi, C. V., and Meck, W.H. (2005). What makes us tick? Functional and neural mechanisms of interval timing. Nat. Rev. Neurosci. 6, 755–765.
author/funder. All rights reserved. No reuse allowed without permission. The copyright holder for this preprint (which was not peer-reviewed) is the. https://doi.org/10.1101/2020.01.12.903500doi: bioRxiv preprint
20
Catanese, J., van der Meer, M., and vanderMeer, M. (2013). A network state linking motivation and action in the nucleus accumbens. Neuron 78, 753–754.
Delong, M.R. (1971). Activity of Pallidal Neurons during Movement. J. Neurophysiol. 34, 414-.
Desmurget, M., and Turner, R.S. (2008). Testing Basal Ganglia Motor Functions Through Reversible Inactivations in the Posterior Internal Globus Pallidus. J. Neurophysiol. 99, 1057–1076.
Desmurget, M., Grafton, S.T., Vindras, P., Gréa, H., and Turner, R.S. (2004). The basal ganglia network mediates the planning of movement amplitude. Eur. J. Neurosci. 19, 2871–2880.
Donahue, C.H., and Kreitzer, A.C. (2015). A Direct Path to Action Initiation. Neuron 88, 240–241.
Graybiel, A.M. (2008). Habits, Rituals, and the Evaluative Brain. Annu. Rev. Neurosci. 31, 359–387.
Guo, K., Yamawaki, N., Svoboda, K., and Shepherd, G.M.G. (2018). Anterolateral motor cortex connects with a medial subdivision of ventromedial thalamus through cell type-specific circuits, forming an excitatory thalamo-cortico-thalamic loop via layer 1 apical tuft dendrites of layer 5B pyramidal tract type neurons. J. Neurosci. 38, 8787–8797.
Guo, Z. V., Hires, S.A., Li, N., O’Connor, D.H., Komiyama, T., Ophir, E., Huber, D., Bonardi, C., Morandell, K., Gutnisky, D., et al. (2014a). Procedures for behavioral experiments in head-fixed mice. PLoS One 9.
Guo, Z. V., Li, N., Huber, D., Ophir, E., Gutnisky, D., Ting, J.T., Feng, G.P., and Svoboda, K. (2014b). Flow of cortical activity underlying a tactile decision in mice. Neuron 81, 179–194.
Guo, Z. V., Inagaki, H.K., Daie, K., Druckmann, S., Gerfen, C.R., and Svoboda, K. (2017). Maintenance of persistent activity in a frontal thalamocortical loop. Nature 545, 181–186.
Jaeger, D., Gilman, S., and Aldridge, J.W. (1994). Primate basal ganglia activity in a precued reaching task: preparation for movement. Exp. Brain Res. 95, 51–64.
Leblois, A., Boraud, T., Meissner, W., Bergman, H., and Hansel, D. (2006). Competition between feedback loops underlies normal and pathological dynamics in the basal ganglia. J. Neurosci. 26, 3567–3583.
Lee, I.H., and Assad, J.A. (2003). Putaminal Activity for Simple Reactions or Self-Timed Movements. J. Neurophysiol. 89, 2528–2537.
Li, N., Chen, T.W., Guo, Z. V., Gerfen, C.R., and Svoboda, K. (2015). A motor cortex circuit for motor planning and movement. Nature 519, 51–56.
Lobb, C.J., and Jaeger, D. (2015). Bursting activity of substantia nigra pars reticulata neurons in mouse parkinsonism in awake and anesthetized states. Neurobiol. Dis. 75, 177–185.
McGinty, V.B., Lardeux, S., Taha, S.A., Kim, J.J., and Nicola, S.M. (2013). Invigoration of reward seeking by cue and proximity encoding in the nucleus accumbens. Neuron 78, 910–922.
Mello, G.B.M., Soares, S., and Paton, J.J. (2015). A Scalable Population Code for Time
author/funder. All rights reserved. No reuse allowed without permission. The copyright holder for this preprint (which was not peer-reviewed) is the. https://doi.org/10.1101/2020.01.12.903500doi: bioRxiv preprint
21
in the Striatum. Curr. Biol. 25, 1113–1122.
Mink, J.W. (1996). BG competing action selection model. Prog. Neurobiol. 50, 26.
Quiroga, R.Q. (2004). Unsupervised spike detection and sorting Problem : detect and separate spikes. Neural Comput. 16, 1661–1687.
Quiroga, R.Q. (2012). Spike sorting. Curr. Biol. 22, R45–R46.
Ruskin, D.N., Bergstrom, D.A., and Walters, J.R. (2002). Nigrostriatal lesion and dopamine agonists affect firing patterns of rodent entopeduncular nucleus neurons. J. Neurophysiol. 88, 487–496.
Sakai, S.T., Grofova, I., and Bruce, K. (1998). Nigrothalamic projections and nigrothalamocortical pathway to the medial agranular cortex in the rat: Single- and double-labeling light and electron microscopic studies. J. Comp. Neurol. 391, 506–525.
Schmidt, R., Leventhal, D.K., Mallet, N., Chen, F., and Berke, J.D. (2013). Canceling actions involves a race between basal ganglia pathways. Nat. Neurosci. 16, 1118–1124.
Shadmehr, R., and Krakauer, J.W. (2008). A computational neuroanatomy for motor control. Exp. Brain Res. 185, 359–381.
Shamash, P., Carandini, M., Harris, K., and Steinmetz, N. (2018). A tool for analyzing electrode tracks from slice histology. BioRxiv 447995.
Tecuapetla, F., Jin, X., Lima, S.Q., and Costa, R.M. (2016). Complementary Contributions of Striatal Projection Pathways to Action Initiation and Execution. Cell 166, 703–715.
Theyel, B.B., Llano, D.A., and Sherman, S.M. (2010). The corticothalamocortical circuit drives higher-order cortex in the mouse. Nat. Neurosci. 13, 84–88.
Travers, J.B., Dinardo, L.A., and Karimnamazi, H. (1997). Motor and premotor mechanisms of licking. Neurosci. Biobehav. Rev. 21, 631–647.
Turner, R.S., and Desmurget, M. (2010). Basal ganglia contributions to motor control: A vigorous tutor. Curr. Opin. Neurobiol. 20, 704–716.
Vong, L., Ye, C., Yang, Z., Choi, B., Chua, S., and Lowell, B.B. (2011). Leptin Action on GABAergic Neurons Prevents Obesity and Reduces Inhibitory Tone to POMC Neurons. Neuron 71, 142–154.
author/funder. All rights reserved. No reuse allowed without permission. The copyright holder for this preprint (which was not peer-reviewed) is the. https://doi.org/10.1101/2020.01.12.903500doi: bioRxiv preprint
22
METHODS
CONTACT FOR REAGENT AND RESOURCE SHARING
Further information and requests for resources and reagents should be directed to and
will be fulfilled by the corresponding authors, Dieter Jaeger ([email protected]) and
Julien Catanese ([email protected]).
EXPERIMENTAL MODEL AND SUBJECT DETAILS
Mice
Data were collected from adult male and female mice between 3-6 month of age. All
mice were from a slc32a transgenic line expressing Cre under the VGAT promoter in
GABAergic neurons (JAX stock #028862). Animals were maintained on a C57BL/6
background and kept on a 12:12 reverse light/dark cycle. During the behavioral training
periods, animals were water restricted to 85% of their body weight. Food was available
ad libitum at all times.
METHOD DETAILS
Stereotaxic Surgeries
Mice were anesthetized with isoflurane (4% for induction and then maintained at 2%).
The analgesic Buprenorphine SR-LAB (1 mg/kg) was administered (s.c.) pre-operatively.
The skull was shaved. Mice were placed on stereotaxic apparatus (Kopf). Ophthalmic
ointment was applied to the eyes. Body temperature was monitored and maintained at
37.2 Celsius at all time by using a heat pad. During the procedure, sterile saline (0.1 ml
s.c.) was injected as needed to maintain hydration. The level of anesthesia was monitored
every 20min (toe pinch and breathing ~1Hz). A circular scalp incision revealed the skull
which was cleaned and dried. A pinhole craniotomy was drilled above the SNr (AP: -3.4
+/- 0.5mm ML: -1.4 +/- 0.5mm, relative to Bregma). A viral vector containing the transgene
(rAVV2-EF1a-DIO-hChR2(E123T/T159C)-EYFP) was injected (200nl) into the left SNr
(AP: -3.40 +/- 0.25mm ML: -1.40 +/- 0.25mm, DV: -4.40 +/-0.10mm relative to Bregma).
After the injection, a custom machined aluminum head-bar was cemented onto the skull
using dental adhesive resin (Metabond C&B, Parkell Products Inc). A pinhole craniotomy
was made above the cerebellum area for the ground wire (Tungsten). The head-bar was
secured with more dental cement and the entire skull area was protected with a thin layer
of cement. Antibiotic ointment was applied around the cemented area.
A few days before acute electrophysiological data acquisition, a second surgery was
performed on the mice that successfully completed the behavioral training. In this
surgery, a small craniotomy (AP: -1.25 +/-0.50 mm; ML: -0.75 +/-0.50 mm relative to
Bregma) was performed under deep isoflurane anesthesia, and protected with Kwik-
Cast silicon sealant (WPI) outside of recording sessions.
author/funder. All rights reserved. No reuse allowed without permission. The copyright holder for this preprint (which was not peer-reviewed) is the. https://doi.org/10.1101/2020.01.12.903500doi: bioRxiv preprint
23
Behavioral Training
All tasks events were programmed using LabView (National InstrumentsTM). The pre-
training procedure (1-2 weeks) was adapted from Guo et al., 2014a. Mice were handled
daily in the experimental room and progressively habituated to the head-fixation
procedure. Once head-fixed and body restricted in a transparent plastic tube (Guo et al.,
2014a), mice were placed in a dark behavioral box (ENV-018MD-EMS, med associates,
Inc.) isolated from light, sounds, and electrical noise.
The training procedure (6-8 weeks) was performed daily with an interruption of one day
per week during which mice had free access to water. The training was divided in 3 steps
as follows:
- step1: Mice learned to respond to the Go-Cue sound by licking, within 1.5 seconds
after the cue onset, on a single tube located in front of them to obtain a water
droplet.
- step2: Mice learned the association between a mild air puff (oriented pseudo-
randomly at each trial toward either the left or the right whiskers) and the reward
side (left or right lick-port tube corresponding to the side of the previous air puff).
An algorithm allowed to prevent for side preference, such that if a mouse exhibited
a preference for executing trials to one side, the probability of trials to the other side
was automatically increased to enforce correct execution of trials to both sides.
- step 3: Mice learned to withhold their response during a delay periods (increasing
by step of 250ms until 750ms). Step transition occurred when 70% performance
criterion was reached. In each step, errors (licking to early or wrong side) were
signaled by an error sound and followed by a time penalty (6s).
Electrophysiological data acquisition
Electrophysiological signals were obtained by acute insertion of silicon probes made of
four shanks separated by 200µm with eight channels per shank separated by 100µm
(A4x8-7mm-100-200-177, Neuronexus Inc). Neurons were recorded in the VM and VAL
thalamus (AP: -1.25 +/-0.25 mm; ML: -0.75 +/-0.25mm; DV: -4.45 +/-0.45mm; relative to
Bregma). Recordings were started 20 minutes after probe insertion to allow the
electrode/brain interface to stabilize. A 200µm diameter optic fiber (0.22 NA) was
mounted 200µm above the first channel on the 3rd shank. An internal reference channel
was located 200µm above the 1st channel on the 2nd shank. Skull screws were cemented
above the cerebellum and used as ground and external reference in case the internal
reference would fail.
Data from electrodes and behavioral data from the task were both acquired
simultaneously at 20KHz through an RHD2000 recording system (Intan Technologies).
Electrophysiological data were notch-filtered at 60Hz. Video data (Figure S2) of the
mouse licking the tubes were acquired at 25Hz (Basler acA1300 camera), under infrared
author/funder. All rights reserved. No reuse allowed without permission. The copyright holder for this preprint (which was not peer-reviewed) is the. https://doi.org/10.1101/2020.01.12.903500doi: bioRxiv preprint
24
LED illumination. Recording of 100 frames was triggered at each trial start (Air-Puff TTL
rising edge).
Pre-processing and analysis of neuronal data
We used Matlab (Mathworks Inc) for all data pre-processing and data analysis. Spike
extractions and spike sorting was obtained using Wave-Clust a method for spike detection
(pass band filter; fmin=600, fmax=8000; detection threshold: stdmin=4, stdmax=30, filter
order =4) and sorting (fmin=300, fmax=4000, filter order=2) with wavelets and
superparamagnetic clustering (Quiroga, 2004, 2012). Each spike was represented by 40
points centered on the minimum value and had a 3ms minimum refractory period. After
the automatized procedure, each cluster was re-inspected to prevent from potential type
1 or type 2 errors as well as to eliminate poorly defined or noisy clusters.
Peri-event time histogram and raster plot were centered on task event onset (Delay,
GO-Cue, Licks).
All z-scores were obtained by subtracting the baseline average firing rate (frB) from each
value of the trial averaged instantaneous firing rate (frT) and divided by the trial average
firing rate standard deviation (sdT).
𝑍𝑠𝑐𝑜𝑟𝑒 = (𝑓𝑟𝑇– 𝑓𝑟𝐵)/𝑠𝑑𝑇;
dZ are obtained by subtracting z-scores (e.g. dZ = Zomi - Zcor).
𝑑𝑍 = 𝑍𝑠𝑐𝑜𝑟𝑒1 – 𝑍𝑠𝑐𝑜𝑟𝑒2;
All classifiers were computed using fitclinear (matlab), with a Logistic learner and 10-fold
cross validation. For figure 6 and S6, only sessions with at least 5 impulsive and 5
omission trials were used. Note that in Figure S6 sessions have different number of cells.
In order to compute the average, for figure 6, only sessions with at least 9 SvTh- cells
recorded simultaneously were used to compute the SvTh- curves. Only sessions with at
least 15 NOL cells recorded simultaneously were used to compute the NOL curves. Only
sessions with at least 20 VM/VAL cells recorded simultaneously were used to compute
the shuffle curves. Because for this particular analysis the number of averaged values
are limited by the session with the least number of cells we arbitrarily set these number
in order to maximize both the number of sessions and the number of cells in the x axis.
Optogenetic stimulation and analysis for photo-tagging
For all photostimulation experiments, we used a blue laser (Dream Laser Inc, 473nm;
10+/-3mW at fiber end). An optic fiber patch cord (Doric Lenses; 200m diameter;
0.22NA) was directly attached to the optrode (Neuronexus; 200m diameter; 0.22NA)
with a ceramic sleeve. Aluminum foil was carefully wrapped around the sleeve to prevent
light spread to the animal’s eyes.
author/funder. All rights reserved. No reuse allowed without permission. The copyright holder for this preprint (which was not peer-reviewed) is the. https://doi.org/10.1101/2020.01.12.903500doi: bioRxiv preprint
25
In-Task optogenetic stimulation consisted of 1 second long continuous pulses.
Optogenetic stimuli were delivered randomly in 20% of the trials. The pulse always started
500ms before the Go-Cue during the delay period (Figure 4A).
Pre and post-task optogenetic stimuli were used for post-hoc photo-tagging (Figures 3,
4 and 6), and consisted of a series of 1.5 second pulses separated by 1.5 second inter-
pulse-intervals (Figure 1D). The post-task stimulation started 1-2 minutes after the
behavioral task recording was stopped without moving the optrode position. The data
from the task, pre-task and post-task were recorded continuously such that spike sorting
was performed in one block for the entire recording. We statistically compared the spike
count during 2 conditions, laser ON versus laser OFF (Wilcoxon test, alpha = 5%; nstim
= 54 +/- 30 pulses per session; mean +/- SD), neurons with significant difference were
considered opto-responsive. We create three categories of VM/VAL photo-tagged
neurons: ‘SvTh-‘ when frON<frOFF; ‘SvTh+’ when frON>frOFF and “Thal NOL” when no
frON and FrOFF were not significantly different.
Histology
At the end of the last recording session, mice were euthanized by an overdose of
ketamine (i.p.), then perfused (i.c.) with phosphate buffered saline (PBS 1X) then with
paraformaldehyde (PFA 4% in PBS) for tissue fixation. The brain was extracted and put
in a 4% PFA solution overnight before being transferred in a 30% sucrose solution for
storage at 4°C.
Brains were sliced (40µm) using a microtome and stained with 2 different methods: Nissl
(Cresyl violet) and immunohistologically using anti-GFP (peroxidase). We used confocal
imaging to observe GFP fluorescence on unstained slices.
QUANTIFICATION AND STATISTICAL ANALYSIS
Specifics on the statistical methodologies and software used for various analyses are
described in the corresponding sections in Results, Methods, Figure Legends, and
Supplemental Figures. Statistical test results are described as significant in the text where
p < 0.05. (* <0.05. **<0.005 ***<0.0005). Bonferroni correction was applied when multiple
comparisons. All shaded areas indicate two SEM except when specified otherwise in the
text/legend. Numerical values obtain by averaging are denoted as follow: Mean +/- SD.
DATA AND SOFTWARE AVAILABILITY
Data and codes from this study are available from the corresponding authors upon
request.
author/funder. All rights reserved. No reuse allowed without permission. The copyright holder for this preprint (which was not peer-reviewed) is the. https://doi.org/10.1101/2020.01.12.903500doi: bioRxiv preprint
26
SUPPLEMENTARY FIGURES:
Supplementary Figure S1
A. 3D Scatter plot of the position of each channel containing at least one cell. the color codes indicate the
populations types defined by photo-tagging. AP, Antero-Posterior; ML, Medio-Lateral, DV, Dorso-Ventral.
B. Histogram of the distribution of both SvTh- (cyan) and SvTh+ (magenta) cell type’s recorded coordinates
(AP, Antero-Posterior; ML, Medio-Lateral, DV, Dorso-Ventral). Only p-values <0.05 are displayed (Wilcoxon
test; α=5%).
C. Representative examples reconstructed localization of SvTh-, SvTh+, and NOL cells types, within the
corresponding Allen Atlas coronal section of the left hemisphere. ventro-medial thalamus (VM, Red area)
and ventro-antero-lateral thalamus (VAL, dark blue area). Each colored dot represents a recording channel
from the 4 shanks silicon probes. color code as in A. VM/VAL NOL are black circle filled black. Black circle
(filled white) are channels that were not recorded.
author/funder. All rights reserved. No reuse allowed without permission. The copyright holder for this preprint (which was not peer-reviewed) is the. https://doi.org/10.1101/2020.01.12.903500doi: bioRxiv preprint
27
FIGURE S2: VIDEO
author/funder. All rights reserved. No reuse allowed without permission. The copyright holder for this preprint (which was not peer-reviewed) is the. https://doi.org/10.1101/2020.01.12.903500doi: bioRxiv preprint
28
Supplementary Figure S3
A and B. 3D Scatter plot (A) and corresponding Histogram (B) from the populations types defined by the
color code: blue, task excited and red task inhibited.
C and D. 3D Scatter plot (C) and corresponding Histogram (D) from the populations types defined by the
color code: blue for sample prefered activity; orange for delay prefered activity and yellow for response
prefered activity.
E and F. 3D Scatter plot (E) and corresponding Histogram (F) from the populations types defined by the
color code: blue for Uni-modal; red for Bi-modal and green for Tri-Modal.
Only Bonferroni corrected p-values<0.05 are displayed (two sided Wilcoxon rank sum test ; α=5%).
author/funder. All rights reserved. No reuse allowed without permission. The copyright holder for this preprint (which was not peer-reviewed) is the. https://doi.org/10.1101/2020.01.12.903500doi: bioRxiv preprint
29
Supplementary Figure S4
A. Comparing average electrophysiological activity between trials with or without optical SNr terminal activation during the delay period for neurons without significant response to optical stimulation outside the task (NOL) B. Same as A but for SvTh+ cell group. C. Same but for ALL response types (SvTh-, NOL, SvTH+) combined. D. Difference in contra-ipsi ratio between opto trials (Ro/Lo) and non-opto trials (R/L). We used the same behavioral sessions as in Figure4B. We find no statistical biais toward ipsilatertal or contralateral trials (One-sample, two sided ttest, alpha 5%). E. Averaged z-scored firing rate of SvTh- neurons during correct contralatral trials, comparing opto trials (light blue) versus non-opto trials (dark blue). Vertical dashed lines indicates sample, dealy and response epoch repective onsets. Horizontal dashed line represent the baseline firing rate F. Same as E but for ipsilateral trials.
author/funder. All rights reserved. No reuse allowed without permission. The copyright holder for this preprint (which was not peer-reviewed) is the. https://doi.org/10.1101/2020.01.12.903500doi: bioRxiv preprint
30
Supplementary Figure S5
A. 3D Scatter plot of the of recording sites spatial coordinates within the thalamic area implanted. A code
color indicate the cell type population based on their preferred response during delay of omission trials
(blue) and impulsive trials (red). B. Histogram corresponding to B. The spatial distribution of omi and imp are not significantly different from
each other (two sided Wilcoxon rank sum test ; α=5%). AP: anteroposterior; ML: mediolateral; DV:
dorsoventral;
author/funder. All rights reserved. No reuse allowed without permission. The copyright holder for this preprint (which was not peer-reviewed) is the. https://doi.org/10.1101/2020.01.12.903500doi: bioRxiv preprint
31
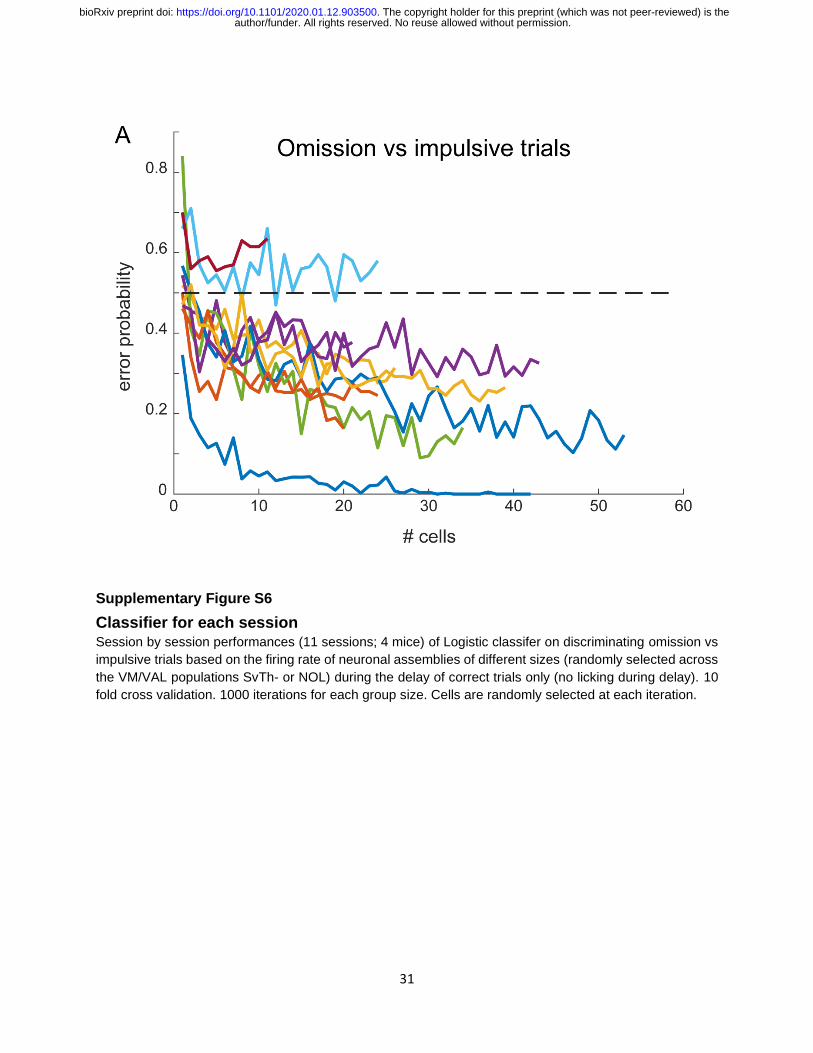
Supplementary Figure S6
Classifier for each session Session by session performances (11 sessions; 4 mice) of Logistic classifer on discriminating omission vs
impulsive trials based on the firing rate of neuronal assemblies of different sizes (randomly selected across
the VM/VAL populations SvTh- or NOL) during the delay of correct trials only (no licking during delay). 10
fold cross validation. 1000 iterations for each group size. Cells are randomly selected at each iteration.
author/funder. All rights reserved. No reuse allowed without permission. The copyright holder for this preprint (which was not peer-reviewed) is the. https://doi.org/10.1101/2020.01.12.903500doi: bioRxiv preprint