Embed Size (px)
Citation preview
UNITED STATESSECURITIES AND EXCHANGE COMMISSION
WASHINGTON, D.C. 20549
FORM 10-Q(Mark One)
☑ QUARTERLY REPORT PURSUANT TO SECTION 13 OR 15(d) OF THE SECURITIES EXCHANGE ACT OF 1934For the Quarterly Period Ended November 30, 2018
☐ TRANSITION REPORT PURSUANT TO SECTION 13 OR 15(d) OF THE SECURITIES EXCHANGE ACT OF 1934For the transition period from to
Commission File Number: 001-10635
NIKE, Inc.(Exact name of registrant as specified in its charter)
OREGON 93-0584541
(State or other jurisdiction ofincorporation or organization) (I.R.S. Employer
Identification No.)
One Bowerman Drive,Beaverton, Oregon 97005-6453
(Address of principal executive offices) (Zip Code)
Registrant ’ s telephone number, including area code: (503) 671-6453
Indicate by check mark whether the registrant (1) has filed all reports required to be filed by Section 13 or 15(d) of the Securities Exchange Act of 1934 during the preceding 12 months (or forsuch shorter period that the registrant was required to file such reports), and (2) has been subject to such filing requirements for the past 90 days. Yes ☑ No ☐
Indicate by check mark whether the registrant has submitted electronically and posted on its corporate Web site, if any, every Interactive Data File required to be submitted and posted pursuantto Rule 405 of Regulation S-T (§ 232.405 of this chapter) during the preceding 12 months (or for such shorter period that the registrant was required to submit and post such files). Yes ☑ No ☐
Indicate by check mark whether the registrant is a large accelerated filer, an accelerated filer, a non-accelerated filer, a smaller reporting company or an emerging growth company. See thedefinitions of “large accelerated filer,” “accelerated filer,” “smaller reporting company” and “emerging growth company” in Rule 12b-2 of the Exchange Act.
Large accelerated filer ☑ Accelerated filer ☐ Smaller reporting company ☐
Non-accelerated filer ☐ (Do not check if a smaller reporting company) Emerging growth company ☐
If an emerging growth company, indicate by check mark if the registrant has elected not to use the extended transition period for complying with any new or revised financial accountingstandards provided pursuant to Section 13(a) of the Exchange Act. ☐
Indicate by check mark whether the registrant is a shell company (as defined in Rule 12b-2 of the Exchange Act). Yes ☐ No ☑
Shares of Common Stock outstanding as of January 3, 2019 were:
Class A 315,024,752Class B 1,258,772,793 1,573,797,545
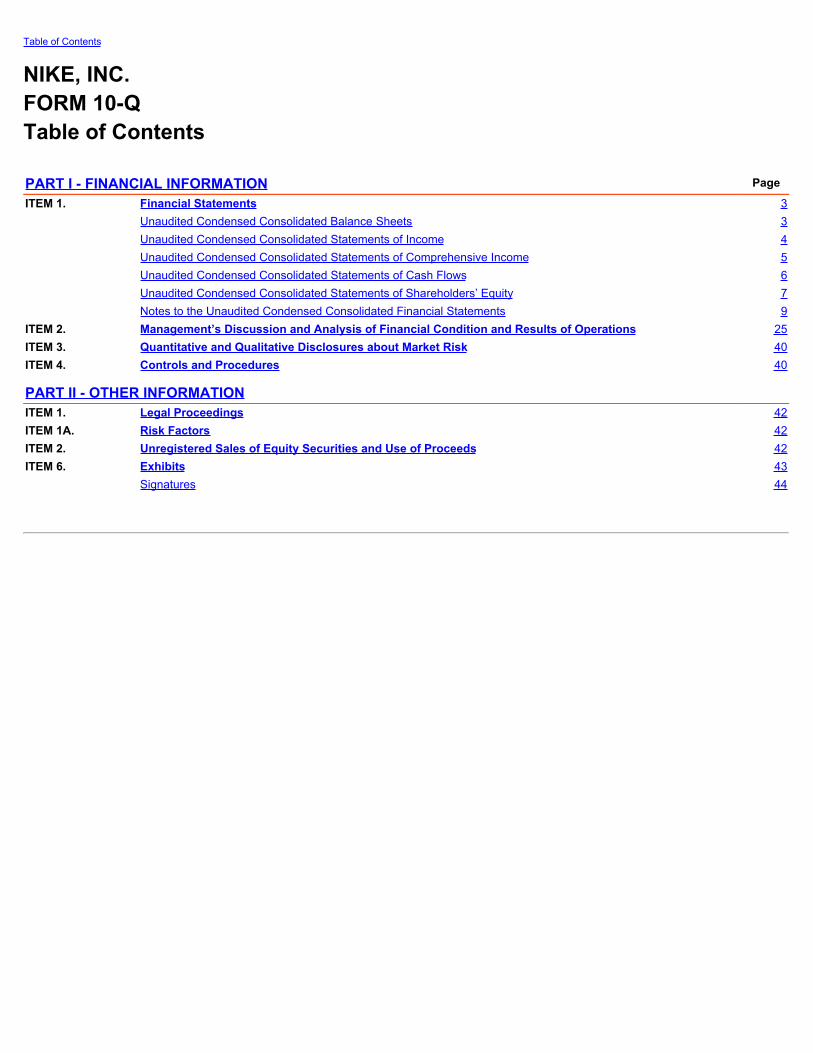
Table of Contents
NIKE, INC.FORM 10-QTable of Contents
PART I - FINANCIAL INFORMATION PageITEM 1. Financial Statements 3 Unaudited Condensed Consolidated Balance Sheets 3 Unaudited Condensed Consolidated Statements of Income 4 Unaudited Condensed Consolidated Statements of Comprehensive Income 5 Unaudited Condensed Consolidated Statements of Cash Flows 6 Unaudited Condensed Consolidated Statements of Shareholders’ Equity 7 Notes to the Unaudited Condensed Consolidated Financial Statements 9ITEM 2. Management’s Discussion and Analysis of Financial Condition and Results of Operations 25ITEM 3. Quantitative and Qualitative Disclosures about Market Risk 40ITEM 4. Controls and Procedures 40 PART II - OTHER INFORMATION ITEM 1. Legal Proceedings 42ITEM 1A. Risk Factors 42ITEM 2. Unregistered Sales of Equity Securities and Use of Proceeds 42ITEM 6. Exhibits 43 Signatures 44
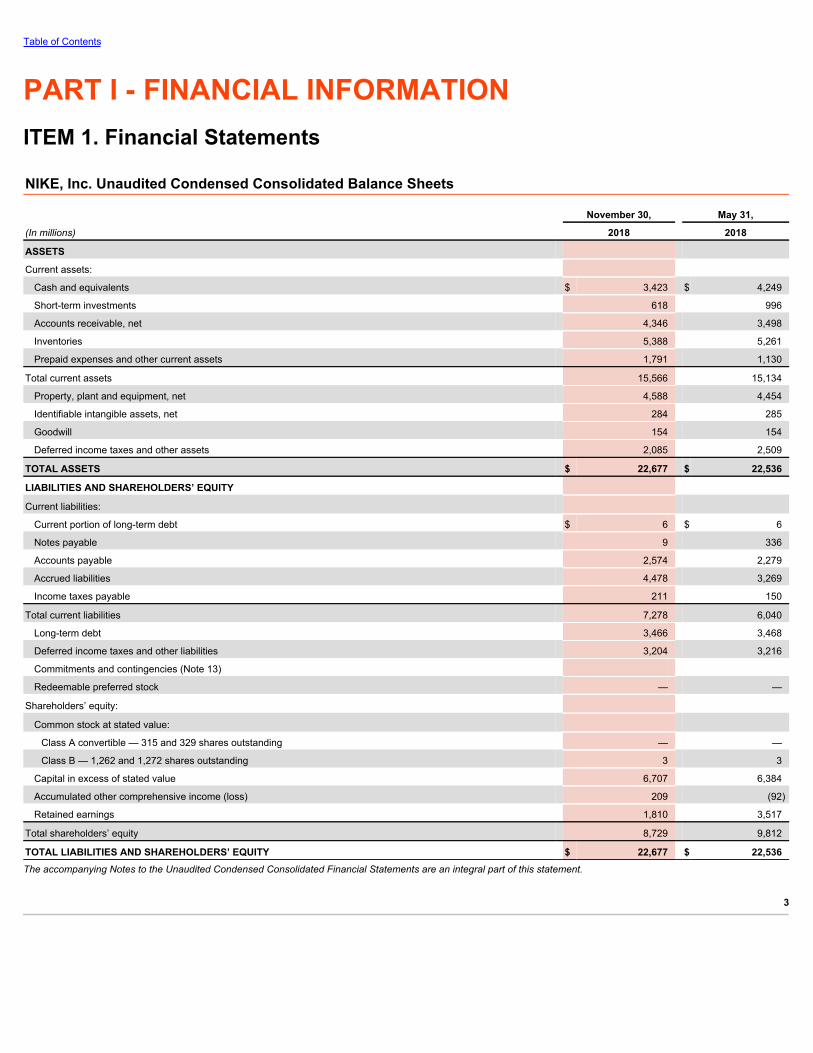
Table of Contents
PART I - FINANCIAL INFORMATIONITEM 1. Financial Statements
NIKE, Inc. Unaudited Condensed Consolidated Balance Sheets
November 30, May 31,
(In millions) 2018 2018
ASSETS
Current assets:
Cash and equivalents $ 3,423 $ 4,249
Short-term investments 618 996
Accounts receivable, net 4,346 3,498
Inventories 5,388 5,261
Prepaid expenses and other current assets 1,791 1,130
Total current assets 15,566 15,134
Property, plant and equipment, net 4,588 4,454
Identifiable intangible assets, net 284 285
Goodwill 154 154
Deferred income taxes and other assets 2,085 2,509
TOTAL ASSETS $ 22,677 $ 22,536
LIABILITIES AND SHAREHOLDERS’ EQUITY
Current liabilities:
Current portion of long-term debt $ 6 $ 6
Notes payable 9 336
Accounts payable 2,574 2,279
Accrued liabilities 4,478 3,269
Income taxes payable 211 150
Total current liabilities 7,278 6,040
Long-term debt 3,466 3,468
Deferred income taxes and other liabilities 3,204 3,216
Commitments and contingencies (Note 13)
Redeemable preferred stock — —
Shareholders’ equity:
Common stock at stated value:
Class A convertible — 315 and 329 shares outstanding — —
Class B — 1,262 and 1,272 shares outstanding 3 3
Capital in excess of stated value 6,707 6,384
Accumulated other comprehensive income (loss) 209 (92)
Retained earnings 1,810 3,517
Total shareholders’ equity 8,729 9,812
TOTAL LIABILITIES AND SHAREHOLDERS’ EQUITY $ 22,677 $ 22,536The accompanying Notes to the Unaudited Condensed Consolidated Financial Statements are an integral part of this statement.
3
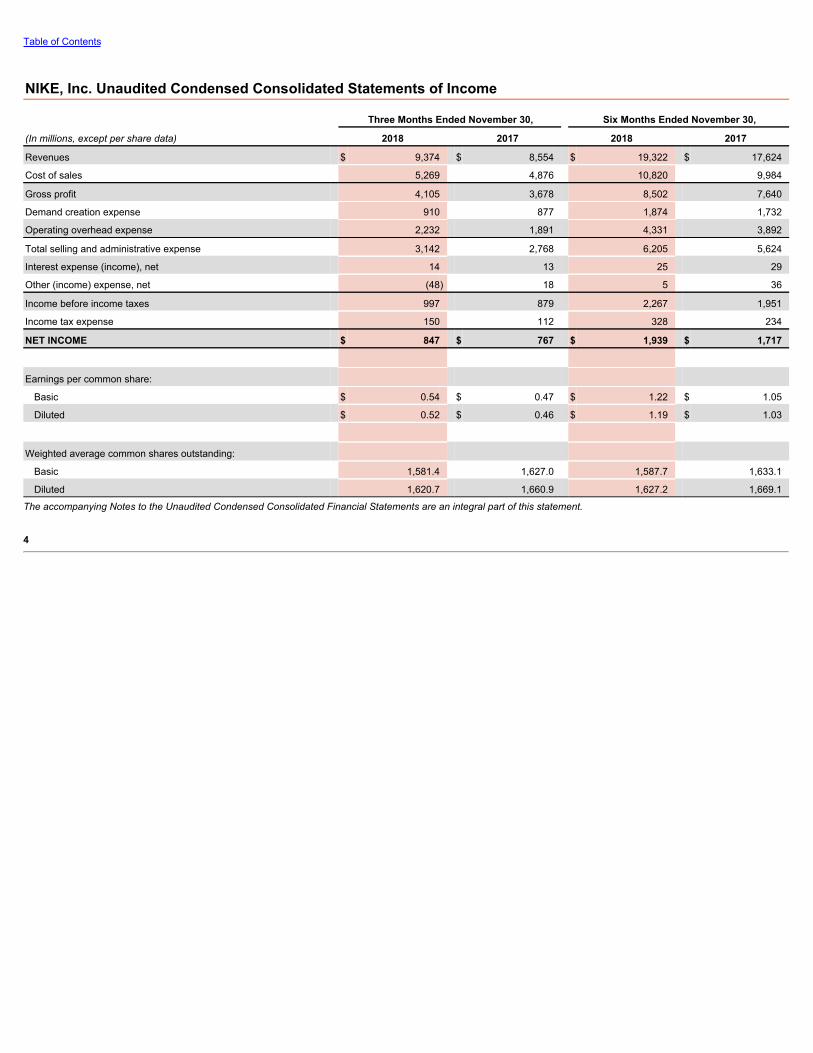
Table of Contents
NIKE, Inc. Unaudited Condensed Consolidated Statements of Income
Three Months Ended November 30, Six Months Ended November 30,
(In millions, except per share data) 2018 2017 2018 2017
Revenues $ 9,374 $ 8,554 $ 19,322 $ 17,624
Cost of sales 5,269 4,876 10,820 9,984
Gross profit 4,105 3,678 8,502 7,640
Demand creation expense 910 877 1,874 1,732
Operating overhead expense 2,232 1,891 4,331 3,892
Total selling and administrative expense 3,142 2,768 6,205 5,624
Interest expense (income), net 14 13 25 29
Other (income) expense, net (48) 18 5 36
Income before income taxes 997 879 2,267 1,951
Income tax expense 150 112 328 234
NET INCOME $ 847 $ 767 $ 1,939 $ 1,717
Earnings per common share:
Basic $ 0.54 $ 0.47 $ 1.22 $ 1.05
Diluted $ 0.52 $ 0.46 $ 1.19 $ 1.03
Weighted average common shares outstanding:
Basic 1,581.4 1,627.0 1,587.7 1,633.1
Diluted 1,620.7 1,660.9 1,627.2 1,669.1
The accompanying Notes to the Unaudited Condensed Consolidated Financial Statements are an integral part of this statement.
4
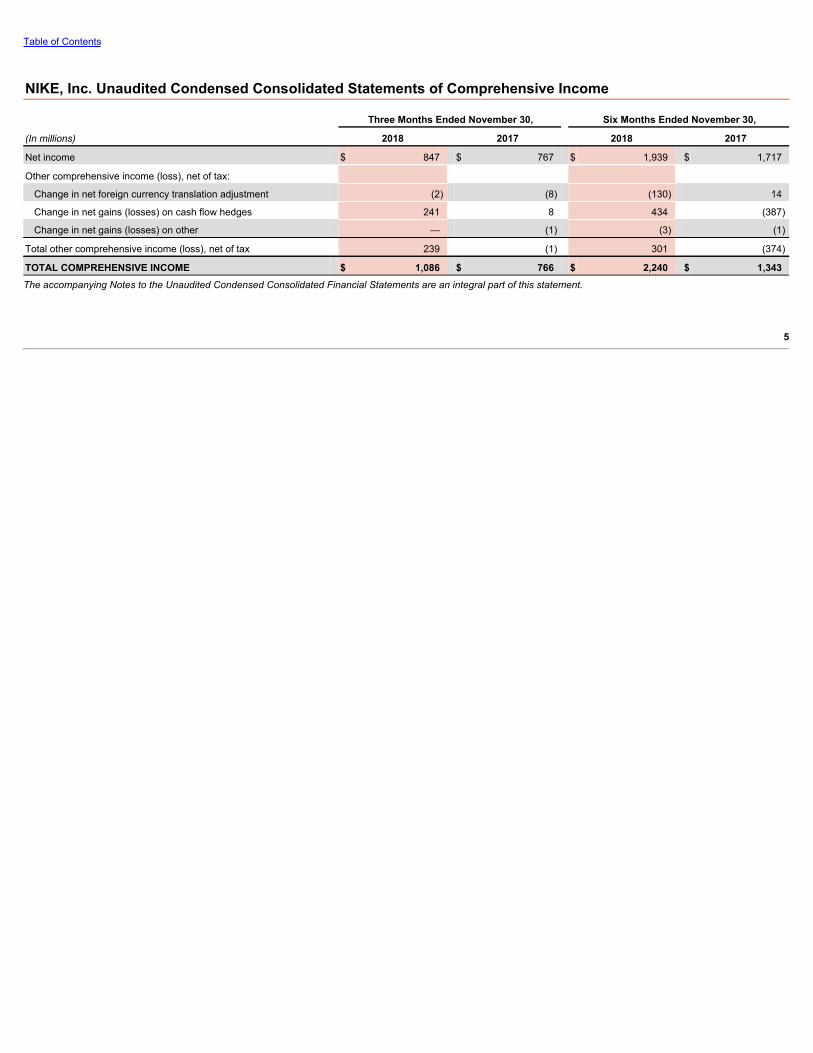
Table of Contents
NIKE, Inc. Unaudited Condensed Consolidated Statements of Comprehensive Income
Three Months Ended November 30, Six Months Ended November 30,
(In millions) 2018 2017 2018 2017
Net income $ 847 $ 767 $ 1,939 $ 1,717
Other comprehensive income (loss), net of tax:
Change in net foreign currency translation adjustment (2) (8) (130) 14
Change in net gains (losses) on cash flow hedges 241 8 434 (387)
Change in net gains (losses) on other — (1) (3) (1)
Total other comprehensive income (loss), net of tax 239 (1) 301 (374)
TOTAL COMPREHENSIVE INCOME $ 1,086 $ 766 $ 2,240 $ 1,343The accompanying Notes to the Unaudited Condensed Consolidated Financial Statements are an integral part of this statement.
5
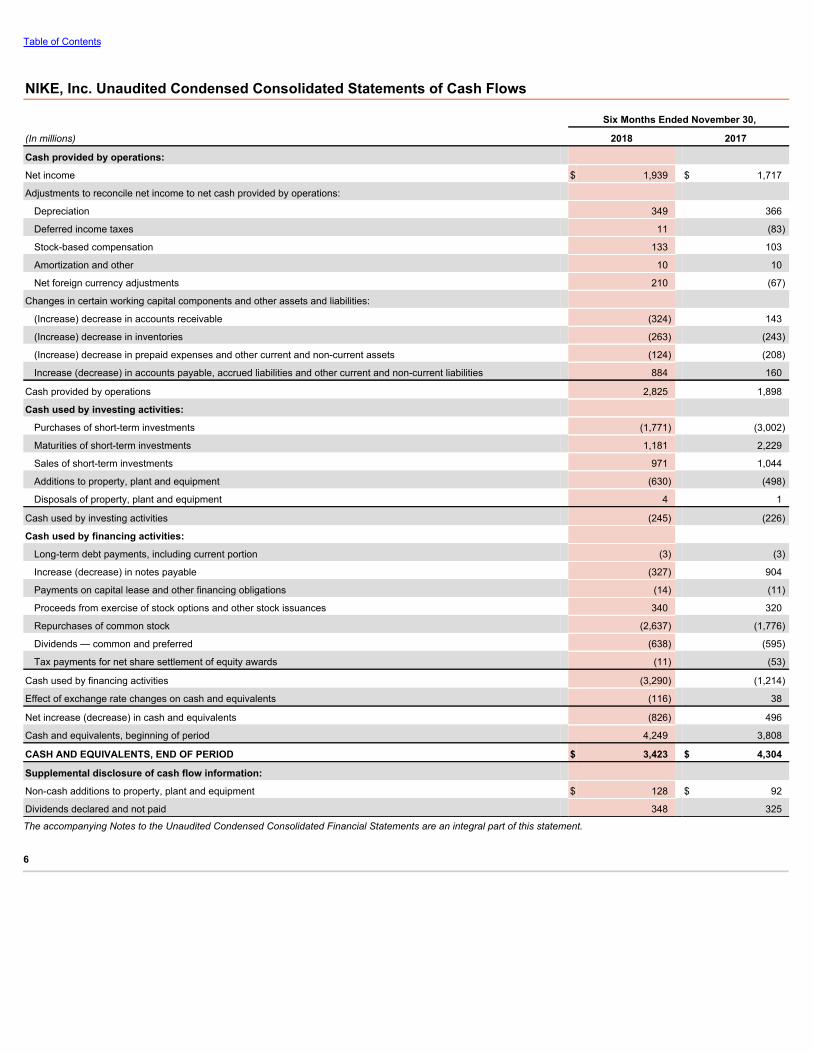
Table of Contents
NIKE, Inc. Unaudited Condensed Consolidated Statements of Cash Flows
Six Months Ended November 30,
(In millions) 2018 2017
Cash provided by operations:
Net income $ 1,939 $ 1,717
Adjustments to reconcile net income to net cash provided by operations:
Depreciation 349 366
Deferred income taxes 11 (83)
Stock-based compensation 133 103
Amortization and other 10 10
Net foreign currency adjustments 210 (67)
Changes in certain working capital components and other assets and liabilities:
(Increase) decrease in accounts receivable (324) 143
(Increase) decrease in inventories (263) (243)
(Increase) decrease in prepaid expenses and other current and non-current assets (124) (208)
Increase (decrease) in accounts payable, accrued liabilities and other current and non-current liabilities 884 160
Cash provided by operations 2,825 1,898
Cash used by investing activities:
Purchases of short-term investments (1,771) (3,002)
Maturities of short-term investments 1,181 2,229
Sales of short-term investments 971 1,044
Additions to property, plant and equipment (630) (498)
Disposals of property, plant and equipment 4 1
Cash used by investing activities (245) (226)
Cash used by financing activities:
Long-term debt payments, including current portion (3) (3)
Increase (decrease) in notes payable (327) 904
Payments on capital lease and other financing obligations (14) (11)
Proceeds from exercise of stock options and other stock issuances 340 320
Repurchases of common stock (2,637) (1,776)
Dividends — common and preferred (638) (595)
Tax payments for net share settlement of equity awards (11) (53)
Cash used by financing activities (3,290) (1,214)
Effect of exchange rate changes on cash and equivalents (116) 38
Net increase (decrease) in cash and equivalents (826) 496
Cash and equivalents, beginning of period 4,249 3,808
CASH AND EQUIVALENTS, END OF PERIOD $ 3,423 $ 4,304
Supplemental disclosure of cash flow information:
Non-cash additions to property, plant and equipment $ 128 $ 92
Dividends declared and not paid 348 325
The accompanying Notes to the Unaudited Condensed Consolidated Financial Statements are an integral part of this statement.
6
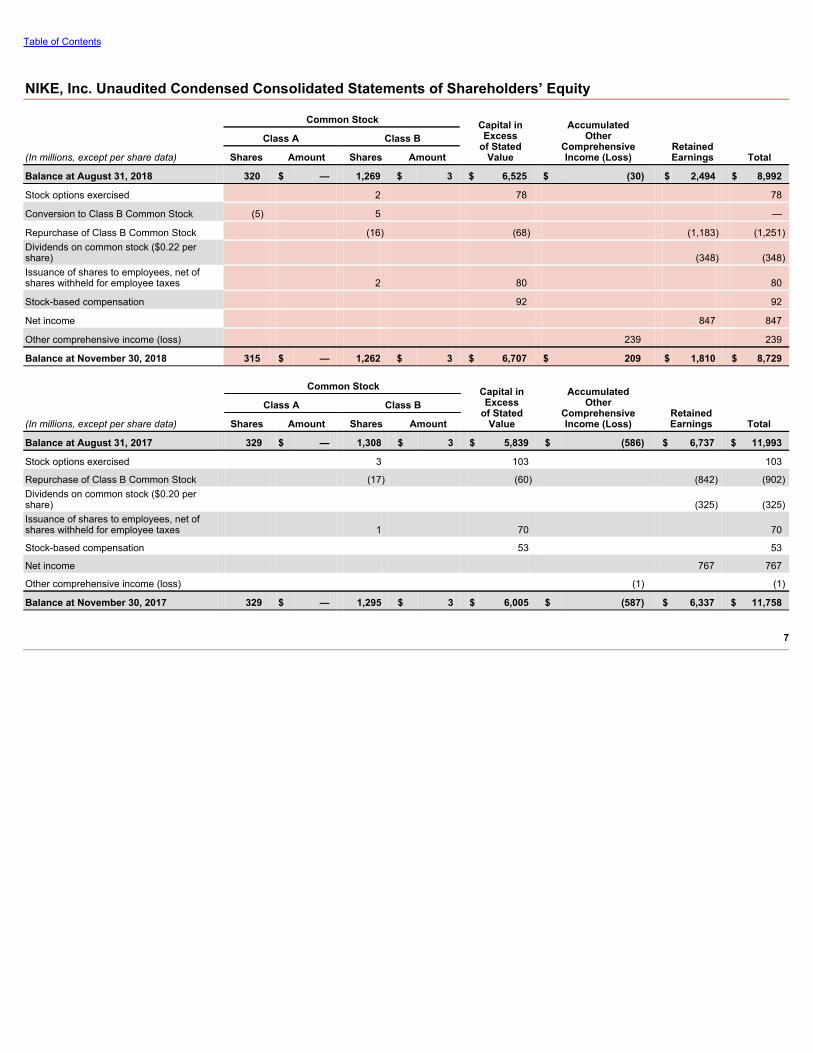
Table of Contents
NIKE, Inc. Unaudited Condensed Consolidated Statements of Shareholders’ Equity
Common Stock Capital inExcess
of StatedValue
AccumulatedOther
ComprehensiveIncome (Loss)
RetainedEarnings Total
Class A Class B
(In millions, except per share data) Shares Amount Shares Amount
Balance at August 31, 2018 320 $ — 1,269 $ 3 $ 6,525 $ (30) $ 2,494 $ 8,992
Stock options exercised 2 78 78
Conversion to Class B Common Stock (5) 5 —
Repurchase of Class B Common Stock (16) (68) (1,183) (1,251)Dividends on common stock ($0.22 pershare) (348) (348)Issuance of shares to employees, net ofshares withheld for employee taxes 2 80 80
Stock-based compensation 92 92
Net income 847 847
Other comprehensive income (loss) 239 239
Balance at November 30, 2018 315 $ — 1,262 $ 3 $ 6,707 $ 209 $ 1,810 $ 8,729
Common Stock Capital inExcess
of StatedValue
AccumulatedOther
ComprehensiveIncome (Loss)
RetainedEarnings Total
Class A Class B
(In millions, except per share data) Shares Amount Shares Amount
Balance at August 31, 2017 329 $ — 1,308 $ 3 $ 5,839 $ (586) $ 6,737 $ 11,993
Stock options exercised 3 103 103
Repurchase of Class B Common Stock (17) (60) (842) (902)Dividends on common stock ($0.20 pershare) (325) (325)Issuance of shares to employees, net ofshares withheld for employee taxes 1 70 70
Stock-based compensation 53 53
Net income 767 767
Other comprehensive income (loss) (1) (1)
Balance at November 30, 2017 329 $ — 1,295 $ 3 $ 6,005 $ (587) $ 6,337 $ 11,758
7
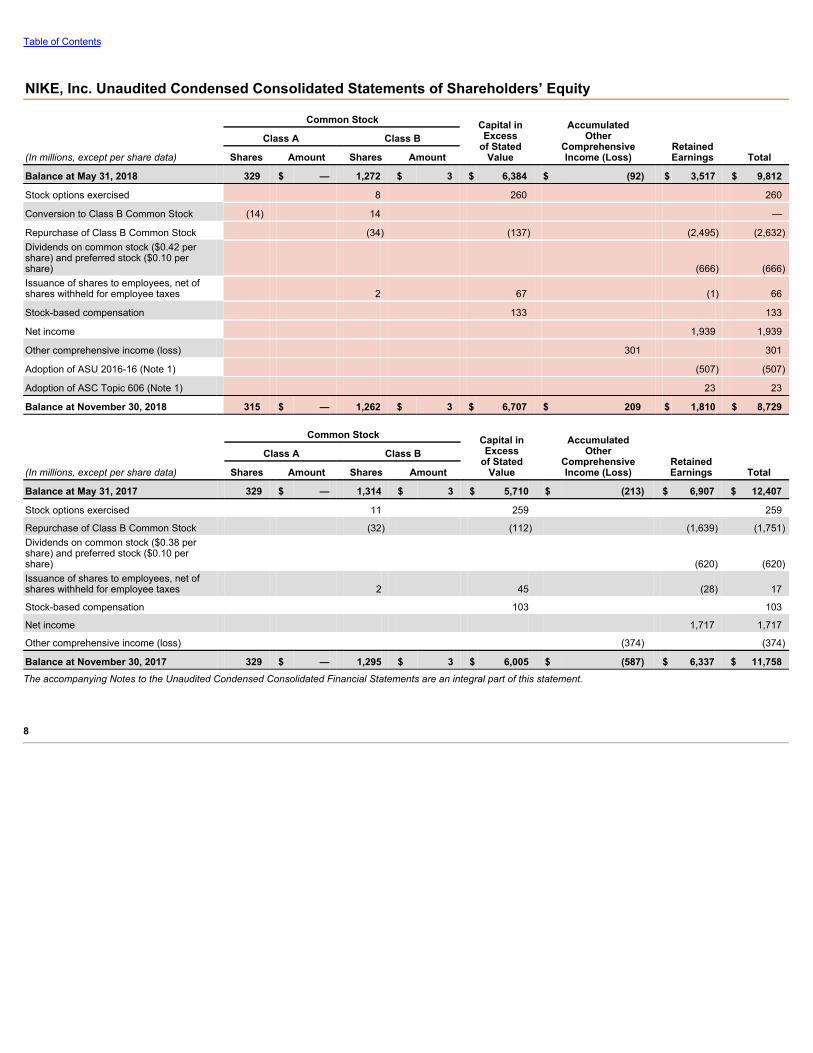
Table of Contents
NIKE, Inc. Unaudited Condensed Consolidated Statements of Shareholders’ Equity
Common Stock Capital inExcess
of StatedValue
AccumulatedOther
ComprehensiveIncome (Loss)
RetainedEarnings Total
Class A Class B
(In millions, except per share data) Shares Amount Shares Amount
Balance at May 31, 2018 329 $ — 1,272 $ 3 $ 6,384 $ (92) $ 3,517 $ 9,812
Stock options exercised 8 260 260
Conversion to Class B Common Stock (14) 14 —
Repurchase of Class B Common Stock (34) (137) (2,495) (2,632)Dividends on common stock ($0.42 pershare) and preferred stock ($0.10 pershare) (666) (666)Issuance of shares to employees, net ofshares withheld for employee taxes 2 67 (1) 66
Stock-based compensation 133 133
Net income 1,939 1,939
Other comprehensive income (loss) 301 301
Adoption of ASU 2016-16 (Note 1) (507) (507)
Adoption of ASC Topic 606 (Note 1) 23 23
Balance at November 30, 2018 315 $ — 1,262 $ 3 $ 6,707 $ 209 $ 1,810 $ 8,729
Common Stock Capital inExcess
of StatedValue
AccumulatedOther
ComprehensiveIncome (Loss)
RetainedEarnings Total
Class A Class B
(In millions, except per share data) Shares Amount Shares Amount
Balance at May 31, 2017 329 $ — 1,314 $ 3 $ 5,710 $ (213) $ 6,907 $ 12,407
Stock options exercised 11 259 259
Repurchase of Class B Common Stock (32) (112) (1,639) (1,751)Dividends on common stock ($0.38 pershare) and preferred stock ($0.10 pershare) (620) (620)Issuance of shares to employees, net ofshares withheld for employee taxes 2 45 (28) 17
Stock-based compensation 103 103
Net income 1,717 1,717
Other comprehensive income (loss) (374) (374)
Balance at November 30, 2017 329 $ — 1,295 $ 3 $ 6,005 $ (587) $ 6,337 $ 11,758The accompanying Notes to the Unaudited Condensed Consolidated Financial Statements are an integral part of this statement.
8

Table of Contents
Notes to the Unaudited Condensed Consolidated Financial Statements
Note 1 Summary of Significant Accounting Policies 10Note 2 Inventories 11Note 3 Accrued Liabilities 11Note 4 Fair Value Measurements 11Note 5 Short-Term Borrowings and Credit Lines 14Note 6 Income Taxes 14Note 7 Common Stock and Stock-Based Compensation 14Note 8 Earnings Per Share 15Note 9 Risk Management and Derivatives 15Note 10 Accumulated Other Comprehensive Income (Loss) 19Note 11 Revenues 21Note 12 Operating Segments 23Note 13 Commitments and Contingencies 24
9
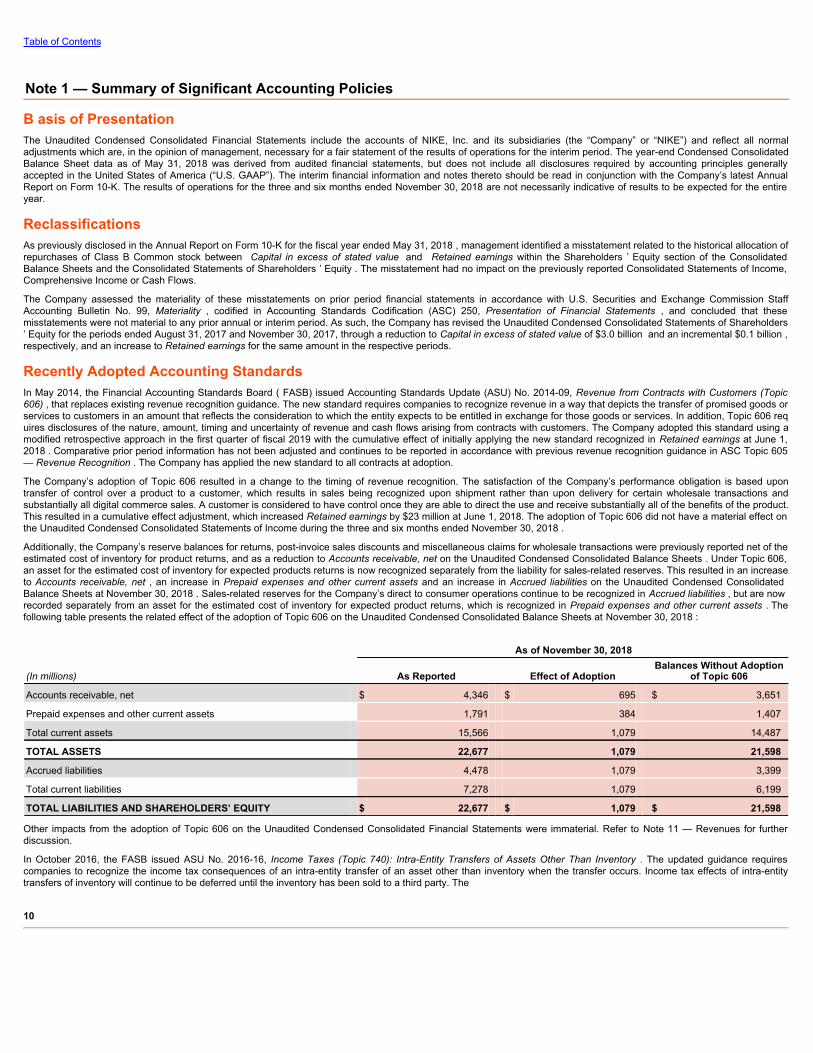
Table of Contents
Note 1 — Summary of Significant Accounting Policies
B asis of PresentationThe Unaudited Condensed Consolidated Financial Statements include the accounts of NIKE, Inc. and its subsidiaries (the “Company” or “NIKE”) and reflect all normaladjustments which are, in the opinion of management, necessary for a fair statement of the results of operations for the interim period. The year-end Condensed ConsolidatedBalance Sheet data as of May 31, 2018 was derived from audited financial statements, but does not include all disclosures required by accounting principles generallyaccepted in the United States of America (“U.S. GAAP”). The interim financial information and notes thereto should be read in conjunction with the Company’s latest AnnualReport on Form 10-K. The results of operations for the three and six months ended November 30, 2018 are not necessarily indicative of results to be expected for the entireyear.
ReclassificationsAs previously disclosed in the Annual Report on Form 10-K for the fiscal year ended May 31, 2018 , management identified a misstatement related to the historical allocation ofrepurchases of Class B Common stock between Capital in excess of stated value and Retained earnings within the Shareholders ’ Equity section of the ConsolidatedBalance Sheets and the Consolidated Statements of Shareholders ’ Equity . The misstatement had no impact on the previously reported Consolidated Statements of Income,Comprehensive Income or Cash Flows.
The Company assessed the materiality of these misstatements on prior period financial statements in accordance with U.S. Securities and Exchange Commission StaffAccounting Bulletin No. 99, Materiality , codified in Accounting Standards Codification (ASC) 250, Presentation of Financial Statements , and concluded that thesemisstatements were not material to any prior annual or interim period. As such, the Company has revised the Unaudited Condensed Consolidated Statements of Shareholders’ Equity for the periods ended August 31, 2017 and November 30, 2017, through a reduction to Capital in excess of stated value of $3.0 billion and an incremental $0.1 billion ,respectively, and an increase to Retained earnings for the same amount in the respective periods.
Recently Adopted Accounting StandardsIn May 2014, the Financial Accounting Standards Board ( FASB) issued Accounting Standards Update (ASU) No. 2014-09, Revenue from Contracts with Customers (Topic606) , that replaces existing revenue recognition guidance. The new standard requires companies to recognize revenue in a way that depicts the transfer of promised goods orservices to customers in an amount that reflects the consideration to which the entity expects to be entitled in exchange for those goods or services. In addition, Topic 606 requires disclosures of the nature, amount, timing and uncertainty of revenue and cash flows arising from contracts with customers. The Company adopted this standard using amodified retrospective approach in the first quarter of fiscal 2019 with the cumulative effect of initially applying the new standard recognized in Retained earnings at June 1,2018 . Comparative prior period information has not been adjusted and continues to be reported in accordance with previous revenue recognition guidance in ASC Topic 605— Revenue Recognition . The Company has applied the new standard to all contracts at adoption.
The Company’s adoption of Topic 606 resulted in a change to the timing of revenue recognition. The satisfaction of the Company’s performance obligation is based upontransfer of control over a product to a customer, which results in sales being recognized upon shipment rather than upon delivery for certain wholesale transactions andsubstantially all digital commerce sales. A customer is considered to have control once they are able to direct the use and receive substantially all of the benefits of the product.This resulted in a cumulative effect adjustment, which increased Retained earnings by $23 million at June 1, 2018. The adoption of Topic 606 did not have a material effect onthe Unaudited Condensed Consolidated Statements of Income during the three and six months ended November 30, 2018 .
Additionally, the Company’s reserve balances for returns, post-invoice sales discounts and miscellaneous claims for wholesale transactions were previously reported net of theestimated cost of inventory for product returns, and as a reduction to Accounts receivable, net on the Unaudited Condensed Consolidated Balance Sheets . Under Topic 606,an asset for the estimated cost of inventory for expected products returns is now recognized separately from the liability for sales-related reserves. This resulted in an increaseto Accounts receivable, net , an increase in Prepaid expenses and other current assets and an increase in Accrued liabilities on the Unaudited Condensed ConsolidatedBalance Sheets at November 30, 2018 . Sales-related reserves for the Company’s direct to consumer operations continue to be recognized in Accrued liabilities , but are nowrecorded separately from an asset for the estimated cost of inventory for expected product returns, which is recognized in Prepaid expenses and other current assets . Thefollowing table presents the related effect of the adoption of Topic 606 on the Unaudited Condensed Consolidated Balance Sheets at November 30, 2018 :
As of November 30, 2018
(In millions) As Reported Effect of Adoption Balances Without Adoption
of Topic 606
Accounts receivable, net $ 4,346 $ 695 $ 3,651
Prepaid expenses and other current assets 1,791 384 1,407
Total current assets 15,566 1,079 14,487
TOTAL ASSETS 22,677 1,079 21,598
Accrued liabilities 4,478 1,079 3,399
Total current liabilities 7,278 1,079 6,199
TOTAL LIABILITIES AND SHAREHOLDERS’ EQUITY $ 22,677 $ 1,079 $ 21,598
Other impacts from the adoption of Topic 606 on the Unaudited Condensed Consolidated Financial Statements were immaterial. Refer to Note 11 — Revenues for furtherdiscussion.
In October 2016, the FASB issued ASU No. 2016-16, Income Taxes (Topic 740): Intra-Entity Transfers of Assets Other Than Inventory . The updated guidance requirescompanies to recognize the income tax consequences of an intra-entity transfer of an asset other than inventory when the transfer occurs. Income tax effects of intra-entitytransfers of inventory will continue to be deferred until the inventory has been sold to a third party. The
10
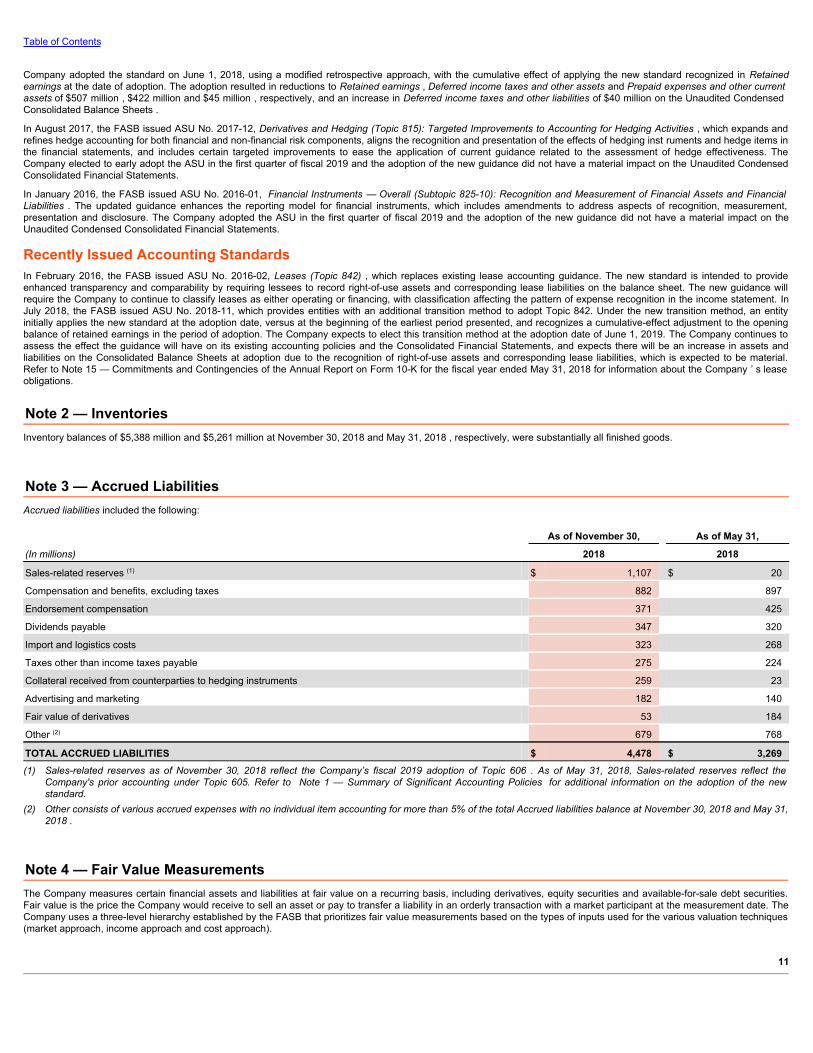
Table of Contents
Company adopted the standard on June 1, 2018, using a modified retrospective approach, with the cumulative effect of applying the new standard recognized in Retainedearnings at the date of adoption. The adoption resulted in reductions to Retained earnings , Deferred income taxes and other assets and Prepaid expenses and other currentassets of $507 million , $422 million and $45 million , respectively, and an increase in Deferred income taxes and other liabilities of $40 million on the Unaudited CondensedConsolidated Balance Sheets .
In August 2017, the FASB issued ASU No. 2017-12, Derivatives and Hedging (Topic 815): Targeted Improvements to Accounting for Hedging Activities , which expands andrefines hedge accounting for both financial and non-financial risk components, aligns the recognition and presentation of the effects of hedging inst ruments and hedge items inthe financial statements, and includes certain targeted improvements to ease the application of current guidance related to the assessment of hedge effectiveness. TheCompany elected to early adopt the ASU in the first quarter of fiscal 2019 and the adoption of the new guidance did not have a material impact on the Unaudited CondensedConsolidated Financial Statements.
In January 2016, the FASB issued ASU No. 2016-01, Financial Instruments — Overall (Subtopic 825-10): Recognition and Measurement of Financial Assets and FinancialLiabilities . The updated guidance enhances the reporting model for financial instruments, which includes amendments to address aspects of recognition, measurement,presentation and disclosure. The Company adopted the ASU in the first quarter of fiscal 2019 and the adoption of the new guidance did not have a material impact on theUnaudited Condensed Consolidated Financial Statements.
Recently Issued Accounting StandardsIn February 2016, the FASB issued ASU No. 2016-02, Leases (Topic 842) , which replaces existing lease accounting guidance. The new standard is intended to provideenhanced transparency and comparability by requiring lessees to record right-of-use assets and corresponding lease liabilities on the balance sheet. The new guidance willrequire the Company to continue to classify leases as either operating or financing, with classification affecting the pattern of expense recognition in the income statement. InJuly 2018, the FASB issued ASU No. 2018-11, which provides entities with an additional transition method to adopt Topic 842. Under the new transition method, an entityinitially applies the new standard at the adoption date, versus at the beginning of the earliest period presented, and recognizes a cumulative-effect adjustment to the openingbalance of retained earnings in the period of adoption. The Company expects to elect this transition method at the adoption date of June 1, 2019. The Company continues toassess the effect the guidance will have on its existing accounting policies and the Consolidated Financial Statements, and expects there will be an increase in assets andliabilities on the Consolidated Balance Sheets at adoption due to the recognition of right-of-use assets and corresponding lease liabilities, which is expected to be material.Refer to Note 15 — Commitments and Contingencies of the Annual Report on Form 10-K for the fiscal year ended May 31, 2018 for information about the Company ’ s leaseobligations.
Note 2 — InventoriesInventory balances of $5,388 million and $5,261 million at November 30, 2018 and May 31, 2018 , respectively, were substantially all finished goods.
Note 3 — Accrued LiabilitiesAccrued liabilities included the following:
As of November 30, As of May 31,
(In millions) 2018 2018
Sales-related reserves (1) $ 1,107 $ 20
Compensation and benefits, excluding taxes 882 897
Endorsement compensation 371 425
Dividends payable 347 320
Import and logistics costs 323 268
Taxes other than income taxes payable 275 224
Collateral received from counterparties to hedging instruments 259 23
Advertising and marketing 182 140
Fair value of derivatives 53 184
Other (2) 679 768
TOTAL ACCRUED LIABILITIES $ 4,478 $ 3,269(1) Sales-related reserves as of November 30, 2018 reflect the Company’s fiscal 2019 adoption of Topic 606 . As of May 31, 2018, Sales-related reserves reflect the
Company's prior accounting under Topic 605. Refer to Note 1 — Summary of Significant Accounting Policies for additional information on the adoption of the newstandard.
(2) Other consists of various accrued expenses with no individual item accounting for more than 5% of the total Accrued liabilities balance at November 30, 2018 and May 31,2018 .
Note 4 — Fair Value MeasurementsThe Company measures certain financial assets and liabilities at fair value on a recurring basis, including derivatives, equity securities and available-for-sale debt securities.Fair value is the price the Company would receive to sell an asset or pay to transfer a liability in an orderly transaction with a market participant at the measurement date. TheCompany uses a three-level hierarchy established by the FASB that prioritizes fair value measurements based on the types of inputs used for the various valuation techniques(market approach, income approach and cost approach).
11
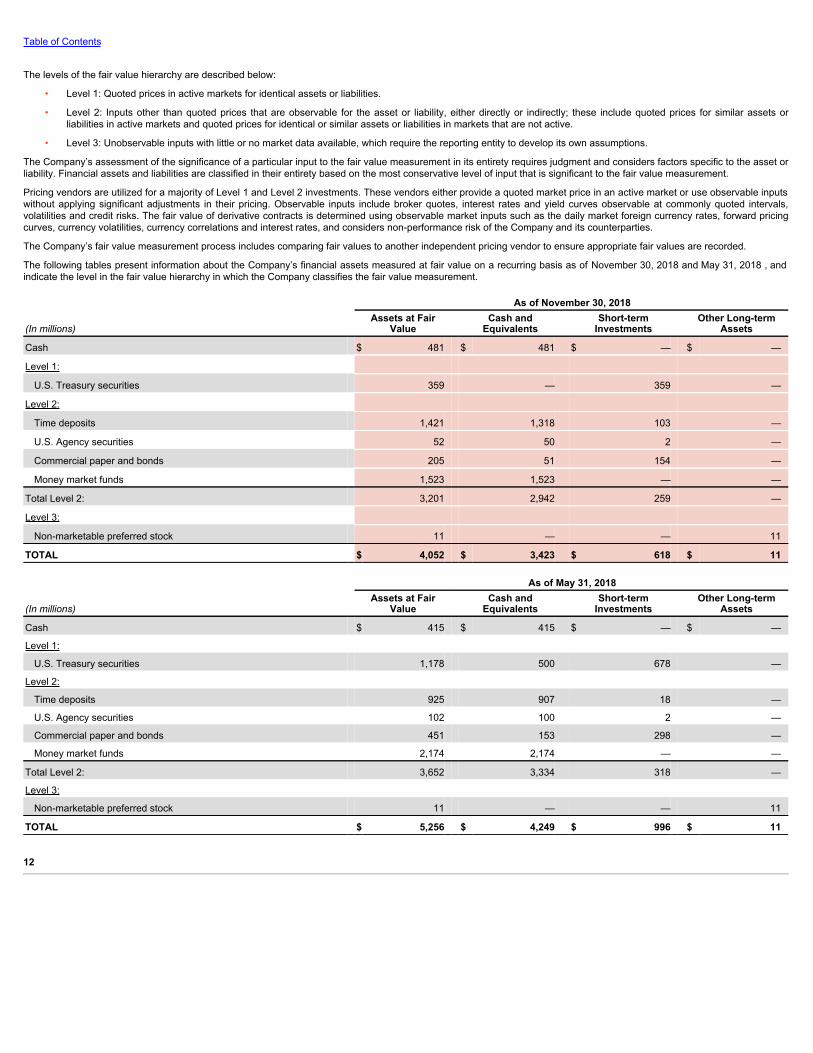
Table of Contents
The levels of the fair value hierarchy are described below:
• Level 1: Quoted prices in active markets for identical assets or liabilities.
• Level 2: Inputs other than quoted prices that are observable for the asset or liability, either directly or indirectly; these include quoted prices for similar assets orliabilities in active markets and quoted prices for identical or similar assets or liabilities in markets that are not active.
• Level 3: Unobservable inputs with little or no market data available, which require the reporting entity to develop its own assumptions.
The Company’s assessment of the significance of a particular input to the fair value measurement in its entirety requires judgment and considers factors specific to the asset orliability. Financial assets and liabilities are classified in their entirety based on the most conservative level of input that is significant to the fair value measurement.
Pricing vendors are utilized for a majority of Level 1 and Level 2 investments. These vendors either provide a quoted market price in an active market or use observable inputswithout applying significant adjustments in their pricing. Observable inputs include broker quotes, interest rates and yield curves observable at commonly quoted intervals,volatilities and credit risks. The fair value of derivative contracts is determined using observable market inputs such as the daily market foreign currency rates, forward pricingcurves, currency volatilities, currency correlations and interest rates, and considers non-performance risk of the Company and its counterparties.
The Company’s fair value measurement process includes comparing fair values to another independent pricing vendor to ensure appropriate fair values are recorded.
The following tables present information about the Company’s financial assets measured at fair value on a recurring basis as of November 30, 2018 and May 31, 2018 , andindicate the level in the fair value hierarchy in which the Company classifies the fair value measurement.
As of November 30, 2018
(In millions) Assets at Fair
Value Cash and
Equivalents Short-term
Investments Other Long-term
Assets
Cash $ 481 $ 481 $ — $ —
Level 1:
U.S. Treasury securities 359 — 359 —
Level 2:
Time deposits 1,421 1,318 103 —
U.S. Agency securities 52 50 2 —
Commercial paper and bonds 205 51 154 —
Money market funds 1,523 1,523 — —
Total Level 2: 3,201 2,942 259 —
Level 3:
Non-marketable preferred stock 11 — — 11
TOTAL $ 4,052 $ 3,423 $ 618 $ 11
As of May 31, 2018
(In millions) Assets at Fair
Value Cash and
Equivalents Short-term
Investments Other Long-term
Assets
Cash $ 415 $ 415 $ — $ —
Level 1:
U.S. Treasury securities 1,178 500 678 —
Level 2:
Time deposits 925 907 18 —
U.S. Agency securities 102 100 2 —
Commercial paper and bonds 451 153 298 —
Money market funds 2,174 2,174 — —
Total Level 2: 3,652 3,334 318 —
Level 3:
Non-marketable preferred stock 11 — — 11
TOTAL $ 5,256 $ 4,249 $ 996 $ 11
12
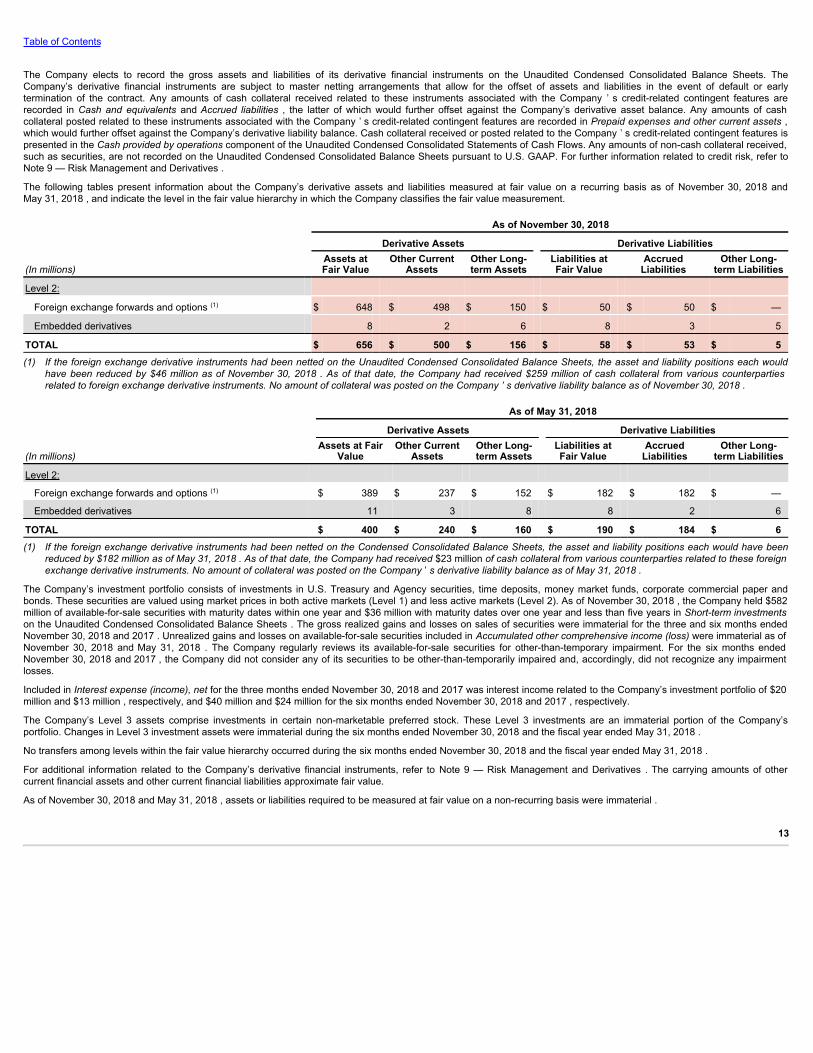
Table of Contents
The Company elects to record the gross assets and liabilities of its derivative financial instruments on the Unaudited Condensed Consolidated Balance Sheets. TheCompany’s derivative financial instruments are subject to master netting arrangements that allow for the offset of assets and liabilities in the event of default or earlytermination of the contract. Any amounts of cash collateral received related to these instruments associated with the Company ’ s credit-related contingent features arerecorded in Cash and equivalents and Accrued liabilities , the latter of which would further offset against the Company’s derivative asset balance. Any amounts of cashcollateral posted related to these instruments associated with the Company ’ s credit-related contingent features are recorded in Prepaid expenses and other current assets ,which would further offset against the Company’s derivative liability balance. Cash collateral received or posted related to the Company ’ s credit-related contingent features ispresented in the Cash provided by operations component of the Unaudited Condensed Consolidated Statements of Cash Flows. Any amounts of non-cash collateral received,such as securities, are not recorded on the Unaudited Condensed Consolidated Balance Sheets pursuant to U.S. GAAP. For further information related to credit risk, refer toNote 9 — Risk Management and Derivatives .
The following tables present information about the Company’s derivative assets and liabilities measured at fair value on a recurring basis as of November 30, 2018 andMay 31, 2018 , and indicate the level in the fair value hierarchy in which the Company classifies the fair value measurement.
As of November 30, 2018 Derivative Assets Derivative Liabilities
(In millions) Assets atFair Value
Other CurrentAssets
Other Long-term Assets
Liabilities atFair Value
AccruedLiabilities
Other Long-term Liabilities
Level 2:
Foreign exchange forwards and options (1) $ 648 $ 498 $ 150 $ 50 $ 50 $ —
Embedded derivatives 8 2 6 8 3 5
TOTAL $ 656 $ 500 $ 156 $ 58 $ 53 $ 5(1) If the foreign exchange derivative instruments had been netted on the Unaudited Condensed Consolidated Balance Sheets, the asset and liability positions each would
have been reduced by $46 million as of November 30, 2018 . As of that date, the Company had received $259 million of cash collateral from various counterpartiesrelated to foreign exchange derivative instruments. No amount of collateral was posted on the Company ’ s derivative liability balance as of November 30, 2018 .
As of May 31, 2018 Derivative Assets Derivative Liabilities
(In millions) Assets at Fair
Value Other Current
Assets Other Long-term Assets
Liabilities atFair Value
AccruedLiabilities
Other Long-term Liabilities
Level 2:
Foreign exchange forwards and options (1) $ 389 $ 237 $ 152 $ 182 $ 182 $ —
Embedded derivatives 11 3 8 8 2 6
TOTAL $ 400 $ 240 $ 160 $ 190 $ 184 $ 6(1) If the foreign exchange derivative instruments had been netted on the Condensed Consolidated Balance Sheets, the asset and liability positions each would have been
reduced by $182 million as of May 31, 2018 . As of that date, the Company had received $23 million of cash collateral from various counterparties related to these foreignexchange derivative instruments. No amount of collateral was posted on the Company ’ s derivative liability balance as of May 31, 2018 .
The Company’s investment portfolio consists of investments in U.S. Treasury and Agency securities, time deposits, money market funds, corporate commercial paper andbonds. These securities are valued using market prices in both active markets (Level 1) and less active markets (Level 2). As of November 30, 2018 , the Company held $582million of available-for-sale securities with maturity dates within one year and $36 million with maturity dates over one year and less than five years in Short-term investmentson the Unaudited Condensed Consolidated Balance Sheets . The gross realized gains and losses on sales of securities were immaterial for the three and six months endedNovember 30, 2018 and 2017 . Unrealized gains and losses on available-for-sale securities included in Accumulated other comprehensive income (loss) were immaterial as ofNovember 30, 2018 and May 31, 2018 . The Company regularly reviews its available-for-sale securities for other-than-temporary impairment. For the six months endedNovember 30, 2018 and 2017 , the Company did not consider any of its securities to be other-than-temporarily impaired and, accordingly, did not recognize any impairmentlosses.
Included in Interest expense (income), net for the three months ended November 30, 2018 and 2017 was interest income related to the Company’s investment portfolio of $20million and $13 million , respectively, and $40 million and $24 million for the six months ended November 30, 2018 and 2017 , respectively.
The Company’s Level 3 assets comprise investments in certain non-marketable preferred stock. These Level 3 investments are an immaterial portion of the Company’sportfolio. Changes in Level 3 investment assets were immaterial during the six months ended November 30, 2018 and the fiscal year ended May 31, 2018 .
No transfers among levels within the fair value hierarchy occurred during the six months ended November 30, 2018 and the fiscal year ended May 31, 2018 .
For additional information related to the Company’s derivative financial instruments, refer to Note 9 — Risk Management and Derivatives . The carrying amounts of othercurrent financial assets and other current financial liabilities approximate fair value.
As of November 30, 2018 and May 31, 2018 , assets or liabilities required to be measured at fair value on a non-recurring basis were immaterial .
13
Table of Contents
Financial Assets and Liabilities Not Recorded at Fair ValueLong-term debt is recorded at adjusted cost, net of unamortized premiums, discounts and debt issuance costs. The fair value of Long-term debt is estimated based uponquoted prices for similar instruments or quoted prices for identical instruments in inactive markets (Level 2). The fair value of the Company’s Long-term debt , including thecurrent portion, was approximately $3,171 million at November 30, 2018 and $3,294 million at May 31, 2018 .
For fair value information regarding Notes payable , refer to Note 5 — Short-Term Borrowings and Credit Lines .
Note 5 — Short-Term Borrowings and Credit LinesAs of November 30, 2018 , the Company had no outstanding borrowings under its $2 billion commercial paper program. As of May 31, 2018 , $325 million of commercial paperwas outstanding at a weighted average interest rate of 1.77% . These borrowings are included within Notes payable on the Unaudited Condensed Consolidated BalanceSheets.
Due to the short-term nature of the borrowings, the carrying amounts reflected on the Unaudited Condensed Consolidated Balance Sheets for Notes payable approximate fairvalue.
Note 6 — Income TaxesThe effective tax rate was 14.5% for the six months ended November 30, 2018 compared to 12.0% for the six months ended November 30, 2017 . The Company ’ s effectivetax rate for the current period reflects the impact of the new U.S. statutory rate and implemented provisions of the U.S. Tax Cuts and Jobs Act (the “Tax Act”).
The Company continued its analysis of the Tax Act during the second quarter of fiscal 2019. This resulted in no change to the provisional amounts recorded in fiscal 2018related to the one-time transition tax on the deemed repatriation of undistributed foreign earnings and the remeasurement of deferred tax assets and liabilities. As of November30, 2018, the Company completed its analysis of the impact of the Tax Act in accordance with U.S. Securities and Exchange Commission Staff Accounting Bulletin No. 118(“SAB 118”) and the amounts are no longer considered provisional.
As of November 30, 2018 , total gross unrecognized tax benefits, excluding related interest and penalties, were $773 million , $521 million of which would affect the Company’seffective tax rate if recognized in future periods. As of May 31, 2018 , total gross unrecognized tax benefits, excluding related interest and penalties, were $698 million . As ofNovember 30, 2018 and May 31, 2018 , accrued interest and penalties related to uncertain tax positions were $157 million (excluding federal benefit). Increases in the liabilityfor payment of interest and penalties were offset by reductions in interest and penalties for the six months ended November 30, 2018.
The Company is subject to taxation in the United States, as well as various state and foreign jurisdictions. The Company has closed all U.S. federal income tax matters throughfiscal 2016, with the exception of certain transfer pricing adjustments.
T he Company’s major foreign jurisdictions, China and the Netherlands, have substantially concluded all income tax matters through calendar 2007 and fiscal 2012,respectively. Although the timing of resolution of audits is not certain, the Company evaluates all domestic and foreign audit issues in the aggregate, along with the expirationof applicable statutes of limitations, and estimates that it is reasonably possible the total gross unrecognized tax benefits could decrease by up to approximately $200 millionwithin the next 12 months.
Note 7 — Common Stock and Stock-Based CompensationThe authorized number of shares of Class A Common Stock, no par value, and Class B Common Stock, no par value, are 400 million and 2,400 million , respectively. Eachshare of Class A Common Stock is convertible into one share of Class B Common Stock. Voting rights of Class B Common Stock are limited in certain circumstances withrespect to the election of directors. There are no differences in the dividend and liquidation preferences or participation rights of the holders of Class A and Class B CommonStock. From time to time, the Company’s Board of Directors authorizes share repurchase programs for the repurchase of Class B Common Stock. The value of repurchasedshares is deducted from Total shareholders’ equity through allocation to Capital in excess of stated value and Retained earnings .
The NIKE, Inc. Stock Incentive Plan (the “Stock Incentive Plan”) provides for the issuance of up to 718 million previously unissued shares of Class B Common Stock inconnection with equity awards granted under the Stock Incentive Plan. The Stock Incentive Plan authorizes the grant of non-statutory stock options, incentive stock options,stock appreciation rights, restricted stock, restricted stock units and performance-based awards. The exercise price for stock options and stock appreciation rights may not beless than the fair market value of the underlying shares on the date of grant. A committee of the Board of Directors administers the Stock Incentive Plan. The committee hasthe authority to determine the employees to whom awards will be made, the amount of the awards and the other terms and conditions of the awards. The Company generallygrants stock options and restricted stock on an annual basis. Substantially all awards outstanding under the Stock Incentive Plan vest ratably over four years, with stock optiongrants expiring ten years from the date of grant.
In addition to the Stock Incentive Plan, the Company gives employees the right to purchase shares at a discount from the market price under employee stock purchase plans(ESPPs). Subject to the annual statutory limit, employees are eligible to participate through payroll deductions of up to 10% of their compensation. At the end of each six -month offering period, shares are purchased by the participants at 85% of the lower of the fair market value at the beginning or the end of the offering period.
The Company accounts for stock-based compensation for options granted under the Stock Incentive Plan and employees ’ purchase rights under the ESPPs by estimating thefair value using the Black-Scholes option pricing model. The Company recognizes this fair value as Cost of sales or Operating overhead expense , as applicable, on a straight-line basis over the vesting period.
14
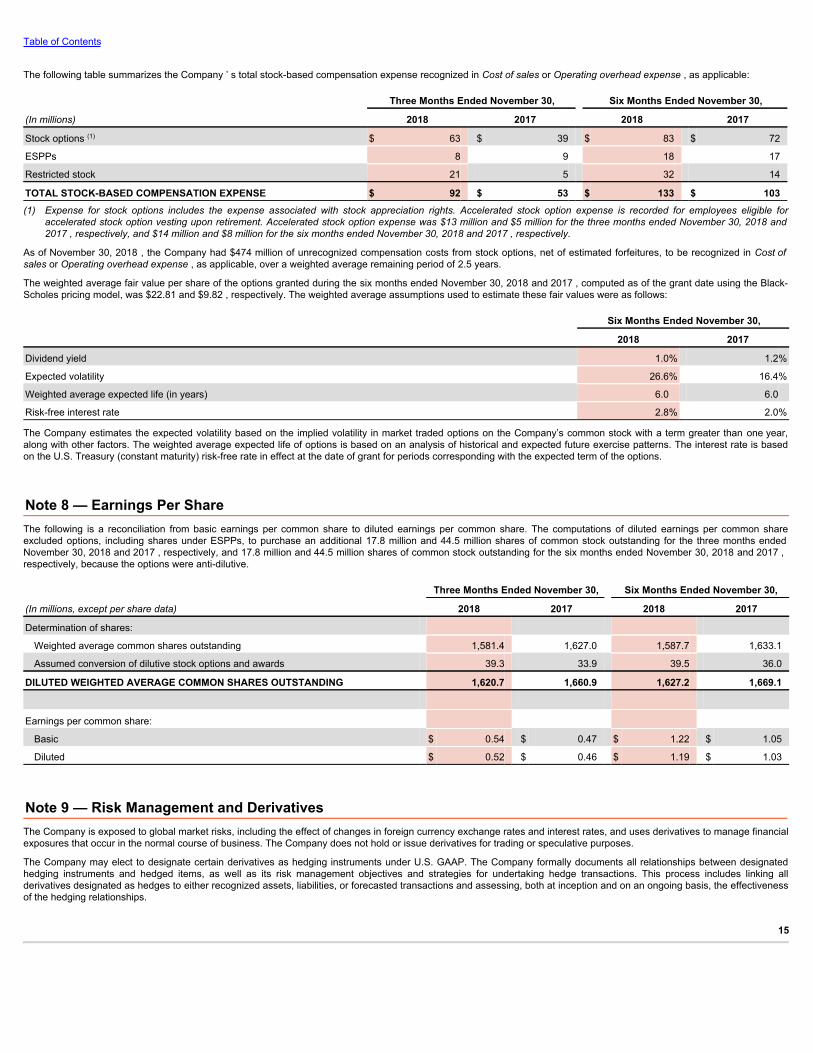
Table of Contents
The following table summarizes the Company ’ s total stock-based compensation expense recognized in Cost of sales or Operating overhead expense , as applicable:
Three Months Ended November 30, Six Months Ended November 30,
(In millions) 2018 2017 2018 2017
Stock options (1) $ 63 $ 39 $ 83 $ 72
ESPPs 8 9 18 17
Restricted stock 21 5 32 14
TOTAL STOCK-BASED COMPENSATION EXPENSE $ 92 $ 53 $ 133 $ 103(1) Expense for stock options includes the expense associated with stock appreciation rights. Accelerated stock option expense is recorded for employees eligible for
accelerated stock option vesting upon retirement. Accelerated stock option expense was $13 million and $5 million for the three months ended November 30, 2018 and2017 , respectively, and $14 million and $8 million for the six months ended November 30, 2018 and 2017 , respectively.
As of November 30, 2018 , the Company had $474 million of unrecognized compensation costs from stock options, net of estimated forfeitures, to be recognized in Cost ofsales or Operating overhead expense , as applicable, over a weighted average remaining period of 2.5 years.
The weighted average fair value per share of the options granted during the six months ended November 30, 2018 and 2017 , computed as of the grant date using the Black-Scholes pricing model, was $22.81 and $9.82 , respectively. The weighted average assumptions used to estimate these fair values were as follows:
Six Months Ended November 30, 2018 2017
Dividend yield 1.0% 1.2%
Expected volatility 26.6% 16.4%
Weighted average expected life (in years) 6.0 6.0
Risk-free interest rate 2.8% 2.0%
The Company estimates the expected volatility based on the implied volatility in market traded options on the Company’s common stock with a term greater than one year,along with other factors. The weighted average expected life of options is based on an analysis of historical and expected future exercise patterns. The interest rate is basedon the U.S. Treasury (constant maturity) risk-free rate in effect at the date of grant for periods corresponding with the expected term of the options.
Note 8 — Earnings Per ShareThe following is a reconciliation from basic earnings per common share to diluted earnings per common share. The computations of diluted earnings per common shareexcluded options, including shares under ESPPs, to purchase an additional 17.8 million and 44.5 million shares of common stock outstanding for the three months endedNovember 30, 2018 and 2017 , respectively, and 17.8 million and 44.5 million shares of common stock outstanding for the six months ended November 30, 2018 and 2017 ,respectively, because the options were anti-dilutive.
Three Months Ended November 30, Six Months Ended November 30,
(In millions, except per share data) 2018 2017 2018 2017
Determination of shares:
Weighted average common shares outstanding 1,581.4 1,627.0 1,587.7 1,633.1
Assumed conversion of dilutive stock options and awards 39.3 33.9 39.5 36.0
DILUTED WEIGHTED AVERAGE COMMON SHARES OUTSTANDING 1,620.7 1,660.9 1,627.2 1,669.1
Earnings per common share:
Basic $ 0.54 $ 0.47 $ 1.22 $ 1.05
Diluted $ 0.52 $ 0.46 $ 1.19 $ 1.03
Note 9 — Risk Management and DerivativesThe Company is exposed to global market risks, including the effect of changes in foreign currency exchange rates and interest rates, and uses derivatives to manage financialexposures that occur in the normal course of business. The Company does not hold or issue derivatives for trading or speculative purposes.
The Company may elect to designate certain derivatives as hedging instruments under U.S. GAAP. The Company formally documents all relationships between designatedhedging instruments and hedged items, as well as its risk management objectives and strategies for undertaking hedge transactions. This process includes linking allderivatives designated as hedges to either recognized assets, liabilities, or forecasted transactions and assessing, both at inception and on an ongoing basis, the effectivenessof the hedging relationships.
15
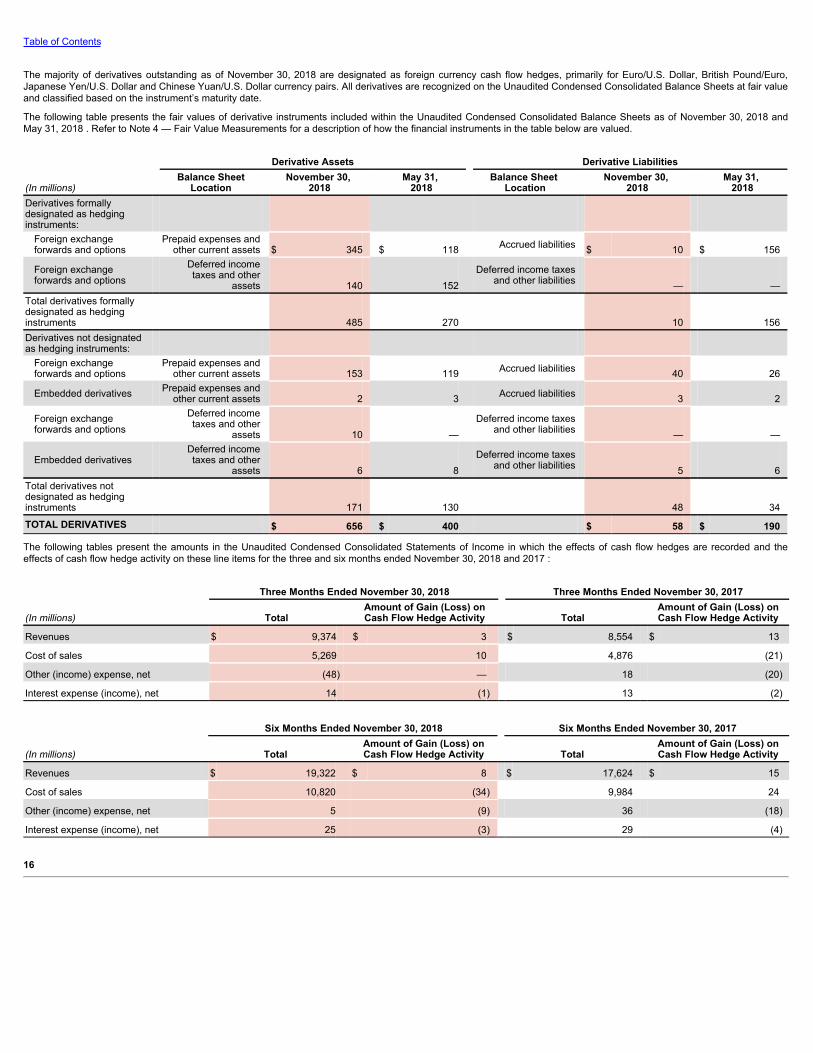
Table of Contents
The majority of derivatives outstanding as of November 30, 2018 are designated as foreign currency cash flow hedges, primarily for Euro/U.S. Dollar, British Pound/Euro,Japanese Yen/U.S. Dollar and Chinese Yuan/U.S. Dollar currency pairs. All derivatives are recognized on the Unaudited Condensed Consolidated Balance Sheets at fair valueand classified based on the instrument’s maturity date.
The following table presents the fair values of derivative instruments included within the Unaudited Condensed Consolidated Balance Sheets as of November 30, 2018 andMay 31, 2018 . Refer to Note 4 — Fair Value Measurements for a description of how the financial instruments in the table below are valued.
Derivative Assets Derivative Liabilities
(In millions) Balance Sheet
Location November 30,
2018 May 31,
2018 Balance Sheet
Location November 30,
2018 May 31,
2018Derivatives formallydesignated as hedginginstruments:
Foreign exchangeforwards and options
Prepaid expenses andother current assets $ 345 $ 118 Accrued liabilities $ 10 $ 156
Foreign exchangeforwards and options
Deferred incometaxes and other
assets 140 152 Deferred income taxes
and other liabilities — —Total derivatives formallydesignated as hedginginstruments
485 270
10 156
Derivatives not designatedas hedging instruments: Foreign exchangeforwards and options
Prepaid expenses andother current assets 153 119 Accrued liabilities 40 26
Embedded derivatives Prepaid expenses andother current assets 2 3 Accrued liabilities 3 2
Foreign exchangeforwards and options
Deferred incometaxes and other
assets 10 — Deferred income taxes
and other liabilities — —
Embedded derivatives
Deferred incometaxes and other
assets 6 8 Deferred income taxes
and other liabilities 5 6Total derivatives notdesignated as hedginginstruments
171 130
48 34
TOTAL DERIVATIVES $ 656 $ 400 $ 58 $ 190
The following tables present the amounts in the Unaudited Condensed Consolidated Statements of Income in which the effects of cash flow hedges are recorded and theeffects of cash flow hedge activity on these line items for the three and six months ended November 30, 2018 and 2017 :
Three Months Ended November 30, 2018 Three Months Ended November 30, 2017
(In millions) Total Amount of Gain (Loss) onCash Flow Hedge Activity Total
Amount of Gain (Loss) onCash Flow Hedge Activity
Revenues $ 9,374 $ 3 $ 8,554 $ 13
Cost of sales 5,269 10 4,876 (21)
Other (income) expense, net (48) — 18 (20)
Interest expense (income), net 14 (1) 13 (2)
Six Months Ended November 30, 2018 Six Months Ended November 30, 2017
(In millions) Total Amount of Gain (Loss) onCash Flow Hedge Activity Total
Amount of Gain (Loss) onCash Flow Hedge Activity
Revenues $ 19,322 $ 8 $ 17,624 $ 15
Cost of sales 10,820 (34) 9,984 24
Other (income) expense, net 5 (9) 36 (18)
Interest expense (income), net 25 (3) 29 (4)
16
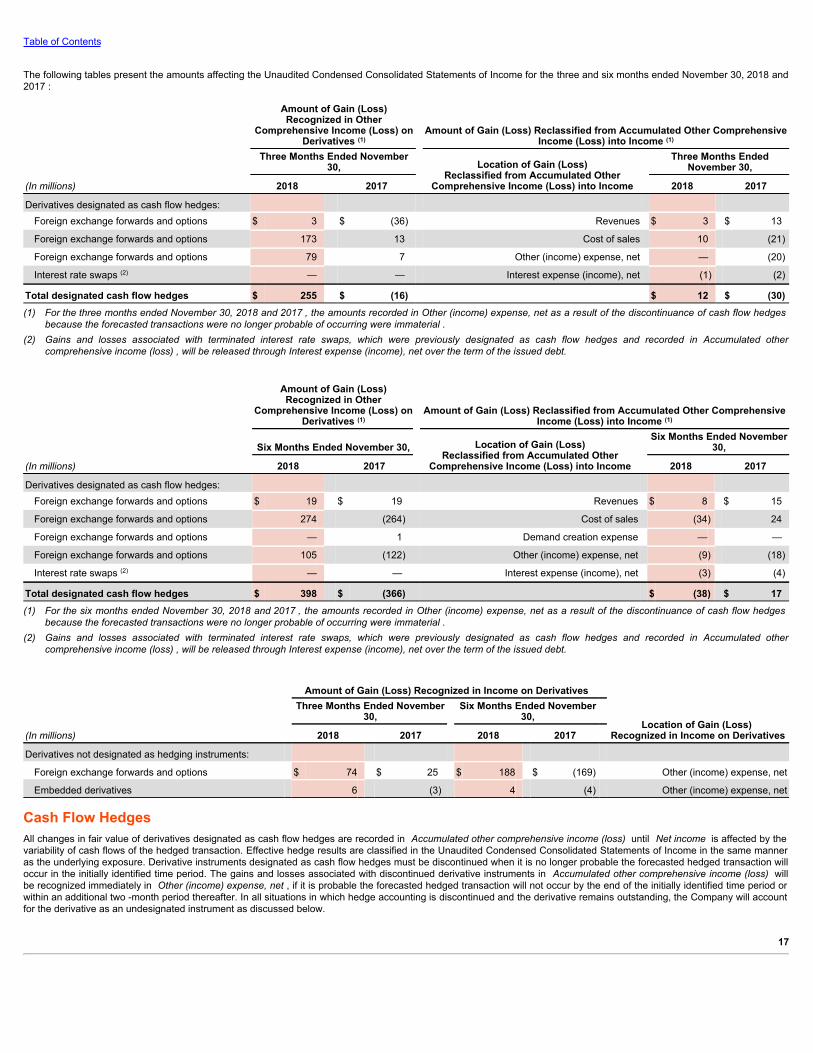
Table of Contents
The following tables present the amounts affecting the Unaudited Condensed Consolidated Statements of Income for the three and six months ended November 30, 2018 and2017 :
(In millions)
Amount of Gain (Loss)Recognized in Other
Comprehensive Income (Loss) onDerivatives (1)
Amount of Gain (Loss) Reclassified from Accumulated Other ComprehensiveIncome (Loss) into Income (1)
Three Months Ended November30, Location of Gain (Loss)
Reclassified from Accumulated OtherComprehensive Income (Loss) into Income
Three Months Ended
November 30,
2018 2017 2018 2017
Derivatives designated as cash flow hedges: Foreign exchange forwards and options $ 3 $ (36) Revenues $ 3 $ 13
Foreign exchange forwards and options 173 13 Cost of sales 10 (21)
Foreign exchange forwards and options 79 7 Other (income) expense, net — (20)
Interest rate swaps (2) — — Interest expense (income), net (1) (2)
Total designated cash flow hedges $ 255 $ (16) $ 12 $ (30)(1) For the three months ended November 30, 2018 and 2017 , the amounts recorded in Other (income) expense, net as a result of the discontinuance of cash flow hedges
because the forecasted transactions were no longer probable of occurring were immaterial .(2) Gains and losses associated with terminated interest rate swaps, which were previously designated as cash flow hedges and recorded in Accumulated other
comprehensive income (loss) , will be released through Interest expense (income), net over the term of the issued debt.
(In millions)
Amount of Gain (Loss)Recognized in Other
Comprehensive Income (Loss) onDerivatives (1)
Amount of Gain (Loss) Reclassified from Accumulated Other ComprehensiveIncome (Loss) into Income (1)
Six Months Ended November 30, Location of Gain (Loss)Reclassified from Accumulated Other
Comprehensive Income (Loss) into Income
Six Months Ended November
30,
2018 2017 2018 2017
Derivatives designated as cash flow hedges: Foreign exchange forwards and options $ 19 $ 19 Revenues $ 8 $ 15
Foreign exchange forwards and options 274 (264) Cost of sales (34) 24
Foreign exchange forwards and options — 1 Demand creation expense — —
Foreign exchange forwards and options 105 (122) Other (income) expense, net (9) (18)
Interest rate swaps (2) — — Interest expense (income), net (3) (4)
Total designated cash flow hedges $ 398 $ (366) $ (38) $ 17(1) For the six months ended November 30, 2018 and 2017 , the amounts recorded in Other (income) expense, net as a result of the discontinuance of cash flow hedges
because the forecasted transactions were no longer probable of occurring were immaterial .(2) Gains and losses associated with terminated interest rate swaps, which were previously designated as cash flow hedges and recorded in Accumulated other
comprehensive income (loss) , will be released through Interest expense (income), net over the term of the issued debt.
Amount of Gain (Loss) Recognized in Income on Derivatives
Three Months Ended November
30, Six Months Ended November
30, Location of Gain (Loss)
Recognized in Income on Derivatives(In millions) 2018 2017 2018 2017
Derivatives not designated as hedging instruments:
Foreign exchange forwards and options $ 74 $ 25 $ 188 $ (169) Other (income) expense, net
Embedded derivatives 6 (3) 4 (4) Other (income) expense, net
Cash Flow HedgesAll changes in fair value of derivatives designated as cash flow hedges are recorded in Accumulated other comprehensive income (loss) until Net income is affected by thevariability of cash flows of the hedged transaction. Effective hedge results are classified in the Unaudited Condensed Consolidated Statements of Income in the same manneras the underlying exposure. Derivative instruments designated as cash flow hedges must be discontinued when it is no longer probable the forecasted hedged transaction willoccur in the initially identified time period. The gains and losses associated with discontinued derivative instruments in Accumulated other comprehensive income (loss) willbe recognized immediately in Other (income) expense, net , if it is probable the forecasted hedged transaction will not occur by the end of the initially identified time period orwithin an additional two -month period thereafter. In all situations in which hedge accounting is discontinued and the derivative remains outstanding, the Company will accountfor the derivative as an undesignated instrument as discussed below.
17
Table of Contents
The purpose of the Company’s foreign exchange risk management program is to lessen both the positive and negative effects of currency fluctuations on the Company’sconsolidated results of operations, financial position and cash flows. Foreign currency exposures the Company may elect to hedge in this manner include product costexposures, non-functional currency denominated external and intercompany revenues, demand creation expenses, investments in U.S. Dollar-denominated available-for-saledebt securities and certain other intercompany transactions.
Product cost exposures are primarily generated through non-functional currency denominated product purchases and the foreign currency adjustment program describedbelow. NIKE entities primarily purchase product in two ways: (1) Certain NIKE entities purchase product from the NIKE Trading Company (NTC), a wholly owned sourcing hubthat buys NIKE branded product from third party factories, predominantly in U.S. Dollars. The NTC, whose functional currency is the U.S. Dollar, then sells the product to NIKEentities in their respective functional currencies. NTC sales to a NIKE entity with a different functional currency result in a foreign currency exposure for the NTC. (2) OtherNIKE entities purchase product directly from third party factories in U.S. Dollars. These purchases generate a foreign currency exposure for those NIKE entities with afunctional currency other than the U.S. Dollar.
The Company operates a foreign currency adjustment program with certain factories. The program is designed to more effectively manage foreign currency risk by assumingcertain of the factories’ foreign currency exposures, some of which are natural offsets to the Company’s existing foreign currency exposures. Under this program, theCompany’s payments to these factories are adjusted for rate fluctuations in the basket of currencies (“factory currency exposure index”) in which the labor, materials andoverhead costs incurred by the factories in the production of NIKE branded products (“factory input costs”) are denominated. For the portion of the indices denominated in thelocal or functional currency of the factory, the Company may elect to place formally designated cash flow hedges. For all currencies within the indices, excluding the U.S. Dollarand the local or functional currency of the factory, an embedded derivative contract is created upon the factory’s acceptance of NIKE’s purchase order. Embedded derivativecontracts are separated from the related purchase order, as further described within the Embedded Derivatives section below.
The Company’s policy permits the utilization of derivatives to reduce its foreign currency exposures where internal netting or other strategies cannot be effectively employed.Typically, the Company may enter into hedge contracts starting up to 12 to 24 months in advance of the forecasted transaction and may place incremental hedges up to 100%of the exposure by the time the forecasted transaction occurs. The total notional amount of outstanding foreign currency derivatives designated as cash flow hedges was $9.2billion as of November 30, 2018 .
As of November 30, 2018 , approximately $316 million of deferred net gains (net of tax) on both outstanding and matured derivatives in Accumulated other comprehensiveincome (loss) are expected to be reclassified to Net income during the next 12 months concurrent with the underlying hedged transactions also being recorded in Net income .Actual amounts ultimately reclassified to Net income are dependent on the exchange rates in effect when derivative contracts currently outstanding mature. As ofNovember 30, 2018 , the maximum term over which the Company is hedging exposures to the variability of cash flows for its forecasted transactions was 18 months.
Fair Value HedgesThe Company has, in the past, been exposed to the risk of changes in the fair value of certain fixed-rate debt attributable to changes in interest rates. Derivatives used by theCompany to hedge this risk are receive-fixed, pay-variable interest rate swaps. All interest rate swaps designated as fair value hedges of the related long-term debt meet theshortcut method requirements under U.S. GAAP. Accordingly, changes in the fair values of the interest rate swaps are considered to exactly offset changes in the fair value ofthe underlying long-term debt. The Company had no interest rate swaps designated as fair value hedges as of November 30, 2018 .
Net Investment HedgesThe Company has, in the past, hedged and may, in the future, hedge the risk of variability in foreign currency-denominated net investments in wholly-owned internationaloperations. All changes in fair value of the derivatives designated as net investment hedges, are reported in Accumulated other comprehensive income (loss) along with theforeign currency translation adjustments on those investments. The Company had no outstanding net investment hedges as of November 30, 2018 .
Undesignated Derivative InstrumentsThe Company may elect to enter into foreign exchange forwards to mitigate the change in fair value of specific assets and liabilities on the Unaudited Condensed ConsolidatedBalance Sheets and/or embedded derivative contracts. These undesignated instruments are recorded at fair value as a derivative asset or liability on the UnauditedCondensed Consolidated Balance Sheets with their corresponding change in fair value recognized in Other (income) expense, net , together with the re-measurement gain orloss from the hedged balance sheet position and/or embedded derivative contract. The total notional amount of outstanding undesignated derivative instruments was $8.0billion as of November 30, 2018 .
Embedded DerivativesAs part of the foreign currency adjustment program described above, an embedded derivative contract is created upon the factory’s acceptance of NIKE’s purchase order forcurrencies within the factory currency exposure indices that are neither the U.S. Dollar nor the local or functional currency of the factory. In addition, embedded derivativecontracts are created when the Company enters into certain other contractual agreements which have payments that are indexed to currencies that are not the functionalcurrency of either substantial party to the contracts. Embedded derivative contracts are treated as foreign currency forward contracts that are bifurcated from the relatedcontract and recorded at fair value as a derivative asset or liability on the Unaudited Condensed Consolidated Balance Sheets with their corresponding change in fair valuerecognized in Other (income) expense, net , through the date the foreign currency fluctuations cease to exist.
As of November 30, 2018 , the total notional amount of embedded derivatives outstanding was approximately $393 million .
Credit RiskThe Company is exposed to credit-related losses in the event of nonperformance by counterparties to hedging instruments. The counterparties to all derivative transactions aremajor financial institutions with investment grade credit ratings; however, this does not eliminate the Company’s exposure to credit risk with these institutions. This credit risk islimited to the unrealized gains in such contracts should any of these counterparties fail to perform as contracted. To manage this risk, the Company has established strictcounterparty credit guidelines that are continually monitored.
18
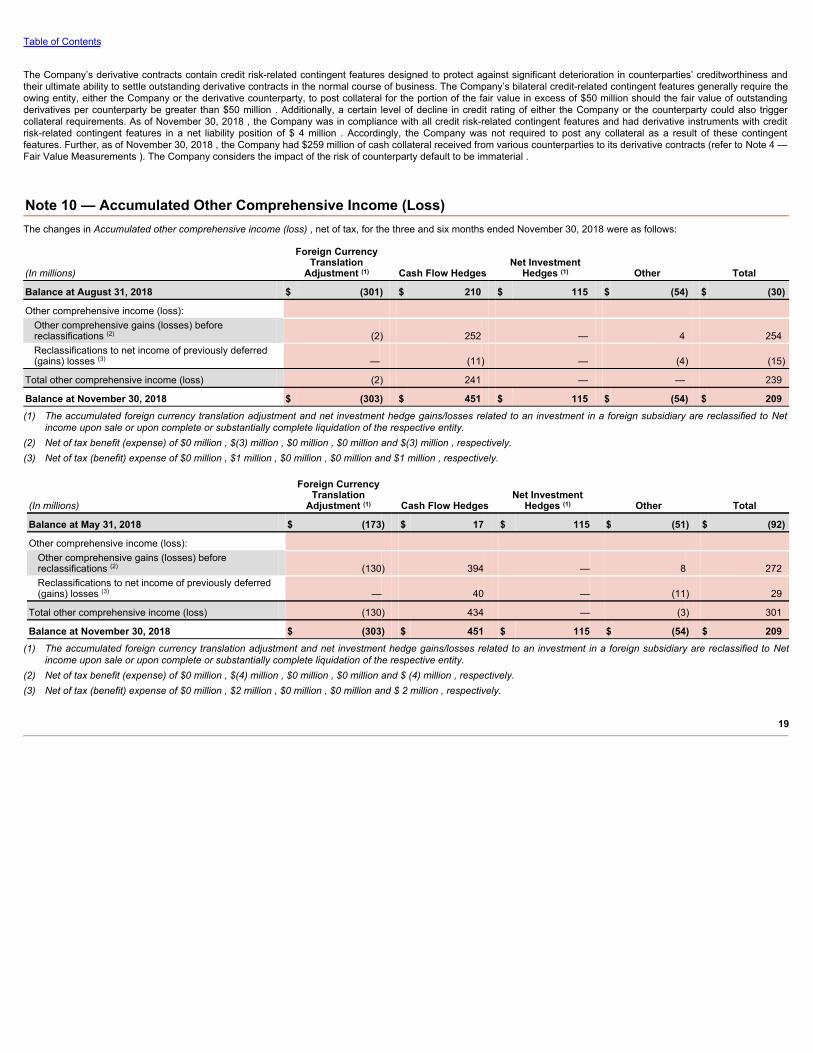
Table of Contents
The Company’s derivative contracts contain credit risk-related contingent features designed to protect against significant deterioration in counterparties’ creditworthiness andtheir ultimate ability to settle outstanding derivative contracts in the normal course of business. The Company’s bilateral credit-related contingent features generally require theowing entity, either the Company or the derivative counterparty, to post collateral for the portion of the fair value in excess of $50 million should the fair value of outstandingderivatives per counterparty be greater than $50 million . Additionally, a certain level of decline in credit rating of either the Company or the counterparty could also triggercollateral requirements. As of November 30, 2018 , the Company was in compliance with all credit risk-related contingent features and had derivative instruments with creditrisk-related contingent features in a net liability position of $ 4 million . Accordingly, the Company was not required to post any collateral as a result of these contingentfeatures. Further, as of November 30, 2018 , the Company had $259 million of cash collateral received from various counterparties to its derivative contracts (refer to Note 4 —Fair Value Measurements ). The Company considers the impact of the risk of counterparty default to be immaterial .
Note 10 — Accumulated Other Comprehensive Income (Loss)The changes in Accumulated other comprehensive income (loss) , net of tax, for the three and six months ended November 30, 2018 were as follows:
(In millions)
Foreign CurrencyTranslation
Adjustment (1) Cash Flow Hedges Net Investment
Hedges (1) Other Total
Balance at August 31, 2018 $ (301) $ 210 $ 115 $ (54) $ (30)
Other comprehensive income (loss): Other comprehensive gains (losses) beforereclassifications (2) (2) 252 — 4 254Reclassifications to net income of previously deferred(gains) losses (3) — (11) — (4) (15)
Total other comprehensive income (loss) (2) 241 — — 239
Balance at November 30, 2018 $ (303) $ 451 $ 115 $ (54) $ 209(1) The accumulated foreign currency translation adjustment and net investment hedge gains/losses related to an investment in a foreign subsidiary are reclassified to Net
income upon sale or upon complete or substantially complete liquidation of the respective entity.(2) Net of tax benefit (expense) of $0 million , $(3) million , $0 million , $0 million and $(3) million , respectively.(3) Net of tax (benefit) expense of $0 million , $1 million , $0 million , $0 million and $1 million , respectively.
(In millions)
Foreign CurrencyTranslation
Adjustment (1) Cash Flow Hedges Net Investment
Hedges (1) Other Total
Balance at May 31, 2018 $ (173) $ 17 $ 115 $ (51) $ (92)
Other comprehensive income (loss): Other comprehensive gains (losses) beforereclassifications (2) (130) 394 — 8 272Reclassifications to net income of previously deferred(gains) losses (3) — 40 — (11) 29
Total other comprehensive income (loss) (130) 434 — (3) 301
Balance at November 30, 2018 $ (303) $ 451 $ 115 $ (54) $ 209(1) The accumulated foreign currency translation adjustment and net investment hedge gains/losses related to an investment in a foreign subsidiary are reclassified to Net
income upon sale or upon complete or substantially complete liquidation of the respective entity.(2) Net of tax benefit (expense) of $0 million , $(4) million , $0 million , $0 million and $ (4) million , respectively.(3) Net of tax (benefit) expense of $0 million , $2 million , $0 million , $0 million and $ 2 million , respectively.
19
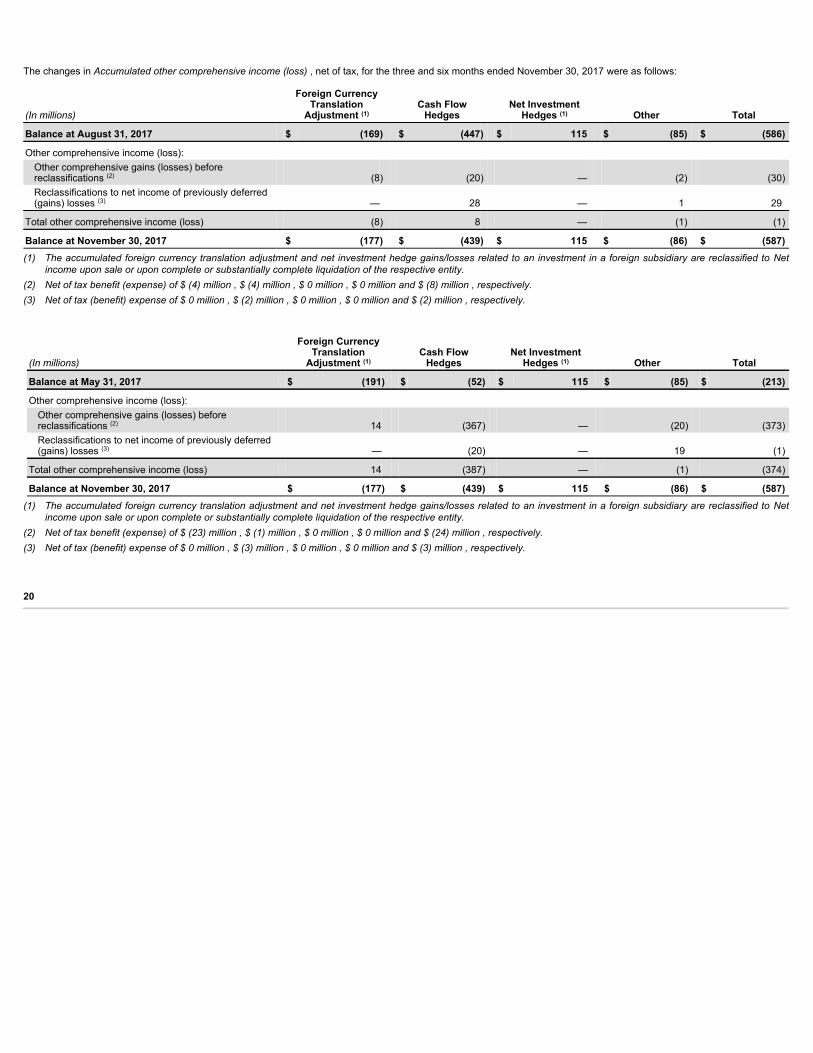
The changes in Accumulated other comprehensive income (loss) , net of tax, for the three and six months ended November 30, 2017 were as follows:
(In millions)
Foreign CurrencyTranslation
Adjustment (1) Cash Flow
Hedges Net Investment
Hedges (1) Other Total
Balance at August 31, 2017 $ (169) $ (447) $ 115 $ (85) $ (586)
Other comprehensive income (loss): Other comprehensive gains (losses) beforereclassifications (2) (8) (20) — (2) (30)Reclassifications to net income of previously deferred(gains) losses (3) — 28 — 1 29
Total other comprehensive income (loss) (8) 8 — (1) (1)
Balance at November 30, 2017 $ (177) $ (439) $ 115 $ (86) $ (587)(1) The accumulated foreign currency translation adjustment and net investment hedge gains/losses related to an investment in a foreign subsidiary are reclassified to Net
income upon sale or upon complete or substantially complete liquidation of the respective entity.(2) Net of tax benefit (expense) of $ (4) million , $ (4) million , $ 0 million , $ 0 million and $ (8) million , respectively.(3) Net of tax (benefit) expense of $ 0 million , $ (2) million , $ 0 million , $ 0 million and $ (2) million , respectively.
(In millions)
Foreign CurrencyTranslation
Adjustment (1) Cash Flow
Hedges Net Investment
Hedges (1) Other Total
Balance at May 31, 2017 $ (191) $ (52) $ 115 $ (85) $ (213)
Other comprehensive income (loss): Other comprehensive gains (losses) beforereclassifications (2) 14 (367) — (20) (373)Reclassifications to net income of previously deferred(gains) losses (3) — (20) — 19 (1)
Total other comprehensive income (loss) 14 (387) — (1) (374)
Balance at November 30, 2017 $ (177) $ (439) $ 115 $ (86) $ (587)(1) The accumulated foreign currency translation adjustment and net investment hedge gains/losses related to an investment in a foreign subsidiary are reclassified to Net
income upon sale or upon complete or substantially complete liquidation of the respective entity.(2) Net of tax benefit (expense) of $ (23) million , $ (1) million , $ 0 million , $ 0 million and $ (24) million , respectively.(3) Net of tax (benefit) expense of $ 0 million , $ (3) million , $ 0 million , $ 0 million and $ (3) million , respectively.
20
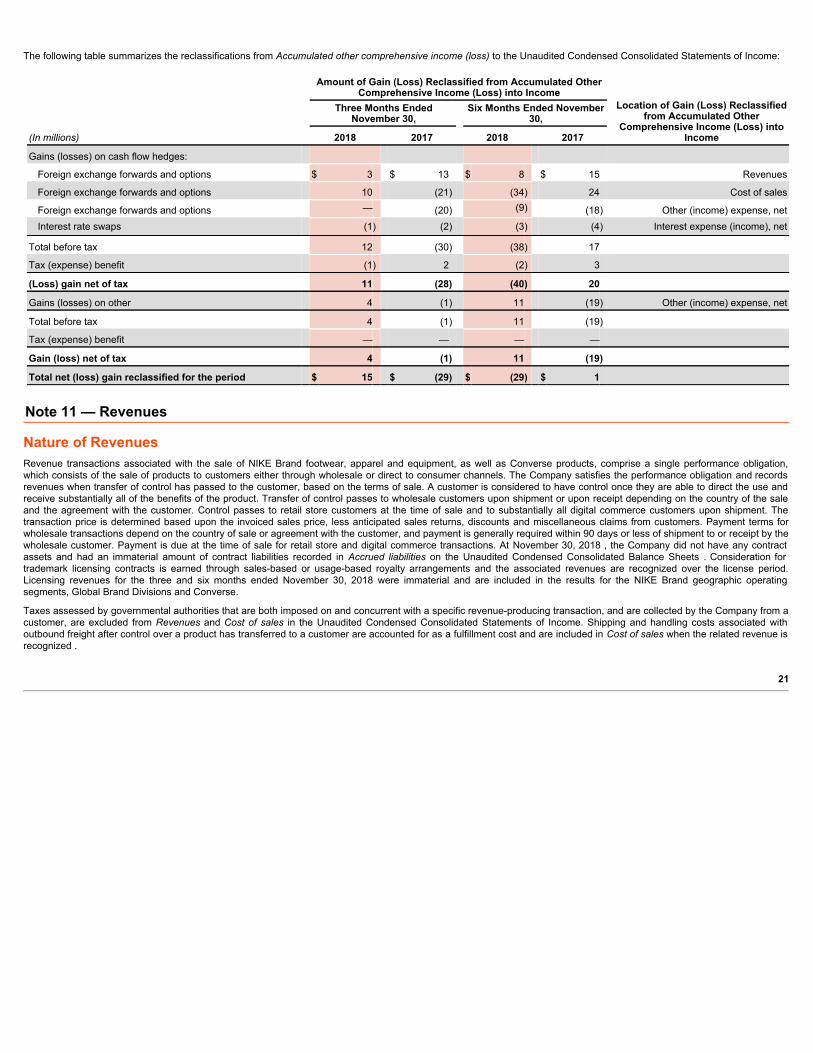
The following table summarizes the reclassifications from Accumulated other comprehensive income (loss) to the Unaudited Condensed Consolidated Statements of Income:
Amount of Gain (Loss) Reclassified from Accumulated Other
Comprehensive Income (Loss) into Income Location of Gain (Loss) Reclassified
from Accumulated OtherComprehensive Income (Loss) into
Income
Three Months Ended
November 30, Six Months Ended November
30,
(In millions) 2018 2017 2018 2017
Gains (losses) on cash flow hedges:
Foreign exchange forwards and options $ 3 $ 13 $ 8 $ 15 Revenues
Foreign exchange forwards and options 10 (21) (34) 24 Cost of sales
Foreign exchange forwards and options — (20) (9) (18) Other (income) expense, netInterest rate swaps (1) (2) (3) (4) Interest expense (income), net
Total before tax 12 (30) (38) 17
Tax (expense) benefit (1) 2 (2) 3
(Loss) gain net of tax 11 (28) (40) 20
Gains (losses) on other 4 (1) 11 (19) Other (income) expense, net
Total before tax 4 (1) 11 (19)
Tax (expense) benefit — — — —
Gain (loss) net of tax 4 (1) 11 (19)
Total net (loss) gain reclassified for the period $ 15 $ (29) $ (29) $ 1
Note 11 — Revenues
Nature of RevenuesRevenue transactions associated with the sale of NIKE Brand footwear, apparel and equipment, as well as Converse products, comprise a single performance obligation,which consists of the sale of products to customers either through wholesale or direct to consumer channels. The Company satisfies the performance obligation and recordsrevenues when transfer of control has passed to the customer, based on the terms of sale. A customer is considered to have control once they are able to direct the use andreceive substantially all of the benefits of the product. Transfer of control passes to wholesale customers upon shipment or upon receipt depending on the country of the saleand the agreement with the customer. Control passes to retail store customers at the time of sale and to substantially all digital commerce customers upon shipment. Thetransaction price is determined based upon the invoiced sales price, less anticipated sales returns, discounts and miscellaneous claims from customers. Payment terms forwholesale transactions depend on the country of sale or agreement with the customer, and payment is generally required within 90 days or less of shipment to or receipt by thewholesale customer. Payment is due at the time of sale for retail store and digital commerce transactions. At November 30, 2018 , the Company did not have any contractassets and had an immaterial amount of contract liabilities recorded in Accrued liabilities on the Unaudited Condensed Consolidated Balance Sheets . Consideration fortrademark licensing contracts is earned through sales-based or usage-based royalty arrangements and the associated revenues are recognized over the license period.Licensing revenues for the three and six months ended November 30, 2018 were immaterial and are included in the results for the NIKE Brand geographic operatingsegments, Global Brand Divisions and Converse.
Taxes assessed by governmental authorities that are both imposed on and concurrent with a specific revenue-producing transaction, and are collected by the Company from acustomer, are excluded from Revenues and Cost of sales in the Unaudited Condensed Consolidated Statements of Income. Shipping and handling costs associated withoutbound freight after control over a product has transferred to a customer are accounted for as a fulfillment cost and are included in Cost of sales when the related revenue isrecognized .
21
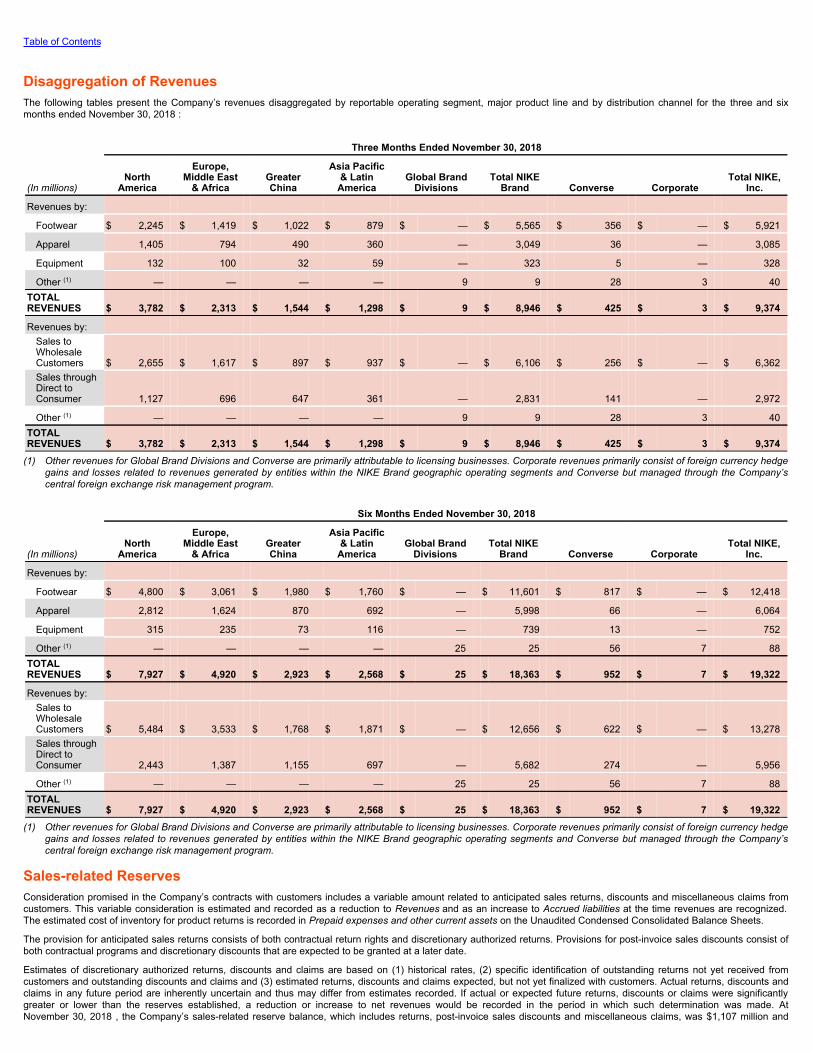
Table of Contents
Disaggregation of RevenuesThe following tables present the Company’s revenues disaggregated by reportable operating segment, major product line and by distribution channel for the three and sixmonths ended November 30, 2018 :
Three Months Ended November 30, 2018
NorthAmerica
Europe,Middle East
& Africa GreaterChina
Asia Pacific& Latin
America Global Brand
Divisions Total NIKE
Brand Converse Corporate Total NIKE,
Inc. (In millions)
Revenues by:
Footwear $ 2,245 $ 1,419 $ 1,022 $ 879 $ — $ 5,565 $ 356 $ — $ 5,921
Apparel 1,405 794 490 360 — 3,049 36 — 3,085
Equipment 132 100 32 59 — 323 5 — 328
Other (1) — — — — 9 9 28 3 40TOTALREVENUES $ 3,782 $ 2,313 $ 1,544 $ 1,298 $ 9 $ 8,946 $ 425 $ 3 $ 9,374
Revenues by: Sales toWholesaleCustomers $ 2,655 $ 1,617 $ 897 $ 937 $ — $ 6,106 $ 256 $ — $ 6,362Sales throughDirect toConsumer 1,127 696 647 361 — 2,831 141 — 2,972
Other (1) — — — — 9 9 28 3 40TOTALREVENUES $ 3,782 $ 2,313 $ 1,544 $ 1,298 $ 9 $ 8,946 $ 425 $ 3 $ 9,374
(1) Other revenues for Global Brand Divisions and Converse are primarily attributable to licensing businesses. Corporate revenues primarily consist of foreign currency hedgegains and losses related to revenues generated by entities within the NIKE Brand geographic operating segments and Converse but managed through the Company’scentral foreign exchange risk management program.
Six Months Ended November 30, 2018
NorthAmerica
Europe,Middle East
& Africa GreaterChina
Asia Pacific& Latin
America Global Brand
Divisions Total NIKE
Brand Converse Corporate Total NIKE,
Inc. (In millions)
Revenues by:
Footwear $ 4,800 $ 3,061 $ 1,980 $ 1,760 $ — $ 11,601 $ 817 $ — $ 12,418
Apparel 2,812 1,624 870 692 — 5,998 66 — 6,064
Equipment 315 235 73 116 — 739 13 — 752
Other (1) — — — — 25 25 56 7 88TOTALREVENUES $ 7,927 $ 4,920 $ 2,923 $ 2,568 $ 25 $ 18,363 $ 952 $ 7 $ 19,322
Revenues by: Sales toWholesaleCustomers $ 5,484 $ 3,533 $ 1,768 $ 1,871 $ — $ 12,656 $ 622 $ — $ 13,278Sales throughDirect toConsumer 2,443 1,387 1,155 697 — 5,682 274 — 5,956
Other (1) — — — — 25 25 56 7 88TOTALREVENUES $ 7,927 $ 4,920 $ 2,923 $ 2,568 $ 25 $ 18,363 $ 952 $ 7 $ 19,322
(1) Other revenues for Global Brand Divisions and Converse are primarily attributable to licensing businesses. Corporate revenues primarily consist of foreign currency hedgegains and losses related to revenues generated by entities within the NIKE Brand geographic operating segments and Converse but managed through the Company’scentral foreign exchange risk management program.
Sales-related ReservesConsideration promised in the Company’s contracts with customers includes a variable amount related to anticipated sales returns, discounts and miscellaneous claims fromcustomers. This variable consideration is estimated and recorded as a reduction to Revenues and as an increase to Accrued liabilities at the time revenues are recognized.The estimated cost of inventory for product returns is recorded in Prepaid expenses and other current assets on the Unaudited Condensed Consolidated Balance Sheets.
The provision for anticipated sales returns consists of both contractual return rights and discretionary authorized returns. Provisions for post-invoice sales discounts consist ofboth contractual programs and discretionary discounts that are expected to be granted at a later date.
Estimates of discretionary authorized returns, discounts and claims are based on (1) historical rates, (2) specific identification of outstanding returns not yet received fromcustomers and outstanding discounts and claims and (3) estimated returns, discounts and claims expected, but not yet finalized with customers. Actual returns, discounts andclaims in any future period are inherently uncertain and thus may differ from estimates recorded. If actual or expected future returns, discounts or claims were significantlygreater or lower than the reserves established, a reduction or increase to net revenues would be recorded in the period in which such determination was made. AtNovember 30, 2018 , the Company’s sales-related reserve balance, which includes returns, post-invoice sales discounts and miscellaneous claims, was $1,107 million and

recorded in Accrued liabilities on
22
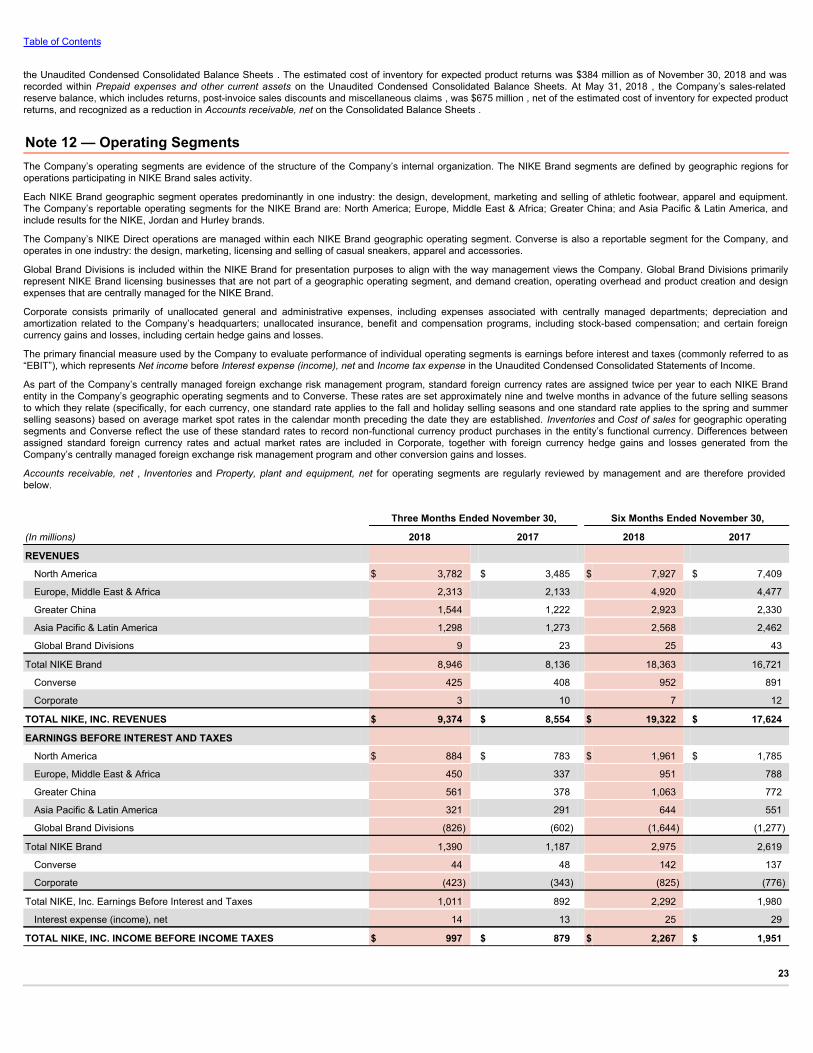
Table of Contents
the Unaudited Condensed Consolidated Balance Sheets . The estimated cost of inventory for expected product returns was $384 million as of November 30, 2018 and wasrecorded within Prepaid expenses and other current assets on the Unaudited Condensed Consolidated Balance Sheets. At May 31, 2018 , the Company’s sales-relatedreserve balance, which includes returns, post-invoice sales discounts and miscellaneous claims , was $675 million , net of the estimated cost of inventory for expected productreturns, and recognized as a reduction in Accounts receivable, net on the Consolidated Balance Sheets .
Note 12 — Operating SegmentsThe Company’s operating segments are evidence of the structure of the Company’s internal organization. The NIKE Brand segments are defined by geographic regions foroperations participating in NIKE Brand sales activity.
Each NIKE Brand geographic segment operates predominantly in one industry: the design, development, marketing and selling of athletic footwear, apparel and equipment.The Company’s reportable operating segments for the NIKE Brand are: North America; Europe, Middle East & Africa; Greater China; and Asia Pacific & Latin America, andinclude results for the NIKE, Jordan and Hurley brands.
The Company’s NIKE Direct operations are managed within each NIKE Brand geographic operating segment. Converse is also a reportable segment for the Company, andoperates in one industry: the design, marketing, licensing and selling of casual sneakers, apparel and accessories.
Global Brand Divisions is included within the NIKE Brand for presentation purposes to align with the way management views the Company. Global Brand Divisions primarilyrepresent NIKE Brand licensing businesses that are not part of a geographic operating segment, and demand creation, operating overhead and product creation and designexpenses that are centrally managed for the NIKE Brand.
Corporate consists primarily of unallocated general and administrative expenses, including expenses associated with centrally managed departments; depreciation andamortization related to the Company’s headquarters; unallocated insurance, benefit and compensation programs, including stock-based compensation; and certain foreigncurrency gains and losses, including certain hedge gains and losses.
The primary financial measure used by the Company to evaluate performance of individual operating segments is earnings before interest and taxes (commonly referred to as“EBIT”), which represents Net income before Interest expense (income), net and Income tax expense in the Unaudited Condensed Consolidated Statements of Income.
As part of the Company’s centrally managed foreign exchange risk management program, standard foreign currency rates are assigned twice per year to each NIKE Brandentity in the Company’s geographic operating segments and to Converse. These rates are set approximately nine and twelve months in advance of the future selling seasonsto which they relate (specifically, for each currency, one standard rate applies to the fall and holiday selling seasons and one standard rate applies to the spring and summerselling seasons) based on average market spot rates in the calendar month preceding the date they are established. Inventories and Cost of sales for geographic operatingsegments and Converse reflect the use of these standard rates to record non-functional currency product purchases in the entity’s functional currency. Differences betweenassigned standard foreign currency rates and actual market rates are included in Corporate, together with foreign currency hedge gains and losses generated from theCompany’s centrally managed foreign exchange risk management program and other conversion gains and losses.
Accounts receivable, net , Inventories and Property, plant and equipment, net for operating segments are regularly reviewed by management and are therefore providedbelow.
Three Months Ended November 30, Six Months Ended November 30,
(In millions) 2018 2017 2018 2017
REVENUES
North America $ 3,782 $ 3,485 $ 7,927 $ 7,409
Europe, Middle East & Africa 2,313 2,133 4,920 4,477
Greater China 1,544 1,222 2,923 2,330
Asia Pacific & Latin America 1,298 1,273 2,568 2,462
Global Brand Divisions 9 23 25 43
Total NIKE Brand 8,946 8,136 18,363 16,721
Converse 425 408 952 891
Corporate 3 10 7 12
TOTAL NIKE, INC. REVENUES $ 9,374 $ 8,554 $ 19,322 $ 17,624
EARNINGS BEFORE INTEREST AND TAXES
North America $ 884 $ 783 $ 1,961 $ 1,785
Europe, Middle East & Africa 450 337 951 788
Greater China 561 378 1,063 772
Asia Pacific & Latin America 321 291 644 551
Global Brand Divisions (826) (602) (1,644) (1,277)
Total NIKE Brand 1,390 1,187 2,975 2,619
Converse 44 48 142 137
Corporate (423) (343) (825) (776)
Total NIKE, Inc. Earnings Before Interest and Taxes 1,011 892 2,292 1,980
Interest expense (income), net 14 13 25 29
TOTAL NIKE, INC. INCOME BEFORE INCOME TAXES $ 997 $ 879 $ 2,267 $ 1,951
23
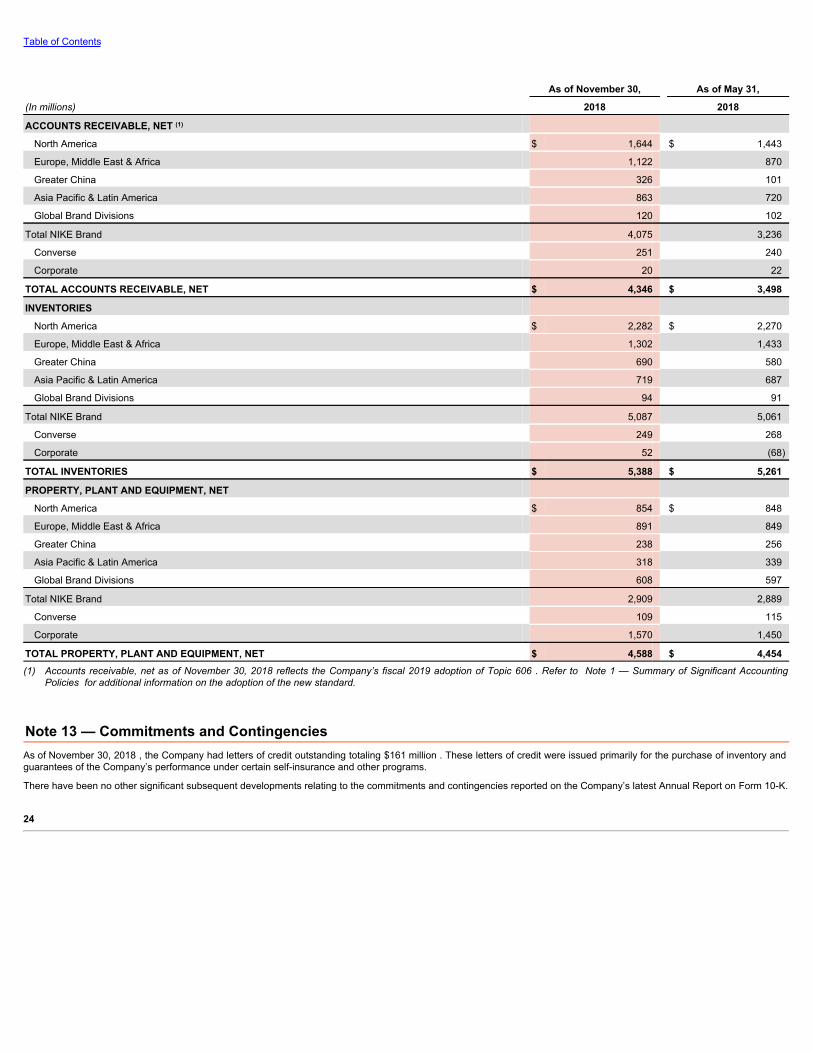
Table of Contents
As of November 30, As of May 31,
(In millions) 2018 2018
ACCOUNTS RECEIVABLE, NET (1)
North America $ 1,644 $ 1,443
Europe, Middle East & Africa 1,122 870
Greater China 326 101
Asia Pacific & Latin America 863 720
Global Brand Divisions 120 102
Total NIKE Brand 4,075 3,236
Converse 251 240
Corporate 20 22
TOTAL ACCOUNTS RECEIVABLE, NET $ 4,346 $ 3,498
INVENTORIES
North America $ 2,282 $ 2,270
Europe, Middle East & Africa 1,302 1,433
Greater China 690 580
Asia Pacific & Latin America 719 687
Global Brand Divisions 94 91
Total NIKE Brand 5,087 5,061
Converse 249 268
Corporate 52 (68)
TOTAL INVENTORIES $ 5,388 $ 5,261
PROPERTY, PLANT AND EQUIPMENT, NET
North America $ 854 $ 848
Europe, Middle East & Africa 891 849
Greater China 238 256
Asia Pacific & Latin America 318 339
Global Brand Divisions 608 597
Total NIKE Brand 2,909 2,889
Converse 109 115
Corporate 1,570 1,450
TOTAL PROPERTY, PLANT AND EQUIPMENT, NET $ 4,588 $ 4,454(1) Accounts receivable, net as of November 30, 2018 reflects the Company’s fiscal 2019 adoption of Topic 606 . Refer to Note 1 — Summary of Significant Accounting
Policies for additional information on the adoption of the new standard.
Note 13 — Commitments and ContingenciesAs of November 30, 2018 , the Company had letters of credit outstanding totaling $161 million . These letters of credit were issued primarily for the purchase of inventory andguarantees of the Company’s performance under certain self-insurance and other programs.
There have been no other significant subsequent developments relating to the commitments and contingencies reported on the Company’s latest Annual Report on Form 10-K.
24
Table of Contents
ITEM 2. Management’s Discussion and Analysis of Financial Conditionand Results of OperationsOverviewNIKE designs, develops, markets and sells athletic footwear, apparel, equipment, accessories and services worldwide. We are the largest seller of athletic footwear andapparel in the world. We sell our products through NIKE-owned retail stores and through digital platforms (which we refer to collectively as our “NIKE Direct” operations), toretail accounts and a mix of independent distributors, licensees and sales representatives in virtually all countries around the world. Our goal is to deliver value to ourshareholders by building a profitable global portfolio of branded footwear, apparel, equipment and accessories businesses. Our strategy is to achieve long-term revenue growthby creating innovative, “must have” products, building deep personal consumer connections with our brands and delivering compelling consumer experiences through digitalplatforms and at retail. In fiscal 2018, we introduced the Consumer Direct Offense, a new company alignment designed to allow NIKE to better serve the consumer morepersonally, at scale. Through the Consumer Direct Offense, we are focusing on our Triple Double strategy, with the objective of doubling the impact of innovation andincreasing our speed to market and direct connections with consumers.
For the second quarter of fiscal 2019 , NIKE, Inc. Revenues increased 10% to $9.4 billion compared to the second quarter of fiscal 2018. On a currency-neutral basis,Revenues increased 14% . Net income was $847 million and diluted earnings per common share was $0.52 , 10% and 13% higher, respectively, than the second quarter offiscal 2018.
Income before income taxes increased 13% compared to the second quarter of fiscal 2018, primarily driven by revenue growth and gross margin expansion, which was onlypartially offset by higher selling and administrative expense. The NIKE Brand, which represents over 90% of NIKE, Inc. Revenues , delivered 10% revenue growth. On acurrency-neutral basis, NIKE Brand revenues grew 14% , driven by higher revenues across all geographies and footwear and apparel, as well as growth in nearly everycategory, led by Sportswear. Revenues for Converse increased 4% and 6% on a reported and currency-neutral basis, respectively, primarily due to revenue growth in Asia andhigher digital commerce sales.
Our effective tax rate was 15.0% for the second quarter of fiscal 2019 compared to 12.7% for the second quarter of fiscal 2018, reflecting the new U.S. statutory rate andimplemented provisions of the U.S. Tax Cuts and Jobs Act .
Diluted earnings per common share reflects a 2% decline in the diluted weighted average common shares outstanding compared to the second quarter of fiscal 2018, primarilydriven by our share repurchase program.
While foreign currency markets remain volatile, partly as a result of global trade uncertainty and geopolitical dynamics, we continue to see opportunities to drive growth andprofitability and remain committed to effectively managing our business to achieve our financial goals over the long-term by executing against the operational strategiesoutlined above.
Use of Non-GAAP Financial MeasuresThroughout this Quarterly Report on Form 10-Q, we discuss non-GAAP financial measures, including references to wholesale equivalent revenues and currency-neutralrevenues, which should be considered in addition to, and not in lieu of, the financial measures calculated and presented in accordance with accounting principles generallyaccepted in the United States of America (“U.S. GAAP”). References to wholesale equivalent revenues are intended to provide context as to the total size of our NIKE Brandmarket footprint if we had no NIKE Direct operations. NIKE Brand wholesale equivalent revenues consist of (1) sales to external wholesale customers and (2) internal salesfrom our wholesale operations to our NIKE Direct operations, which are charged at prices comparable to those charged to external wholesale customers. Additionally,currency-neutral revenues are calculated using actual exchange rates in use during the comparative prior year period to enhance the visibility of the underlying business trendsexcluding the impact of translation arising from foreign currency exchange rate fluctuations.
Management uses these non-GAAP financial measures when evaluating the Company’s performance, including when making financial and operating decisions. Additionally,management believes these non-GAAP financial measures provide investors with additional financial information that should be considered when assessing our underlyingbusiness performance and trends. However, references to wholesale equivalent revenues and currency-neutral revenues should not be considered in isolation or as asubstitute for other financial measures calculated and presented in accordance with U.S. GAAP and may not be comparable to similarly titled non-GAAP measures used byother companies.
25
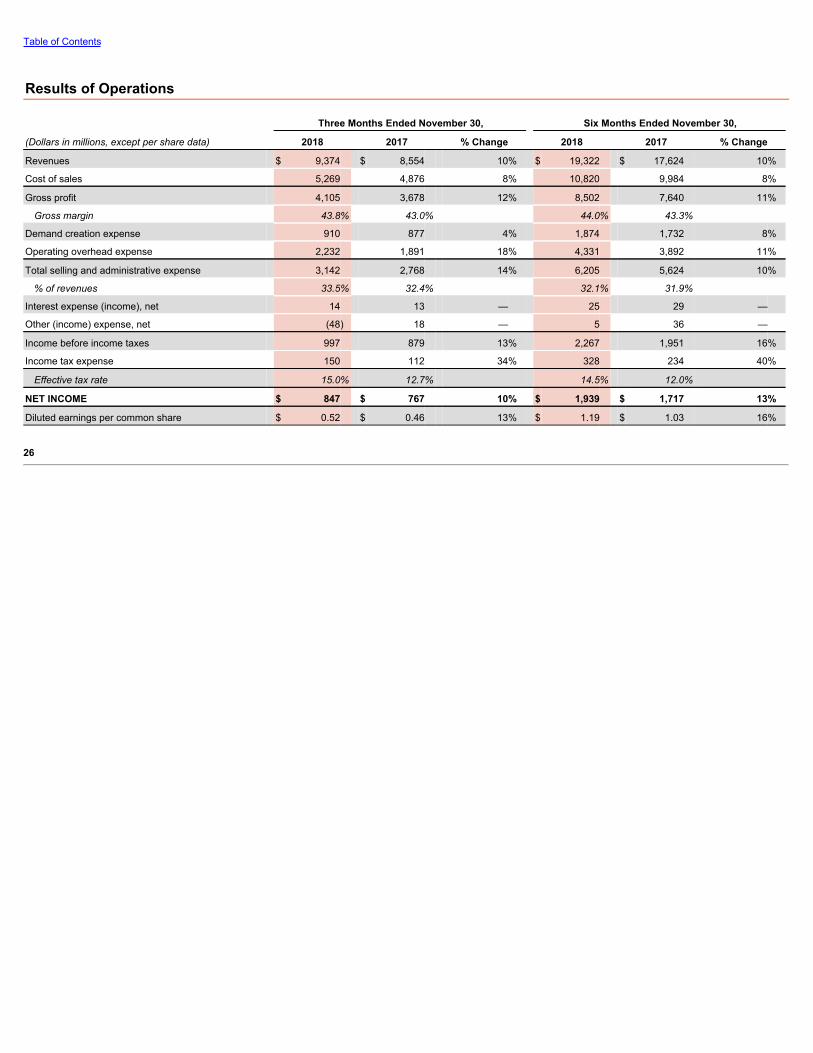
Table of Contents
Results of Operations
Three Months Ended November 30, Six Months Ended November 30,
(Dollars in millions, except per share data) 2018 2017 % Change 2018 2017 % Change
Revenues $ 9,374 $ 8,554 10% $ 19,322 $ 17,624 10%
Cost of sales 5,269 4,876 8% 10,820 9,984 8%
Gross profit 4,105 3,678 12% 8,502 7,640 11%
Gross margin 43.8% 43.0% 44.0% 43.3%
Demand creation expense 910 877 4% 1,874 1,732 8%
Operating overhead expense 2,232 1,891 18% 4,331 3,892 11%
Total selling and administrative expense 3,142 2,768 14% 6,205 5,624 10%
% of revenues 33.5% 32.4% 32.1% 31.9% Interest expense (income), net 14 13 — 25 29 —
Other (income) expense, net (48) 18 — 5 36 —
Income before income taxes 997 879 13% 2,267 1,951 16%
Income tax expense 150 112 34% 328 234 40%
Effective tax rate 15.0% 12.7% 14.5% 12.0%
NET INCOME $ 847 $ 767 10% $ 1,939 $ 1,717 13%
Diluted earnings per common share $ 0.52 $ 0.46 13% $ 1.19 $ 1.03 16%
26
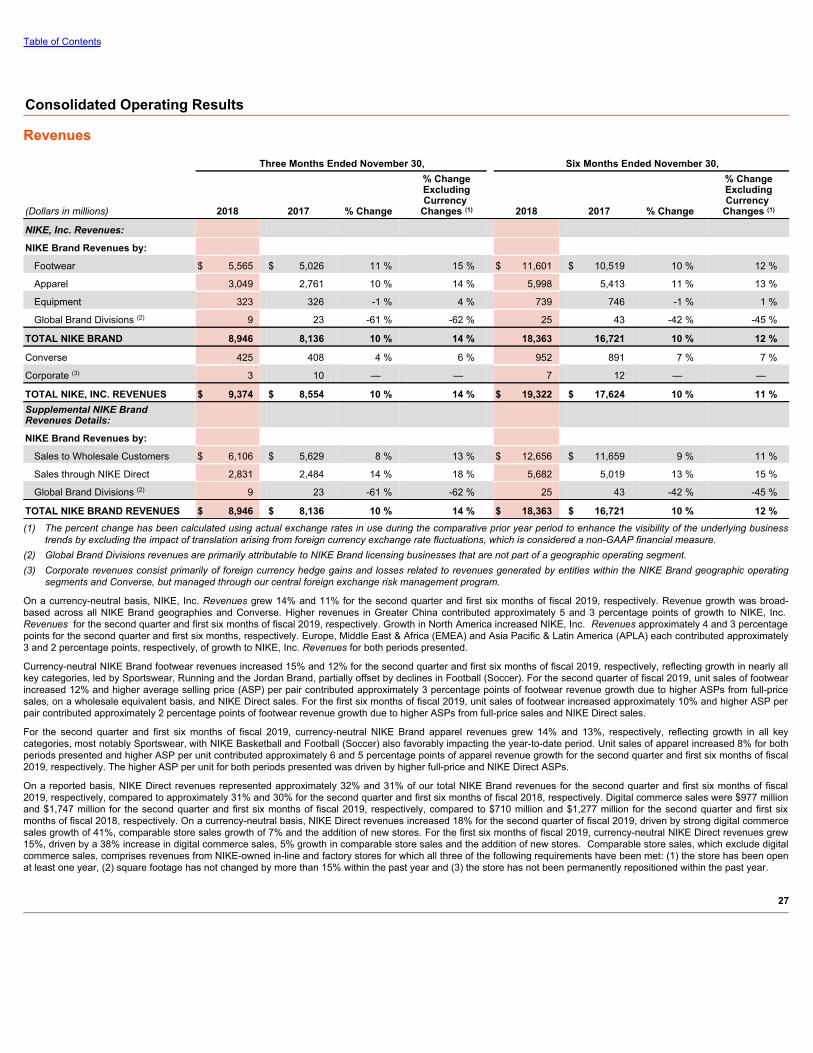
Table of Contents
Consolidated Operating Results
Revenues Three Months Ended November 30, Six Months Ended November 30,
(Dollars in millions) 2018 2017 % Change
% ChangeExcludingCurrency
Changes (1) 2018 2017 % Change
% ChangeExcludingCurrency
Changes (1)
NIKE, Inc. Revenues:
NIKE Brand Revenues by:
Footwear $ 5,565 $ 5,026 11 % 15 % $ 11,601 $ 10,519 10 % 12 %
Apparel 3,049 2,761 10 % 14 % 5,998 5,413 11 % 13 %
Equipment 323 326 -1 % 4 % 739 746 -1 % 1 %
Global Brand Divisions (2) 9 23 -61 % -62 % 25 43 -42 % -45 %
TOTAL NIKE BRAND 8,946 8,136 10 % 14 % 18,363 16,721 10 % 12 %
Converse 425 408 4 % 6 % 952 891 7 % 7 %
Corporate (3) 3 10 — — 7 12 — —
TOTAL NIKE, INC. REVENUES $ 9,374 $ 8,554 10 % 14 % $ 19,322 $ 17,624 10 % 11 %Supplemental NIKE BrandRevenues Details:
NIKE Brand Revenues by:
Sales to Wholesale Customers $ 6,106 $ 5,629 8 % 13 % $ 12,656 $ 11,659 9 % 11 %
Sales through NIKE Direct 2,831 2,484 14 % 18 % 5,682 5,019 13 % 15 %
Global Brand Divisions (2) 9 23 -61 % -62 % 25 43 -42 % -45 %
TOTAL NIKE BRAND REVENUES $ 8,946 $ 8,136 10 % 14 % $ 18,363 $ 16,721 10 % 12 %(1) The percent change has been calculated using actual exchange rates in use during the comparative prior year period to enhance the visibility of the underlying business
trends by excluding the impact of translation arising from foreign currency exchange rate fluctuations, which is considered a non-GAAP financial measure.(2) Global Brand Divisions revenues are primarily attributable to NIKE Brand licensing businesses that are not part of a geographic operating segment.(3) Corporate revenues consist primarily of foreign currency hedge gains and losses related to revenues generated by entities within the NIKE Brand geographic operating
segments and Converse, but managed through our central foreign exchange risk management program.
On a currency-neutral basis, NIKE, Inc. Revenues grew 14% and 11% for the second quarter and first six months of fiscal 2019, respectively. Revenue growth was broad-based across all NIKE Brand geographies and Converse. Higher revenues in Greater China contributed approximately 5 and 3 percentage points of growth to NIKE, Inc. Revenues for the second quarter and first six months of fiscal 2019, respectively. Growth in North America increased NIKE, Inc. Revenues approximately 4 and 3 percentagepoints for the second quarter and first six months, respectively. Europe, Middle East & Africa (EMEA) and Asia Pacific & Latin America (APLA) each contributed approximately3 and 2 percentage points, respectively, of growth to NIKE, Inc. Revenues for both periods presented.
Currency-neutral NIKE Brand footwear revenues increased 15% and 12% for the second quarter and first six months of fiscal 2019, respectively, reflecting growth in nearly allkey categories, led by Sportswear, Running and the Jordan Brand, partially offset by declines in Football (Soccer). For the second quarter of fiscal 2019, unit sales of footwearincreased 12% and higher average selling price (ASP) per pair contributed approximately 3 percentage points of footwear revenue growth due to higher ASPs from full-pricesales, on a wholesale equivalent basis, and NIKE Direct sales. For the first six months of fiscal 2019, unit sales of footwear increased approximately 10% and higher ASP perpair contributed approximately 2 percentage points of footwear revenue growth due to higher ASPs from full-price sales and NIKE Direct sales.
For the second quarter and first six months of fiscal 2019, currency-neutral NIKE Brand apparel revenues grew 14% and 13%, respectively, reflecting growth in all keycategories, most notably Sportswear, with NIKE Basketball and Football (Soccer) also favorably impacting the year-to-date period. Unit sales of apparel increased 8% for bothperiods presented and higher ASP per unit contributed approximately 6 and 5 percentage points of apparel revenue growth for the second quarter and first six months of fiscal2019, respectively. The higher ASP per unit for both periods presented was driven by higher full-price and NIKE Direct ASPs.
On a reported basis, NIKE Direct revenues represented approximately 32% and 31% of our total NIKE Brand revenues for the second quarter and first six months of fiscal2019, respectively, compared to approximately 31% and 30% for the second quarter and first six months of fiscal 2018, respectively. Digital commerce sales were $977 millionand $1,747 million for the second quarter and first six months of fiscal 2019, respectively, compared to $710 million and $1,277 million for the second quarter and first sixmonths of fiscal 2018, respectively. On a currency-neutral basis, NIKE Direct revenues increased 18% for the second quarter of fiscal 2019, driven by strong digital commercesales growth of 41%, comparable store sales growth of 7% and the addition of new stores. For the first six months of fiscal 2019, currency-neutral NIKE Direct revenues grew15%, driven by a 38% increase in digital commerce sales, 5% growth in comparable store sales and the addition of new stores. Comparable store sales, which exclude digitalcommerce sales, comprises revenues from NIKE-owned in-line and factory stores for which all three of the following requirements have been met: (1) the store has been openat least one year, (2) square footage has not changed by more than 15% within the past year and (3) the store has not been permanently repositioned within the past year.
27
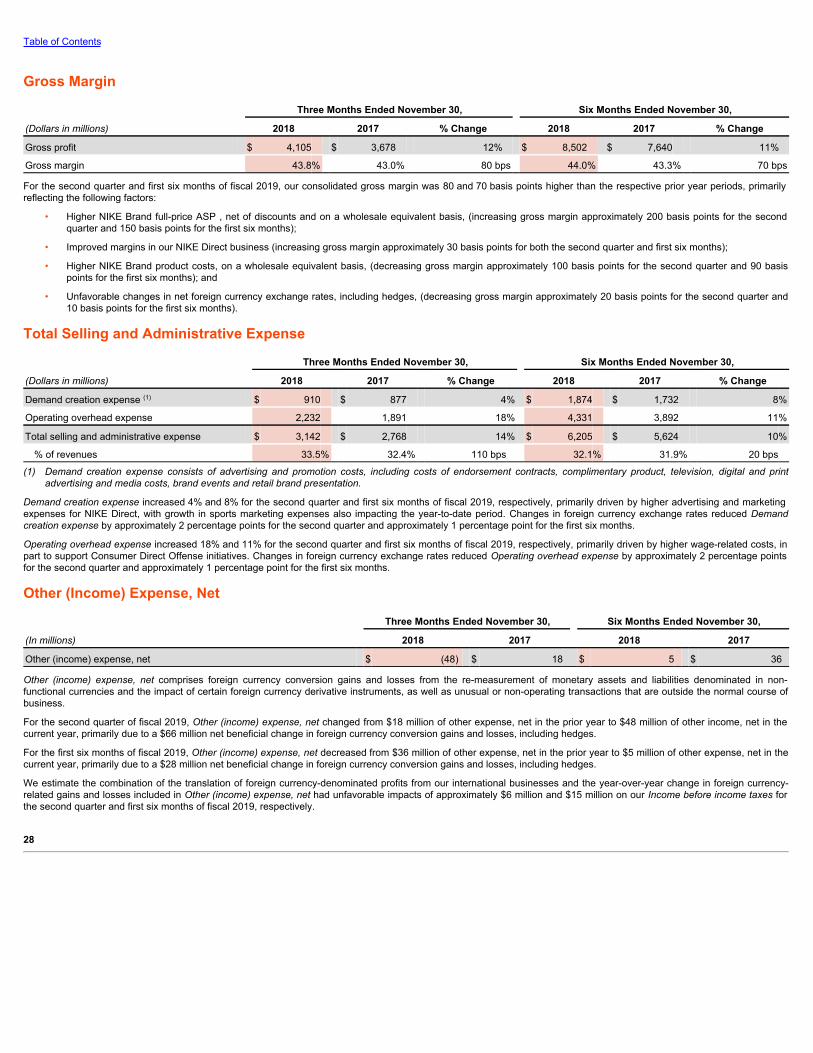
Table of Contents
Gross Margin Three Months Ended November 30, Six Months Ended November 30,
(Dollars in millions) 2018 2017 % Change 2018 2017 % Change
Gross profit $ 4,105 $ 3,678 12% $ 8,502 $ 7,640 11%
Gross margin 43.8% 43.0% 80 bps 44.0% 43.3% 70 bps
For the second quarter and first six months of fiscal 2019, our consolidated gross margin was 80 and 70 basis points higher than the respective prior year periods, primarilyreflecting the following factors:
• Higher NIKE Brand full-price ASP , net of discounts and on a wholesale equivalent basis, (increasing gross margin approximately 200 basis points for the secondquarter and 150 basis points for the first six months);
• Improved margins in our NIKE Direct business (increasing gross margin approximately 30 basis points for both the second quarter and first six months);
• Higher NIKE Brand product costs, on a wholesale equivalent basis, (decreasing gross margin approximately 100 basis points for the second quarter and 90 basispoints for the first six months); and
• Unfavorable changes in net foreign currency exchange rates, including hedges, (decreasing gross margin approximately 20 basis points for the second quarter and10 basis points for the first six months).
Total Selling and Administrative Expense Three Months Ended November 30, Six Months Ended November 30,
(Dollars in millions) 2018 2017 % Change 2018 2017 % Change
Demand creation expense (1) $ 910 $ 877 4% $ 1,874 $ 1,732 8%
Operating overhead expense 2,232 1,891 18% 4,331 3,892 11%
Total selling and administrative expense $ 3,142 $ 2,768 14% $ 6,205 $ 5,624 10%
% of revenues 33.5% 32.4% 110 bps 32.1% 31.9% 20 bps
(1) Demand creation expense consists of advertising and promotion costs, including costs of endorsement contracts, complimentary product, television, digital and printadvertising and media costs, brand events and retail brand presentation.
Demand creation expense increased 4% and 8% for the second quarter and first six months of fiscal 2019, respectively, primarily driven by higher advertising and marketingexpenses for NIKE Direct, with growth in sports marketing expenses also impacting the year-to-date period. Changes in foreign currency exchange rates reduced Demandcreation expense by approximately 2 percentage points for the second quarter and approximately 1 percentage point for the first six months.
Operating overhead expense increased 18% and 11% for the second quarter and first six months of fiscal 2019, respectively, primarily driven by higher wage-related costs, inpart to support Consumer Direct Offense initiatives. Changes in foreign currency exchange rates reduced Operating overhead expense by approximately 2 percentage pointsfor the second quarter and approximately 1 percentage point for the first six months.
Other (Income) Expense, Net Three Months Ended November 30, Six Months Ended November 30,
(In millions) 2018 2017 2018 2017
Other (income) expense, net $ (48) $ 18 $ 5 $ 36
Other (income) expense, net comprises foreign currency conversion gains and losses from the re-measurement of monetary assets and liabilities denominated in non-functional currencies and the impact of certain foreign currency derivative instruments, as well as unusual or non-operating transactions that are outside the normal course ofbusiness.
For the second quarter of fiscal 2019, Other (income) expense, net changed from $18 million of other expense, net in the prior year to $48 million of other income, net in thecurrent year, primarily due to a $66 million net beneficial change in foreign currency conversion gains and losses, including hedges.
For the first six months of fiscal 2019, Other (income) expense, net decreased from $36 million of other expense, net in the prior year to $5 million of other expense, net in thecurrent year, primarily due to a $28 million net beneficial change in foreign currency conversion gains and losses, including hedges.
We estimate the combination of the translation of foreign currency-denominated profits from our international businesses and the year-over-year change in foreign currency-related gains and losses included in Other (income) expense, net had unfavorable impacts of approximately $6 million and $15 million on our Income before income taxes forthe second quarter and first six months of fiscal 2019, respectively.
28
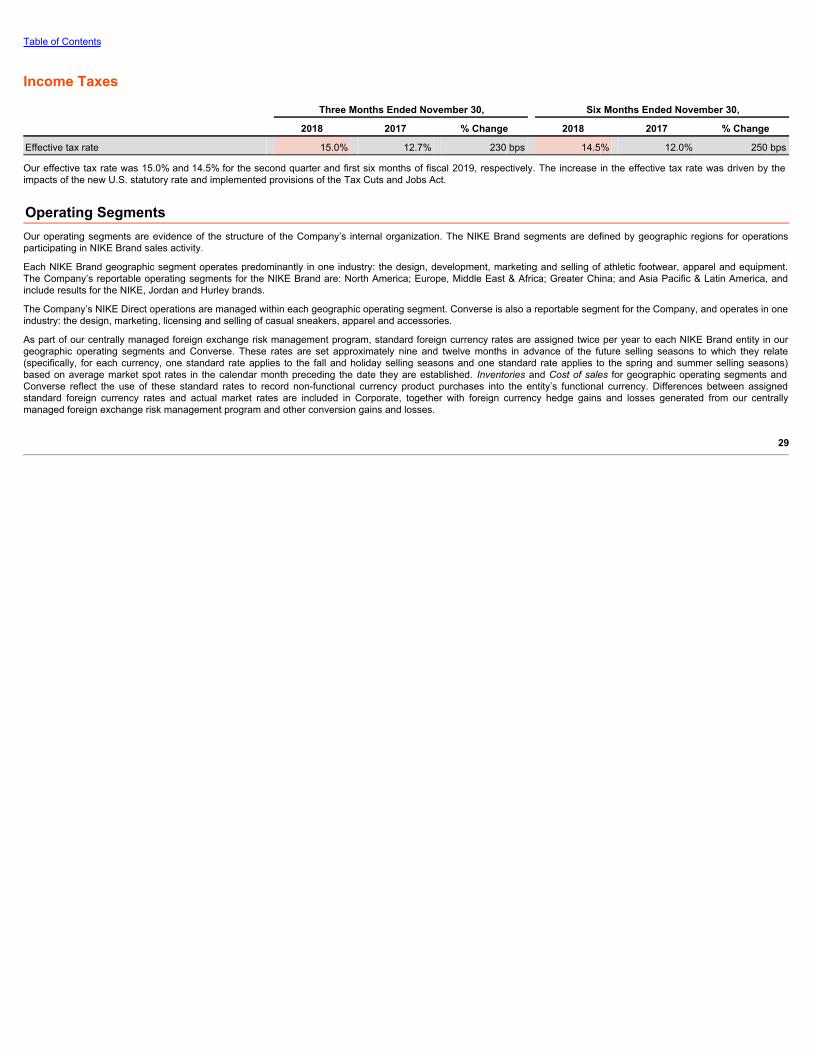
Table of Contents
Income Taxes Three Months Ended November 30, Six Months Ended November 30, 2018 2017 % Change 2018 2017 % Change
Effective tax rate 15.0% 12.7% 230 bps 14.5% 12.0% 250 bps
Our effective tax rate was 15.0% and 14.5% for the second quarter and first six months of fiscal 2019, respectively. The increase in the effective tax rate was driven by theimpacts of the new U.S. statutory rate and implemented provisions of the Tax Cuts and Jobs Act.
Operating SegmentsOur operating segments are evidence of the structure of the Company’s internal organization. The NIKE Brand segments are defined by geographic regions for operationsparticipating in NIKE Brand sales activity.
Each NIKE Brand geographic segment operates predominantly in one industry: the design, development, marketing and selling of athletic footwear, apparel and equipment.The Company’s reportable operating segments for the NIKE Brand are: North America; Europe, Middle East & Africa; Greater China; and Asia Pacific & Latin America, andinclude results for the NIKE, Jordan and Hurley brands.
The Company’s NIKE Direct operations are managed within each geographic operating segment. Converse is also a reportable segment for the Company, and operates in oneindustry: the design, marketing, licensing and selling of casual sneakers, apparel and accessories.
As part of our centrally managed foreign exchange risk management program, standard foreign currency rates are assigned twice per year to each NIKE Brand entity in ourgeographic operating segments and Converse. These rates are set approximately nine and twelve months in advance of the future selling seasons to which they relate(specifically, for each currency, one standard rate applies to the fall and holiday selling seasons and one standard rate applies to the spring and summer selling seasons)based on average market spot rates in the calendar month preceding the date they are established. Inventories and Cost of sales for geographic operating segments andConverse reflect the use of these standard rates to record non-functional currency product purchases into the entity’s functional currency. Differences between assignedstandard foreign currency rates and actual market rates are included in Corporate, together with foreign currency hedge gains and losses generated from our centrallymanaged foreign exchange risk management program and other conversion gains and losses.
29
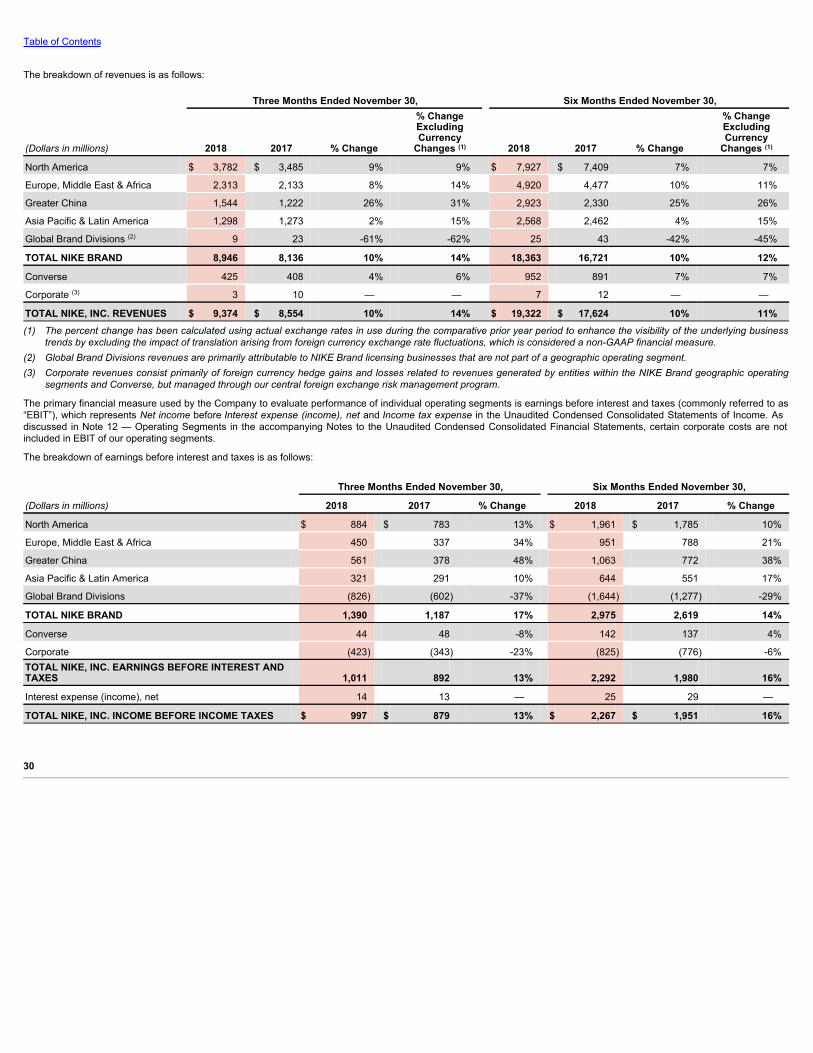
Table of Contents
The breakdown of revenues is as follows:
Three Months Ended November 30, Six Months Ended November 30,
(Dollars in millions) 2018 2017 % Change
% ChangeExcludingCurrency
Changes (1) 2018 2017 % Change
% ChangeExcludingCurrency
Changes (1)
North America $ 3,782 $ 3,485 9% 9% $ 7,927 $ 7,409 7% 7%
Europe, Middle East & Africa 2,313 2,133 8% 14% 4,920 4,477 10% 11%
Greater China 1,544 1,222 26% 31% 2,923 2,330 25% 26%
Asia Pacific & Latin America 1,298 1,273 2% 15% 2,568 2,462 4% 15%
Global Brand Divisions (2) 9 23 -61% -62% 25 43 -42% -45%
TOTAL NIKE BRAND 8,946 8,136 10% 14% 18,363 16,721 10% 12%
Converse 425 408 4% 6% 952 891 7% 7%
Corporate (3) 3 10 — — 7 12 — —
TOTAL NIKE, INC. REVENUES $ 9,374 $ 8,554 10% 14% $ 19,322 $ 17,624 10% 11%(1) The percent change has been calculated using actual exchange rates in use during the comparative prior year period to enhance the visibility of the underlying business
trends by excluding the impact of translation arising from foreign currency exchange rate fluctuations, which is considered a non-GAAP financial measure.(2) Global Brand Divisions revenues are primarily attributable to NIKE Brand licensing businesses that are not part of a geographic operating segment.(3) Corporate revenues consist primarily of foreign currency hedge gains and losses related to revenues generated by entities within the NIKE Brand geographic operating
segments and Converse, but managed through our central foreign exchange risk management program.
The primary financial measure used by the Company to evaluate performance of individual operating segments is earnings before interest and taxes (commonly referred to as“EBIT”), which represents Net income before Interest expense (income), net and Income tax expense in the Unaudited Condensed Consolidated Statements of Income. Asdiscussed in Note 12 — Operating Segments in the accompanying Notes to the Unaudited Condensed Consolidated Financial Statements, certain corporate costs are notincluded in EBIT of our operating segments.
The breakdown of earnings before interest and taxes is as follows:
Three Months Ended November 30, Six Months Ended November 30,
(Dollars in millions) 2018 2017 % Change 2018 2017 % Change
North America $ 884 $ 783 13% $ 1,961 $ 1,785 10%
Europe, Middle East & Africa 450 337 34% 951 788 21%
Greater China 561 378 48% 1,063 772 38%
Asia Pacific & Latin America 321 291 10% 644 551 17%
Global Brand Divisions (826) (602) -37% (1,644) (1,277) -29%
TOTAL NIKE BRAND 1,390 1,187 17% 2,975 2,619 14%
Converse 44 48 -8% 142 137 4%
Corporate (423) (343) -23% (825) (776) -6%TOTAL NIKE, INC. EARNINGS BEFORE INTEREST ANDTAXES 1,011 892 13% 2,292 1,980 16%
Interest expense (income), net 14 13 — 25 29 —
TOTAL NIKE, INC. INCOME BEFORE INCOME TAXES $ 997 $ 879 13% $ 2,267 $ 1,951 16%
30
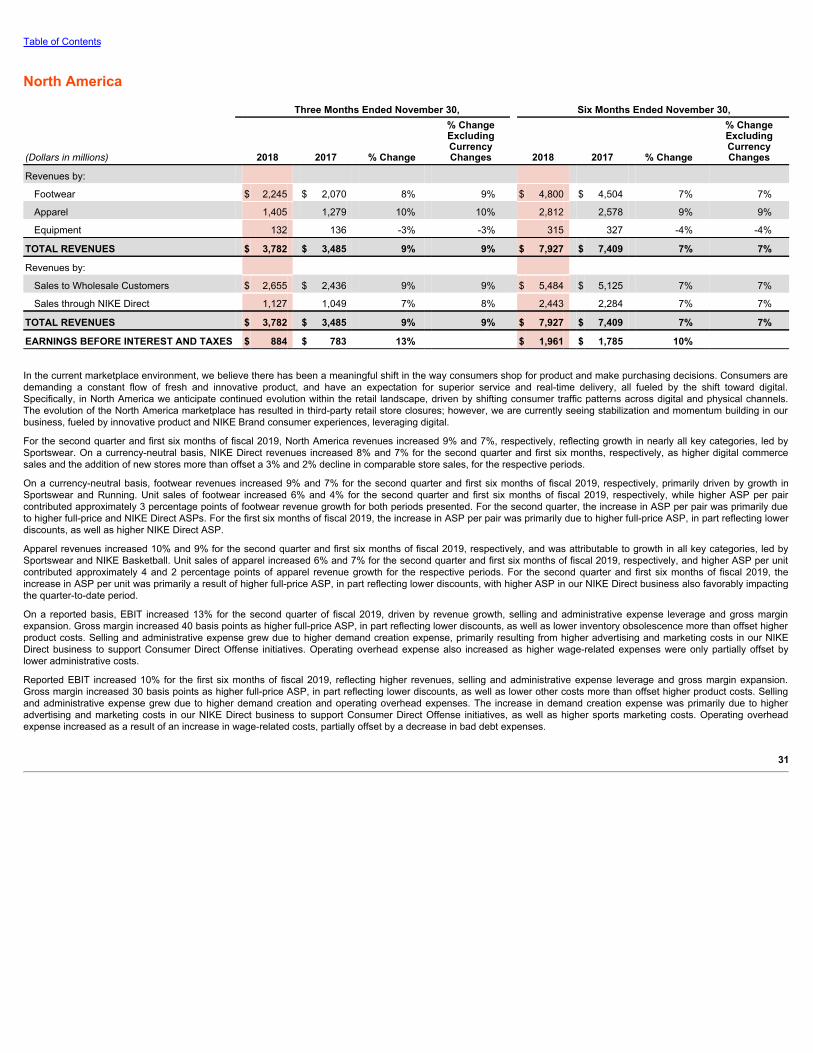
Table of Contents
North America Three Months Ended November 30, Six Months Ended November 30,
(Dollars in millions) 2018 2017 % Change
% ChangeExcludingCurrencyChanges 2018 2017 % Change
% ChangeExcludingCurrencyChanges
Revenues by:
Footwear $ 2,245 $ 2,070 8% 9% $ 4,800 $ 4,504 7% 7%
Apparel 1,405 1,279 10% 10% 2,812 2,578 9% 9%
Equipment 132 136 -3% -3% 315 327 -4% -4%
TOTAL REVENUES $ 3,782 $ 3,485 9% 9% $ 7,927 $ 7,409 7% 7%
Revenues by:
Sales to Wholesale Customers $ 2,655 $ 2,436 9% 9% $ 5,484 $ 5,125 7% 7%
Sales through NIKE Direct 1,127 1,049 7% 8% 2,443 2,284 7% 7%
TOTAL REVENUES $ 3,782 $ 3,485 9% 9% $ 7,927 $ 7,409 7% 7%
EARNINGS BEFORE INTEREST AND TAXES $ 884 $ 783 13% $ 1,961 $ 1,785 10%
In the current marketplace environment, we believe there has been a meaningful shift in the way consumers shop for product and make purchasing decisions. Consumers aredemanding a constant flow of fresh and innovative product, and have an expectation for superior service and real-time delivery, all fueled by the shift toward digital.Specifically, in North America we anticipate continued evolution within the retail landscape, driven by shifting consumer traffic patterns across digital and physical channels.The evolution of the North America marketplace has resulted in third-party retail store closures; however, we are currently seeing stabilization and momentum building in ourbusiness, fueled by innovative product and NIKE Brand consumer experiences, leveraging digital.
For the second quarter and first six months of fiscal 2019, North America revenues increased 9% and 7%, respectively, reflecting growth in nearly all key categories, led bySportswear. On a currency-neutral basis, NIKE Direct revenues increased 8% and 7% for the second quarter and first six months, respectively, as higher digital commercesales and the addition of new stores more than offset a 3% and 2% decline in comparable store sales, for the respective periods.
On a currency-neutral basis, footwear revenues increased 9% and 7% for the second quarter and first six months of fiscal 2019, respectively, primarily driven by growth inSportswear and Running. Unit sales of footwear increased 6% and 4% for the second quarter and first six months of fiscal 2019, respectively, while higher ASP per paircontributed approximately 3 percentage points of footwear revenue growth for both periods presented. For the second quarter, the increase in ASP per pair was primarily dueto higher full-price and NIKE Direct ASPs. For the first six months of fiscal 2019, the increase in ASP per pair was primarily due to higher full-price ASP, in part reflecting lowerdiscounts, as well as higher NIKE Direct ASP.
Apparel revenues increased 10% and 9% for the second quarter and first six months of fiscal 2019, respectively, and was attributable to growth in all key categories, led bySportswear and NIKE Basketball. Unit sales of apparel increased 6% and 7% for the second quarter and first six months of fiscal 2019, respectively, and higher ASP per unitcontributed approximately 4 and 2 percentage points of apparel revenue growth for the respective periods. For the second quarter and first six months of fiscal 2019, theincrease in ASP per unit was primarily a result of higher full-price ASP, in part reflecting lower discounts, with higher ASP in our NIKE Direct business also favorably impactingthe quarter-to-date period.
On a reported basis, EBIT increased 13% for the second quarter of fiscal 2019, driven by revenue growth, selling and administrative expense leverage and gross marginexpansion. Gross margin increased 40 basis points as higher full-price ASP, in part reflecting lower discounts, as well as lower inventory obsolescence more than offset higherproduct costs. Selling and administrative expense grew due to higher demand creation expense, primarily resulting from higher advertising and marketing costs in our NIKEDirect business to support Consumer Direct Offense initiatives. Operating overhead expense also increased as higher wage-related expenses were only partially offset bylower administrative costs.
Reported EBIT increased 10% for the first six months of fiscal 2019, reflecting higher revenues, selling and administrative expense leverage and gross margin expansion.Gross margin increased 30 basis points as higher full-price ASP, in part reflecting lower discounts, as well as lower other costs more than offset higher product costs. Sellingand administrative expense grew due to higher demand creation and operating overhead expenses. The increase in demand creation expense was primarily due to higheradvertising and marketing costs in our NIKE Direct business to support Consumer Direct Offense initiatives, as well as higher sports marketing costs. Operating overheadexpense increased as a result of an increase in wage-related costs, partially offset by a decrease in bad debt expenses.
31
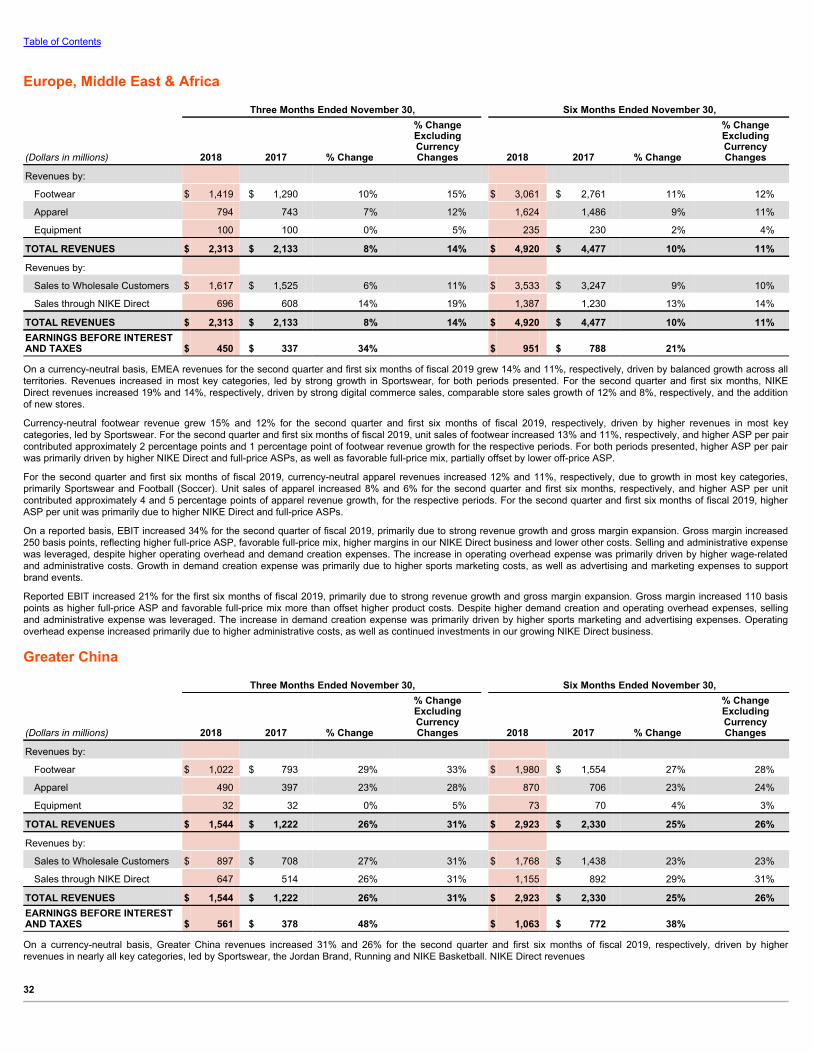
Table of Contents
Europe, Middle East & Africa Three Months Ended November 30, Six Months Ended November 30,
(Dollars in millions) 2018 2017 % Change
% ChangeExcludingCurrencyChanges 2018 2017 % Change
% ChangeExcludingCurrencyChanges
Revenues by:
Footwear $ 1,419 $ 1,290 10% 15% $ 3,061 $ 2,761 11% 12%
Apparel 794 743 7% 12% 1,624 1,486 9% 11%
Equipment 100 100 0% 5% 235 230 2% 4%
TOTAL REVENUES $ 2,313 $ 2,133 8% 14% $ 4,920 $ 4,477 10% 11%
Revenues by:
Sales to Wholesale Customers $ 1,617 $ 1,525 6% 11% $ 3,533 $ 3,247 9% 10%
Sales through NIKE Direct 696 608 14% 19% 1,387 1,230 13% 14%
TOTAL REVENUES $ 2,313 $ 2,133 8% 14% $ 4,920 $ 4,477 10% 11%EARNINGS BEFORE INTERESTAND TAXES $ 450 $ 337 34% $ 951 $ 788 21%
On a currency-neutral basis, EMEA revenues for the second quarter and first six months of fiscal 2019 grew 14% and 11%, respectively, driven by balanced growth across allterritories. Revenues increased in most key categories, led by strong growth in Sportswear, for both periods presented. For the second quarter and first six months, NIKEDirect revenues increased 19% and 14%, respectively, driven by strong digital commerce sales, comparable store sales growth of 12% and 8%, respectively, and the additionof new stores.
Currency-neutral footwear revenue grew 15% and 12% for the second quarter and first six months of fiscal 2019, respectively, driven by higher revenues in most keycategories, led by Sportswear. For the second quarter and first six months of fiscal 2019, unit sales of footwear increased 13% and 11%, respectively, and higher ASP per paircontributed approximately 2 percentage points and 1 percentage point of footwear revenue growth for the respective periods. For both periods presented, higher ASP per pairwas primarily driven by higher NIKE Direct and full-price ASPs, as well as favorable full-price mix, partially offset by lower off-price ASP.
For the second quarter and first six months of fiscal 2019, currency-neutral apparel revenues increased 12% and 11%, respectively, due to growth in most key categories,primarily Sportswear and Football (Soccer). Unit sales of apparel increased 8% and 6% for the second quarter and first six months, respectively, and higher ASP per unitcontributed approximately 4 and 5 percentage points of apparel revenue growth, for the respective periods. For the second quarter and first six months of fiscal 2019, higherASP per unit was primarily due to higher NIKE Direct and full-price ASPs.
On a reported basis, EBIT increased 34% for the second quarter of fiscal 2019, primarily due to strong revenue growth and gross margin expansion. Gross margin increased250 basis points, reflecting higher full-price ASP, favorable full-price mix, higher margins in our NIKE Direct business and lower other costs. Selling and administrative expensewas leveraged, despite higher operating overhead and demand creation expenses. The increase in operating overhead expense was primarily driven by higher wage-relatedand administrative costs. Growth in demand creation expense was primarily due to higher sports marketing costs, as well as advertising and marketing expenses to supportbrand events.
Reported EBIT increased 21% for the first six months of fiscal 2019, primarily due to strong revenue growth and gross margin expansion. Gross margin increased 110 basispoints as higher full-price ASP and favorable full-price mix more than offset higher product costs. Despite higher demand creation and operating overhead expenses, sellingand administrative expense was leveraged. The increase in demand creation expense was primarily driven by higher sports marketing and advertising expenses. Operatingoverhead expense increased primarily due to higher administrative costs, as well as continued investments in our growing NIKE Direct business.
Greater China Three Months Ended November 30, Six Months Ended November 30,
(Dollars in millions) 2018 2017 % Change
% ChangeExcludingCurrencyChanges 2018 2017 % Change
% ChangeExcludingCurrencyChanges
Revenues by:
Footwear $ 1,022 $ 793 29% 33% $ 1,980 $ 1,554 27% 28%
Apparel 490 397 23% 28% 870 706 23% 24%
Equipment 32 32 0% 5% 73 70 4% 3%
TOTAL REVENUES $ 1,544 $ 1,222 26% 31% $ 2,923 $ 2,330 25% 26%
Revenues by:
Sales to Wholesale Customers $ 897 $ 708 27% 31% $ 1,768 $ 1,438 23% 23%
Sales through NIKE Direct 647 514 26% 31% 1,155 892 29% 31%
TOTAL REVENUES $ 1,544 $ 1,222 26% 31% $ 2,923 $ 2,330 25% 26%EARNINGS BEFORE INTERESTAND TAXES $ 561 $ 378 48% $ 1,063 $ 772 38%
On a currency-neutral basis, Greater China revenues increased 31% and 26% for the second quarter and first six months of fiscal 2019, respectively, driven by higherrevenues in nearly all key categories, led by Sportswear, the Jordan Brand, Running and NIKE Basketball. NIKE Direct revenues
32
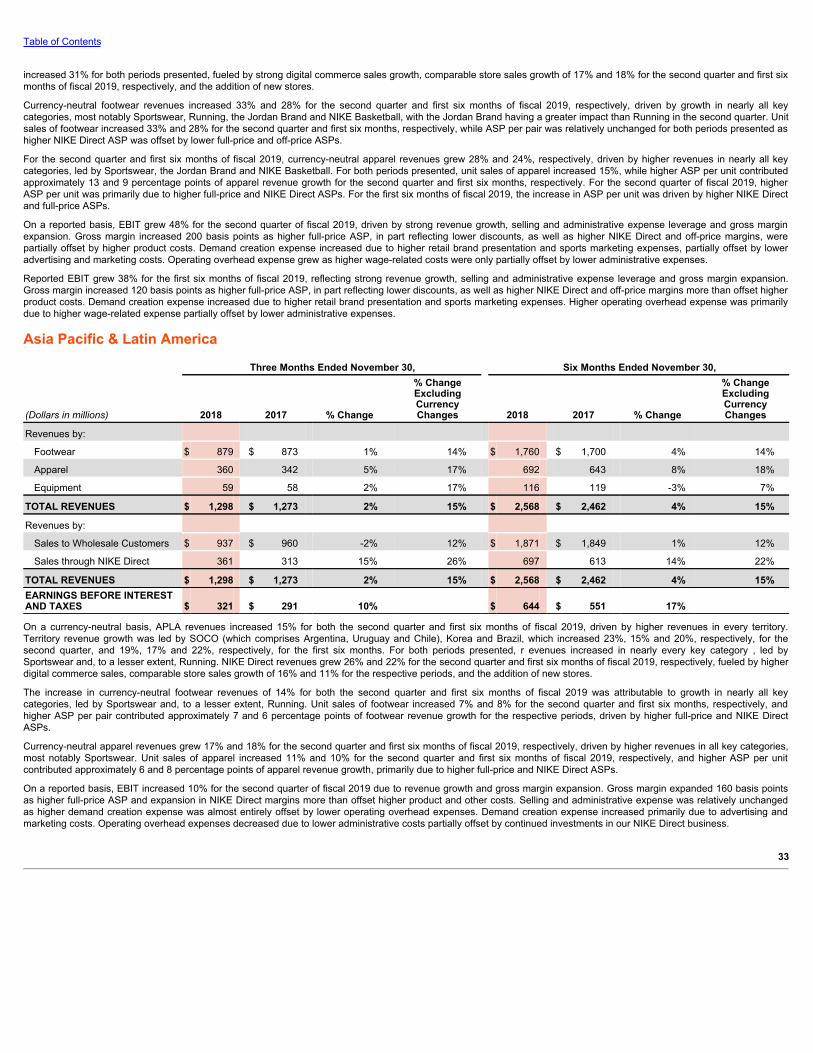
Table of Contents
increased 31% for both periods presented, fueled by strong digital commerce sales growth, comparable store sales growth of 17% and 18% for the second quarter and first sixmonths of fiscal 2019, respectively, and the addition of new stores.
Currency-neutral footwear revenues increased 33% and 28% for the second quarter and first six months of fiscal 2019, respectively, driven by growth in nearly all keycategories, most notably Sportswear, Running, the Jordan Brand and NIKE Basketball, with the Jordan Brand having a greater impact than Running in the second quarter. Unitsales of footwear increased 33% and 28% for the second quarter and first six months, respectively, while ASP per pair was relatively unchanged for both periods presented ashigher NIKE Direct ASP was offset by lower full-price and off-price ASPs.
For the second quarter and first six months of fiscal 2019, currency-neutral apparel revenues grew 28% and 24%, respectively, driven by higher revenues in nearly all keycategories, led by Sportswear, the Jordan Brand and NIKE Basketball. For both periods presented, unit sales of apparel increased 15%, while higher ASP per unit contributedapproximately 13 and 9 percentage points of apparel revenue growth for the second quarter and first six months, respectively. For the second quarter of fiscal 2019, higherASP per unit was primarily due to higher full-price and NIKE Direct ASPs. For the first six months of fiscal 2019, the increase in ASP per unit was driven by higher NIKE Directand full-price ASPs.
On a reported basis, EBIT grew 48% for the second quarter of fiscal 2019, driven by strong revenue growth, selling and administrative expense leverage and gross marginexpansion. Gross margin increased 200 basis points as higher full-price ASP, in part reflecting lower discounts, as well as higher NIKE Direct and off-price margins, werepartially offset by higher product costs. Demand creation expense increased due to higher retail brand presentation and sports marketing expenses, partially offset by loweradvertising and marketing costs. Operating overhead expense grew as higher wage-related costs were only partially offset by lower administrative expenses.
Reported EBIT grew 38% for the first six months of fiscal 2019, reflecting strong revenue growth, selling and administrative expense leverage and gross margin expansion.Gross margin increased 120 basis points as higher full-price ASP, in part reflecting lower discounts, as well as higher NIKE Direct and off-price margins more than offset higherproduct costs. Demand creation expense increased due to higher retail brand presentation and sports marketing expenses. Higher operating overhead expense was primarilydue to higher wage-related expense partially offset by lower administrative expenses.
Asia Pacific & Latin America Three Months Ended November 30, Six Months Ended November 30,
(Dollars in millions) 2018 2017 % Change
% ChangeExcludingCurrencyChanges 2018 2017 % Change
% ChangeExcludingCurrencyChanges
Revenues by:
Footwear $ 879 $ 873 1% 14% $ 1,760 $ 1,700 4% 14%
Apparel 360 342 5% 17% 692 643 8% 18%
Equipment 59 58 2% 17% 116 119 -3% 7%
TOTAL REVENUES $ 1,298 $ 1,273 2% 15% $ 2,568 $ 2,462 4% 15%
Revenues by:
Sales to Wholesale Customers $ 937 $ 960 -2% 12% $ 1,871 $ 1,849 1% 12%
Sales through NIKE Direct 361 313 15% 26% 697 613 14% 22%
TOTAL REVENUES $ 1,298 $ 1,273 2% 15% $ 2,568 $ 2,462 4% 15%EARNINGS BEFORE INTERESTAND TAXES $ 321 $ 291 10% $ 644 $ 551 17%
On a currency-neutral basis, APLA revenues increased 15% for both the second quarter and first six months of fiscal 2019, driven by higher revenues in every territory.Territory revenue growth was led by SOCO (which comprises Argentina, Uruguay and Chile), Korea and Brazil, which increased 23%, 15% and 20%, respectively, for thesecond quarter, and 19%, 17% and 22%, respectively, for the first six months. For both periods presented, r evenues increased in nearly every key category , led bySportswear and, to a lesser extent, Running. NIKE Direct revenues grew 26% and 22% for the second quarter and first six months of fiscal 2019, respectively, fueled by higherdigital commerce sales, comparable store sales growth of 16% and 11% for the respective periods, and the addition of new stores.
The increase in currency-neutral footwear revenues of 14% for both the second quarter and first six months of fiscal 2019 was attributable to growth in nearly all keycategories, led by Sportswear and, to a lesser extent, Running. Unit sales of footwear increased 7% and 8% for the second quarter and first six months, respectively, andhigher ASP per pair contributed approximately 7 and 6 percentage points of footwear revenue growth for the respective periods, driven by higher full-price and NIKE DirectASPs.
Currency-neutral apparel revenues grew 17% and 18% for the second quarter and first six months of fiscal 2019, respectively, driven by higher revenues in all key categories,most notably Sportswear. Unit sales of apparel increased 11% and 10% for the second quarter and first six months of fiscal 2019, respectively, and higher ASP per unitcontributed approximately 6 and 8 percentage points of apparel revenue growth, primarily due to higher full-price and NIKE Direct ASPs.
On a reported basis, EBIT increased 10% for the second quarter of fiscal 2019 due to revenue growth and gross margin expansion. Gross margin expanded 160 basis pointsas higher full-price ASP and expansion in NIKE Direct margins more than offset higher product and other costs. Selling and administrative expense was relatively unchangedas higher demand creation expense was almost entirely offset by lower operating overhead expenses. Demand creation expense increased primarily due to advertising andmarketing costs. Operating overhead expenses decreased due to lower administrative costs partially offset by continued investments in our NIKE Direct business.
33
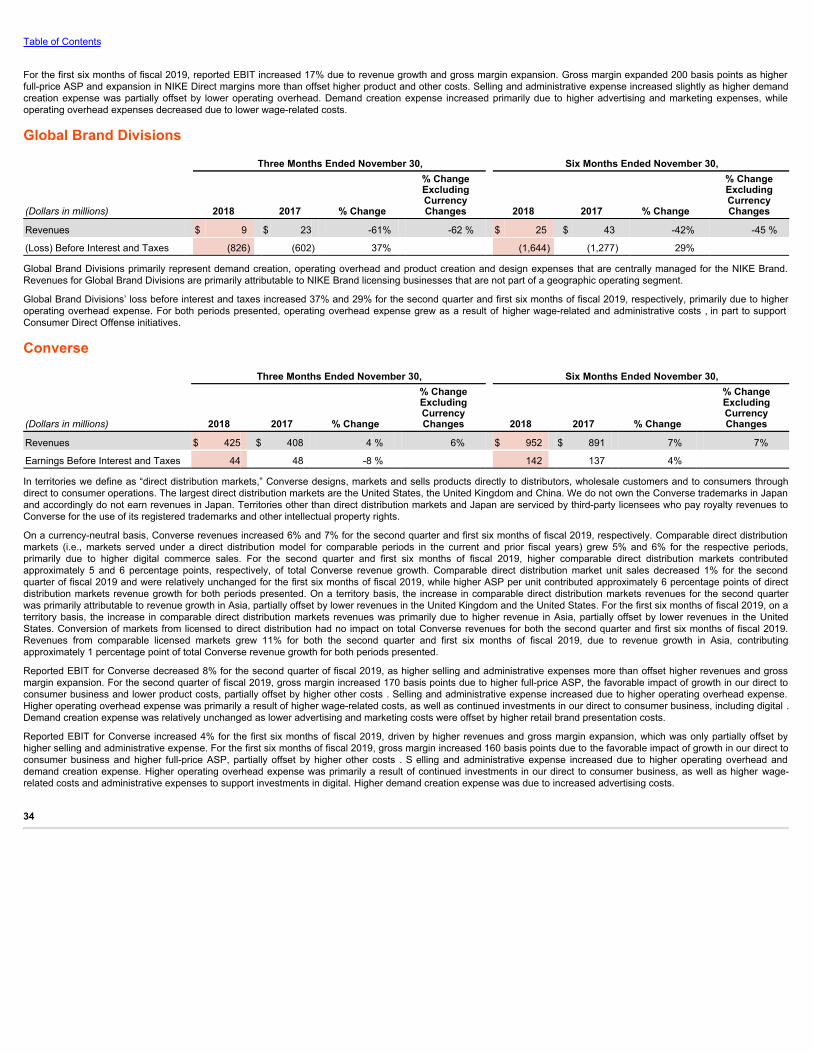
Table of Contents
For the first six months of fiscal 2019, reported EBIT increased 17% due to revenue growth and gross margin expansion. Gross margin expanded 200 basis points as higherfull-price ASP and expansion in NIKE Direct margins more than offset higher product and other costs. Selling and administrative expense increased slightly as higher demandcreation expense was partially offset by lower operating overhead. Demand creation expense increased primarily due to higher advertising and marketing expenses, whileoperating overhead expenses decreased due to lower wage-related costs.
Global Brand Divisions Three Months Ended November 30, Six Months Ended November 30,
(Dollars in millions) 2018 2017 % Change
% ChangeExcludingCurrencyChanges 2018 2017 % Change
% ChangeExcludingCurrencyChanges
Revenues $ 9 $ 23 -61% -62 % $ 25 $ 43 -42% -45 %
(Loss) Before Interest and Taxes (826) (602) 37% (1,644) (1,277) 29%
Global Brand Divisions primarily represent demand creation, operating overhead and product creation and design expenses that are centrally managed for the NIKE Brand.Revenues for Global Brand Divisions are primarily attributable to NIKE Brand licensing businesses that are not part of a geographic operating segment.
Global Brand Divisions’ loss before interest and taxes increased 37% and 29% for the second quarter and first six months of fiscal 2019, respectively, primarily due to higheroperating overhead expense. For both periods presented, operating overhead expense grew as a result of higher wage-related and administrative costs , in part to supportConsumer Direct Offense initiatives.
Converse Three Months Ended November 30, Six Months Ended November 30,
(Dollars in millions) 2018 2017 % Change
% ChangeExcludingCurrencyChanges 2018 2017 % Change
% ChangeExcludingCurrencyChanges
Revenues $ 425 $ 408 4 % 6% $ 952 $ 891 7% 7%
Earnings Before Interest and Taxes 44 48 -8 % 142 137 4%
In territories we define as “direct distribution markets,” Converse designs, markets and sells products directly to distributors, wholesale customers and to consumers throughdirect to consumer operations. The largest direct distribution markets are the United States, the United Kingdom and China. We do not own the Converse trademarks in Japanand accordingly do not earn revenues in Japan. Territories other than direct distribution markets and Japan are serviced by third-party licensees who pay royalty revenues toConverse for the use of its registered trademarks and other intellectual property rights.
On a currency-neutral basis, Converse revenues increased 6% and 7% for the second quarter and first six months of fiscal 2019, respectively. Comparable direct distributionmarkets (i.e., markets served under a direct distribution model for comparable periods in the current and prior fiscal years) grew 5% and 6% for the respective periods,primarily due to higher digital commerce sales. For the second quarter and first six months of fiscal 2019, higher comparable direct distribution markets contributedapproximately 5 and 6 percentage points, respectively, of total Converse revenue growth. Comparable direct distribution market unit sales decreased 1% for the secondquarter of fiscal 2019 and were relatively unchanged for the first six months of fiscal 2019, while higher ASP per unit contributed approximately 6 percentage points of directdistribution markets revenue growth for both periods presented. On a territory basis, the increase in comparable direct distribution markets revenues for the second quarterwas primarily attributable to revenue growth in Asia, partially offset by lower revenues in the United Kingdom and the United States. For the first six months of fiscal 2019, on aterritory basis, the increase in comparable direct distribution markets revenues was primarily due to higher revenue in Asia, partially offset by lower revenues in the UnitedStates. Conversion of markets from licensed to direct distribution had no impact on total Converse revenues for both the second quarter and first six months of fiscal 2019.Revenues from comparable licensed markets grew 11% for both the second quarter and first six months of fiscal 2019, due to revenue growth in Asia, contributingapproximately 1 percentage point of total Converse revenue growth for both periods presented.
Reported EBIT for Converse decreased 8% for the second quarter of fiscal 2019, as higher selling and administrative expenses more than offset higher revenues and grossmargin expansion. For the second quarter of fiscal 2019, gross margin increased 170 basis points due to higher full-price ASP, the favorable impact of growth in our direct toconsumer business and lower product costs, partially offset by higher other costs . Selling and administrative expense increased due to higher operating overhead expense.Higher operating overhead expense was primarily a result of higher wage-related costs, as well as continued investments in our direct to consumer business, including digital .Demand creation expense was relatively unchanged as lower advertising and marketing costs were offset by higher retail brand presentation costs.
Reported EBIT for Converse increased 4% for the first six months of fiscal 2019, driven by higher revenues and gross margin expansion, which was only partially offset byhigher selling and administrative expense. For the first six months of fiscal 2019, gross margin increased 160 basis points due to the favorable impact of growth in our direct toconsumer business and higher full-price ASP, partially offset by higher other costs . S elling and administrative expense increased due to higher operating overhead anddemand creation expense. Higher operating overhead expense was primarily a result of continued investments in our direct to consumer business, as well as higher wage-related costs and administrative expenses to support investments in digital. Higher demand creation expense was due to increased advertising costs.
34
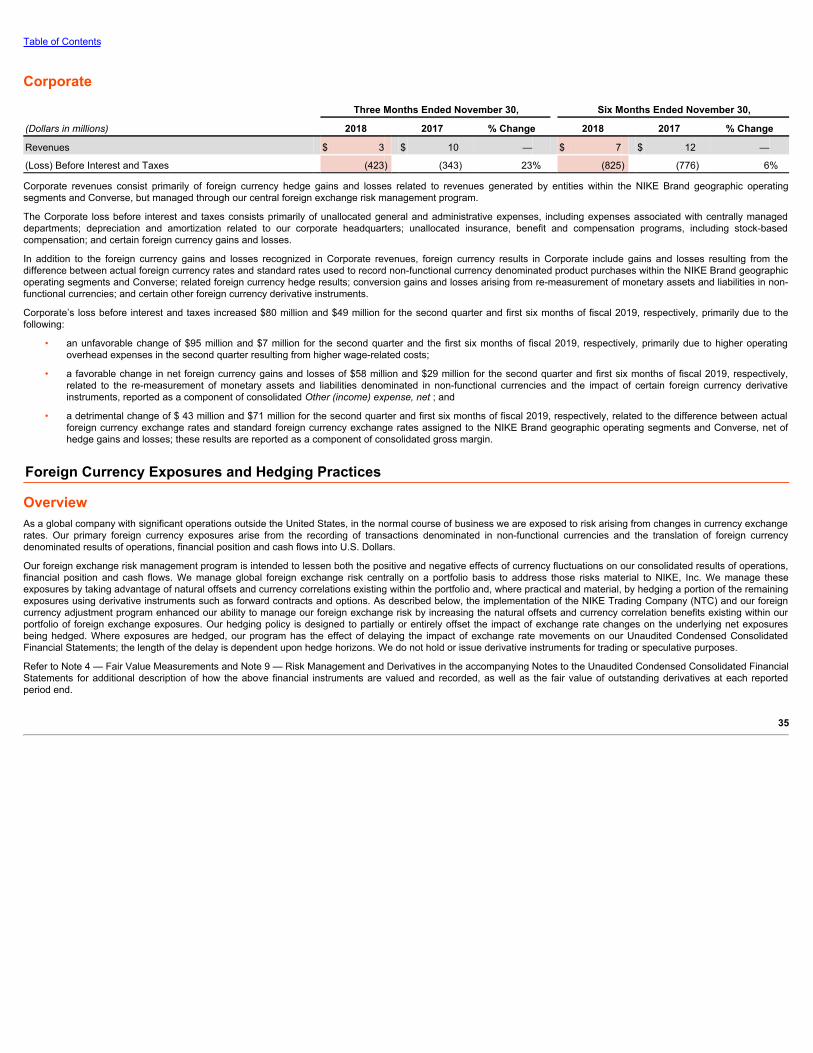
Table of Contents
Corporate Three Months Ended November 30, Six Months Ended November 30,
(Dollars in millions) 2018 2017 % Change 2018 2017 % Change
Revenues $ 3 $ 10 — $ 7 $ 12 —
(Loss) Before Interest and Taxes (423) (343) 23% (825) (776) 6%
Corporate revenues consist primarily of foreign currency hedge gains and losses related to revenues generated by entities within the NIKE Brand geographic operatingsegments and Converse, but managed through our central foreign exchange risk management program.
The Corporate loss before interest and taxes consists primarily of unallocated general and administrative expenses, including expenses associated with centrally manageddepartments; depreciation and amortization related to our corporate headquarters; unallocated insurance, benefit and compensation programs, including stock-basedcompensation; and certain foreign currency gains and losses.
In addition to the foreign currency gains and losses recognized in Corporate revenues, foreign currency results in Corporate include gains and losses resulting from thedifference between actual foreign currency rates and standard rates used to record non-functional currency denominated product purchases within the NIKE Brand geographicoperating segments and Converse; related foreign currency hedge results; conversion gains and losses arising from re-measurement of monetary assets and liabilities in non-functional currencies; and certain other foreign currency derivative instruments.
Corporate’s loss before interest and taxes increased $80 million and $49 million for the second quarter and first six months of fiscal 2019, respectively, primarily due to thefollowing:
• an unfavorable change of $95 million and $7 million for the second quarter and the first six months of fiscal 2019, respectively, primarily due to higher operatingoverhead expenses in the second quarter resulting from higher wage-related costs;
• a favorable change in net foreign currency gains and losses of $58 million and $29 million for the second quarter and first six months of fiscal 2019, respectively,related to the re-measurement of monetary assets and liabilities denominated in non-functional currencies and the impact of certain foreign currency derivativeinstruments, reported as a component of consolidated Other (income) expense, net ; and
• a detrimental change of $ 43 million and $71 million for the second quarter and first six months of fiscal 2019, respectively, related to the difference between actualforeign currency exchange rates and standard foreign currency exchange rates assigned to the NIKE Brand geographic operating segments and Converse, net ofhedge gains and losses; these results are reported as a component of consolidated gross margin.
Foreign Currency Exposures and Hedging Practices
OverviewAs a global company with significant operations outside the United States, in the normal course of business we are exposed to risk arising from changes in currency exchangerates. Our primary foreign currency exposures arise from the recording of transactions denominated in non-functional currencies and the translation of foreign currencydenominated results of operations, financial position and cash flows into U.S. Dollars.
Our foreign exchange risk management program is intended to lessen both the positive and negative effects of currency fluctuations on our consolidated results of operations,financial position and cash flows. We manage global foreign exchange risk centrally on a portfolio basis to address those risks material to NIKE, Inc. We manage theseexposures by taking advantage of natural offsets and currency correlations existing within the portfolio and, where practical and material, by hedging a portion of the remainingexposures using derivative instruments such as forward contracts and options. As described below, the implementation of the NIKE Trading Company (NTC) and our foreigncurrency adjustment program enhanced our ability to manage our foreign exchange risk by increasing the natural offsets and currency correlation benefits existing within ourportfolio of foreign exchange exposures. Our hedging policy is designed to partially or entirely offset the impact of exchange rate changes on the underlying net exposuresbeing hedged. Where exposures are hedged, our program has the effect of delaying the impact of exchange rate movements on our Unaudited Condensed ConsolidatedFinancial Statements; the length of the delay is dependent upon hedge horizons. We do not hold or issue derivative instruments for trading or speculative purposes.
Refer to Note 4 — Fair Value Measurements and Note 9 — Risk Management and Derivatives in the accompanying Notes to the Unaudited Condensed Consolidated FinancialStatements for additional description of how the above financial instruments are valued and recorded, as well as the fair value of outstanding derivatives at each reportedperiod end.
35
Table of Contents
Transactional ExposuresWe conduct business in various currencies and have transactions which subject us to foreign currency risk. Our most significant transactional foreign currency exposures are:
• Product Costs — NIKE’s product costs are exposed to fluctuations in foreign currencies in the following ways:
1. Product purchases denominated in currencies other than the functional currency of the transacting entity:
a. Certain NIKE entities purchase product from the NTC, a wholly-owned sourcing hub that buys NIKE branded products from third-party factories,predominantly in U.S. Dollars. The NTC, whose functional currency is the U.S. Dollar, then sells the products to NIKE entities in their respective functionalcurrencies. NTC sales to a NIKE entity with a different functional currency result in a foreign currency exposure for the NTC.
b. Other NIKE entities purchase product directly from third-party factories in U.S. Dollars. These purchases generate a foreign currency exposure for thoseNIKE entities with a functional currency other than the U.S. Dollar.
In both purchasing scenarios, a weaker U.S. Dollar reduces inventory costs incurred by NIKE whereas a stronger U.S. Dollar increases its cost.
2. Factory input costs: NIKE operates a foreign currency adjustment program with certain factories. The program is designed to more effectively manage foreigncurrency risk by assuming certain of the factories’ foreign currency exposures, some of which are natural offsets to our existing foreign currency exposures.Under this program, our payments to these factories are adjusted for rate fluctuations in the basket of currencies (“factory currency exposure index”) in which thelabor, materials and overhead costs incurred by the factories in the production of NIKE branded products (“factory input costs”) are denominated.
For the currency within the factory currency exposure indices that is the local or functional currency of the factory, the currency rate fluctuation affecting theproduct cost is recorded within Inventories and is recognized in Cost of sales when the related product is sold to a third-party. All currencies within the indices,excluding the U.S. Dollar and the local or functional currency of the factory, are recognized as embedded derivative contracts and are recorded at fair valuethrough Other (income) expense, net . Refer to Note 9 — Risk Management and Derivatives in the accompanying Notes to the Unaudited CondensedConsolidated Financial Statements for additional detail.
As an offset to the impacts of the fluctuating U.S. Dollar on our non-functional currency denominated product purchases described above, a strengtheningU.S. Dollar against the foreign currencies within the factory currency exposure indices decreases NIKE’s U.S. Dollar inventory cost. Conversely, a weakeningU.S. Dollar against the indexed foreign currencies increases our inventory cost.
• Non-Functional Currency Denominated External Sales — A portion of our NIKE Brand and Converse revenues associated with European operations are earned incurrencies other than the Euro (e.g. the British Pound) but are recognized at a subsidiary that uses the Euro as its functional currency. These sales generate aforeign currency exposure.
• Other Costs — Non-functional currency denominated costs, such as endorsement contracts, also generate foreign currency risk, though to a lesser extent. In certaincases, the Company has entered into contractual agreements which have payments indexed to foreign currencies that create embedded derivative contractsrecorded at fair value through Other (income) expense, net . Refer to Note 9 — Risk Management and Derivatives in the accompanying Notes to the UnauditedCondensed Consolidated Financial Statements for additional detail.
• Non-Functional Currency Denominated Monetary Assets and Liabilities — Our global subsidiaries have various assets and liabilities, primarily receivables andpayables, including intercompany receivables and payables, denominated in currencies other than their functional currencies. These balance sheet items are subjectto re-measurement which may create fluctuations in Other (income) expense, net within our consolidated results of operations.
Managing Transactional ExposuresTransactional exposures are managed on a portfolio basis within our foreign currency risk management program. We manage these exposures by taking advantage of naturaloffsets and currency correlations that exist within the portfolio and may also elect to use currency forward and option contracts to hedge the remaining effect of exchange ratefluctuations on probable forecasted future cash flows, including certain product cost exposures, non-functional currency denominated external sales and other costs describedabove. Generally, these are accounted for as cash flow hedges in accordance with U.S. GAAP, except for hedges of the embedded derivative components of the product costexposures and other contractual agreements.
Certain currency forward contracts used to manage the foreign exchange exposure of non-functional currency denominated monetary assets and liabilities subject to re-measurement and embedded derivative contracts are not formally designated as hedging instruments under U.S. GAAP. Accordingly, changes in fair value of theseinstruments are recognized in Other (income) expense, net and are intended to offset the foreign currency impact of the re-measurement of the related non-functional currencydenominated asset or liability or the embedded derivative contract being hedged.
36
Table of Contents
Translational ExposuresMany of our foreign subsidiaries operate in functional currencies other than the U.S. Dollar. Fluctuations in currency exchange rates create volatility in our reported results aswe are required to translate the balance sheets, operational results and cash flows of these subsidiaries into U.S. Dollars for consolidated reporting. The translation of foreignsubsidiaries’ non-U.S. Dollar denominated balance sheets into U.S. Dollars for consolidated reporting results in a cumulative translation adjustment to Accumulated othercomprehensive income (loss) within Shareholders’ equity . In the translation of our Unaudited Condensed Consolidated Statements of Income, a weaker U.S. Dollar in relationto foreign functional currencies benefits our consolidated earnings whereas a stronger U.S. Dollar reduces our consolidated earnings. The impact of foreign exchange ratefluctuations on the translation of our consolidated Revenues was a detriment of approximately $347 million and a benefit of approximately $97 million for the three monthsended November 30, 2018 and 2017, respectively. The impact of foreign exchange rate fluctuations on the translation of our Income before income taxes was a detriment ofapproximately $73 million and a benefit of approximately $16 million for the three months ended November 30, 2018 and 2017, respectively. The impact of foreign exchangerate fluctuations on the translation of our consolidated Revenues was a detriment of approximately $318 million and a benefit of approximately $61 million for the six monthsended November 30, 2018 and 2017, respectively. The impact of foreign exchange rate fluctuations on the translation of our Income before income taxes was a detriment ofapproximately $43 million and a benefit of approximately $6 million for the six months ended November 30, 2018 and 2017, respectively.
Management generally identifies hyper-inflationary markets as those markets whose cumulative inflation rate over a three-year period exceeds 100%. Management hasconcluded our Argentina subsidiary within our APLA operating segment is now operating in a hyper-inflationary market. As a result, beginning in the second quarter of fiscal2019, the functional currency of our Argentina subsidiary changed from the local currency to the U.S. Dollar. As of and for the three months ended November 30, 2018, thischange did not have a material impact on our results of operations or financial condition and we do not anticipate it will have a material impact in future periods based oncurrent rates.
Managing Translational ExposuresTo minimize the impact of translating foreign currency denominated revenues and expenses into U.S. Dollars for consolidated reporting, certain foreign subsidiaries use excesscash to purchase U.S. Dollar denominated available-for-sale investments. The variable future cash flows associated with the purchase and subsequent sale of theseU.S. Dollar denominated investments at non-U.S. Dollar functional currency subsidiaries creates a foreign currency exposure that qualifies for hedge accounting under U.S.GAAP. We utilize forward contracts and/or options to mitigate the variability of the forecasted future purchases and sales of these U.S. Dollar investments. The combination ofthe purchase and sale of the U.S. Dollar investment and the hedging instrument has the effect of partially offsetting the year-over-year foreign currency translation impact onnet earnings in the period the investments are sold. Hedges of the purchase of U.S. Dollar denominated available-for-sale investments are accounted for as cash flow hedges.
We estimate the combination of translation of foreign currency-denominated profits from our international businesses and the year-over-year change in foreign currency-relatedgains and losses included in Other (income) expense, net had an unfavorable impact of approximately $6 million and $15 million on our Income before income taxes for thethree and six months ended November 30, 2018 , respectively.
Net Investments in Foreign SubsidiariesWe are also exposed to the impact of foreign exchange fluctuations on our investments in wholly-owned foreign subsidiaries denominated in a currency other than theU.S. Dollar, which could adversely impact the U.S. Dollar value of these investments and, therefore, the value of future repatriated earnings. We have, in the past, hedged andmay, in the future, hedge net investment positions in certain foreign subsidiaries to mitigate the effects of foreign exchange fluctuations on these net investments. Thesehedges are accounted for as net investment hedges in accordance with U.S. GAAP. There were no outstanding net investment hedges as of November 30, 2018 and 2017 .There were no cash flows from net investment hedge settlements for the three and six months ended November 30, 2018 and 2017 .
Liquidity and Capital Resources
Cash Flow ActivityCash provided by operations was $2,825 million for the first six months of fiscal 2019, compared to $1,898 million for the first six months of fiscal 2018. Net income , adjustedfor non-cash items, generated $ 2,652 million of operating cash flows for the first six months of fiscal 2019, compared to $ 2,046 million for the first six months of fiscal 2018.The net change in working capital and other assets and liabilities resulted in a cash inflow of $173 million during fiscal 2019, compared to a cash outflow of $148 million forfiscal 2018. The net change in working capital was partly impacted by the net change in cash collateral with derivative counterparties as a result of hedging transactions.During the first six months of fiscal 2019, we received cash collateral of $236 million, as compared to posting net cash collateral of $127 million during the first six months offiscal 2018. Refer to the Credit Risk section of Note 9 — Risk Management and Derivatives for additional details. Also impacting the change in working capital was a $ 467million increase in Accounts receivable, net , driven by revenue growth.
Cash used by investing activities was $245 million for the first six months of fiscal 2019, compared to $226 million for the first six months of fiscal 2018. The primary driver ofthe change related to a $132 million increase in capital expenditures in the first six months of fiscal 2019, offset by an increase in the cash inflow of net purchases, sales andmaturities of short-term investments to $381 million for the first six months of fiscal 2019 from $271 million for the first six months of fiscal 2018.
Cash used by financing activities was $3,290 million for the first six months of fiscal 2019, compared to $1,214 million for the first six months of fiscal 2018. The increase in Cash used by financing activities was primarily driven by repayment of notes payable and higher share repurchases during the first six months of fiscal 2019 compared to thefirst six months of fiscal 2018.
37
Table of Contents
During the first six months of fiscal 2019, we repurchased 33.9 million shares of NIKE’s Class B Common Stock for $2,632 million (an average price of $77.65 per share) underthe four-year, $12 billion share repurchase program approved by the Board of Directors in November 2015. As of November 30, 2018 , we had repurchased 183.3 millionshares at a cost of approximately $11,336 million (an average price of $61.84 per share) under this program. Although the timing and number of shares purchased will bedictated by our capital needs and stock market conditions, we currently anticipate completing this repurchase program during fiscal 2019. In June 2018, our Board of Directorsapproved a new four-year, $15 billion program to repurchase shares of NIKE’s Class B Common Stock, which we anticipate will commence at the completion of our currentprogram. We continue to expect funding of share repurchases will come from operating cash flows, excess cash and/or proceeds from debt.
Capital ResourcesOn July 21, 2016, we filed a shelf registration statement (the “Shelf”) with the SEC which permits us to issue an unlimited amount of debt securities from time to time. The Shelfexpires on July 21, 2019. For additional detail refer to Note 8 — Long Term Debt in our Annual Report on Form 10-K for the fiscal year ended May 31, 2018 .
On August 28, 2015, we entered into a committed credit facility agreement with a syndicate of banks, which provides for up to $2 billion of borrowings. The facility maturesAugust 28, 2020, with a one-year extension option prior to any anniversary of the closing date, provided that in no event shall it extend beyond August 28, 2022. As of and forthe six months ended November 30, 2018 , we had no amounts outstanding under the committed credit facility.
We currently have long-term debt ratings of AA- and A1 from Standard and Poor’s Corporation and Moody’s Investor Services, respectively. If our long-term debt ratings wereto decline, the facility fee and interest rate under our committed credit facility would increase. Conversely, if our long-term debt ratings were to improve, the facility fee andinterest rate would decrease. Changes in our long-term debt ratings would not trigger acceleration of maturity of any then-outstanding borrowings or any future borrowingsunder the committed credit facility. Under this facility, we have agreed to various covenants. These covenants include limits on our disposal of fixed assets and the amount ofdebt secured by liens we may incur, as well as limits on the indebtedness we can incur relative to our net worth. In the event we were to have any borrowings outstandingunder this facility and failed to meet any covenant, and were unable to obtain a waiver from a majority of the banks in the syndicate, any borrowings would become immediatelydue and payable. As of November 30, 2018 , we were in full compliance with each of these covenants and believe it is unlikely we will fail to meet any of these covenants in theforeseeable future.
Liquidity is also provided by our $2 billion commercial paper program. On June 1, 2018, we repaid $325 million of commercial paper outstanding and had no additionalborrowings under this program as of and for the six months ended November 30, 2018 . We may continue to issue commercial paper or other debt securities during fiscal 2019depending on general corporate needs. We currently have short-term debt ratings of A1+ and P1 from Standard and Poor’s Corporation and Moody’s Investor Services,respectively.
To date, in fiscal 2019 , we have not experienced difficulty accessing the credit markets or incurred higher interest costs; however, future volatility in the capital markets mayincrease costs associated with issuing commercial paper or other debt instruments or affect our ability to access those markets.
As of November 30, 2018 , we had cash, cash equivalents and short-term investments totaling $4.0 billion , consisting primarily of deposits held at major banks, money marketfunds, commercial paper, corporate notes, U.S. Treasury obligations, U.S. government sponsored enterprise obligations and other investment grade fixed-incomesecurities. Our fixed-income investments are exposed to both credit and interest rate risk. All of our investments are investment grade to minimize our credit risk. Whileindividual securities have varying durations, as of November 30, 2018 , the weighted-average days to maturity of our cash equivalents and short-term investments portfolio was32 days.
We believe that existing cash, cash equivalents, short-term investments and cash generated by operations, together with access to external sources of funds as describedabove, will be sufficient to meet our domestic and foreign capital needs in the foreseeable future.
Contractual ObligationsThere have been no significant changes to the contractual obligations reported in our Annual Report on Form 10-K for the fiscal year ended May 31, 2018.
Off-Balance Sheet ArrangementsAs of November 30, 2018 , we did not have any off-balance sheet arrangements that have, or are reasonably likely to have, a material current or future effect on our financialcondition, results of operations, liquidity, capital expenditures or capital resources.
New Accounting PronouncementsRefer to Note 1 — Summary of Significant Accounting Policies in the accompanying Notes to the Unaudited Condensed Consolidated Financial Statements for recentlyadopted and recently issued accounting standards.
Critical Accounting PoliciesOur discussion and analysis of our financial condition and results of operations are based upon our Unaudited Condensed Consolidated Financial Statements, which havebeen prepared in accordance with U.S. GAAP. The preparation of these financial statements requires us to make estimates and judgments that affect the reported amounts ofassets, liabilities, revenues and expenses and related disclosure of contingent assets and liabilities.
We believe that the estimates, assumptions and judgments involved in the accounting policies described in the “Management’s Discussion and Analysis of Financial Conditionand Results of Operations” section of our most recent Annual Report on Form 10-K have the greatest potential impact on our financial statements, so we consider these to beour critical accounting policies. Actual results could differ from the estimates we use in applying our critical accounting policies. We are not currently aware of any reasonablylikely events or circumstances that would result in materially different amounts being reported.
38
Table of Contents
The following critical accounting policy has changed from our most recent Annual Report on Form 10-K. Refer also to Note 1 — Summary of Significant Accounting Policies foradditional information on the adoption of Topic 606.
Revenue RecognitionRevenue transactions associated with the sale of NIKE Brand footwear, apparel and equipment, as well as Converse products, comprise a single performance obligation,which consists of the sale of products to customers either through wholesale or direct to consumer channels. We satisfy the performance obligation and record revenues whentransfer of control has passed to the customer, based on the terms of sale. A customer is considered to have control once they’re able to direct the use and receivesubstantially all of the benefits of the product. Transfer of control passes to wholesale customers upon shipment or upon receipt depending on the country of the sale and theagreement with the customer. Control passes to retail store customers at the time of sale and to substantially all digital commerce customers upon shipment. The transactionprice is determined based upon the invoiced sales price, less anticipated sales returns, discounts and miscellaneous claims from customers. Payment terms for wholesaletransactions depend on the country of sale or agreement with the customer and payment is generally required within 90 days or less of shipment to or receipt by the wholesalecustomer. Payment is due at the time of sale for retail store and digital commerce transactions.
As part of our revenue recognition policy, consideration promised in our contracts with customers includes a variable amount related to anticipated sales returns, discounts andmiscellaneous claims from customers. This variable consideration is estimated and recorded as a reduction to Revenues and as an increase to Accrued liabilities at the timerevenues are recognized. The estimated cost of inventory for returned product related to anticipated sales returns is recorded in Prepaid expenses and other current assets .
The provision for anticipated sales returns consists of both contractual return rights and discretionary authorized returns. Provisions for post-invoice sales discounts consist ofboth contractual programs and discretionary discounts that are expected to be granted at a later date.
Estimates of discretionary authorized returns, discounts and claims are based on (1) historical rates, (2) specific identification of outstanding returns not yet received fromcustomers and outstanding discounts and claims and (3) estimated returns, discounts and claims expected, but not yet finalized with customers. Actual returns, discounts andclaims in any future period are inherently uncertain and thus may differ from estimates recorded. If actual or expected future returns, discounts or claims were significantlygreater or lower than the reserves established, a reduction or increase to net revenues would be recorded in the period in which such determination was made.
39
Table of Contents
ITEM 3. Quantitative and Qualitative Disclosures about Market RiskThere have been no material changes from the information previously reported under Part II, Item 7A of our Annual Report on Form 10-K for the fiscal year ended May 31,2018 .
ITEM 4. Controls and ProceduresWe maintain disclosure controls and procedures that are designed to provide reasonable assurance that information required to be disclosed in our Securities Exchange Act of1934, as amended (“the Exchange Act”) reports is recorded, processed, summarized and reported within the time periods specified in the Securities and ExchangeCommission’s rules and forms and that such information is accumulated and communicated to our management, including our Chief Executive Officer and Chief FinancialOfficer, as appropriate, to allow for timely decisions regarding required disclosure. In designing and evaluating the disclosure controls and procedures, managementrecognizes that any controls and procedures, no matter how well designed and operated, can provide only reasonable assurance of achieving the desired control objectives,and management is required to apply its judgment in evaluating the cost-benefit relationship of possible controls and procedures.
We carry out a variety of ongoing procedures under the supervision and with the participation of our management, including our Chief Executive Officer and Chief FinancialOfficer, to evaluate the effectiveness of the design and operation of our disclosure controls and procedures. Based on the foregoing, our Chief Executive Officer and ChiefFinancial Officer concluded that our disclosure controls and procedures were effective at the reasonable assurance level as of November 30, 2018 .
We are continuing several transformation initiatives to centralize and simplify our business processes and systems. These are long-term initiatives, which we believe willenhance our internal control over financial reporting due to increased automation and further integration of related processes. We will continue to monitor our internal controlover financial reporting for effectiveness throughout the transformation.
There have not been any changes in our internal control over financial reporting during our most recent fiscal quarter that have materially affected, or are reasonably likely tomaterially affect, our internal control over financial reporting.
40
Table of Contents
Special Note Regarding Forward-LookingStatements and Analyst Reports
Certain written and oral statements, other than purely historic information, including estimates, projections, statements relating to NIKE’s business plans, objectives andexpected operating results and the assumptions upon which those statements are based, made or incorporated by reference from time to time by NIKE or its representatives inthis report, other reports, filings with the Securities and Exchange Commission, press releases, conferences or otherwise, are “forward-looking statements” within the meaningof the Private Securities Litigation Reform Act of 1995 and Section 21E of the Securities Exchange Act of 1934, as amended. Forward-looking statements include, withoutlimitation, any statement that may predict, forecast, indicate or imply future results, performance or achievements, and may contain the words “believe,” “anticipate,” “expect,”“estimate,” “project,” “will be,” “will continue,” “will likely result” or words or phrases of similar meaning. Forward-looking statements involve risks and uncertainties which maycause actual results to differ materially from the forward-looking statements. The risks and uncertainties are detailed from time to time in reports filed by NIKE with theSecurities and Exchange Commission, including reports filed on Forms 8-K, 10-Q and 10-K, and include, among others, the following: international, national and local generaleconomic and market conditions; the size and growth of the overall athletic footwear, apparel and equipment markets; intense competition among designers, marketers,distributors and sellers of athletic footwear, apparel and equipment for consumers and endorsers; demographic changes; changes in consumer preferences; popularity ofparticular designs, categories of products and sports; seasonal and geographic demand for NIKE products; difficulties in anticipating or forecasting changes in consumerpreferences, consumer demand for NIKE products and the various market factors described above; difficulties in implementing, operating and maintaining NIKE’s increasinglycomplex information technology systems and controls, including, without limitation, the systems related to demand and supply planning and inventory control; interruptions indata and information technology systems; consumer data security; fluctuations and difficulty in forecasting operating results, including, without limitation, the fact that advanceorders may not be indicative of future revenues due to changes in shipment timing, the changing mix of orders with shorter lead times, and discounts, order cancellations andreturns; the ability of NIKE to sustain, manage or forecast its growth and inventories; the size, timing and mix of purchases of NIKE’s products; increases in the cost ofmaterials, labor and energy used to manufacture products; new product development and introduction; the ability to secure and protect trademarks, patents and otherintellectual property; product performance and quality; customer service; adverse publicity, including without limitation, through social media or in connection with branddamaging events; the loss of significant customers or suppliers; dependence on distributors and licensees; business disruptions; increased costs of freight and transportationto meet delivery deadlines; increases in borrowing costs due to any decline in NIKE’s debt ratings; changes in business strategy or development plans; general risksassociated with doing business outside of the United States, including, without limitation, exchange rate fluctuations, inflation, import duties, tariffs, quotas, political andeconomic instability and terrorism; the impact of recent U.S. tax reform legislation on our results of operations; the political impact of new laws, regulations or policy, including,without limitation, tariffs, import/export, trade and immigration regulations or policies; changes in government regulations; the impact of, including business and legaldevelopments relating to, climate change and natural disasters; litigation, regulatory proceedings and other claims asserted against NIKE; the ability to attract and retainqualified employees, and any negative public perception with respect to personnel; the effects of NIKE’s decision to invest in or divest of businesses and other factorsreferenced or incorporated by reference in this report and other reports.
The risks included here are not exhaustive. Other sections of this report may include additional factors which could adversely affect NIKE’s business and financial performance.Moreover, NIKE operates in a very competitive and rapidly changing environment. New risks emerge from time to time and it is not possible for management to predict all suchrisks, nor can it assess the impact of all such risks on NIKE’s business or the extent to which any risk, or combination of risks, may cause actual results to differ materially fromthose contained in any forward-looking statements. Given these risks and uncertainties, investors should not place undue reliance on forward-looking statements as aprediction of actual results.
Investors should also be aware that while NIKE does, from time to time, communicate with securities analysts, it is against NIKE’s policy to disclose to them any material non-public information or other confidential commercial information. Accordingly, shareholders should not assume that NIKE agrees with any statement or report issued by anyanalyst irrespective of the content of the statement or report. Furthermore, NIKE has a policy against issuing or confirming financial forecasts or projections issued by others.Thus, to the extent that reports issued by securities analysts contain any projections, forecasts or opinions, such reports are not the responsibility of NIKE.
41
Table of Contents
PART II - OTHER INFORMATIONITEM 1. Legal ProceedingsThere have been no material developments with respect to the information previously reported under Part I, Item 3 of our Annual Report on Form 10-K for the fiscal year endedMay 31, 2018 .
ITEM 1A. Risk FactorsThere have been no material changes in our risk factors from those disclosed in Part I, Item 1A of our Annual Report on Form 10-K for the fiscal year ended May 31, 2018 .
ITEM 2. Unregistered Sales of Equity Securities and Use of ProceedsIn November 2015, the Board of Directors approved a four-year, $12 billion share repurchase program. As of November 30, 2018 , the Company had repurchased 183.3million shares at an average price of $61.84 per share for a total approximate cost of $11.3 billion under this program.
The following table presents a summary of share repurchases made by NIKE under this program during the quarter ended November 30, 2018 :
Period Total Number of
Shares Purchased Average PricePaid per Share
Total Number of SharesPurchased as Part of Publicly
Announced Plans orPrograms
Maximum Number (or ApproximateDollar Value) of Shares that May Yet Be
Purchased Under the Plansor Programs (In millions)
September 1 — September 30, 2018 4,144,461 $ 82.62 4,144,461 $ 1,573
October 1 — October 31, 2018 7,350,000 $ 76.83 7,350,000 $ 1,008
November 1 — November 30, 2018 4,613,116 $ 74.53 4,613,116 $ 664
16,107,577 $ 77.66 16,107,577
42
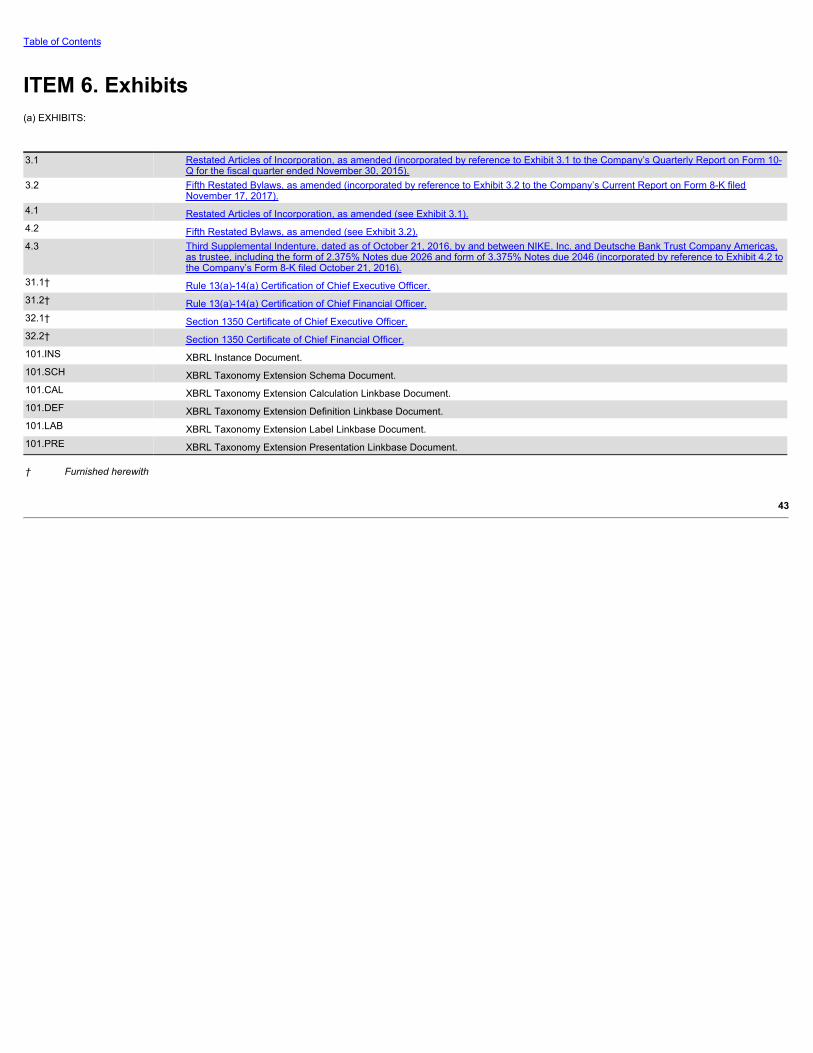
Table of Contents
ITEM 6. Exhibits(a) EXHIBITS:
3.1
Restated Articles of Incorporation, as amended (incorporated by reference to Exhibit 3.1 to the Company’s Quarterly Report on Form 10-Q for the fiscal quarter ended November 30, 2015).
3.2
Fifth Restated Bylaws, as amended (incorporated by reference to Exhibit 3.2 to the Company’s Current Report on Form 8-K filedNovember 17, 2017).
4.1 Restated Articles of Incorporation, as amended (see Exhibit 3.1).4.2 Fifth Restated Bylaws, as amended (see Exhibit 3.2).4.3
Third Supplemental Indenture, dated as of October 21, 2016, by and between NIKE, Inc. and Deutsche Bank Trust Company Americas,as trustee, including the form of 2.375% Notes due 2026 and form of 3.375% Notes due 2046 (incorporated by reference to Exhibit 4.2 tothe Company’s Form 8-K filed October 21, 2016).
31.1† Rule 13(a)-14(a) Certification of Chief Executive Officer.31.2† Rule 13(a)-14(a) Certification of Chief Financial Officer.32.1† Section 1350 Certificate of Chief Executive Officer.32.2† Section 1350 Certificate of Chief Financial Officer.101.INS XBRL Instance Document.101.SCH XBRL Taxonomy Extension Schema Document.101.CAL XBRL Taxonomy Extension Calculation Linkbase Document.101.DEF XBRL Taxonomy Extension Definition Linkbase Document.101.LAB XBRL Taxonomy Extension Label Linkbase Document.101.PRE XBRL Taxonomy Extension Presentation Linkbase Document.
† Furnished herewith
43
Table of Contents
SignaturesPursuant to the requirements of the Securities Exchange Act of 1934, the registrant has duly caused this report to be signed on its behalf by the undersigned thereunto dulyauthorized.
NIKE, Inc.
an Oregon Corporation
/S/ ANDREW CAMPION
Andrew CampionChief Financial Officer and Authorized
Officer
DATED: January 8, 2019
44
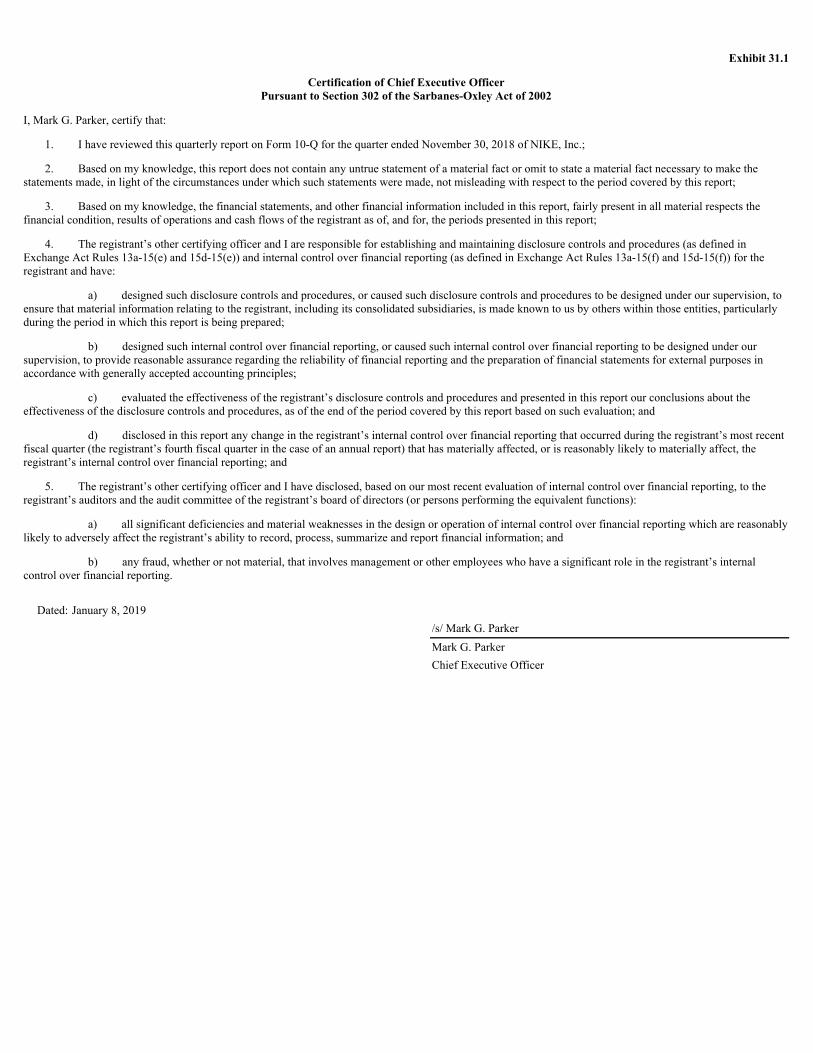
Exhibit 31.1
Certification of Chief Executive OfficerPursuant to Section 302 of the Sarbanes-Oxley Act of 2002
I, Mark G. Parker, certify that:
1. I have reviewed this quarterly report on Form 10-Q for the quarter ended November 30, 2018 of NIKE, Inc.;
2. Based on my knowledge, this report does not contain any untrue statement of a material fact or omit to state a material fact necessary to make thestatements made, in light of the circumstances under which such statements were made, not misleading with respect to the period covered by this report;
3. Based on my knowledge, the financial statements, and other financial information included in this report, fairly present in all material respects thefinancial condition, results of operations and cash flows of the registrant as of, and for, the periods presented in this report;
4. The registrant’s other certifying officer and I are responsible for establishing and maintaining disclosure controls and procedures (as defined inExchange Act Rules 13a-15(e) and 15d-15(e)) and internal control over financial reporting (as defined in Exchange Act Rules 13a-15(f) and 15d-15(f)) for theregistrant and have:
a) designed such disclosure controls and procedures, or caused such disclosure controls and procedures to be designed under our supervision, toensure that material information relating to the registrant, including its consolidated subsidiaries, is made known to us by others within those entities, particularlyduring the period in which this report is being prepared;
b) designed such internal control over financial reporting, or caused such internal control over financial reporting to be designed under oursupervision, to provide reasonable assurance regarding the reliability of financial reporting and the preparation of financial statements for external purposes inaccordance with generally accepted accounting principles;
c) evaluated the effectiveness of the registrant’s disclosure controls and procedures and presented in this report our conclusions about theeffectiveness of the disclosure controls and procedures, as of the end of the period covered by this report based on such evaluation; and
d) disclosed in this report any change in the registrant’s internal control over financial reporting that occurred during the registrant’s most recentfiscal quarter (the registrant’s fourth fiscal quarter in the case of an annual report) that has materially affected, or is reasonably likely to materially affect, theregistrant’s internal control over financial reporting; and
5. The registrant’s other certifying officer and I have disclosed, based on our most recent evaluation of internal control over financial reporting, to theregistrant’s auditors and the audit committee of the registrant’s board of directors (or persons performing the equivalent functions):
a) all significant deficiencies and material weaknesses in the design or operation of internal control over financial reporting which are reasonablylikely to adversely affect the registrant’s ability to record, process, summarize and report financial information; and
b) any fraud, whether or not material, that involves management or other employees who have a significant role in the registrant’s internalcontrol over financial reporting.
Dated: January 8, 2019 /s/ Mark G. Parker Mark G. Parker Chief Executive Officer
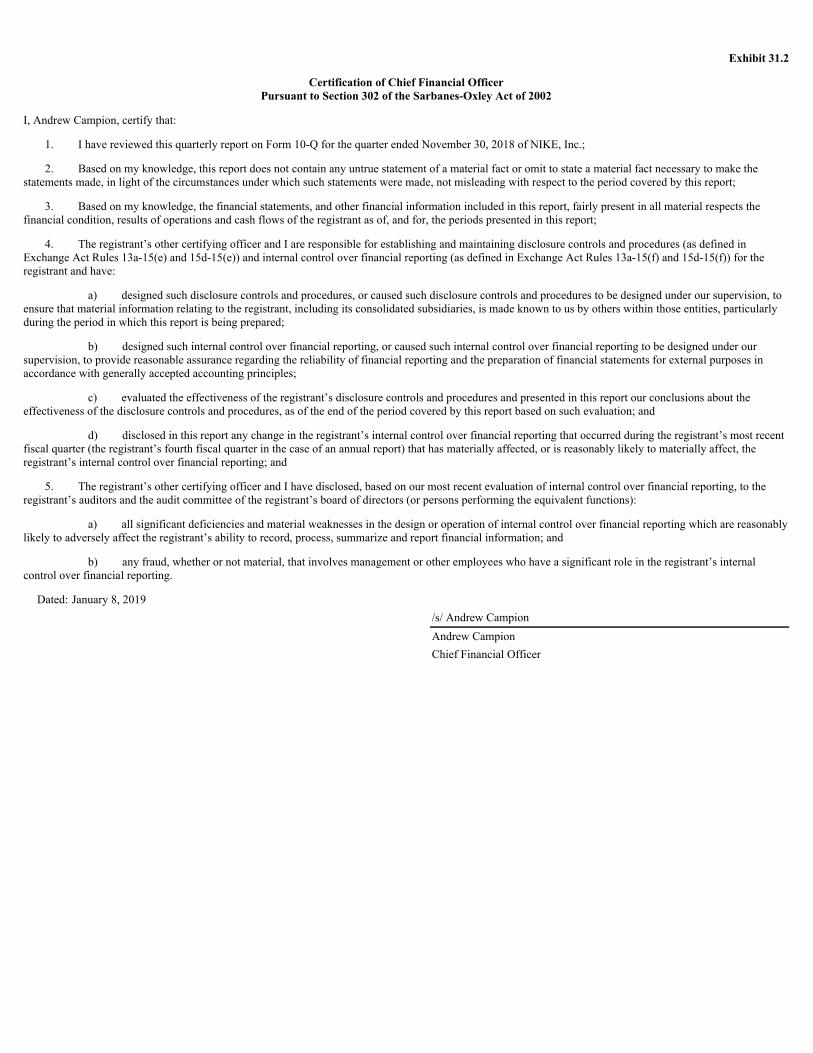
Exhibit 31.2
Certification of Chief Financial OfficerPursuant to Section 302 of the Sarbanes-Oxley Act of 2002
I, Andrew Campion, certify that:
1. I have reviewed this quarterly report on Form 10-Q for the quarter ended November 30, 2018 of NIKE, Inc.;
2. Based on my knowledge, this report does not contain any untrue statement of a material fact or omit to state a material fact necessary to make thestatements made, in light of the circumstances under which such statements were made, not misleading with respect to the period covered by this report;
3. Based on my knowledge, the financial statements, and other financial information included in this report, fairly present in all material respects thefinancial condition, results of operations and cash flows of the registrant as of, and for, the periods presented in this report;
4. The registrant’s other certifying officer and I are responsible for establishing and maintaining disclosure controls and procedures (as defined inExchange Act Rules 13a-15(e) and 15d-15(e)) and internal control over financial reporting (as defined in Exchange Act Rules 13a-15(f) and 15d-15(f)) for theregistrant and have:
a) designed such disclosure controls and procedures, or caused such disclosure controls and procedures to be designed under our supervision, toensure that material information relating to the registrant, including its consolidated subsidiaries, is made known to us by others within those entities, particularlyduring the period in which this report is being prepared;
b) designed such internal control over financial reporting, or caused such internal control over financial reporting to be designed under oursupervision, to provide reasonable assurance regarding the reliability of financial reporting and the preparation of financial statements for external purposes inaccordance with generally accepted accounting principles;
c) evaluated the effectiveness of the registrant’s disclosure controls and procedures and presented in this report our conclusions about theeffectiveness of the disclosure controls and procedures, as of the end of the period covered by this report based on such evaluation; and
d) disclosed in this report any change in the registrant’s internal control over financial reporting that occurred during the registrant’s most recentfiscal quarter (the registrant’s fourth fiscal quarter in the case of an annual report) that has materially affected, or is reasonably likely to materially affect, theregistrant’s internal control over financial reporting; and
5. The registrant’s other certifying officer and I have disclosed, based on our most recent evaluation of internal control over financial reporting, to theregistrant’s auditors and the audit committee of the registrant’s board of directors (or persons performing the equivalent functions):
a) all significant deficiencies and material weaknesses in the design or operation of internal control over financial reporting which are reasonablylikely to adversely affect the registrant’s ability to record, process, summarize and report financial information; and
b) any fraud, whether or not material, that involves management or other employees who have a significant role in the registrant’s internalcontrol over financial reporting.
Dated: January 8, 2019 /s/ Andrew Campion Andrew Campion Chief Financial Officer

Exhibit 32.1
Pursuant to 18 U.S.C. Section 1350, as adopted pursuant to Section 906 of the Sarbanes-Oxley Act of 2002, the following certifications are being made toaccompany the Registrant’s quarterly report on Form 10-Q for the fiscal quarter ended November 30, 2018 .
Certification of Chief Executive Officer
Pursuant to 18 U.S.C. Section 1350, as adopted pursuant to Section 906 of the Sarbanes-Oxley Act of 2002, the undersigned officer of NIKE, Inc. (the“Company”) hereby certifies, to such officer’s knowledge, that:
(i) the Quarterly Report on Form 10-Q of the Company for the fiscal quarter ended November 30, 2018 (the “Report”) fully complies with the requirementsof Section 13(a) or Section 15(d), as applicable, of the Securities Exchange Act of 1934, as amended; and
(ii) the information contained in the Report fairly presents, in all material respects, the financial condition and results of operations of the Company.
Dated: January 8, 2019 /s/ Mark G. Parker Mark G. Parker Chief Executive Officer
Exhibit 32.2
Pursuant to 18 U.S.C. Section 1350, as adopted pursuant to Section 906 of the Sarbanes-Oxley Act of 2002, the following certifications are being made toaccompany the Registrant’s quarterly report on Form 10-Q for the fiscal quarter ended November 30, 2018 .
Certification of Chief Financial Officer
Pursuant to 18 U.S.C. Section 1350, as adopted pursuant to Section 906 of the Sarbanes-Oxley Act of 2002, the undersigned officer of NIKE, Inc. (the“Company”) hereby certifies, to such officer’s knowledge, that:
(i) the Quarterly Report on Form 10-Q of the Company for the fiscal quarter ended November 30, 2018 (the “Report”) fully complies with the requirementsof Section 13(a) or Section 15(d), as applicable, of the Securities Exchange Act of 1934, as amended; and
(ii) the information contained in the Report fairly presents, in all material respects, the financial condition and results of operations of the Company.
Dated: January 8, 2019 /s/ Andrew Campion Andrew Campion Chief Financial Officer