Embed Size (px)
Citation preview

© 2001 Chemometrics Group, Rasmus Bro, [email protected]
ThreeThreeThree---way analysisway analysisway analysis
New multi-way models and algorithms for solving blind source separation problems
Rasmus BroChemometrics Group, Food TechnologyRoyal Veterinary & Agricultural University (KVL)[email protected]
Nikos SidiropoulosDept. of Electrical & Computer Engr.University of [email protected]

© 2001 Chemometrics Group, Rasmus Bro, [email protected]
IntroductionModels & algorithmsApplicationsProblems
ContentContentContent

© 2001 Chemometrics Group, Rasmus Bro, [email protected] B
C
Three-way data?Simply a set of two-way matricesEach mode consist of same basic entities over the other modesE.g. same samples measured at different variables, several timesInstead of a matrix with typical elements xij, we have an array with elements xijk
Where?Sensory analysis, Process analysis, Image analysis, Experimental design, Spectroscopy, Chromatography, Environmental analysis, QSAR, Communication, Medicine, …
IntroductionIntroductionIntroduction

© 2001 Chemometrics Group, Rasmus Bro, [email protected] B
C
! Sensory analysis! Score as a function of (Food sample, Judge, Attribute)
! Process analysis! Measurement as a function of (Batch, Variable, time)! Measurement as a function of (Variable, Lag, Location)
! Image analysis! Pixelvalue as a function of (Sample, Image pixel, Variable)
! Experimental design! Response as a function of (factor 1, factor2, factor3,..)
! Spectroscopy! Intensity as a function of (Wavelength, Retention, Sample, Time, Location ,
Treatment)! Environmental analysis
! Measurement as a function of (Location, Time, Variable)
Examples from chemistryExamples from chemistryExamples from chemistry

© 2001 Chemometrics Group, Rasmus Bro, [email protected]
Unfolding/Unfolding/Unfolding/matricizationmatricizationmatricization
! Traditional approach! Unfolding leading to two-way data and
analysis
! Three-way models! Natural extensions of two-way models! PCA leads to PARAFAC or Tucker3
depending on how it is extended! Rank-reduced regression, e.g. PLS leads
to multilinear PLS (N-PLS)
SampleWavelength
pH
pH Sample
Sample
Sample
Wavelength
Wavelength
Wavelength pH
pH
Unfolding/matricizationOften leads to overfitting because nature of model !nature of the data
Unfold: Wold, Geladi, Esbensen, Öhman. Principal component- and PLS-analyses generalized to multi-way (multi-order) data arrays. Copenhagen Symposium on Applied Statistics:249-277, 1986.

© 2001 Chemometrics Group, Rasmus Bro, [email protected]
PARallel FACtor PARallel FACtor PARallel FACtor analysisanalysisanalysis
PCA - bilinear model,
xij = Σftifpjf + eij, i=1,..,I; j=1,..,J
PARAFAC - trilinear model,
xijk = Σfaifbjfckf + eijk , i=1,..,I; j=1,..,J; k=1,..,K
X E= + +
c2
b2
a2
c1
b1
a1
=E
+A
C
B

© 2001 Chemometrics Group, Rasmus Bro, [email protected]
PARallel FACtor PARallel FACtor PARallel FACtor analysisanalysisanalysis
PCA - bilinear model,X = AB’ + E
PARAFAC - trilinear model,Xk = ADkB’ + Ek , k = 1,…,KDk = diag(C(k,:))
X E= + +
c2
b2
a2
c1
b1
a1
=E
+A
C
B

© 2001 Chemometrics Group, Rasmus Bro, [email protected]
Definition of threeDefinition of threeDefinition of three---way rankway rankway rank
Rank of two-way matrixMinimum number of bilinear (PCA) components needed to reproduce matrix
Rank of three-way arrayMinimum number of trilinear (PARAFAC) components needed to reproduce array
X= +
c2
b2
a2
c1
b1
a1

© 2001 Chemometrics Group, Rasmus Bro, [email protected]
Definition of threeDefinition of threeDefinition of three---way rankway rankway rank
Two-wayAny random matrix has full rank with probability oneRow-rank = column-rankSimple rules for maximal rank
Three-wayRandom 2×2×2 is rank 2 (30%) and rank 3 (70%)!Row-rank ≠ column-rank ≠ tube-rank!No rules for maximal rank!
Except simple cases such as 3×3×3 is five.
X= +
c2
b2
a2
c1
b1
a1

© 2001 Chemometrics Group, Rasmus Bro, [email protected]
PARAFAC PARAFAC PARAFAC --- uniquenessuniquenessuniqueness
Emission
Excitation
S. 1 S. 2
Sample
Emission
Excitation
Three-w
ay Two-way
250 300 350 400 450240
260280
3000
500
Emission Wavelength/nm
Excitation Wavelength/nm
Inte
nsity
250 300 350 400 450240
260280
3000
200
400
Emission Wavelength/nm
Excitation Wavelength/nm
Inte
nsity
PARAFAC has a unique property: It is unique!!
Practical example: FluorescenceTwo samplesMixture of three analytes
(Trp, Tyr, Phe)
PARAFAC invented in 1970 by Harshman and independently by Carroll & Chang under the name CANDECOMP. Based on a principle of parallel proportional profiles suggested in 1944 by Cattell
•R. A. Harshman. UCLA working papers in phonetics 16:1-84, 1970.•J. D. Carroll and J. Chang. Psychometrika 35:283-319, 1970.•R. B. Cattell. Psychometrika 9:267-283, 1944.

© 2001 Chemometrics Group, Rasmus Bro, [email protected]
PARAFAC PARAFAC PARAFAC --- uniquenessuniquenessuniqueness
PCA orthogonal loadings PARAFAC pure spectra!
250 300 350 400 450 500-0.15
-0.1
-0.05
0
0.05
0.1
0.15
0.2
0.25
Emission wavelength
PCA
load
ing
250 300 350 400 450 500-0.05
0
0.05
0.1
0.15
0.2
0.25
Emission wavelength
PAR
AFAC
load
ing/
Emis
sion
inte
nsity

© 2001 Chemometrics Group, Rasmus Bro, [email protected]
PARAFAC for CDMA PARAFAC for CDMA PARAFAC for CDMA

© 2001 Chemometrics Group, Rasmus Bro, [email protected]
PARAFAC PARAFAC PARAFAC --- uniquenessuniquenessuniqueness
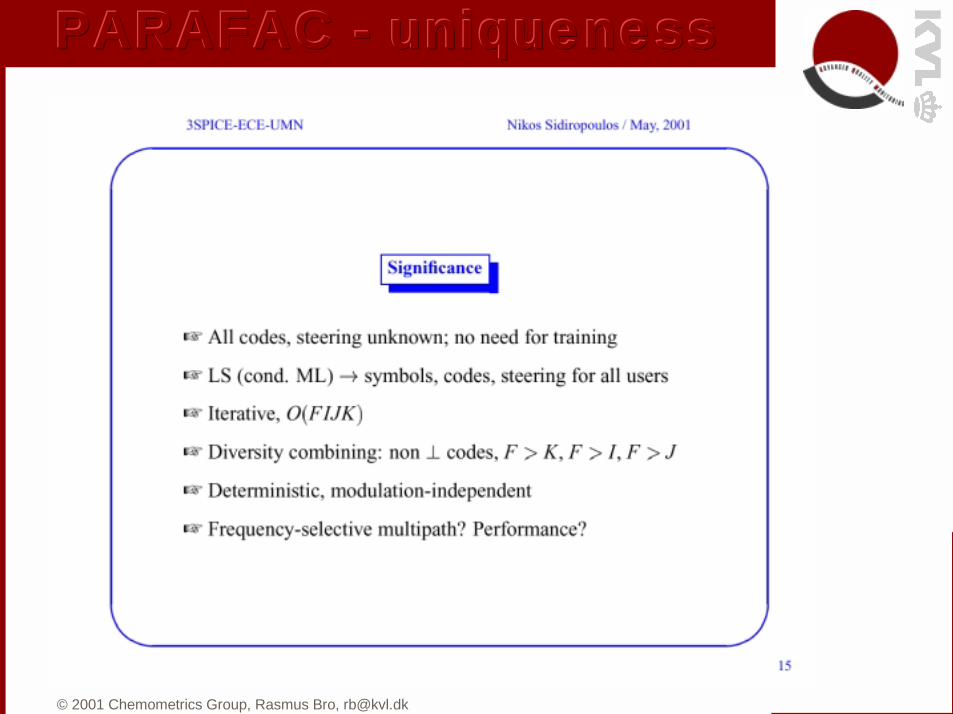
Uniqueness - conditionsA PARAFAC model is unique when
kA + kB + kC " 2F + 2
F is the number of components and kA is the k-rank of loading A = maximal number of randomly chosen columns which will have full rank (#F)
J. B. Kruskal. Linear Algebra and its Applications 18:95-138, 1977.SidGiaBro, IEEE TSP, Mar 2000, N = 3, !SidBro. JChemom 14 2000, any N, "
XB
A
C
=≥ + −∑ 1
2 ( 1)Nnn
k F N

© 2001 Chemometrics Group, Rasmus Bro, [email protected]
PARAFAC PARAFAC PARAFAC --- uniquenessuniquenessuniqueness
Uniqueness - what does it mean?Mixtures of analytes can be separatedConcentrations can be estimatedPure spectra and profiles can be estimated
8 × 8 × 8 array is unique for a 10 component model!!Hence with 8 snapshots, 8 symbols and 8 codes, recovery of 10 sources is possible
ExamplesOn-line purity control (Kodak) Windig, J. Magnetic Resonance 132:298-306, 1998
Determination of kinetic parameters Bijlsma, AIChE Journal 44:2713-2723, 1998
Mathematical chromatography Leurgans, Statistical Science 7:289-319, 1992
Localizing cellular phone calls Sidiropoulos & Bro. PARAFAC Techniques for Signal separation. In: Signal Processing Advances in Communications, edited by P. Stoica, G. B. Giannakis, Y. Hua, and L. Tong,Prentice-Hall, 2000,
© 2001 Chemometrics Group, Rasmus Bro, [email protected]
PARAFAC PARAFAC PARAFAC --- uniquenessuniquenessuniqueness

© 2001 Chemometrics Group, Rasmus Bro, [email protected]
PARAFAC PARAFAC PARAFAC --- uniquenessuniquenessuniqueness

© 2001 Chemometrics Group, Rasmus Bro, [email protected]
PARAFAC PARAFAC PARAFAC --- uniquenessuniquenessuniqueness

© 2001 Chemometrics Group, Rasmus Bro, [email protected]
PARAFAC PARAFAC PARAFAC --- algorithmalgorithmalgorithm
Alternating least squares algorithm
* Hadamard (elementwise product)
( ) ( ){ }
( ) ( ){ }
( ) ( ){ } ( )
1
k k1
1
k k1
1
k k
1. Initialize and
2. ' * '
2. ' ' * '
3. ' * ' diag ' , =1,..,
4. Step 2 until relative change in fit is small
K
k
K
k
diag k K
−
=
−
=
−
= =
=
∑
∑
B C
A X BD B B C C
B X AD A A C C
D B B A A A X B

© 2001 Chemometrics Group, Rasmus Bro, [email protected]
PARAFAC PARAFAC PARAFAC --- algorithmalgorithmalgorithm
Speed-upCompression of data (LS or Spline-based bases)Line-search etc.
Alternative algorithmsGRAM/DTLD – direct generalized eigenvalue problem but not LSPMF3 – Gauss-Newton: fast but problematic for large arraysCOMFAC – Uses compression and separation + Gauss-Newton
© 2001 Chemometrics Group, Rasmus Bro, [email protected]
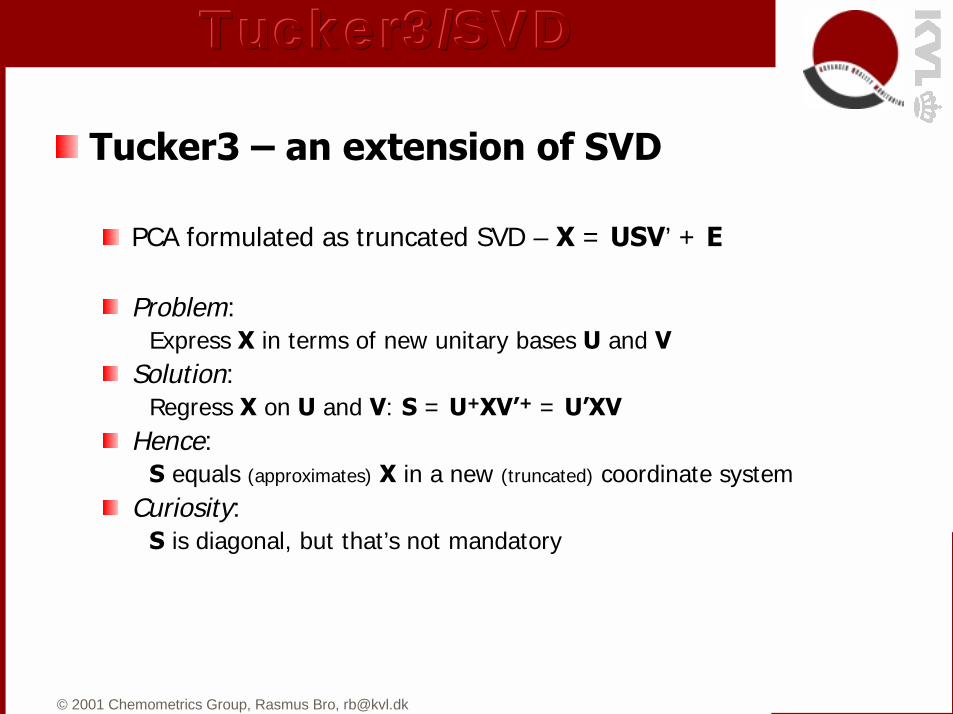
Tucker3 – an extension of SVD
PCA formulated as truncated SVD – X = USV’ + E
Problem: Express X in terms of new unitary bases U and V
Solution: Regress X on U and V: S = U+XV’+ = U’XV
Hence: S equals (approximates) X in a new (truncated) coordinate system
Curiosity: S is diagonal, but that’s not mandatory
Tucker3/SVDTucker3/SVDTucker3/SVD

© 2001 Chemometrics Group, Rasmus Bro, [email protected]
PCA = SVD can be written (note the off-diagonals)
=XS BT
A= [ ] [ ] T
1 2 1 21 00 2
a a b b
T T T T T T1 1 2 1 1 2 2 2 1 1 2 20 0 2 2= + + + == +a b a b a b a b a b a b
Tucker3/SVDTucker3/SVDTucker3/SVD

© 2001 Chemometrics Group, Rasmus Bro, [email protected]
The Tucker3 modelThe Tucker3 modelThe Tucker3 model
For three-way data, three unitary bases, A, B, and C; one for each mode
Tucker3 is X = AG(C⊗⊗⊗⊗ B)’ + E
Loadings are truncated bases and G the representation of X in these reduced spaces
=X
G
C
B
A•L. R. Tucker. The extension of factor analysis to three-dimensional matrices. In: Contributions to Mathematical Psychology, edited by N. Frederiksen and H. Gulliksen, New York:Holt, Rinehart & Winston, 1964, p. 110-182.
•L. R. Tucker. Some mathematical notes on three-mode factor analysis.Psychometrika 31:279-311, 1966

© 2001 Chemometrics Group, Rasmus Bro, [email protected]
Tucker3Tucker3Tucker3
! Important theorem! If the matricized ranks in the three
modes are found to be P, Q, and Rrespectively
! then a (P,Q,R) Tucker3 model fit the data perfect
! Practical value! If the pseudo-ranks are definitely found
to be P, Q, and R respectively! then a (P,Q,R) Tucker3 model fit the
data appropriately
pH Sample
Sample
Sample
Wavelength
Wavelength
Wavelength pH
pH
Unfold: Wold, Geladi, Esbensen, Öhman. Principal component- and PLS-analyses generalized to multi-way (multi-order) data arrays. Copenhagen Symposium on Applied Statistics:249-277, 1986.
PCA rank P
PCA rank Q
PCA rank R

© 2001 Chemometrics Group, Rasmus Bro, [email protected]
Tucker3 Tucker3 Tucker3 vs vs vs PARAFACPARAFACPARAFAC
Differences from PARAFAC/PCA:The number of components can vary in A, B, and C!G is not superdiagonalTucker loadings not unique (only subspace) = rotational freedom Tucker loadings orthogonal => variance-partitioningPARAFAC best rank F model, but does not describe the part of data within that subspace!Tucker best subspace F model but not rank F !!
=X
G
C
B
A

© 2001 Chemometrics Group, Rasmus Bro, [email protected]
Tucker3 Tucker3 Tucker3 --- algorithmalgorithmalgorithm
1. Initialize B and C (e.g. from SVD)2. A equals first P left singular vectors of X(I×JK)(C⊗ B)3. B equals first Q left singular vectors of X(J×IK)(C⊗ A)4. C equals first R left singular vectors of X(K×IJ)(B⊗ A)5. Go to step 2 until relative changes are small6. G = A’X(C⊗ B)
=X
G
C
B
A

© 2001 Chemometrics Group, Rasmus Bro, [email protected]
Other Tucker modelsOther Tucker modelsOther Tucker models
Tucker3 has the number 3 because three modes are ’reduced’.Tucker2 and Tucker1 reduces two and one modes respectively
=X
B
A
G
=X
C
B
A
G
=X
A
G
Tucker3
Tucker1
Tucker2
Tucker2 core often called Extended
Core Array
Tucker1 is identical to PCA on
matricizes X

© 2001 Chemometrics Group, Rasmus Bro, [email protected]
Multilinear PLS regressionMultilinear PLS regressionMultilinear PLS regression
N-PLS
Use a trilinear (PARAFAC-like) model of X but such that the scores are predictive of y.
X E= + +
c2
b2
t2
c1
b1
t1
T y
b
Bro. Multiway calibration. Multi-linear PLS. Journal of Chemometrics 10:47-61, 1996.

© 2001 Chemometrics Group, Rasmus Bro, [email protected]
Multilinear PLS regressionMultilinear PLS regressionMultilinear PLS regression
Two-way PLS principleFind w (||w||=1) and q (||q||=1) such that the one-component models of X = tw' + EX and Y = uq' + EY have maximal covariance (t'u)
Make regression model to predict u from t
Subtract the model from X and predictions from Y
Proceed with the next component from residuals

© 2001 Chemometrics Group, Rasmus Bro, [email protected]
Two-way PLS: how to do it - one y.
= = = =
=
⇒
=
max cov( , )
max '
max '
max '
''
w
w
w
w
t y t Xw
t y t Xw
y Xw
z w
X ywX y
Multilinear PLS regressionMultilinear PLS regressionMultilinear PLS regression
Max covariance
LS model

© 2001 Chemometrics Group, Rasmus Bro, [email protected]
Multilinear PLS regressionMultilinear PLS regressionMultilinear PLS regression
Three-way PLS: how to do it - one y.
= =
= = =
= = =
= =
= = = =
=
= ⇒
∑∑
∑ ∑∑
∑∑∑
∑∑
J K
J K
J K
J K
J K
J Ki ijk j k
1 1
J Ki i i ijk j k
1 1 1
J Ki ijk j k
1 1 1
J Kjk j k
1 1
J K
,
max cov( , )
max
max
max
max ( ) '
SVD on
J K
j k
I J K
i j k
I J K
i j k
J K
j k
t x w w
t y t x w w
y x w w
z w w
w w
w w
w w
w w
w w
t y
w Zw
Z

© 2001 Chemometrics Group, Rasmus Bro, [email protected]
Example sensory dataExample sensory dataExample sensory data
Three-way, two-way: Does it make a difference?
5 breads (in replicates) × 11 attributes × 8 judgesData due to Magni Martens
10 breads
11 a
ttrib
utes
Judge 2 Judge 8Judge 1
11 a
ttrib
utes
11 a
ttrib
utes
X10 breads
8 Judges
11 attributes
_

© 2001 Chemometrics Group, Rasmus Bro, [email protected]
Sensory dataSensory dataSensory data
PCA
Score one
Scor
e tw
o
-10 0 10 20-10
-8
-6
-4
-2
0
2
4
6
8
10
78
3
12
4
5
6
910
PARAFAC
Score one
Scor
e tw
o
-10 -5 0 5 10 15-10
-8
-6
-4
-2
0
2
4
6
8
10
34
56
78
12910
Scores from bilinear PCA and trilinear PARAFAC
Similar but note that replicates are closer for PARAFAC
Thre
e-w
ay m
ore
robu
st
beca
use
of ‘s
tron
ger’
stru
ctur
al m
odel

© 2001 Chemometrics Group, Rasmus Bro, [email protected]
Loadings from bilinear PCA and trilinear PARAFAC
Sensory dataSensory dataSensory data
Off-flav
Tough Salt-t
Sweet-t
Other-t
Bread-od
Yeast-od
Colour
Moisture
Yest-t
Total
PARAFAC - Attributes PARAFAC - Judges
-0.5Loading one
0 0.5
-0.6
-0.2
0.2
0.6Lo
adin
g tw
o
0.2 0.3 0.4 0.5 0.6 0.7
0.15
0.25
0.35
0.45
0.55
Loading one
Load
ing
two
6
1
2
3
45
78
65
801014
19
21
25
30
36 4354
6374
76
851
8
11
13
22415264
67
69
77
495073
83
2
345
67
9
1215
16
17
18
20
2324
2627
28
29
31
32
33
34
35
37
38
3940
42
44
45
46
47
48
51
53
55
56
57585960
6162
66
68
7071
72
75
78
79
8182
84
86
88
PCA - unfolded
-0.2 -0.1 0 0.1 0.2
Loading one
-0.3
-0.1
0.1
0.3
Load
ing
two
PARAFAC 19 loading-elements per componentPCA 88 loading-elements per component!

© 2001 Chemometrics Group, Rasmus Bro, [email protected]
Sensory dataSensory dataSensory data
Calibration - predict salt content
25% improvement!!
LV Variation explained /% RMSE
X cal. X val. Y cal. Y val. Y cal. Y val.
1 43 25 80 62 0.21 0.29
2 61 38 95 76 0.10 0.23
3 74 49 100 84 0.03 0.19
4 78 49 100 84 0.01 0.19
5 84 50 100 84 0.00 0.19
6 87 52 100 84 0.00 0.19
1 31 22 75 60 0.23 0.30
2 46 36 93 82 0.12 0.20
3 54 44 98 91 0.07 0.15
4 57 46 100 91 0.03 0.14
5 60 47 100 90 0.02 0.15
6 61 47 100 90 0.00 0.15
unfo
ld-P
LSTr
iline
ar P
LS
Three-way more predictive because less overfit

© 2001 Chemometrics Group, Rasmus Bro, [email protected]
Second order calibrationSecond order calibrationSecond order calibration
Two-way classical least squares mixture model X = CS’, E.g.X the measured spectra, C the true concentrations, S the pure spectra
If pure spectra, S, known, C determined by a simple least squares regression step – C = X(S’)+
Thus, if all spectra known quantitation possible and no calibration samples are needed

© 2001 Chemometrics Group, Rasmus Bro, [email protected]
How to do itHow to do itHow to do it
In three-way PARAFAC the model is Xk = ADkB’, Xk the measured spectra at occasion kA the true concentrationsB the pure spectraC (rows from Dk) pure spectra/profiles etc.
Pure spectra not necessary. They are found by decomposing with PARAFAC
Thus, without prior knowledge quantitation possible and no calibration samples are needed except for fixing the scale

© 2001 Chemometrics Group, Rasmus Bro, [email protected]
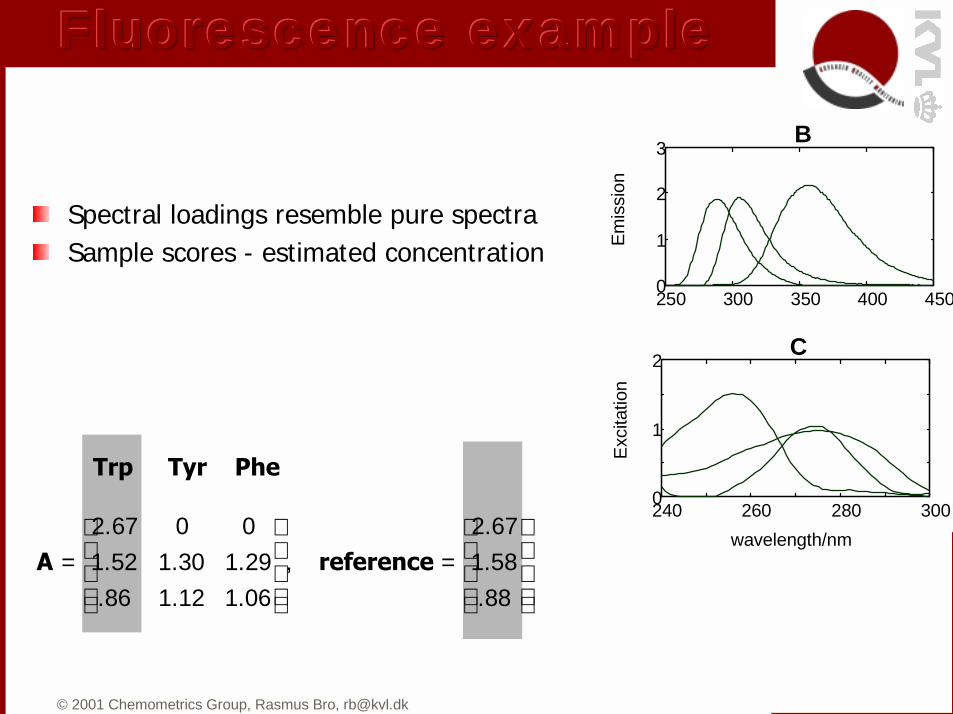
Fluorescence exampleFluorescence exampleFluorescence example
250350
450260
3000
500
1000
Standard (Trp)
250350
450260
300-500
0
500
Unknown 1 (Tyr,Trp,Phe)
250350
450260
3000
200
400
Emission Wavelength/nm
Excitation Wavelength/nm
Inte
nsity
Unknown 2 (Tyr,Trp,Phe)
Calibration set: One sample with oneanalyte (2.67 µM Trp)
Test set: Two samples with three analytes each (Trp, Tyr, Phe)
Three-component PARAFAC model fitted to the fluorescence data (3×201×61):
A - estimated concentrationsB - estimated emission spectraC - estimated excitation spectra
X= + +
c2
b2
a2
c1
b1
a1
c3
b3
a3
© 2001 Chemometrics Group, Rasmus Bro, [email protected]
Fluorescence exampleFluorescence exampleFluorescence example
250 300 350 400 4500
1
2
3
Emis
sion
B
240 260 280 3000
1
2 C
wavelength/nm
Exci
tatio
n
2.67 0 0 2.671.52 1.30 1.29 , 1.58.86 1.12 1.06 .88
= =
A reference
Trp Tyr Phe
Spectral loadings resemble pure spectra Sample scores - estimated concentration

© 2001 Chemometrics Group, Rasmus Bro, [email protected]
PredictionPredictionPrediction
How to make a prediction modelUsing sub-space regression, e.g. N-PLSUsing ‘second-order calibration’ mostly with PARAFAC
Significant differencePredictions based on ordinary regression models only work if all interferents are varying independently in the calibration data ⇒
Many samples neededOnly similar samples can be predicted
PARAFAC models work with only one calibration sample and with unknown uncalibrated interferents

© 2001 Chemometrics Group, Rasmus Bro, [email protected]
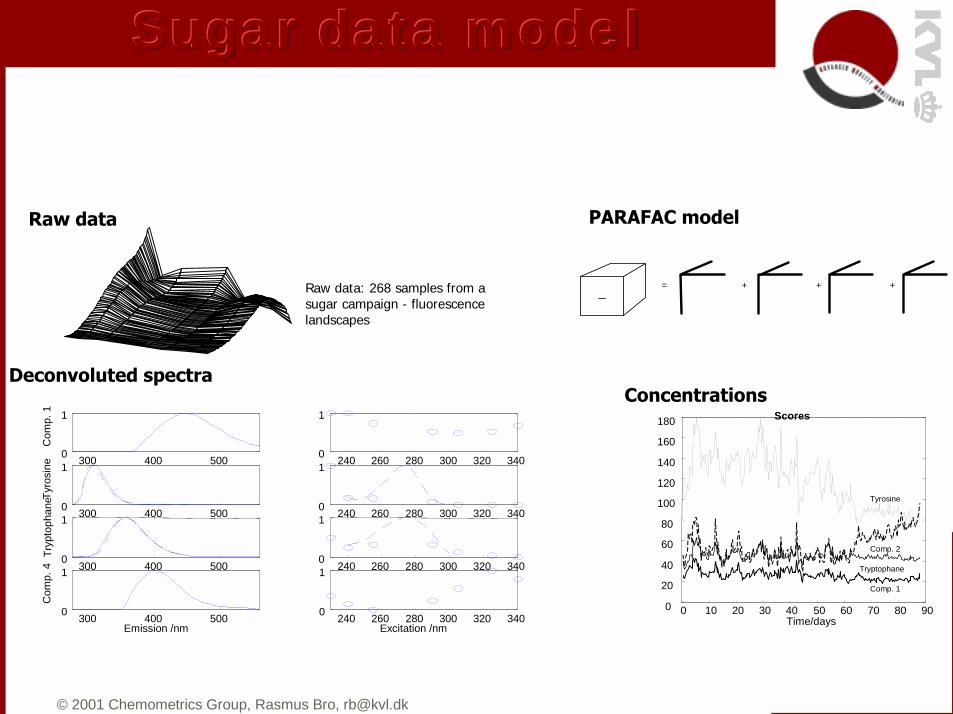
Sugar processingSugar processingSugar processing
Sugar made from beets
End product sampled every 8’th hour during the three months of operationMeasured spectrofluorometrically260 samples
Thick juice
Massecuite
Standardliqour
Sugarboiling
Centrifuge
Thin juiceA little
SyrupWash syrup
Wash water
Wash juice
Water
Sugar
X7
X8
X1
X2
X3
X4
X5
X6
© 2001 Chemometrics Group, Rasmus Bro, [email protected]
Sugar data modelSugar data modelSugar data model
Raw data: 268 samples from a sugar campaign - fluorescence landscapes
Concentrations
Raw data
0 10 20 30 40 50 60 70 80 900
20
40
60
80
100
120
140
160
180 Scores
Time/days
Comp. 2
Tryptophane
Tyrosine
Comp. 1
300 400 5000
1
Com
p. 1
240 260 280 300 320 3400
1
300 400 5000
1
Tyro
sine
240 260 280 300 320 3400
1
300 400 5000
1
Tryp
toph
ane
240 260 280 300 320 3400
1
300 400 5000
1
Com
p. 4
Emission /nm240 260 280 300 320 3400
1
Excitation /nm
Deconvoluted spectra
= + + +
PARAFAC model

© 2001 Chemometrics Group, Rasmus Bro, [email protected]
0 33 66 99Days
Predicting CaO
0 10 20 30 40 50 60 70 80 9015
20
25
30
35
Days
PredictedReference
Predicting color
PARAFAC and fluorescence: unique combination of multivariate process control and process analytical chemistryThe process can be monitored and controlled on a chemical level
Using the modelUsing the modelUsing the model

© 2001 Chemometrics Group, Rasmus Bro, [email protected]
Resolving twoResolving twoResolving two---way exponentialsway exponentialsway exponentials
Time (ms)0 100 200 300 400 500 600 700 800 900 1000
I(t) = M0 ∙ exp(-t/T2)
Two-way data but with very special structure in loadings
X = AB’ = 1 0 27 9 3 10 1 16 8 4 2
2143891627
Sample 2Sample 1

© 2001 Chemometrics Group, Rasmus Bro, [email protected]
X1 = AD1B’ =9 31 0 3 18 4 20 1
00 2
43
89
1627
Sample 2Sample 1
SLAB 1 (X1)
21
43
89
Sample 2Sample 1
SLAB 2 (X2)
X2 = AD2B’ = 9 31 0 1 18 4 20 1
00 1
SLICING SLICING SLICING --- Pseudo ThreePseudo ThreePseudo Three---way Dataway Dataway Data

© 2001 Chemometrics Group, Rasmus Bro, [email protected]
Example: Sensory qualityExample: Sensory qualityExample: Sensory quality
! Predicting cooked potato quality from NMR on raw data! Potatoes cooked and served hot. Ten assessors
evaluate texture profile, e.g. mealiness
! Raw (!) potato measured by NMR (CPMG pulse sequence)
0 200 400 600 800 1000 1200 14000
500
1000
1500
2000
2500
3000
3500
4000
4500
5000Raw data
???
Inte
nsity
A. K. Thybo et. al., Food Science and Technology, 33 (2):103-111, 2000.
=
LaggingPAR
AFAC

© 2001 Chemometrics Group, Rasmus Bro, [email protected]
Example: Sensory qualityExample: Sensory qualityExample: Sensory quality
0 50 100 150 200 250 300 350 400 450-0.1
0
0.1
0.2
0.3
0.4
0.5
0.6Profile s PAR AFAC decomposition
???
a.u.
2 3 4 5 6 7
2
3
4
5
6
7
Predictions mealy
Reference
Pred
icte
d
r=0.858 RMSEP=0.79
Decomposing NMR into meaningful latent variablesPARAFAC on lagged data enables meaningful decompositionFour components adequate for describing NMR data
Predictions of mealiness from NMRPredicting sensory quality of cooked potatoes from amount of latent variables (i.e. directly from NMR of raw potatoes)

© 2001 Chemometrics Group, Rasmus Bro, [email protected]
Using constraintsUsing constraintsUsing constraints
Using constraints in multi-way modeling
ExampleInstead of ‘PCA’: || X - AB’||fit the model: || X - AB’||,
subject to A and B are nonnegative
Constraints are essential in two-way curve resolution because the model is unidentified
In three-way curve resolution the model is often unique but constraints are still useful
© 2001 Chemometrics Group, Rasmus Bro, [email protected]
Why constraints?Why constraints?Why constraints?
Obtain sensible parametersEx.: Require chromatographic profiles to have but one peak
Obtain unique solutionEx.: Use selective channels in data to obtain uniqueness
Test hypothesesEx.: Investigate if tryptophane is present in sample
Avoiding degeneracy and numerical problemsEx.: Enabling a PARAFAC model of data otherwise inappropriate for the model
Speed up algorithmsEx.: Use truncated bases to reexpress problem by a smaller problem
Enable quantitative analysis of qualitative dataEx.: Incorporate sex and job type in a model for predicting income
© 2001 Chemometrics Group, Rasmus Bro, [email protected]
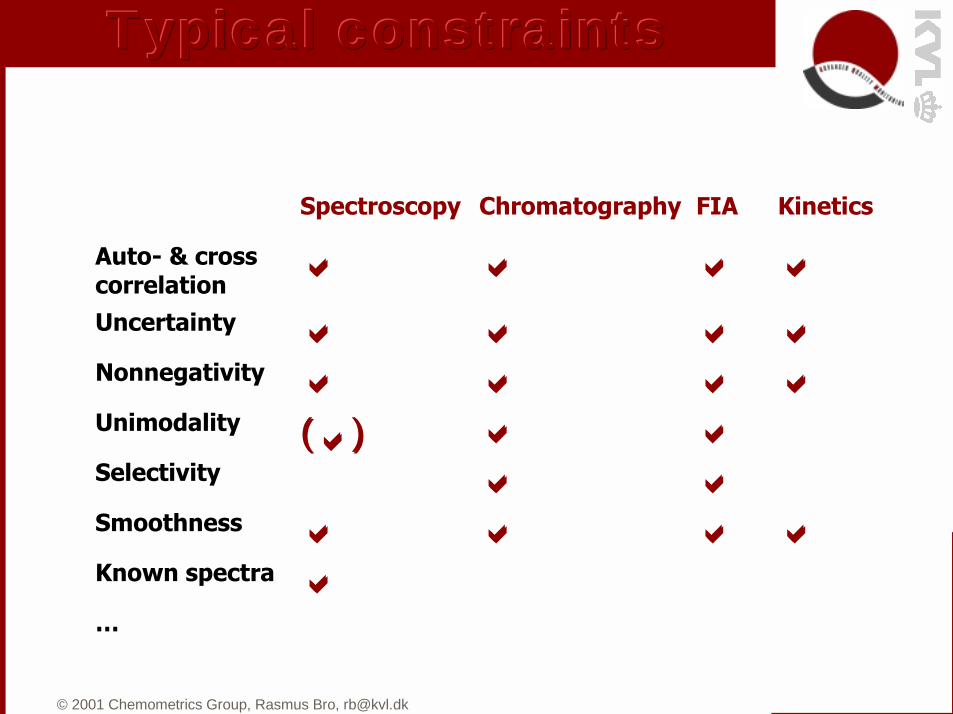
Typical constraintsTypical constraintsTypical constraints
Spectroscopy Chromatography FIA Kinetics
Auto- & cross correlation !! !! !! !!
Uncertainty !! !! !! !!Nonnegativity !! !! !! !!Unimodality ((!!)) !! !!Selectivity !! !!Smoothness !! !! !! !!Known spectra !!…

© 2001 Chemometrics Group, Rasmus Bro, [email protected]
FIA exampleFIA exampleFIA example
Model of a single sample with one analyte
0
50
100
250300
350400
4500
0.1
0.2
0.3
TimeWavelengthAbsorbance
250 300 350 400 4500
0.05
0.1
0.15
Wavelength/nm
0 20 40 60 80 1000
0.02
0.04
0.06
Time
Absorbance
Absorbance
Samples of 2, 3, 4-HBA (hydroxy benzaldehyde) detected by UV-VIS in FIA system with pH-gradient imposedEvery spectrum is a sum of acidic and basic spectrum. Same holds for time profiles. Only sums are measuredModel not important here. PARALIND : Xk = AHDkB’
DataConcentrations
Pure spectra

© 2001 Chemometrics Group, Rasmus Bro, [email protected]
Effect of constraintsEffect of constraintsEffect of constraints
Eq : Equality of summed profilesNNLS : Non-negativity of all parametersULSR : Unimodality of FIAgrams/time profilesFix : Fixing purely acidic/basic times to only reflect acidic/basic analytes
SPECTRA 2HBAacidic
2HBAbasic
3HBAacidic
3HBAbasic
4HBAacidic
4HBAbasic
Eq 0.9893* 0.9871* 0.9689* 0.7647* 0.9106* 0.9211*
NNLS 0.9944 0.9117* 0.9952 0.9241 0.9974 0.9977
NNLS/Eq 0.9946 0.9312* 0.9953 0.9988 0.9965 0.9971
NNLS/ULSR/Eq 0.9946 0.9590* 0.9953 0.9989 0.9966 0.9943
NNLS/ULSR/Fix/Eq 0.9946 0.9989 0.9954 0.9986 0.9961 0.9977
0 20 40 60 80 100
0
0.2
Time
4HBA -a.u.
Non-negativity & equality constrained
Correlations

© 2001 Chemometrics Group, Rasmus Bro, [email protected]
Problems to deal withProblems to deal withProblems to deal with
AlgorithmsTucker, N-PLS are unproblematic, even for large data setsPARAFAC problematic
Multiple local minima 2-factor degeneracy (model-problem): no solution?Solution sensitive to correct dimensionality (not sequential)Slow convergence
Other problems currently consideredStatistical measures (rank/DoF problems)Diagnostics for choosing the number of componentsHandling highly structured error covariancesHandling huge amounts of missing data

© 2001 Chemometrics Group, Rasmus Bro, [email protected]
Concluding remarksConcluding remarksConcluding remarks
Uniqueness (mainly PARAFAC)Pure spectraSecond order advantage
No interferents, only one standard
Better structural modelRobustness/noise reductionSimpler modelInterpretationBetter predictions
© 2001 Chemometrics Group, Rasmus Bro, [email protected]
Concluding remarksConcluding remarksConcluding remarks
ReferencesHarshman, Lundy. Comp. Stat. Data Anal., 1994, 18, 39Leurgans, Ross. Statist. Sci., 1992, 7, 289Smilde. Chemom. Intell. Lab. Syst., 1992, 5, 143Bro. J. Chemom. 1996, 10, 47Bro, Chemom.Intell.Lab.Syst., 1997, 38, 149Sidiropoulos & Bro. PARAFAC Techniques for Signal separation. In: Signal Processing Advances in Communications, edited by P. Stoica, G. B. Giannakis, Y. Hua, and L. Tong, Prentice-Hall, 2000.
Software & infohttp://www.models.kvl.dk (Free matlab code’n’course, database of papers)http://www.ece.umn.edu/users/nikos/public_html/3SPICE/3SPICEmain.htmlTRIPLE SPICE – Multi-way analysis in signal processing – matlab, presentations etc.http://www.eigenvector.com (Matlab code)http://www.fsw.leidenuniv.nl/~kroonenb (Stand alone)