Embed Size (px)
Citation preview
Nine Month Report 2014
Interstate 4 Ultimate, Florida, U.S.
Nine Month Report 2014 – Highlights − Substantial growth in the third
quarter − Revenue − Operating income − Cash flow
− Strong trend continues − Order bookings − Divestment gains
− Operating income SEK 3.5 bn (3.5)
− Exit Latin America − Winding-down E&C − Divesting O&M
2 November 7, 2014 Skanska Nine Month Report 2014

Construction
− Revenue SEK 91.8 bn (85.7)
− Order bookings SEK 105.3 bn (86.5) − USA Civil, UK, Sweden and Poland
strong − Book-to-build YTD: 115%
− Operating income SEK 3.1 bn (2.6) − Strong performance in Swedish,
Finnish and Polish operations − Latin American operations reported
as part of Central stream1
3 November 7, 2014 Skanska Nine Month Report 2014
Florida Polytechnic University, Lakeland, U.S. 1 Business stream numbers adjusted from 1/1 2013
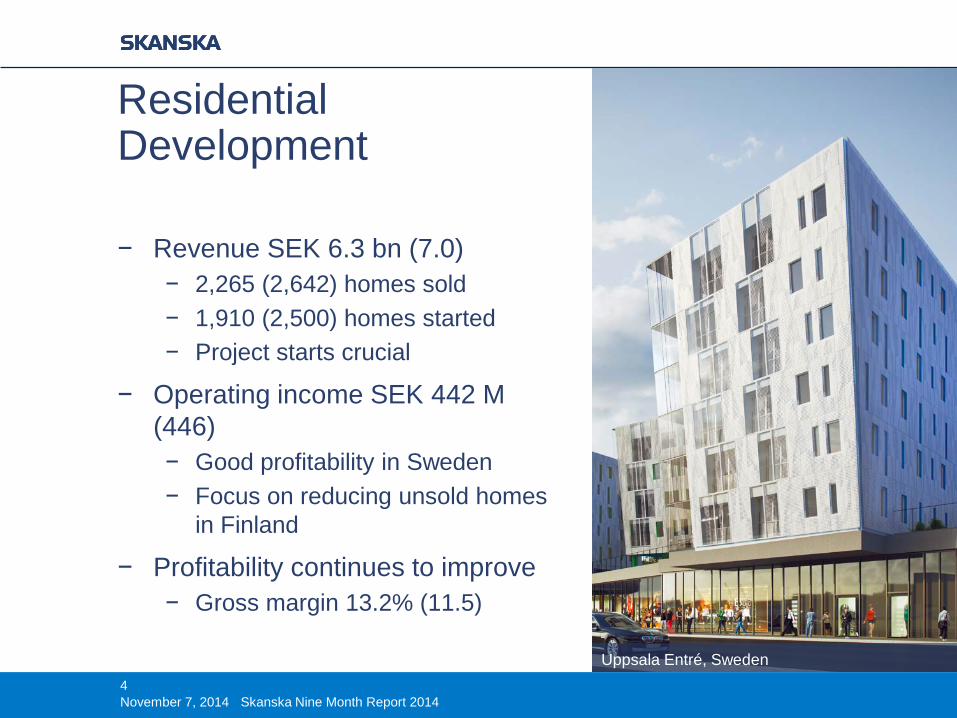
Uppsala Entré, Sweden
Residential Development
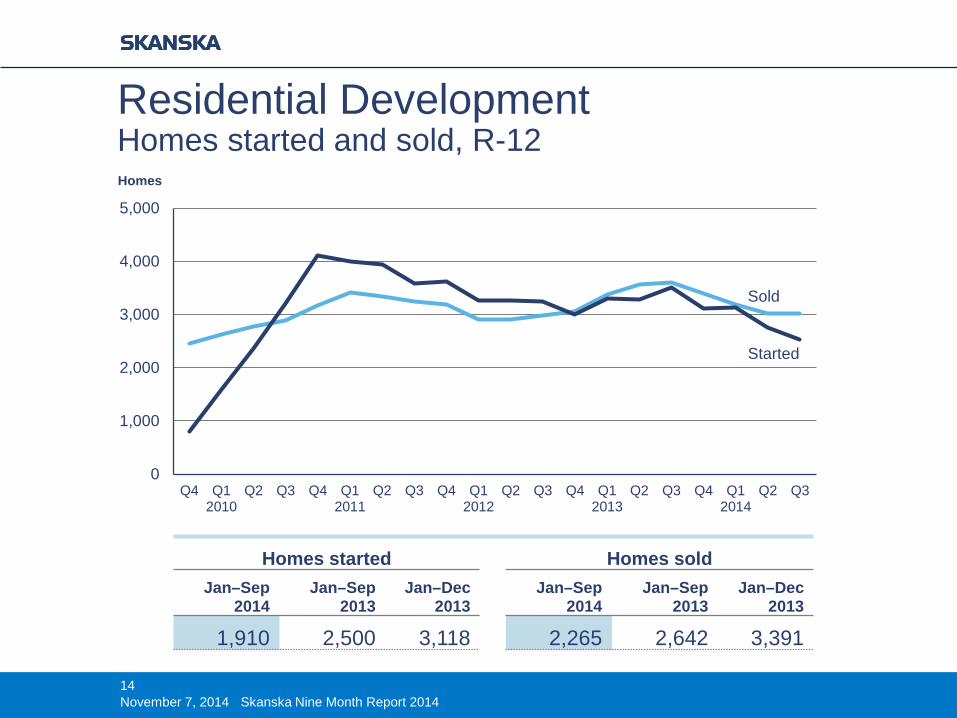
− Revenue SEK 6.3 bn (7.0) − 2,265 (2,642) homes sold − 1,910 (2,500) homes started − Project starts crucial
− Operating income SEK 442 M (446) − Good profitability in Sweden − Focus on reducing unsold homes
in Finland
− Profitability continues to improve − Gross margin 13.2% (11.5)
4 November 7, 2014 Skanska Nine Month Report 2014
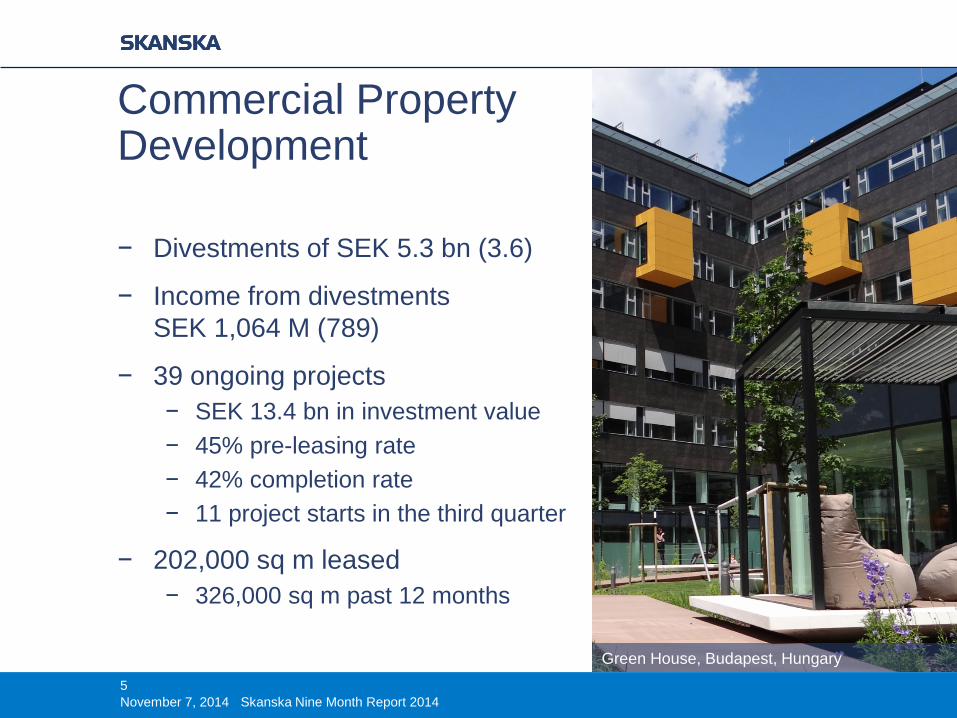
Green House, Budapest, Hungary
Commercial Property Development
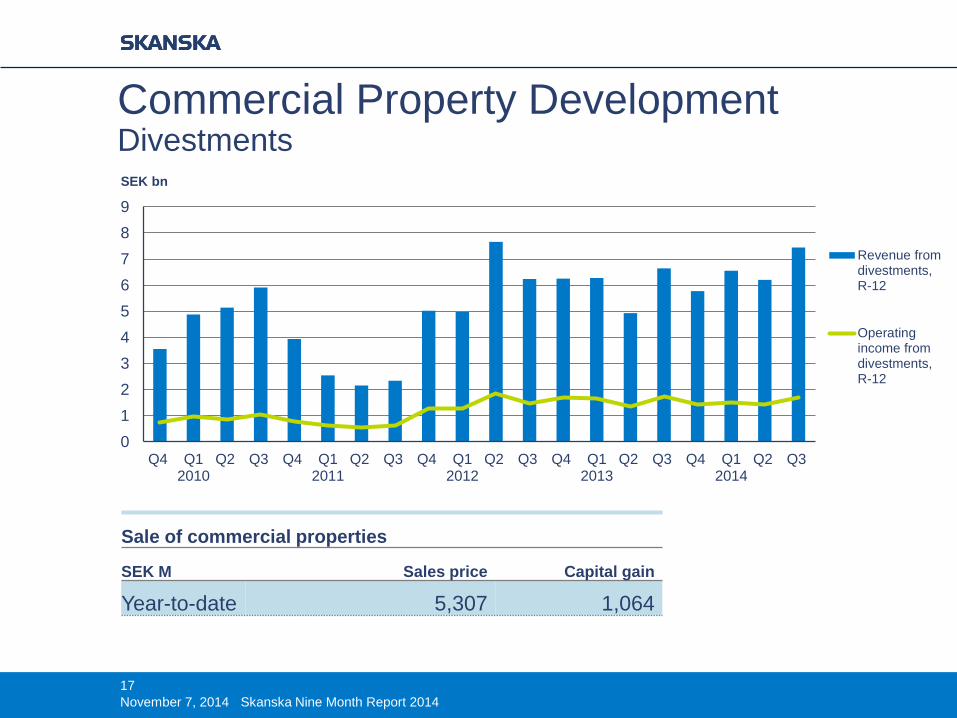
− Divestments of SEK 5.3 bn (3.6)
− Income from divestments SEK 1,064 M (789)
− 39 ongoing projects − SEK 13.4 bn in investment value − 45% pre-leasing rate − 42% completion rate − 11 project starts in the third quarter
− 202,000 sq m leased − 326,000 sq m past 12 months
5 November 7, 2014 Skanska Nine Month Report 2014
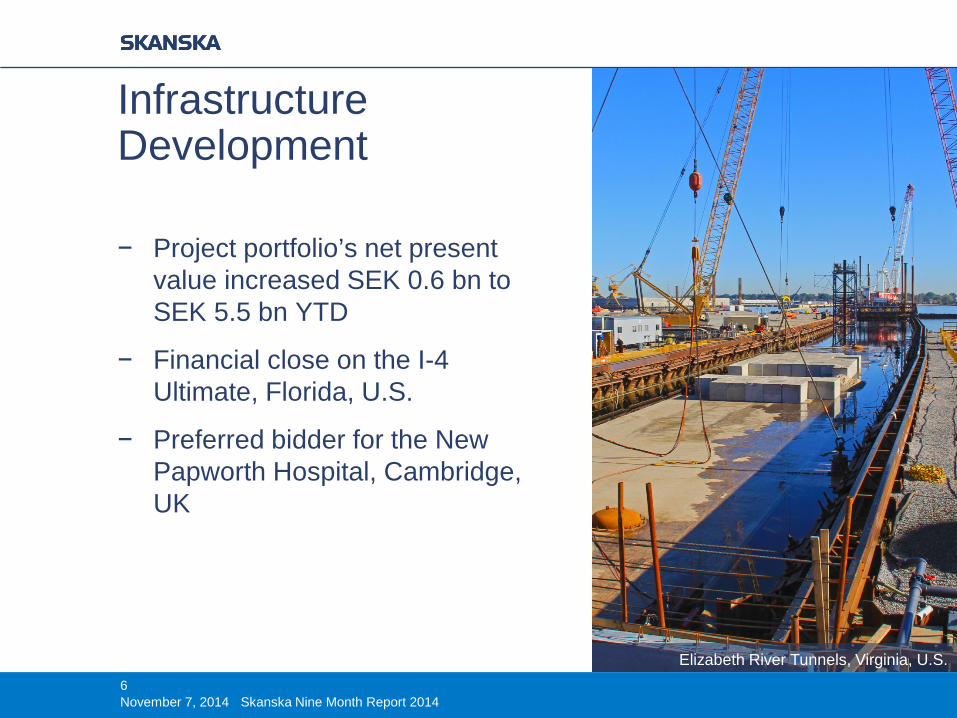
Elizabeth River Tunnels, Virginia, U.S.
Infrastructure Development
− Project portfolio’s net present value increased SEK 0.6 bn to SEK 5.5 bn YTD
− Financial close on the I-4 Ultimate, Florida, U.S.
− Preferred bidder for the New Papworth Hospital, Cambridge, UK
6 November 7, 2014 Skanska Nine Month Report 2014
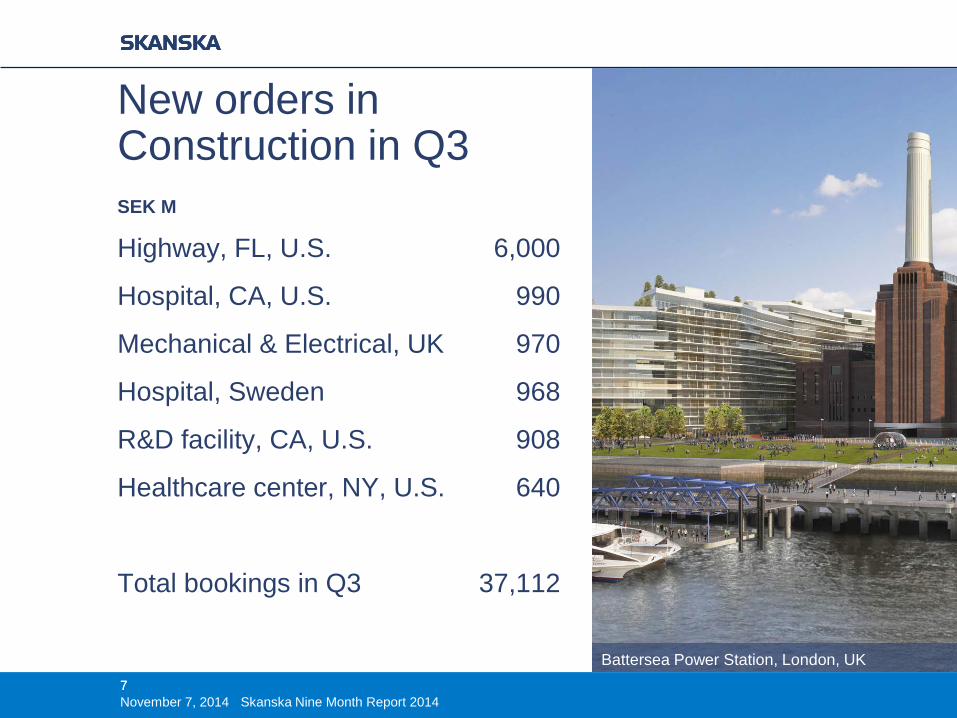
Battersea Power Station, London, UK
Highway, FL, U.S. 6,000
Hospital, CA, U.S. 990
Mechanical & Electrical, UK 970
Hospital, Sweden 968
R&D facility, CA, U.S. 908
Healthcare center, NY, U.S. 640
Total bookings in Q3 37,112
7
New orders in Construction in Q3
7
SEK M
November 7, 2014 Skanska Nine Month Report 2014
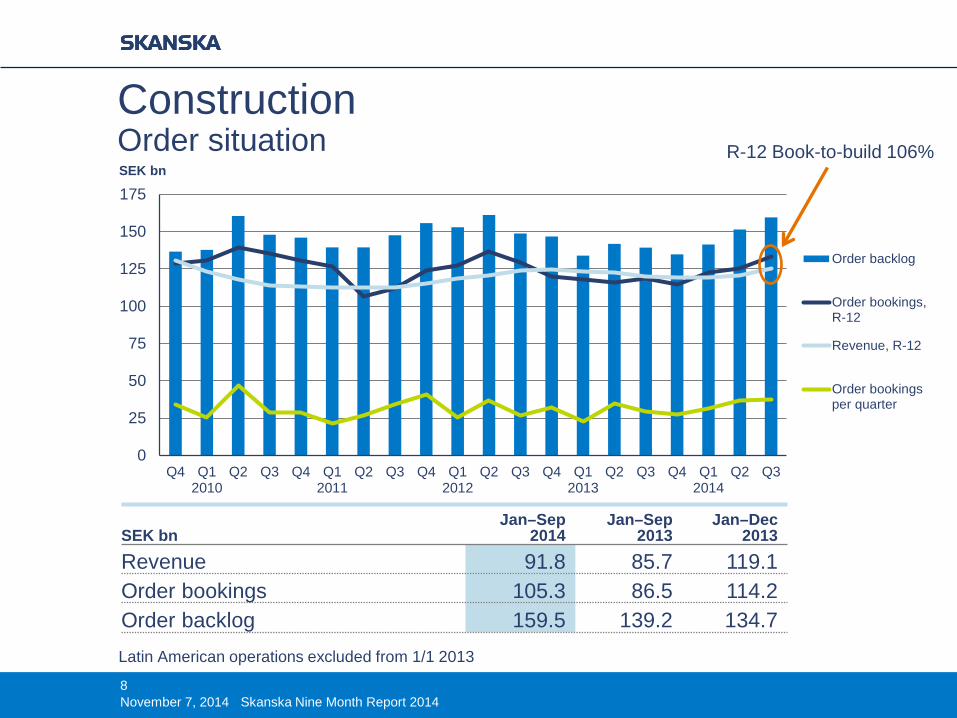
Construction Order situation
8
0
25
50
75
100
125
150
175
Q4 Q12010
Q2 Q3 Q4 Q12011
Q2 Q3 Q4 Q12012
Q2 Q3 Q4 Q12013
Q2 Q3 Q4 Q12014
Q2 Q3
SEK bn
Order backlog
Order bookings,R-12
Revenue, R-12
Order bookingsper quarter
R-12 Book-to-build 106%
November 7, 2014 Skanska Nine Month Report 2014
SEK bn
Jan–Sep 2014
Jan–Sep 2013
Jan–Dec 2013
Revenue 91.8 85.7 119.1 Order bookings 105.3 86.5 114.2 Order backlog 159.5 139.2 134.7 Latin American operations excluded from 1/1 2013
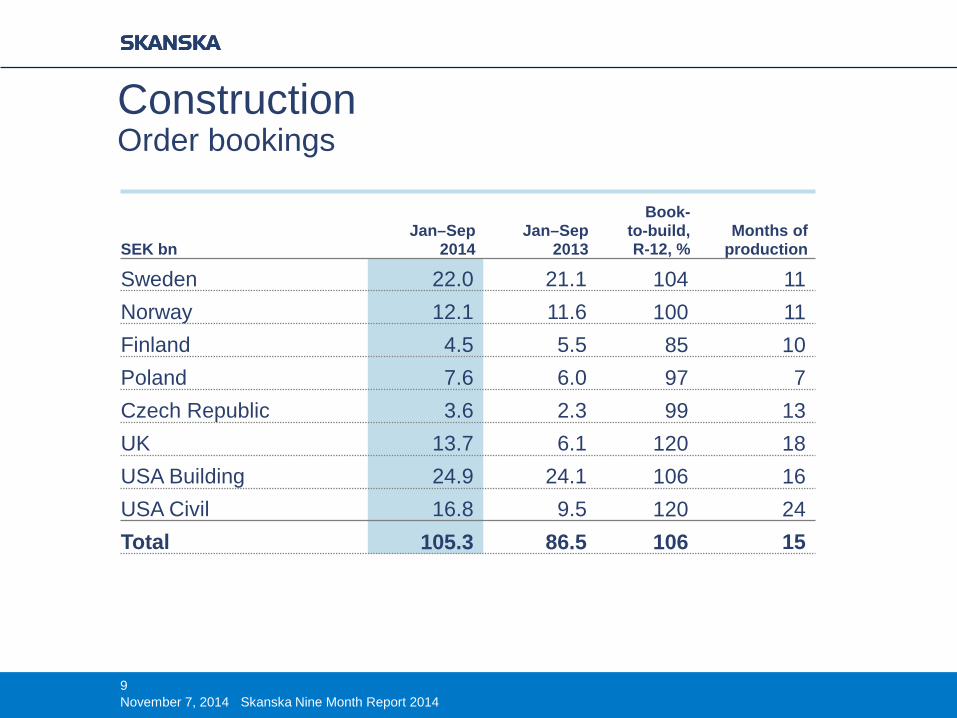
Construction Order bookings
SEK bn
Jan–Sep 2014
Jan–Sep 2013
Book- to-build, R-12, %
Months of production
Sweden 22.0 21.1 104 11 Norway 12.1 11.6 100 11 Finland 4.5 5.5 85 10 Poland 7.6 6.0 97 7 Czech Republic 3.6 2.3 99 13 UK 13.7 6.1 120 18 USA Building 24.9 24.1 106 16 USA Civil 16.8 9.5 120 24 Total 105.3 86.5 106 15
9 November 7, 2014 Skanska Nine Month Report 2014
0
40
80
120
160
2.0
2.5
3.0
3.5
4.0
4.5
5.0
Q4 Q12010
Q2 Q3 Q4 Q12011
Q2 Q3 Q4 Q12012
Q2 Q3 Q4 Q12013
Q2 Q3 Q4 Q12014
Q2 Q3
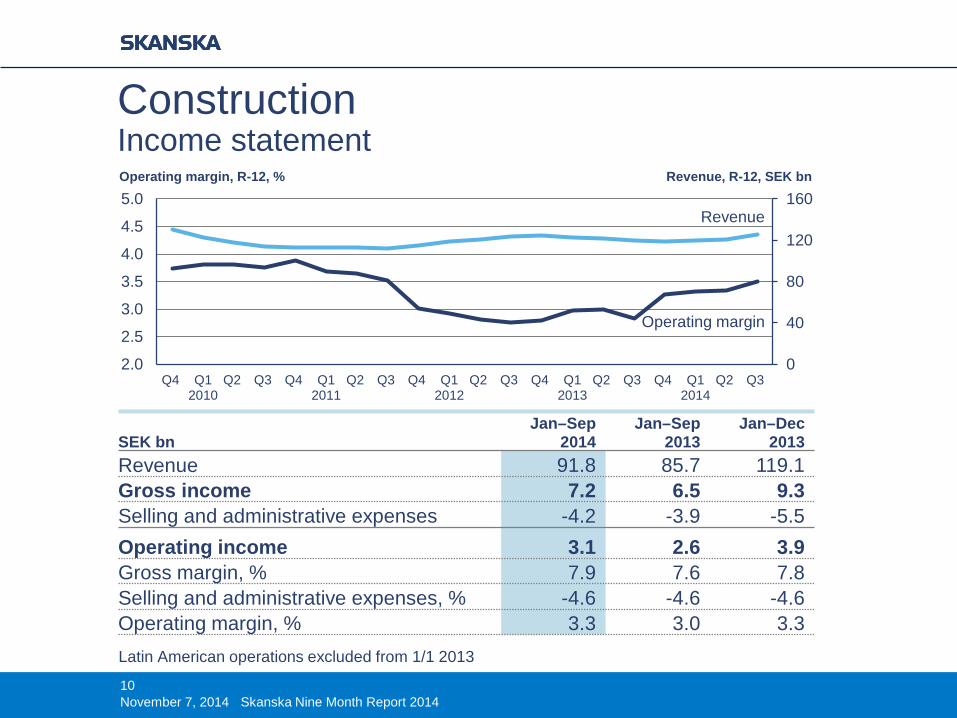
Construction Income statement
10
Revenue
Operating margin
Revenue, R-12, SEK bn
November 7, 2014 Skanska Nine Month Report 2014
SEK bn Jan–Sep
2014 Jan–Sep
2013 Jan–Dec
2013 Revenue 91.8 85.7 119.1 Gross income 7.2 6.5 9.3 Selling and administrative expenses -4.2 -3.9 -5.5 Operating income 3.1 2.6 3.9 Gross margin, % 7.9 7.6 7.8 Selling and administrative expenses, % -4.6 -4.6 -4.6 Operating margin, % 3.3 3.0 3.3
Operating margin, R-12, %
Latin American operations excluded from 1/1 2013
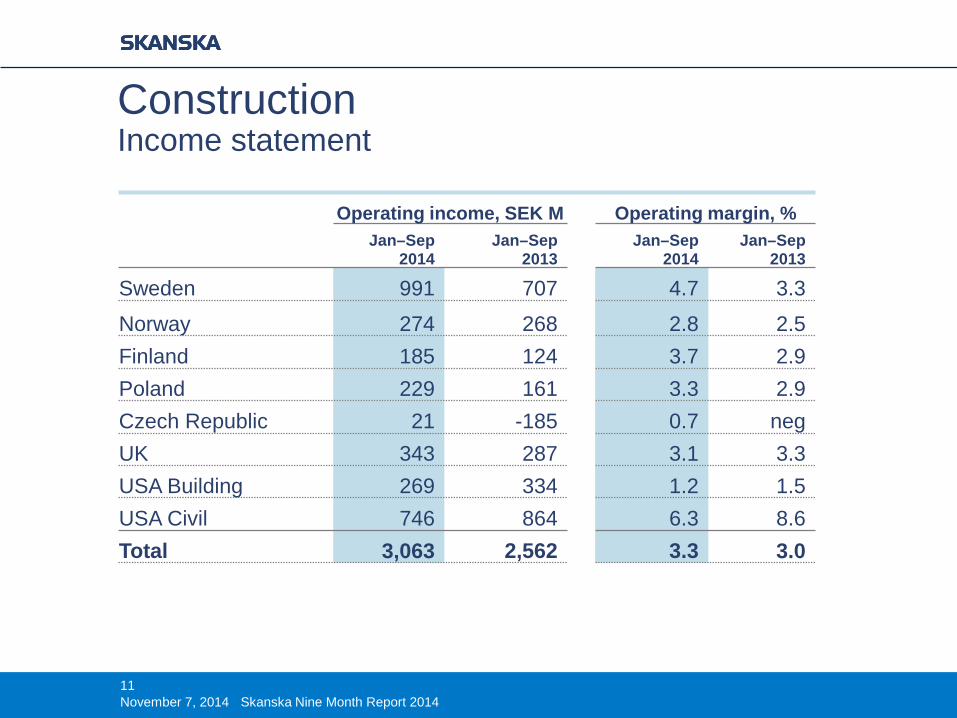
Construction Income statement
11
Operating income, SEK M Operating margin, % Jan–Sep
2014 Jan–Sep
2013 Jan–Sep
2014 Jan–Sep
2013
Sweden 991 707 4.7 3.3
Norway 274 268 2.8 2.5 Finland 185 124 3.7 2.9 Poland 229 161 3.3 2.9 Czech Republic 21 -185 0.7 neg UK 343 287 3.1 3.3 USA Building 269 334 1.2 1.5 USA Civil 746 864 6.3 8.6 Total 3,063 2,562 3.3 3.0
November 7, 2014 Skanska Nine Month Report 2014
0
2
4
6
8
10
-15
-10
-5
0
5
10
Q4 Q12010
Q2 Q3 Q4 Q12011
Q2 Q3 Q4 Q12012
Q2 Q3 Q4 Q12013
Q2 Q3 Q4 Q12014
Q2 Q3
Revenue
Operating margin
Operating margin, R-12, %
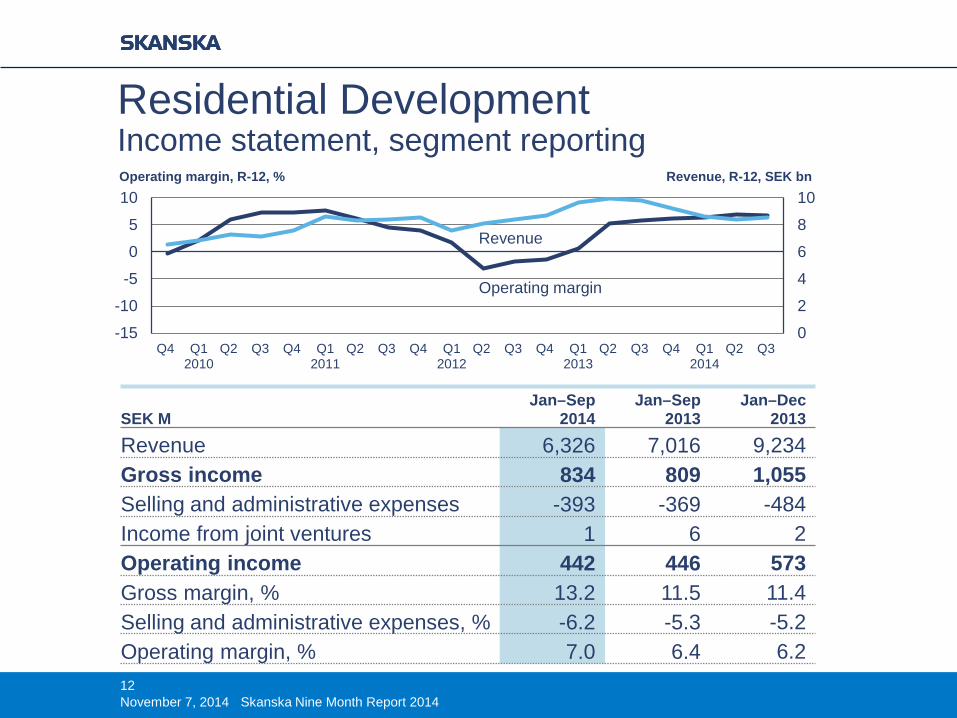
Residential Development Income statement, segment reporting
12 November 7, 2014 Skanska Nine Month Report 2014
SEK M
Jan–Sep 2014
Jan–Sep 2013
Jan–Dec 2013
Revenue 6,326 7,016 9,234 Gross income 834 809 1,055 Selling and administrative expenses -393 -369 -484 Income from joint ventures 1 6 2 Operating income 442 446 573 Gross margin, % 13.2 11.5 11.4 Selling and administrative expenses, % -6.2 -5.3 -5.2 Operating margin, % 7.0 6.4 6.2
Revenue, R-12, SEK bn
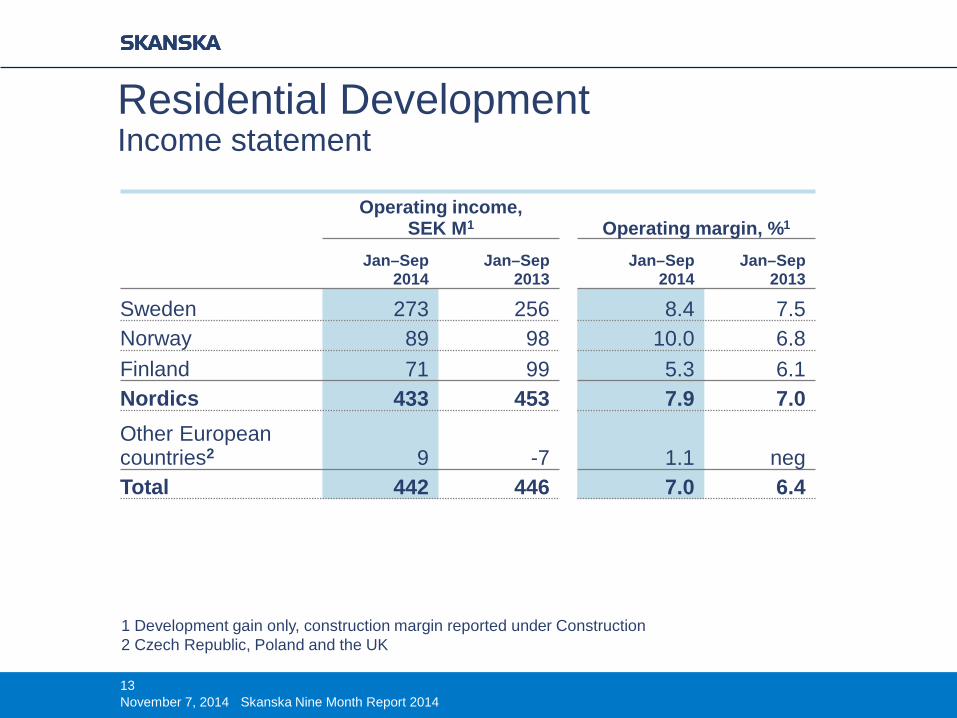
Residential Development Income statement
13
Operating income, SEK M1 Operating margin, %1
Jan–Sep 2014
Jan–Sep 2013
Jan–Sep 2014
Jan–Sep 2013
Sweden 273 256 8.4 7.5 Norway 89 98 10.0 6.8 Finland 71 99 5.3 6.1 Nordics 433 453 7.9 7.0 Other European countries2 9 -7 1.1 neg Total 442 446 7.0 6.4
1 Development gain only, construction margin reported under Construction 2 Czech Republic, Poland and the UK
November 7, 2014 Skanska Nine Month Report 2014
0
1,000
2,000
3,000
4,000
5,000
Q4 Q12010
Q2 Q3 Q4 Q12011
Q2 Q3 Q4 Q12012
Q2 Q3 Q4 Q12013
Q2 Q3 Q4 Q12014
Q2 Q3
Homes
Residential Development Homes started and sold, R-12
14
Sold
Started
November 7, 2014 Skanska Nine Month Report 2014
Homes started Homes sold Jan–Sep
2014 Jan–Sep
2013 Jan–Dec
2013 Jan–Sep
2014 Jan–Sep
2013 Jan–Dec
2013
1,910 2,500 3,118 2,265 2,642 3,391
0
1,000
2,000
3,000
4,000
5,000
6,000
7,000
Q4 Q12010
Q2 Q3 Q4 Q12011
Q2 Q3 Q4 Q12012
Q2 Q3 Q4 Q12013
Q2 Q3 Q4 Q12014
Q2 Q3
Homes
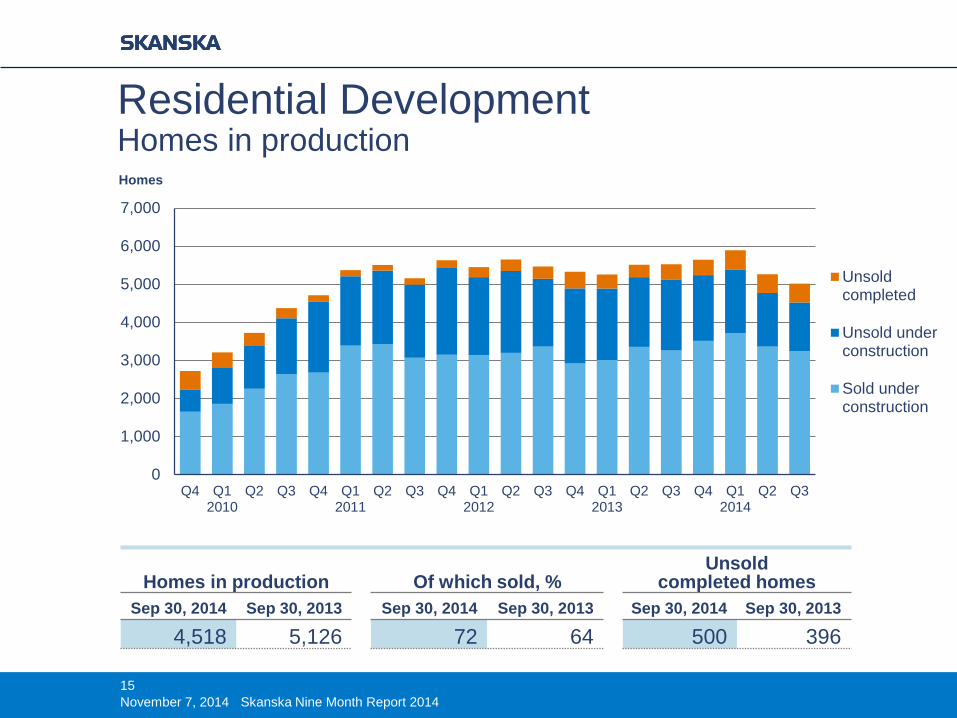
Unsoldcompleted
Unsold underconstruction
Sold underconstruction
Residential Development Homes in production
15
Homes in production Of which sold, % Unsold
completed homes Sep 30, 2014 Sep 30, 2013 Sep 30, 2014 Sep 30, 2013 Sep 30, 2014 Sep 30, 2013
4,518 5,126 72 64 500 396
November 7, 2014 Skanska Nine Month Report 2014
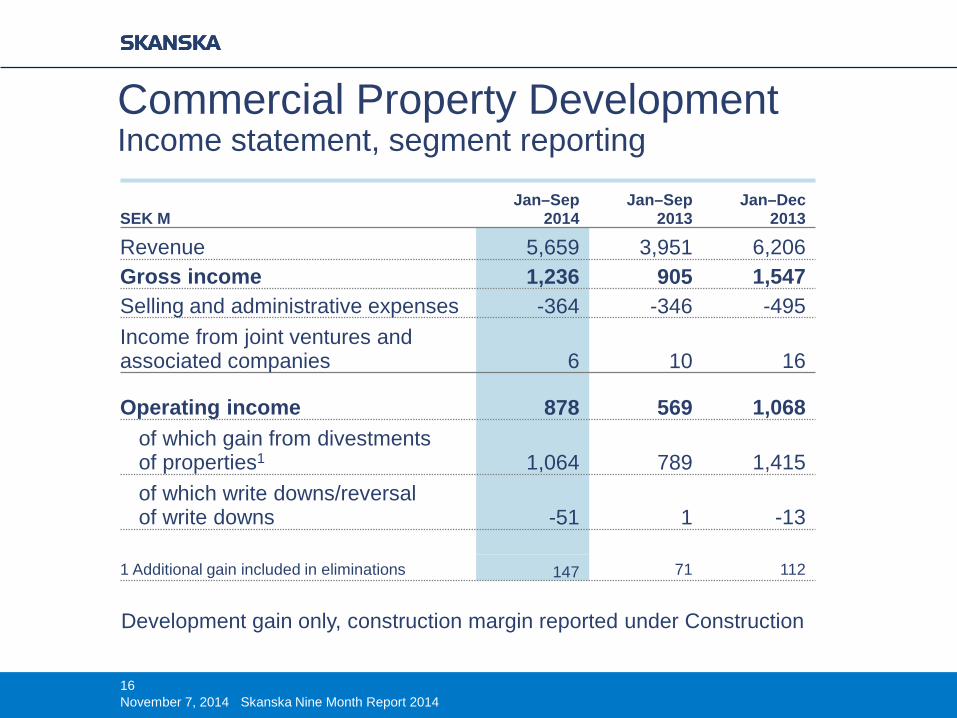
Commercial Property Development Income statement, segment reporting
16
SEK M
Jan–Sep 2014
Jan–Sep 2013
Jan–Dec 2013
Revenue 5,659 3,951 6,206 Gross income 1,236 905 1,547 Selling and administrative expenses -364 -346 -495 Income from joint ventures and associated companies 6 10 16
Operating income 878 569 1,068 of which gain from divestments of properties1 1,064 789 1,415 of which write downs/reversal of write downs -51 1 -13
1 Additional gain included in eliminations 147 71 112
Development gain only, construction margin reported under Construction
November 7, 2014 Skanska Nine Month Report 2014
0123456789
Q4 Q12010
Q2 Q3 Q4 Q12011
Q2 Q3 Q4 Q12012
Q2 Q3 Q4 Q12013
Q2 Q3 Q4 Q12014
Q2 Q3
Revenue fromdivestments,R-12
Operatingincome fromdivestments,R-12
SEK bn
Commercial Property Development Divestments
Sale of commercial properties
SEK M Sales price Capital gain
Year-to-date 5,307 1,064
17 November 7, 2014 Skanska Nine Month Report 2014
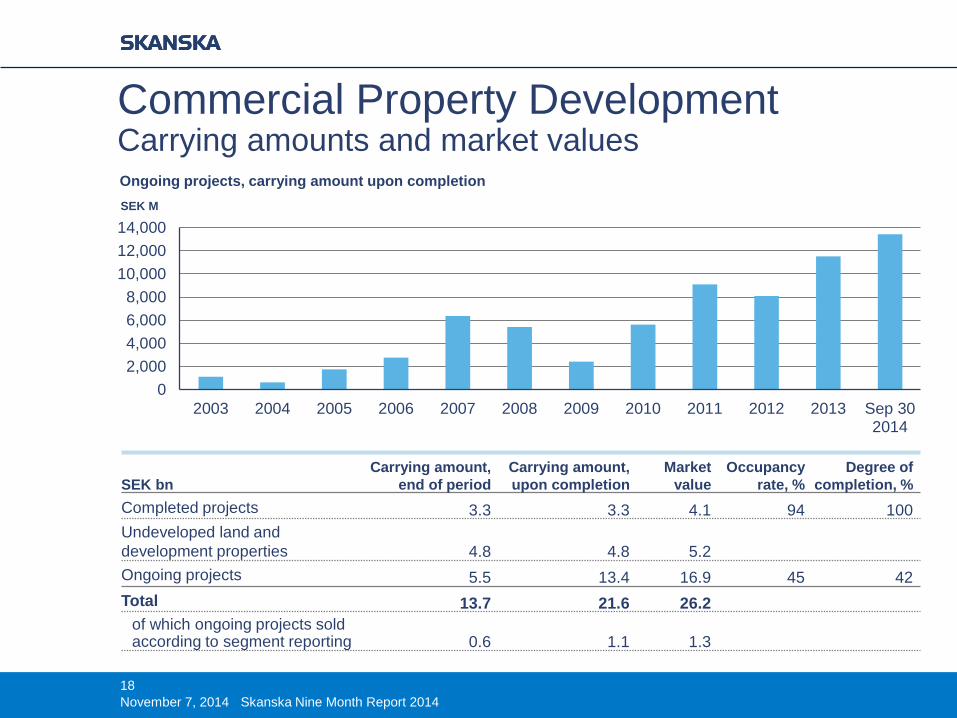
Commercial Property Development Carrying amounts and market values
18
SEK bn
Carrying amount, end of period
Carrying amount, upon completion
Market value
Occupancy rate, %
Degree of completion, %
Completed projects 3.3 3.3 4.1 94 100 Undeveloped land and development properties 4.8 4.8 5.2 Ongoing projects 5.5 13.4 16.9 45 42 Total 13.7 21.6 26.2 of which ongoing projects sold according to segment reporting 0.6 1.1 1.3
02,0004,0006,0008,000
10,00012,00014,000
2003 2004 2005 2006 2007 2008 2009 2010 2011 2012 2013 Sep 302014
SEK M
Ongoing projects, carrying amount upon completion
November 7, 2014 Skanska Nine Month Report 2014
0
50
100
150
200
250
300
350
400
Q4 Q12010
Q2 Q3 Q4 Q12011
Q2 Q3 Q4 Q12012
Q2 Q3 Q4 Q12013
Q2 Q3 Q4 Q12014
Q2 Q3
Leasing,quarterly
Leasing,R-12
000 sq m
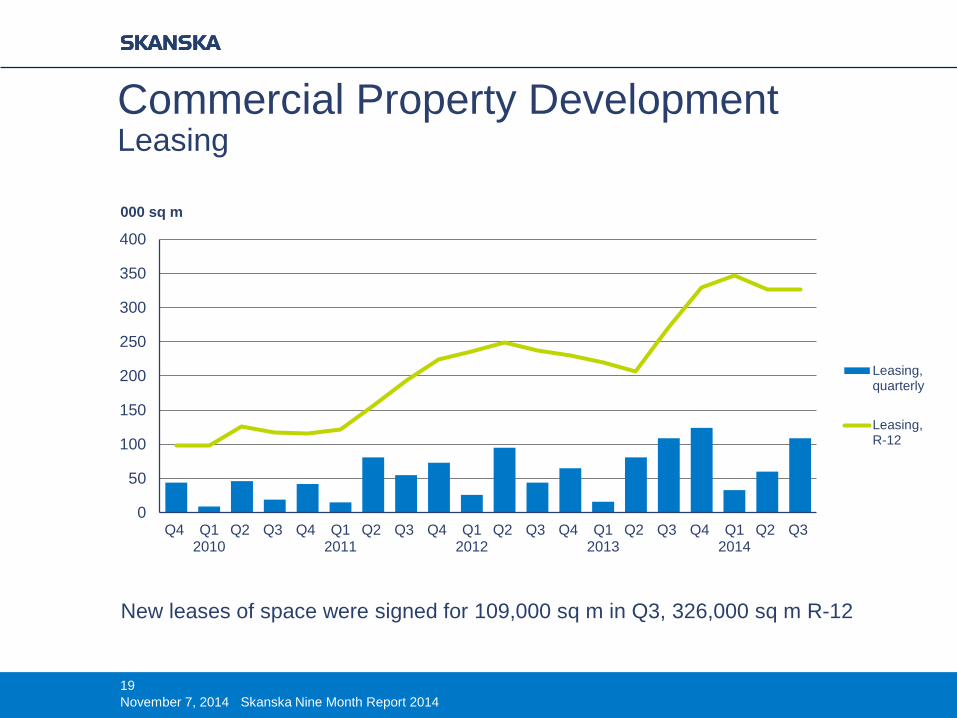
Commercial Property Development Leasing
19
New leases of space were signed for 109,000 sq m in Q3, 326,000 sq m R-12
November 7, 2014 Skanska Nine Month Report 2014
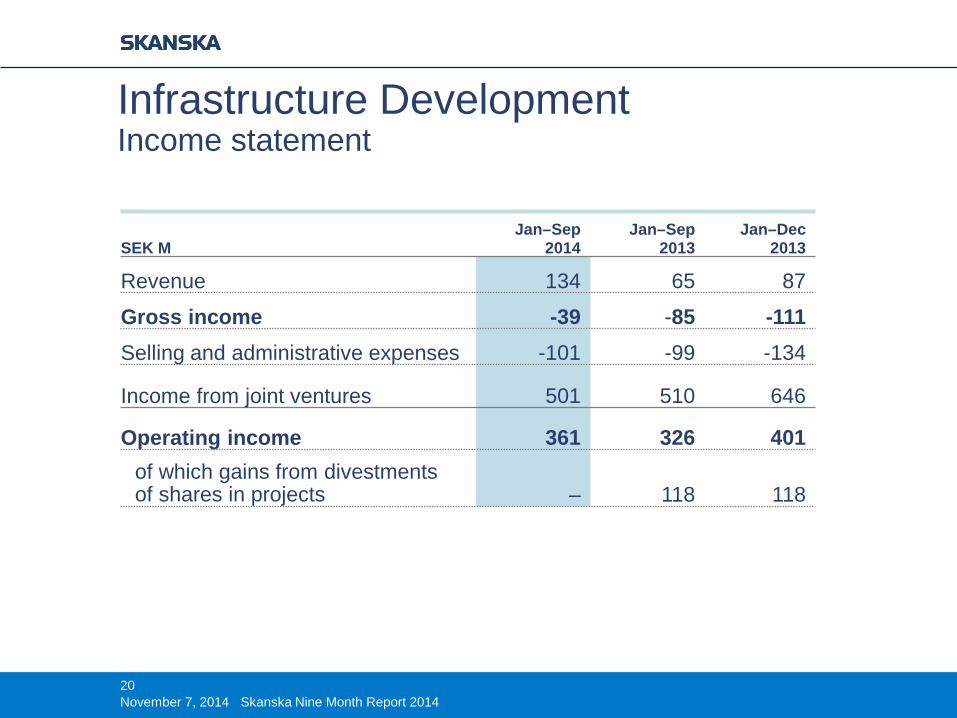
Infrastructure Development Income statement
20
SEK M
Jan–Sep 2014
Jan–Sep 2013
Jan–Dec 2013
Revenue 134 65 87
Gross income -39 -85 -111 Selling and administrative expenses -101 -99 -134
Income from joint ventures 501 510 646
Operating income 361 326 401 of which gains from divestments of shares in projects – 118 118
November 7, 2014 Skanska Nine Month Report 2014
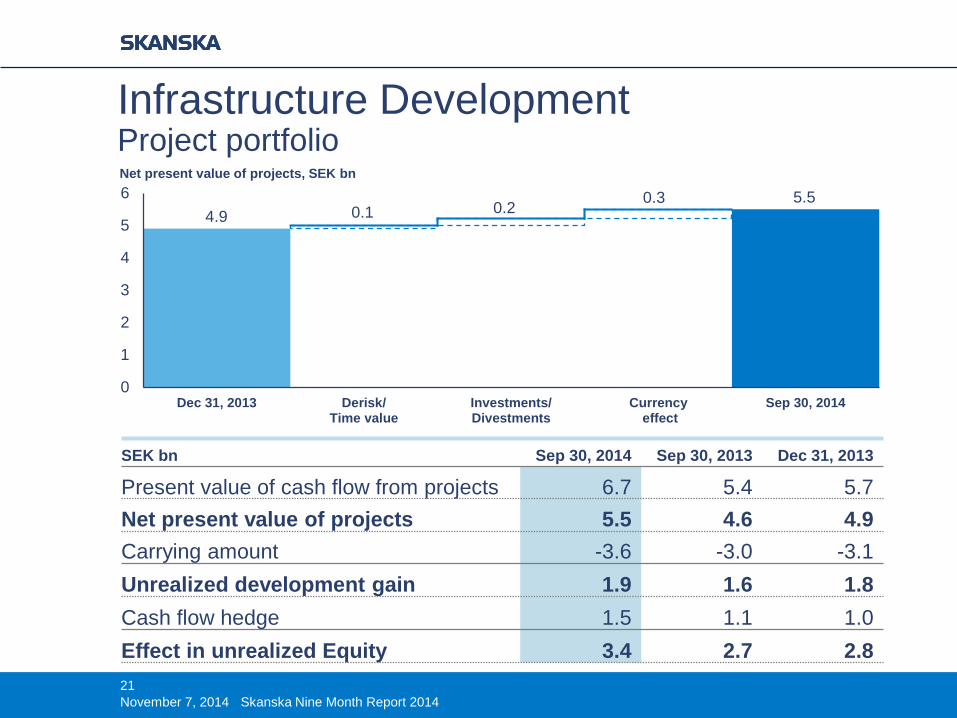
Net present value of projects, SEK bn
Infrastructure Development Project portfolio
21
4.9 0.1 0.2 0.3 5.5
0
1
2
3
4
5
6
Dec 31, 2013 Derisk/Time value
Investments/Divestments
Currency effect
Sep 30, 2014
SEK bn Sep 30, 2014 Sep 30, 2013 Dec 31, 2013
Present value of cash flow from projects 6.7 5.4 5.7 Net present value of projects 5.5 4.6 4.9 Carrying amount -3.6 -3.0 -3.1 Unrealized development gain 1.9 1.6 1.8 Cash flow hedge 1.5 1.1 1.0 Effect in unrealized Equity 3.4 2.7 2.8
November 7, 2014 Skanska Nine Month Report 2014
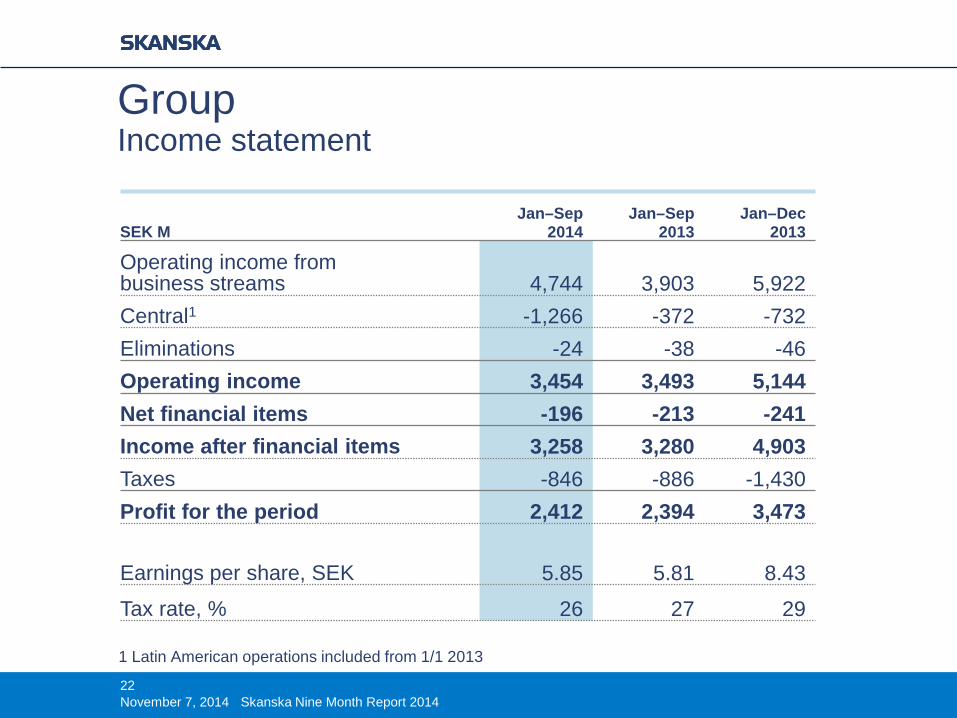
Group Income statement
22
SEK M
Jan–Sep 2014
Jan–Sep 2013
Jan–Dec 2013
Operating income from business streams 4,744 3,903 5,922 Central1 -1,266 -372 -732 Eliminations -24 -38 -46 Operating income 3,454 3,493 5,144 Net financial items -196 -213 -241 Income after financial items 3,258 3,280 4,903 Taxes -846 -886 -1,430 Profit for the period 2,412 2,394 3,473
Earnings per share, SEK 5.85 5.81 8.43
Tax rate, % 26 27 29
November 7, 2014 Skanska Nine Month Report 2014
1 Latin American operations included from 1/1 2013
-6-4-202468
10
Q4 Q12010
Q2 Q3 Q4 Q12011
Q2 Q3 Q4 Q12012
Q2 Q3 Q4 Q12013
Q2 Q3 Q4 Q12014
Q2 Q3
SEK bn
Cash flowfrombusinessoperations,quarterly
R-12
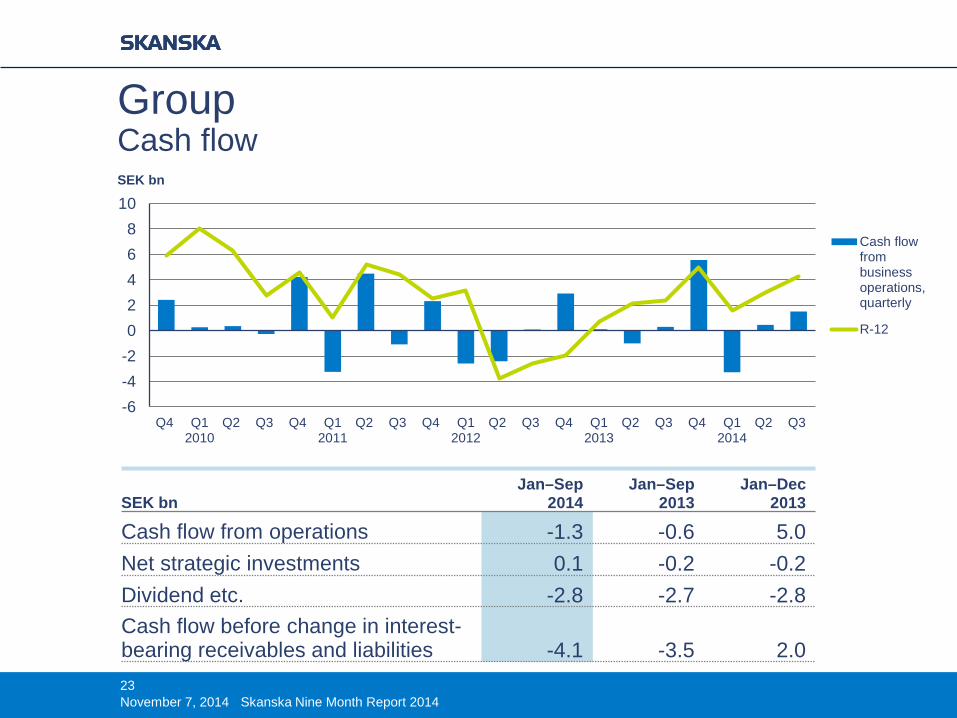
Group Cash flow
23
SEK bn
Jan–Sep 2014
Jan–Sep 2013
Jan–Dec 2013
Cash flow from operations -1.3 -0.6 5.0 Net strategic investments 0.1 -0.2 -0.2 Dividend etc. -2.8 -2.7 -2.8 Cash flow before change in interest-bearing receivables and liabilities -4.1 -3.5 2.0
November 7, 2014 Skanska Nine Month Report 2014
0
2
4
6
8
10
12
14
16
18
0
5
10
15
20
25
Q4 Q12010
Q2 Q3 Q4 Q12011
Q2 Q3 Q4 Q12012
Q2 Q3 Q4 Q12013
Q2 Q3 Q4 Q12014
Q2 Q3
% SEK bn
Free workingcapital, SEK bn
Average freeworking capital/Constructionrevenue, R-12, %
Free working capital, end of Q3, SEK bn
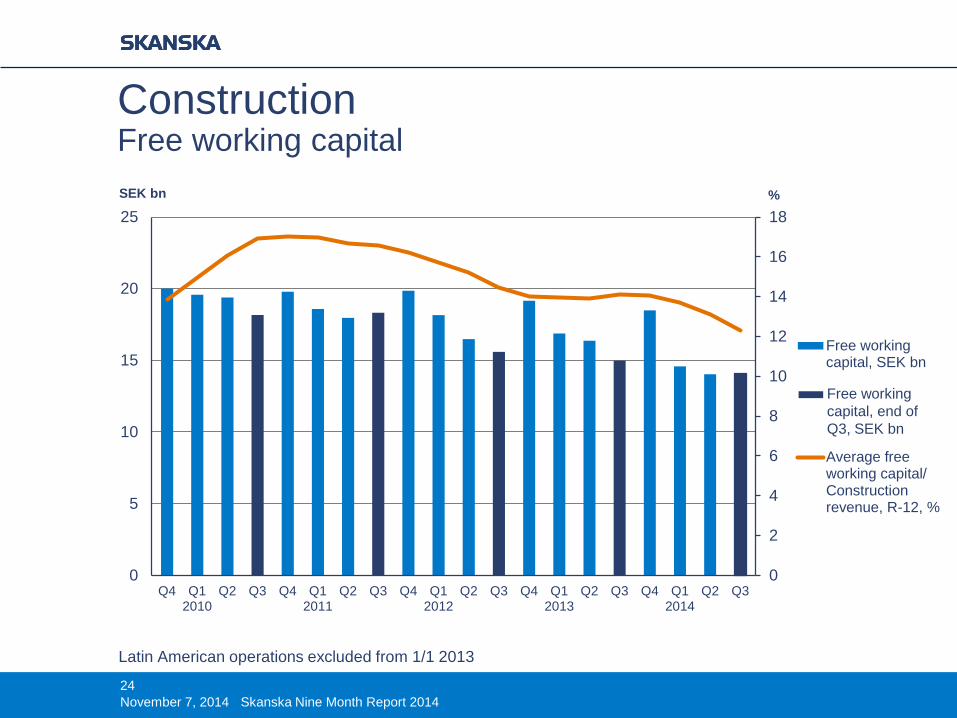
Construction Free working capital
24 November 7, 2014 Skanska Nine Month Report 2014
Latin American operations excluded from 1/1 2013
02468
101214
Q4 Q12010
Q2 Q3 Q4 Q12011
Q2 Q3 Q4 Q12012
Q2 Q3 Q4 Q12013
Q2 Q3 Q4 Q12014
Q2 Q3
Operating net financial assets/liabilities, SEK bn
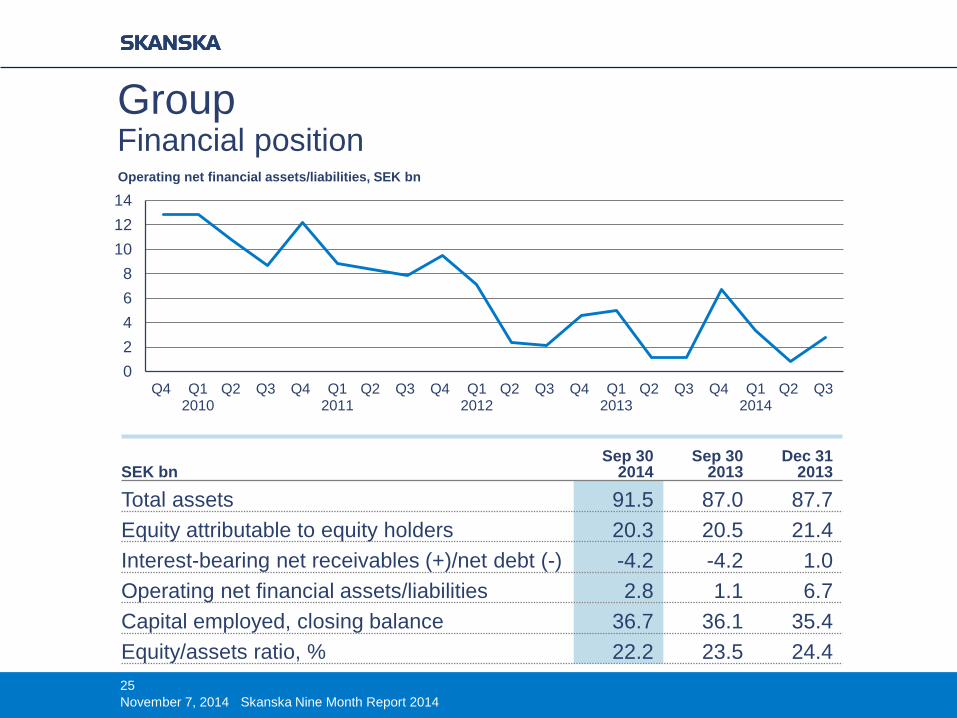
Group Financial position
25 November 7, 2014 Skanska Nine Month Report 2014
SEK bn
Sep 30 2014
Sep 30 2013
Dec 31 2013
Total assets 91.5 87.0 87.7 Equity attributable to equity holders 20.3 20.5 21.4 Interest-bearing net receivables (+)/net debt (-) -4.2 -4.2 1.0 Operating net financial assets/liabilities 2.8 1.1 6.7 Capital employed, closing balance 36.7 36.1 35.4 Equity/assets ratio, % 22.2 23.5 24.4
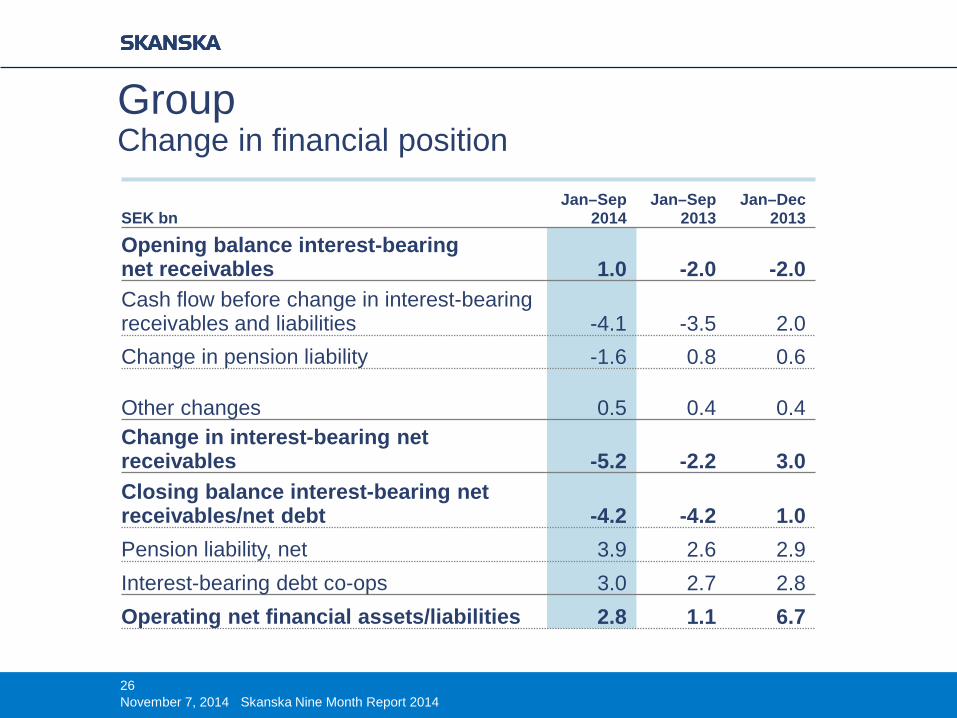
Group Change in financial position
26
SEK bn Jan–Sep
2014 Jan–Sep
2013 Jan–Dec
2013
Opening balance interest-bearing net receivables 1.0 -2.0 -2.0 Cash flow before change in interest-bearing receivables and liabilities -4.1 -3.5 2.0 Change in pension liability -1.6 0.8 0.6
Other changes
0.5 0.4 0.4 Change in interest-bearing net receivables -5.2 -2.2 3.0 Closing balance interest-bearing net receivables/net debt -4.2 -4.2 1.0 Pension liability, net 3.9 2.6 2.9 Interest-bearing debt co-ops 3.0 2.7 2.8 Operating net financial assets/liabilities 2.8 1.1 6.7
November 7, 2014 Skanska Nine Month Report 2014
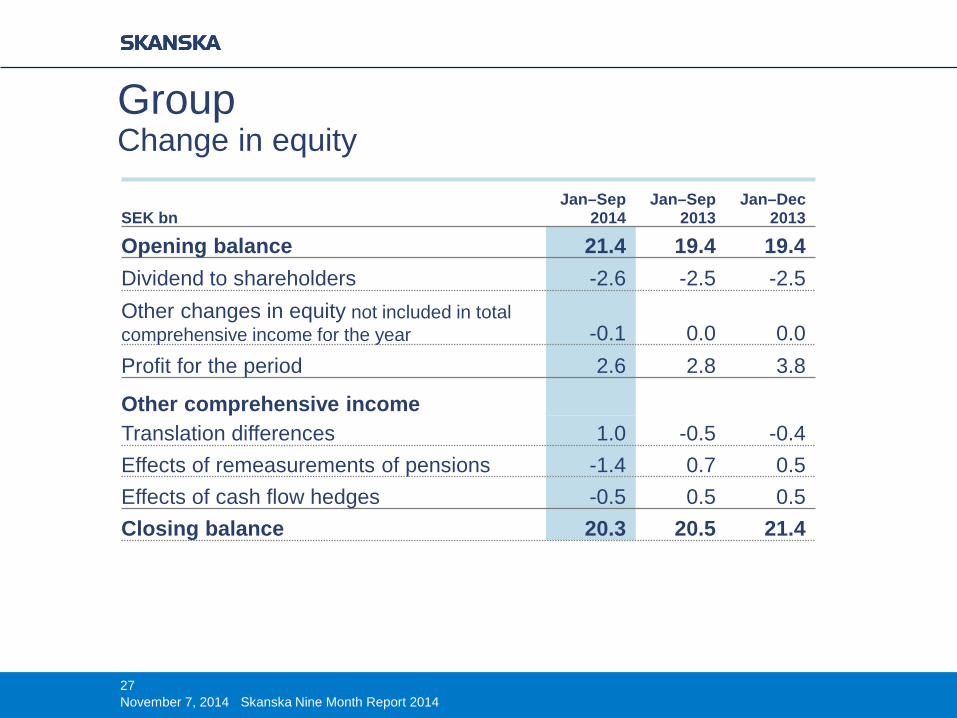
Group Change in equity
27 November 7, 2014 Skanska Nine Month Report 2014
SEK bn Jan–Sep
2014 Jan–Sep
2013 Jan–Dec
2013
Opening balance 21.4 19.4 19.4 Dividend to shareholders -2.6 -2.5 -2.5 Other changes in equity not included in total comprehensive income for the year -0.1 0.0 0.0 Profit for the period 2.6 2.8 3.8
Other comprehensive income Translation differences 1.0 -0.5 -0.4 Effects of remeasurements of pensions -1.4 0.7 0.5 Effects of cash flow hedges -0.5 0.5 0.5 Closing balance 20.3 20.5 21.4
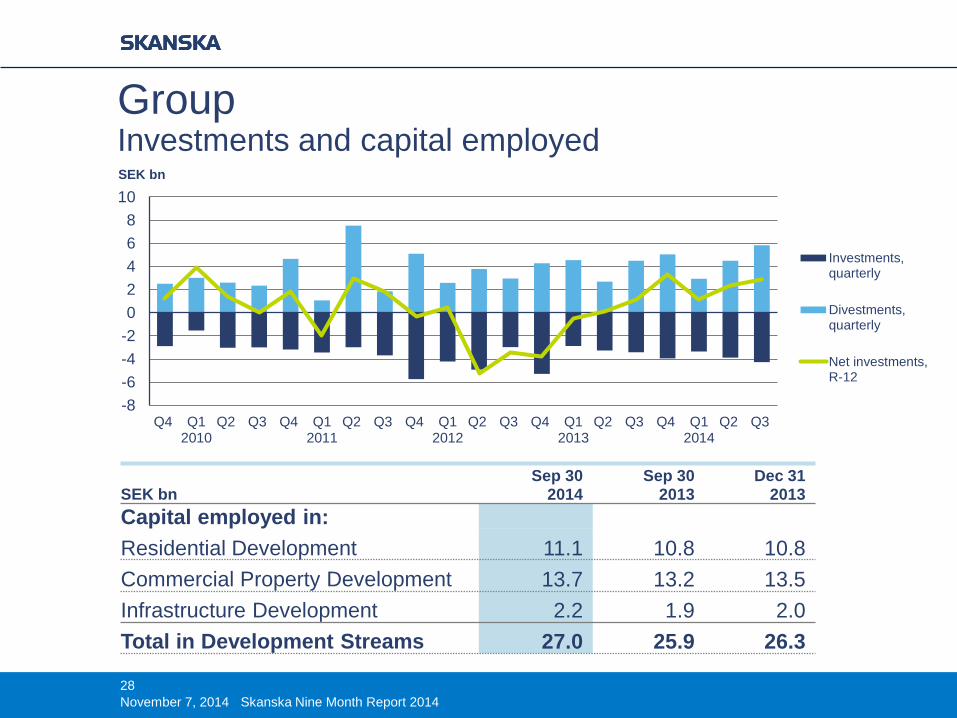
-8-6-4-202468
10
Q4 Q12010
Q2 Q3 Q4 Q12011
Q2 Q3 Q4 Q12012
Q2 Q3 Q4 Q12013
Q2 Q3 Q4 Q12014
Q2 Q3
SEK bn
Investments,quarterly
Divestments,quarterly
Net investments,R-12
Group Investments and capital employed
28 November 7, 2014 Skanska Nine Month Report 2014
SEK bn Sep 30
2014 Sep 30
2013 Dec 31
2013 Capital employed in: Residential Development 11.1 10.8 10.8 Commercial Property Development 13.7 13.2 13.5 Infrastructure Development 2.2 1.9 2.0 Total in Development Streams 27.0 25.9 26.3
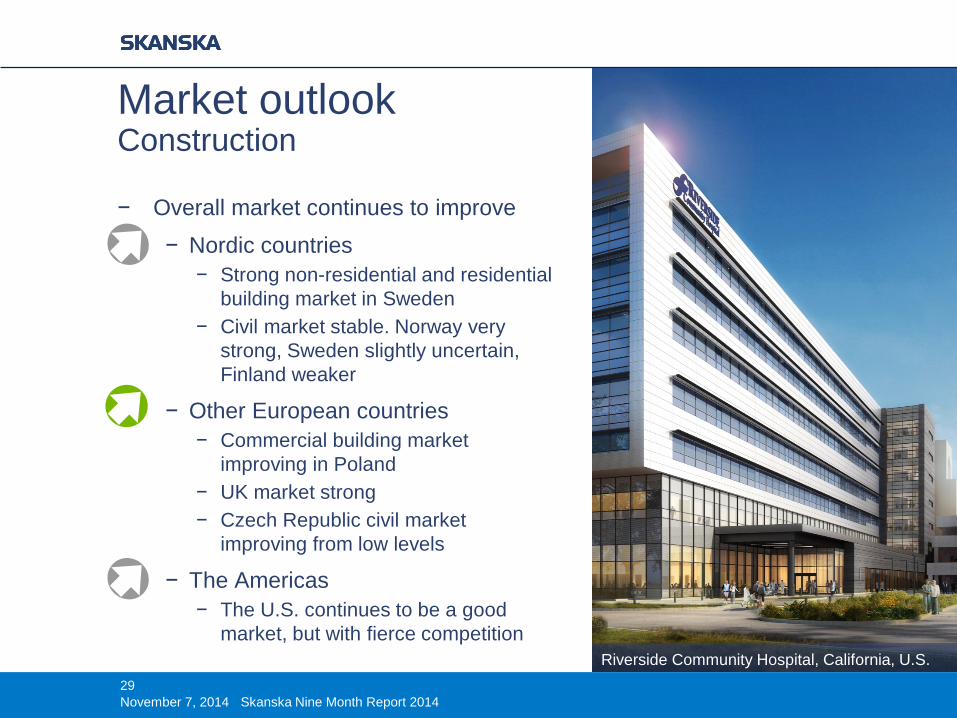
Market outlook Construction
29
− Overall market continues to improve − Nordic countries
− Strong non-residential and residential building market in Sweden
− Civil market stable. Norway very strong, Sweden slightly uncertain, Finland weaker
− Other European countries − Commercial building market
improving in Poland − UK market strong − Czech Republic civil market
improving from low levels
− The Americas − The U.S. continues to be a good
market, but with fierce competition
November 7, 2014 Skanska Nine Month Report 2014
Riverside Community Hospital, California, U.S.
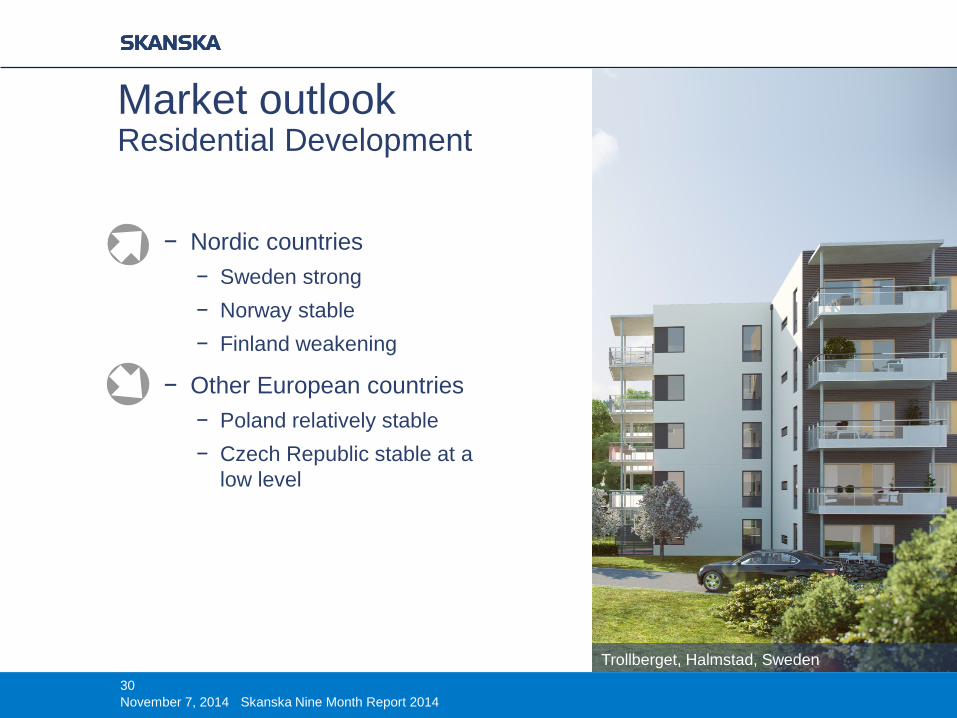
Trollberget, Halmstad, Sweden
− Nordic countries − Sweden strong − Norway stable − Finland weakening
− Other European countries − Poland relatively stable − Czech Republic stable at a
low level
Market outlook Residential Development
30 November 7, 2014 Skanska Nine Month Report 2014
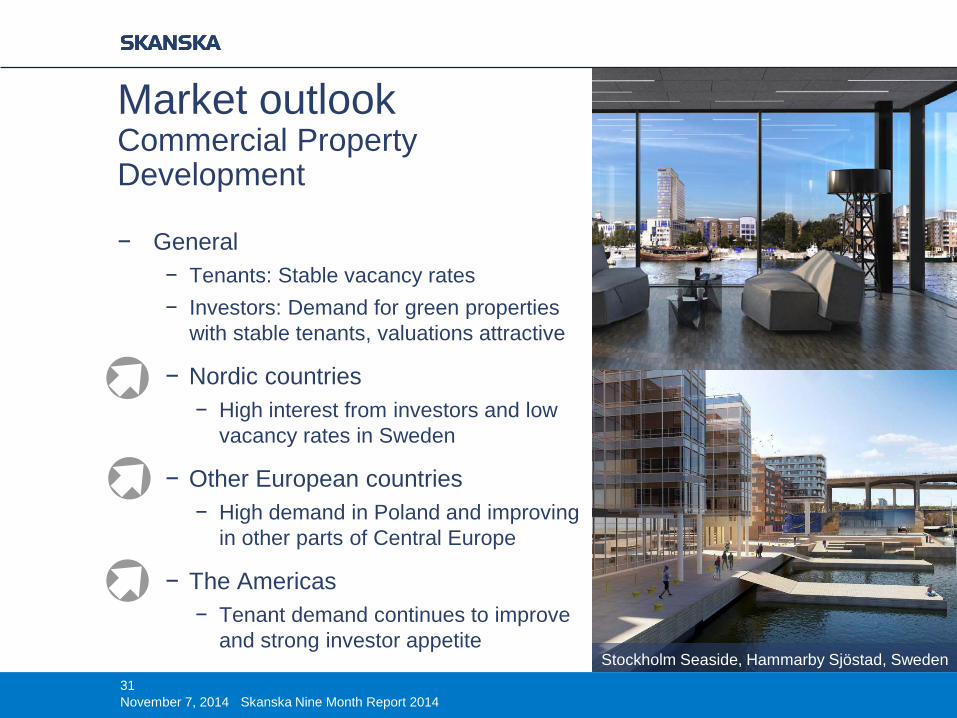
Stockholm Seaside, Hammarby Sjöstad, Sweden
− General − Tenants: Stable vacancy rates − Investors: Demand for green properties
with stable tenants, valuations attractive
− Nordic countries − High interest from investors and low
vacancy rates in Sweden
− Other European countries − High demand in Poland and improving
in other parts of Central Europe
− The Americas − Tenant demand continues to improve
and strong investor appetite
Market outlook Commercial Property Development
31 November 7, 2014 Skanska Nine Month Report 2014
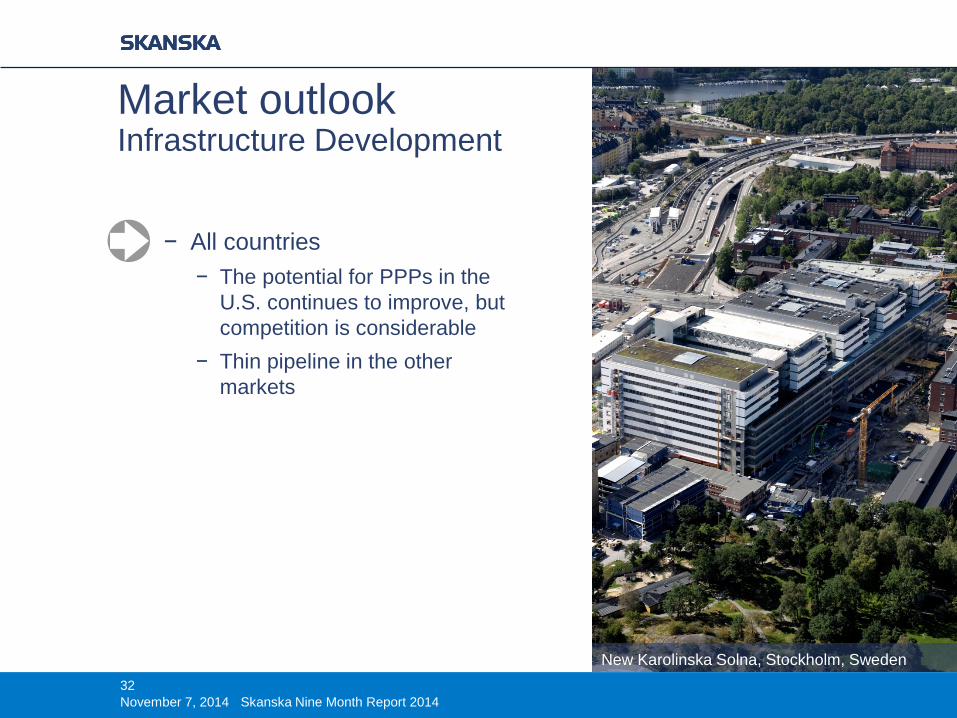
New Karolinska Solna, Stockholm, Sweden
Market outlook Infrastructure Development
32 November 7, 2014 Skanska Nine Month Report 2014
− All countries − The potential for PPPs in the
U.S. continues to improve, but competition is considerable
− Thin pipeline in the other markets
33 November 7, 2014 Skanska Nine Month Report 2014