Embed Size (px)
Citation preview
NINGO-PRAMPRAM
MUNICIPALITY

ii
Copyright © 2014 Ghana Statistical Service
iii
PREFACE AND ACKNOWLEDGEMENT
No meaningful developmental activity can be undertaken without taking into account the
characteristics of the population for whom the activity is targeted. The size of the population
and its spatial distribution, growth and change over time, in addition to its socio-economic
characteristics are all important in development planning.
A population census is the most important source of data on the size, composition, growth
and distribution of a country’s population at the national and sub-national levels. Data from
the 2010 Population and Housing Census (PHC) will serve as reference for equitable
distribution of national resources and government services, including the allocation of
government funds among various regions, districts and other sub-national populations to
education, health and other social services.
The Ghana Statistical Service (GSS) is delighted to provide data users, especially the
Metropolitan, Municipal and District Assemblies, with district-level analytical reports based
on the 2010 PHC data to facilitate their planning and decision-making.
The District Analytical Report for the Ningo-Prampram Municipality is one of the 216
district census reports aimed at making data available to planners and decision makers at the
district level. In addition to presenting the district profile, the report discusses the social and
economic dimensions of demographic variables and their implications for policy formulation,
planning and interventions. The conclusions and recommendations drawn from the district
report are expected to serve as a basis for improving the quality of life of Ghanaians through
evidence-based decision-making, monitoring and evaluation of developmental goals and
intervention programmes.
For ease of accessibility to the census data, the district report and other census reports
produced by the GSS will be disseminated widely in both print and electronic formats. The
report will also be posted on the GSS website: www.statsghana.gov.gh.
The GSS wishes to express its profound gratitude to the Government of Ghana for providing
the required resources for the conduct of the 2010 PHC. While appreciating the contribution
of our Development Partners (DPs) towards the successful implementation of the Census, we
wish to specifically acknowledge the Department for Foreign Affairs, Trade and
Development (DFATD) formerly the Canadian International Development Agency (CIDA)
and the Danish International Development Agency (DANIDA) for providing resources for
the preparation of all the 216 district reports. Our gratitude also goes to the Metropolitan,
Municipal and District Assemblies, the Ministry of Local Government, Consultant Guides,
Consultant Editors, Project Steering Committee members and their respective institutions for
their invaluable support during the report writing exercise. Finally, we wish to thank all the
report writers, including the GSS staff who contributed to the preparation of the reports, for
their dedication and diligence in ensuring the timely and successful completion of the district
census reports.
Dr. Philomena Nyarko
Government Statistician
iv
TABLE OF CONTENTS
PREFACE AND ACKNOWLEDGEMENT ........................................................................ iii
LIST OF TABLES .................................................................................................................. vi
LIST OF FIGURES ............................................................................................................... vii
ACRONYMS AND ABBREVIATIONS ............................................................................. viii
EXECUTIVE SUMMARY .................................................................................................... ix
CHAPTER ONE: INTRODUCTION ................................................................................... 1 1.1 Background ................................................................................................................. 1
1.2 Physical Features ......................................................................................................... 1
1.3 Political Administration and Structure ........................................................................ 3
1.4 Social and Cultural Structure ...................................................................................... 3
1.5 Economy...................................................................................................................... 4
1.6 Census Methodology, Concepts and Definitions ........................................................ 6
1.7 Organization of the Report ........................................................................................ 16
CHAPTER TWO: DEMOGRAPHIC CHARACTERISTICS ......................................... 17 2.1 Introduction ............................................................................................................... 17
2.2 Population Size and Distribution .............................................................................. 17
2.3 Age-Sex Structure ..................................................................................................... 19
2.4 Fertility, Mortality and Migration ............................................................................. 20
CHAPTER THREE: SOCIAL CHARACTERISTICS .................................................... 26 3.1 Introduction ............................................................................................................... 26
3.2 Size, Household Composition and Structure............................................................. 26
3.3 Marital Status ............................................................................................................ 28
3.4 Nationality ................................................................................................................. 31
3.5 Religious Affiliation .................................................................................................. 32
3.6 Literacy and Education.............................................................................................. 32
CHAPTER FOUR: ECONOMIC CHARACTERISTICS ............................................... 37 4.1 Introduction ............................................................................................................... 37
4.2 Economic Activity Status .......................................................................................... 37
4.3 Occupation ................................................................................................................ 39
4.4 Industry...................................................................................................................... 40
4.5 Employment Status ................................................................................................... 41
4.6 Employment Sector ................................................................................................... 42
CHAPTER FIVE: INFORMATION COMMUNICATION TECHNOLOGY .............. 43 5.1 Introduction ............................................................................................................... 43
5.2 Ownership of Mobile Phones and Internet Facility Usage ....................................... 43
5.3 Household Ownership of Desktop/Laptop Computer ............................................... 43
CHAPTER SIX: DISABILITY ........................................................................................... 44 6.1 Introduction ............................................................................................................... 44
6.2 Population with Disability ......................................................................................... 44

v
6.3 Types of Disability .................................................................................................... 44
6.4 Disability and Economic Activity ............................................................................. 46
6.5 Disability and Education ........................................................................................... 47
CHAPTER SEVEN: AGRICULTURAL ACTIVITIES ................................................... 50 7.1 Introduction ............................................................................................................... 50
7.2 Households in Agriculture ........................................................................................ 50
7.3 Types of Livestock and Other Animals Reared ........................................................ 50
CHAPTER EIGHT: HOUSING CONDITIONS ............................................................... 52 8.1 Introduction ............................................................................................................... 52
8.2 Housing Stock ........................................................................................................... 52
8.3 Type of Dwelling Unit, Holding and Tenancy Arrangement.................................... 53
8.4 Construction Materials of Dwelling Units ................................................................ 54
8.5 Room Occupancy ...................................................................................................... 56
8.6 Access to Utilities and Household Facilities ............................................................. 57
8.7 Sources of Water for Drinking and Other Domestic Purposes ................................. 58
8.8 Bathing and Toilet Facilities ..................................................................................... 60
8.9 Methods of Waste Disposal....................................................................................... 63
CHAPTER NINE: SUMMARY OF FINDINGS AND POLICY
RECOMMENDATIONS ..................................................................... 65 9.1 Introduction ............................................................................................................... 65
9.2 Summary of Findings ................................................................................................ 65
9.3 Policy Commendations ............................................................................................. 68
REFERENCES ....................................................................................................................... 70
APPENDICES ........................................................................................................................ 71
LIST OF CONTRIBUTORS ................................................................................................ 75

vi
LIST OF TABLES
Table 2.1: Population by age, sex and type of locality ........................................................... 18
Table 2.2: Reported total fertility rate, general fertility rate and crude birth rate
by district .............................................................................................................. 21
Table 2.3: Female population 12 years and older by age, children ever born,
children surviving and sex of child ........................................................................ 22
Table 2.4: Deaths in households and crude death rate by district ........................................... 22
Table 2.5: Causes of deaths in households ............................................................................. 24
Table 2.6: Birthplace and duration of residence of migrants ................................................... 25
Table 3.1: Household size by locality ..................................................................................... 26
Table 3.2: Household population by composition and sex ..................................................... 27
Table 3.3: Household structure and sex .................................................................................. 27
Table 3.4: Persons 12 years and older by sex, age-group and marital status .......................... 29
Table 3.5: Persons 12 years and older by sex, marital status and level of education ............. 30
Table 3.6: Marital status of population 12 years and older by sex and economic
activity status in the district ................................................................................... 31
Table 3.7: Population by nationality and sex .......................................................................... 32
Table 3.8: Population by religion and sex .............................................................................. 32
Table 3.9: Population 11 years and older by age-sex and literacy status ............................... 34
Table 3.10:Population 3 years and older by level of education, school attendance and sex ... 36
Table 4.1: Population 15 years and older by activity status and sex ...................................... 38
Table 4.2: Economic activity of population 15 years and older by age and sex ..................... 39
Table 4.3: Employed population 15 years and older by occupation and sex .......................... 40
Table 4.4: Employed population 15 years and older by Industry and sex .............................. 41
Table 4.5: Employed population 15 years and older by employment status and sex ............. 42
Table 4.6: Employed population 15 years and older by employment sector and sex ............. 42
Table 5.1: Population 12 years and older by mobile phone ownership, internet
facility usage, and sex ............................................................................................ 43
Table 5.2: Households having desktop/laptop computers, fixed telephone lines
and sex of head ....................................................................................................... 43
Table 6.1: Population by type of locality, disability type and sex .......................................... 44
Table 6.2: Persons 15 years and older with disability by economic activity status
and sex ................................................................................................................... 47
Table 6.3: Population 3 years and older by sex, disability type and level of education ......... 48
Table 7.1: Households by agricultural activities and locality ................................................. 50
Table 7.2: Distribution of livestock, other animals and keepers............................................. 51
Table 8.1: Stock of houses and households by type of locality .............................................. 52
Table 8.2: Ownership status of dwelling units by sex of household head and
type of locality ...................................................................................................... 53
Table 8.3: Type of occupied dwelling unit by sex of household head and type of locality ... 54
Table 8.4: Construction material for outer walls of dwelling units by type of locality .......... 55
Table 8.5: Construction materials for floors of dwelling units by type of locality ................. 55
vii
Table 8.6: Construction material for roofing of dwelling units by type of locality ................ 56
Table 8.7: Household size and number of sleeping rooms in dwelling units ......................... 57
Table 8.8: Source of energy for lighting dwelling units by type of locality ........................... 57
Table 8.9: Main source of cooking fuel, and cooking space used by households .................. 58
Table 8.10:Main source of water of dwelling unit for drinking and other
domestic purposes .................................................................................................. 60
Table 8.11: Type of toilet facility and bathing facility used by household by type
of locality .............................................................................................................. 62
Table 8.12: Method of solid and liquid waste disposal by type of locality ............................. 64
Table A1: Household composition by type of locality .......................................................... 71
Table A2: Population 3 years and older by sex, disability type and level of education ........ 72
Table A3: Population by sex, number of Households and houses in the 20 largest
communities .......................................................................................................... 73
Table A4: Population by age group in the 20 largest communities ....................................... 74
LIST OF FIGURES
Figure 2.1: Sex ratio of population in Ningo-Prampram ........................................................ 19
Figure 2.2: Population pyramid .............................................................................................. 20
Figure 2.3: Reported age specific death rates by sex .............................................................. 23
Figure 3.1: Marital status of population 12 years and older ................................................... 28
Figure 3.2: Population literate by language of literacy ........................................................... 33
Figure 6.1: Population with disability by type and sex ........................................................... 46
Figure 8.2: Toilet Facilities in Ningo-Prampram district........................................................ 61
viii
ACRONYMS AND ABBREVIATIONS
CBR Crude Birth Rate
CHPS Community Health Planning Services
CIDA Canadian International Development Agency
DANIDA Danish International Development Agency
DCE District Chief Executive
DCD District Co-coordinating Director
FAO Food Agricultural Organization
GFR General Fertility Rate
GSS Ghana Statistical Service
ICT Information Communication Technology
JSS Junior Secondary School
JHS Junior High School
LI Legislative Instrument
MDG Millennium Development Goal
NGO Non-Governmental Organization
PHC Population and Housing Census
PWDs Persons with Disabilities
SSS Senior Secondary School
UN United Nations
UNICEF United Nations Children Emergency Fund
WHO World Health Organization
ix
EXECUTIVE SUMMARY
Introduction
The district census report is the first of its kind since the first post-independence census was
conducted in 1960. The report provides basic information about the district. It gives a brief
background of the district, describing its physical features, political and administrative
structure, socio-cultural structure and economy. Using data from the 2010 Population and
Housing Census (2010 PHC), the report discusses the population characteristics of the district,
fertility, mortality, migration, marital status, literacy and education, economic activity status,
occupation, employment; Information Communication Technology (ICT), disability,
agricultural activities and housing conditions of the district. The key findings of the analysis are
as follows (references are to the relevant sections of the report):
Population size, structure and composition
The population of Ningo-Prampram District, according to the 2010 Population and Housing
Census, is 70,923 representing 1.8 percent of the region’s total population. Males constitute
47.3 percent and females represent 52.7 percent. About 558.3 percent of the population live in
rural localities. The district has a sex ratio of 89.6. The population of the district is youthful
(under 15 years) (38.2%) depicting a broad base population pyramid which tapers off with a
small number of elderly persons 60 years and above (6.6%). The total age dependency ratio for
the District is 75.3, the dependency ratio in the rural localities is higher (75.7) than that of the
dependency ratio in the urban areas (74.7).
Fertility, mortality and migration
The District has a Total Fertility Rate of 2.8. The General Fertility Rate is 82.3 births per 1000
women aged 15-49 years which is the ninth highest for the region. The Crude Birth Rate (CBR)
is 22 per 1000 population. The crude death rate for the district is 7.8 per 1000. The death rate
for males is highest for age 60-64 representing 45 deaths per 1000 population while for the
females, the highest death rate of 34 deaths per 1000 population is also for age 65-69.
Accident/violence/homicide/suicide accounts for 18.0 percent of deaths, while 82.0 percent is
by other causes. The district has a migrant population of 13,979. Majority of migrants (53.6%)
living in the district were born in elsewhere in another Region, while 41.9 percent were born
elsewhere in the Greater Accra region. For migrants born in another region, those born in Volta
region constitute 35.0 percent followed by Eastern with 30.1 percent and Central, 11.5 percent.
Household Size, composition and structure
The district has a household population of 68,521 with a total number of 14,627 households.
The average household size in the district is 4.8 persons per household. Children constitute the
largest proportion of the household members accounting for 37.9 percent. Spouses form about
8.4 percent while Grandchildren constitute 13.5 percent. Nuclear (head, spouse(s), children)
constitute 22.4 percent of the total number of households in the district and this is followed by
Single parent Extended households (25.1%).
Marital status
About 39.0 percent of the populations aged 12 years and older are married and 40.1 percent
have never married. By age 25-29 years, about 49.6 of females are married compared to 32.8
percent of males. At age 65 and above, widowed females account for as high as 56.5 percent
while widowed males account for only 13.0 percent. . Among the married, 36.1 percent have

x
no education while about 12.0 percent of the never married have never been to school. About
78.1 percent of the married populations are employed, 3.1 percent are unemployed and 18.7
percent are economically not active. More than half of those who have never married (64.2%)
are economically not active with 3.8 percent unemployed.
Nationality
The proportion of Ghanaians by birth in the district is 94.9 percent. Those who have
naturalised constitute 0.7 percent and the non-Ghanaian population in the district is 2.3
percent.
Literacy and education
Of the population 11 years and above, 71.2 percent are literate and 28.8 percent are non-
literate. The proportion of literate males is higher (78.7 %) than that of females (64.7%).
About four out of ten people (47.5%) indicated they could speak and write both English and
Ghanaian languages. Of the population aged 3 years and above (64,527) in the district, 27.8
percent has never attended school, 36.9 percent are currently attending and 35.3 percent have
attended in the past.
Economic activity status
About 66.8 percent of the populations aged 15 years and older are economically active while
33.2 per cent are economically not active. Of the economically active population, 94.1
percent are employed while 5.9 percent are unemployed. For those who are economically not
active, a larger percentage of them are students (48.8%) and 25.1 percent perform household
duties. Again, about 53.7 percent of the unemployed are seeking work for the first and
available for work.
Occupation
Of the employed population, about 28.5 percent are engaged as skilled agricultural forestry
and fishery workers, 24.0 percent service and sales workers, 21.8 percent in craft and related
trade and 6.8 percent in elementary occupations. About 9.8 percent are engaged as managers,
professionals, and technicians.
Employment status and sector
Of the employed population 15 years and older 62.4 percent are self-employed without
employees, while 6.0 percent are contributing family workers. About 4.8 percent are self-
employed with employees and 21.5 percent are employees. The private informal sector is the
largest employer in the district, employing 85.0 percent of the population followed by the
private formal with 9.1 percent.
Information Communication Technology
Of the population 12 years and above, 52.9 percent have mobile phones. Men who own
mobile phones constitute 60.2 percent as compared to 46.7 percent of females. About 8.7
percent of the population 12 years and older use internet facilities in the district. Also, about
7.5 percent of households in the district have desktop/laptop computers.
Disability
About 2.1 percent of the district’s total population has one form of disability or the other. The
proportion of the male population with disability is slightly lower (1.9) than that of females
(2.3). The types of disability in the district include sight, physical, hearing, speech, intellect,
xi
and emotion. Persons with sight disability recorded the highest of 42.9 percent followed by
physical (34.2%), and speech disability (17.6%). Of the population disabled, 44.9 percent are
employed and 52.2 percent economically not active. About 50.6 percent of the populations
with disability have never attended school.
Agriculture
In the district, 33.7 percent of households are engage in agriculture. In the rural localities,
43.5 percent of households are agricultural households while in the urban localities, 22.9
percent of households are into agriculture. Most households engaged in agriculture in the
district (84.8%) are involved in crop farming with chicken as the dominant animal reared in
the district.
Housing
The housing stock of Ningo-Prampram District is 9,236 representing 1.9 percent of the total
number of houses in the Greater Accra Region. The average number of persons per house is
7.7.
Type, tenancy arrangement and ownership of dwelling units
A little more than half (55.8%) of all dwelling units in the district are compound houses; 31.0
percent are separate houses and 4.9 percent are semi-detached houses. About 56 percent of
the dwelling units in the district are owned by members of the household; 23.7 percent are
owned by private individuals; 16.4 percent are owned by a relative who is not a member of
the household and only 1.3 percent are owned by public or government. About 0.3 percent of
the dwelling units are owned through mortgage schemes.
Material for construction of outer wall, floor and roof
The main construction material for outer walls of dwelling units in the district is cement
blocks/concrete accounting for 76 percent with mud brick/earth constituting 17.3 percent of
outer walls of dwelling units in the district. Cement/concrete (84.8%) and earth/mud (9.2%)
are the two main materials used in the construction of floors of dwelling units in the district.
slate/asbestos are the main roofing material (50.5%) for dwelling units in the district, while
36.9 percent of dwelling used metal sheets to roof their dwellings.
Room occupancy
Single room constitutes the highest percentage (55.8%) of sleeping rooms occupied by
households in housing units in the district. About 8.6 percent of households with 10 or more
members occupy single rooms.
Utilities and household facilities
The three main sources of lighting in dwelling units in the district are electricity (64.1%),
kerosene lamp (28.1%) and flashlight/torch (5.2%), The main source of fuel for cooking for
most households in the district is charcoal (52.2%). The proportions for urban is higher than
that of rural. The four main sources of water in the district are pipe borne water, public
standpipe and pipe-borne inside dwelling supply. About 32 percent of households drink water
from pipe-borne outside dwelling.
Majority of households (55.1%) do not have toilet facilities and therefore resort to fields,
bush and beaches. Other households (27.1%) in the District use the public toilet (WC, KVIP,
Pit, pan) as places for convenient. Also, about 26.1 percent of households use W.C. About a
xii
fifth of households (26.1%) in the district have bathrooms for exclusive use of members
while another 22.9 percent use shared separate bathroom in the same house.
Waste disposal
Most households (32.3%) burn their solid waste and 30.5 percent dump in a public dump
(container). Another 4.4 percent have their solid waste collected. For liquid waste disposal,
throwing of waste onto the compound (58.5%) and onto the street (26.9%) and are the two
most common methods used by households in the district.
1
CHAPTER ONE
INTRODUCTION
1.1 Background
The Ningo-Prampram district was carved out of the then Dangme West district into Shai
Osudoku and Ningo-Prampram districts by the LI 2132 in 2012 and the Local Government
Act of 1993(Act 462). The Local Government Act of 1993, (ACT 462) and the National
Development Planning System Act of 1994 (ACT 480) designate the District Assembly as
the Planning Authority with the mandate to plan, initiate and implement development
programmes at the local level. With the decentralized system of development, the Assembly
as the planning authority is expected to initiate and coordinate the processes of planning,
programming, budgeting and implementation of district plans, programmes and projects
including integration of population policies and issues, as they pertain to the needs of
particular districts and communities.
1.2 Physical Features
1.2.1 Location and size
Ningo-Prampram district covers a total land area of about 622.2 square kilometers. The
district is located about 15 km to the east of Tema and about 40 km from Accra, the capital of
Ghana. The district is bounded in the north by Shai-Osudoku district, south by the Gulf of
Guinea, in the east by the Ada East district and to the west by Kpone-Katamanso district. The
district’s proximity to Tema and Accra makes it easy for community members to have access
to many social facilities and infrastructure, such as, good roads, water, hospitals and
electricity. The district also serves as a dormitory for workers in many industries in Tema and
Accra metropolis.
1.2.2 Relief and drainage
The district forms the central portion of the Accra plains. The relief is generally gentle and
undulating, a low plain with heights not exceeding 70 meters. The plains are punctuated in
isolated areas by a few prominent inselbergs, isolated hills, outliers and knolls scattered
erratically over the area.
Ancient igneous rocks underlie the major part of the district. Strongly metamorphosed
ancient sediments occur along the western boundary. There are also important areas of
relatively young unconsolidated sediments in the south and southeast. Dahomeyan gneiss and
schist’s occupy most of the plains proper. Basic gneiss forms a number of large inselbergs
(isolated rocky hills) in the north and center of the belt. Small rock outcrops are also common
in the north close to the inselbergs but are rare in the south and southeast.
The general pattern of drainage in the Ningo-Prampram district is dendritic with most of the
streams taking their source from the Akwapim range which also serves as a watershed and
flows in a northwest to southwest directions into lagoons on the coast.
2
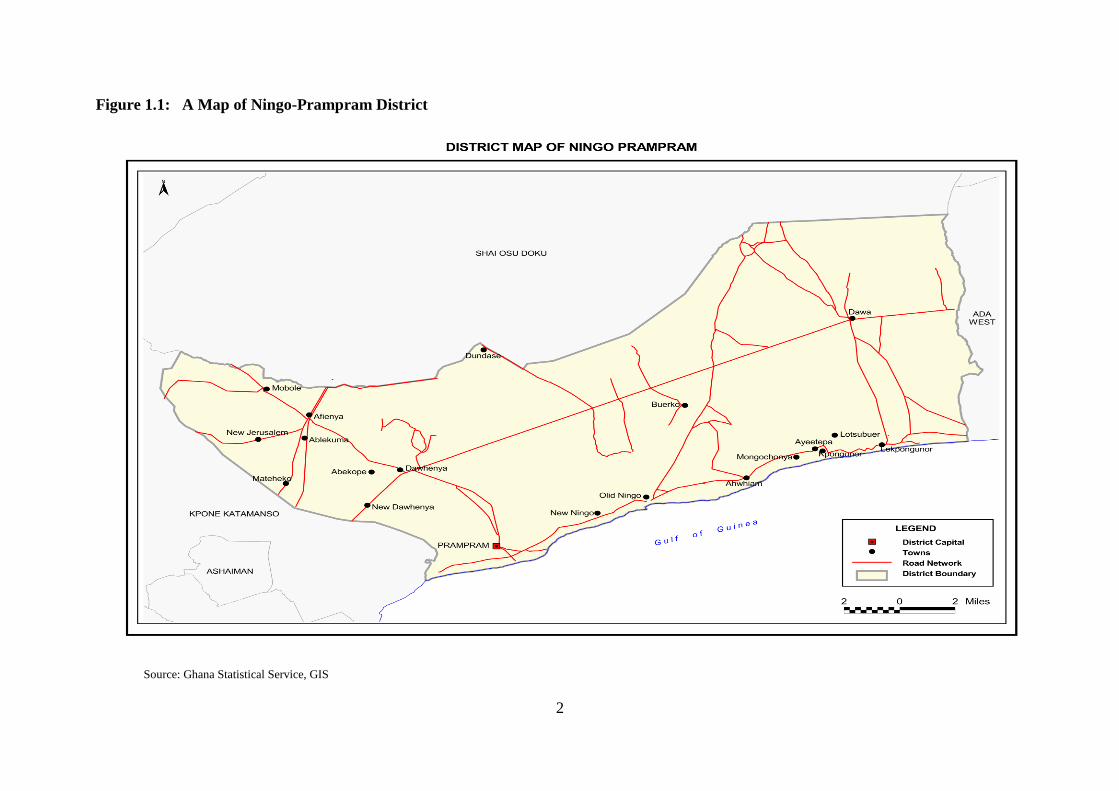
Figure 1.1: A Map of Ningo-Prampram District
Source: Ghana Statistical Service, GIS
3
Flowing over a fairly low terrain, most of the streams have carved wide valleys for
themselves which are left dry for most parts of the year. The very seasonal nature of most of
the streams caused by high temperatures and equally high insulation levels have encouraged
the creation of a number of artificial dams and ponds of varying size, used for irrigation and
for the watering of livestock. Prominent among these is the Dawhenya dam on the Dekyidor
stream which provides ample water for irrigation farming, particularly, rice and vegetables.
1.2.3 Climate
The south-eastern coastal plain of Ghana, which encompasses the Ningo-Prampram district,
is one of the hottest and driest parts of the country. Temperatures are however subjected to
occasional and minimal moderating influences along the coast and altitudinal influences
affected by the Akwapim range in the northwest. Temperatures are appreciably high for most
parts of the year with the highest during the main dry season (November – March) and lowest
during the short dry season (July – August). The maximum temperature is 40 0 C.
The most complete absence of cloud cover for most parts of the year gives way to very high
rates of evaporation which leaves most parts of the district dry and with parched soils.
The combined effects of high temperatures and high insulation levels, on the other hand, are
of invaluable asset to the salt-making industry, as they account for the high and rapid rates of
stalinization and crystallization crucial for the winning of salt. They also provide enormous
potentials for solar power development.
Rainfall is generally very low with most of the rains being very erratic in coming mostly
between September and November. The mean annual rainfall increases from 762.5 milliliters
in the coast to 1,220 milliliters in the northern parts of the district.
1.3 Political Administration and Structure
Ningo-Prampram District Assembly is headed by the District Chief Executive and assisted
administratively by the District Co-coordinating Director. The Assembly through the Local
Government Act 1993 and Act 462 (section 10 sub sections 1,2,3,4 and 5), carries out the
legislative, deliberative and executive functions of government.
There are currently thirty-two (32) Assembly members including the District Chief Executive
and the Member of Parliament for the constituency. The remaining thirty (30) members are
made up of ten (10) appointed and twenty (20) elected members. There are only six (6)
women out of the thirty (30) Assembly members, representing 20.0 percent. The district is
divided into three Area Councils under which are the twenty (20) electoral areas. There are
13 departments performing various functions in the district.
1.4 Social and Cultural Structure
1.4.1 Traditional Administration
The people of Ningo-Prampram district are predominantly Ga-Dangmes. The oral traditions
of the Ga-Dangmes hold that the communities, which now constitute the Ga-Dangme, once
lived in an area they claim was called SAME in modern day Nigeria, having migrated from
southern Sudan and Egypt. From Nigeria, the Gas moved by sea to their present location, and
the Dangmes traveled by land through Togo crossing the River Volta at various points to a
place called Lowlowvor, where they lived for quiet sometime until they broke up into the
composite tribes, namely, Shai, Osudoku (who remains inland), Ningo, Ada (who moved to
4
the coast) and were later joined by Prampram (Gbugbla). The indigenous people of the
district are organized into two traditional areas, namely, Prampram Traditional Area with
paramouncy at Prampram and Ningo Traditional Area with the Seat at Ningo. Other ethnic
groups in the district include Ewe, Hausa, Asante, Fantes and among others. (Source:
Ningo—Prampram District Assembly)
1.4.2 Festivals
The district is known for its rich child naming ceremony and other festivals. Puberty rites are
performed for boys and girls. The boys undergo circumcision in their infancy. When they
reach manhood, their fathers buy guns for them and engage wives for them. They are also
given land to cultivate or fishing gear to fish.
The girls undertake the ‘Dipo’ rite, which originally, was a home craft course lasting for three
years. During this period, they are taught personal cleanliness, housekeeping and cookery,
laundry, sewing with thread and needle, weaving of basket, childcare and decent manners.
Today, the period for the ‘Dipo’ initiation rites has been reduced considerably to one month
or less.
There are a number of annual festivals that are held between August and October. The people
of Prampram and Ningo celebrate ‘Homowo’ festivals. Other celebrations for traditional
festivals take place yearly after the Easter celebration. The chiefs and the ‘Asafoatsemei’ also
observe yam festivals for their traditional stools every year. Funeral rites for the departed
relations are also observed yearly by the various clans. (Source: District Office)
1.4.3 Social infrastructure/amenities
The district has 107 public schools, made up of 32 JHS, 42 primary, 2 SHS and 31 pre-
schools. There are also about 93 private schools. Prampram Senior High School and Ningo
Senior High School are the only public second cycle institutions in the district.
The district has 15 health facilities out of which 10 are public health facilities and the
remaining five are private. The health facilities render services like laboratory, pharmacy,
school health, family planning, reproductive and child health and maternal services. Cases
above these facilities are usually referred to the Tema General Hospital, which is 15 km drive
from Prampram, the district capital. With these facilities, physical access to health care
delivery is not a major problem in the Ningo-Prampram district.
1.5 Economy
The Ningo-Prampram district is largely rural. The predominance of rural population reflects
in the occupational distribution with agriculture as the dominant occupation. About 90
percent of the total land area is arable land and about 25 percent is mainly savannah grassland
suitable for livestock farming. The major crops grown in the district are cassava, maize,
mango, banana, vegetables (tomato, okro, pepper) and rice. The district border on the Gulf of
Guinea with a coastline stretching over 37 kilometers gives the district vast fishing potential.
This potential is currently under great exploitation by many households in the district.
Irrigation agriculture is practiced on a medium scale in the district. About 15.6 percent of
crop farmers are engaged in irrigation agriculture under the Dawhenya Irrigation Scheme
with the remaining depending on rain (rain fed agriculture). The total land area at the scheme
site is 480 hectares. Currently, the developed area of the scheme is 240 hectares. The main
Irrigation Scheme has reservoir with a capacity of 5.6 million cubic meters of water for
5
irrigation. The farmers have organized themselves into co-operative societies which are
registered under the Department of Co - operatives.
There are a number of manufacturing activities in the district that provide employment
opportunities for the people. The activities cover production of agricultural inputs (e.g.
RANNAH Fish Feed Company), carpentry (e.g. MELGREP Company), block making
companies and small scale aluminium industries that produce cooking utensils.
Although agriculture dominates in the district, the leading sectors in terms of revenue to the
district Assembly and remunerations to workers is the housing development sector. Financial
reports from the District Assembly indicate that the highest contribution to internally
generated revenue comes from building permit applications and fines. This is followed
closely by business operating permits.
1.5.1 Transport, telecommunication and banking services
The district has about 264.9 kilometers of road network. 40 per cent is surfaced while the
rest are feeder roads.The road surface condition of the national trunk roads (i.e. Tema–
Akosombo and Tema-Aflao) is of an appreciably good condition.Various forms of transport
including private vehicles, commercial private minibuses, public buses, motorbikes, tricycles,
bicycles and others types of IMTs are found in the district.
The district is earmarked for the construction of a new Ghana international airport, Ghana
affordable housing and an ultra-modern sports academy among others.
The new international Airport is one of the major interventions of the government, intended
to ease pressure on the Kotoka International Airport (KIA) and create more space for Airlines
in the country. A land size of 60,000 acres has been acquired at Tsopoli-Nigbenya a
community within the district for this project. So far, feasibility study and survey works had
been completed on the project and work will soon begin. The project will be jointly funded
by the government of Ghana and other investors. The Airport will come along with new state
Airlines. It is expected that this project will bring development, create employment and other
economic benefits for the people in the Ningo-Prampram district and Ghana at large.
The Ghana (5,000) affordable housing unit is under construction in the Ningo-Prampram
district. This initiative is to help solve the housing deficit in the country and also provide
employment for the local contractors and the people within the district. The amount being
accrued in the sale of the houses would be channeled into building additional houses for the
district and the country at large. (Source: Ghana News Agency)
Availability of cheap agricultural lands is forcing private housing developers (Castle Gate,
Elite Kingdom, HFC Reality, Noble Reality Estates etc.) into converting the district into
dormitory towns for workers in and outside the district.
The district is served with a number of services which includes banking, transport,
telecommunication, and electricity. There are Fourteen (14) financial institutions, sixteen (16)
fuel service stations and eight (8) Gas stations.The district is connected to the national
electricity grid. Current estimates show that more than half of households in the district have
access to electricity.
1.5.2 Tourism
The Ningo-Prampram district can boast of interesting places that attract tourist both in and
outside the country. The district is known to have one of the finest beaches in the country
6
with clean and clear water. It also has beautiful palm trees at the shore which provides shades
for tourists.
The coastline of Ghana is famous for its ancient forts and castles built by early European
traders, and one of them is in the district. Tourists that visit the fort are guarded by a tourist
guard because the indigenes believe there are some ammunitions buried there to avoid any
explosion.
The oldest police station in the country built in 1486 is in the district. The police station is
still in existence and tourists’ troop in and out of the district to have a look at it. The other
popular tourist attractions in the district are the decent hotels, guest houses, restaurants, the
polo sport as well as the rich festivals
1.6 Census Methodology, Concepts and Definitions
1.6.1 Introduction
Ghana Statistical Service (GSS) was guided by the principle of international comparability
and the need to obtain accurate information in the 2010 Population and Housing Census
(2010 PHC). The Census was, therefore, conducted using all the essential features of a
modern census as contained in the United Nations Principles and Recommendations for
countries taking part in the 2010 Round of Population and Housing Censuses.
Experience from previous post independence censuses of Ghana (1960, 1970, 1984 and 2000)
was taken into consideration in developing the methodologies for conducting the 2010 PHC.
The primary objective of the 2010 PHC was to provide information on the number,
distribution and social, economic and demographic characteristics of the population of Ghana
necessary to facilitate the socio-economic development of the country.
1.6.2 Pre-enumeration activities
Development of census project document and work plans
A large scale statistical operation, such as the 2010 Population and Housing Census required
meticulous planning for its successful implementation. A working group of the Ghana
Statistical Service prepared the census project document with the assistance of two
consultants. The document contains the rationale and objectives of the census, census
organization, a work plan as well as a budget. The project document was launched in
November 2008 as part of the Ghana Statistics Development Plan (GSDP) and reviewed in
November 2009.
Census secretariat and committees
It is a well-structured management and supervisory framework that outlines the
responsibilities of the various stakeholders is essential for the effective implementation of a
population and housing census. To implement the 2010 PHC, a National Census Secretariat
was set up in January 2008 and comprised professional and technical staff of GSS as well as
staff of other Ministries, Departments and Agencies (MDAs) seconded to GSS. The Census
Secretariat was primarily responsible for the day-to-day planning and implementation of the
census activities. The Secretariat had seven units, namely; census administration,
cartography, recruitment and training, publicity and education, field operations and logistics
management, data processing, and data analysis and dissemination.
7
The Census Secretariat was initially headed by an acting Census Coordinator engaged by the
United Nations Population Fund (UNFPA) in 2008 to support GSS in the planning of the
Census. In 2009, the Census Secretariat was re-organised with the Government Statistician as
the National Chief Census Officer and overall Coordinator, assisted by a Census
Management Team and a Census Coordinating Team. The Census Management Team had
oversight responsibility for the implementation of the Census. It also had the responsibility of
taking critical decisions on the census in consultation with other national committees. The
Census Coordinating Team, on the other hand, was responsible for the day-to-day
implementation of the Census programme.
A number of census committees were also set up at both national and sub-national levels to
provide guidance and assistance with respect to resource mobilization and technical advice.
At the national level, the committees were the National Census Steering Committee (NCSC),
the National Census Technical Advisory Committee (NCTAC) and the National Census
Publicity and Education Committee (NCPEC). At the regional and district levels, the
committees were the Regional Census Implementation Committee and the District Census
Implementation Committee, respectively.
The Regional and District Census Implementation Committees were inter-sectoral in their
composition. Members of the Committees were mainly from decentralized departments with
the Regional and District Coordinating Directors chairing the Regional Census
Implementation Committee and District Census Implementation Committee, respectively.
The Committees contributed to the planning of district, community and locality level
activities in areas of publicity and field operations. They supported the Regional and District
Census Officers in the recruitment and training of field personnel (enumerators and
supervisors), as well as mobilizing logistical support for the census.
Selection of census topics
The topics selected for the 2010 Population and Housing Census were based on
recommendations contained in the UN Principles and Recommendations for 2010 Round of
Population and Housing Censuses and the African Addendum to that document as well as the
needs of data users. All the core topics recommended at the global level, i.e., geographical
and internal migration characteristics, international migration, household characteristics,
demographic and social characteristics such as age, date of birth, sex, and marital status,
fertility and mortality, educational and economic characteristics, issues relating to disability
and housing conditions and amenities were included in the census.
Some topics that were not considered core by the UN recommendations but which were
found to be of great interest and importance to Ghana and were, therefore, included in the
2010 PHC are religion, ethnicity, employment sector and place of work, agricultural activity,
as well as housing topics, such as, type of dwelling, materials for outer wall, floor and roof,
tenure/holding arrangement, number of sleeping rooms, cooking fuel, cooking space and
Information Communication Technology (ICT).
Census mapping
A timely and well implemented census mapping is pivotal to the success of any population
and housing census. Mapping delineates the country into enumeration areas to facilitate
smooth enumeration of the population. The updating of the 2000 Census Enumeration Area
(EA) maps started in the last quarter of 2007 with the acquisition of topographic sheets of all
8
indices from the Survey and Mapping Division of the Lands Commission. In addition, digital
sheets were also procured for the Geographical Information System Unit.
The Cartography Unit of the Census Secretariat collaborated with the Survey and Mapping
Division of the Lands Commission and the Centre for Remote Sensing and Geographic
Information Services (CERSGIS) of the Department of Geography and Resource
Development, University of Ghana, to determine the viability of migrating from analog to
digital mapping for the 2010 PHC, as recommended in the 2000 PHC Administrative Report.
Field cartographic work started in March 2008 and was completed in February 2010.
Development of questionnaire and manuals
For effective data collection, there is the need to design appropriate documents to solicit the
required information from respondents. GSS consulted widely with main data users in the
process of the questionnaire development. Data users including MDAs, research institutions,
civil society organisations and development partners were given the opportunity to indicate
the type of questions they wanted to be included in the census questionnaire.
Documents developed for the census included the questionnaire and manuals, and field
operation documents. The field operation documents included Enumerator’s Visitation
Record Book, Supervisor’s Record Book, and other operational control forms. These record
books served as operational and quality control tools to assist enumerators and supervisors to
control and monitor their field duties respectively.
Pre-tests and trial census
It is internationally recognized that an essential element in census planning is the pre-testing
of the questionnaire and related instructions. The objective of the pre-test is to test the
questionnaire, the definition of its concepts and the instructions for filling out the
questionnaire.
The census questionnaire was pre-tested twice in the course of its development. The first pre-
test was carried out in March 2009 to find out the suitability of the questions and the
instructions provided. It also tested the adequacy and completeness of the responses and how
respondents understood the questions. The second pre-test was done in 10 selected
enumeration areas in August, 2009. The objective of the second pre-test was to examine the
sequence of the questions, test the new questions, such as, date of birth and migration, and
assess how the introduction of ‘date of birth’ could help to reduce ‘age heaping’. With regard
to questions on fertility, the pre-tests sought to find out the difference, if any, between proxy
responses and responses by the respondents themselves. Both pre-tests were carried in the
Greater Accra Region. Experience from the pre-tests was used to improve the final census
questionnaire.
A trial census which is a dress rehearsal of all the activities and procedures that are planned
for the main census was carried out in October/November 2009. These included recruitment
and training, distribution of census materials, administration of the questionnaire and other
census forms, enumeration of the various categories of the population (household,
institutional and floating population), and data processing. The trial census was held in six
selected districts across the country namely; Saboba (Northern Region), Chereponi (Northern
Region), Sene (Brong Ahafo Region), Bia (Western Region), Awutu Senya (Central Region),
and Osu Klottey Sub-Metro (Greater Accra Region). A number of factors were considered in
selecting the trial census districts. These included: administrative boundary issues, ecological
9
zone, and accessibility, enumeration of floating population/outdoor-sleepers, fast growing
areas, institutional population, and enumeration areas with scattered settlements.
The trial census provided GSS with an opportunity to assess its plans and procedures as well
as the state of preparedness for the conduct of the 2010 PHC. The common errors found
during editing of the completed questionnaires resulted in modifications to the census
questionnaire, enumerator manuals and other documents. The results of the trial census
assisted GSS to arrive at technically sound decisions on the ideal number of persons per
questionnaire, number of persons in the household roster, migration questions, placement of
the mortality question, serial numbering of houses/housing structures and method of
collection of information on community facilities. Lessons learnt from the trial census also
guided the planning of the recruitment process, the procedures for training of census field
staff and the publicity and education interventions.
1.6.3 Census Enumeration
1.6.3.1 Method of enumeration and field work
All post- independence censuses (1960, 1970, 1984, and 2000) conducted in Ghana used the
de facto method of enumeration where people are enumerated at where they were on census
night and not where they usually reside. The same method was adopted for the 2010 PHC.
The de facto count is preferred because it provides a simple and straight forward way of
counting the population since it is based on a physical fact of presence and can hardly be
misinterpreted. It is thought that the method also minimizes the risks of under-enumeration
and over enumeration. The canvasser method, which involves trained field personnel visiting
houses and households identified in their respective enumeration areas, was adopted for the
2010 PHC.
The main census enumeration involved the canvassing of all categories of the population by
trained enumerators, using questionnaires prepared and tested during the pre-enumeration
phase. Specific arrangements were made for the coverage of special population groups, such
as the homeless and the floating population. The fieldwork began on 21st September 2010
with the identification of EA boundaries, listing of structures, enumeration of institutional
population and floating population.
The week preceding the Census Night was used by field personnel to list houses and other
structures in their enumeration areas. Enumerators were also mobilized to enumerate
residents/inmates of institutions, such as, schools and prisons. They returned to the
institutions during the enumeration period to reconcile the information they obtained from
individuals and also to cross out names of those who were absent from the institutions on
Census Night.
Out-door sleepers (floating population) were also enumerated on the Census Night
Enumeration of the household population started on Monday, 27th
September, 2010.
Enumerators visited houses, compounds and structures in their enumeration areas and started
enumerating all households including visitors who spent the Census Night in the households.
Enumeration was carried out in the order in which houses/structures were listed and where
the members of the household were absent, the enumerator left a call-back-card indicating
when he/she would come back to enumerate the household. The enumeration process took off
smoothly with enumerators poised on completing their assignments on schedule since many
of them were teachers and had to return to school. However, many enumerators ran short of
questionnaires after a few days’ work.
10
Enumeration resumed in all districts when the questionnaire shortage was resolved and by
17th
October, 2010, enumeration was completed in most districts. Enumerators who had
finished their work were mobilized to assist in the enumeration of localities that were yet to
be enumerated in some regional capitals and other fast growing areas. Flooded areas and
other inaccessible localities were also enumerated after the end of the official enumeration
period. Because some enumeration areas in fast growing cities and towns, such as, Accra
Metropolitan Area, Kumasi, Kasoa and Techiman were not properly demarcated and some
were characterized by large EAs, some enumerators were unable to complete their assigned
tasks within the stipulated time.
1.6.4 Post Enumeration Survey
In line with United Nations recommendations, GSS conducted a Post Enumeration Survey
(PES) in April, 2011 to check content and coverage error. The PES was also to serve as an
important tool in providing feedback regarding operational matters such as concepts and
procedures in order to help improve future census operations. The PES field work was
carried out for 21 days in April 2011 and was closely monitored and supervised to ensure
quality output. The main findings of the PES were that:
97.0 percent of all household residents who were in the country on Census Night (26th
September, 2010) were enumerated.
1.3 percent of the population was erroneously included in the census.
Regional differentials are observed. Upper East region recorded the highest coverage
rate of 98.2 percent while the Volta region had the lowest coverage rate of 95.7
percent.
Males (3.3%) were more likely than females (2.8%) to be omitted in the census. The
coverage rate for males was 96.7 percent and the coverage rate for females was 97.2
percent. Also, the coverage rates (94.1%) for those within the 20-29 and 30-39 age
groups are relatively lower compared to the coverage rates of the other age groups.
There was a high rate of agreement between the 2010 PHC data and the PES data for
sex (98.8%), marital status (94.6%), relationship to head of household (90.5%) and
age (83.0%).
1.6.5 Release and dissemination of results
The provisional results of the census were released in February 2011 and the final results in
May 2012. A National Analytical report, six thematic reports, a Census Atlas, 10 Regional
Reports and a report on Demographic, Social, Economic and Housing were prepared and
disseminated in 2013.
1.6.6 Concepts and definitions
Introduction
The 2010 Population and Housing Census of Ghana followed the essential concepts and
definitions of a modern Population and Housing Census as recommended by the United
Nations (UN). It is important that the concepts, definitions and recommendations are adhered
to since they form the basis upon which Ghana could compare her data with that of other
countries.

11
The concepts and definitions in this report cover all sections of the 2010 Population and
Housing Census questionnaires (PHC1A and PHC1B). The sections were: geographical
location of the population, Household and Non-household population, Literacy and
Education, Emigration, Demographic and Economic Characteristics, Disability, Information
Communication Technology (ICT), Fertility, Mortality, Agricultural Activity and Housing
Conditions.
The concepts and definitions are provided to facilitate understanding and use of the data
presented in this report. Users are therefore advised to use the results of the census within the
context of these concepts and definitions.
Region
There were ten (10) administrative regions in Ghana during the 2010 Population and Housing
Census as they were in 1984 and 2000.
District
In 1988, Ghana changed from the local authority system of administration to the district
assembly system. In that year, the then existing 140 local authorities were demarcated into
110 districts. In 2004, 28 new districts were created; this increased the number of districts in
the country to 138. In 2008, 32 additional districts were created bringing the total number of
districts to 170. The 2010 Population and Housing Census was conducted in these 170
administrative districts (these are made-up of 164 districts/municipals and 6 metropolitan
areas). In 2012, 46 new districts were created to bring the total number of districts to 216.
There was urgent need for data for the 46 newly created districts for planning and decision-
making. To meet this demand, the 2010 Census data was re-programmed into 216 districts
after carrying out additional fieldwork and consultations with stakeholders in the districts
affected by the creation of the new districts.
Locality
A locality is a distinct population cluster (also designated as inhabited place, populated
centre, settlement) which has a NAME or LOCALLY RECOGNISED STATUS. It included
fishing hamlets, mining camps, ranches, farms, market towns, villages, towns, cities and
many other types of population clusters, which meet the above criteria. There were two
main types of localities, rural and urban. As in previous censuses, the classification of
localities into ‘urban’ and ‘rural’ was based on population size. Localities with 5,000 or more
persons were classified as urban while localities with less than 5,000 persons were classified
as rural.
Population
The 2010 Census was a “de facto” count and each person present in Ghana, irrespective of
nationality, was enumerated at the place where he/she spent the midnight of 26th September
2010.
Household
A household is a person or a group of persons, who live together in the same house or
compound and share the same house-keeping arrangements. In general, a household consists
of a man, his wife, children and some other relatives or a house help who may be living with
them. Some members of a household may not necessarily be related by blood or marriage
because non-relatives (e.g. house-helps) form part of a household.
12
Head of household
The household head is a male or female member of the household recognised as such by the
other household members. The head of household is generally the person who has economic
and social responsibility for the household. All relationships are defined with reference to the
head.
Household and non-household population
Household population comprises all persons who spent the census night in a household
setting. All persons who did not spend the census night in a household setting (except
otherwise stated) were classified as non-household population. Persons who spent census
night in any of the under listed institutions and locations were classified as non-household
population:
(a) Educational Institutions
(b) Children's and Old People’s Homes
(c) Hospitals and Healing Centres
(d) Hotels
(e) Prisons
(f) Service Barracks
(g) Soldiers on field exercise
(h) Floating Population: The following are examples of persons in this category:
i. All persons who slept in lorry parks, markets, in front of stores and offices, public
bathrooms, petrol filling stations, railway stations, verandas, pavements, and all
such places which are not houses or compounds.
ii. Hunting and fishing camps.
iii. Beggars and vagrants (mentally sick or otherwise).
Age
The age of a person are completed years disregarding fractions of days and months. For those
persons who did not know their birthdays, the enumerator estimated their ages using a list of
district, regional and national historical events.
Nationality
Nationality is the country to which a person belongs. A distinction is made between
Ghanaians and other nationals. Ghanaian nationals are grouped into Ghanaian by birth,
Ghanaian with dual nationality and Ghanaian by naturalization. Other nationals are grouped
into ECOWAS nationals, Africans other than ECOWAS nationals, and non-Africans.
Ethnicity
Ethnicity refers to the ethnic group that a person belonged to. This information is collected
only from Ghanaians by birth and Ghanaians with dual nationality. The classification of
13
ethnic groups in Ghana is that officially provided by the Bureau of Ghana Languages and
which has been in use since the 1960 census.
Birthplace
The birthplace of a person refers to the locality of usual residence of the mother at the time of
birth. If after delivery a mother stayed outside her locality of usual residence for six months
or more or had the intention of staying in the new place for six or more months, then the
actual town/village of physical birth becomes the birthplace of the child.
Duration of residence
Duration of residence refers to the number of years a person has lived in a particular place.
This question is only asked of persons not born in the place where enumeration took place.
Breaks in duration of residence lasting less than 12 months are disregarded. The duration of
residence of persons who made multiple movements of one (1) year or more is assumed to be
the number of years lived in the locality (town or village) since the last movement.
Religion
Religion refers to the individual’s religious affiliation as reported by the respondent,
irrespective of the religion of the household head or the head’s spouse or the name of the
person. No attempt was made to find out if respondents actually practiced the faith they
professed.
Marital status
Marital status refers to the respondent’s marital status as at Census Night. The question on
marital status was asked only of persons 12 years and older. The selection of the age limit of
12 years was based on the average age at menarche and also on the practice in some parts of
the country where girls as young as 12 years old could be given in marriage.
Literacy
Literacy refers to the ability of a person to read and write in any language. A person is
considered literate if he/she could read and write a simple statement with understanding. The
question on literacy was asked only of persons 11 years and older.
Education
School Attendance
Data were collected on school attendance of all persons three (3) years and older. School
attendance refers to whether a person has ever attended, was currently attending or has never
attended school. In the census, school meant an educational institution where a person
received at least four hours of formal education.
Although the lower age limit of formal education is six years for primary one, eligibility for
the school attendance question was lowered to three years because pre-school education has
become an important phenomenon in the country.
Level of Education
Level of education refers to the highest level of formal school that a person ever attended or
was attending. This information was obtained for persons 3 years and older.
14
Activity status
Activity status refers to economic or non-economic activity of respondents during the 7 days
preceding census night. Information on type of activity was collected on persons 5 years and
older. A person was regarded as economically active if he/she:
a. Worked for pay or profit or family gain for at least 1 hour within the 7 days preceding
Census Night. This included persons who were in paid employment or self-
employment or contributing family workers.
b. Did not work, but had jobs to return to.
c. Were unemployed.
The economically not active were persons who did not work and were not seeking for work.
They were classified by reasons for not being economically active. Economically not active
persons included homemakers, students, retired persons, the disabled and persons who were
unable to work due to their age or ill-health.
Occupation
This refers to the type of work the person was engaged in at the establishment where he/she
worked. This was asked only of persons 5 years and older who worked 7 days before the
census night, and those who did not work but had a job to return to as well as those
unemployed who had worked before. All persons who worked during the 7 days before the
census night were classified by the kind of work they were engaged in. The emphasis was on
the work the person did during the reference period and not what he/she was trained to do.
For those who did not work but had a job to return to, their occupation was the job they
would go back to after the period of absence. Also, for persons who had worked before and
were seeking for work and available for work, their occupation was on the last work they did
before becoming unemployed. If a person was engaged in more than one occupation, only the
main one was considered.
Industry
Industry refers to the type of product produced or service rendered at the respondent’s work
place. Information was collected only on the main product produced or service rendered in
the establishment during the reference period.
Employment status
Employment status refers to the status of a person in the establishment where he/she currently
works or previously worked. Eight employment status categories were provided: employee,
self-employed without employees, self-employed with employees, casual worker,
contributing family worker, apprentice, domestic employee (house help). Persons who could
not be classified under any of the above categories were classified as “other”.
Employment sector
This refers to the sector in which a person worked. The employment sectors covered in the
census were public, private formal, private informal, semi-public/parastatal, NGOs and
international organizations.
15
Disability
Persons with disability are those who are unable to or restricted in the performance of
specific tasks/activities due to loss of function of some part of the body as a result of
impairment or malformation. Information was collected on persons with visual/sight
impairment, hearing impairment, mental retardation, emotional or behavioural disorders and
other physical challenges.
Information Communication Technology (ICT)
ICT questions were asked for both individuals and households. Persons having mobile
phones refer to respondents 12 years and older who owned mobile phones (irrespective of the
number of mobile phones owned by each person). Persons using internet facility refers to
those who had access to internet facility at home, internet cafe, on mobile phone or other
mobile device. Internet access is assumed to be not only via computer, but also by mobile
phones, PDA, game machine and digital television.
Households having Personal Computers/Laptops refer to households who own
desktops/laptop computers. The fixed telephone line refers to a telephone line connecting a
customer’s terminal equipment (e.g. telephone set, facsimile machine) to the public switch
telephone network.
Fertility
Two types of fertility data were collected: lifetime fertility and current fertility. Lifetime
fertility refers to the total number of live births that females 12 years and older have ever had
during their life time. Current fertility refers to the number of live births that females 12-54
years old had in the 12 months preceding the Census Night.
Mortality
Mortality refers to all deaths that occurred in a household during the 12 months preceding the
Census Night. The report presents information on deaths due to accidents, violence, homicide
and suicide. In addition, data were collected on pregnancy-related deaths of females 12-54
years.
Agricultural household
Agricultural household is where at least one member is engaged in a farming activity that
includes crop farming, tree planting, livestock rearing and fish farming.
Housing conditions and facilities
The UN recommended definition of a house as “a structurally separate and independent place
of abode such that a person or group of persons can isolate themselves from the hazards of
climate such as storms and the sun’’ was adopted. The definition covers any type of shelter
used as living quarters, such as separate houses, semi-detached houses, flats/apartments,
compound houses, huts, tents, kiosks and containers.
Living quarters or dwelling units refer to a specific area or space occupied by a particular
household and therefore need not necessarily be the same as the house of which the dwelling
unit may be a part.
Information collected on housing conditions included the type of dwelling unit, main
construction materials for walls, floor and roof, holding/tenure arrangement, ownership type,
16
type of lighting, source of water supply and toilet facilities. Data was also collected on
method of disposal of solid and liquid waste.
1.7 Organization of the Report
The report consists of nine chapters. Chapter one provides basic information about the
district. It gives a brief background, its physical features, political and administrative
structures, social and cultural structures, economy and the methodology and concepts and
definitions used in the report. Chapter two discusses the population size, composition and age
structure. It further discusses the migratory pattern in the district as well as fertility and
mortality.
In chapter three, the focus is on household size, composition and headship as well as the
marital characteristics and nationality of the inhabitants of the district. The chapter also
discusses religious affiliations and educational status of the population in the district. Chapter
four focuses on economic characteristics, such as, economic activity status, occupation,
industries and employment status and sectors of the employed population.
Information Communication Technology (ICT) is discussed in chapter five. It analyses
mobile phone ownership, internet use and ownership of desktop/laptop computers and fixed
telephone lines. Chapter six is devoted to persons living with disabilities (PWDs) and their
socio-demographic characteristics. Chapter seven concentrates on the agricultural activities
of the households, the types of farming activities, livestock rearing and numbers of livestock
reared.
In chapter eight are discussed, housing conditions such as housing stock, type of dwelling and
construction materials, room occupancy, holding and tenancy, lighting and cooking facilities,
bathing and toilet facilities, waste disposal and source of water for drinking or for other
domestic use in the district. The final Chapter nine presents the summary of findings,
conclusions and policy implications for the district.
17
CHAPTER TWO
DEMOGRAPHIC CHARACTERISTICS
2.1 Introduction
Changes in any population are brought about through the dynamics of fertility, mortality and
migration. In particular, structural changes that occur in the context of population growth
have a direct as well as indirect impact on development. Areas of impact include economic
growth, poverty reduction, resource allocation, productivity, and the general welfare and
well-being of the population.
This chapter provides information on population size and distribution, age and sex structure,
fertility, mortality and migration in the district. The system and administration of planning in
Ghana require that statistics be provided on size and distribution of the population at the local
level.
2.2 Population Size and Distribution
A fundamental demographic parameter is the number of individuals in a
population (Elberton et al., 1992). Table 2.1 shows population of Ningo-Prampram district by
age, sex, sex ratio and type of locality in 2010. The total population of the district is 70,923
out of which 47.3 are males and 52.7 females. Also, 41.7 percent of the population live in
urban localities and the remaining 58.3 percent are in rural localities. This therefore calls for
more attention in the rural areas since a greater portion of the district population are there.
The highest proportions (14.3%) of the population are in 0-4 year age group, followed by 5-9
years age group (12.5%) and 10-14 years age group (10.9%). The lowest proportion is the
oldest age group, 95 years and older (0.1%). The distribution of the population by sex also
shows the highest proportions among males (15.4%) and among females (13.4%) are in the 0-
4 year’s age group. The proportions of the population 0-4 years in urban locality and in rural
locality are almost similar, 14.4 percent and 14.3 percent, respectively. The district
population has a very youthful structure with most of it in the young age groups less than 15
years. Furthermore, the population decreases in each subsequent age group as age increases.
The decreasing nature of the population may be attributed to high mortality rate as age
increases and also, to some extent, to migration.
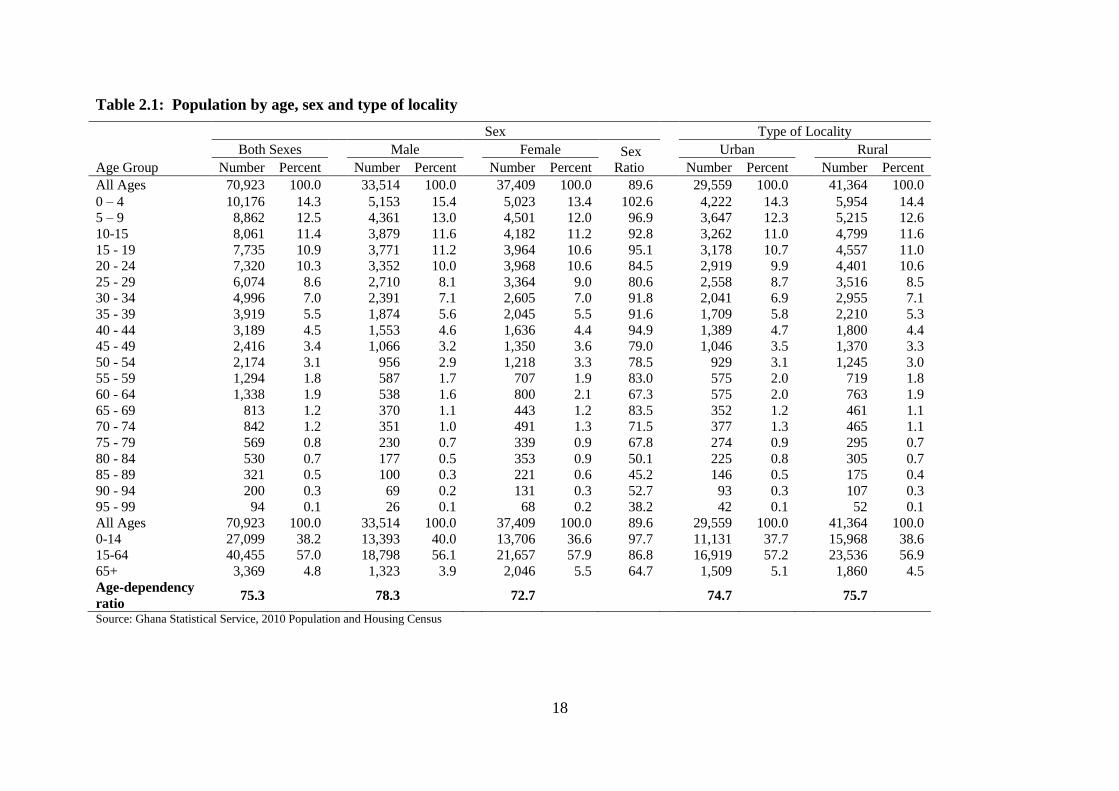
18
Table 2.1: Population by age, sex and type of locality
Age Group
Sex Type of Locality
Both Sexes
Male
Female Sex
Ratio
Urban
Rural
Number Percent Number Percent Number Percent Number Percent Number Percent
All Ages 70,923 100.0
33,514 100.0
37,409 100.0 89.6
29,559 100.0
41,364 100.0
0 – 4 10,176 14.3
5,153 15.4
5,023 13.4 102.6
4,222 14.3
5,954 14.4
5 – 9 8,862 12.5
4,361 13.0
4,501 12.0 96.9
3,647 12.3
5,215 12.6
10-15 8,061 11.4
3,879 11.6
4,182 11.2 92.8
3,262 11.0
4,799 11.6
15 - 19 7,735 10.9
3,771 11.2
3,964 10.6 95.1
3,178 10.7
4,557 11.0
20 - 24 7,320 10.3
3,352 10.0
3,968 10.6 84.5
2,919 9.9
4,401 10.6
25 - 29 6,074 8.6
2,710 8.1
3,364 9.0 80.6
2,558 8.7
3,516 8.5
30 - 34 4,996 7.0
2,391 7.1
2,605 7.0 91.8
2,041 6.9
2,955 7.1
35 - 39 3,919 5.5
1,874 5.6
2,045 5.5 91.6
1,709 5.8
2,210 5.3
40 - 44 3,189 4.5
1,553 4.6
1,636 4.4 94.9
1,389 4.7
1,800 4.4
45 - 49 2,416 3.4
1,066 3.2
1,350 3.6 79.0
1,046 3.5
1,370 3.3
50 - 54 2,174 3.1
956 2.9
1,218 3.3 78.5
929 3.1
1,245 3.0
55 - 59 1,294 1.8
587 1.7
707 1.9 83.0
575 2.0
719 1.8
60 - 64 1,338 1.9
538 1.6
800 2.1 67.3
575 2.0
763 1.9
65 - 69 813 1.2
370 1.1
443 1.2 83.5
352 1.2
461 1.1
70 - 74 842 1.2
351 1.0
491 1.3 71.5
377 1.3
465 1.1
75 - 79 569 0.8
230 0.7
339 0.9 67.8
274 0.9
295 0.7
80 - 84 530 0.7
177 0.5
353 0.9 50.1
225 0.8
305 0.7
85 - 89 321 0.5
100 0.3
221 0.6 45.2
146 0.5
175 0.4
90 - 94 200 0.3
69 0.2
131 0.3 52.7
93 0.3
107 0.3
95 - 99 94 0.1
26 0.1
68 0.2 38.2
42 0.1
52 0.1
All Ages 70,923 100.0
33,514 100.0
37,409 100.0 89.6
29,559 100.0
41,364 100.0
0-14 27,099 38.2
13,393 40.0
13,706 36.6 97.7
11,131 37.7
15,968 38.6
15-64 40,455 57.0
18,798 56.1
21,657 57.9 86.8
16,919 57.2
23,536 56.9
65+ 3,369 4.8
1,323 3.9
2,046 5.5 64.7
1,509 5.1
1,860 4.5
Age-dependency
ratio 75.3 78.3 72.7 74.7 75.7
Source: Ghana Statistical Service, 2010 Population and Housing Census
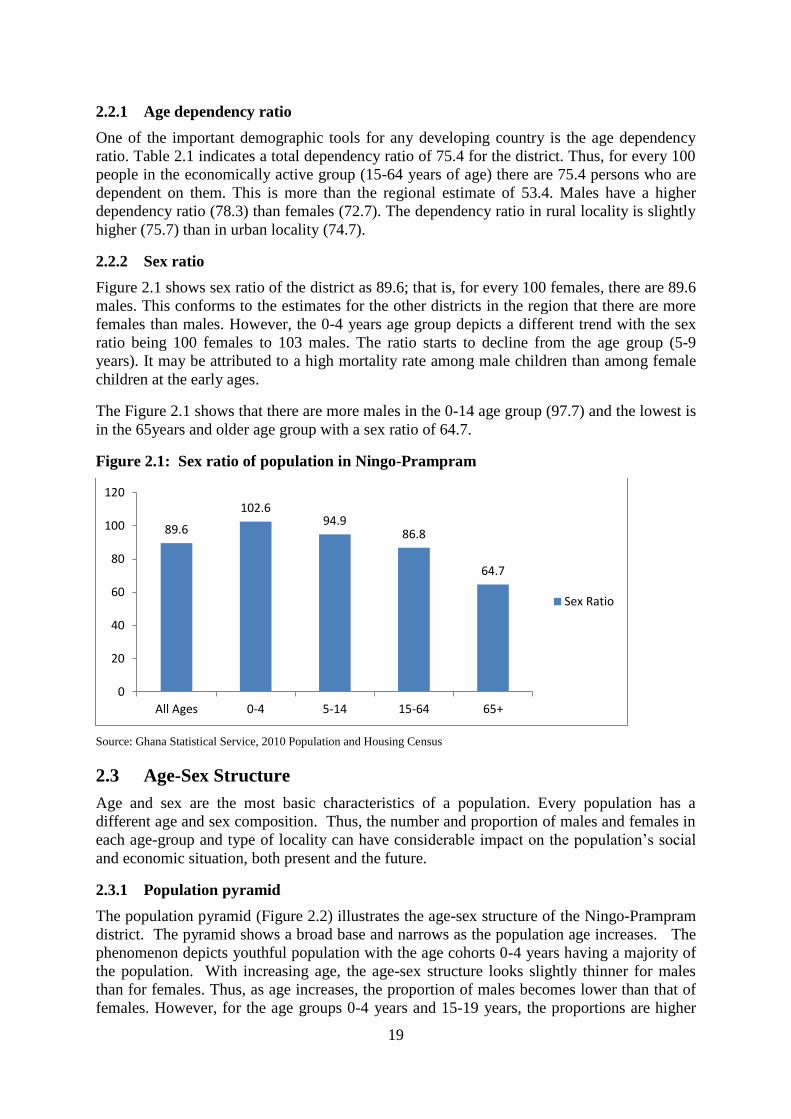
19
2.2.1 Age dependency ratio
One of the important demographic tools for any developing country is the age dependency
ratio. Table 2.1 indicates a total dependency ratio of 75.4 for the district. Thus, for every 100
people in the economically active group (15-64 years of age) there are 75.4 persons who are
dependent on them. This is more than the regional estimate of 53.4. Males have a higher
dependency ratio (78.3) than females (72.7). The dependency ratio in rural locality is slightly
higher (75.7) than in urban locality (74.7).
2.2.2 Sex ratio
Figure 2.1 shows sex ratio of the district as 89.6; that is, for every 100 females, there are 89.6
males. This conforms to the estimates for the other districts in the region that there are more
females than males. However, the 0-4 years age group depicts a different trend with the sex
ratio being 100 females to 103 males. The ratio starts to decline from the age group (5-9
years). It may be attributed to a high mortality rate among male children than among female
children at the early ages.
The Figure 2.1 shows that there are more males in the 0-14 age group (97.7) and the lowest is
in the 65years and older age group with a sex ratio of 64.7.
Figure 2.1: Sex ratio of population in Ningo-Prampram
Source: Ghana Statistical Service, 2010 Population and Housing Census
2.3 Age-Sex Structure
Age and sex are the most basic characteristics of a population. Every population has a
different age and sex composition. Thus, the number and proportion of males and females in
each age-group and type of locality can have considerable impact on the population’s social
and economic situation, both present and the future.
2.3.1 Population pyramid
The population pyramid (Figure 2.2) illustrates the age-sex structure of the Ningo-Prampram
district. The pyramid shows a broad base and narrows as the population age increases. The
phenomenon depicts youthful population with the age cohorts 0-4 years having a majority of
the population. With increasing age, the age-sex structure looks slightly thinner for males
than for females. Thus, as age increases, the proportion of males becomes lower than that of
females. However, for the age groups 0-4 years and 15-19 years, the proportions are higher
89.6
102.6 94.9
86.8
64.7
0
20
40
60
80
100
120
All Ages 0-4 5-14 15-64 65+
Sex Ratio
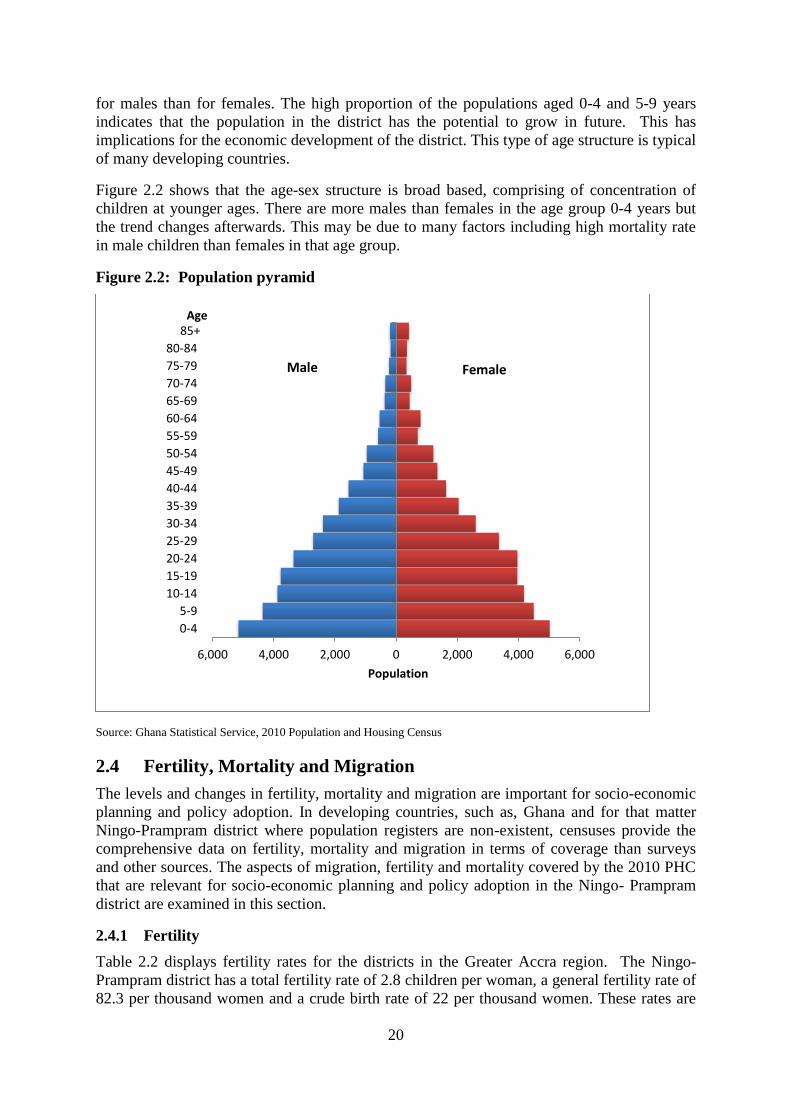
20
for males than for females. The high proportion of the populations aged 0-4 and 5-9 years
indicates that the population in the district has the potential to grow in future. This has
implications for the economic development of the district. This type of age structure is typical
of many developing countries.
Figure 2.2 shows that the age-sex structure is broad based, comprising of concentration of
children at younger ages. There are more males than females in the age group 0-4 years but
the trend changes afterwards. This may be due to many factors including high mortality rate
in male children than females in that age group.
Figure 2.2: Population pyramid
Source: Ghana Statistical Service, 2010 Population and Housing Census
2.4 Fertility, Mortality and Migration
The levels and changes in fertility, mortality and migration are important for socio-economic
planning and policy adoption. In developing countries, such as, Ghana and for that matter
Ningo-Prampram district where population registers are non-existent, censuses provide the
comprehensive data on fertility, mortality and migration in terms of coverage than surveys
and other sources. The aspects of migration, fertility and mortality covered by the 2010 PHC
that are relevant for socio-economic planning and policy adoption in the Ningo- Prampram
district are examined in this section.
2.4.1 Fertility
Table 2.2 displays fertility rates for the districts in the Greater Accra region. The Ningo-
Prampram district has a total fertility rate of 2.8 children per woman, a general fertility rate of
82.3 per thousand women and a crude birth rate of 22 per thousand women. These rates are
6,000 4,000 2,000 0 2,000 4,000 6,000
0-4
5-9
10-14
15-19
20-24
25-29
30-34
35-39
40-44
45-49
50-54
55-59
60-64
65-69
70-74
75-79
80-84
85+
Population
Age
Female Male
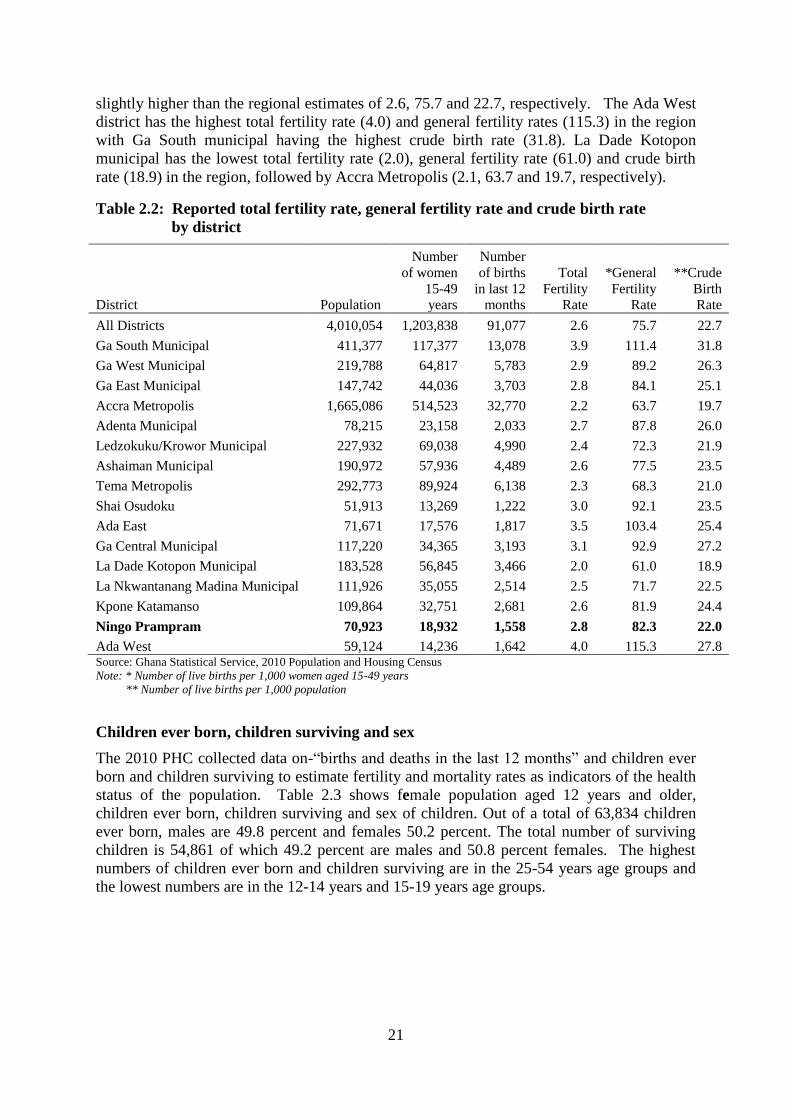
21
slightly higher than the regional estimates of 2.6, 75.7 and 22.7, respectively. The Ada West
district has the highest total fertility rate (4.0) and general fertility rates (115.3) in the region
with Ga South municipal having the highest crude birth rate (31.8). La Dade Kotopon
municipal has the lowest total fertility rate (2.0), general fertility rate (61.0) and crude birth
rate (18.9) in the region, followed by Accra Metropolis (2.1, 63.7 and 19.7, respectively).
Table 2.2: Reported total fertility rate, general fertility rate and crude birth rate
by district
District Population
Number
of women
15-49
years
Number
of births
in last 12
months
Total
Fertility
Rate
*General
Fertility
Rate
**Crude
Birth
Rate
All Districts 4,010,054 1,203,838 91,077 2.6 75.7 22.7
Ga South Municipal 411,377 117,377 13,078 3.9 111.4 31.8
Ga West Municipal 219,788 64,817 5,783 2.9 89.2 26.3
Ga East Municipal 147,742 44,036 3,703 2.8 84.1 25.1
Accra Metropolis 1,665,086 514,523 32,770 2.2 63.7 19.7
Adenta Municipal 78,215 23,158 2,033 2.7 87.8 26.0
Ledzokuku/Krowor Municipal 227,932 69,038 4,990 2.4 72.3 21.9
Ashaiman Municipal 190,972 57,936 4,489 2.6 77.5 23.5
Tema Metropolis 292,773 89,924 6,138 2.3 68.3 21.0
Shai Osudoku 51,913 13,269 1,222 3.0 92.1 23.5
Ada East 71,671 17,576 1,817 3.5 103.4 25.4
Ga Central Municipal 117,220 34,365 3,193 3.1 92.9 27.2
La Dade Kotopon Municipal 183,528 56,845 3,466 2.0 61.0 18.9
La Nkwantanang Madina Municipal 111,926 35,055 2,514 2.5 71.7 22.5
Kpone Katamanso 109,864 32,751 2,681 2.6 81.9 24.4
Ningo Prampram 70,923 18,932 1,558 2.8 82.3 22.0
Ada West 59,124 14,236 1,642 4.0 115.3 27.8 Source: Ghana Statistical Service, 2010 Population and Housing Census
Note: * Number of live births per 1,000 women aged 15-49 years
** Number of live births per 1,000 population
Children ever born, children surviving and sex
The 2010 PHC collected data on-“births and deaths in the last 12 months” and children ever
born and children surviving to estimate fertility and mortality rates as indicators of the health
status of the population. Table 2.3 shows female population aged 12 years and older,
children ever born, children surviving and sex of children. Out of a total of 63,834 children
ever born, males are 49.8 percent and females 50.2 percent. The total number of surviving
children is 54,861 of which 49.2 percent are males and 50.8 percent females. The highest
numbers of children ever born and children surviving are in the 25-54 years age groups and
the lowest numbers are in the 12-14 years and 15-19 years age groups.
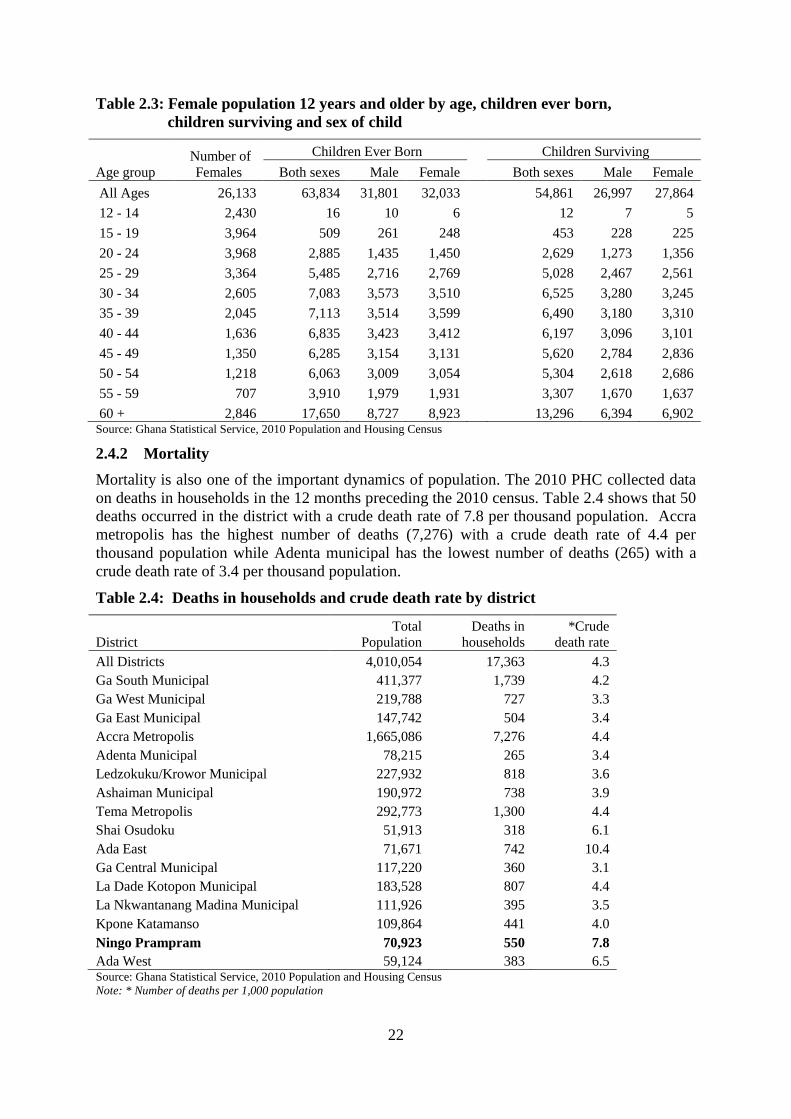
22
Table 2.3: Female population 12 years and older by age, children ever born,
children surviving and sex of child
Age group
Number of
Females
Children Ever Born Children Surviving
Both sexes Male Female Both sexes Male Female
All Ages 26,133 63,834 31,801 32,033
54,861 26,997 27,864
12 - 14 2,430 16 10 6
12 7 5
15 - 19 3,964 509 261 248
453 228 225
20 - 24 3,968 2,885 1,435 1,450
2,629 1,273 1,356
25 - 29 3,364 5,485 2,716 2,769
5,028 2,467 2,561
30 - 34 2,605 7,083 3,573 3,510
6,525 3,280 3,245
35 - 39 2,045 7,113 3,514 3,599
6,490 3,180 3,310
40 - 44 1,636 6,835 3,423 3,412
6,197 3,096 3,101
45 - 49 1,350 6,285 3,154 3,131
5,620 2,784 2,836
50 - 54 1,218 6,063 3,009 3,054
5,304 2,618 2,686
55 - 59 707 3,910 1,979 1,931
3,307 1,670 1,637
60 + 2,846 17,650 8,727 8,923 13,296 6,394 6,902 Source: Ghana Statistical Service, 2010 Population and Housing Census
2.4.2 Mortality
Mortality is also one of the important dynamics of population. The 2010 PHC collected data
on deaths in households in the 12 months preceding the 2010 census. Table 2.4 shows that 50
deaths occurred in the district with a crude death rate of 7.8 per thousand population. Accra
metropolis has the highest number of deaths (7,276) with a crude death rate of 4.4 per
thousand population while Adenta municipal has the lowest number of deaths (265) with a
crude death rate of 3.4 per thousand population.
Table 2.4: Deaths in households and crude death rate by district
District
Total
Population
Deaths in
households
*Crude
death rate
All Districts 4,010,054 17,363 4.3
Ga South Municipal 411,377 1,739 4.2
Ga West Municipal 219,788 727 3.3
Ga East Municipal 147,742 504 3.4
Accra Metropolis 1,665,086 7,276 4.4
Adenta Municipal 78,215 265 3.4
Ledzokuku/Krowor Municipal 227,932 818 3.6
Ashaiman Municipal 190,972 738 3.9
Tema Metropolis 292,773 1,300 4.4
Shai Osudoku 51,913 318 6.1
Ada East 71,671 742 10.4
Ga Central Municipal 117,220 360 3.1
La Dade Kotopon Municipal 183,528 807 4.4
La Nkwantanang Madina Municipal 111,926 395 3.5
Kpone Katamanso 109,864 441 4.0
Ningo Prampram 70,923 550 7.8
Ada West 59,124 383 6.5 Source: Ghana Statistical Service, 2010 Population and Housing Census
Note: * Number of deaths per 1,000 population
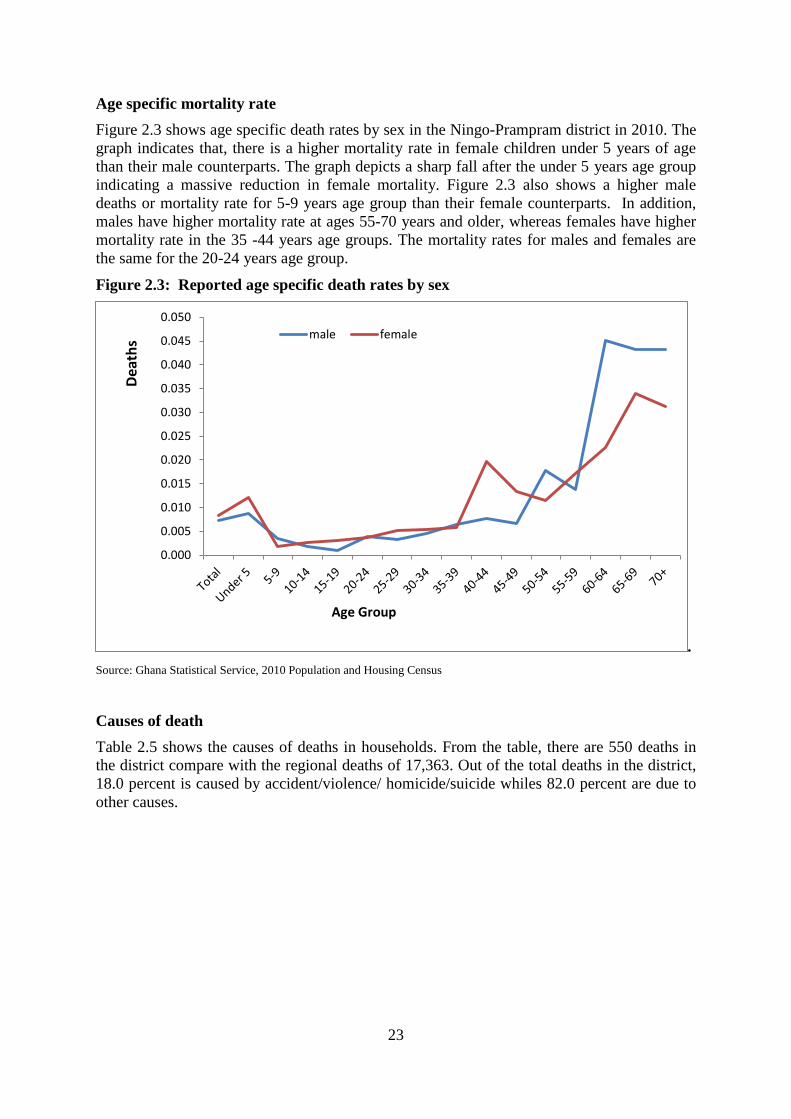
23
Age specific mortality rate
Figure 2.3 shows age specific death rates by sex in the Ningo-Prampram district in 2010. The
graph indicates that, there is a higher mortality rate in female children under 5 years of age
than their male counterparts. The graph depicts a sharp fall after the under 5 years age group
indicating a massive reduction in female mortality. Figure 2.3 also shows a higher male
deaths or mortality rate for 5-9 years age group than their female counterparts. In addition,
males have higher mortality rate at ages 55-70 years and older, whereas females have higher
mortality rate in the 35 -44 years age groups. The mortality rates for males and females are
the same for the 20-24 years age group.
Figure 2.3: Reported age specific death rates by sex
.
Source: Ghana Statistical Service, 2010 Population and Housing Census
Causes of death
Table 2.5 shows the causes of deaths in households. From the table, there are 550 deaths in
the district compare with the regional deaths of 17,363. Out of the total deaths in the district,
18.0 percent is caused by accident/violence/ homicide/suicide whiles 82.0 percent are due to
other causes.
0.000
0.005
0.010
0.015
0.020
0.025
0.030
0.035
0.040
0.045
0.050
male female
Dea
ths
Age Group
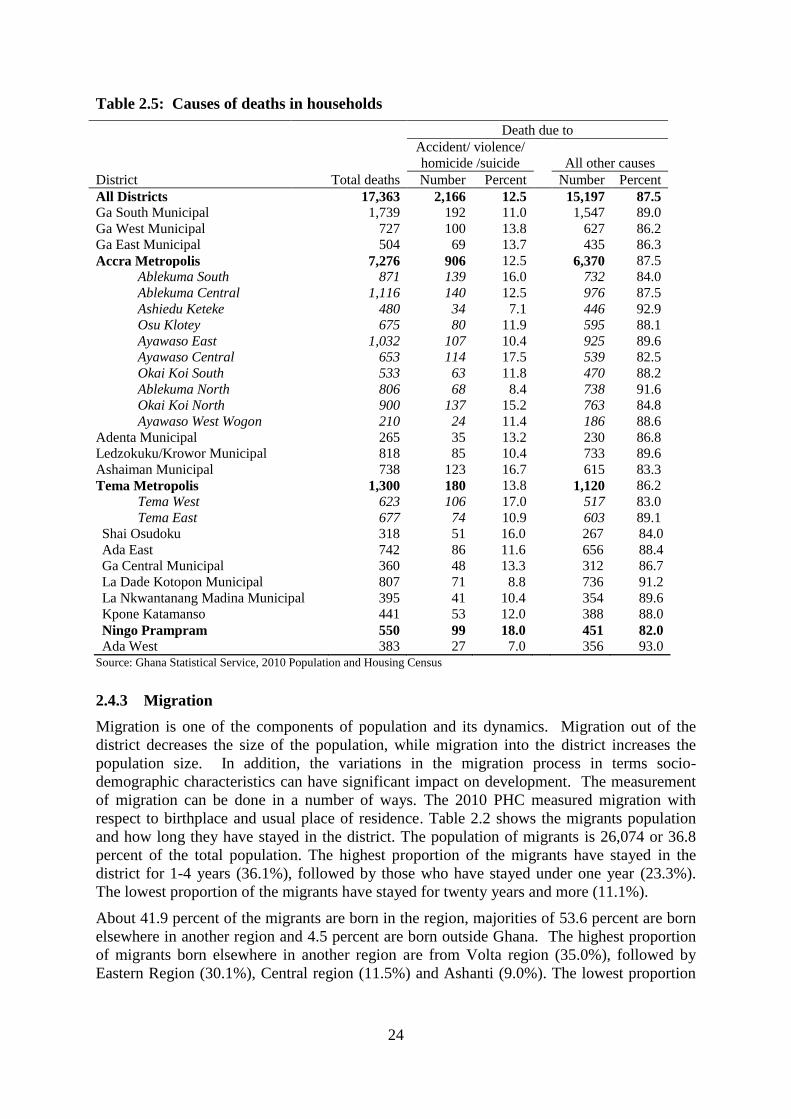
24
Table 2.5: Causes of deaths in households
Total deaths
Death due to
Accident/ violence/
homicide /suicide
All other causes
District Number Percent Number Percent
All Districts 17,363 2,166 12.5
15,197 87.5
Ga South Municipal 1,739 192 11.0
1,547 89.0
Ga West Municipal 727 100 13.8
627 86.2
Ga East Municipal 504 69 13.7
435 86.3
Accra Metropolis 7,276 906 12.5
6,370 87.5
Ablekuma South 871 139 16.0
732 84.0
Ablekuma Central 1,116 140 12.5
976 87.5
Ashiedu Keteke 480 34 7.1
446 92.9
Osu Klotey 675 80 11.9
595 88.1
Ayawaso East 1,032 107 10.4
925 89.6
Ayawaso Central 653 114 17.5
539 82.5
Okai Koi South 533 63 11.8
470 88.2
Ablekuma North 806 68 8.4
738 91.6
Okai Koi North 900 137 15.2
763 84.8
Ayawaso West Wogon 210 24 11.4
186 88.6
Adenta Municipal 265 35 13.2
230 86.8
Ledzokuku/Krowor Municipal 818 85 10.4
733 89.6
Ashaiman Municipal 738 123 16.7
615 83.3
Tema Metropolis 1,300 180 13.8
1,120 86.2
Tema West 623 106 17.0
517 83.0
Tema East 677 74 10.9
603 89.1
Shai Osudoku 318 51 16.0
267 84.0
Ada East 742 86 11.6
656 88.4
Ga Central Municipal 360 48 13.3
312 86.7
La Dade Kotopon Municipal 807 71 8.8
736 91.2
La Nkwantanang Madina Municipal 395 41 10.4
354 89.6
Kpone Katamanso 441 53 12.0
388 88.0
Ningo Prampram 550 99 18.0
451 82.0
Ada West 383 27 7.0 356 93.0 Source: Ghana Statistical Service, 2010 Population and Housing Census
2.4.3 Migration
Migration is one of the components of population and its dynamics. Migration out of the
district decreases the size of the population, while migration into the district increases the
population size. In addition, the variations in the migration process in terms socio-
demographic characteristics can have significant impact on development. The measurement
of migration can be done in a number of ways. The 2010 PHC measured migration with
respect to birthplace and usual place of residence. Table 2.2 shows the migrants population
and how long they have stayed in the district. The population of migrants is 26,074 or 36.8
percent of the total population. The highest proportion of the migrants have stayed in the
district for 1-4 years (36.1%), followed by those who have stayed under one year (23.3%).
The lowest proportion of the migrants have stayed for twenty years and more (11.1%).
About 41.9 percent of the migrants are born in the region, majorities of 53.6 percent are born
elsewhere in another region and 4.5 percent are born outside Ghana. The highest proportion
of migrants born elsewhere in another region are from Volta region (35.0%), followed by
Eastern Region (30.1%), Central region (11.5%) and Ashanti (9.0%). The lowest proportion
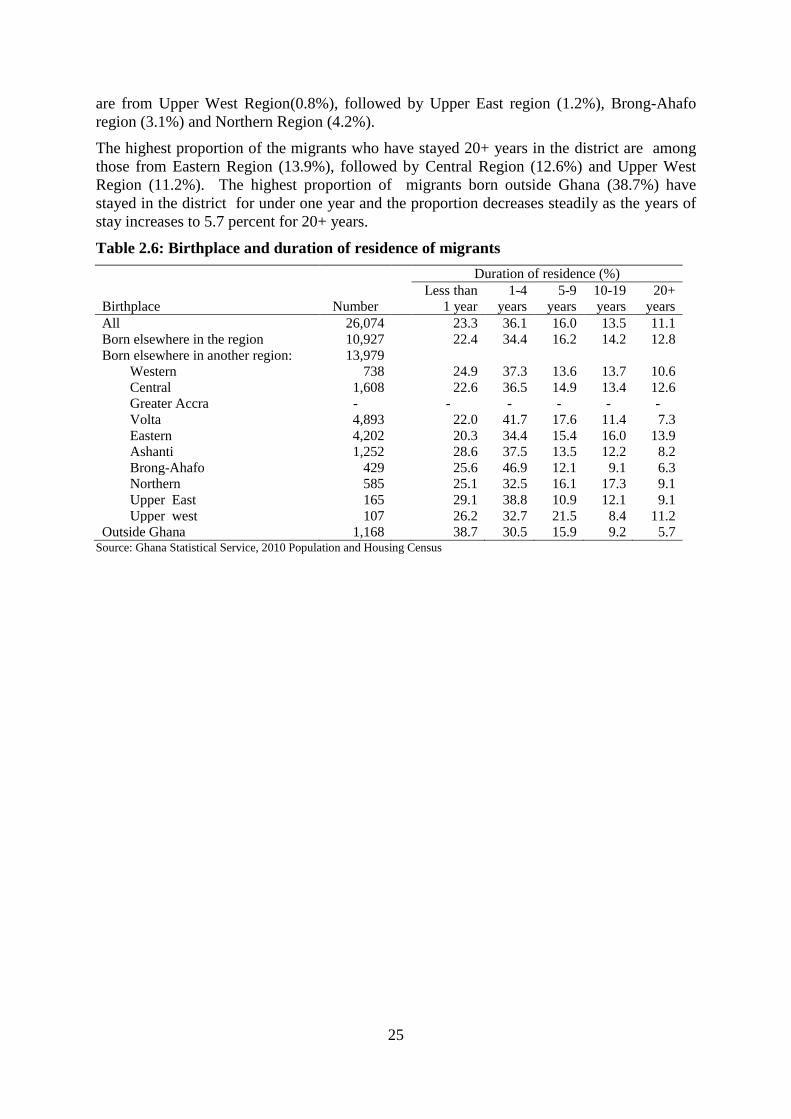
25
are from Upper West Region(0.8%), followed by Upper East region (1.2%), Brong-Ahafo
region (3.1%) and Northern Region (4.2%).
The highest proportion of the migrants who have stayed 20+ years in the district are among
those from Eastern Region (13.9%), followed by Central Region (12.6%) and Upper West
Region (11.2%). The highest proportion of migrants born outside Ghana (38.7%) have
stayed in the district for under one year and the proportion decreases steadily as the years of
stay increases to 5.7 percent for 20+ years.
Table 2.6: Birthplace and duration of residence of migrants
Birthplace Number
Duration of residence (%)
Less than
1 year
1-4
years
5-9
years
10-19
years
20+
years
All 26,074
23.3 36.1 16.0 13.5 11.1
Born elsewhere in the region 10,927
22.4 34.4 16.2 14.2 12.8
Born elsewhere in another region: 13,979
Western 738
24.9 37.3 13.6 13.7 10.6
Central 1,608
22.6 36.5 14.9 13.4 12.6
Greater Accra -
- - - - -
Volta 4,893
22.0 41.7 17.6 11.4 7.3
Eastern 4,202
20.3 34.4 15.4 16.0 13.9
Ashanti 1,252
28.6 37.5 13.5 12.2 8.2
Brong-Ahafo 429
25.6 46.9 12.1 9.1 6.3
Northern 585
25.1 32.5 16.1 17.3 9.1
Upper East 165
29.1 38.8 10.9 12.1 9.1
Upper west 107
26.2 32.7 21.5 8.4 11.2
Outside Ghana 1,168 38.7 30.5 15.9 9.2 5.7 Source: Ghana Statistical Service, 2010 Population and Housing Census
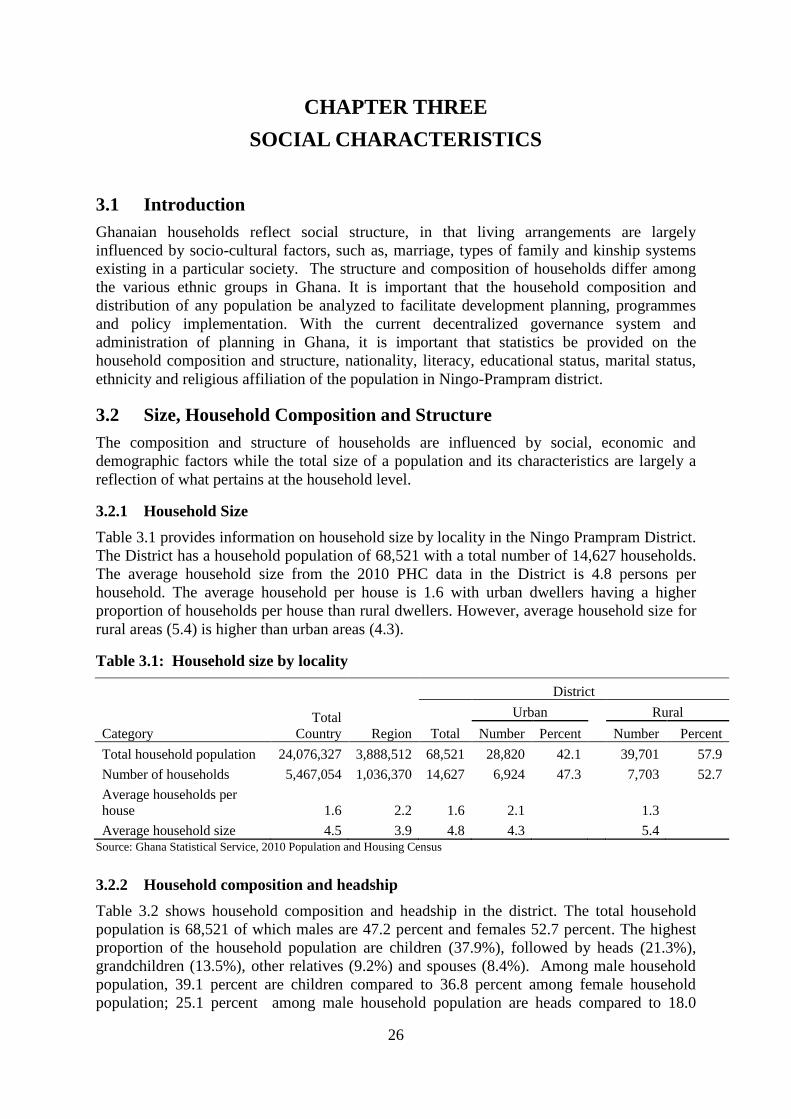
26
CHAPTER THREE
SOCIAL CHARACTERISTICS
3.1 Introduction
Ghanaian households reflect social structure, in that living arrangements are largely
influenced by socio-cultural factors, such as, marriage, types of family and kinship systems
existing in a particular society. The structure and composition of households differ among
the various ethnic groups in Ghana. It is important that the household composition and
distribution of any population be analyzed to facilitate development planning, programmes
and policy implementation. With the current decentralized governance system and
administration of planning in Ghana, it is important that statistics be provided on the
household composition and structure, nationality, literacy, educational status, marital status,
ethnicity and religious affiliation of the population in Ningo-Prampram district.
3.2 Size, Household Composition and Structure
The composition and structure of households are influenced by social, economic and
demographic factors while the total size of a population and its characteristics are largely a
reflection of what pertains at the household level.
3.2.1 Household Size
Table 3.1 provides information on household size by locality in the Ningo Prampram District.
The District has a household population of 68,521 with a total number of 14,627 households.
The average household size from the 2010 PHC data in the District is 4.8 persons per
household. The average household per house is 1.6 with urban dwellers having a higher
proportion of households per house than rural dwellers. However, average household size for
rural areas (5.4) is higher than urban areas (4.3).
Table 3.1: Household size by locality
District
Category
Total
Country Region Total
Urban
Rural
Number Percent Number Percent
Total household population 24,076,327 3,888,512 68,521 28,820 42.1
39,701 57.9
Number of households 5,467,054 1,036,370 14,627 6,924 47.3
7,703 52.7
Average households per
house 1.6 2.2 1.6 2.1
1.3
Average household size 4.5 3.9 4.8 4.3 5.4 Source: Ghana Statistical Service, 2010 Population and Housing Census
3.2.2 Household composition and headship
Table 3.2 shows household composition and headship in the district. The total household
population is 68,521 of which males are 47.2 percent and females 52.7 percent. The highest
proportion of the household population are children (37.9%), followed by heads (21.3%),
grandchildren (13.5%), other relatives (9.2%) and spouses (8.4%). Among male household
population, 39.1 percent are children compared to 36.8 percent among female household
population; 25.1 percent among male household population are heads compared to 18.0
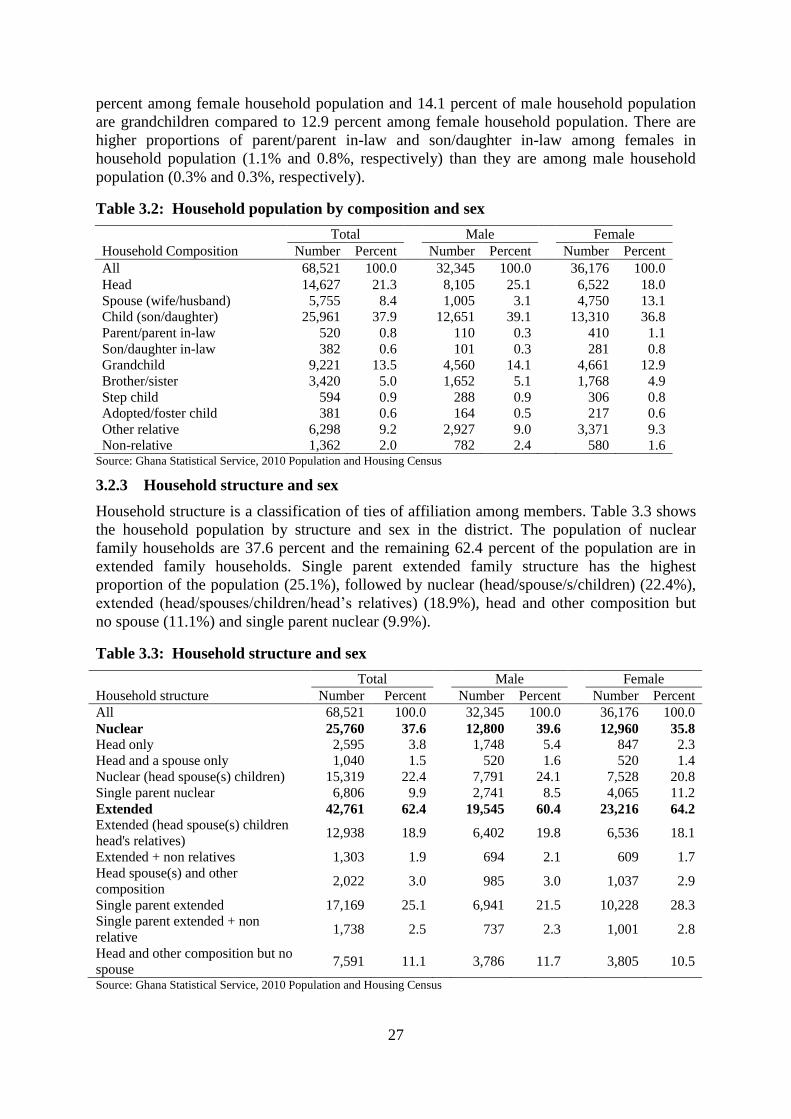
27
percent among female household population and 14.1 percent of male household population
are grandchildren compared to 12.9 percent among female household population. There are
higher proportions of parent/parent in-law and son/daughter in-law among females in
household population (1.1% and 0.8%, respectively) than they are among male household
population (0.3% and 0.3%, respectively).
Table 3.2: Household population by composition and sex
Household Composition
Total Male Female
Number Percent Number Percent Number Percent
All 68,521 100.0
32,345 100.0
36,176 100.0
Head 14,627 21.3
8,105 25.1
6,522 18.0
Spouse (wife/husband) 5,755 8.4
1,005 3.1
4,750 13.1
Child (son/daughter) 25,961 37.9
12,651 39.1
13,310 36.8
Parent/parent in-law 520 0.8
110 0.3
410 1.1
Son/daughter in-law 382 0.6
101 0.3
281 0.8
Grandchild 9,221 13.5
4,560 14.1
4,661 12.9
Brother/sister 3,420 5.0
1,652 5.1
1,768 4.9
Step child 594 0.9
288 0.9
306 0.8
Adopted/foster child 381 0.6
164 0.5
217 0.6
Other relative 6,298 9.2
2,927 9.0
3,371 9.3
Non-relative 1,362 2.0 782 2.4 580 1.6 Source: Ghana Statistical Service, 2010 Population and Housing Census
3.2.3 Household structure and sex
Household structure is a classification of ties of affiliation among members. Table 3.3 shows
the household population by structure and sex in the district. The population of nuclear
family households are 37.6 percent and the remaining 62.4 percent of the population are in
extended family households. Single parent extended family structure has the highest
proportion of the population (25.1%), followed by nuclear (head/spouse/s/children) (22.4%),
extended (head/spouses/children/head’s relatives) (18.9%), head and other composition but
no spouse (11.1%) and single parent nuclear (9.9%).
Table 3.3: Household structure and sex
Household structure
Total Male Female
Number Percent Number Percent Number Percent
All 68,521 100.0
32,345 100.0
36,176 100.0
Nuclear 25,760 37.6
12,800 39.6
12,960 35.8
Head only 2,595 3.8
1,748 5.4
847 2.3
Head and a spouse only 1,040 1.5
520 1.6
520 1.4
Nuclear (head spouse(s) children) 15,319 22.4
7,791 24.1
7,528 20.8
Single parent nuclear 6,806 9.9
2,741 8.5
4,065 11.2
Extended 42,761 62.4
19,545 60.4
23,216 64.2
Extended (head spouse(s) children
head's relatives) 12,938 18.9
6,402 19.8
6,536 18.1
Extended + non relatives 1,303 1.9
694 2.1
609 1.7
Head spouse(s) and other
composition 2,022 3.0
985 3.0
1,037 2.9
Single parent extended 17,169 25.1
6,941 21.5
10,228 28.3
Single parent extended + non
relative 1,738 2.5
737 2.3
1,001 2.8
Head and other composition but no
spouse 7,591 11.1 3,786 11.7 3,805 10.5
Source: Ghana Statistical Service, 2010 Population and Housing Census
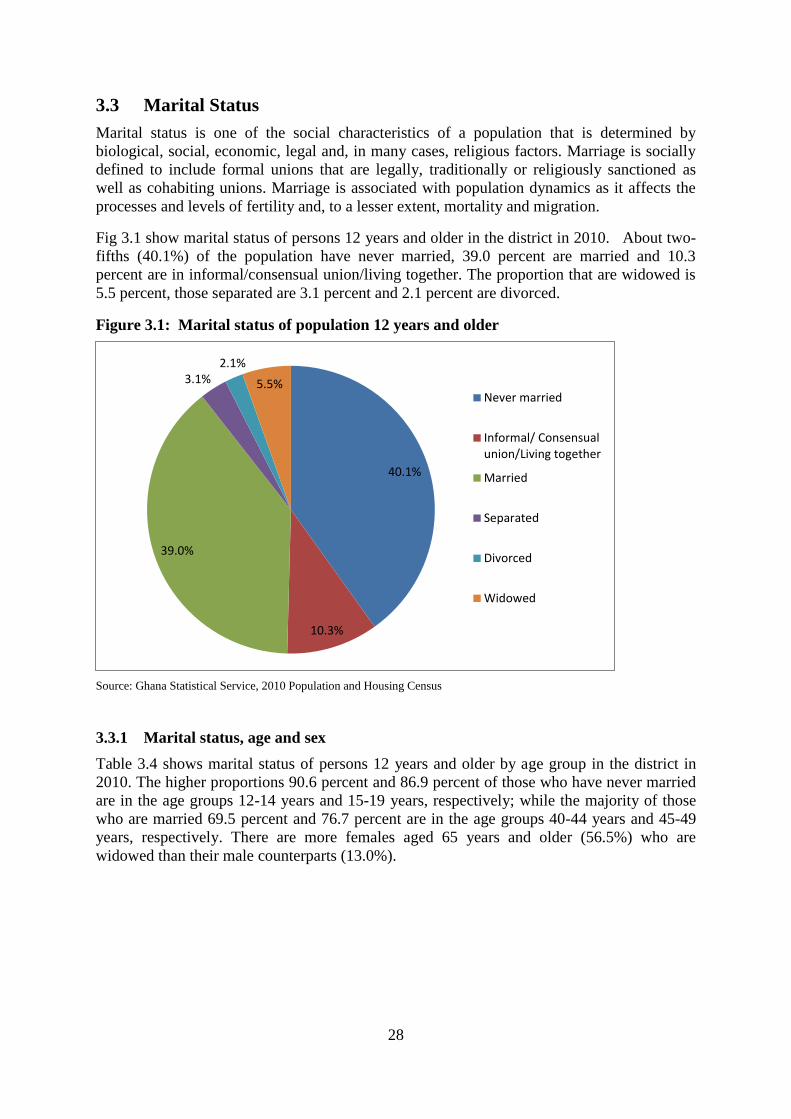
28
3.3 Marital Status
Marital status is one of the social characteristics of a population that is determined by
biological, social, economic, legal and, in many cases, religious factors. Marriage is socially
defined to include formal unions that are legally, traditionally or religiously sanctioned as
well as cohabiting unions. Marriage is associated with population dynamics as it affects the
processes and levels of fertility and, to a lesser extent, mortality and migration.
Fig 3.1 show marital status of persons 12 years and older in the district in 2010. About two-
fifths (40.1%) of the population have never married, 39.0 percent are married and 10.3
percent are in informal/consensual union/living together. The proportion that are widowed is
5.5 percent, those separated are 3.1 percent and 2.1 percent are divorced.
Figure 3.1: Marital status of population 12 years and older
Source: Ghana Statistical Service, 2010 Population and Housing Census
3.3.1 Marital status, age and sex
Table 3.4 shows marital status of persons 12 years and older by age group in the district in
2010. The higher proportions 90.6 percent and 86.9 percent of those who have never married
are in the age groups 12-14 years and 15-19 years, respectively; while the majority of those
who are married 69.5 percent and 76.7 percent are in the age groups 40-44 years and 45-49
years, respectively. There are more females aged 65 years and older (56.5%) who are
widowed than their male counterparts (13.0%).
40.1%
10.3%
39.0%
3.1% 2.1%
5.5% Never married
Informal/ Consensualunion/Living together
Married
Separated
Divorced
Widowed
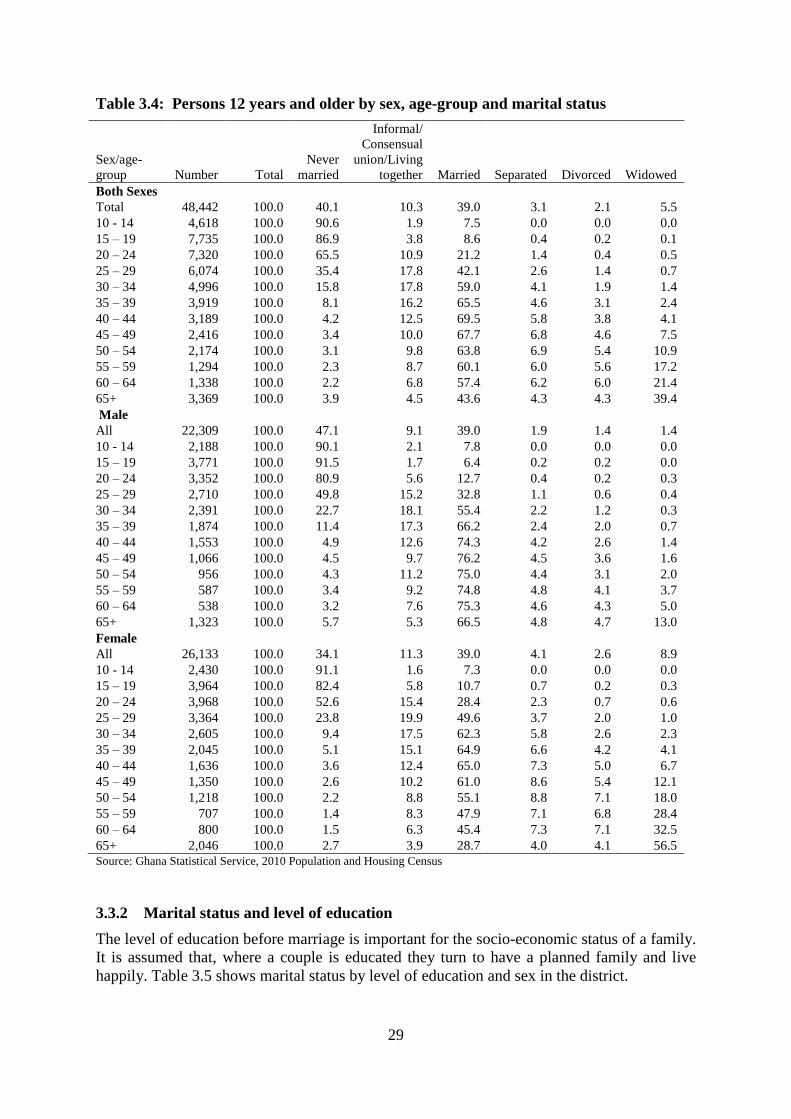
29
Table 3.4: Persons 12 years and older by sex, age-group and marital status
Sex/age-
group Number Total
Never
married
Informal/
Consensual
union/Living
together Married Separated Divorced Widowed
Both Sexes
Total 48,442 100.0 40.1 10.3 39.0 3.1 2.1 5.5
10 - 14 4,618 100.0 90.6 1.9 7.5 0.0 0.0 0.0
15 – 19 7,735 100.0 86.9 3.8 8.6 0.4 0.2 0.1
20 – 24 7,320 100.0 65.5 10.9 21.2 1.4 0.4 0.5
25 – 29 6,074 100.0 35.4 17.8 42.1 2.6 1.4 0.7
30 – 34 4,996 100.0 15.8 17.8 59.0 4.1 1.9 1.4
35 – 39 3,919 100.0 8.1 16.2 65.5 4.6 3.1 2.4
40 – 44 3,189 100.0 4.2 12.5 69.5 5.8 3.8 4.1
45 – 49 2,416 100.0 3.4 10.0 67.7 6.8 4.6 7.5
50 – 54 2,174 100.0 3.1 9.8 63.8 6.9 5.4 10.9
55 – 59 1,294 100.0 2.3 8.7 60.1 6.0 5.6 17.2
60 – 64 1,338 100.0 2.2 6.8 57.4 6.2 6.0 21.4
65+ 3,369 100.0 3.9 4.5 43.6 4.3 4.3 39.4
Male
All 22,309 100.0 47.1 9.1 39.0 1.9 1.4 1.4
10 - 14 2,188 100.0 90.1 2.1 7.8 0.0 0.0 0.0
15 – 19 3,771 100.0 91.5 1.7 6.4 0.2 0.2 0.0
20 – 24 3,352 100.0 80.9 5.6 12.7 0.4 0.2 0.3
25 – 29 2,710 100.0 49.8 15.2 32.8 1.1 0.6 0.4
30 – 34 2,391 100.0 22.7 18.1 55.4 2.2 1.2 0.3
35 – 39 1,874 100.0 11.4 17.3 66.2 2.4 2.0 0.7
40 – 44 1,553 100.0 4.9 12.6 74.3 4.2 2.6 1.4
45 – 49 1,066 100.0 4.5 9.7 76.2 4.5 3.6 1.6
50 – 54 956 100.0 4.3 11.2 75.0 4.4 3.1 2.0
55 – 59 587 100.0 3.4 9.2 74.8 4.8 4.1 3.7
60 – 64 538 100.0 3.2 7.6 75.3 4.6 4.3 5.0
65+ 1,323 100.0 5.7 5.3 66.5 4.8 4.7 13.0
Female
All 26,133 100.0 34.1 11.3 39.0 4.1 2.6 8.9
10 - 14 2,430 100.0 91.1 1.6 7.3 0.0 0.0 0.0
15 – 19 3,964 100.0 82.4 5.8 10.7 0.7 0.2 0.3
20 – 24 3,968 100.0 52.6 15.4 28.4 2.3 0.7 0.6
25 – 29 3,364 100.0 23.8 19.9 49.6 3.7 2.0 1.0
30 – 34 2,605 100.0 9.4 17.5 62.3 5.8 2.6 2.3
35 – 39 2,045 100.0 5.1 15.1 64.9 6.6 4.2 4.1
40 – 44 1,636 100.0 3.6 12.4 65.0 7.3 5.0 6.7
45 – 49 1,350 100.0 2.6 10.2 61.0 8.6 5.4 12.1
50 – 54 1,218 100.0 2.2 8.8 55.1 8.8 7.1 18.0
55 – 59 707 100.0 1.4 8.3 47.9 7.1 6.8 28.4
60 – 64 800 100.0 1.5 6.3 45.4 7.3 7.1 32.5
65+ 2,046 100.0 2.7 3.9 28.7 4.0 4.1 56.5
Source: Ghana Statistical Service, 2010 Population and Housing Census
3.3.2 Marital status and level of education
The level of education before marriage is important for the socio-economic status of a family.
It is assumed that, where a couple is educated they turn to have a planned family and live
happily. Table 3.5 shows marital status by level of education and sex in the district.
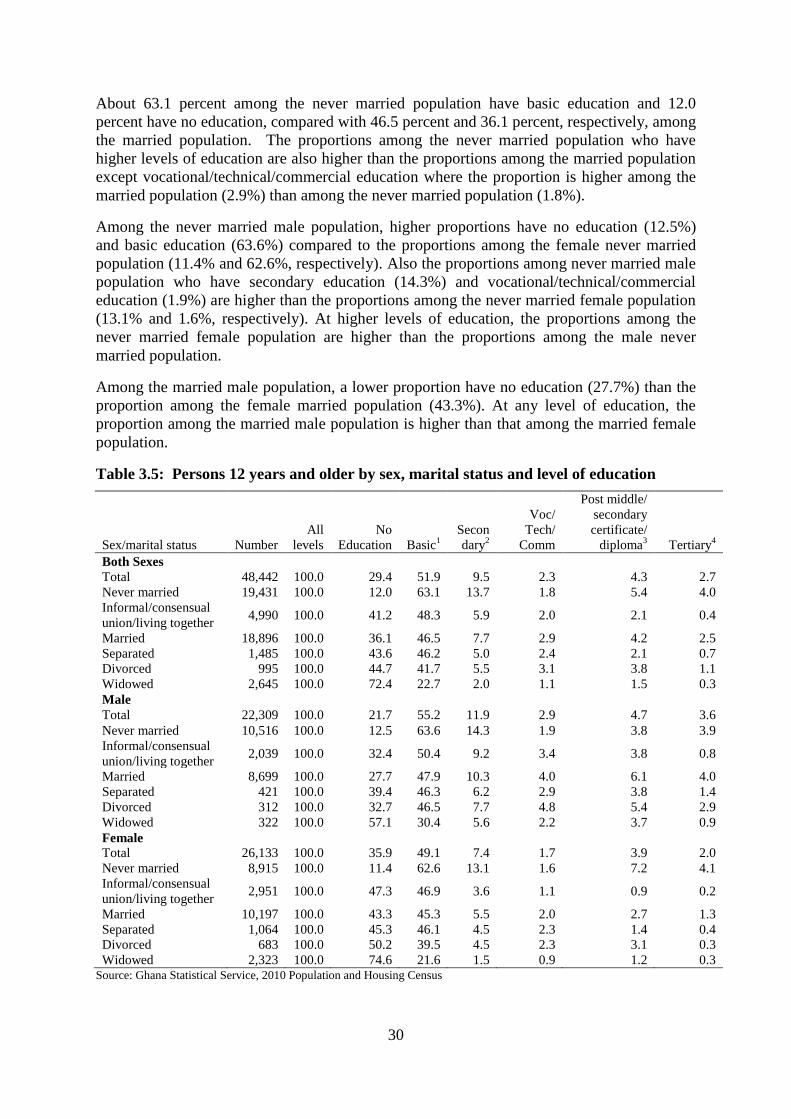
30
About 63.1 percent among the never married population have basic education and 12.0
percent have no education, compared with 46.5 percent and 36.1 percent, respectively, among
the married population. The proportions among the never married population who have
higher levels of education are also higher than the proportions among the married population
except vocational/technical/commercial education where the proportion is higher among the
married population (2.9%) than among the never married population (1.8%).
Among the never married male population, higher proportions have no education (12.5%)
and basic education (63.6%) compared to the proportions among the female never married
population (11.4% and 62.6%, respectively). Also the proportions among never married male
population who have secondary education (14.3%) and vocational/technical/commercial
education (1.9%) are higher than the proportions among the never married female population
(13.1% and 1.6%, respectively). At higher levels of education, the proportions among the
never married female population are higher than the proportions among the male never
married population.
Among the married male population, a lower proportion have no education (27.7%) than the
proportion among the female married population (43.3%). At any level of education, the
proportion among the married male population is higher than that among the married female
population.
Table 3.5: Persons 12 years and older by sex, marital status and level of education
Sex/marital status Number
All
levels
No
Education Basic1
Secon
dary2
Voc/
Tech/
Comm
Post middle/
secondary
certificate/
diploma3 Tertiary
4
Both Sexes
Total 48,442 100.0 29.4 51.9 9.5 2.3 4.3 2.7
Never married 19,431 100.0 12.0 63.1 13.7 1.8 5.4 4.0
Informal/consensual
union/living together 4,990 100.0 41.2 48.3 5.9 2.0 2.1 0.4
Married 18,896 100.0 36.1 46.5 7.7 2.9 4.2 2.5
Separated 1,485 100.0 43.6 46.2 5.0 2.4 2.1 0.7
Divorced 995 100.0 44.7 41.7 5.5 3.1 3.8 1.1
Widowed 2,645 100.0 72.4 22.7 2.0 1.1 1.5 0.3
Male
Total 22,309 100.0 21.7 55.2 11.9 2.9 4.7 3.6
Never married 10,516 100.0 12.5 63.6 14.3 1.9 3.8 3.9
Informal/consensual
union/living together 2,039 100.0 32.4 50.4 9.2 3.4 3.8 0.8
Married 8,699 100.0 27.7 47.9 10.3 4.0 6.1 4.0
Separated 421 100.0 39.4 46.3 6.2 2.9 3.8 1.4
Divorced 312 100.0 32.7 46.5 7.7 4.8 5.4 2.9
Widowed 322 100.0 57.1 30.4 5.6 2.2 3.7 0.9
Female
Total 26,133 100.0 35.9 49.1 7.4 1.7 3.9 2.0
Never married 8,915 100.0 11.4 62.6 13.1 1.6 7.2 4.1
Informal/consensual
union/living together 2,951 100.0 47.3 46.9 3.6 1.1 0.9 0.2
Married 10,197 100.0 43.3 45.3 5.5 2.0 2.7 1.3
Separated 1,064 100.0 45.3 46.1 4.5 2.3 1.4 0.4
Divorced 683 100.0 50.2 39.5 4.5 2.3 3.1 0.3
Widowed 2,323 100.0 74.6 21.6 1.5 0.9 1.2 0.3 Source: Ghana Statistical Service, 2010 Population and Housing Census
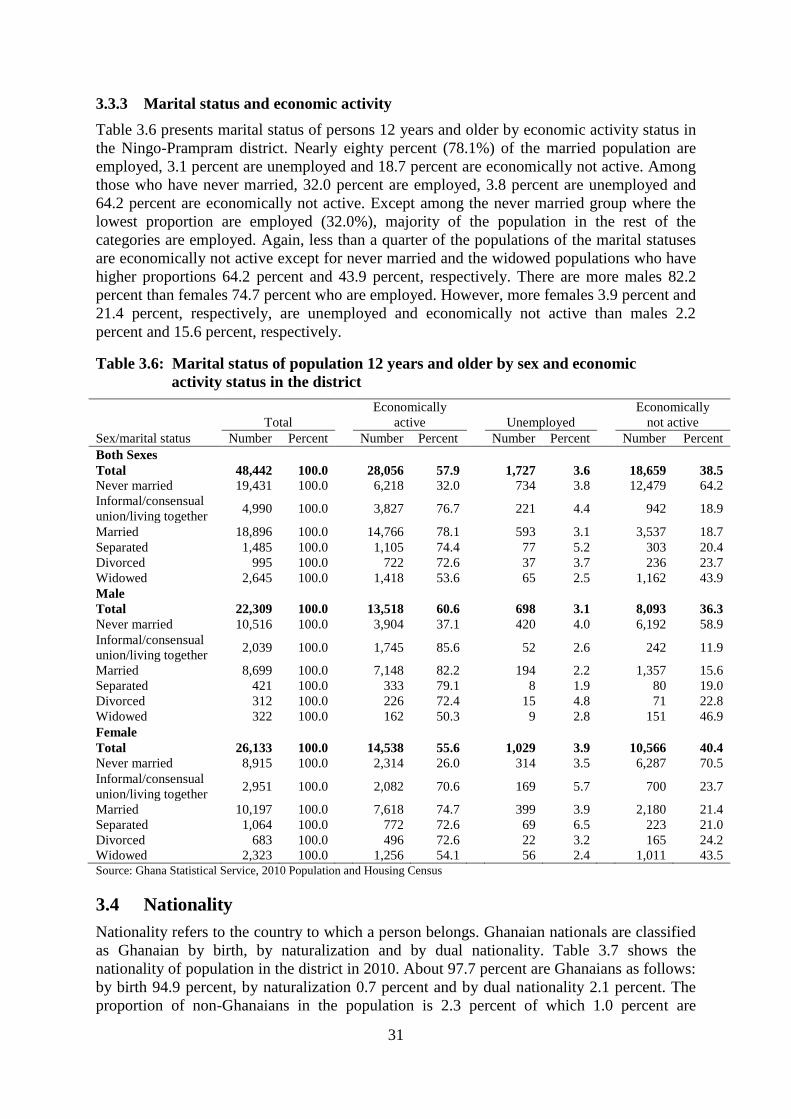
31
3.3.3 Marital status and economic activity
Table 3.6 presents marital status of persons 12 years and older by economic activity status in
the Ningo-Prampram district. Nearly eighty percent (78.1%) of the married population are
employed, 3.1 percent are unemployed and 18.7 percent are economically not active. Among
those who have never married, 32.0 percent are employed, 3.8 percent are unemployed and
64.2 percent are economically not active. Except among the never married group where the
lowest proportion are employed (32.0%), majority of the population in the rest of the
categories are employed. Again, less than a quarter of the populations of the marital statuses
are economically not active except for never married and the widowed populations who have
higher proportions 64.2 percent and 43.9 percent, respectively. There are more males 82.2
percent than females 74.7 percent who are employed. However, more females 3.9 percent and
21.4 percent, respectively, are unemployed and economically not active than males 2.2
percent and 15.6 percent, respectively.
Table 3.6: Marital status of population 12 years and older by sex and economic
activity status in the district
Sex/marital status
Total
Economically
active
Unemployed Economically
not active
Number Percent Number Percent Number Percent Number Percent
Both Sexes
Total 48,442 100.0
28,056 57.9
1,727 3.6
18,659 38.5
Never married 19,431 100.0
6,218 32.0
734 3.8
12,479 64.2
Informal/consensual
union/living together 4,990 100.0
3,827 76.7
221 4.4
942 18.9
Married 18,896 100.0
14,766 78.1
593 3.1
3,537 18.7
Separated 1,485 100.0
1,105 74.4
77 5.2
303 20.4
Divorced 995 100.0
722 72.6
37 3.7
236 23.7
Widowed 2,645 100.0
1,418 53.6
65 2.5
1,162 43.9
Male
Total 22,309 100.0
13,518 60.6
698 3.1
8,093 36.3
Never married 10,516 100.0
3,904 37.1
420 4.0
6,192 58.9
Informal/consensual
union/living together 2,039 100.0
1,745 85.6
52 2.6
242 11.9
Married 8,699 100.0
7,148 82.2
194 2.2
1,357 15.6
Separated 421 100.0
333 79.1
8 1.9
80 19.0
Divorced 312 100.0
226 72.4
15 4.8
71 22.8
Widowed 322 100.0
162 50.3
9 2.8
151 46.9
Female
Total 26,133 100.0
14,538 55.6
1,029 3.9
10,566 40.4
Never married 8,915 100.0
2,314 26.0
314 3.5
6,287 70.5
Informal/consensual
union/living together 2,951 100.0
2,082 70.6
169 5.7
700 23.7
Married 10,197 100.0
7,618 74.7
399 3.9
2,180 21.4
Separated 1,064 100.0
772 72.6
69 6.5
223 21.0
Divorced 683 100.0
496 72.6
22 3.2
165 24.2
Widowed 2,323 100.0 1,256 54.1 56 2.4 1,011 43.5 Source: Ghana Statistical Service, 2010 Population and Housing Census
3.4 Nationality
Nationality refers to the country to which a person belongs. Ghanaian nationals are classified
as Ghanaian by birth, by naturalization and by dual nationality. Table 3.7 shows the
nationality of population in the district in 2010. About 97.7 percent are Ghanaians as follows:
by birth 94.9 percent, by naturalization 0.7 percent and by dual nationality 2.1 percent. The
proportion of non-Ghanaians in the population is 2.3 percent of which 1.0 percent are
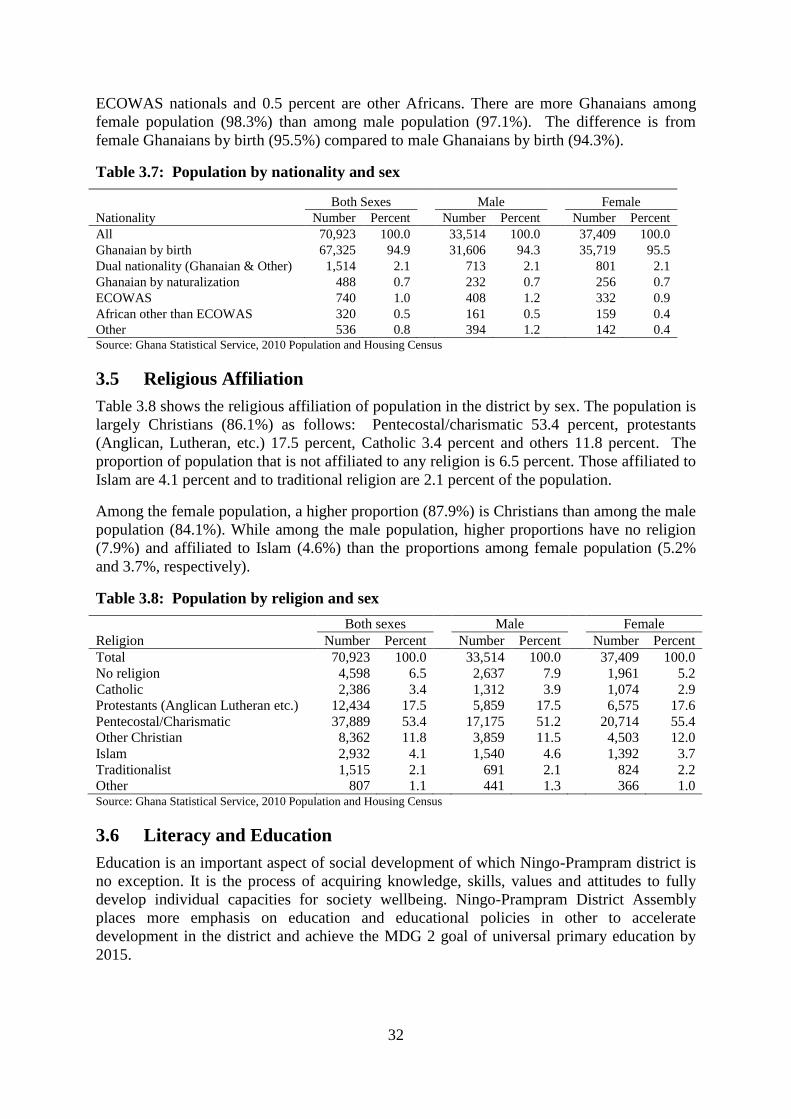
32
ECOWAS nationals and 0.5 percent are other Africans. There are more Ghanaians among
female population (98.3%) than among male population (97.1%). The difference is from
female Ghanaians by birth (95.5%) compared to male Ghanaians by birth (94.3%).
Table 3.7: Population by nationality and sex
Nationality
Both Sexes Male Female
Number Percent Number Percent Number Percent
All 70,923 100.0
33,514 100.0
37,409 100.0
Ghanaian by birth 67,325 94.9
31,606 94.3
35,719 95.5
Dual nationality (Ghanaian & Other) 1,514 2.1
713 2.1
801 2.1
Ghanaian by naturalization 488 0.7
232 0.7
256 0.7
ECOWAS 740 1.0
408 1.2
332 0.9
African other than ECOWAS 320 0.5
161 0.5
159 0.4
Other 536 0.8 394 1.2 142 0.4 Source: Ghana Statistical Service, 2010 Population and Housing Census
3.5 Religious Affiliation
Table 3.8 shows the religious affiliation of population in the district by sex. The population is
largely Christians (86.1%) as follows: Pentecostal/charismatic 53.4 percent, protestants
(Anglican, Lutheran, etc.) 17.5 percent, Catholic 3.4 percent and others 11.8 percent. The
proportion of population that is not affiliated to any religion is 6.5 percent. Those affiliated to
Islam are 4.1 percent and to traditional religion are 2.1 percent of the population.
Among the female population, a higher proportion (87.9%) is Christians than among the male
population (84.1%). While among the male population, higher proportions have no religion
(7.9%) and affiliated to Islam (4.6%) than the proportions among female population (5.2%
and 3.7%, respectively).
Table 3.8: Population by religion and sex
Religion
Both sexes Male Female
Number Percent Number Percent Number Percent
Total 70,923 100.0
33,514 100.0
37,409 100.0
No religion 4,598 6.5
2,637 7.9
1,961 5.2
Catholic 2,386 3.4
1,312 3.9
1,074 2.9
Protestants (Anglican Lutheran etc.) 12,434 17.5
5,859 17.5
6,575 17.6
Pentecostal/Charismatic 37,889 53.4
17,175 51.2
20,714 55.4
Other Christian 8,362 11.8
3,859 11.5
4,503 12.0
Islam 2,932 4.1
1,540 4.6
1,392 3.7
Traditionalist 1,515 2.1
691 2.1
824 2.2
Other 807 1.1 441 1.3 366 1.0 Source: Ghana Statistical Service, 2010 Population and Housing Census
3.6 Literacy and Education
Education is an important aspect of social development of which Ningo-Prampram district is
no exception. It is the process of acquiring knowledge, skills, values and attitudes to fully
develop individual capacities for society wellbeing. Ningo-Prampram District Assembly
places more emphasis on education and educational policies in other to accelerate
development in the district and achieve the MDG 2 goal of universal primary education by
2015.
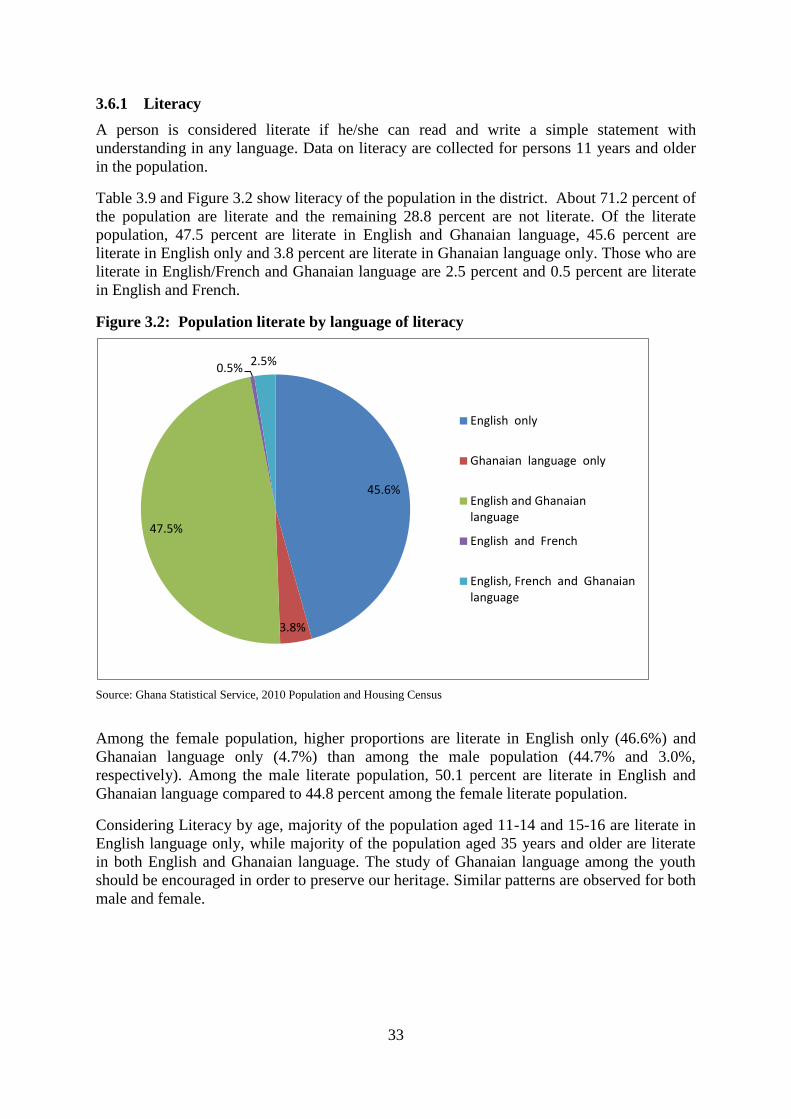
33
3.6.1 Literacy
A person is considered literate if he/she can read and write a simple statement with
understanding in any language. Data on literacy are collected for persons 11 years and older
in the population.
Table 3.9 and Figure 3.2 show literacy of the population in the district. About 71.2 percent of
the population are literate and the remaining 28.8 percent are not literate. Of the literate
population, 47.5 percent are literate in English and Ghanaian language, 45.6 percent are
literate in English only and 3.8 percent are literate in Ghanaian language only. Those who are
literate in English/French and Ghanaian language are 2.5 percent and 0.5 percent are literate
in English and French.
Figure 3.2: Population literate by language of literacy
Source: Ghana Statistical Service, 2010 Population and Housing Census
Among the female population, higher proportions are literate in English only (46.6%) and
Ghanaian language only (4.7%) than among the male population (44.7% and 3.0%,
respectively). Among the male literate population, 50.1 percent are literate in English and
Ghanaian language compared to 44.8 percent among the female literate population.
Considering Literacy by age, majority of the population aged 11-14 and 15-16 are literate in
English language only, while majority of the population aged 35 years and older are literate
in both English and Ghanaian language. The study of Ghanaian language among the youth
should be encouraged in order to preserve our heritage. Similar patterns are observed for both
male and female.
45.6%
3.8%
47.5%
0.5% 2.5%
English only
Ghanaian language only
English and Ghanaianlanguage
English and French
English, French and Ghanaianlanguage

34
Table 3.9: Population 11 years and older by age-sex and literacy status
Age/Sex/
None
(not
literate) Literate Total
English
only
Ghanaian
language
only
English
and
Ghanaian
language
English
and
French
English,
French and
Ghanaian
language
Both Sexes
Total 14,386 35,484 100.0 45.6 3.8 47.5 0.5 2.5
11-14 587 5,459 100.0 60.3 2.4 35.4 0.4 1.6
15-19 863 6,872 100.0 48.6 1.9 45.5 0.5 3.6
20-24 1,320 6,000 100.0 40.5 2.5 50.3 1.1 5.6
25-29 1,564 4,510 100.0 44.9 3.9 49.6 0.2 1.3
30-34 1,583 3,413 100.0 44.2 5.4 48.9 0.4 1.2
35-39 1,446 2,473 100.0 42.5 5.7 50.0 0.6 1.1
40-44 1,254 1,935 100.0 41.4 6.9 50.0 0.3 1.3
45-49 1,000 1,416 100.0 39.8 5.9 52.8 0.4 1.1
50-54 981 1,193 100.0 36.7 6.2 54.7 0.1 2.3
55-59 556 738 100.0 34.6 6.5 57.2 0.3 1.5
60-64 761 577 100.0 31.5 6.8 59.8 0.9 1.0
65+ 2,471 898 100.0 34.5 6.9 57.1 0.2 1.2
Male
Total 4,907 18,112 100.0 44.7 3.0 50.1 0.5 1.7
11-14 276 2,622 100.0 60.3 2.1 36.0 0.4 1.3
15-19 413 3,358 100.0 48.9 1.4 47.5 0.4 1.8
20-24 504 2,848 100.0 42.0 2.1 52.1 0.9 2.8
25-29 549 2,161 100.0 42.8 3.1 52.3 0.4 1.5
30-34 548 1,843 100.0 43.1 3.5 51.7 0.5 1.2
35-39 509 1,365 100.0 40.7 3.9 53.5 0.7 1.3
40-44 434 1,119 100.0 39.4 5.4 53.4 0.4 1.4
45-49 292 774 100.0 39.0 4.1 55.2 0.3 1.4
50-54 290 666 100.0 34.5 4.8 57.8 0.0 2.9
55-59 156 431 100.0 29.7 5.1 62.4 0.5 2.3
60-64 201 337 100.0 31.2 4.2 62.9 0.9 0.9
Female
Total 9,479 17,372 100.0 46.6 4.7 44.8 0.5 3.4
11-14 311 2,837 100.0 60.3 2.7 34.8 0.4 1.9
15-19 450 3,514 100.0 48.3 2.3 43.5 0.6 5.4
20-24 816 3,152 100.0 39.2 2.8 48.7 1.2 8.2
25-29 1,015 2,349 100.0 46.9 4.6 47.2 0.1 1.2
30-34 1,035 1,570 100.0 45.4 7.6 45.7 0.2 1.1
35-39 937 1,108 100.0 44.9 8.0 45.7 0.5 0.9
40-44 820 816 100.0 44.2 9.1 45.3 0.1 1.2
45-49 708 642 100.0 40.8 8.1 49.8 0.6 0.6
50-54 691 527 100.0 39.5 8.0 50.9 0.2 1.5
55-59 400 307 100.0 41.4 8.5 49.8 0.0 0.3
60-64 560 240 100.0 32.1 10.4 55.4 0.8 1.3
65+ 1,736 310 100.0 35.5 11.0 52.6 0.0 1.0 Source: Ghana Statistical Service, 2010 Population and Housing Census
3.6.2 Level of Education
The level of education for persons 3 years and older is shown in Table 3.10. Almost half
(48.3%) of the population currently attending school are in Primary, 16.1 percent are in
JSS/JHS, 13.4 percent are in Kindergarten and 7.0 percent and 5.9 percent are in secondary
and tertiary institutions, respectively. There are no marked differences in current school
attendance by sex except at the tertiary level where the proportion among females (7.3%) is
higher than that among males (4.5%).
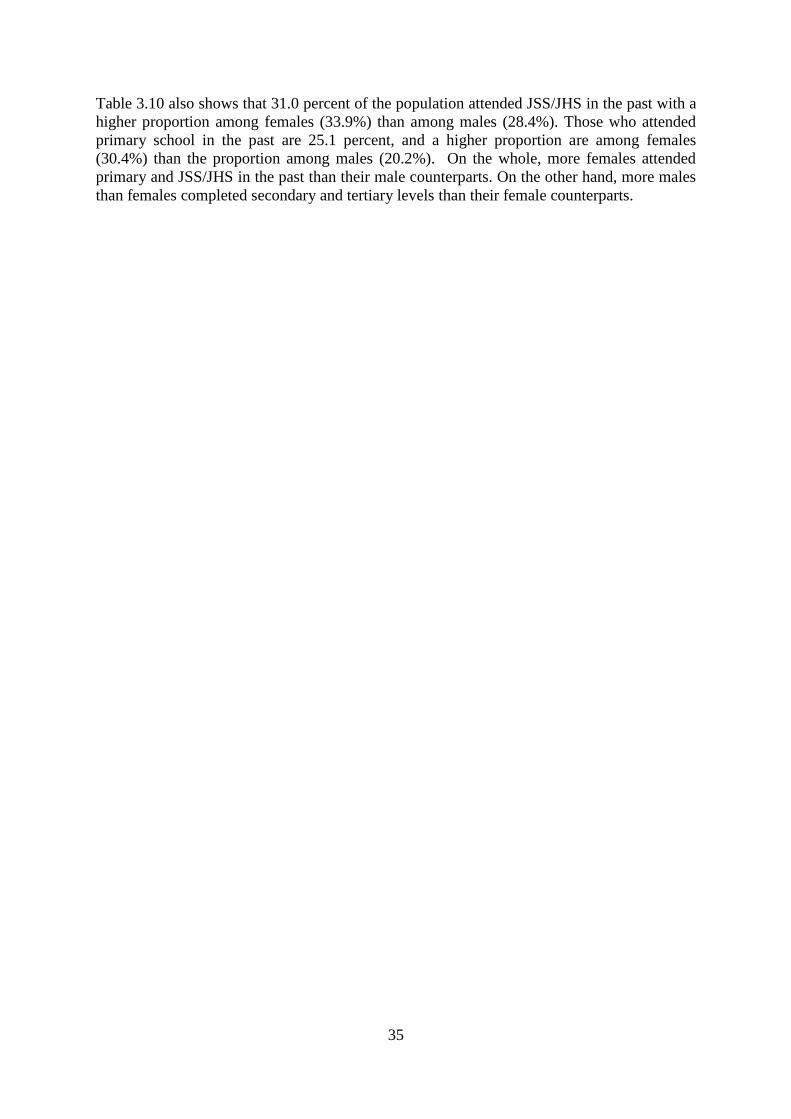
35
Table 3.10 also shows that 31.0 percent of the population attended JSS/JHS in the past with a
higher proportion among females (33.9%) than among males (28.4%). Those who attended
primary school in the past are 25.1 percent, and a higher proportion are among females
(30.4%) than the proportion among males (20.2%). On the whole, more females attended
primary and JSS/JHS in the past than their male counterparts. On the other hand, more males
than females completed secondary and tertiary levels than their female counterparts.
36
Table 3.10: Population 3 years and older by level of education, school attendance and sex
Level of Education
Currently Attending Past Attendance
Both Sexes
Male
Female
Both Sexes
Male
Female
Number Percent Number Percent Number Percent Number Percent Number Percent Number Percent
All 23858 100.0
11802 100.0
12056 100.0
22839 100.0
11830 100.0
11009 100.0
Nursery 2030 8.5
1052 8.9
978 8.1
0 0.0
0 0.0
0 0.0
Kindergarten 3193 13.4
1547 13.1
1646 13.7
0 0.0
0 0.0
0 0.0
Primary 11515 48.3
5709 48.4
5806 48.2
5728 25.1
2386 20.2
3342 30.4
JSS/JHS 3847 16.1
2001 17.0
1846 15.3
7089 31.0
3361 28.4
3728 33.9
Middle 0 0.0
0 0.0
0 0.0
4241 18.6
2426 20.5
1815 16.5
SSS/SHS 1676 7.0
871 7.4
805 6.7
2136 9.4
1235 10.4
901 8.2
Secondary 0 0.0
0 0.0
0 0.0
782 3.4
547 4.6
235 2.1
Voc./Tech./Commercial 121 0.5
61 0.5
60 0.5
973 4.3
593 5.0
380 3.5
Post middle/secondary
certificate 71 0.3
33 0.3
38 0.3
449 2.0
281 2.4
168 1.5
Tertiary 1405 5.9 528 4.5 877 7.3 1441 6.3 1001 8.5 440 4.0 Source: Ghana Statistical Service, 2010 Population and Housing Census
37
CHAPTER FOUR
ECONOMIC CHARACTERISTICS
4.1 Introduction
The economic characteristic of population is important for development planning and other
purposes. They are also development indicators to determine how government is able to
manage the population and national resources in order to provide the needs of the population
and thereby achieve the human development goals.
The economic characteristics of a population also help in examining population and
development interventions so that appropriate policies can be adopted. Population and
development policies have been a major area of research and policy concern in developing
countries, including Ghana and for that matter Ningo-Prampram district. It is against this
background that the economic characteristics of the population of Ningo-Prampram district
are discussed in this chapter. The areas of focus include economic activity status,
employment status and sector, occupation and industry.
4.2 Economic Activity Status
Data on economic activity were collected from persons 15 years and older who worked for
pay (cash or kind), profit or family gain during the seven days preceding the census night.
Table 4.1 and Figure 4.1 show the economic activity status by sex of the population in Ningo-
Prampram District. About 66.8 percent of the population are economically active and the
remaining 33.2 percent are economically not active. About 94.1 percent of the economically
active population are employed and 5.9 percent are unemployed.
Among the male population, 69.4 percent are economically active and 30.6 percent are not
active compared to 64.7 percent and 35.3 percent, respectively, among the female population.
Among the male economically active population, 95.0 percent are employed and 5.0 percent
are unemployed compared to 93.3 percent and 6.7 percent, respectively, among the female
economically active population.
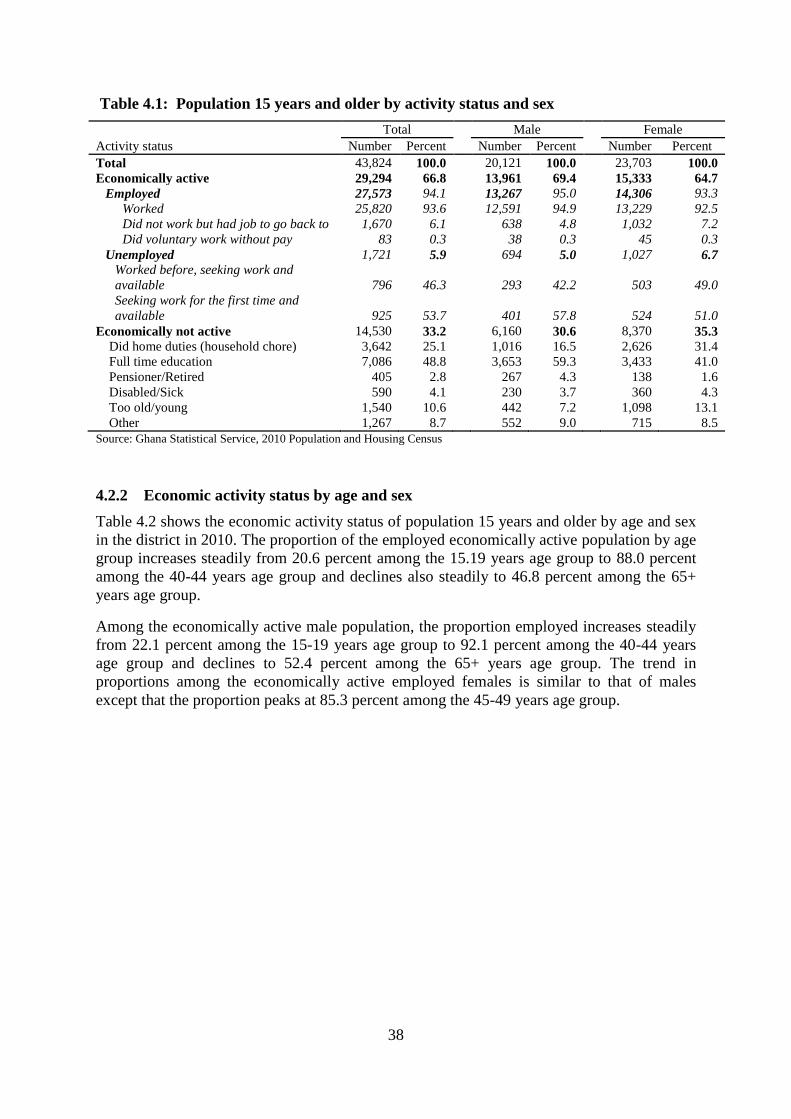
38
Table 4.1: Population 15 years and older by activity status and sex
Activity status
Total Male Female
Number Percent Number Percent Number Percent
Total 43,824 100.0
20,121 100.0
23,703 100.0
Economically active 29,294 66.8
13,961 69.4
15,333 64.7
Employed 27,573 94.1
13,267 95.0
14,306 93.3
Worked 25,820 93.6
12,591 94.9
13,229 92.5
Did not work but had job to go back to 1,670 6.1
638 4.8
1,032 7.2
Did voluntary work without pay 83 0.3
38 0.3
45 0.3
Unemployed 1,721 5.9
694 5.0
1,027 6.7
Worked before, seeking work and
available 796 46.3
293 42.2
503 49.0
Seeking work for the first time and
available 925 53.7
401 57.8
524 51.0
Economically not active 14,530 33.2
6,160 30.6
8,370 35.3
Did home duties (household chore) 3,642 25.1
1,016 16.5
2,626 31.4
Full time education 7,086 48.8
3,653 59.3
3,433 41.0
Pensioner/Retired 405 2.8
267 4.3
138 1.6
Disabled/Sick 590 4.1
230 3.7
360 4.3
Too old/young 1,540 10.6
442 7.2
1,098 13.1
Other 1,267 8.7 552 9.0 715 8.5
Source: Ghana Statistical Service, 2010 Population and Housing Census
4.2.2 Economic activity status by age and sex
Table 4.2 shows the economic activity status of population 15 years and older by age and sex
in the district in 2010. The proportion of the employed economically active population by age
group increases steadily from 20.6 percent among the 15.19 years age group to 88.0 percent
among the 40-44 years age group and declines also steadily to 46.8 percent among the 65+
years age group.
Among the economically active male population, the proportion employed increases steadily
from 22.1 percent among the 15-19 years age group to 92.1 percent among the 40-44 years
age group and declines to 52.4 percent among the 65+ years age group. The trend in
proportions among the economically active employed females is similar to that of males
except that the proportion peaks at 85.3 percent among the 45-49 years age group.
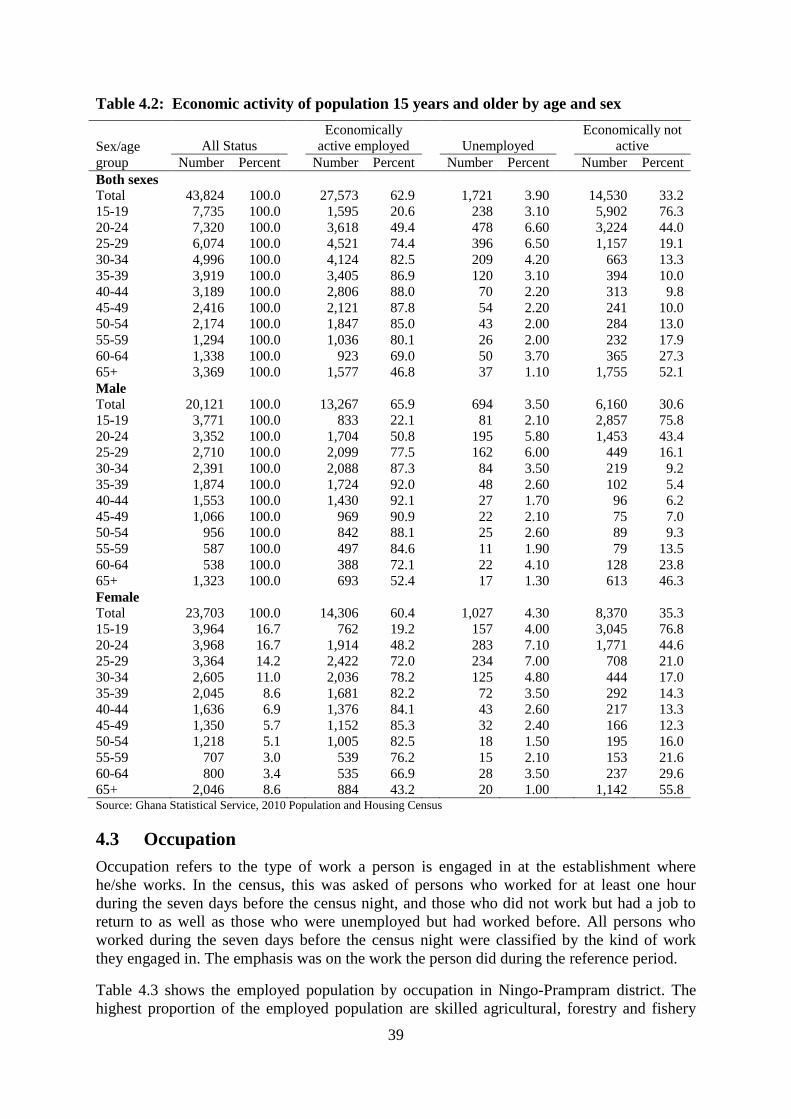
39
Table 4.2: Economic activity of population 15 years and older by age and sex
Sex/age
group
All Status
Economically
active employed
Unemployed
Economically not
active
Number Percent Number Percent Number Percent Number Percent
Both sexes
Total 43,824 100.0
27,573 62.9
1,721 3.90
14,530 33.2
15-19 7,735 100.0
1,595 20.6
238 3.10
5,902 76.3
20-24 7,320 100.0
3,618 49.4
478 6.60
3,224 44.0
25-29 6,074 100.0
4,521 74.4
396 6.50
1,157 19.1
30-34 4,996 100.0
4,124 82.5
209 4.20
663 13.3
35-39 3,919 100.0
3,405 86.9
120 3.10
394 10.0
40-44 3,189 100.0
2,806 88.0
70 2.20
313 9.8
45-49 2,416 100.0
2,121 87.8
54 2.20
241 10.0
50-54 2,174 100.0
1,847 85.0
43 2.00
284 13.0
55-59 1,294 100.0
1,036 80.1
26 2.00
232 17.9
60-64 1,338 100.0
923 69.0
50 3.70
365 27.3
65+ 3,369 100.0 1,577 46.8 37 1.10 1,755 52.1
Male
Total 20,121 100.0
13,267 65.9
694 3.50
6,160 30.6
15-19 3,771 100.0
833 22.1
81 2.10
2,857 75.8
20-24 3,352 100.0
1,704 50.8
195 5.80
1,453 43.4
25-29 2,710 100.0
2,099 77.5
162 6.00
449 16.1
30-34 2,391 100.0
2,088 87.3
84 3.50
219 9.2
35-39 1,874 100.0
1,724 92.0
48 2.60
102 5.4
40-44 1,553 100.0
1,430 92.1
27 1.70
96 6.2
45-49 1,066 100.0
969 90.9
22 2.10
75 7.0
50-54 956 100.0
842 88.1
25 2.60
89 9.3
55-59 587 100.0
497 84.6
11 1.90
79 13.5
60-64 538 100.0
388 72.1
22 4.10
128 23.8
65+ 1,323 100.0
693 52.4
17 1.30
613 46.3
Female
Total 23,703 100.0
14,306 60.4
1,027 4.30
8,370 35.3
15-19 3,964 16.7
762 19.2
157 4.00
3,045 76.8
20-24 3,968 16.7
1,914 48.2
283 7.10
1,771 44.6
25-29 3,364 14.2
2,422 72.0
234 7.00
708 21.0
30-34 2,605 11.0
2,036 78.2
125 4.80
444 17.0
35-39 2,045 8.6
1,681 82.2
72 3.50
292 14.3
40-44 1,636 6.9
1,376 84.1
43 2.60
217 13.3
45-49 1,350 5.7
1,152 85.3
32 2.40
166 12.3
50-54 1,218 5.1
1,005 82.5
18 1.50
195 16.0
55-59 707 3.0
539 76.2
15 2.10
153 21.6
60-64 800 3.4
535 66.9
28 3.50
237 29.6
65+ 2,046 8.6 884 43.2 20 1.00 1,142 55.8 Source: Ghana Statistical Service, 2010 Population and Housing Census
4.3 Occupation
Occupation refers to the type of work a person is engaged in at the establishment where
he/she works. In the census, this was asked of persons who worked for at least one hour
during the seven days before the census night, and those who did not work but had a job to
return to as well as those who were unemployed but had worked before. All persons who
worked during the seven days before the census night were classified by the kind of work
they engaged in. The emphasis was on the work the person did during the reference period.
Table 4.3 shows the employed population by occupation in Ningo-Prampram district. The
highest proportion of the employed population are skilled agricultural, forestry and fishery
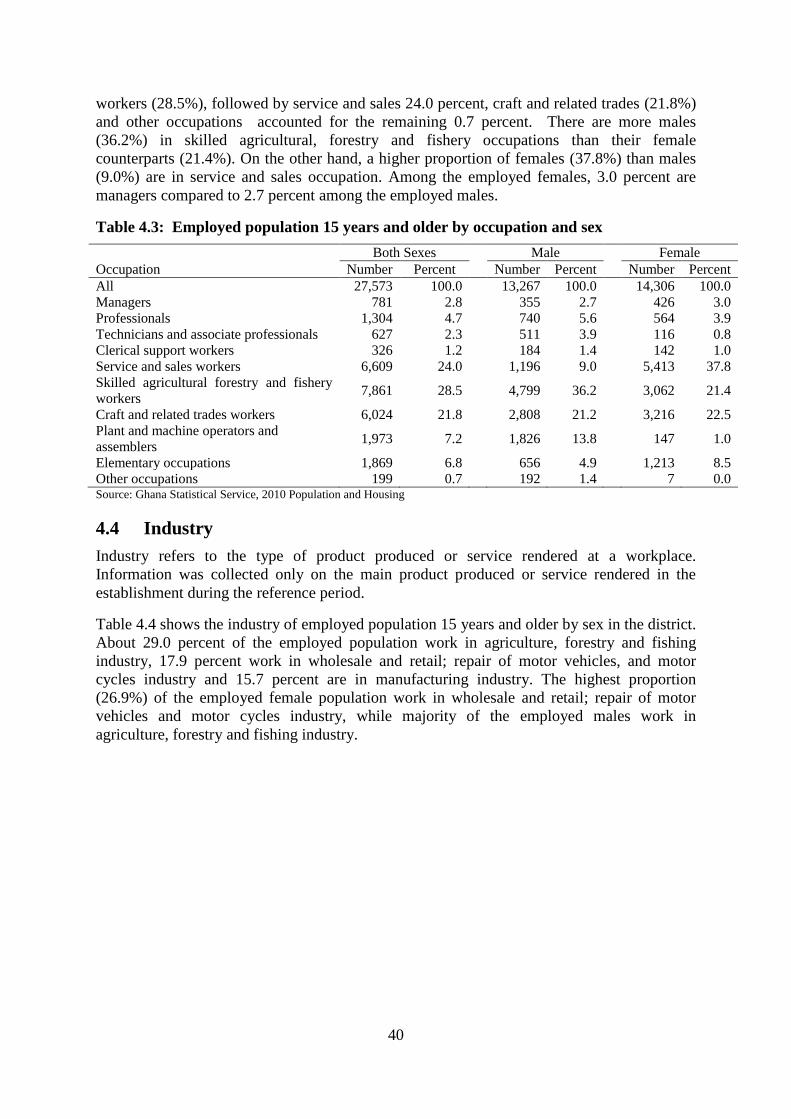
40
workers (28.5%), followed by service and sales 24.0 percent, craft and related trades (21.8%)
and other occupations accounted for the remaining 0.7 percent. There are more males
(36.2%) in skilled agricultural, forestry and fishery occupations than their female
counterparts (21.4%). On the other hand, a higher proportion of females (37.8%) than males
(9.0%) are in service and sales occupation. Among the employed females, 3.0 percent are
managers compared to 2.7 percent among the employed males.
Table 4.3: Employed population 15 years and older by occupation and sex
Occupation
Both Sexes Male Female
Number Percent Number Percent Number Percent
All 27,573 100.0
13,267 100.0
14,306 100.0
Managers 781 2.8
355 2.7
426 3.0
Professionals 1,304 4.7
740 5.6
564 3.9
Technicians and associate professionals 627 2.3
511 3.9
116 0.8
Clerical support workers 326 1.2
184 1.4
142 1.0
Service and sales workers 6,609 24.0
1,196 9.0
5,413 37.8
Skilled agricultural forestry and fishery
workers 7,861 28.5
4,799 36.2
3,062 21.4
Craft and related trades workers 6,024 21.8
2,808 21.2
3,216 22.5
Plant and machine operators and
assemblers 1,973 7.2
1,826 13.8
147 1.0
Elementary occupations 1,869 6.8
656 4.9
1,213 8.5
Other occupations 199 0.7 192 1.4 7 0.0 Source: Ghana Statistical Service, 2010 Population and Housing
4.4 Industry
Industry refers to the type of product produced or service rendered at a workplace.
Information was collected only on the main product produced or service rendered in the
establishment during the reference period.
Table 4.4 shows the industry of employed population 15 years and older by sex in the district.
About 29.0 percent of the employed population work in agriculture, forestry and fishing
industry, 17.9 percent work in wholesale and retail; repair of motor vehicles, and motor
cycles industry and 15.7 percent are in manufacturing industry. The highest proportion
(26.9%) of the employed female population work in wholesale and retail; repair of motor
vehicles and motor cycles industry, while majority of the employed males work in
agriculture, forestry and fishing industry.
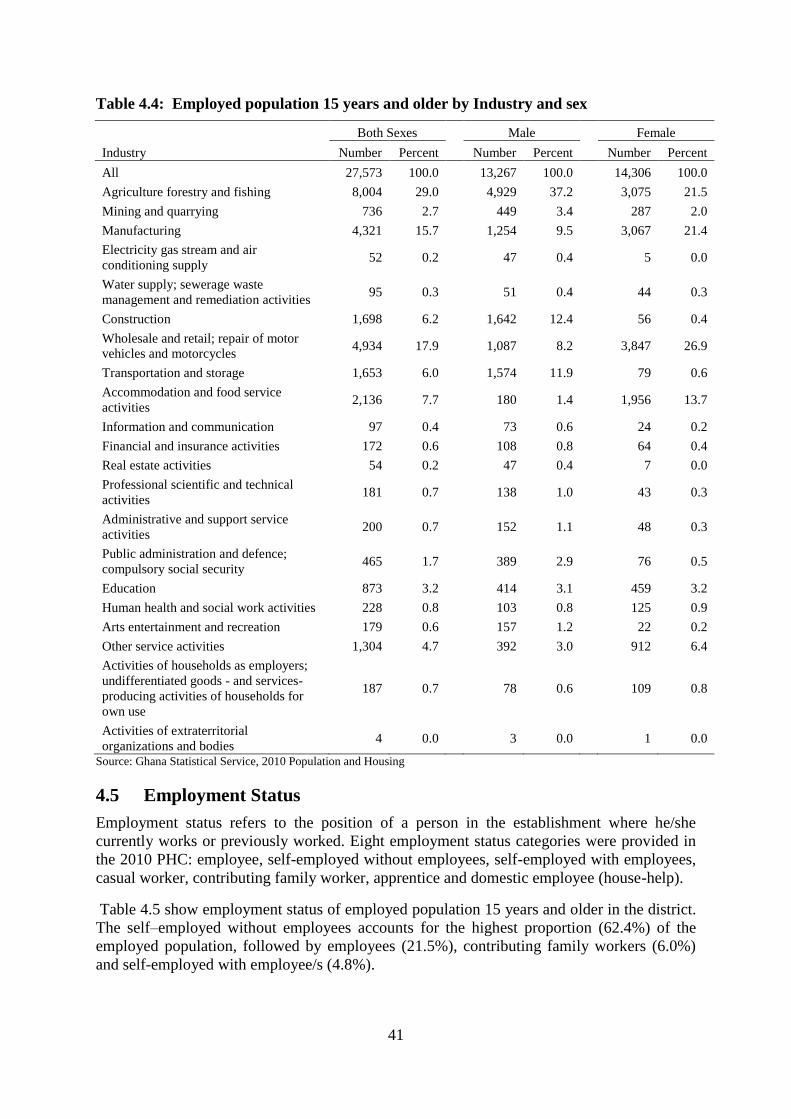
41
Table 4.4: Employed population 15 years and older by Industry and sex
Industry
Both Sexes Male Female
Number Percent Number Percent Number Percent
All 27,573 100.0
13,267 100.0
14,306 100.0
Agriculture forestry and fishing 8,004 29.0
4,929 37.2
3,075 21.5
Mining and quarrying 736 2.7
449 3.4
287 2.0
Manufacturing 4,321 15.7
1,254 9.5
3,067 21.4
Electricity gas stream and air
conditioning supply 52 0.2
47 0.4
5 0.0
Water supply; sewerage waste
management and remediation activities 95 0.3
51 0.4
44 0.3
Construction 1,698 6.2
1,642 12.4
56 0.4
Wholesale and retail; repair of motor
vehicles and motorcycles 4,934 17.9
1,087 8.2
3,847 26.9
Transportation and storage 1,653 6.0
1,574 11.9
79 0.6
Accommodation and food service
activities 2,136 7.7
180 1.4
1,956 13.7
Information and communication 97 0.4
73 0.6
24 0.2
Financial and insurance activities 172 0.6
108 0.8
64 0.4
Real estate activities 54 0.2
47 0.4
7 0.0
Professional scientific and technical
activities 181 0.7
138 1.0
43 0.3
Administrative and support service
activities 200 0.7
152 1.1
48 0.3
Public administration and defence;
compulsory social security 465 1.7
389 2.9
76 0.5
Education 873 3.2
414 3.1
459 3.2
Human health and social work activities 228 0.8
103 0.8
125 0.9
Arts entertainment and recreation 179 0.6
157 1.2
22 0.2
Other service activities 1,304 4.7
392 3.0
912 6.4
Activities of households as employers;
undifferentiated goods - and services-
producing activities of households for
own use
187 0.7
78 0.6
109 0.8
Activities of extraterritorial
organizations and bodies 4 0.0 3 0.0 1 0.0
Source: Ghana Statistical Service, 2010 Population and Housing
4.5 Employment Status
Employment status refers to the position of a person in the establishment where he/she
currently works or previously worked. Eight employment status categories were provided in
the 2010 PHC: employee, self-employed without employees, self-employed with employees,
casual worker, contributing family worker, apprentice and domestic employee (house-help).
Table 4.5 show employment status of employed population 15 years and older in the district.
The self–employed without employees accounts for the highest proportion (62.4%) of the
employed population, followed by employees (21.5%), contributing family workers (6.0%)
and self-employed with employee/s (4.8%).

42
Higher proportions among employed females are self-employed without employees (73.7%)
and contributing family workers (7.0%) compared to their male counterparts (50.3% and
4.9%, respectively), Higher proportions among employed males are employees (32.7%),
casual workers (3.4%) and self-employed with employee/s (5.8%) than their female
counterparts (11.0%, 0.9% and 4.0%, respectively).
Table 4.5: Employed population 15 years and older by employment status and sex
Employment sector
Both Sexes Male Female
Number Percent Number Percent Number Percent
Total 27,573 100.0
13,267 100.0
14,306 100.0
Employee 5,919 21.5
4,344 32.7
1,575 11.0
Self-employed without employee(s) 17,219 62.4
6,672 50.3
10,547 73.7
Self-employed with employee(s) 1,334 4.8
763 5.8
571 4.0
Casual worker 580 2.1
447 3.4
133 0.9
Contributing family worker 1,650 6.0
649 4.9
1,001 7.0
Apprentice 660 2.4
287 2.2
373 2.6
Domestic employee (house help) 171 0.6
76 0.6
95 0.7
Other 40 0.1 29 0.2 11 0.1 Source: Ghana Statistical Service, 2010 Population and Housing
4.6 Employment Sector
Employment sector refers to the sector in which a person works. The sectors covered in the
census are public, private formal, private informal, semi-public/parastatal, NGOs and
International organizations.
Table 4.6 shows the employment sector of the employed population 15 year and older in the
district. The majority of the employed population (85.0%) are in the private informal sector;
among females 91.3 percent and among males 78.1 percent are employed in the private
informal sector. The private formal sector employs 9.1 percent of the population; a higher
proportion among males (13.5%) are in this sector than the proportion among females (4.7%).
The public (government) sector accounts for 5.2 percent of the employed population; the
proportion among employed males (7.0%) is higher than that among employed females
(3.5%).
Table 4.6: Employed population 15 years and older by employment sector and sex
Employment sector
Both Sexes Male Female
Number Percent Number Percent Number Percent
Total 27,573 100.0
13,267 100.0
14,306 100.0
Public (government) 1,423 5.2
926 7.0
497 3.5
Private/formal 2,503 9.1
1,831 13.8
672 4.7
Private/informal 23,432 85.0
10,368 78.1
13,064 91.3
Semi-public/parastatal 16 0.1
12 0.1
4 0.0
NGOs (local and international) 189 0.7
121 0.9
68 0.5
Other international organisations 10 0.0 9 0.1 1 0.0 Source: Ghana Statistical Service, 2010 Population and Housing Census
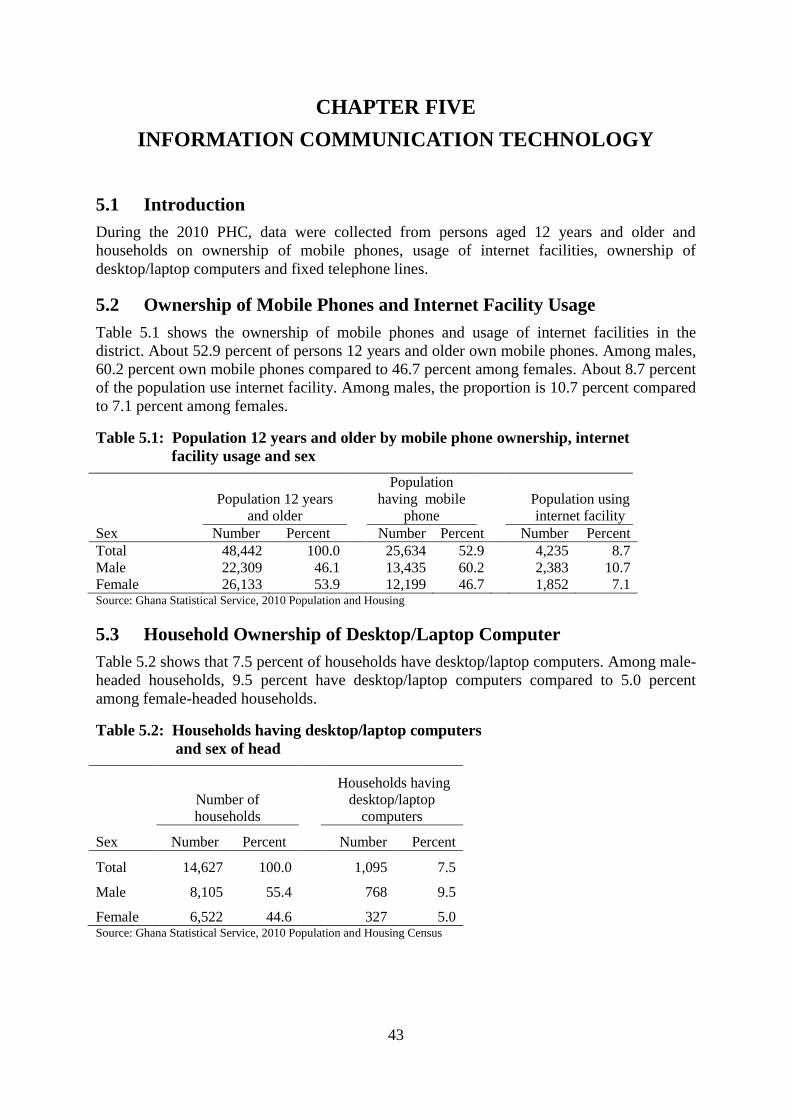
43
CHAPTER FIVE
INFORMATION COMMUNICATION TECHNOLOGY
5.1 Introduction
During the 2010 PHC, data were collected from persons aged 12 years and older and
households on ownership of mobile phones, usage of internet facilities, ownership of
desktop/laptop computers and fixed telephone lines.
5.2 Ownership of Mobile Phones and Internet Facility Usage
Table 5.1 shows the ownership of mobile phones and usage of internet facilities in the
district. About 52.9 percent of persons 12 years and older own mobile phones. Among males,
60.2 percent own mobile phones compared to 46.7 percent among females. About 8.7 percent
of the population use internet facility. Among males, the proportion is 10.7 percent compared
to 7.1 percent among females.
Table 5.1: Population 12 years and older by mobile phone ownership, internet
facility usage and sex
Sex
Population 12 years
and older
Population
having mobile
phone Population using
internet facility Number Percent Number Percent Number Percent
Total 48,442 100.0
25,634 52.9
4,235 8.7 Male 22,309 46.1
13,435 60.2
2,383 10.7
Female 26,133 53.9 12,199 46.7 1,852 7.1 Source: Ghana Statistical Service, 2010 Population and Housing
5.3 Household Ownership of Desktop/Laptop Computer
Table 5.2 shows that 7.5 percent of households have desktop/laptop computers. Among male-
headed households, 9.5 percent have desktop/laptop computers compared to 5.0 percent
among female-headed households.
Table 5.2: Households having desktop/laptop computers
and sex of head
Sex
Number of
households
Households having
desktop/laptop
computers
Number Percent Number Percent
Total 14,627 100.0
1,095 7.5
Male 8,105 55.4
768 9.5
Female 6,522 44.6 327 5.0 Source: Ghana Statistical Service, 2010 Population and Housing Census
44
CHAPTER SIX
DISABILITY
6.1 Introduction
Persons with disabilities (PWD) are those who are unable to or are restricted in the
performance of specific tasks/activities due to loss of function of some part of the body as a
result of impairment or malformation (GSS, 2012). As a result, PWD face a wide range of
life challenges because disability, in whatever form or type, can reduce an individual’s ability
to function to his/her full potential.
In Ghana, PWDs are marginalized and suffer from discrimination on account of their
disability status. They are mostly regarded as less productive and not capable of contributing
to development compared to their non-disabled counterparts. Accordingly, they are often
seen as a burden on society and their unfortunate circumstances are viewed sometimes as a
curse or punishment. Furthermore, they have poorer health status, lower educational
achievements, less economic participation and higher levels of poverty than people with no
disabilities (World Health Organization, (2011). During the 2010 PHC data were collected on
persons with disability. Discussed in this chapter are population with disability, types of
disability, economic activity and level of education and literacy of population with disability.
6.2 Population with Disability
Persons with disability are 1,499 or 2.1 percent of the total population. Among females, 2.3
percent have disability compared to1.9 percent among males. The proportion of persons with
disability in urban locality is 2.2 percent compared to 2.0 percent in rural locality (Table 6.1).
6.3 Types of Disability
Six types of disability are identified in the 2010 Population and Housing Census as shown in
Table 6.1 and Figure 6.1. Sight disability is the most common type, 42.9 percent of the
population with disability, followed by physical (34.2%), speech (17.6%) and hearing
(13.9%). The lowest proportion is emotional disability (11.7%), followed by intellectual
disability (12.1%).
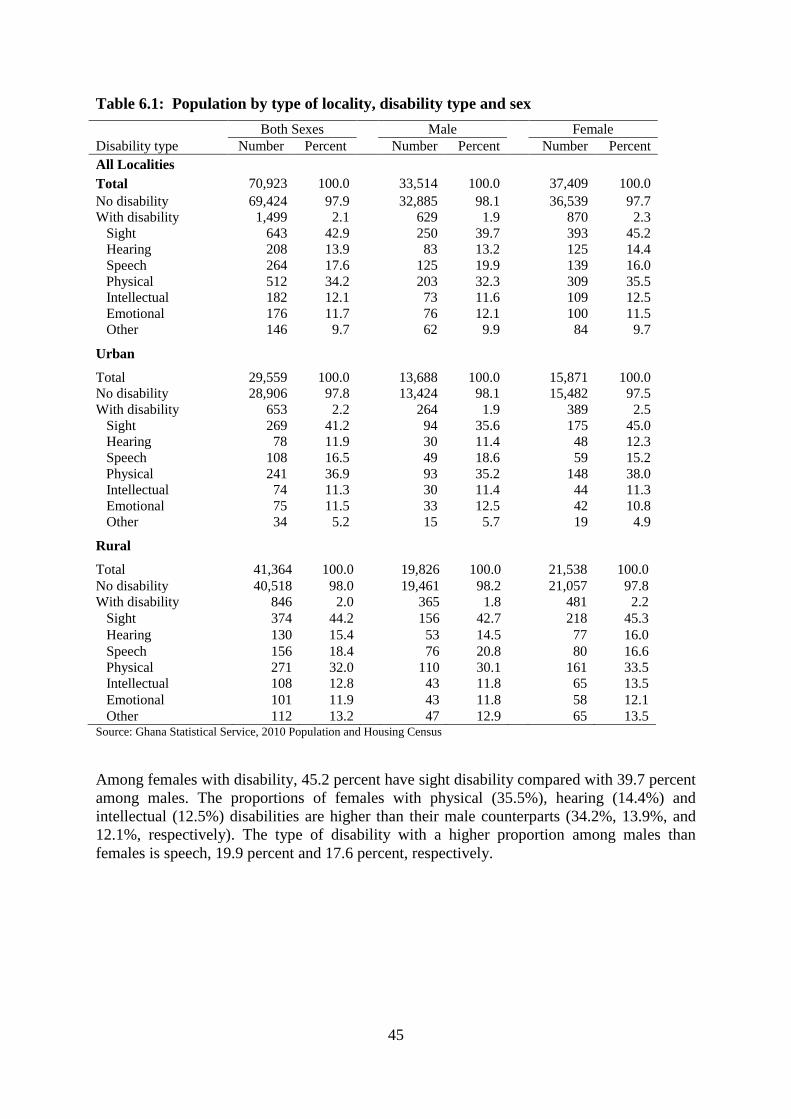
45
Table 6.1: Population by type of locality, disability type and sex
Disability type
Both Sexes Male Female
Number Percent Number Percent Number Percent
All Localities
Total 70,923 100.0
33,514 100.0
37,409 100.0
No disability 69,424 97.9
32,885 98.1
36,539 97.7
With disability 1,499 2.1
629 1.9
870 2.3
Sight 643 42.9
250 39.7
393 45.2
Hearing 208 13.9
83 13.2
125 14.4
Speech 264 17.6
125 19.9
139 16.0
Physical 512 34.2
203 32.3
309 35.5
Intellectual 182 12.1
73 11.6
109 12.5
Emotional 176 11.7
76 12.1
100 11.5
Other 146 9.7
62 9.9
84 9.7
Urban
Total 29,559 100.0
13,688 100.0
15,871 100.0
No disability 28,906 97.8
13,424 98.1
15,482 97.5
With disability 653 2.2
264 1.9
389 2.5
Sight 269 41.2
94 35.6
175 45.0
Hearing 78 11.9
30 11.4
48 12.3
Speech 108 16.5
49 18.6
59 15.2
Physical 241 36.9
93 35.2
148 38.0
Intellectual 74 11.3
30 11.4
44 11.3
Emotional 75 11.5
33 12.5
42 10.8
Other 34 5.2 15 5.7 19 4.9
Rural
Total 41,364 100.0
19,826 100.0
21,538 100.0
No disability 40,518 98.0
19,461 98.2
21,057 97.8
With disability 846 2.0
365 1.8
481 2.2
Sight 374 44.2
156 42.7
218 45.3
Hearing 130 15.4
53 14.5
77 16.0
Speech 156 18.4
76 20.8
80 16.6
Physical 271 32.0
110 30.1
161 33.5
Intellectual 108 12.8
43 11.8
65 13.5
Emotional 101 11.9
43 11.8
58 12.1
Other 112 13.2 47 12.9 65 13.5 Source: Ghana Statistical Service, 2010 Population and Housing Census
Among females with disability, 45.2 percent have sight disability compared with 39.7 percent
among males. The proportions of females with physical (35.5%), hearing (14.4%) and
intellectual (12.5%) disabilities are higher than their male counterparts (34.2%, 13.9%, and
12.1%, respectively). The type of disability with a higher proportion among males than
females is speech, 19.9 percent and 17.6 percent, respectively.
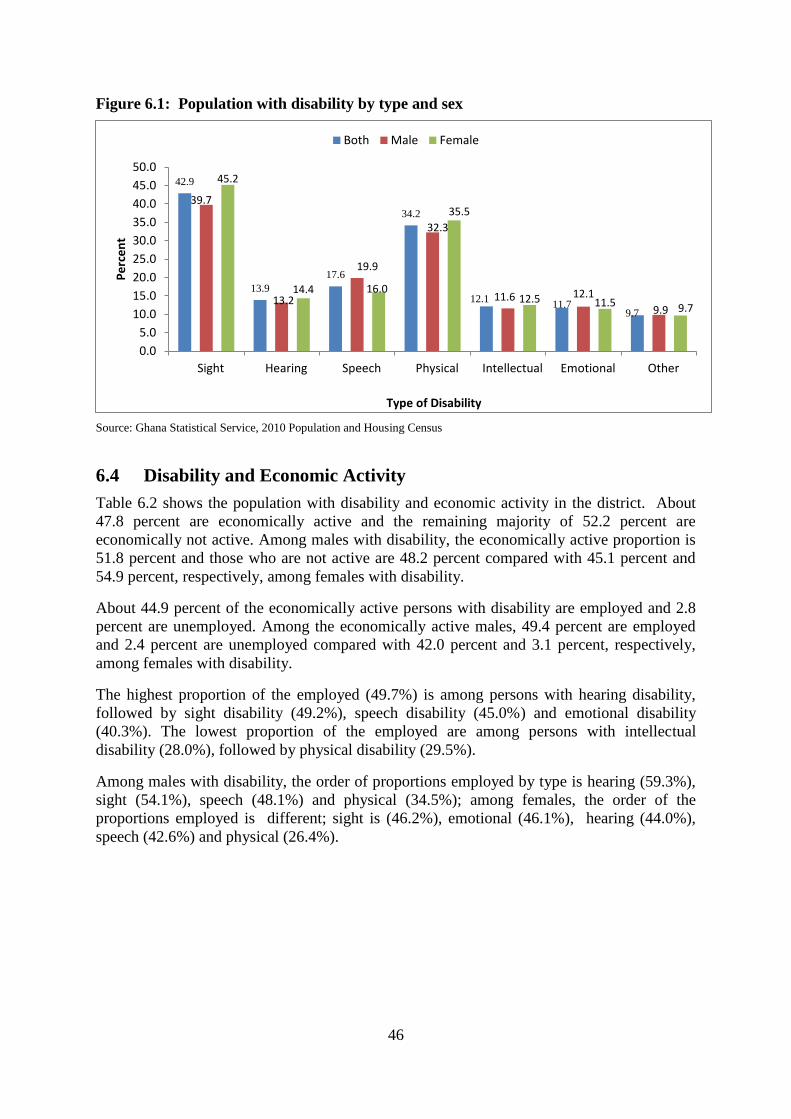
46
Figure 6.1: Population with disability by type and sex
Source: Ghana Statistical Service, 2010 Population and Housing Census
6.4 Disability and Economic Activity
Table 6.2 shows the population with disability and economic activity in the district. About
47.8 percent are economically active and the remaining majority of 52.2 percent are
economically not active. Among males with disability, the economically active proportion is
51.8 percent and those who are not active are 48.2 percent compared with 45.1 percent and
54.9 percent, respectively, among females with disability.
About 44.9 percent of the economically active persons with disability are employed and 2.8
percent are unemployed. Among the economically active males, 49.4 percent are employed
and 2.4 percent are unemployed compared with 42.0 percent and 3.1 percent, respectively,
among females with disability.
The highest proportion of the employed (49.7%) is among persons with hearing disability,
followed by sight disability (49.2%), speech disability (45.0%) and emotional disability
(40.3%). The lowest proportion of the employed are among persons with intellectual
disability (28.0%), followed by physical disability (29.5%).
Among males with disability, the order of proportions employed by type is hearing (59.3%),
sight (54.1%), speech (48.1%) and physical (34.5%); among females, the order of the
proportions employed is different; sight is (46.2%), emotional (46.1%), hearing (44.0%),
speech (42.6%) and physical (26.4%).
42.9
13.9
17.6
34.2
12.1 11.7
9.7
39.7
13.2
19.9
32.3
11.6 12.1
9.9
45.2
14.4 16.0
35.5
12.5 11.5 9.7
0.0
5.0
10.0
15.0
20.0
25.0
30.0
35.0
40.0
45.0
50.0
Sight Hearing Speech Physical Intellectual Emotional Other
Pe
rce
nt
Type of Disability
Both Male Female
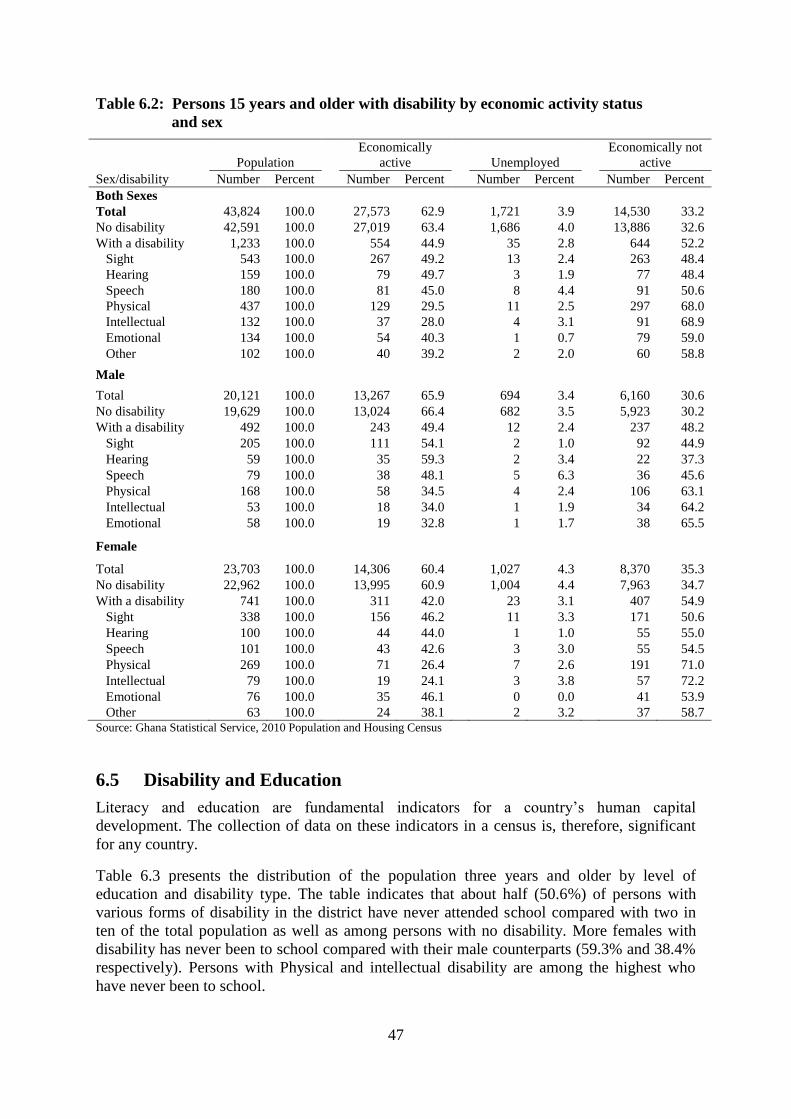
47
Table 6.2: Persons 15 years and older with disability by economic activity status
and sex
Sex/disability
Population Economically
active
Unemployed Economically not
active
Number Percent Number Percent Number Percent Number Percent
Both Sexes
Total 43,824 100.0
27,573 62.9
1,721 3.9
14,530 33.2
No disability 42,591 100.0
27,019 63.4
1,686 4.0
13,886 32.6
With a disability 1,233 100.0
554 44.9
35 2.8
644 52.2
Sight 543 100.0
267 49.2
13 2.4
263 48.4
Hearing 159 100.0
79 49.7
3 1.9
77 48.4
Speech 180 100.0
81 45.0
8 4.4
91 50.6
Physical 437 100.0
129 29.5
11 2.5
297 68.0
Intellectual 132 100.0
37 28.0
4 3.1
91 68.9
Emotional 134 100.0
54 40.3
1 0.7
79 59.0
Other 102 100.0
40 39.2
2 2.0
60 58.8
Male
Total 20,121 100.0
13,267 65.9
694 3.4
6,160 30.6
No disability 19,629 100.0
13,024 66.4
682 3.5
5,923 30.2
With a disability 492 100.0
243 49.4
12 2.4
237 48.2
Sight 205 100.0
111 54.1
2 1.0
92 44.9
Hearing 59 100.0
35 59.3
2 3.4
22 37.3
Speech 79 100.0
38 48.1
5 6.3
36 45.6
Physical 168 100.0
58 34.5
4 2.4
106 63.1
Intellectual 53 100.0
18 34.0
1 1.9
34 64.2
Emotional 58 100.0 19 32.8 1 1.7 38 65.5
Female
Total 23,703 100.0
14,306 60.4
1,027 4.3
8,370 35.3
No disability 22,962 100.0
13,995 60.9
1,004 4.4
7,963 34.7
With a disability 741 100.0
311 42.0
23 3.1
407 54.9
Sight 338 100.0
156 46.2
11 3.3
171 50.6
Hearing 100 100.0
44 44.0
1 1.0
55 55.0
Speech 101 100.0
43 42.6
3 3.0
55 54.5
Physical 269 100.0
71 26.4
7 2.6
191 71.0
Intellectual 79 100.0
19 24.1
3 3.8
57 72.2
Emotional 76 100.0
35 46.1
0 0.0
41 53.9
Other 63 100.0 24 38.1 2 3.2 37 58.7 Source: Ghana Statistical Service, 2010 Population and Housing Census
6.5 Disability and Education
Literacy and education are fundamental indicators for a country’s human capital
development. The collection of data on these indicators in a census is, therefore, significant
for any country.
Table 6.3 presents the distribution of the population three years and older by level of
education and disability type. The table indicates that about half (50.6%) of persons with
various forms of disability in the district have never attended school compared with two in
ten of the total population as well as among persons with no disability. More females with
disability has never been to school compared with their male counterparts (59.3% and 38.4%
respectively). Persons with Physical and intellectual disability are among the highest who
have never been to school.
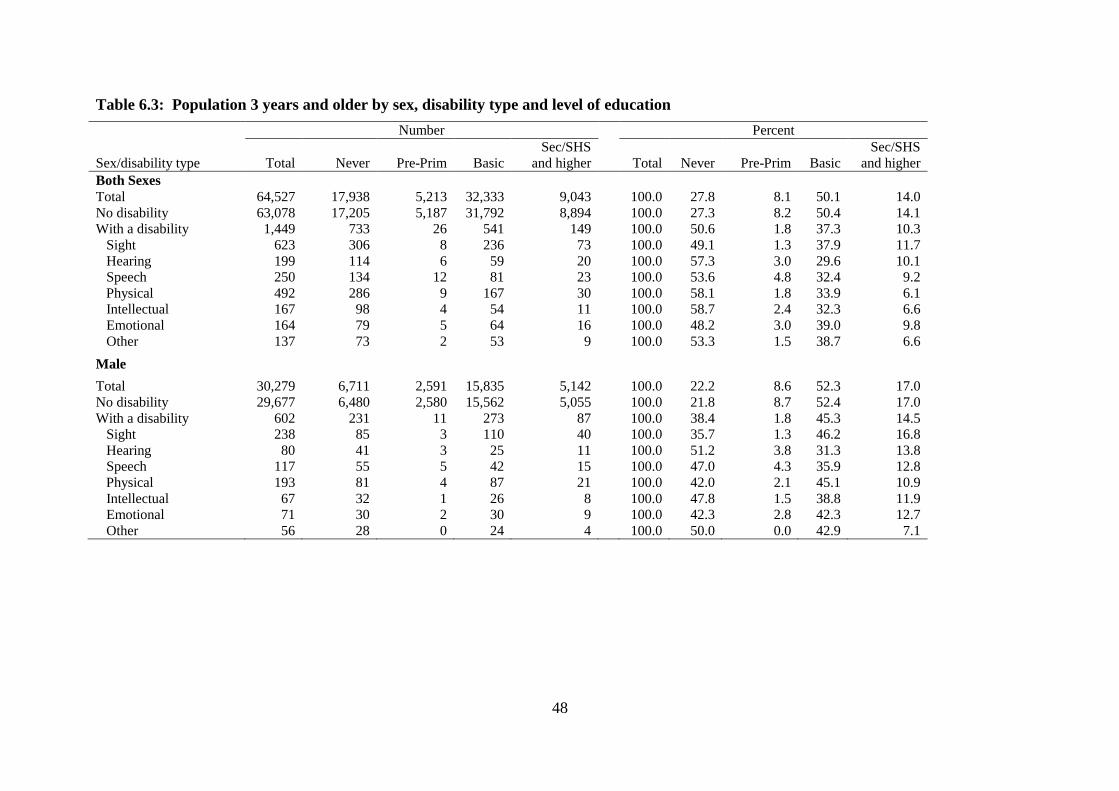
48
Table 6.3: Population 3 years and older by sex, disability type and level of education
Sex/disability type
Number Percent
Total Never Pre-Prim Basic
Sec/SHS
and higher
Total Never Pre-Prim Basic
Sec/SHS
and higher
Both Sexes
Total 64,527 17,938 5,213 32,333 9,043
100.0 27.8 8.1 50.1 14.0
No disability 63,078 17,205 5,187 31,792 8,894
100.0 27.3 8.2 50.4 14.1
With a disability 1,449 733 26 541 149
100.0 50.6 1.8 37.3 10.3
Sight 623 306 8 236 73
100.0 49.1 1.3 37.9 11.7
Hearing 199 114 6 59 20
100.0 57.3 3.0 29.6 10.1
Speech 250 134 12 81 23
100.0 53.6 4.8 32.4 9.2
Physical 492 286 9 167 30
100.0 58.1 1.8 33.9 6.1
Intellectual 167 98 4 54 11
100.0 58.7 2.4 32.3 6.6
Emotional 164 79 5 64 16
100.0 48.2 3.0 39.0 9.8
Other 137 73 2 53 9
100.0 53.3 1.5 38.7 6.6
Male
Total 30,279 6,711 2,591 15,835 5,142
100.0 22.2 8.6 52.3 17.0
No disability 29,677 6,480 2,580 15,562 5,055
100.0 21.8 8.7 52.4 17.0
With a disability 602 231 11 273 87
100.0 38.4 1.8 45.3 14.5
Sight 238 85 3 110 40
100.0 35.7 1.3 46.2 16.8
Hearing 80 41 3 25 11
100.0 51.2 3.8 31.3 13.8
Speech 117 55 5 42 15
100.0 47.0 4.3 35.9 12.8
Physical 193 81 4 87 21
100.0 42.0 2.1 45.1 10.9
Intellectual 67 32 1 26 8
100.0 47.8 1.5 38.8 11.9
Emotional 71 30 2 30 9
100.0 42.3 2.8 42.3 12.7
Other 56 28 0 24 4
100.0 50.0 0.0 42.9 7.1
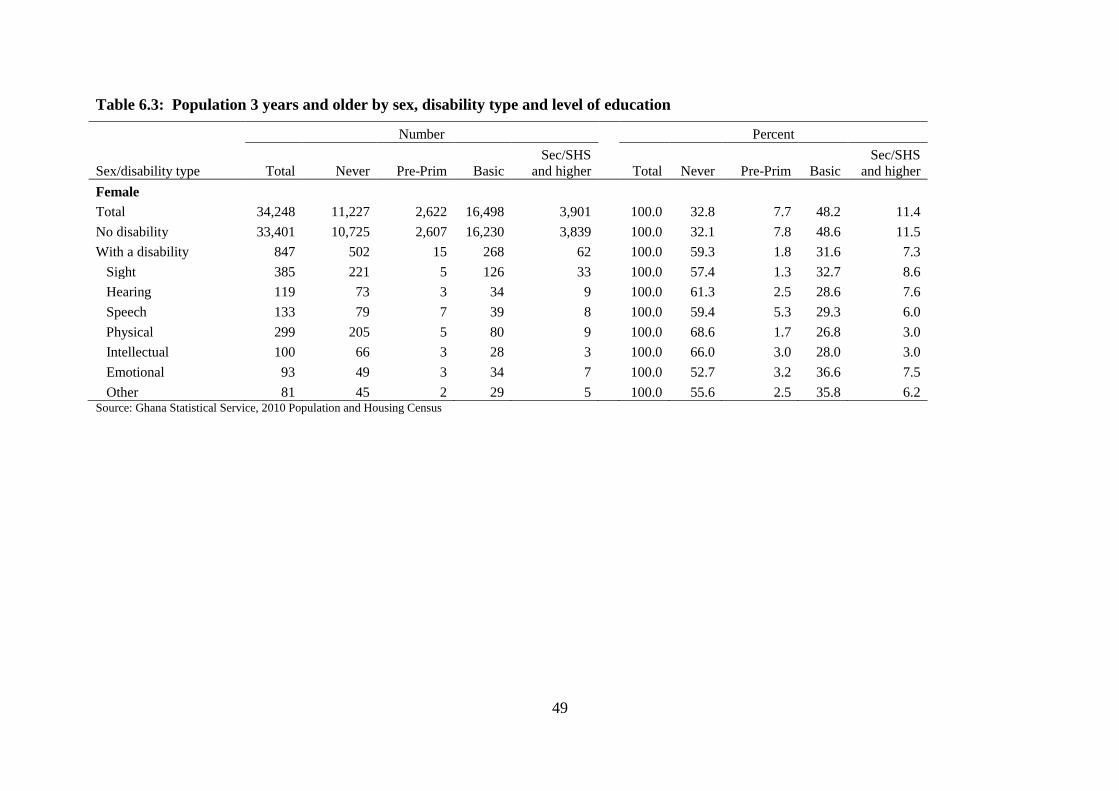
49
Table 6.3: Population 3 years and older by sex, disability type and level of education
Sex/disability type
Number Percent
Total Never Pre-Prim Basic
Sec/SHS
and higher
Total Never Pre-Prim Basic
Sec/SHS
and higher
Female
Total 34,248 11,227 2,622 16,498 3,901
100.0 32.8 7.7 48.2 11.4
No disability 33,401 10,725 2,607 16,230 3,839
100.0 32.1 7.8 48.6 11.5
With a disability 847 502 15 268 62
100.0 59.3 1.8 31.6 7.3
Sight 385 221 5 126 33
100.0 57.4 1.3 32.7 8.6
Hearing 119 73 3 34 9
100.0 61.3 2.5 28.6 7.6
Speech 133 79 7 39 8
100.0 59.4 5.3 29.3 6.0
Physical 299 205 5 80 9
100.0 68.6 1.7 26.8 3.0
Intellectual 100 66 3 28 3
100.0 66.0 3.0 28.0 3.0
Emotional 93 49 3 34 7
100.0 52.7 3.2 36.6 7.5
Other 81 45 2 29 5 100.0 55.6 2.5 35.8 6.2 Source: Ghana Statistical Service, 2010 Population and Housing Census
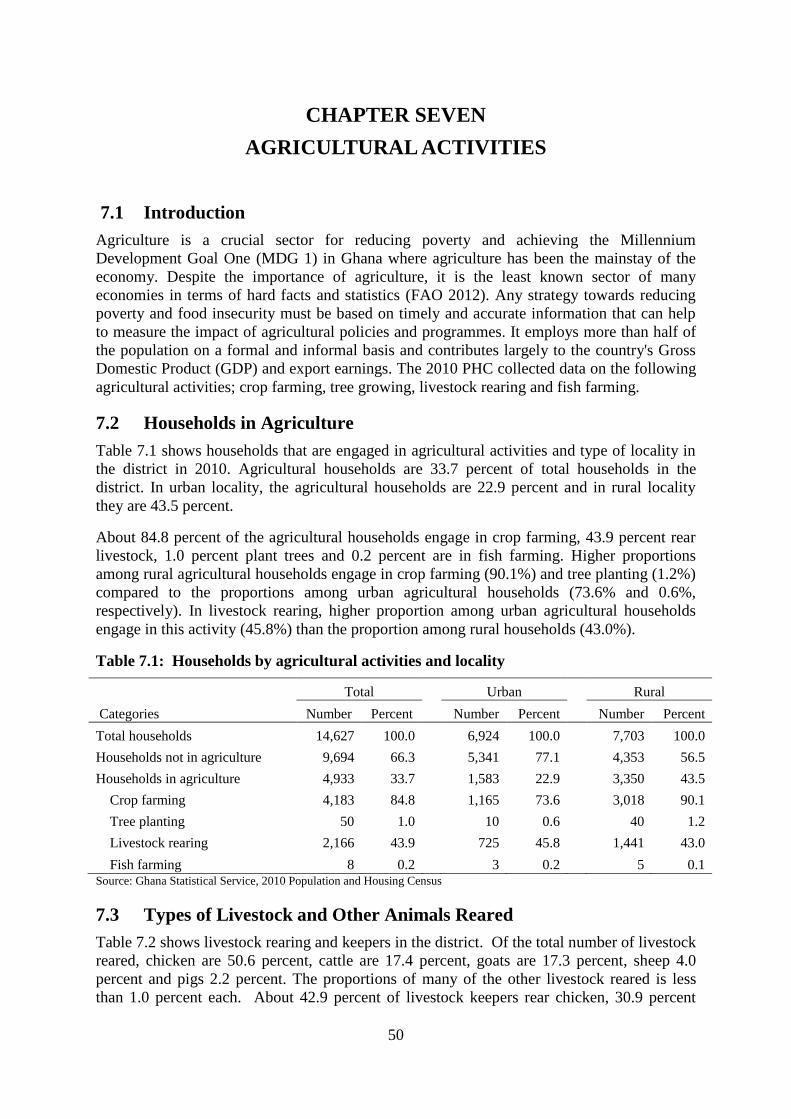
50
CHAPTER SEVEN
AGRICULTURAL ACTIVITIES
7.1 Introduction
Agriculture is a crucial sector for reducing poverty and achieving the Millennium
Development Goal One (MDG 1) in Ghana where agriculture has been the mainstay of the
economy. Despite the importance of agriculture, it is the least known sector of many
economies in terms of hard facts and statistics (FAO 2012). Any strategy towards reducing
poverty and food insecurity must be based on timely and accurate information that can help
to measure the impact of agricultural policies and programmes. It employs more than half of
the population on a formal and informal basis and contributes largely to the country's Gross
Domestic Product (GDP) and export earnings. The 2010 PHC collected data on the following
agricultural activities; crop farming, tree growing, livestock rearing and fish farming.
7.2 Households in Agriculture
Table 7.1 shows households that are engaged in agricultural activities and type of locality in
the district in 2010. Agricultural households are 33.7 percent of total households in the
district. In urban locality, the agricultural households are 22.9 percent and in rural locality
they are 43.5 percent.
About 84.8 percent of the agricultural households engage in crop farming, 43.9 percent rear
livestock, 1.0 percent plant trees and 0.2 percent are in fish farming. Higher proportions
among rural agricultural households engage in crop farming (90.1%) and tree planting (1.2%)
compared to the proportions among urban agricultural households (73.6% and 0.6%,
respectively). In livestock rearing, higher proportion among urban agricultural households
engage in this activity (45.8%) than the proportion among rural households (43.0%).
Table 7.1: Households by agricultural activities and locality
Categories
Total Urban Rural
Number Percent Number Percent Number Percent
Total households 14,627 100.0
6,924 100.0
7,703 100.0
Households not in agriculture 9,694 66.3
5,341 77.1
4,353 56.5
Households in agriculture 4,933 33.7
1,583 22.9
3,350 43.5
Crop farming 4,183 84.8
1,165 73.6
3,018 90.1
Tree planting 50 1.0
10 0.6
40 1.2
Livestock rearing 2,166 43.9
725 45.8
1,441 43.0
Fish farming 8 0.2 3 0.2 5 0.1 Source: Ghana Statistical Service, 2010 Population and Housing Census
7.3 Types of Livestock and Other Animals Reared
Table 7.2 shows livestock rearing and keepers in the district. Of the total number of livestock
reared, chicken are 50.6 percent, cattle are 17.4 percent, goats are 17.3 percent, sheep 4.0
percent and pigs 2.2 percent. The proportions of many of the other livestock reared is less
than 1.0 percent each. About 42.9 percent of livestock keepers rear chicken, 30.9 percent
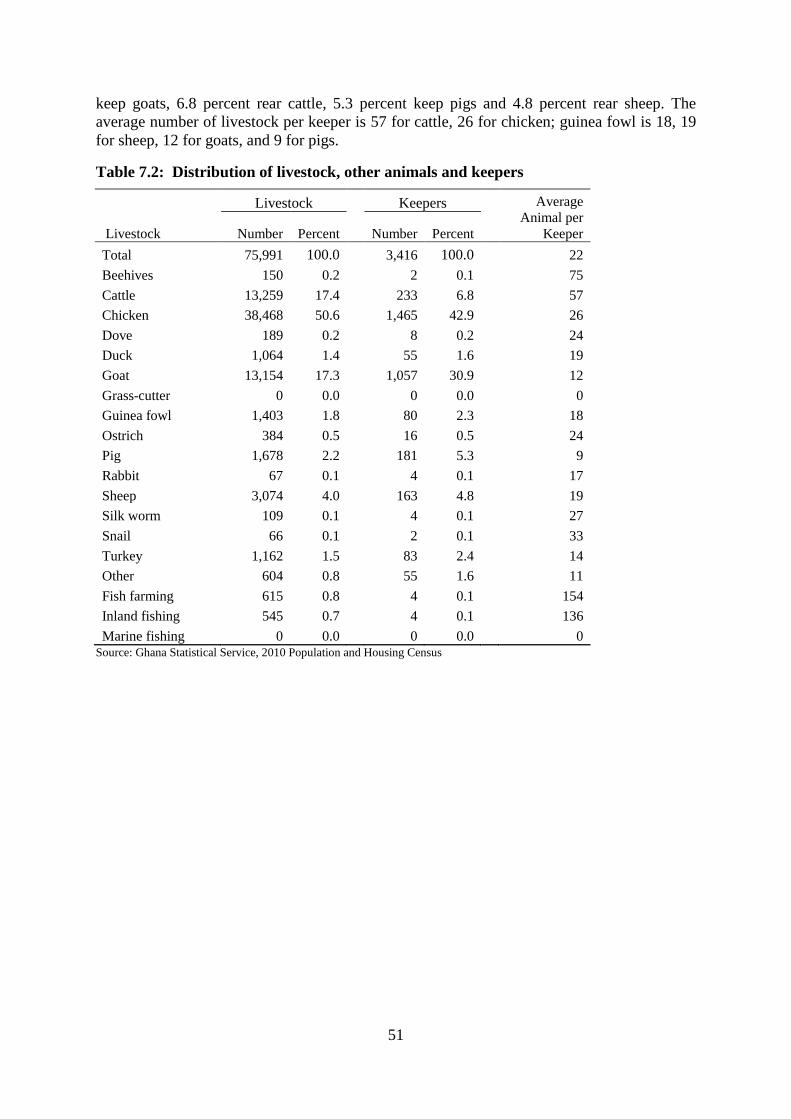
51
keep goats, 6.8 percent rear cattle, 5.3 percent keep pigs and 4.8 percent rear sheep. The
average number of livestock per keeper is 57 for cattle, 26 for chicken; guinea fowl is 18, 19
for sheep, 12 for goats, and 9 for pigs.
Table 7.2: Distribution of livestock, other animals and keepers
Livestock
Livestock Keepers Average
Animal per
Keeper Number Percent Number Percent
Total 75,991 100.0
3,416 100.0
22
Beehives 150 0.2
2 0.1
75
Cattle 13,259 17.4
233 6.8
57
Chicken 38,468 50.6
1,465 42.9
26
Dove 189 0.2
8 0.2
24
Duck 1,064 1.4
55 1.6
19
Goat 13,154 17.3
1,057 30.9
12
Grass-cutter 0 0.0
0 0.0
0
Guinea fowl 1,403 1.8
80 2.3
18
Ostrich 384 0.5
16 0.5
24
Pig 1,678 2.2
181 5.3
9
Rabbit 67 0.1
4 0.1
17
Sheep 3,074 4.0
163 4.8
19
Silk worm 109 0.1
4 0.1
27
Snail 66 0.1
2 0.1
33
Turkey 1,162 1.5
83 2.4
14
Other 604 0.8
55 1.6
11
Fish farming 615 0.8
4 0.1
154
Inland fishing 545 0.7
4 0.1
136
Marine fishing 0 0.0 0 0.0 0 Source: Ghana Statistical Service, 2010 Population and Housing Census
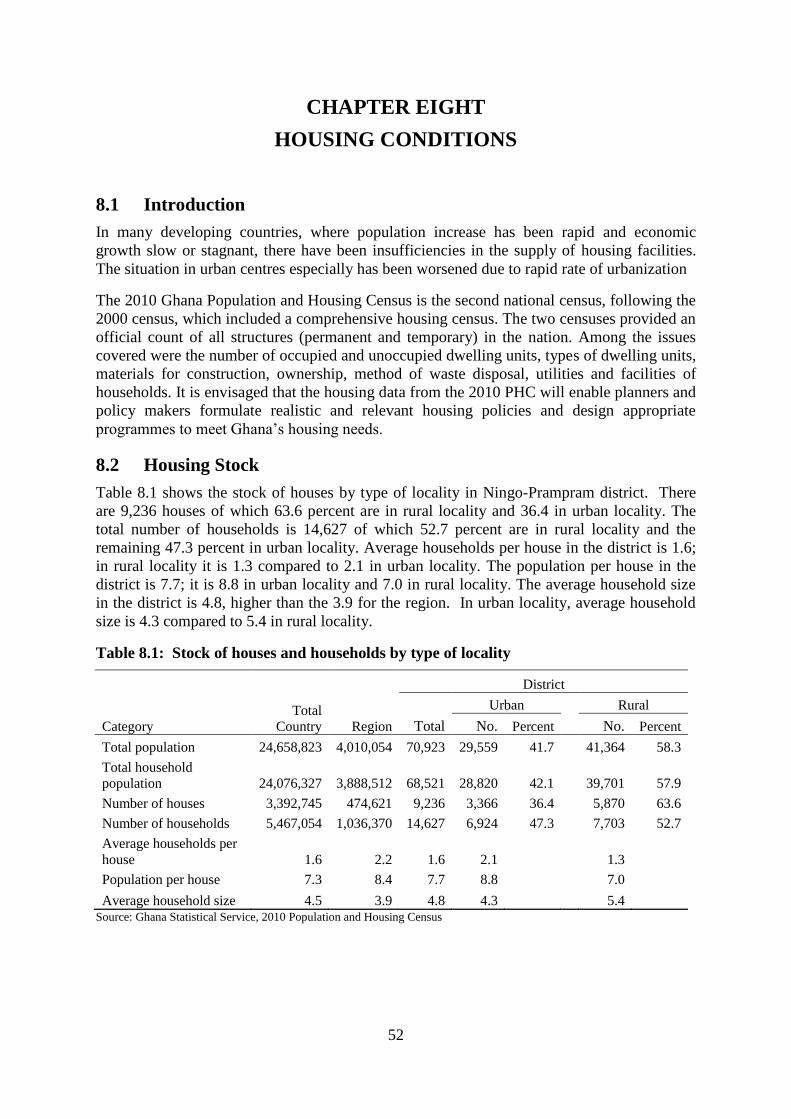
52
CHAPTER EIGHT
HOUSING CONDITIONS
8.1 Introduction
In many developing countries, where population increase has been rapid and economic
growth slow or stagnant, there have been insufficiencies in the supply of housing facilities.
The situation in urban centres especially has been worsened due to rapid rate of urbanization
The 2010 Ghana Population and Housing Census is the second national census, following the
2000 census, which included a comprehensive housing census. The two censuses provided an
official count of all structures (permanent and temporary) in the nation. Among the issues
covered were the number of occupied and unoccupied dwelling units, types of dwelling units,
materials for construction, ownership, method of waste disposal, utilities and facilities of
households. It is envisaged that the housing data from the 2010 PHC will enable planners and
policy makers formulate realistic and relevant housing policies and design appropriate
programmes to meet Ghana’s housing needs.
8.2 Housing Stock
Table 8.1 shows the stock of houses by type of locality in Ningo-Prampram district. There
are 9,236 houses of which 63.6 percent are in rural locality and 36.4 in urban locality. The
total number of households is 14,627 of which 52.7 percent are in rural locality and the
remaining 47.3 percent in urban locality. Average households per house in the district is 1.6;
in rural locality it is 1.3 compared to 2.1 in urban locality. The population per house in the
district is 7.7; it is 8.8 in urban locality and 7.0 in rural locality. The average household size
in the district is 4.8, higher than the 3.9 for the region. In urban locality, average household
size is 4.3 compared to 5.4 in rural locality.
Table 8.1: Stock of houses and households by type of locality
Category
Total
Country
District
Region Total
Urban
Rural
No. Percent No. Percent
Total population 24,658,823 4,010,054 70,923 29,559 41.7
41,364 58.3
Total household
population 24,076,327 3,888,512 68,521 28,820 42.1
39,701 57.9
Number of houses 3,392,745 474,621 9,236 3,366 36.4
5,870 63.6
Number of households 5,467,054 1,036,370 14,627 6,924 47.3
7,703 52.7
Average households per
house 1.6 2.2 1.6 2.1
1.3
Population per house 7.3 8.4 7.7 8.8
7.0
Average household size 4.5 3.9 4.8 4.3 5.4 Source: Ghana Statistical Service, 2010 Population and Housing Census
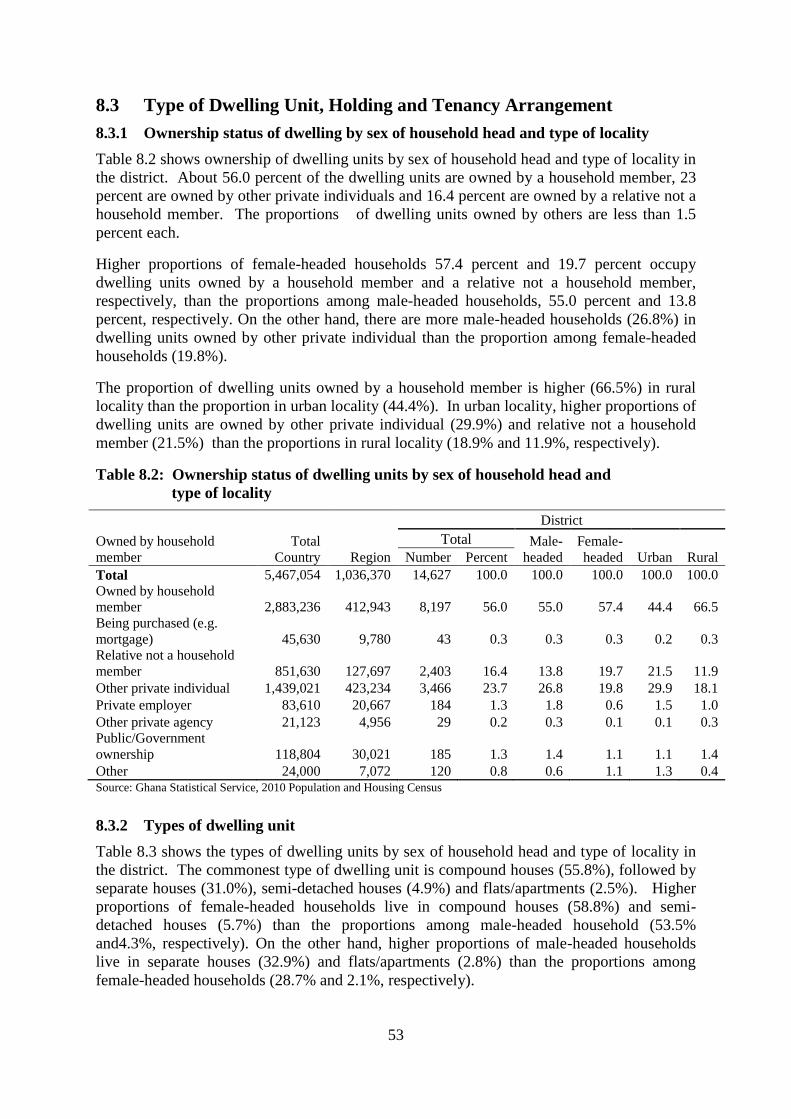
53
8.3 Type of Dwelling Unit, Holding and Tenancy Arrangement
8.3.1 Ownership status of dwelling by sex of household head and type of locality
Table 8.2 shows ownership of dwelling units by sex of household head and type of locality in
the district. About 56.0 percent of the dwelling units are owned by a household member, 23
percent are owned by other private individuals and 16.4 percent are owned by a relative not a
household member. The proportions of dwelling units owned by others are less than 1.5
percent each.
Higher proportions of female-headed households 57.4 percent and 19.7 percent occupy
dwelling units owned by a household member and a relative not a household member,
respectively, than the proportions among male-headed households, 55.0 percent and 13.8
percent, respectively. On the other hand, there are more male-headed households (26.8%) in
dwelling units owned by other private individual than the proportion among female-headed
households (19.8%).
The proportion of dwelling units owned by a household member is higher (66.5%) in rural
locality than the proportion in urban locality (44.4%). In urban locality, higher proportions of
dwelling units are owned by other private individual (29.9%) and relative not a household
member (21.5%) than the proportions in rural locality (18.9% and 11.9%, respectively).
Table 8.2: Ownership status of dwelling units by sex of household head and
type of locality
Total
Country
District
Owned by household
member Region
Total Male-
headed
Female-
headed Urban Rural Number Percent
Total 5,467,054 1,036,370 14,627 100.0 100.0 100.0 100.0 100.0
Owned by household
member 2,883,236 412,943 8,197 56.0 55.0 57.4 44.4 66.5
Being purchased (e.g.
mortgage) 45,630 9,780 43 0.3 0.3 0.3 0.2 0.3
Relative not a household
member 851,630 127,697 2,403 16.4 13.8 19.7 21.5 11.9
Other private individual 1,439,021 423,234 3,466 23.7 26.8 19.8 29.9 18.1
Private employer 83,610 20,667 184 1.3 1.8 0.6 1.5 1.0
Other private agency 21,123 4,956 29 0.2 0.3 0.1 0.1 0.3
Public/Government
ownership 118,804 30,021 185 1.3 1.4 1.1 1.1 1.4
Other 24,000 7,072 120 0.8 0.6 1.1 1.3 0.4 Source: Ghana Statistical Service, 2010 Population and Housing Census
8.3.2 Types of dwelling unit
Table 8.3 shows the types of dwelling units by sex of household head and type of locality in
the district. The commonest type of dwelling unit is compound houses (55.8%), followed by
separate houses (31.0%), semi-detached houses (4.9%) and flats/apartments (2.5%). Higher
proportions of female-headed households live in compound houses (58.8%) and semi-
detached houses (5.7%) than the proportions among male-headed household (53.5%
and4.3%, respectively). On the other hand, higher proportions of male-headed households
live in separate houses (32.9%) and flats/apartments (2.8%) than the proportions among
female-headed households (28.7% and 2.1%, respectively).
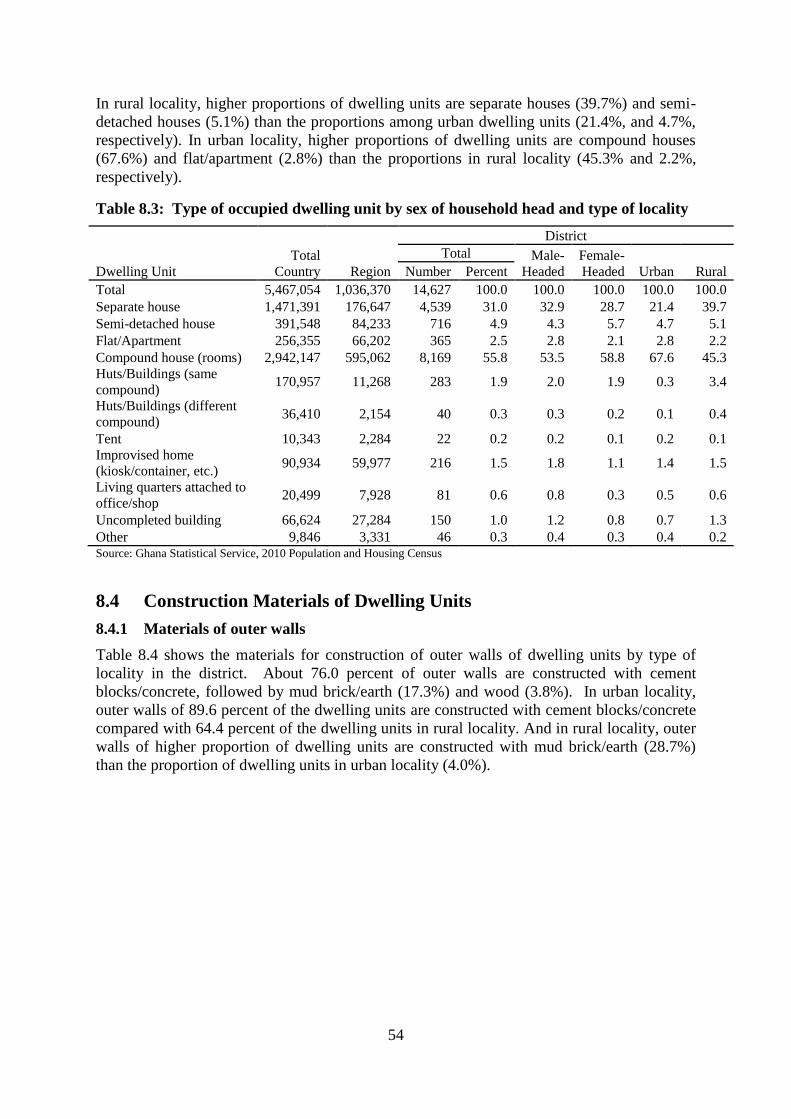
54
In rural locality, higher proportions of dwelling units are separate houses (39.7%) and semi-
detached houses (5.1%) than the proportions among urban dwelling units (21.4%, and 4.7%,
respectively). In urban locality, higher proportions of dwelling units are compound houses
(67.6%) and flat/apartment (2.8%) than the proportions in rural locality (45.3% and 2.2%,
respectively).
Table 8.3: Type of occupied dwelling unit by sex of household head and type of locality
Dwelling Unit
Total
Country Region
District
Total Male-
Headed
Female-
Headed Urban Number Percent Rural
Total 5,467,054 1,036,370 14,627 100.0 100.0 100.0 100.0 100.0
Separate house 1,471,391 176,647 4,539 31.0 32.9 28.7 21.4 39.7
Semi-detached house 391,548 84,233 716 4.9 4.3 5.7 4.7 5.1
Flat/Apartment 256,355 66,202 365 2.5 2.8 2.1 2.8 2.2
Compound house (rooms) 2,942,147 595,062 8,169 55.8 53.5 58.8 67.6 45.3
Huts/Buildings (same
compound) 170,957 11,268 283 1.9 2.0 1.9 0.3 3.4
Huts/Buildings (different
compound) 36,410 2,154 40 0.3 0.3 0.2 0.1 0.4
Tent 10,343 2,284 22 0.2 0.2 0.1 0.2 0.1
Improvised home
(kiosk/container, etc.) 90,934 59,977 216 1.5 1.8 1.1 1.4 1.5
Living quarters attached to
office/shop 20,499 7,928 81 0.6 0.8 0.3 0.5 0.6
Uncompleted building 66,624 27,284 150 1.0 1.2 0.8 0.7 1.3
Other 9,846 3,331 46 0.3 0.4 0.3 0.4 0.2 Source: Ghana Statistical Service, 2010 Population and Housing Census
8.4 Construction Materials of Dwelling Units
8.4.1 Materials of outer walls
Table 8.4 shows the materials for construction of outer walls of dwelling units by type of
locality in the district. About 76.0 percent of outer walls are constructed with cement
blocks/concrete, followed by mud brick/earth (17.3%) and wood (3.8%). In urban locality,
outer walls of 89.6 percent of the dwelling units are constructed with cement blocks/concrete
compared with 64.4 percent of the dwelling units in rural locality. And in rural locality, outer
walls of higher proportion of dwelling units are constructed with mud brick/earth (28.7%)
than the proportion of dwelling units in urban locality (4.0%).

55
Table 8.4: Construction material for outer walls of dwelling units by type of locality
Material for outer wall
Total
District
Total
Urban Rural Country Region Number Percent
All 5,817,607 1,090,397
16,062 100.0
100.0 100.0
Mud brick/earth 1,991,540 39,198
2,779 17.3
4.0 28.7
Wood 200,594 110,736
610 3.8
3.5 4.0
Metal sheet/slate/asbestos 43,708 14,038
139 0.9
0.7 1.0
Stone 11,330 2,692
40 0.2
0.2 0.3
Burnt bricks 38,237 3,981
47 0.3
0.3 0.3
Cement blocks/concrete 3,342,462 896,518
12,211 76.0
89.6 64.4
Landcrete 104,270 3,810
70 0.4
0.9 0.1
Bamboo 8,206 1,380
12 0.1
0.1 0.1
Palm leaf/thatch (grass)/raffia 38,054 1,806
29 0.2
0.1 0.2
Other 39,206 16,238 125 0.8 0.6 0.9 Source: Ghana Statistical Service, 2010 Population and Housing Census
8.4.2 Construction material for floor
Table 8.5 shows materials for construction of floors of dwelling units by type of locality in
the district. About 84.8 percent of floors are constructed with cement/concrete, for 9.2
percent of dwelling units earth/mud is used. In urban locality, cement/concrete is used for
floors of 92.3 percent of the dwelling units compared with 78.1 percent of dwelling units in
rural locality. In rural locality 15.3% of dwelling units used earth/mud for floors compared
with 2.5 percent of dwelling units in urban locality.
Table 8.5: Construction materials for floors of dwelling units by type of locality
Materials for floor
Total
Country Region
District
Total
Urban Rural Number Percent
All 5,467,054 1,036,370 14,582 100.0 100.0 100.0
Earth/mud 872,161 53,990 1,344 9.2 2.5 15.3
Cement/concrete 4,255,611 830,972 12,370 84.8 92.3 78.1
Stone 32,817 4,928 57 0.4 0.4 0.4
Burnt brick 6,537 1,996 9 0.1 0.1 0.1
Wood 52,856 38,877 109 0.7 0.7 0.8
Vinyl tiles 57,032 27,454 207 1.4 1.4 1.4
Ceramic/porcelain/granite/marble tiles 88,500 39,618 339 2.3 1.8 2.8
Terrazzo/terrazzo tiles 85,973 34,697 113 0.8 0.7 0.8
Other 15,567 3,838 34 0.2 0.2 0.3 Source: Ghana Statistical Service, 2010 Population and Housing Census
8.4.3 Roofing materials
Table 8.6 shows the materials for roofing dwelling units in the district by type of locality.
About 50.5 percent of the dwelling units are roofed with slate/asbestos, 36.9 percent are
roofed with metal sheets and 8.0 percent are roofed with thatch/palm leaf/raffia. In urban
locality, 70.4 percent of the dwelling units are roofed with slate/asbestos compared to 33.5
percent of dwelling units in rural locality. And, in rural locality higher proportions of the
dwelling units are roofed with metal sheets (47.4%) and thatch/palm leaf/raffia (134.7%)
than dwelling units in urban locality (24.6% and 8.0%, respectively).

56
Table 8.6: Construction material for roofing of dwelling units by type of locality
Roofing material
Total
Country Region
District
Total
Urban Rural Number Percent
All 5,817,607 1,090,397
16,062 100.0
100.0 100.0
Mud/Mud bricks/earth 80,644 3,162
78 0.5
0.1 0.8
Wood 45,547 8,895
67 0.4
0.4 0.4
Metal sheet 4,152,259 537,503
5,928 36.9
24.6 47.4
Slate/asbestos 759,039 454,300
8,115 50.5
70.4 33.5
Cement/concrete 141,072 41,671
250 1.6
1.3 1.8
Roofing tile 31,456 18,041
213 1.3
0.8 1.7
Bamboo 71,049 2,284
40 0.2
0.4 0.1
Thatch/palm leaf or raffia 500,606 16,797
1,289 8.0
1.4 13.7
Other 35,935 7,744 82 0.5 0.5 0.5 Source: Ghana Statistical Service, 2010 Population and Housing Census
8.5 Room Occupancy
The number of rooms available to households in dwelling units is an indication of sleeping
arrangement of household members. There are health and consequent wellbeing implications
of the household members. For example, some communicable diseases thrive in households
where sleeping rooms are crowded.
Table 8.7 shows the distribution of rooms by household size in dwelling units in the district.
About 55.8 percent of households occupy dwelling units with one sleeping room and the
proportion of households decreases steadily as the number of rooms occupied increases to 0.5
percent of households that occupy eight rooms, and the proportion increase to 0.8 percent for
households that occupy nine rooms and more.
With regard to households size, the proportion of households that occupy one room decreases
steadily as households size increases from 91.4 percent for one member household to 8.6
percent for 10+ member households. The proportion of households that occupy dwelling
units with two sleeping rooms increase steadily from 6.0 percent for one member households
to 37.0 percent for six member households and then declines steadily to 18.3 percent for 10+
member households. For dwelling units with 4 and more sleeping rooms, the proportion of
households who live in them decreases almost steadily as households size increases to 10+
member households.
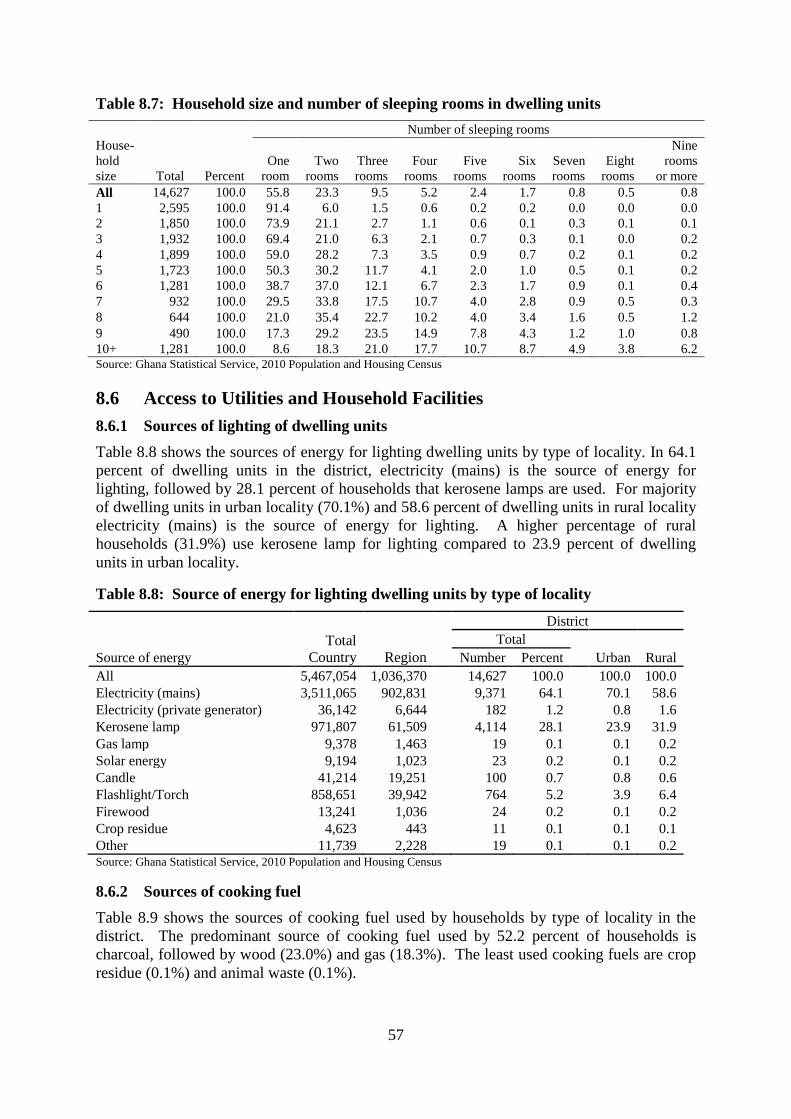
57
Table 8.7: Household size and number of sleeping rooms in dwelling units
House-
hold
size Total Percent
Number of sleeping rooms
One
room
Two
rooms
Three
rooms
Four
rooms
Five
rooms
Six
rooms
Seven
rooms
Eight
rooms
Nine
rooms
or more
All 14,627 100.0 55.8 23.3 9.5 5.2 2.4 1.7 0.8 0.5 0.8
1 2,595 100.0 91.4 6.0 1.5 0.6 0.2 0.2 0.0 0.0 0.0
2 1,850 100.0 73.9 21.1 2.7 1.1 0.6 0.1 0.3 0.1 0.1
3 1,932 100.0 69.4 21.0 6.3 2.1 0.7 0.3 0.1 0.0 0.2
4 1,899 100.0 59.0 28.2 7.3 3.5 0.9 0.7 0.2 0.1 0.2
5 1,723 100.0 50.3 30.2 11.7 4.1 2.0 1.0 0.5 0.1 0.2
6 1,281 100.0 38.7 37.0 12.1 6.7 2.3 1.7 0.9 0.1 0.4
7 932 100.0 29.5 33.8 17.5 10.7 4.0 2.8 0.9 0.5 0.3
8 644 100.0 21.0 35.4 22.7 10.2 4.0 3.4 1.6 0.5 1.2
9 490 100.0 17.3 29.2 23.5 14.9 7.8 4.3 1.2 1.0 0.8
10+ 1,281 100.0 8.6 18.3 21.0 17.7 10.7 8.7 4.9 3.8 6.2 Source: Ghana Statistical Service, 2010 Population and Housing Census
8.6 Access to Utilities and Household Facilities
8.6.1 Sources of lighting of dwelling units
Table 8.8 shows the sources of energy for lighting dwelling units by type of locality. In 64.1
percent of dwelling units in the district, electricity (mains) is the source of energy for
lighting, followed by 28.1 percent of households that kerosene lamps are used. For majority
of dwelling units in urban locality (70.1%) and 58.6 percent of dwelling units in rural locality
electricity (mains) is the source of energy for lighting. A higher percentage of rural
households (31.9%) use kerosene lamp for lighting compared to 23.9 percent of dwelling
units in urban locality.
Table 8.8: Source of energy for lighting dwelling units by type of locality
Source of energy
Total
Country Region
District
Total
Urban Rural Number Percent
All 5,467,054 1,036,370
14,627 100.0
100.0 100.0
Electricity (mains) 3,511,065 902,831
9,371 64.1
70.1 58.6
Electricity (private generator) 36,142 6,644
182 1.2
0.8 1.6
Kerosene lamp 971,807 61,509
4,114 28.1
23.9 31.9
Gas lamp 9,378 1,463
19 0.1
0.1 0.2
Solar energy 9,194 1,023
23 0.2
0.1 0.2
Candle 41,214 19,251
100 0.7
0.8 0.6
Flashlight/Torch 858,651 39,942
764 5.2
3.9 6.4
Firewood 13,241 1,036
24 0.2
0.1 0.2
Crop residue 4,623 443
11 0.1
0.1 0.1
Other 11,739 2,228 19 0.1 0.1 0.2 Source: Ghana Statistical Service, 2010 Population and Housing Census
8.6.2 Sources of cooking fuel
Table 8.9 shows the sources of cooking fuel used by households by type of locality in the
district. The predominant source of cooking fuel used by 52.2 percent of households is
charcoal, followed by wood (23.0%) and gas (18.3%). The least used cooking fuels are crop
residue (0.1%) and animal waste (0.1%).
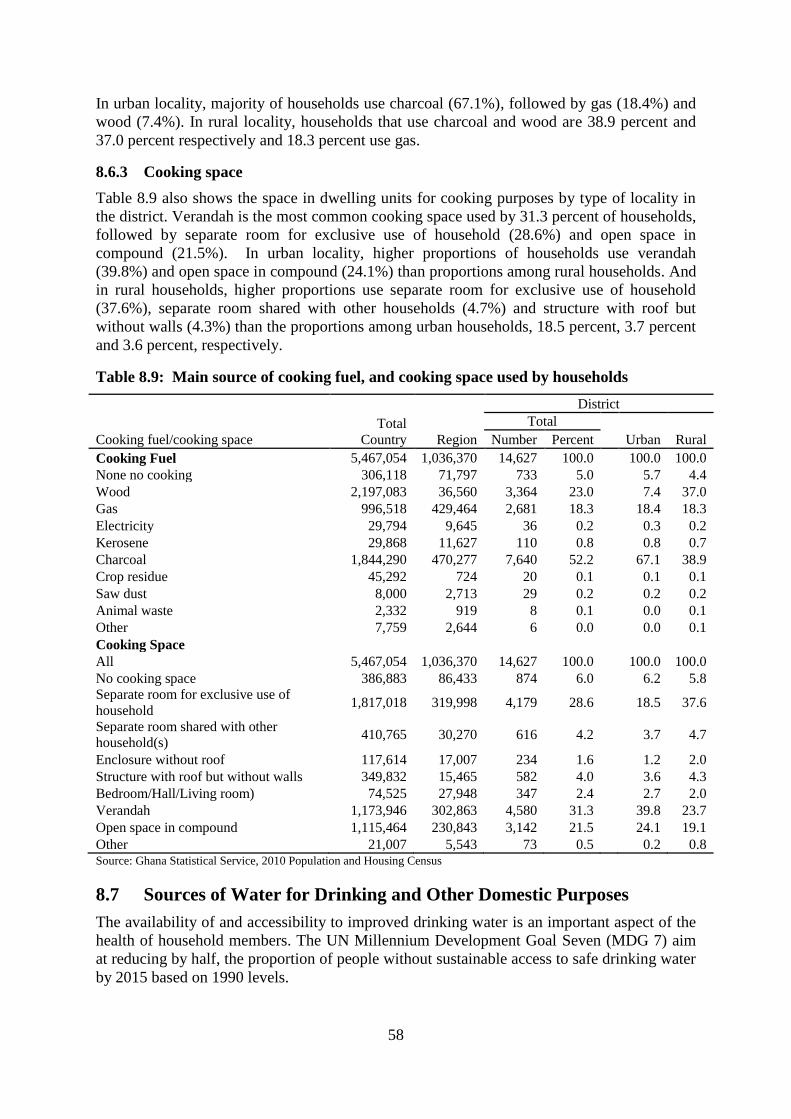
58
In urban locality, majority of households use charcoal (67.1%), followed by gas (18.4%) and
wood (7.4%). In rural locality, households that use charcoal and wood are 38.9 percent and
37.0 percent respectively and 18.3 percent use gas.
8.6.3 Cooking space
Table 8.9 also shows the space in dwelling units for cooking purposes by type of locality in
the district. Verandah is the most common cooking space used by 31.3 percent of households,
followed by separate room for exclusive use of household (28.6%) and open space in
compound (21.5%). In urban locality, higher proportions of households use verandah
(39.8%) and open space in compound (24.1%) than proportions among rural households. And
in rural households, higher proportions use separate room for exclusive use of household
(37.6%), separate room shared with other households (4.7%) and structure with roof but
without walls (4.3%) than the proportions among urban households, 18.5 percent, 3.7 percent
and 3.6 percent, respectively.
Table 8.9: Main source of cooking fuel, and cooking space used by households
Cooking fuel/cooking space
Total
Country Region
District
Total
Urban Rural Number Percent
Cooking Fuel 5,467,054 1,036,370 14,627 100.0
100.0 100.0
None no cooking 306,118 71,797 733 5.0
5.7 4.4
Wood 2,197,083 36,560 3,364 23.0
7.4 37.0
Gas 996,518 429,464 2,681 18.3
18.4 18.3
Electricity 29,794 9,645 36 0.2
0.3 0.2
Kerosene 29,868 11,627 110 0.8
0.8 0.7
Charcoal 1,844,290 470,277 7,640 52.2
67.1 38.9
Crop residue 45,292 724 20 0.1
0.1 0.1
Saw dust 8,000 2,713 29 0.2
0.2 0.2
Animal waste 2,332 919 8 0.1
0.0 0.1
Other 7,759 2,644 6 0.0
0.0 0.1
Cooking Space
All 5,467,054 1,036,370 14,627 100.0
100.0 100.0
No cooking space 386,883 86,433 874 6.0
6.2 5.8
Separate room for exclusive use of
household 1,817,018 319,998 4,179 28.6
18.5 37.6
Separate room shared with other
household(s) 410,765 30,270 616 4.2
3.7 4.7
Enclosure without roof 117,614 17,007 234 1.6
1.2 2.0
Structure with roof but without walls 349,832 15,465 582 4.0
3.6 4.3
Bedroom/Hall/Living room) 74,525 27,948 347 2.4
2.7 2.0
Verandah 1,173,946 302,863 4,580 31.3
39.8 23.7
Open space in compound 1,115,464 230,843 3,142 21.5
24.1 19.1
Other 21,007 5,543 73 0.5 0.2 0.8 Source: Ghana Statistical Service, 2010 Population and Housing Census
8.7 Sources of Water for Drinking and Other Domestic Purposes
The availability of and accessibility to improved drinking water is an important aspect of the
health of household members. The UN Millennium Development Goal Seven (MDG 7) aim
at reducing by half, the proportion of people without sustainable access to safe drinking water
by 2015 based on 1990 levels.

59
Water sources are often classified as ‘improved’ or ‘unimproved’: Sources considered as
improved are piped public water inside dwelling, public standpipe, borehole, protected (lined)
dug well, protected spring, and protected rainwater collection. Unimproved ones are
unprotected wells and springs, vendors, and tanker-trucks (WHO and UNICEF, 2000).
The purpose of good drinking water is to a large extent minimize the prevalence of water
borne diseases among household members. The source of drinking water is important
because water borne diseases are common in Ghana and members of households are better
off if they have access to good drinking water. For instance, one of the main health benefits
of clean drinking water supply is a reduction in diarrhea.
8.7.1 Sources of drinking water
Table 8.10 and Figure 8.1 show the sources of drinking water in the district. About 32.0
percent of households have access to pipe-borne water outside dwellings, 28.6 percent use
public tap/Standpipe, 14.6 percent use pipe borne water inside dwellings, 12.2 percent get
supply from tanker supply/ vendor provided and 6.6 percent from sachet water. The
proportions of household that get supply of drinking water from other sources are mostly less
than 0.5 percent and less,
In rural locality, higher proportions of households get drinking water from public
tap/standpipe (34.5%), pipe borne outside dwelling (32.6%), and pipe borne inside dwelling
(15.3%) than the proportions in urban locality (22.0%, 31.4% and 13.9%, respectively). In
urban locality, higher proportions of households get supply of drinking water from tanker
supply/vendor provided (18.7%), sachet water (8.9%) and protected well (3.4%) compared to
proportions of rural households (6.3%, 4.6% and 1.4%, respectively)
8.7.2 Source of water for other domestic uses
Table 8.7 also shows sources of water for other domestic use of households in the district.
About 33.2 percent use pipe-borne water outside dwelling 28.3 percent use public
tap/standpipes, 15.8 percent have access to pipe-borne inside their dwelling and 12.7 percent
use tanker supply/vendor provided water.
Among rural households, higher proportions use water from public tap/standpipe 32.3%),
pipe3borne inside dwelling (16.1%) and river/stream (2.6%) compared to proportions among
urban households (23.8%, 15.5% and 0.3%, respectively). In urban households, higher
proportions use pipe borne outside dwelling (33.5%), tanker supply / vendor provided
(19.4%) and protected well (3.9%) compared to proportions among rural households (33.0%,
6.7% and 1.8%, respectively).
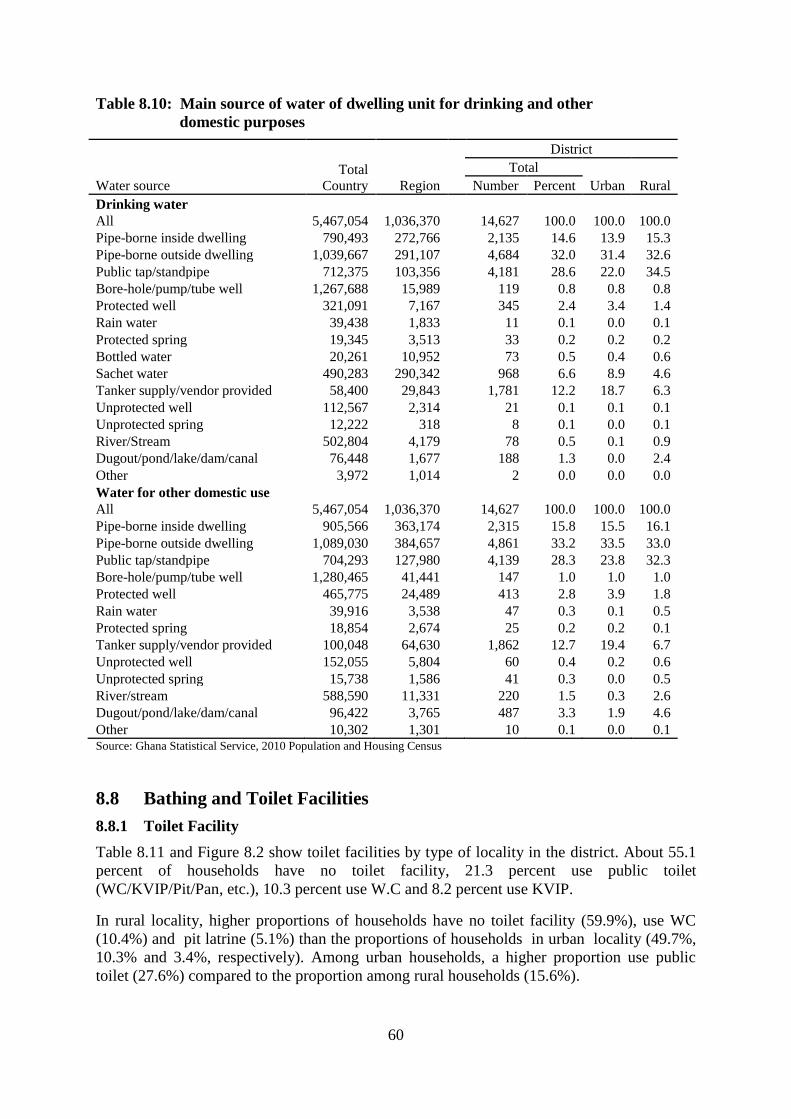
60
Table 8.10: Main source of water of dwelling unit for drinking and other
domestic purposes
Water source
Total
Country Region
District
Total
Urban Rural Number Percent
Drinking water
All 5,467,054 1,036,370
14,627 100.0 100.0 100.0
Pipe-borne inside dwelling 790,493 272,766
2,135 14.6 13.9 15.3
Pipe-borne outside dwelling 1,039,667 291,107
4,684 32.0 31.4 32.6
Public tap/standpipe 712,375 103,356
4,181 28.6 22.0 34.5
Bore-hole/pump/tube well 1,267,688 15,989
119 0.8 0.8 0.8
Protected well 321,091 7,167
345 2.4 3.4 1.4
Rain water 39,438 1,833
11 0.1 0.0 0.1
Protected spring 19,345 3,513
33 0.2 0.2 0.2
Bottled water 20,261 10,952
73 0.5 0.4 0.6
Sachet water 490,283 290,342
968 6.6 8.9 4.6
Tanker supply/vendor provided 58,400 29,843
1,781 12.2 18.7 6.3
Unprotected well 112,567 2,314
21 0.1 0.1 0.1
Unprotected spring 12,222 318
8 0.1 0.0 0.1
River/Stream 502,804 4,179
78 0.5 0.1 0.9
Dugout/pond/lake/dam/canal 76,448 1,677
188 1.3 0.0 2.4
Other 3,972 1,014
2 0.0 0.0 0.0
Water for other domestic use
All 5,467,054 1,036,370
14,627 100.0 100.0 100.0
Pipe-borne inside dwelling 905,566 363,174
2,315 15.8 15.5 16.1
Pipe-borne outside dwelling 1,089,030 384,657
4,861 33.2 33.5 33.0
Public tap/standpipe 704,293 127,980
4,139 28.3 23.8 32.3
Bore-hole/pump/tube well 1,280,465 41,441
147 1.0 1.0 1.0
Protected well 465,775 24,489
413 2.8 3.9 1.8
Rain water 39,916 3,538
47 0.3 0.1 0.5
Protected spring 18,854 2,674
25 0.2 0.2 0.1
Tanker supply/vendor provided 100,048 64,630
1,862 12.7 19.4 6.7
Unprotected well 152,055 5,804
60 0.4 0.2 0.6
Unprotected spring 15,738 1,586
41 0.3 0.0 0.5
River/stream 588,590 11,331
220 1.5 0.3 2.6
Dugout/pond/lake/dam/canal 96,422 3,765
487 3.3 1.9 4.6
Other 10,302 1,301 10 0.1 0.0 0.1 Source: Ghana Statistical Service, 2010 Population and Housing Census
8.8 Bathing and Toilet Facilities
8.8.1 Toilet Facility
Table 8.11 and Figure 8.2 show toilet facilities by type of locality in the district. About 55.1
percent of households have no toilet facility, 21.3 percent use public toilet
(WC/KVIP/Pit/Pan, etc.), 10.3 percent use W.C and 8.2 percent use KVIP.
In rural locality, higher proportions of households have no toilet facility (59.9%), use WC
(10.4%) and pit latrine (5.1%) than the proportions of households in urban locality (49.7%,
10.3% and 3.4%, respectively). Among urban households, a higher proportion use public
toilet (27.6%) compared to the proportion among rural households (15.6%).
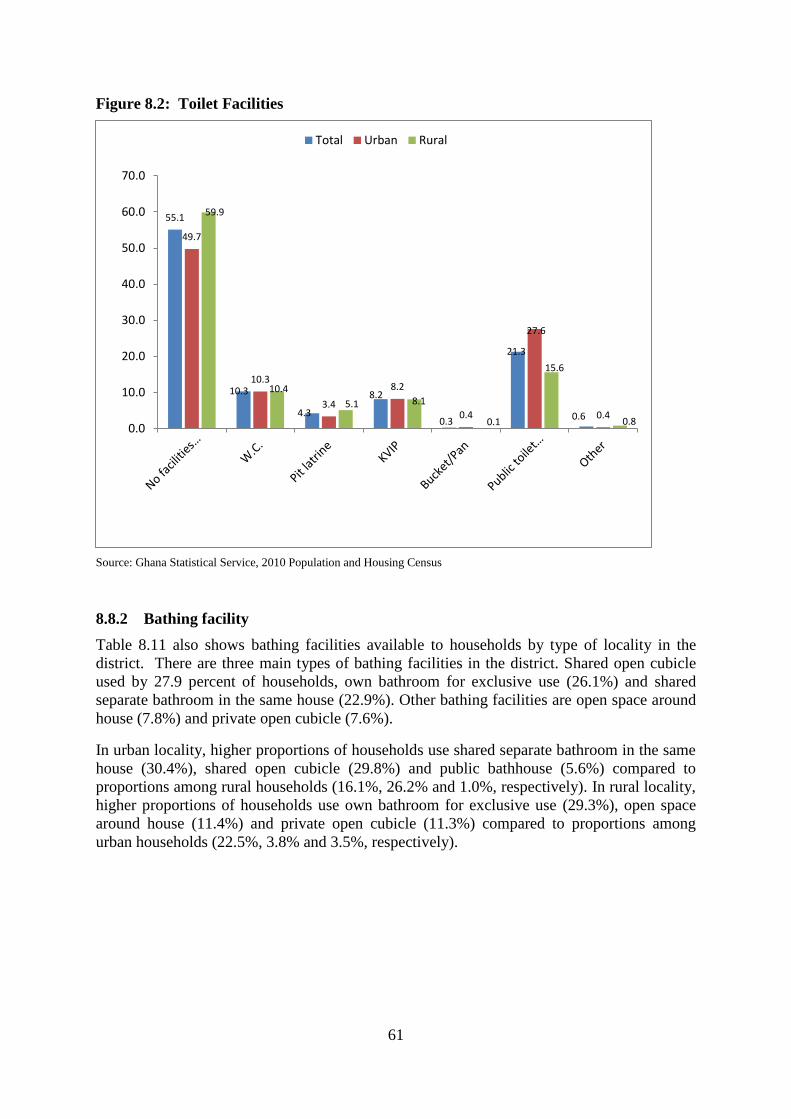
61
Figure 8.2: Toilet Facilities
Source: Ghana Statistical Service, 2010 Population and Housing Census
8.8.2 Bathing facility
Table 8.11 also shows bathing facilities available to households by type of locality in the
district. There are three main types of bathing facilities in the district. Shared open cubicle
used by 27.9 percent of households, own bathroom for exclusive use (26.1%) and shared
separate bathroom in the same house (22.9%). Other bathing facilities are open space around
house (7.8%) and private open cubicle (7.6%).
In urban locality, higher proportions of households use shared separate bathroom in the same
house (30.4%), shared open cubicle (29.8%) and public bathhouse (5.6%) compared to
proportions among rural households (16.1%, 26.2% and 1.0%, respectively). In rural locality,
higher proportions of households use own bathroom for exclusive use (29.3%), open space
around house (11.4%) and private open cubicle (11.3%) compared to proportions among
urban households (22.5%, 3.8% and 3.5%, respectively).
55.1
10.3
4.3
8.2
0.3
21.3
0.6
49.7
10.3
3.4
8.2
0.4
27.6
0.4
59.9
10.4
5.1 8.1
0.1
15.6
0.8 0.0
10.0
20.0
30.0
40.0
50.0
60.0
70.0
Total Urban Rural
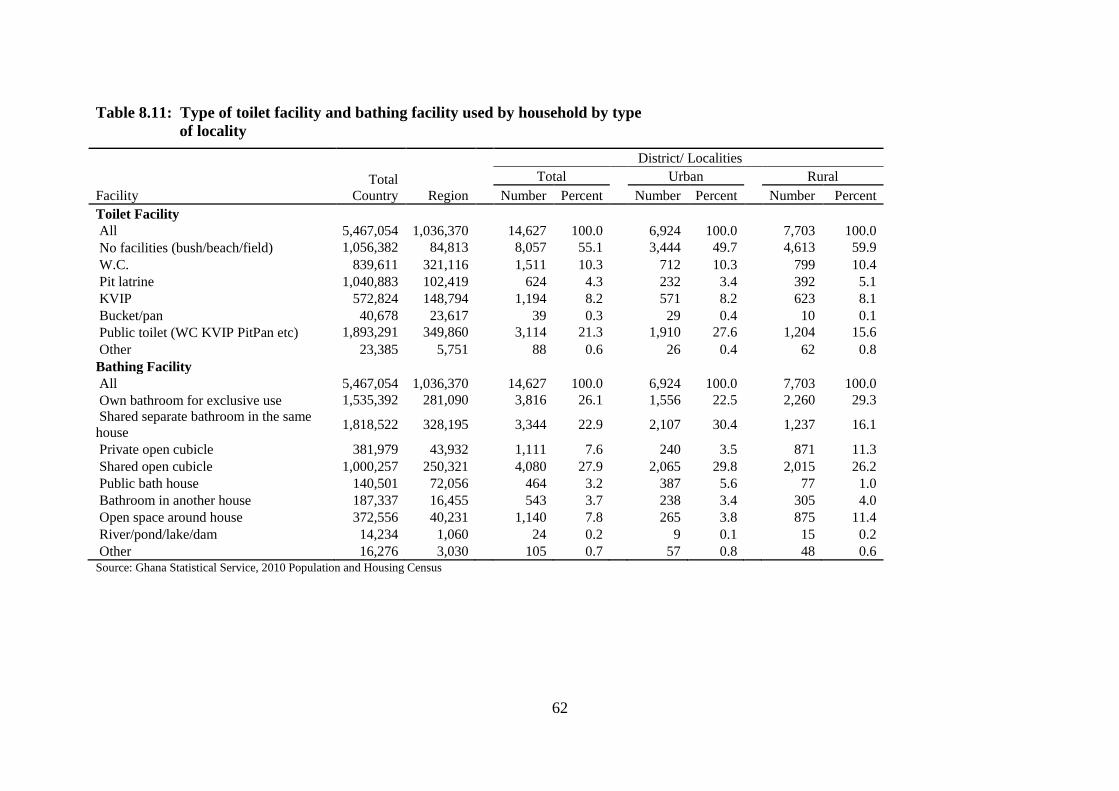
62
Table 8.11: Type of toilet facility and bathing facility used by household by type
of locality
Facility
Total
Country Region
District/ Localities
Total
Urban
Rural
Number Percent Number Percent Number Percent
Toilet Facility
All 5,467,054 1,036,370
14,627 100.0
6,924 100.0
7,703 100.0
No facilities (bush/beach/field) 1,056,382 84,813
8,057 55.1
3,444 49.7
4,613 59.9
W.C. 839,611 321,116
1,511 10.3
712 10.3
799 10.4
Pit latrine 1,040,883 102,419
624 4.3
232 3.4
392 5.1
KVIP 572,824 148,794
1,194 8.2
571 8.2
623 8.1
Bucket/pan 40,678 23,617
39 0.3
29 0.4
10 0.1
Public toilet (WC KVIP PitPan etc) 1,893,291 349,860
3,114 21.3
1,910 27.6
1,204 15.6
Other 23,385 5,751
88 0.6
26 0.4
62 0.8
Bathing Facility
All 5,467,054 1,036,370
14,627 100.0
6,924 100.0
7,703 100.0
Own bathroom for exclusive use 1,535,392 281,090
3,816 26.1
1,556 22.5
2,260 29.3
Shared separate bathroom in the same
house 1,818,522 328,195
3,344 22.9
2,107 30.4
1,237 16.1
Private open cubicle 381,979 43,932
1,111 7.6
240 3.5
871 11.3
Shared open cubicle 1,000,257 250,321
4,080 27.9
2,065 29.8
2,015 26.2
Public bath house 140,501 72,056
464 3.2
387 5.6
77 1.0
Bathroom in another house 187,337 16,455
543 3.7
238 3.4
305 4.0
Open space around house 372,556 40,231
1,140 7.8
265 3.8
875 11.4
River/pond/lake/dam 14,234 1,060
24 0.2
9 0.1
15 0.2
Other 16,276 3,030 105 0.7 57 0.8 48 0.6 Source: Ghana Statistical Service, 2010 Population and Housing Census
63
8.9 Methods of Waste Disposal
8.9.1 Solid waste disposal
Table 8.12 shows methods of households’ disposal of solid waste by type of locality in the
district. Nearly one third (32.3%) of households burn solid waste, 30.5 percent use public
dump (open space), 15.9 percent put in public dump (container), 4.4 percent have solid waste
collected and 2.9 percent of households bury solid waste.
In rural locality, higher proportions of households burn solid waste (39.5%), dump
indiscriminately (15.6%), have it collected (6.1%) and burn (4.5%) compared to the
proportions in urban locality (24.4%, 7.7%, 2.4% and 1.0%, respectively). And, in urban
locality, higher proportions of households put solid waste in public dump (open space)
(35.7%) and public dump (container) (26.4%) than the proportions among rural households
(25.9% and 6.6%, respectively).
8.9.2 Liquid waste disposal
Table 8.12 also shows methods of households’ disposal of liquid waste by type of locality in
the district in 2010. More than half (58.5%) of the households throw liquid waste onto the
compound, 26.9 percent throw onto the street/outside and 6.0 percent throw into gutter. In
rural locality, higher proportions of households throw liquid waste onto compound (59.5%)
and through sewerage system (3.6%) than the proportions among urban households (57.3%
and 2.1%, respectively). And in urban locality, higher proportions of households throw
liquid waste onto the street/outside (27.3%), throw into gutter (7.2%) and through drainage
system into gutter (4.1%) than the proportions among rural households (26.5%, 4.9% and
3.3%, respectively).
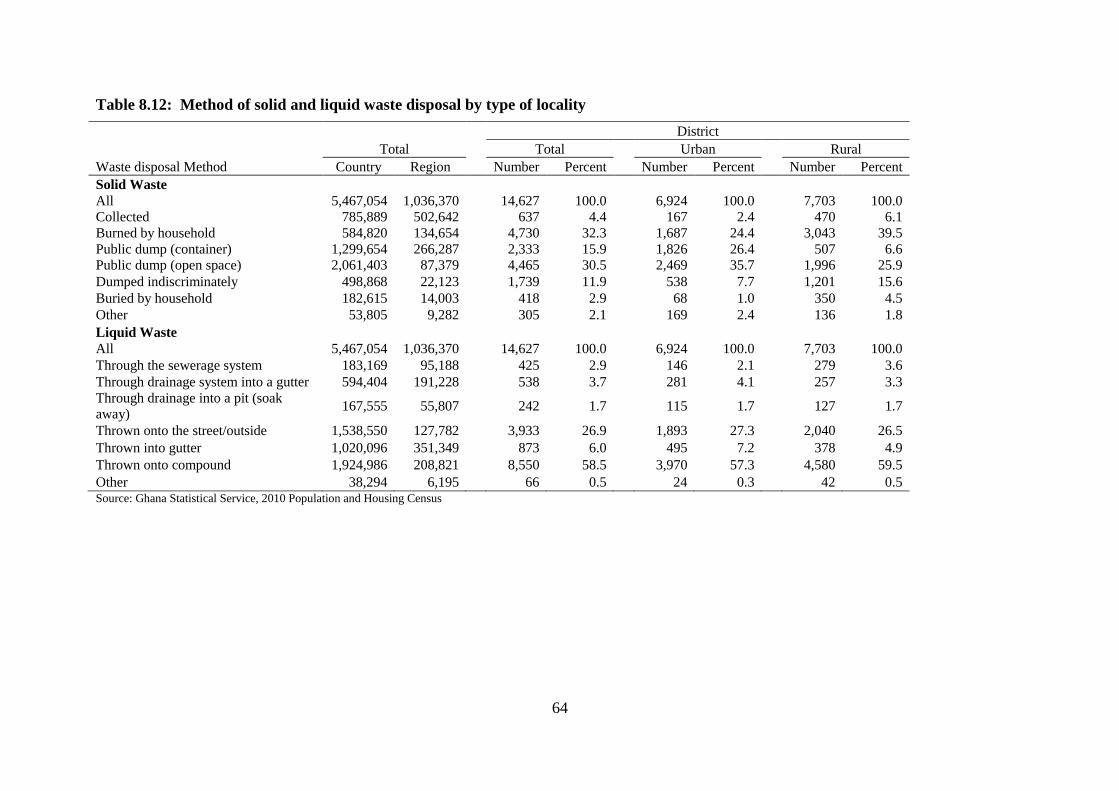
64
Table 8.12: Method of solid and liquid waste disposal by type of locality
Waste disposal Method
Total
District
Total
Urban
Rural
Country Region Number Percent Number Percent Number Percent
Solid Waste
All 5,467,054 1,036,370
14,627 100.0
6,924 100.0
7,703 100.0
Collected 785,889 502,642
637 4.4
167 2.4
470 6.1
Burned by household 584,820 134,654
4,730 32.3
1,687 24.4
3,043 39.5
Public dump (container) 1,299,654 266,287
2,333 15.9
1,826 26.4
507 6.6
Public dump (open space) 2,061,403 87,379
4,465 30.5
2,469 35.7
1,996 25.9
Dumped indiscriminately 498,868 22,123
1,739 11.9
538 7.7
1,201 15.6
Buried by household 182,615 14,003
418 2.9
68 1.0
350 4.5
Other 53,805 9,282
305 2.1
169 2.4
136 1.8
Liquid Waste
All 5,467,054 1,036,370
14,627 100.0
6,924 100.0
7,703 100.0
Through the sewerage system 183,169 95,188
425 2.9
146 2.1
279 3.6
Through drainage system into a gutter 594,404 191,228
538 3.7
281 4.1
257 3.3
Through drainage into a pit (soak
away) 167,555 55,807
242 1.7
115 1.7
127 1.7
Thrown onto the street/outside 1,538,550 127,782
3,933 26.9
1,893 27.3
2,040 26.5
Thrown into gutter 1,020,096 351,349
873 6.0
495 7.2
378 4.9
Thrown onto compound 1,924,986 208,821
8,550 58.5
3,970 57.3
4,580 59.5
Other 38,294 6,195 66 0.5 24 0.3 42 0.5 Source: Ghana Statistical Service, 2010 Population and Housing Census

65
CHAPTER NINE
SUMMARY OF FINDINGS AND POLICY
RECOMMENDATIONS
9.1 Introduction
The formulation and implementation of development policies are often driven by data. The
main objective for conducting the 2010 PHC is to provide the country with up-to-date socio-
economic data for planning and for evaluating the various government policy intervention
programmes at national, regional and district levels. The district specific demographic and
socio-economic information from the 2010 PHC is therefore to help inform the goals and
objectives of policies, targets to be achieved and strategies adopted for achieving such
targets. This chapter contains summary of findings of the 2010 PHC for Ningo-Prampram
district and policy recommendations.
9.2 Summary of Findings
9.2.1 Demographic characteristics
The Ningo-Prampram district covers a total land area of about 622.2 square kilometers. The
total population of the district is 70,923 out of which 41.7 percent are in urban locality the
remaining 58.3 percent in rural locality. This calls for more attention in the rural locality
since a greater portion of the population are there. The age group 0-4 years has the highest
population of 14.3 percent and age group 95-99 years has the lowest population of 0.1
percent. The sex ratio of the district is 89.6 that is for every 100 females, there are about 90
males.
More than half of the population (57%) of the district are in the economically active group
(15-64 years of age) and the age dependency ratio is 75.3.The total fertility rate is 2.8
children per woman, a general fertility rate is 82.3 birth per thousand women and a crude
birth rate is 22 per thousand live births. The crude death rate in the district is 7.8 per
thousand of population. About 36.8 percent of the population in the district are migrants,
with majority coming from Volta, Eastern and Central regions.
9.2.2 Social characteristics
The total household population is 68,521 out of the total District Population of 70,923. This
shows that the district has an institutional population of 2,402 persons or 3.4 percent.
Household members consist of children (37.9%), household heads (21.3%), grand children
(13.5%), other relatives (9.2%), and spouses (8.4%) among others. The high percentage of
children in the households is an indication of the high fertility of the population.
The proportion of the population who have never married is 40.1 percent and those married
are 39.0 percent, those in informal/consensual unions and the widowed are 10.3 percent and
5.5 percent, respectively. Nearly one third of those who have never married are employed and
slightly more than half of the widowed are also employed. Majority (94.3%) of the
population in the district are Ghanaians by birth, 2.1 percent have dual nationality and 0.7
percent are Ghanaians by naturalization. The proportion of foreign nationals is less than 3
percent.
66
Nearly ninety percent (86.1%) of the population are Christians, 6.5 percent have no religion
and 4.1 percent belong to the Islam religion.
About 47.5 of population 6 years and older are literate in English and Ghanaian language and
45.6 percent are literate in English only. Only a small proportion 0.5 percent are literate in
English and French.
Nearly half (48.3%) of those currently in school are in primary school. For past school
attendance, more females attended primary and JSS/JHS than their male counterparts.
9.2.3 Economic characteristics
About 66.8 percent of the population are economically active and 33.2 percent are
economically not active. Of the economically active population, 94.1 percent are employed
and 5.9 percent are unemployed.
The highest proportion of the employed population (88.0%) are in the age group 40-44 years,
followed by 87.8 percent in the 45-49 years age group. The highest proportion of the
economically not active population are in age group 15-19 years (76.3%), followed by 52.1
percent for those aged 65 years and older.
Skilled agricultural, forestry and fishery workers (28.5%), service and sales workers (24.0%)
and craft and related trades workers (21.8%) are the three major occupations in the district.
The three major industries with respect to employment of the population are agriculture,
forestry and fishing (29.0%), manufacturing (15.7%) and wholesale and retail, repair of
motor vehicles and motorcycles (17.9%).
In terms of employment status, 62.4 percent of the employed population are self-employed
without employees and 21.5 percent are employed. The private informal sector accounts for
85.0 percent of the employed population in the district.
9.2.4 Information Communication Technology
In the district, 52.9 percent of the population 12 years and older own mobile phones. More
males (60.2%) than females (46.7%) own mobile phones.
Only 8.7 percent of the population 12 years and older have access to internet facilities; the
proportions among males and females are 10.7 percent and 7.1 percent, respectively.
Only 0.5 percent of the households in the district have fixed telephone lines; 0.6 percent and
0.4 percent among male and female heads of households, respectively.
About 7.5 percent of households have desktop/laptop computers; the proportion of male-
headed and female-headed households are 9.5 percent and 5.0 percent, respectively).
9.2.5 Disability
Persons with disability are 1,499 or 2.1 percent of population aged 15 years and older; males
are 629 (1.9%) and females, 870 (2.3%). Sight is the most common disability type (42.9%),
among males they are 39.7 percent and among females they are 45.2 percent. Physical
disability is 34.2 percent in the district. The proportions of population by types of disability
are higher in rural locality than the proportions in urban locality with exception of physical
disability.
67
9.2.6 Agricultural activities
Agricultural households are 33.7 percent of total households in the district. About 67.9
percent of agricultural households are in rural locality and the remaining 32.1 percent are in
urban locality. About 84.8 percent of agricultural households engage in crop farming, 43.9
percent are in livestock rearing, 1.0 percent are in tree planting and0.2 percent engage in fish
farming. Of the households that are engaged in crop farming, 72.1% are in rural areas while
27.9% are in urban areas.
The highest proportion of livestock in the district is chicken (50.6%), followed by cattle
(17.4%), goats (17.3%), sheep (4.0%) and pigs (2.2%). About 42.9 percent of keepers handle
chicken, 30.9 percent keep goats, 6.8 percent rear cattle, 5.3 percent keep pigs and 4.8 percent
handle sheep. Average livestock per keeper is highest for cattle (57), followed by chicken
(26), sheep (19), guinea fowl (18), goats (12) and pigs (9).
9.2.7 Housing conditions
The total stock of houses in the Ningo-Prampram district is 9,236 of which 63.6 percent are
in rural locality and 36.4 percent in urban locality. Majority of houses are owned by a
household member (56.0%), followed by other private individual (23.7%) and relative not a
household member (16.4%).
Compound houses are the commonest type of dwelling units occupied by households in the
district (55.8%), followed by separate houses (31.0%) and semi-detached houses (4.9%). In
urban locality, compound houses are 67.6 percent and 45.3 percent in rural locality. Outer
walls of nearly eighty percent of houses in the district are constructed with cement
blocks/concrete, floors of 84.8 percent are constructed with cement / concrete and 50.5
percent are roofed with slate/asbestos.
More than half (55.8%) of households occupy dwelling units with one room. The proportion
of households that have two rooms is 23.3 percent and those that have six or more rooms is
less than 3 percent.
Nearly two thirds (64.1%) of households in the district use electricity (mains) as energy
source of lighting, 28.1 percent use kerosene lamps Seven out of every 10 households
(70.1%) in urban locality use electricity (mains) as source of energy for lighting and rural
locality 58.6 percent of households use this source.
The most common cooking fuel is charcoal used by 52.2 percent of households, followed by
wood (23.0%). The least used cooking fuels are crop residue and animal waste (0.1% of
households each).
Veranda is the most common cooking space in the district used by 31.3 percent of
households, followed by separate room for exclusive use of households (28.6%) and open
space in compound (21.5%).
For drinking water, about 32.0 percent of households have access to pipe-borne outside
dwelling, 28.6 percent use public tap/standpipe and 14.6 percent use water from pipe-borne
inside dwelling.
Water for domestic use, 33.2 percent of households have access to pipe-borne outside
dwelling, 28.3 percent use public tap/standpipe, 15.8 percent rely on pipe-borne inside
dwelling and 12.7 percent use tanker supply/vendor provided water.

68
Three main types of bathing facilities in the district are shared open cubicle used by percent
27.9 percent of households, own bathroom for exclusive use (26.1%) and shared separate
bathroom in the same house (22.9%).
More than half (55.1%) of households in Ningo-Prampram district have no toilet facility, 21.3
percent use public toilet (WC/KVIP/Pit/Pan, etc.) and 10.3 percent use W.C.
Nearly one third (32.3%) of households in the district burn solid waste, 30.5 percent use
public dump (open space), 15.9 percent use public dump (container) and 11.9 percent dump
sold waste indiscriminately.
More than half of households in the District (58.5%) throw liquid waste onto the compound,
26.9 percent throw onto the street/outside and 6.0 percent throw into gutter.
9.3 Policy Commendations
9.3.1 Demographic characteristics
The fertility rate of the district is 2.8 children per woman which is higher than the regional
fertility rate of 2.6. Therefore efforts should be made to bring down the fertility rate in order
to sustain developmental achievements. The district should also develop opportunities for the
youth in areas of education and job creation in order to reduce the total dependency ratio.
With an increasingly infants and aged population, more resources should be channelled to
health care facilities for infants and aged in the district. Focus should also be shifted to the
high mortality rate in the district to reduce it.
9.3.2 Social characteristics
Attention should gear towards creating and expanding economic and educational
opportunities for females in order for them to enhance their already important role in the
households.
The era of social and economic empowerment has largely influence the attitude of people in
marriage. The changes observed in the marital status should therefore be carefully researched
in order to develop useful programmes and policies.
9.3.3 Economic characteristics
Pragmatic, value-adding employment policy initiatives and actions are needed to address the
unemployment situation in the district. It is observed that a lot of people who are employed
mostly in the private sector have low levels of education. In order to promote scientific and
technology based agricultural workforce, a new outlook towards education will be required.
Both the central government and the local authorities need to increase their efforts to expand
modern technical and vocational education linked with practical apprenticeship programmes
involving employers to improve the levels of employment skills in the district
9.3.4 Information and Communication Technology
The analysis shows that (8.7%) of the population 12 years and older in the district use the
internet facility. This indicates that ICT usage is very low in the area. This low estimate must
be taken seriously considering the importance of computer and internet in teaching and
learning, information dissemination and many more. Private-public partnerships and other
interventions should be initiated to expand computer ownership and the use of internet in the
district. It is recommended that the Assembly should increase investment in ICT

69
infrastructure and services. The Government should assist the assembly in setting up internet
centers in public places. This would enable the population in the district to be linked to the
rest of the region, country and world.
9.3.5 Disability
The causes of sight and physical disabilities may be due to poor environmental conditions
and lack of immunization of children in the early years of age. The Assembly should
intensify immunization and sanitation campaigns to reach all persons in the desired ages. The
inclusion of disability questions in 2010 PHC is very crucial for evidence-based policy
formulation, planning, monitoring and evaluation of developmental goals and intervention
programmess. It will help policy makers at the regional and district levels to include
disability friendly features in both public and private structures.
9.3.6 Agricultural activities
Analysis under this chapter indicated that of the total households of 14,627 in the district,
number of households engaged in agriculture is 4,933. Agriculture should be made attractive
by ensuring increased incomes for persons engaged in the sector. Provision of roads that can
be used throughout the year to facilitate evacuation of farm produce to market centres would
reduce post-harvest losses and increase incomes for farmers. Increased incomes from the
sector would also make it an attractive option for new entrants into the labour market, and
thus reduce the unemployment rate. Appropriate farming equipment should also be provided
for farmers to till the land.
9.3.7 Housing conditions
One key finding with social and health implications is the poor nature of housing condition in
the district which confirms the relative poverty of the population. More than half of
households (55.8%) in the district use single room. This gives a picture of overcrowding,
which calls for interventions to revamp the housing system in the district.
An analysis of toilet and bathing facilities can be used to assess sanitary conditions and
poverty levels. The data on bathing and toilet facilities show that, together with revamping
the housing situation in the district, attention should be paid to provision of modern housing
facilities for bathing and toilet.
The usage of charcoal (52.2%) as the major sources of cooking fuel has negative implications
on the vegetation. It could lead to rapid deforestation if not addressed early enough. The use
of gas should be encouraged to curb the use of wood and charcoal.
70
REFERENCES
2010-2014 Medium Term Development Plan Ningo-Prampram District Assembly
Ghana Statistical Service (2013), 2010 Population and Housing Census, Eastern Region
Analytical Report, Accra
Ghana Statistical Service (2013), 2010 Population and Housing Census, National Analytical
Report, Accra
Ghana Statistical Service (2013), 2010 Population and Housing Census, Western Region
Analytical Report, Accra
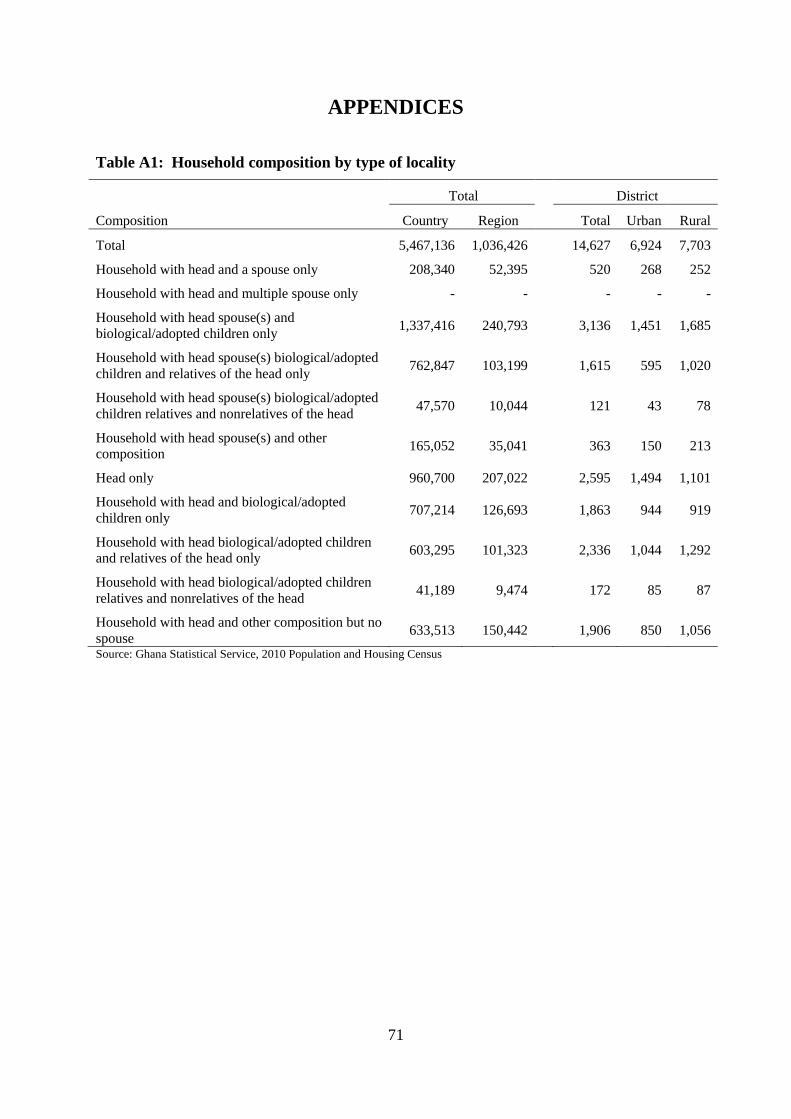
71
APPENDICES
Table A1: Household composition by type of locality
Composition
Total District
Country Region Total Urban Rural
Total 5,467,136 1,036,426
14,627 6,924 7,703
Household with head and a spouse only 208,340 52,395
520 268 252
Household with head and multiple spouse only - -
- - -
Household with head spouse(s) and
biological/adopted children only 1,337,416 240,793
3,136 1,451 1,685
Household with head spouse(s) biological/adopted
children and relatives of the head only 762,847 103,199
1,615 595 1,020
Household with head spouse(s) biological/adopted
children relatives and nonrelatives of the head 47,570 10,044
121 43 78
Household with head spouse(s) and other
composition 165,052 35,041
363 150 213
Head only 960,700 207,022
2,595 1,494 1,101
Household with head and biological/adopted
children only 707,214 126,693
1,863 944 919
Household with head biological/adopted children
and relatives of the head only 603,295 101,323
2,336 1,044 1,292
Household with head biological/adopted children
relatives and nonrelatives of the head 41,189 9,474
172 85 87
Household with head and other composition but no
spouse 633,513 150,442 1,906 850 1,056
Source: Ghana Statistical Service, 2010 Population and Housing Census
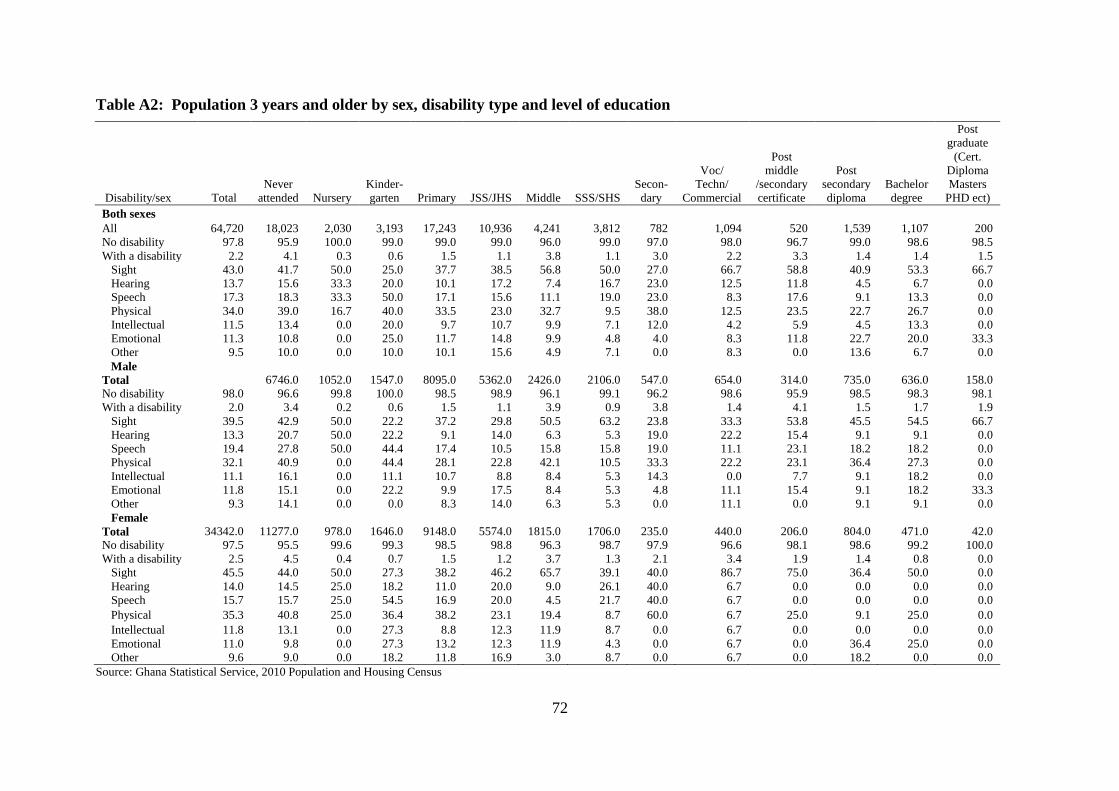
72
Table A2: Population 3 years and older by sex, disability type and level of education
Disability/sex Total
Never
attended Nursery
Kinder-
garten Primary JSS/JHS Middle SSS/SHS
Secon-
dary
Voc/
Techn/
Commercial
Post
middle
/secondary
certificate
Post
secondary
diploma
Bachelor
degree
Post
graduate
(Cert.
Diploma
Masters
PHD ect)
Both sexes
All 64,720 18,023 2,030 3,193 17,243 10,936 4,241 3,812 782 1,094 520 1,539 1,107 200
No disability 97.8 95.9 100.0 99.0 99.0 99.0 96.0 99.0 97.0 98.0 96.7 99.0 98.6 98.5
With a disability 2.2 4.1 0.3 0.6 1.5 1.1 3.8 1.1 3.0 2.2 3.3 1.4 1.4 1.5
Sight 43.0 41.7 50.0 25.0 37.7 38.5 56.8 50.0 27.0 66.7 58.8 40.9 53.3 66.7
Hearing 13.7 15.6 33.3 20.0 10.1 17.2 7.4 16.7 23.0 12.5 11.8 4.5 6.7 0.0
Speech 17.3 18.3 33.3 50.0 17.1 15.6 11.1 19.0 23.0 8.3 17.6 9.1 13.3 0.0
Physical 34.0 39.0 16.7 40.0 33.5 23.0 32.7 9.5 38.0 12.5 23.5 22.7 26.7 0.0
Intellectual 11.5 13.4 0.0 20.0 9.7 10.7 9.9 7.1 12.0 4.2 5.9 4.5 13.3 0.0
Emotional 11.3 10.8 0.0 25.0 11.7 14.8 9.9 4.8 4.0 8.3 11.8 22.7 20.0 33.3
Other 9.5 10.0 0.0 10.0 10.1 15.6 4.9 7.1 0.0 8.3 0.0 13.6 6.7 0.0
Male
Total
6746.0 1052.0 1547.0 8095.0 5362.0 2426.0 2106.0 547.0 654.0 314.0 735.0 636.0 158.0
No disability 98.0 96.6 99.8 100.0 98.5 98.9 96.1 99.1 96.2 98.6 95.9 98.5 98.3 98.1
With a disability 2.0 3.4 0.2 0.6 1.5 1.1 3.9 0.9 3.8 1.4 4.1 1.5 1.7 1.9
Sight 39.5 42.9 50.0 22.2 37.2 29.8 50.5 63.2 23.8 33.3 53.8 45.5 54.5 66.7
Hearing 13.3 20.7 50.0 22.2 9.1 14.0 6.3 5.3 19.0 22.2 15.4 9.1 9.1 0.0
Speech 19.4 27.8 50.0 44.4 17.4 10.5 15.8 15.8 19.0 11.1 23.1 18.2 18.2 0.0
Physical 32.1 40.9 0.0 44.4 28.1 22.8 42.1 10.5 33.3 22.2 23.1 36.4 27.3 0.0
Intellectual 11.1 16.1 0.0 11.1 10.7 8.8 8.4 5.3 14.3 0.0 7.7 9.1 18.2 0.0
Emotional 11.8 15.1 0.0 22.2 9.9 17.5 8.4 5.3 4.8 11.1 15.4 9.1 18.2 33.3
Other 9.3 14.1 0.0 0.0 8.3 14.0 6.3 5.3 0.0 11.1 0.0 9.1 9.1 0.0
Female
Total 34342.0 11277.0 978.0 1646.0 9148.0 5574.0 1815.0 1706.0 235.0 440.0 206.0 804.0 471.0 42.0
No disability 97.5 95.5 99.6 99.3 98.5 98.8 96.3 98.7 97.9 96.6 98.1 98.6 99.2 100.0
With a disability 2.5 4.5 0.4 0.7 1.5 1.2 3.7 1.3 2.1 3.4 1.9 1.4 0.8 0.0
Sight 45.5 44.0 50.0 27.3 38.2 46.2 65.7 39.1 40.0 86.7 75.0 36.4 50.0 0.0
Hearing 14.0 14.5 25.0 18.2 11.0 20.0 9.0 26.1 40.0 6.7 0.0 0.0 0.0 0.0
Speech 15.7 15.7 25.0 54.5 16.9 20.0 4.5 21.7 40.0 6.7 0.0 0.0 0.0 0.0
Physical 35.3 40.8 25.0 36.4 38.2 23.1 19.4 8.7 60.0 6.7 25.0 9.1 25.0 0.0
Intellectual 11.8 13.1 0.0 27.3 8.8 12.3 11.9 8.7 0.0 6.7 0.0 0.0 0.0 0.0
Emotional 11.0 9.8 0.0 27.3 13.2 12.3 11.9 4.3 0.0 6.7 0.0 36.4 25.0 0.0
Other 9.6 9.0 0.0 18.2 11.8 16.9 3.0 8.7 0.0 6.7 0.0 18.2 0.0 0.0
Source: Ghana Statistical Service, 2010 Population and Housing Census
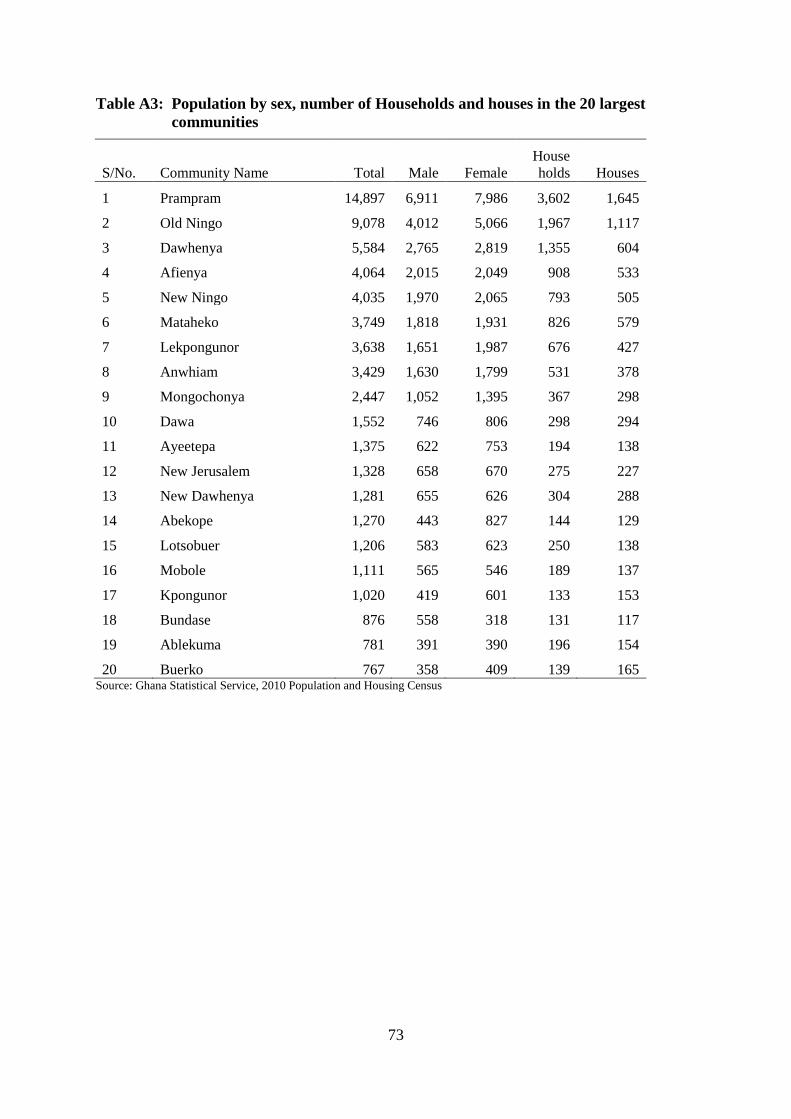
73
Table A3: Population by sex, number of Households and houses in the 20 largest
communities
S/No. Community Name Total Male Female House
holds Houses
1 Prampram 14,897 6,911 7,986 3,602 1,645
2 Old Ningo 9,078 4,012 5,066 1,967 1,117
3 Dawhenya 5,584 2,765 2,819 1,355 604
4 Afienya 4,064 2,015 2,049 908 533
5 New Ningo 4,035 1,970 2,065 793 505
6 Mataheko 3,749 1,818 1,931 826 579
7 Lekpongunor 3,638 1,651 1,987 676 427
8 Anwhiam 3,429 1,630 1,799 531 378
9 Mongochonya 2,447 1,052 1,395 367 298
10 Dawa 1,552 746 806 298 294
11 Ayeetepa 1,375 622 753 194 138
12 New Jerusalem 1,328 658 670 275 227
13 New Dawhenya 1,281 655 626 304 288
14 Abekope 1,270 443 827 144 129
15 Lotsobuer 1,206 583 623 250 138
16 Mobole 1,111 565 546 189 137
17 Kpongunor 1,020 419 601 133 153
18 Bundase 876 558 318 131 117
19 Ablekuma 781 391 390 196 154
20 Buerko 767 358 409 139 165 Source: Ghana Statistical Service, 2010 Population and Housing Census
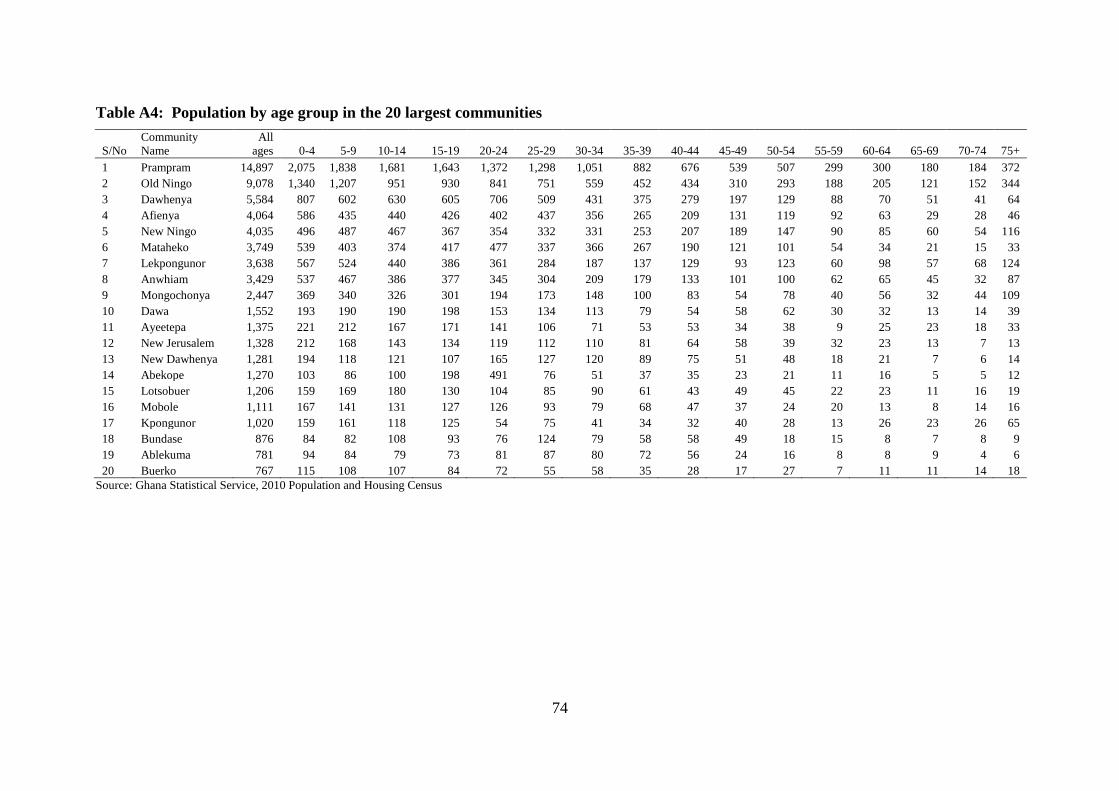
74
Table A4: Population by age group in the 20 largest communities
S/No
Community
Name
All
ages 0-4 5-9 10-14 15-19 20-24 25-29 30-34 35-39 40-44 45-49 50-54 55-59 60-64 65-69 70-74 75+
1 Prampram 14,897 2,075 1,838 1,681 1,643 1,372 1,298 1,051 882 676 539 507 299 300 180 184 372
2 Old Ningo 9,078 1,340 1,207 951 930 841 751 559 452 434 310 293 188 205 121 152 344
3 Dawhenya 5,584 807 602 630 605 706 509 431 375 279 197 129 88 70 51 41 64
4 Afienya 4,064 586 435 440 426 402 437 356 265 209 131 119 92 63 29 28 46
5 New Ningo 4,035 496 487 467 367 354 332 331 253 207 189 147 90 85 60 54 116
6 Mataheko 3,749 539 403 374 417 477 337 366 267 190 121 101 54 34 21 15 33
7 Lekpongunor 3,638 567 524 440 386 361 284 187 137 129 93 123 60 98 57 68 124
8 Anwhiam 3,429 537 467 386 377 345 304 209 179 133 101 100 62 65 45 32 87
9 Mongochonya 2,447 369 340 326 301 194 173 148 100 83 54 78 40 56 32 44 109
10 Dawa 1,552 193 190 190 198 153 134 113 79 54 58 62 30 32 13 14 39
11 Ayeetepa 1,375 221 212 167 171 141 106 71 53 53 34 38 9 25 23 18 33
12 New Jerusalem 1,328 212 168 143 134 119 112 110 81 64 58 39 32 23 13 7 13
13 New Dawhenya 1,281 194 118 121 107 165 127 120 89 75 51 48 18 21 7 6 14
14 Abekope 1,270 103 86 100 198 491 76 51 37 35 23 21 11 16 5 5 12
15 Lotsobuer 1,206 159 169 180 130 104 85 90 61 43 49 45 22 23 11 16 19
16 Mobole 1,111 167 141 131 127 126 93 79 68 47 37 24 20 13 8 14 16
17 Kpongunor 1,020 159 161 118 125 54 75 41 34 32 40 28 13 26 23 26 65
18 Bundase 876 84 82 108 93 76 124 79 58 58 49 18 15 8 7 8 9
19 Ablekuma 781 94 84 79 73 81 87 80 72 56 24 16 8 8 9 4 6
20 Buerko 767 115 108 107 84 72 55 58 35 28 17 27 7 11 11 14 18
Source: Ghana Statistical Service, 2010 Population and Housing Census
75
LIST OF CONTRIBUTORS
Project Secretariat
Dr. Philomena Nyarko, Government Statistician
Mr. Baah Wadieh, Deputy Government Statistician
Mr. David Yenukwa Kombat, Acting Census Coordinator
Mr. Sylvester Gyamfi, DISDAP Project Coordinator
Mrs. Abena A. Osei-Akoto, Data Processing
Mr. Rochester Appiah Kubi Boateng, Data Processing
Mrs. Jacqueline Anum, Data Processing
Mrs. Samilia Mintah, Data Processing
Mr. Yaw Misefa, Data Processing
Mr. Ernest Enyan, Data Processing
Mr. Christian Assem, Regional Statistician
Ms. Hanna Frempong Konadu, Formatting/Typesetting
Mrs. Hellen Ayitevie, Formatting/Typesetting
Ms. Margaret Hervie, Formatting/Typesetting
Writers
Damago Zubaida
Konde Jein Joshua
Consultant
Mrs. Edith Mote
Editor/ Reviewers
Prof. Kwabena Asomanin Anaman
Mr. Jeremiah Sixtus Dery