Embed Size (px)
Citation preview
Ninja: Towards Transparent Tracing and Debugging on ARM
Zhenyu Ning and Fengwei ZhangWayne State University
{zhenyu.ning, fengwei}@wayne.edu
Abstract
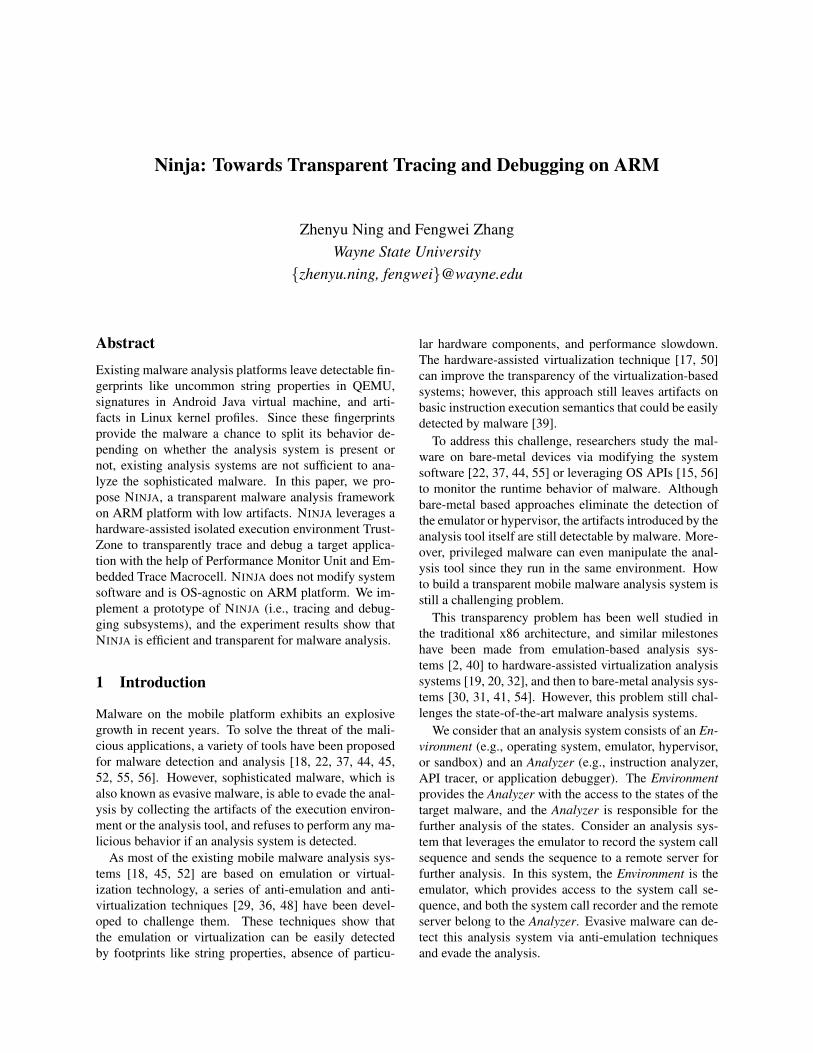
Existing malware analysis platforms leave detectable fin-gerprints like uncommon string properties in QEMU,signatures in Android Java virtual machine, and arti-facts in Linux kernel profiles. Since these fingerprintsprovide the malware a chance to split its behavior de-pending on whether the analysis system is present ornot, existing analysis systems are not sufficient to ana-lyze the sophisticated malware. In this paper, we pro-pose NINJA, a transparent malware analysis frameworkon ARM platform with low artifacts. NINJA leverages ahardware-assisted isolated execution environment Trust-Zone to transparently trace and debug a target applica-tion with the help of Performance Monitor Unit and Em-bedded Trace Macrocell. NINJA does not modify systemsoftware and is OS-agnostic on ARM platform. We im-plement a prototype of NINJA (i.e., tracing and debug-ging subsystems), and the experiment results show thatNINJA is efficient and transparent for malware analysis.
1 Introduction
Malware on the mobile platform exhibits an explosivegrowth in recent years. To solve the threat of the mali-cious applications, a variety of tools have been proposedfor malware detection and analysis [18, 22, 37, 44, 45,52, 55, 56]. However, sophisticated malware, which isalso known as evasive malware, is able to evade the anal-ysis by collecting the artifacts of the execution environ-ment or the analysis tool, and refuses to perform any ma-licious behavior if an analysis system is detected.
As most of the existing mobile malware analysis sys-tems [18, 45, 52] are based on emulation or virtual-ization technology, a series of anti-emulation and anti-virtualization techniques [29, 36, 48] have been devel-oped to challenge them. These techniques show thatthe emulation or virtualization can be easily detectedby footprints like string properties, absence of particu-
lar hardware components, and performance slowdown.The hardware-assisted virtualization technique [17, 50]can improve the transparency of the virtualization-basedsystems; however, this approach still leaves artifacts onbasic instruction execution semantics that could be easilydetected by malware [39].
To address this challenge, researchers study the mal-ware on bare-metal devices via modifying the systemsoftware [22, 37, 44, 55] or leveraging OS APIs [15, 56]to monitor the runtime behavior of malware. Althoughbare-metal based approaches eliminate the detection ofthe emulator or hypervisor, the artifacts introduced by theanalysis tool itself are still detectable by malware. More-over, privileged malware can even manipulate the anal-ysis tool since they run in the same environment. Howto build a transparent mobile malware analysis system isstill a challenging problem.
This transparency problem has been well studied inthe traditional x86 architecture, and similar milestoneshave been made from emulation-based analysis sys-tems [2, 40] to hardware-assisted virtualization analysissystems [19, 20, 32], and then to bare-metal analysis sys-tems [30, 31, 41, 54]. However, this problem still chal-lenges the state-of-the-art malware analysis systems.
We consider that an analysis system consists of an En-vironment (e.g., operating system, emulator, hypervisor,or sandbox) and an Analyzer (e.g., instruction analyzer,API tracer, or application debugger). The Environmentprovides the Analyzer with the access to the states of thetarget malware, and the Analyzer is responsible for thefurther analysis of the states. Consider an analysis sys-tem that leverages the emulator to record the system callsequence and sends the sequence to a remote server forfurther analysis. In this system, the Environment is theemulator, which provides access to the system call se-quence, and both the system call recorder and the remoteserver belong to the Analyzer. Evasive malware can de-tect this analysis system via anti-emulation techniquesand evade the analysis.
To build a transparent analysis system, we proposethree requirements. Firstly, the Environment must be iso-lated. Otherwise, the Environment itself can be manip-ulated by the malware. Secondly, the Environment ex-ists on an off-the-shelf (OTS) bare-metal platform with-out modifying the software or hardware (e.g., emulationand virtualization are not). Although studying the anti-emulation and anti-virtualization techniques [29, 36, 39,48] helps us to build a more transparent system by fix-ing the imperfections of the Environment, we considerperfect emulation or virtualization is impractical due tothe complexity of the software. Instead, if the Environ-ment already exists in the OTS bare-metal platform, mal-ware cannot detect the analysis system by the presence ofthe Environment. Finally, the Analyzer should not leaveany detectable footprints (e.g., files, memory, registers,or code) to the outside of the Environment. An Analyzerviolating this requirement can be detected.
In light of the three requirements, we present NINJA 1,a transparent malware analysis framework on ARM plat-form based on hardware features including TrustZonetechnology, Performance Monitoring Unit (PMU), andEmbedded Trace Macrocell (ETM). We implement aprototype of NINJA that embodies a trace subsystemwith different tracing granularities and a debug subsys-tem with a GDB-like debugging protocol on ARM Junodevelopment board. Additionally, hardware-based trapsand memory protection are leveraged to keep the use ofsystem registers transparent to the target application. Theexperimental results show that our framework can trans-parently monitor and analyze the behavior of the mal-ware samples. Moreover, NINJA introduces reasonableoverhead. We evaluate the performance of the trace sub-system with several popular benchmarks, and the resultshows that the overheads of the instruction trace and sys-tem call trace are less than 1% and the Android API traceintroduces 4 to 154 times slowdown.
The main contributions of this work include:
• We present a hardware-assisted analysis framework,named NINJA, on ARM platform with low artifacts.It does not rely on emulation, virtualization, or sys-tem software, and is OS-agnostic. NINJA residesin a hardware isolation execution environment, andthus is transparent to the analyzed malware.
• NINJA eliminates its footprints by novel techniquesincluding hardware traps, memory mapping inter-ception, and timer adjusting. The evaluation resultdemonstrates the effectiveness of the mitigation andNINJA achieves a high level of transparency. More-over, we evaluate the instruction-skid problem andshow that it has little influence on our system.
1A NINJA in feudal Japan has invisibility and transparency ability
EL0Applications
EL1Rich OS
EL2Hypervisor
Non-Secure state
EL0Applications
EL1Secure OS
EL3Secure monitor
Secure state
ARMv7 modes and PLs64-bit ARMv8 Exception Levels
usr mode (PL0)
fiq/irq/svc/abt/und/sys mode (PL1)
fiq/irq/svc/mon/abt/und/sys mode (PL3)
hyp mode (PL2)
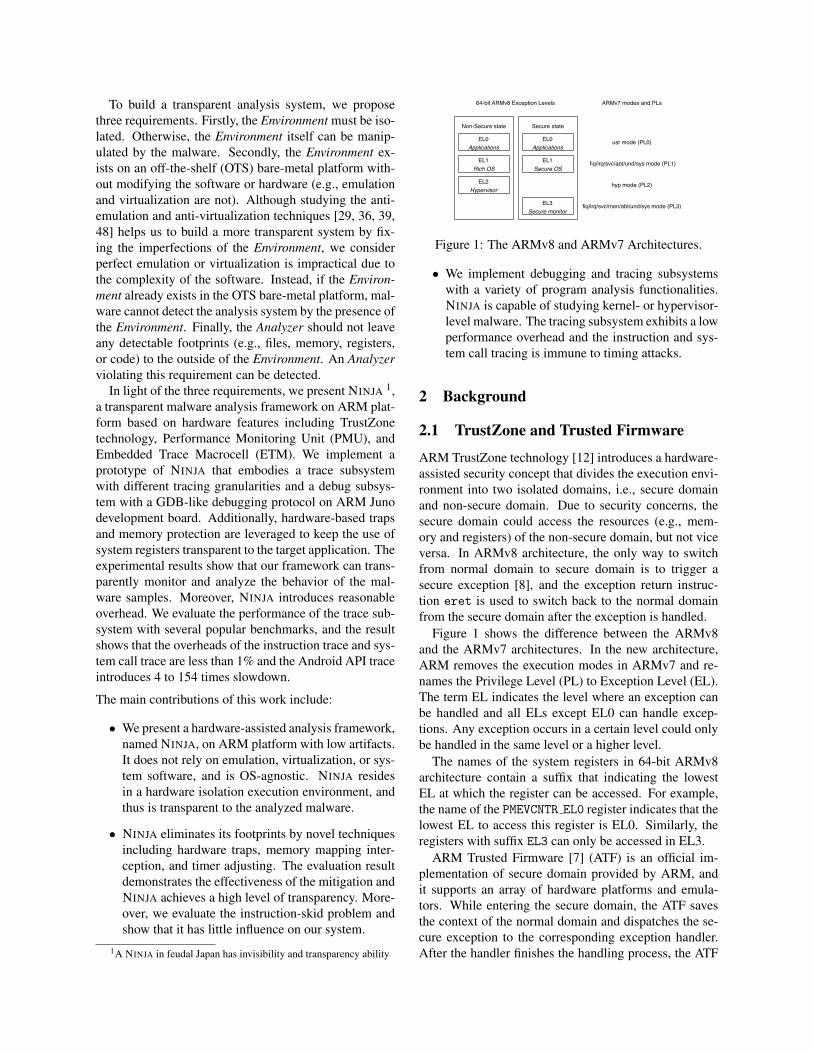
Figure 1: The ARMv8 and ARMv7 Architectures.
• We implement debugging and tracing subsystemswith a variety of program analysis functionalities.NINJA is capable of studying kernel- or hypervisor-level malware. The tracing subsystem exhibits a lowperformance overhead and the instruction and sys-tem call tracing is immune to timing attacks.
2 Background
2.1 TrustZone and Trusted Firmware
ARM TrustZone technology [12] introduces a hardware-assisted security concept that divides the execution envi-ronment into two isolated domains, i.e., secure domainand non-secure domain. Due to security concerns, thesecure domain could access the resources (e.g., mem-ory and registers) of the non-secure domain, but not viceversa. In ARMv8 architecture, the only way to switchfrom normal domain to secure domain is to trigger asecure exception [8], and the exception return instruc-tion eret is used to switch back to the normal domainfrom the secure domain after the exception is handled.
Figure 1 shows the difference between the ARMv8and the ARMv7 architectures. In the new architecture,ARM removes the execution modes in ARMv7 and re-names the Privilege Level (PL) to Exception Level (EL).The term EL indicates the level where an exception canbe handled and all ELs except EL0 can handle excep-tions. Any exception occurs in a certain level could onlybe handled in the same level or a higher level.
The names of the system registers in 64-bit ARMv8architecture contain a suffix that indicating the lowestEL at which the register can be accessed. For example,the name of the PMEVCNTR EL0 register indicates that thelowest EL to access this register is EL0. Similarly, theregisters with suffix EL3 can only be accessed in EL3.
ARM Trusted Firmware [7] (ATF) is an official im-plementation of secure domain provided by ARM, andit supports an array of hardware platforms and emula-tors. While entering the secure domain, the ATF savesthe context of the normal domain and dispatches the se-cure exception to the corresponding exception handler.After the handler finishes the handling process, the ATF

restores the context of the normal domain and switchesback with eret instruction. ATF also provides a trustedboot path by authenticating the firmware image with sev-eral approaches like signatures and public keys.
2.2 PMU and ETMThe Performance Monitors Unit (PMU) [8] is a fea-ture widely implemented in both x86 and ARM architec-tures [42], which leverages a set of performance counterregisters to calculate CPU events. Each architecturespecifies a list of common events by event numbers,and different CPUs may also maintain additional eventnumbers. A Performance Monitor Interrupt (PMI) canbe triggered while a performance counter register over-flows. Note that the PMU is a non-invasive debug featurethat does not affect the performance of the CPU.
The Embedded Trace Macrocell (ETM) [11] is anothernon-invasive debug component in ARM architecture. Ittraces instructions and data by monitoring instructionand data buses with low performance impact. Actually,ARM expects that ETM has no effect on the functionalperformance of the processor. The ETM generates anelement for executed signpost instructions that could befurther used to reconstruct all the executed instructions.The generated elements are encoded into a trace streamand sent to a pre-allocated buffer on the chip.
According to Futuremark [23], 21 of the most popu-lar 50 smartphones and tablets are equipped with ARMCortex-A5x or Cortex-A7x series processors, in whichthe PMU and ETM components are included.
3 Related Work
3.1 Transparent Malware Analysis on x86Ether [20] leverages hardware virtualization to build amalware analysis system and achieves high transparency.Spider [19] is also based on hardware virtualization, andit focuses on both applicability and transparency whileusing memory page instrument to gain higher efficiency.Since the hardware virtualization has transparency is-sues, these systems are naturally not transparent. LO-PHI [41] leverages additional hardware sensors to moni-tor the disk operation and periodically poll memory snap-shots, and it achieves a higher transparency at the cost ofincomplete view of system states.
MalT [54] increases the transparency by involvingSystem Manage Mode (SMM), a special CPU mode inx86 architecture. It leverages PMU to monitor the pro-gram execution and switch into SMM for analysis. Com-paring with MalT, NINJA improves in the following as-pects: 1) The PMU registers on MalT are accessible byprivileged malware, which breaks the transparency by
checking the values of these registers. By leveragingTrustZone technology, NINJA configures needed PMUregisters as secure ones so that even the privileged mal-ware in the normal domain cannot access them. 2) MalTis built on SMM. However, SMM is not designed for se-curity purpose such as transparent debugging (originallyfor power management); frequent CPU mode switchingintroduces a high performance overhead (12 µs is re-quired for a SMM switch [54]). NINJA is based on Trust-Zone, a dedicated security extension on ARM. The do-main switching only needs 0.34 µs (see Appendix B). 3)Besides a debugging system, NINJA develops a transpar-ent tracing system with existing hardware. The instruc-tion and system call tracing introduce negligible over-head, which is immune to timing attacks while MalT suf-fers from external timing attack.
BareCloud [31] and MalGene [30] focus on detect-ing evasive malware by executing malware in differentenvironments and comparing their behavior. There arelimitations to this approach. Firstly, it fails to transpar-ently fetch the malware runtime behavior (e.g., systemcalls and modifications to memory/registers) on a bare-metal environment. Secondly, it assumes that the eva-sive malware shows the malicious behavior in at leastone of the analysis platforms. However, sophisticatedmalware may be able to detect all the analysis platformsand refuse to exhibit any malicious behavior during theanalysis. Lastly, after these tools identify the evasivemalware from the large-scale malware samples, they stillneed a transparent malware analysis tool which is able toanalyze these evasive samples transparently. NINJA pro-vides a transparent framework to study the evasive mal-ware and plays a complementary role for these systems.
3.2 Dynamic Analysis Tools on ARM
Emulation-based systems. DroidScope [52] rebuildsthe semantic information of both the Android OS andthe Dalvik virtual machine based on QEMU. Copper-Droid [45] is a VMI-based analysis tool that automati-cally reconstructs the behavior of Android malware in-cluding inter-process communication (IPC) and remoteprocedure call interaction. DroidScibe [18] uses Cop-perDroid [45] to collect behavior profiles of Androidmalware, and automatically classifies them into differ-ent families. Since the emulator leaves footprints, thesesystems are natural not transparent.Hardware virtualization. Xen on ARM [50] mi-grates the hardware virtualization based hypervisor Xento ARM architecture and makes the analysis basedon hardware virtualization feasible on mobile devices.KVM/ARM [17] uses standard Linux components to im-prove the performance of the hypervisor. Although thehardware virtualization based solution is considered to
be more transparent than the emulation or traditional vir-tualization based solution, it still leaves some detectablefootprints on CPU semantics while executing specific in-structions [39].Bare-metal systems. TaintDroid [22] is a system-wideinformation flow tracking tool. It provides variable-level,message-level, method-level, and file-level taint propa-gation by modifying the original Android framework.TaintART [44] extends the idea of TaintDroid on themost recent Android Java virtual machine Android Run-time (ART). VetDroid [55] reconstructs the malicious be-havior of the malware based on permission usage, andit is applicable to taint analysis. DroidTrace [56] usesptrace to monitor the dynamic loading code on bothJava and native code level. BareDroid [34] provides aquick restore mechanism that makes the bare-metal anal-ysis of Android applications feasible at scale. Althoughthese tools attempt to analyze the target on real-worlddevices to improve transparency, the modification to theAndroid framework leaves some memory footprints orcode signatures, and the ptrace-based approaches canbe detected by simply check the /proc/self/status
file. Moreover, these systems are vulnerable to privilegedmalware.
3.3 TrustZone-related SystemsTZ-RKP [13] runs in the secure domain and protects therich OS kernel by event-driven monitoring. Sprobes [51]provides an instrumentation mechanism to introspect therich OS from the secure domain, and guarantees the ker-nel code integrity. SeCReT [28] is a framework that en-ables a secure communication channel between the nor-mal domain and the secure domain, and provides a trustexecution environment. Brasser et al. [14] use TrustZoneto analyze and regulate guest devices in a restricted hostspaces via remote memory operation to avoid misusageof sensors and peripherals. C-FLAT [1] fights againstcontrol-flow hijacking via runtime control-flow verifica-tion in TrustZone. TrustShadow [25] shields the execu-tion of an unmodified application from a compromisedoperating system by building a lightweight runtime sys-tem in the ARM TrustZone secure world. The runtimesystem forwards the requests of system services to thecommodity operating systems in the normal world andverifies the returns. Unlike previous systems, NINJAleverage TrustZone to transparently debug and analyzethe ARM applications and malware.
4 System Architecture
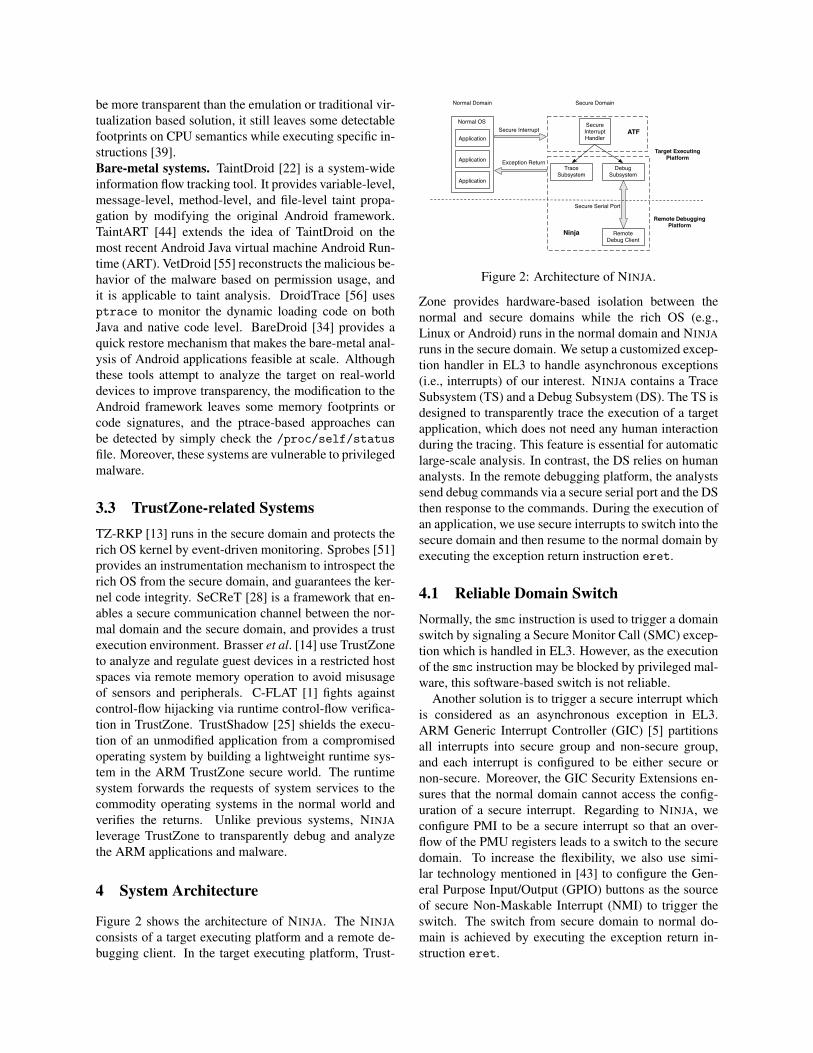
Figure 2 shows the architecture of NINJA. The NINJAconsists of a target executing platform and a remote de-bugging client. In the target executing platform, Trust-
Secure Interrupt Handler
Trace Subsystem
Remote Debug Client
Normal OS
Application
ApplicationSecure Interrupt
Debug Subsystem
Normal Domain Secure Domain
Application
Ninja
Exception Return
Secure Serial Port
ATF
Target Executing Platform
Remote DebuggingPlatform
Figure 2: Architecture of NINJA.
Zone provides hardware-based isolation between thenormal and secure domains while the rich OS (e.g.,Linux or Android) runs in the normal domain and NINJAruns in the secure domain. We setup a customized excep-tion handler in EL3 to handle asynchronous exceptions(i.e., interrupts) of our interest. NINJA contains a TraceSubsystem (TS) and a Debug Subsystem (DS). The TS isdesigned to transparently trace the execution of a targetapplication, which does not need any human interactionduring the tracing. This feature is essential for automaticlarge-scale analysis. In contrast, the DS relies on humananalysts. In the remote debugging platform, the analystssend debug commands via a secure serial port and the DSthen response to the commands. During the execution ofan application, we use secure interrupts to switch into thesecure domain and then resume to the normal domain byexecuting the exception return instruction eret.
4.1 Reliable Domain SwitchNormally, the smc instruction is used to trigger a domainswitch by signaling a Secure Monitor Call (SMC) excep-tion which is handled in EL3. However, as the executionof the smc instruction may be blocked by privileged mal-ware, this software-based switch is not reliable.
Another solution is to trigger a secure interrupt whichis considered as an asynchronous exception in EL3.ARM Generic Interrupt Controller (GIC) [5] partitionsall interrupts into secure group and non-secure group,and each interrupt is configured to be either secure ornon-secure. Moreover, the GIC Security Extensions en-sures that the normal domain cannot access the config-uration of a secure interrupt. Regarding to NINJA, weconfigure PMI to be a secure interrupt so that an over-flow of the PMU registers leads to a switch to the securedomain. To increase the flexibility, we also use simi-lar technology mentioned in [43] to configure the Gen-eral Purpose Input/Output (GPIO) buttons as the sourceof secure Non-Maskable Interrupt (NMI) to trigger theswitch. The switch from secure domain to normal do-main is achieved by executing the exception return in-struction eret.
4.2 The Trace Subsystem
The Trace Subsystem (TS) provides the analyst the abil-ity to trace the execution of the target application in dif-ferent granularities during automatic analysis includinginstruction tracing, system call tracing, and Android APItracing. We achieve the instruction and system call trac-ing via hardware component ETM, and the Android APItracing with help of PMU registers.
By default, we use the GPIO button as the trigger ofsecure NMIs. Once the button is pressed, a secure NMIrequest is signaled to the GIC, and GIC routes this NMIto EL3. NINJA toggles the enable status of ETM afterreceiving this interrupt and outputs the tracing result ifneeded. Additionally, the PMU registers are involvedduring the Android API trace. Note that the NMI ofGPIO buttons can be replaced by any system events thattrigger an interrupt (e.g., system calls, network events,clock events, and etc.), and these events can be used toindicate the start or end of the trace in different usagescenarios.
Another advanced feature of ETM is that PMU eventscan also be configured as an external input source. Inlight of this, we specify different granularities of the trac-ing. For example, we trace all the system calls by con-figure the ETM to use the signal of PMU event EXC SVC
as the external input.
4.3 The Debug Subsystem
In contrast to the TS, the Debug Subsystem (DS) is de-signed for manual analysis. It establishes a secure chan-nel between the target executing platform and the remotedebugging platform, and provides a user interface for hu-man analysts to introspect the execution status of the tar-get application.
To interrupt the execution of the target, we configurethe PMI to be secure and adjust the value of the PMUcounter registers to trigger an overflow at a desired point.NINJA receives the secure interrupt after a PMU counteroverflows and pauses the execution of the target. A hu-man analyst then issues debugging commands via the se-cure serial port and introspects the current status of thetarget following our GDB-like debugging protocol. Toensure the PMI will be triggered again, the DS sets de-sirable values to the PMU registers before exiting the se-cure domain.
Moreover, similar to the TS, we specify the granu-larity of the debugging by monitoring different PMUevents. For example, if we choose the event INST R-
ETIRED which occurs after an instruction is retired, theexecution of the target application is paused after eachinstruction is executed. If the event EXC SVC is chosen,the DS takes control of the system after each system call.
5 Design and Implementation
We implement NINJA on a 64-bit ARMv8 Juno r1 board.There are two ARM Cortex-A57 cores and four ARMCortex-A53 cores on the board, and all of them includethe support for PMU, ETM, and TrustZone. Based on theATF and Linaro’s deliverables on Android 5.1.1 for Juno,we build a customized firmware for the board. Note thatNINJA is compatible with commercial mobile devicesbecause it relies on existing deployed hardware features.
5.1 Bridge the Semantic GapAs with the VMI-based [27] and TEE-based [54] sys-tems, bridging the semantic gap is an essential step forNINJA to conduct the analysis. In particular, we face twolayers of semantic gaps in our system.
5.1.1 Gap between Normal and Secure Domains
In the DS, NINJA uses PMI to trigger a trap to EL3. How-ever, the PMU counts the instructions executed in theCPU disregarding to the current running process. Thatmeans the instruction which triggers the PMI may belongto another application. Thus, we first need to identify ifthe current running process is the target. Since NINJA isimplemented in the secure domain, it cannot understandthe semantic information of the normal domain, and wehave to fill the semantic gap to learn the current runningprocess in the OS.
In Linux, each process is represented by an instanceof thread info data structure, and the one for thecurrent running process could be obtained by SP &∼(THREAD SIZE - 1) , where SP indicates the currentstack pointer and THREAD SIZE represents the size ofthe stack. Next, we can fetch the task struct, whichmaintains the process information (like pid, name, andmemory layout), from the thread info. Then, the tar-get process can be identified by the pid or process name.
5.1.2 Gap in Android Java Virtual Machine
Android maintains a Java virtual machine to interpretJava bytecode, and we need to figure out the current exe-cuting Java method and bytecode during the Android APItracing and bytecode stepping. DroidScope [52] fills thesemantic gaps in the Dalvik to understand the current sta-tus of the VM. However, as a result of Android upgrades,Dalvik is no longer available in recent Android versions,and the approach in DroidScope is not applicable for us.
By manually analyzing the source code ofART, we learn that the bytecode interpreter usesExecuteGotoImpl or ExecuteSwitchImpl functionto execute the bytecode. The approaches we used to fillthe semantic gap in these two functions are similar, and
...link_
method_vregs_
...
...link_
method_vregs_
...
...link_
method_vregs_
...
...declaring_class_
dex_method_index_...
...dex_cache_
dex_type_idx_...
...dex_file_
...
...
type 0type 1
...type n
...
method 0method 1
...method n
...
code 0code 1
...code n
...
StackFrame StackFrame StackFrame
DexCache DexFile
Class
ArtMethod
X19: stack frameX21: dex_pcX27: bytecode
const/4 v0, 0const/4 v1, 1
add-int, v0, v0, v1return v0
CodeItem
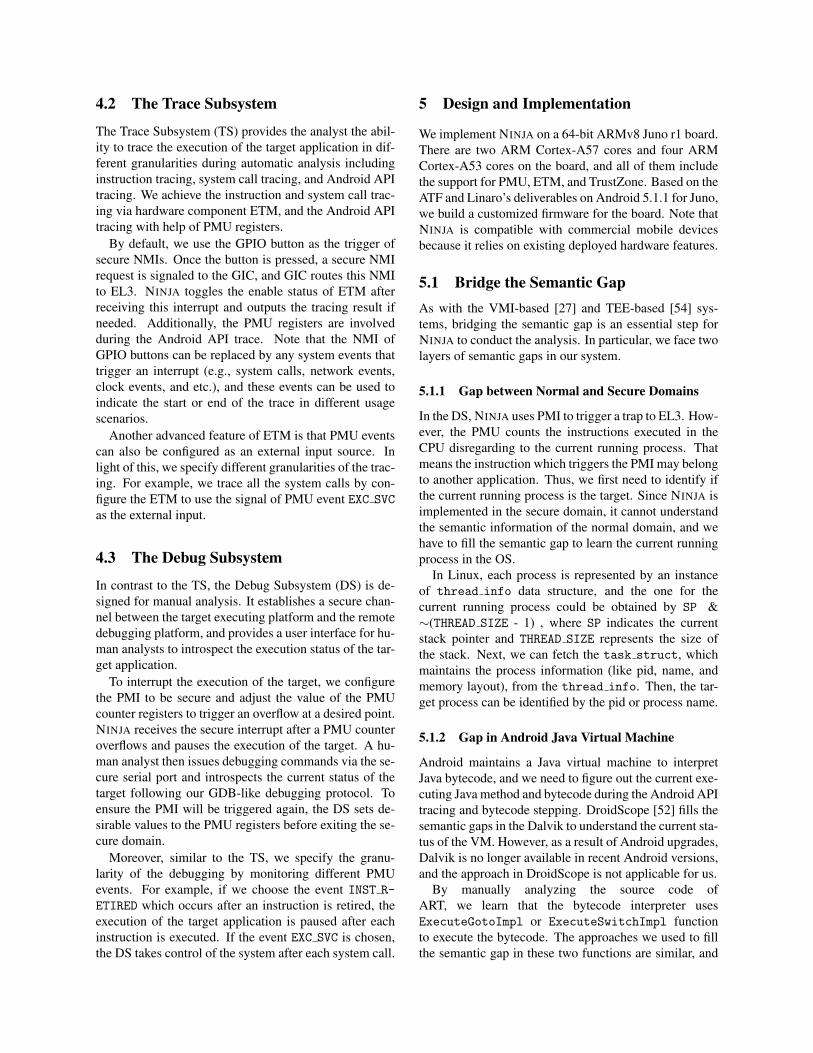
Figure 3: Semantics in the Function ExecuteGotoImpl.
we use function ExecuteGotoImpl as an example toexplain our approach. In Android, the bytecode of a Javamethod is organized as a 16-bit array, and ART passesthe bytecode array to the function ExecuteGotoImpl
together with the current execution status such as thecurrent thread, caller and callee methods, and the callframe stack that stores the call stack and parameters.Then, the function ExecuteGotoImpl interprets thebytecode in the array following the control flows, and alocal variable dex pc indicates the index of the currentinterpreting bytecode in the array. By manual checkingthe decompiled result of the function, we find that thepointer to the bytecode array is stored in register X27
while variable dex pc is kept by register X21, and thecall frame stack is maintained in register X19. Figure 3shows the semantics in the function ExecuteGotoImpl.By combining registers X21 and X27, we can locate thecurrent executing bytecode. Moreover, a single framein the call frame stack is represented by an instance ofStackFrame with the variable link pointing to theprevious frame. The variable method indicates thecurrent executing Java method, which is representedby an instance of ArtMethod. Next, we fetch thedeclaring class of the Java method following the pointerdeclaring class . The pointer dex cache in thedeclaring class points to an instance of DexCache whichis used to maintain a cache for the DEX file, and thevariable dex file in the DexCache finally points tothe instance of DexFile, which contains all informationof a DEX file. Detail description like the name of themethod can be fetched via the index of the method (i.e.,dex method index ) in the method array maintainedby the DexFile. Note that both ExecuteGotoImpl
and ExecuteSwitchImpl functions have four different
template implementations in ART, and our approach isapplicable to all of them.
5.2 Secure Interrupts
In GIC, each interrupt is assigned to Group 0 (secure in-terrupts) or Group 1 (non-secure interrupts) by a groupof 32-bit GICD IGROUPR registers. Each bit in eachGICD IGROUPR register represents the group informationof a single interrupt, and value 0 indicates Group 0 whilevalue 1 means Group 1. For a given interrupt ID n,the index of the corresponding GICD IGROUPR registeris given by n / 32, and the corresponding bit in the reg-ister is n mod 32. Moreover, the GIC maintains a targetprocess list in GICD ITARGETSR registers for each inter-rupt. By default, the ATF configures the secure interruptsto be handled in Cortex-A57 core 0.
As mentioned in Section 4.1, NINJA uses secure PMIand NMI to trigger a reliable switch. As the secure inter-rupts are handled in Cortex-A57 core 0, we run the tar-get application on the same core to reduce the overheadof the communication between cores. In Juno board,the interrupt ID for PMI in Cortex-A57 core 0 is 34.Thus, we clear the bit 2 of the register GICD IGROUPR1
(34 mod 32 = 2,34/32 = 1) to mark the interrupt 34 assecure. Similarly, we configure the interrupt 195, whichis triggered by pressing a GPIO button, to be secure byclearing the bit 3 of the register GICD IGROUPR6.
5.3 The Trace Subsystem
5.3.1 Instruction Tracing
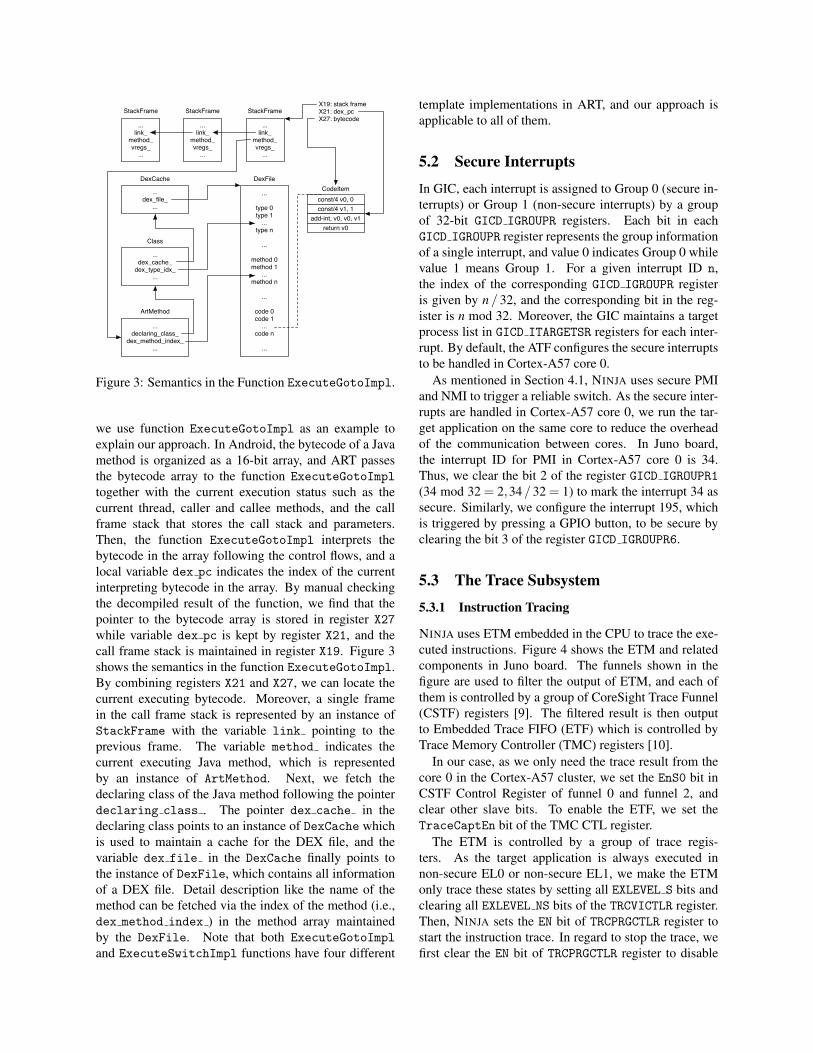
NINJA uses ETM embedded in the CPU to trace the exe-cuted instructions. Figure 4 shows the ETM and relatedcomponents in Juno board. The funnels shown in thefigure are used to filter the output of ETM, and each ofthem is controlled by a group of CoreSight Trace Funnel(CSTF) registers [9]. The filtered result is then outputto Embedded Trace FIFO (ETF) which is controlled byTrace Memory Controller (TMC) registers [10].
In our case, as we only need the trace result from thecore 0 in the Cortex-A57 cluster, we set the EnS0 bit inCSTF Control Register of funnel 0 and funnel 2, andclear other slave bits. To enable the ETF, we set theTraceCaptEn bit of the TMC CTL register.
The ETM is controlled by a group of trace regis-ters. As the target application is always executed innon-secure EL0 or non-secure EL1, we make the ETMonly trace these states by setting all EXLEVEL S bits andclearing all EXLEVEL NS bits of the TRCVICTLR register.Then, NINJA sets the EN bit of TRCPRGCTLR register tostart the instruction trace. In regard to stop the trace, wefirst clear the EN bit of TRCPRGCTLR register to disable

Core 1ETM
Cortex-A57 cluster
Funnel 2Input 0 Input 1 ETF 0
Cortex-A53 cluster
Input 0 Input 1 Input 2 Input 3Funnel 1
Core 0ETM
Core 1ETM
Core 2ETM
Core 3ETM
Input 0 Input 1Funnel 0
Core 0ETM
Figure 4: ETM in Juno Board.
ETM and then set the StopOnFl bit and the FlushMan
bits of FFCR register in the TMC registers to stop theETF. To read the trace result, we keep reading from RRD
register until 0xFFFFFFFF is fetched. Note that the traceresult is an encoded trace stream, and we use an opensource analyzer ptm2human [26] to convert the stream toa readable format.
5.3.2 System Call Tracing
The system call of Linux in ARM platforms is achievedby supervisor call instruction svc, and an immediatevalue following the svc instruction indicates the corre-sponding system call number. Since the ETM can beconfigured to trace the PMU event EXC SVC, which oc-curs right after the execution of a svc instruction, wetrace the system calls via tracing this event in ETM.
As mentioned in Section 4.2, we can configure theETM to trace PMU events during the instruction trace.The TRCEXTINSELR register is used to trace at most fourexternal input source, and we configure one of themto trace the EXC SVC event. In Cortex-A57, the eventnumber of the EXC SVC event is 0x60, so we set theSEL0 bits of the TRCEXTINSELR register to be 0x60.Also, the SELECT bits of the second trace resource se-lection control register TRCRSCTLR2 (TRCRSCTLR0 andTRCRSCTLR1 are reserved) is configured to 0 to selectthe external input 0 as tracing resource 2. Next, we con-figure the EVENT0 bit of TRCEVENTCTL0R register to 2 toselect the resource 2 as event 0. Finally, the INSTEN bitof TRCEVENTCTL1R register is set to 0x1 to enable event0. Note that the X bit of PMU register PMCR EL0 shouldalso be set to export the events to ETM. After the config-uration, the ETM can be used to trace system calls, andthe configuration to start and stop the trace is similar tothe one in Section 5.3.1.
5.3.3 Android API Tracing
Unlike the instruction trace and system call trace, wecannot use ETM to directly trace the Android APIsas the existence of the semantic gap. As mentionedin Section 5.1.2, each Java method is interpreter byExecuteGotoImpl or ExecuteSwitchImpl function,
and ART jumps to these functions by a branch instructionbl. Since a PMU event BR RETIRED is fired after exe-cution of a branch instruction, we use PMU to trace theBR RETIRED event and reconstruct the semantic informa-tion following the approach described in Section 5.1.2 ifthese functions are invoked.
There exist six PMU counters for each processor onJuno board, and we randomly select the last one to beused for the Android API trace and the DS. Firstly, theE bit of PMCR EL0 register is set to enable the PMU.Then, both PMCNTENSET EL0 and PMINTENSET EL1 reg-isters are set to 0x20 to enable the counter 6 andthe overflow interrupt of the counter 6. Next, we setPMEVTYPER5 EL0 register to 0x80000021 to make thecounter 6 count the BR RETIRED event in non-secureEL0. Finally, the counter PMEVCNTR5 EL0 is set to itsmaximum value 0xFFFFFFFF. With this configuration,a secure PMI is routed to EL3 after the execution ofthe next branch instruction. In the interrupt handler, theELR EL3 register, which is identical to the PC of the nor-mal domain, is examined to identify whether the execu-tion of normal domain encounters ExecuteGotoImpl orExecuteSwitchImpl function. If true, we fill the se-mantic gap and fetch the information about the currentexecuting Java method. By the declaring class of themethod, we differentiate the Android APIs from the de-veloper defined methods. Before returning to the normaldomain, we reset the performance counter to its maxi-mum value to make sure the next execution of a branchinstruction leads to an overflow.
5.4 The Debug Subsystem
Debugging is another essential approach to learn the be-havior of an application. NINJA leverages a secure serialport to connect the board to an external debugging client.There exists two serial port (i.e., UART0 and UART1) inJuno board, and the ATF uses UART0 as the debugginginput/output of both normal domain and secure domain.To build a secure debugging bridge, NINJA uses UART1as the debugging channel and marks it as a secure de-vice by configuring NIC-400 [3]. Alternatively, we canuse a USB cable for this purpose. In the DS, an ana-lyst pauses the execution of the target application by thesecure NMI or predefined breakpoints and send debug-ging commands to the board via the secure serial port.NINJA processes the commands and outputs the responseto the serial port with a user-friendly format. The table inAppendix A shows the supported debugging commands.The information about symbols in both bytecode and ma-chine code are not supported at this moment, and we con-sider it as our future work.

5.4.1 Single-instruction Stepping
The ARMv8 architecture provides instruction steppingsupport for the debuggers by the SS bit of MDSCR EL1
register. Once this bit is set, the CPU generates a soft-ware step exception after each instruction is executed,and the highest EL that this exception can be routed isEL2. However, this approach has two fundamental draw-backs: 1) the EL2 is normally prepared for the hard-ware virtualization systems, which does not satisfy ourtransparency requirements. 2) The instruction steppingchanges the value of PSTATE, which is accessible fromEL1. Thus, we cannot use the software step exception forthe instruction stepping. Another approach is to modifythe target application’s code to generate a SMC excep-tion after each instruction. Nonetheless, the modificationbrings the side effect that the self-checking malware maybe aware of it.
The PMU event INST RETIRED is fired after the exe-cution of each instruction, and we use this event to im-plement instruction stepping by using similar approachmentioned in Section 5.3.3. With the configuration,NINJA pauses the execution of the target after the exe-cution of each instruction and waits for the debuggingcommands.
Moreover, NINJA is capable of stepping Java byte-code. Recall that the functions ExecuteGotoImpl
and ExecuteSwitchImpl interpret the bytecode in Javamethods. In both functions, a branch instruction is usedto switch to the interpretation code of each Java byte-code. Thus, we use BR RETIRED event to trace thebranch instructions and firstly ensure the pc of normaldomain is inside the two interpreter functions. Next, wefill the semantic gap and monitor the value of dex pc. Asthe change of dex pc value indicates the change of cur-rent interpreting bytecode, we pause the system once thedex pc is changed to achieve Java bytecode stepping.
5.4.2 Breakpoints
In ARMv8 architecture, a breakpoint exception is gen-erated by either a software breakpoint or a hardwarebreakpoint. The execution of brk instruction is consid-ered as a software breakpoint while the breakpoint con-trol registers DBGBCR EL1 and breakpoint value registersDBGBVR EL1 provide support for at most 16 hardwarebreakpoints. However, similar to the software step ex-ception, the breakpoint exception generated in the nor-mal domain could not be routed to EL3, which breaks thetransparency requirement of NINJA. MalT [54] discussesanother breakpoint implementation that modifies the tar-get’s code to trigger an interrupt. Due to the transparencyrequirement, we avoid this approach to keep our systemtransparent against the self-checking malware. Thus, weimplement the breakpoint based on the instruction step-
ping technique discussed above. Once the analyst addsa breakpoint, NINJA stores its address and enable PMUto trace the execution of instructions. If the address ofan executing instruction matches the breakpoint, NINJApauses the execution and waits for debugging commands.Otherwise, we return to the normal domain and do notinterrupt the execution of the target.
5.4.3 Memory Read/Write
NINJA supports memory access with both physical andvirtual addresses. The TrustZone technology ensuresthat EL3 code can access the physical memory of thenormal domain, so it is straight forward for NINJA toaccess memory via physical addresses. Regarding tomemory accesses via virtual addresses, we have to findthe corresponding physical addresses for the virtual ad-dresses in the normal domain. Instead of manually walkthrough the page tables, a series of Address Translation(AT) instructions help to translate a 64-bit virtual addressto a 48-bit physical address2 considering the translationstages, ELs and memory attributes. As an example, theat s12e0r addr instruction performs stage 1 and 2 (ifavailable) translations as defined for EL0 to the 64-bitaddress addr, with permissions as if reading from addr.The [47:12] bits of the corresponding physical addressare storing in the PA bits of the PAR EL1 register, andthe [11:0] bits of the physical address are identical to the[11:0] bits of the virtual address addr. After the transla-tion, NINJA directly manipulates the memory in normaldomain according to the debugging commands.
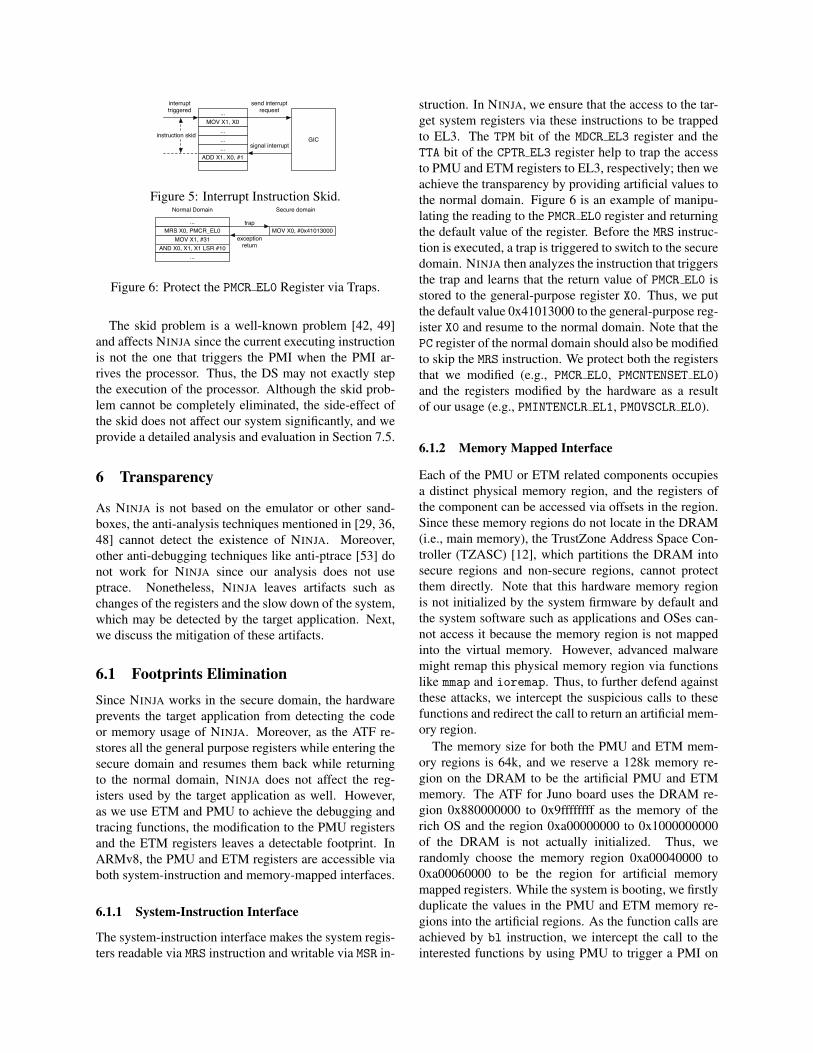
5.5 Interrupt Instruction SkidIn ARMv8 manual, the interrupts are referred as asyn-chronous exceptions. Once an interrupt source is trig-gered, the CPU continues executing the instructions in-stead of waiting for the interrupt. Figure 5 shows theinterrupt process in Juno board. Assume that an inter-rupt source is triggered before the MOV instruction is ex-ecuted. The processor then sends the interrupt requestto the GIC and continues executing the MOV instruction.The GIC processes the requested interrupt according tothe configuration, and signals the interrupt back to theprocessor. Note that it takes GIC some time to finish theprocess, so some instructions following the MOV instruc-tion have been executed when the interrupt arrives theprocessor. As shown in Figure 5, the current executinginstruction is the ADD instruction instead of the MOV in-struction when the interrupt arrives, and the instructionshadow region between the MOV and ADD instructions isconsidered as interrupt instruction skid.
2The ARMv8 architecture does not support more bits in the physicaladdress at this moment
...MOV X1, X0
...
...
...ADD X1, X0, #1
GIC
interrupt triggered
send interruptrequest
signal interruptinstruction skid
Figure 5: Interrupt Instruction Skid.
MRS X0, PMCR_EL0MOV X1, #31
AND X0, X1, X1 LSR #10...
...MOV X0, #0x41013000
exception return
trap
Normal Domain Secure domain
Figure 6: Protect the PMCR EL0 Register via Traps.
The skid problem is a well-known problem [42, 49]and affects NINJA since the current executing instructionis not the one that triggers the PMI when the PMI ar-rives the processor. Thus, the DS may not exactly stepthe execution of the processor. Although the skid prob-lem cannot be completely eliminated, the side-effect ofthe skid does not affect our system significantly, and weprovide a detailed analysis and evaluation in Section 7.5.
6 Transparency
As NINJA is not based on the emulator or other sand-boxes, the anti-analysis techniques mentioned in [29, 36,48] cannot detect the existence of NINJA. Moreover,other anti-debugging techniques like anti-ptrace [53] donot work for NINJA since our analysis does not useptrace. Nonetheless, NINJA leaves artifacts such aschanges of the registers and the slow down of the system,which may be detected by the target application. Next,we discuss the mitigation of these artifacts.
6.1 Footprints EliminationSince NINJA works in the secure domain, the hardwareprevents the target application from detecting the codeor memory usage of NINJA. Moreover, as the ATF re-stores all the general purpose registers while entering thesecure domain and resumes them back while returningto the normal domain, NINJA does not affect the reg-isters used by the target application as well. However,as we use ETM and PMU to achieve the debugging andtracing functions, the modification to the PMU registersand the ETM registers leaves a detectable footprint. InARMv8, the PMU and ETM registers are accessible viaboth system-instruction and memory-mapped interfaces.
6.1.1 System-Instruction Interface
The system-instruction interface makes the system regis-ters readable via MRS instruction and writable via MSR in-
struction. In NINJA, we ensure that the access to the tar-get system registers via these instructions to be trappedto EL3. The TPM bit of the MDCR EL3 register and theTTA bit of the CPTR EL3 register help to trap the accessto PMU and ETM registers to EL3, respectively; then weachieve the transparency by providing artificial values tothe normal domain. Figure 6 is an example of manipu-lating the reading to the PMCR EL0 register and returningthe default value of the register. Before the MRS instruc-tion is executed, a trap is triggered to switch to the securedomain. NINJA then analyzes the instruction that triggersthe trap and learns that the return value of PMCR EL0 isstored to the general-purpose register X0. Thus, we putthe default value 0x41013000 to the general-purpose reg-ister X0 and resume to the normal domain. Note that thePC register of the normal domain should also be modifiedto skip the MRS instruction. We protect both the registersthat we modified (e.g., PMCR EL0, PMCNTENSET EL0)and the registers modified by the hardware as a resultof our usage (e.g., PMINTENCLR EL1, PMOVSCLR EL0).
6.1.2 Memory Mapped Interface
Each of the PMU or ETM related components occupiesa distinct physical memory region, and the registers ofthe component can be accessed via offsets in the region.Since these memory regions do not locate in the DRAM(i.e., main memory), the TrustZone Address Space Con-troller (TZASC) [12], which partitions the DRAM intosecure regions and non-secure regions, cannot protectthem directly. Note that this hardware memory regionis not initialized by the system firmware by default andthe system software such as applications and OSes can-not access it because the memory region is not mappedinto the virtual memory. However, advanced malwaremight remap this physical memory region via functionslike mmap and ioremap. Thus, to further defend againstthese attacks, we intercept the suspicious calls to thesefunctions and redirect the call to return an artificial mem-ory region.
The memory size for both the PMU and ETM mem-ory regions is 64k, and we reserve a 128k memory re-gion on the DRAM to be the artificial PMU and ETMmemory. The ATF for Juno board uses the DRAM re-gion 0x880000000 to 0x9ffffffff as the memory of therich OS and the region 0xa00000000 to 0x1000000000of the DRAM is not actually initialized. Thus, werandomly choose the memory region 0xa00040000 to0xa00060000 to be the region for artificial memorymapped registers. While the system is booting, we firstlyduplicate the values in the PMU and ETM memory re-gions into the artificial regions. As the function calls areachieved by bl instruction, we intercept the call to theinterested functions by using PMU to trigger a PMI on

the execution of branch instructions and compare the pcof the normal domain with the address of these functions.Next, we manipulate the call to these functions by mod-ification to the parameters. Take ioremap function asan example. The first parameter of the function, whichis stored in the register X0, indicates the target physicaladdress, and we modify the value stored at the registerto the corresponding address in the artificial memory re-gion. With this approach, the application never readsthe real value of PMU and ETM registers, and cannotbe aware of NINJA.
6.2 Defending Against Timing Attacks
The target application may use the SoC or external timersto detect the time elapsed in the secure domain since theDS affects the performance of the processor and com-municates with a human analyst. Note that the TS usingETM does not affect the performance of the processorand thus is immune to the timing attack.
The ARMv8 architecture defines two types of timercomponents, i.e., the memory-mapped timers and thegeneric timer registers [8]. Other than these timers, theJuno board is equipped with an additional Real TimeClock (RTC) component PL031 [6] and two dual-timermodules SP804 [4] to measure the time. For each one ofthese components, we manipulate its value to make thetime elapsed of NINJA invisible.
Each of the memory-mapped timer components ismapped to a pre-defined memory region, and all thesememory regions are writable in EL3. Thus, we recordthe value of the timer or counter while entering NINJAand restore it before existing NINJA. The RTC and dual-timer modules are also mapped to a writable memory re-gion, so we use a similar method to handle them.
The generic timer registers consist of a series oftimer and counter registers, and all of these regis-ters are writable in EL3 except the physical counterregister CNTPCT EL0 and the virtual counter registerCNTVCT EL0. For the writable registers, we use thesame approach as handling memory-mapped timers tomanipulate them. Although CNTPCT EL0 is not directlywritable, the ARM architecture requires a memory-mapped counter component to control the generationof the counter value [8]. In the Juno board, thegeneric counter is mapped to a controlling memory frame0x2a430000-0x2a43ffff, and writing to the memory ad-dress 0x2a430008 updates the value of CNTPCT EL0.The CNTVCT EL0 register always holds a value equalto the value of the physical counter register minus thevalue of the virtual offset register CNTVOFF EL2. Thus,the update to the CNTPCT EL0 register also updates theCNTVCT EL0 register.
Note that the above mechanism only considers the
time consumption of NINJA, and does not take the timeconsumption of the ATF into account. Thus, to makeit more precise, we measure the average time consump-tion of the ATF during the secure exception handling (seeAppendix B) and minus it while restoring the timer val-ues. Besides the timers, the malware may also leveragethe PMU to count the CPU cycles. Thus, NINJA checksthe enabled PMU counters and restores their values in asimilar way to the writable timers.
The external timing attack cannot be defended bymodifying the local timer since external timers are in-volved. As the instruction tracing in NINJA is immune tothe timing attack, we can use the TS to trace the execu-tion of the target with DS enabled and disabled. By com-paring the trace result using the approaches describedin BareCloud [31] and MalGene [30], we may identifythe suspicious instructions that launch the attack and de-fend against the attack by manipulating the control flowin EL3 to bypass these instructions. However, the ef-fectiveness of this approach needs to be further studied.Currently, defending against the external timing attack isan open research problem [20, 54].
7 Evaluation
To evaluate NINJA, we fist compare it with existing anal-ysis and debugging tools on ARM. NINJA neither in-volves any virtual machine or emulator nor uses the de-tectable Linux tools like ptrace or strace. Moreover,to further improve the transparency, we do not modifyAndroid system software or the Linux kernel. The de-tailed comparison is listed in Table 1. Since NINJA onlyrelies on the ATF, the table shows that the Trusted Com-puting Base (TCB) of NINJA is much smaller than exist-ing systems.
7.1 Output of Tracing SubsystemTo learn the details of the tracing output, we write a sim-ple Android application that uses Java Native Interfaceto read the /proc/self/status file line by line (whichcan be further used to identify whether ptrace is en-abled) and outputs the content to the console. We useinstruction trace of the TS to trace the execution of theapplication, and also measure the time usage. The statusfile contains 38 lines in total, and it takes about 0.22 msto finish executing. After the execution, the ETF contains9.92 KB encoded trace data, and the datarate is approxi-mately 44.03 MB/s. Next, we use ptm2human [26] to de-code the data, and the decoded trace data contains 1341signpost instructions (80 in our custom native library andthe others in libc.so). By manually introspect the sign-post instructions in our custom native library, we can re-build the whole execution control flow. To reduce the
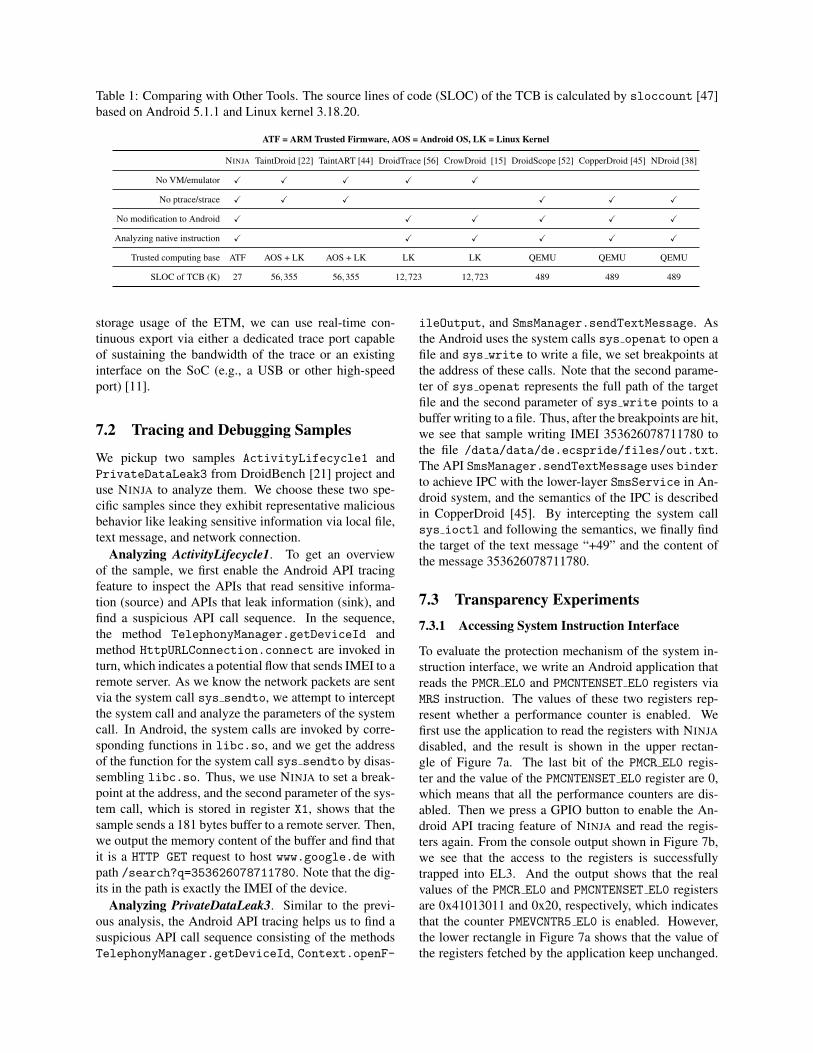
Table 1: Comparing with Other Tools. The source lines of code (SLOC) of the TCB is calculated by sloccount [47]based on Android 5.1.1 and Linux kernel 3.18.20.
ATF = ARM Trusted Firmware, AOS = Android OS, LK = Linux Kernel
NINJA TaintDroid [22] TaintART [44] DroidTrace [56] CrowDroid [15] DroidScope [52] CopperDroid [45] NDroid [38]
No VM/emulator X X X X X
No ptrace/strace X X X X X X
No modification to Android X X X X X X
Analyzing native instruction X X X X X X
Trusted computing base ATF AOS + LK AOS + LK LK LK QEMU QEMU QEMU
SLOC of TCB (K) 27 56,355 56,355 12,723 12,723 489 489 489
storage usage of the ETM, we can use real-time con-tinuous export via either a dedicated trace port capableof sustaining the bandwidth of the trace or an existinginterface on the SoC (e.g., a USB or other high-speedport) [11].
7.2 Tracing and Debugging Samples
We pickup two samples ActivityLifecycle1 andPrivateDataLeak3 from DroidBench [21] project anduse NINJA to analyze them. We choose these two spe-cific samples since they exhibit representative maliciousbehavior like leaking sensitive information via local file,text message, and network connection.
Analyzing ActivityLifecycle1. To get an overviewof the sample, we first enable the Android API tracingfeature to inspect the APIs that read sensitive informa-tion (source) and APIs that leak information (sink), andfind a suspicious API call sequence. In the sequence,the method TelephonyManager.getDeviceId andmethod HttpURLConnection.connect are invoked inturn, which indicates a potential flow that sends IMEI to aremote server. As we know the network packets are sentvia the system call sys sendto, we attempt to interceptthe system call and analyze the parameters of the systemcall. In Android, the system calls are invoked by corre-sponding functions in libc.so, and we get the addressof the function for the system call sys sendto by disas-sembling libc.so. Thus, we use NINJA to set a break-point at the address, and the second parameter of the sys-tem call, which is stored in register X1, shows that thesample sends a 181 bytes buffer to a remote server. Then,we output the memory content of the buffer and find thatit is a HTTP GET request to host www.google.de withpath /search?q=353626078711780. Note that the dig-its in the path is exactly the IMEI of the device.
Analyzing PrivateDataLeak3. Similar to the previ-ous analysis, the Android API tracing helps us to find asuspicious API call sequence consisting of the methodsTelephonyManager.getDeviceId, Context.openF-
ileOutput, and SmsManager.sendTextMessage. Asthe Android uses the system calls sys openat to open afile and sys write to write a file, we set breakpoints atthe address of these calls. Note that the second parame-ter of sys openat represents the full path of the targetfile and the second parameter of sys write points to abuffer writing to a file. Thus, after the breakpoints are hit,we see that sample writing IMEI 353626078711780 tothe file /data/data/de.ecspride/files/out.txt.The API SmsManager.sendTextMessage uses binderto achieve IPC with the lower-layer SmsService in An-droid system, and the semantics of the IPC is describedin CopperDroid [45]. By intercepting the system callsys ioctl and following the semantics, we finally findthe target of the text message “+49” and the content ofthe message 353626078711780.
7.3 Transparency Experiments7.3.1 Accessing System Instruction Interface
To evaluate the protection mechanism of the system in-struction interface, we write an Android application thatreads the PMCR EL0 and PMCNTENSET EL0 registers viaMRS instruction. The values of these two registers rep-resent whether a performance counter is enabled. Wefirst use the application to read the registers with NINJAdisabled, and the result is shown in the upper rectan-gle of Figure 7a. The last bit of the PMCR EL0 regis-ter and the value of the PMCNTENSET EL0 register are 0,which means that all the performance counters are dis-abled. Then we press a GPIO button to enable the An-droid API tracing feature of NINJA and read the regis-ters again. From the console output shown in Figure 7b,we see that the access to the registers is successfullytrapped into EL3. And the output shows that the realvalues of the PMCR EL0 and PMCNTENSET EL0 registersare 0x41013011 and 0x20, respectively, which indicatesthat the counter PMEVCNTR5 EL0 is enabled. However,the lower rectangle in Figure 7a shows that the value ofthe registers fetched by the application keep unchanged.

(a) Reading PMU Register in an Application. (b) EL3 Output in the Secure Console.
Figure 7: Accessing System Instruction Interface.
This experiment shows that NINJA effectively eliminatesthe footprint on the system instruction interface.
7.3.2 Accessing Memory Mapped Interface
In this section, we take ioremap function as an exam-ple to evaluate whether the interception to the memory-mapping functions works. As the ioremap function canbe called only in the kernel space, we write a kernel mod-ule that remaps the memory region of the ETM by theioremap function, and print the content of the first 32bytes in the region. Similar to the approach discussedabove, we first load the kernel module with NINJA dis-abled, and the output is shown in the upper rectangle inFigure 8a. Note that the 5th to the 8th bytes are mappedas the TRCPRGCTLR register and the EN bit, which indi-cates the status of the ETM, is the last bit of the register.In the upper rectangle, the EN bit 0 shows that the ETM isdisabled. Next, we enable the instruction tracing featureof NINJA and reload the kernel module. The lower rect-angle in Figure 8a shows that the content of the memoryfetched by the module remains the same. However, in theFigure 8b, the output from EL3 shows that the memoryof the ETM has changed. This experiment shows that wesuccessfully hide the ETM status change to the normaldomain, and NINJA remains transparent.
7.3.3 Adjusting the Timers
To evaluate whether our mechanism that modifies thelocal timers works, we write a simple application thatlaunches a dummy loop for 1 billion times, and calculatethe execution time of the loop by the return values of theAPI call System.currentTimeMillis(). In the firstexperiment, we record the execution time with NINJAdisabled, and the average time for 30 runs is 53.16s witha standard deviation 2.97s. In the second experiment,we enable the debugging mode of NINJA and pause theexecution during the loop by pressing the GPIO button.To simulate the manual analysis, we send a command rr
to output all the general purpose registers and then readthem for 60s. Finally, a command c is sent to resume
Table 2: The TS Performance Evaluation Calculating 1Million Digits of π .
Mean STD # Slowdown
Base: Tracing disabled 2.133 s 0.69 ms
Instruction tracing 2.135 s 2.79 ms ∼ 1xSystem call tracing 2.134 s 5.13 ms ∼ 1xAndroid API tracing 149.372 s 1287.88 ms ∼70x
the execution of the target. We repeat the second exper-iment with the timer adjusting feature of NINJA enabledand disabled for 30 times each, and record the execu-tion time of the loop. The result shows that the averageexecution time with timer adjusting feature disabled is116.33s with a standard deviation 2.24s, and that withtimer adjusting feature enabled is 54.33s with a standarddeviation 3.77s. As the latter result exhibits similar exe-cution time with the original system, the malware cannotuse the local timer to detect the presence of the debug-ging system.
7.4 Performance EvaluationIn this section, we evaluate the performance overhead ofthe trace subsystem due to its automation characteristic.Performance overhead of the debugging subsystem is notnoticed by an analyst in front of the command console,and the debugging system is designed with human inter-action.
To learn the performance overhead on the Linux bi-naries, we build an executable that using an open sourceπ calculation algorithm provided by the GNU MultiplePrecision Arithmetic Library [46] to calculate 1 milliondigits of the π for 30 times with the tracing functions dis-abled and enabled, and the time consumption is shownin Table 2. Since we leverage ETM to achieve the in-struction tracing and system call tracing, the experimentresult shows that the ETM-based solution has negligibleoverhead — less than 0.1%. In the Android API tracing,the overhead is about 70x. This overhead is mainly dueto the frequent domain switch during the execution andbridging the semantic gap. To reduce the overhead, we

(a) Reading ETM Memory Region. (b) EL3 Output in the Secure Console.
Figure 8: Memory Mapped Interface.Table 3: The TS Performance Evaluation with CF-Bench [16].
Native Scores Java Scores Overall ScoresMean STD Slowdown Mean STD Slowdown Mean STD Slowdown
Base: Tracing disabled 25380 1023 18758 1142 21407 1092
Instruction tracing 25364 908 ∼ 1x 18673 1095 ∼ 1x 21349 1011 ∼ 1xSystem call tracing 25360 774 ∼ 1x 18664 1164 ∼ 1x 21342 911 ∼ 1xAndroid API tracing 6452 24 ∼ 4x 122 4 ∼ 154x 2654 11 ∼ 8x
can combine ETM instruction trace with data trace, andleverage the trace result to rebuild the semantic informa-tion and API usage offline.
To measure the performance overhead on the Androidapplications, we use CF-Bench [16] downloaded fromGoogle Play Store. The CF-Bench focuses on measur-ing both the Java performance and native performancein Android system, and we use it to evaluate the over-head for 30 times. The result in Table 3 shows that theoverheads of instruction tracing and system call tracingare sufficiently small to ignore. The Android API tracingbrings 4x slowdown on the native score and 154x slow-down on the Java score, and the overall slowdown is 8x.Note that we make these benchmarks to be executed onlyon Cortex-A57 core 0 by setting their CPU affinity maskto 0x1 since NINJA only stays in that core.
7.5 Skid EvaluationIn this subsection, we evaluate the influence of the skidproblem to NINJA. Since the instruction tracing, systemcall tracing, and memory read/write do not involve PMI,these functionalities are not affected by the skid prob-lem. In ART, each bytecode is interpreted as an array ofmachine code. Our bytecode stepping mechanism rec-ognizes the corresponding bytecode once it is executingany machine code in the array, i.e., the skid problem af-fects the bytecode stepping if and only if the instructionshadow covers all the machine code for a bytecode. Weevaluate the listed 218 bytecode opcode [24] on the An-droid official website, and it shows that the shadow re-gion cannot cover the machine code for any of them.Thus, the bytecode stepping does not suffer from the skidproblem. For a similar reason, the skid problem has noinfluence on the Android API tracing.
However, the native code stepping and the breakpoint
Table 4: Instructions in the Skid Shadow with Represen-tative PMU Events.
Event Number Event Description# of InstructionsMean STD
0x81-0x8F Exception related events that fir-ing after taking exceptions
0 0
0x11 CPU cycle event that firing aftereach CPU cycle
2.73 2.30
0x08 Instruction retired event that fir-ing after executing each instruc-tion
6.03 4.99
are still affected, and both of them use instruction retiredevent to overflow the counter. Since the skid problem isdue to the delay between the interrupt request and the in-terrupt arrival, we first use PMU counter to measure thisdelay by CPU cycles. Similar with the instruction step-ping, we make the PMU counter to count CPU CYCLES
event and initialize the value of the counter to its maxi-mum value. Then, the counter value after switching intoEL3 is the time delay of the skid in CPU cycles. Theresults of 30 experiments show that the delay is about106.3 CPU cycles with a standard deviation 2.26. Asthe frequency of our CPU is 1.15GHz, the delay is about0.09µs. We also evaluate the number of instructions inthe skid shadow with some representative PMU events.For each event, we trigger the PMI for 30 times andcalculate the mean and standard deviation of the num-ber of instructions in the shadow. Table 4 shows theresult with different PMU events. Unlike the work de-scribed in [42], the exception related events exhibits noinstruction shadow in our platform, and we consider it iscaused by different ARM architectures. It is worth not-ing that the number of instructions in the skid shadowof the CPU cycle event is less than the instruction re-tired event. However, using the CPU cycle event maylead to multiple PMIs for a single instruction since the
execution of a single instruction may need multiple CPUcycles, which introduces more performance overhead butwith more fine-grained instruction-stepping. In practice,it is a trade off between the performance overhead andthe debugging accuracy, and we can use either one basedon the requirement.
8 Discussion
NINJA leverages existing deployed hardware and is com-patible with commercial mobile devices. However, thesecure domain on the commercial mobile devices is man-aged by the Original Equipment Manufacturer (OEM).Thus, it requires cooperation from the OEMs to imple-ment NINJA on a commercial mobile device.
The approach we used to fill the semantic gaps re-lies on the understanding of the kernel data structuresand memory maps, and thus is vulnerable to the privi-leged malware. Patagonix [33] leverages a database ofwhitelisted applications binary pages to learn the seman-tic information in the memory pages of the target applica-tion. However, this approach is limited by the knowledgeof the analyzer. Currently, how to transparently bridgethe semantic gap without any assumption to the systemis still an open research problem [27].
The protection mechanism mentioned in Section 6.1helps to improve transparency when the attackers tryto use PMU or ETM registers, and using shadow reg-isters [35] can further protect the critical system regis-ters. However, if an advanced attacker intentionally usesPMU or ETM to trace CPU events or instructions andchecks whether the trace result matches the expected one,the mechanism of returning artificial or shadow registervalues may not provide accurate result and thus affectsNINJA’s transparency. To address this problem, we needto fully virtualize the PMU and ETM, and this is left asour future work.
Though NINJA protects the system-instruction inter-face access to the registers, the mechanism we used toprotect the memory mapped interface access maybe vul-nerable to advanced attacks such as directly manipulat-ing the memory-mapping, disabling MMU to gain phys-ical memory access, and using DMA to access memory.Note that these attacks might be difficult to implement inpractice (e.g., disabling MMU might crash the system).To fully protect the memory-mapped region of ETM andPMU registers, we would argue that hardware supportfrom TrustZone is needed. Since the TZASC only pro-tects the DRAM, we may need additional hardware fea-tures to extend the idea of TZASC to the whole physicalmemory region.
Although the instruction skid of the PMI cannot becompletely eliminated, we can also enable ETM betweentwo PMIs to learn the instructions in the skid. More-
over, since the instruction skid is caused by the delayof the PMI, similar hardware component like Local Ad-vanced Programmable Interrupt Controller [54] on x86which handles interrupt locally may help to mitigate theproblem by reducing the response time.
9 Conclusions
In this paper, we present NINJA, a transparent malwareanalysis framework on ARM platform. It embodies a se-ries of analysis functionalities like tracing and debuggingvia hardware-assisted isolation execution environmentTrustZone and hardware features PMU and ETM. SinceNINJA does not involve emulator or framework modifi-cation, it is more transparent than existing analysis toolson ARM. To minimize the artifacts introduced by NINJA,we adopt register protection mechanism to protect all in-volving registers based on hardware traps and runtimefunction interception. Moreover, as the TrustZone andthe hardware components are widely equipped by OTSmobile devices, NINJA can be easily transplanted to ex-isting mobile platforms. Our experiment results showthat performance overheads of the instruction tracing andsystem call tracing are less than 1% while the AndroidAPI tracing introduces 4 to 154 times slowdown.
10 Acknowledgements
We would like to thank our shepherd, Manuel Egele, andthe anonymous reviewers for their valuable commentsand feedback. Special thanks to He Sun, who offers earlydiscussion about the project. We also appreciate SaeidMofrad, Leilei Ruan, and Qian Jiang for their kindly re-view and helpful suggestions.
References[1] ABERA, T., ASOKAN, N., DAVI, L., EKBERG, J.-E., NYMAN,
T., PAVERD, A., SADEGHI, A.-R., AND TSUDIK, G. C-FLAT:Control-flow attestation for embedded systems software. In Pro-ceedings of the 23rd ACM SIGSAC Conference on Computer andCommunications Security (CCS’16) (2016).
[2] ANUBIS. Analyzing Unknown Binaries. http:
//anubis.iseclab.org.
[3] ARM LTD. ARM CoreLink NIC-400 Network In-terconnect Technical Reference Manual. http:
//infocenter.arm.com/help/index.jsp?topic=/com.arm.doc.ddi0475g/index.html.
[4] ARM LTD. ARM Dual-Timer Module (SP804) Technical Ref-erence Manual. http://infocenter.arm.com/help/topic/com.arm.doc.ddi0271d/DDI0271.pdf.
[5] ARM LTD. ARM Generic Interrupt Controller Archi-tecture Specification. http://infocenter.arm.com/help/index.jsp?topic=/com.arm.doc.ihi0048b/index.html.
[6] ARM LTD. ARM PrimeCell Real Time Clock Technical Ref-erence Manual. http://infocenter.arm.com/help/topic/com.arm.doc.ddi0224b/DDI0224.pdf.

[7] ARM LTD. ARM Trusted Firmware. https://github.com/ARM-software/arm-trusted-firmware.
[8] ARM LTD. ARMv8-A Reference Manual. http:
//infocenter.arm.com/help/index.jsp?topic=/com.arm.doc.ddi0487a.k/index.html.
[9] ARM LTD. CoreSight ComponentsTechnical Reference Manual. http://
infocenter.arm.com/help/topic/com.arm.doc.ddi0314h/DDI0314H coresight components trm.pdf.
[10] ARM LTD. CoreSight Trace Memory Controller Technical Ref-erence Manual. http://infocenter.arm.com/help/topic/com.arm.doc.ddi0461b/DDI0461B tmc r0p1 trm.pdf.
[11] ARM LTD. Embedded Trace Macrocell ArchitectureSpecification. http://infocenter.arm.com/help/index.jsp?topic=/com.arm.doc.ihi0014q/index.html.
[12] ARM LTD. TrustZone Security Whitepaper. http:
//infocenter.arm.com/help/index.jsp?topic=/com.arm.doc.prd29-genc-009492c/index.html.
[13] AZAB, A. M., NING, P., SHAH, J., CHEN, Q., BHUTKAR, R.,GANESH, G., MA, J., AND SHEN, W. Hypervision AcrossWorlds: Real-time Kernel Protection from the ARM TrustZoneSecure World. In Proceedings of the 21st ACM SIGSAC Con-ference on Computer and Communications Security (CCS’14)(2014).
[14] BRASSER, F., KIM, D., LIEBCHEN, C., GANAPATHY, V.,IFTODE, L., AND SADEGHI, A.-R. Regulating ARM TrustZonedevices in restricted spaces. In Proceedings of the 14th AnnualInternational Conference on Mobile Systems, Applications, andServices (MobiSys’16) (2016).
[15] BURGUERA, I., ZURUTUZA, U., AND NADJM-TEHRANI, S.Crowdroid: Behavior-based malware detection system for An-droid. In Proceedings of the 1st ACM workshop on Security andPrivacy in Smartphones and Mobile Devices (SPSM’11) (2011).
[16] CHAINFIRE. CF-Bench. https://play.google.com/store/apps/details?id=eu.chainfire.cfbench.
[17] DALL, C., AND NIEH, J. KVM/ARM: The design and im-plementation of the linux ARM hypervisor. In Proceedings ofthe 19th International Conference on Architectural Support forProgramming Languages and Operating Systems (ASPLOS’14)(2014).
[18] DASH, S. K., SUAREZ-TANGIL, G., KHAN, S., TAM, K., AH-MADI, M., KINDER, J., AND CAVALLARO, L. DroidScribe:Classifying Android malware based on runtime behavior. MobileSecurity Technologies (MoST’16) (2016).
[19] DENG, Z., ZHANG, X., AND XU, D. Spider: Stealthy binaryprogram instrumentation and debugging via hardware virtualiza-tion. In Proceedings of the 29th Annual Computer Security Ap-plications Conference (ACSAC’13) (2013).
[20] DINABURG, A., ROYAL, P., SHARIF, M., AND LEE, W. Ether:Malware analysis via hardware virtualization extensions. In Pro-ceedings of the 15th ACM Conference on Computer and Commu-nications Security (CCS’08) (2008).
[21] EC SPRIDE SECURE SOFTWARE ENGINEERING GROUP.DroidBench. https://github.com/secure-software-engineering/DroidBench.
[22] ENCK, WILLIAM AND GILBERT, PETER AND COX, LANDON PAND JUNG, JAEYEON AND MCDANIEL, PATRICK AND SHETH,ANMOL N. TaintDroid: An Information-Flow Tracking Systemfor Realtime Privacy Monitoring on Smartphones. In Proceed-ings of the 9th USENIX Symposium on Operating Systems Designand Implementation (OSDI10) (2010).
[23] FUTUREMARK. Best Smartphones. http://
www.futuremark.com/hardware/mobile.
[24] GOOGLE INC. Dalvik bytecode. https://
source.android.com/devices/tech/dalvik/dalvik-bytecode.html.
[25] GUAN, L., LIU, P., XING, X., GE, X., ZHANG, S., YU, M.,AND JAEGER, T. TrustShadow: Secure execution of unmodifiedapplications with ARM trustzone. In Proceedings of the 15th An-nual International Conference on Mobile Systems, Applications,and Services (MobiSys’17) (2017).
[26] HWANG, C.-C. ptm2human. https://github.com/hwangcc23/ptm2human.
[27] JAIN, B., BAIG, M. B., ZHANG, D., PORTER, D. E., ANDSION, R. Sok: Introspections on trust and the semantic gap.In Proceedings of 35th IEEE Symposium on Security and Privacy(S&P’14) (2014).
[28] JANG, J. S., KONG, S., KIM, M., KIM, D., AND KANG, B. B.SeCReT: Secure Channel between Rich Execution Environmentand Trusted Execution Environment. In Proceedings of 22ndNetwork and Distributed System Security Symposium (NDSS’15)(2015).
[29] JING, Y., ZHAO, Z., AHN, G.-J., AND HU, H. Morpheus: au-tomatically generating heuristics to detect Android emulators. InProceedings of the 30th Annual Computer Security ApplicationsConference (ACSAC’14) (2014).
[30] KIRAT, DHILUNG AND VIGNA, GIOVANNI. MalGene: Auto-matic extraction of malware analysis evasion signature. In Pro-ceedings of the 22nd ACM SIGSAC Conference on Computer andCommunications Security (CCS’15) (2015).
[31] KIRAT, DHILUNG AND VIGNA, GIOVANNI AND KRUEGEL,CHRISTOPHER. Barecloud: Bare-metal analysis-based evasivemalware detection. In Proceedings of the 23rd USENIX SecuritySymposium (USENIX Security’14) (2014).
[32] LENGYEL, T. K., MARESCA, S., PAYNE, B. D., WEBSTER,G. D., VOGL, S., AND KIAYIAS, A. Scalability, fidelity andstealth in the drakvuf dynamic malware analysis system. InProceedings of the 30th Annual Computer Security ApplicationsConference (ACSAC’14) (2014).
[33] LITTY, L., LAGAR-CAVILLA, H. A., AND LIE, D. Hypervi-sor support for identifying covertly executing binaries. In Pro-ceedings of the 17th USENIX Security Symposium (USENIX Se-curity’08) (2008).
[34] MUTTI, S., FRATANTONIO, Y., BIANCHI, A., INVERNIZZI, L.,CORBETTA, J., KIRAT, D., KRUEGEL, C., AND VIGNA, G.BareDroid: Large-scale analysis of Android apps on real devices.In Proceedings of the 31st Annual Computer Security Applica-tions Conference (ACSAC’15) (2015).
[35] NETHERCOTE, N., AND SEWARD, J. Valgrind: a framework forheavyweight dynamic binary instrumentation. In Proceedings ofthe 28th ACM SIGPLAN Conference on Programming LanguageDesign and Implementation (PLDI’07) (2007).
[36] PETSAS, T., VOYATZIS, G., ATHANASOPOULOS, E., POLY-CHRONAKIS, M., AND IOANNIDIS, S. Rage against the virtualmachine: hindering dynamic analysis of Android malware. InProceedings of the 7th European Workshop on System Security(EurSec’14) (2014).
[37] PORTOKALIDIS, G., HOMBURG, P., ANAGNOSTAKIS, K., ANDBOS, H. Paranoid Android: Versatile protection for smartphones.In Proceedings of the 26th Annual Computer Security Applica-tions Conference (ACSAC’10) (2010).
[38] QIAN, C., LUO, X., SHAO, Y., AND CHAN, A. T. On trackinginformation flows through jni in android applications. In Pro-ceedings of The 44th Annual IEEE/IFIP International Confer-ence on Dependable Systems and Networks (DSN’14) (2014).

[39] SHI, H., ALWABEL, A., AND MIRKOVIC, J. Cardinal pill testingof system virtual machines. In Proceedings of the 23rd USENIXSecurity Symposium (USENIX Security’14) (2014).
[40] SONG, D., BRUMLEY, D., YIN, H., CABALLERO, J., JAGER,I., KANG, M. G., LIANG, Z., NEWSOME, J., POOSANKAM, P.,AND SAXENA, P. BitBlaze: A New Approach to Computer Secu-rity via Binary Analysis. In Proceedings of the 4th InternationalConference on Information Systems Security (ICISS’08) (2008).
[41] SPENSKY, C., HU, H., AND LEACH, K. LO-PHI: Low-observable physical host instrumentation for malware analysis.In Proceedings of 23rd Network and Distributed System SecuritySymposium (NDSS’16) (2016).
[42] SPISAK, M. Hardware-assisted rootkits: Abusing performancecounters on the ARM and x86 architectures. In Proceedings of the10th USENIX Workshop on Offensive Technologies (WOOT’16)(2016).
[43] SUN, H., SUN, K., WANG, Y., AND JING, J. TrustOTP: Trans-forming smartphones into secure one-time password tokens. InProceedings of the 22nd ACM SIGSAC Conference on Computerand Communications Security (CCS’15) (2015).
[44] SUN, M., WEI, T., AND LUI, J. TaintART: a practical multi-level information-flow tracking system for Android RunTime. InProceedings of the 23rd ACM SIGSAC Conference on Computerand Communications Security (CCS’16) (2016).
[45] TAM, K., KHAN, S. J., FATTORI, A., AND CAVALLARO, L.CopperDroid: Automatic reconstruction of Android malware be-haviors. In Proceedings of 22nd Network and Distributed SystemSecurity Symposium (NDSS’15) (2015).
[46] THE GNU MULTIPLE PRECISION ARITHMETIC LIBRARY. Piwith GMP. https://gmplib.org/.
[47] UBUNTU. sloccount. http://manpages.ubuntu.com/manpages/precise/man1/compute all.1.html.
[48] VIDAS, T., AND CHRISTIN, N. Evading Android runtime anal-ysis via sandbox detection. In Proceedings of the 9th ACM Sym-posium on Information, Computer and Communications Security(AsiaCCS’14) (2014).
[49] VOGL, S., AND ECKERT, C. Using hardware performance eventsfor instruction-level monitoring on the x86 architecture. In Pro-ceedings of the 2012 European Workshop on System Security (Eu-roSec12) (2012).
[50] XEN PROJECT. Xen ARM with virtualization ex-tensions. https://wiki.xenproject.org/wiki/Xen ARM with Virtualization Extensions.
[51] XINYANG GE, H. V., AND JAEGER, T. SPROBES: EnforcingKernel Code Integrity on the TrustZone Architecture. In Pro-ceedings of the 2014 Mobile Security Technologies (MoST’14)(2014).
[52] YAN, LOK KWONG AND YIN, HENG. Droidscope: Seamlesslyreconstructing the OS and Dalvik semantic views for dynamicAndroid malware analysis. In Proceedings of the 21st USENIXSecurity Symposium (USENIX Security’12) (2012).
[53] YU, R. Android packers: facing the challenges, building solu-tions. In Proceedings of the Virus Bulletin Conference (VB’14)(2014).
[54] ZHANG, F., LEACH, K., STAVROU, A., AND WANG, H. Usinghardware features for increased debugging transparency. In Pro-ceedings of The 36th IEEE Symposium on Security and Privacy(S&P’15) (2015), pp. 55–69.
[55] ZHANG, Y., YANG, M., XU, B., YANG, Z., GU, G., NING, P.,WANG, X. S., AND ZANG, B. Vetting undesirable behaviors inAndroid apps with permission use analysis. In Proceedings ofthe 20th ACM SIGSAC Conference on Computer and Communi-cations Security (CCS’13) (2013).
[56] ZHENG, MIN AND SUN, MINGSHEN AND LUI, JOHN CS.DroidTrace: A ptrace based Android dynamic analysis sys-tem with forward execution capability. In 2014 InternationalWireless Communications and Mobile Computing Conference(IWCMC’14) (2014).
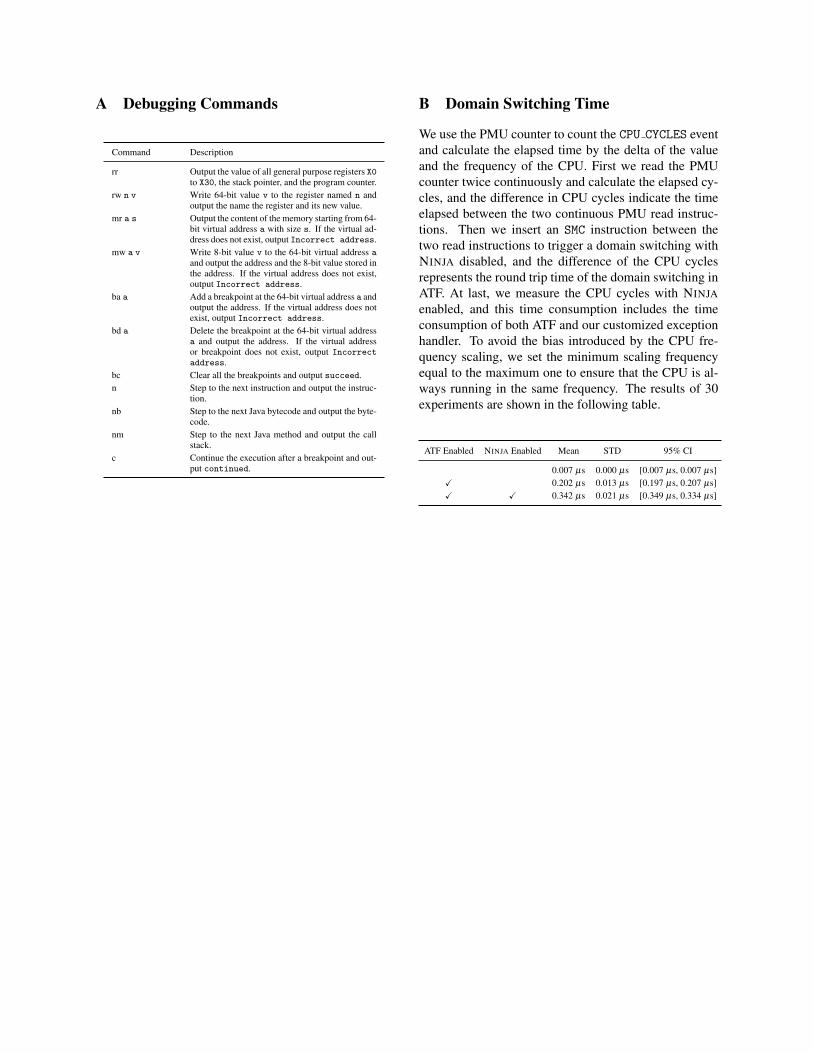
A Debugging Commands
Command Description
rr Output the value of all general purpose registers X0to X30, the stack pointer, and the program counter.
rw n v Write 64-bit value v to the register named n andoutput the name the register and its new value.
mr a s Output the content of the memory starting from 64-bit virtual address a with size s. If the virtual ad-dress does not exist, output Incorrect address.
mw a v Write 8-bit value v to the 64-bit virtual address aand output the address and the 8-bit value stored inthe address. If the virtual address does not exist,output Incorrect address.
ba a Add a breakpoint at the 64-bit virtual address a andoutput the address. If the virtual address does notexist, output Incorrect address.
bd a Delete the breakpoint at the 64-bit virtual addressa and output the address. If the virtual addressor breakpoint does not exist, output Incorrectaddress.
bc Clear all the breakpoints and output succeed.n Step to the next instruction and output the instruc-
tion.nb Step to the next Java bytecode and output the byte-
code.nm Step to the next Java method and output the call
stack.c Continue the execution after a breakpoint and out-
put continued.
B Domain Switching Time
We use the PMU counter to count the CPU CYCLES eventand calculate the elapsed time by the delta of the valueand the frequency of the CPU. First we read the PMUcounter twice continuously and calculate the elapsed cy-cles, and the difference in CPU cycles indicate the timeelapsed between the two continuous PMU read instruc-tions. Then we insert an SMC instruction between thetwo read instructions to trigger a domain switching withNINJA disabled, and the difference of the CPU cyclesrepresents the round trip time of the domain switching inATF. At last, we measure the CPU cycles with NINJAenabled, and this time consumption includes the timeconsumption of both ATF and our customized exceptionhandler. To avoid the bias introduced by the CPU fre-quency scaling, we set the minimum scaling frequencyequal to the maximum one to ensure that the CPU is al-ways running in the same frequency. The results of 30experiments are shown in the following table.
ATF Enabled NINJA Enabled Mean STD 95% CI
0.007 µs 0.000 µs [0.007 µs, 0.007 µs]X 0.202 µs 0.013 µs [0.197 µs, 0.207 µs]X X 0.342 µs 0.021 µs [0.349 µs, 0.334 µs]