Embed Size (px)
Citation preview
Ninth Economic Impact Survey January 2012
Jan 2012 Secretariat of the ACE, Brussels www.ace-cae.eu
January 2012
Ninth Snapshot Survey of the
Impact of Economic Downturn

Ninth Economic Impact Survey January 2012
Jan 2012 Secretariat of the ACE, Brussels www.ace-cae.eu
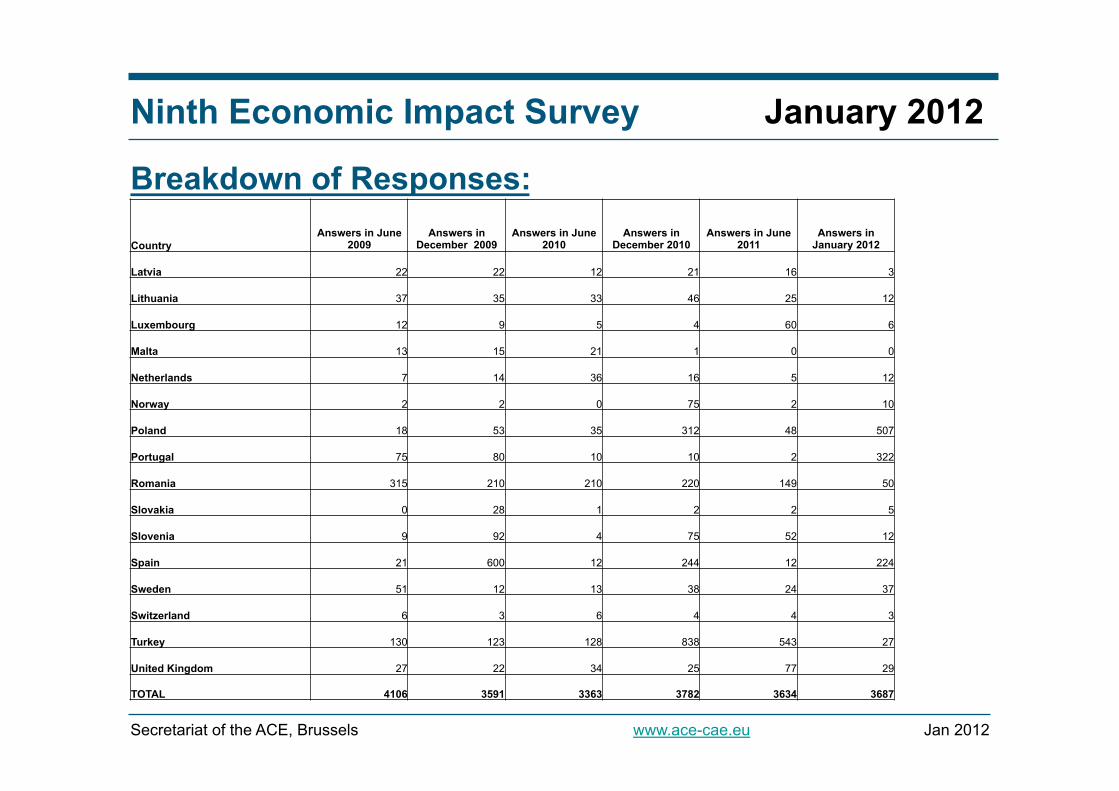
Breakdown of Responses:
Country Answers in June
2009 Answers in
December 2009 Answers in June
2010 Answers in
December 2010 Answers in June 2011
Answers in January 2012
Austria 7 19 4 9 12 10
Belgium 630 39 336 48 352 26
Bosnia & Herzegovina 2 0 1 0 0 0
Bulgaria 17 96 75 164 251 256
Croatia 126 5 251 28 133 182
Cyprus 3 0 4 2 2 5
Czech Republic 55 67 134 224 216 10
Denmark 92 14 23 14 16 23
Estonia 23 39 17 1 2 12
Finland 32 17 12 18 22 11
France 1736 1652 1058 874 1049 1357
FYROM 0 3 1 1 0 1
Germany 127 87 429 90 12 25
Greece 216 180 225 321 265 414
Hungary 121 0 2 2 1 3
Ireland 91 14 216 43 266 68
Italy 83 39 16 12 14 25
Ninth Economic Impact Survey January 2012
Jan 2012 Secretariat of the ACE, Brussels www.ace-cae.eu
Breakdown of Responses: Country
Answers in June 2009
Answers in December 2009
Answers in June 2010
Answers in December 2010
Answers in June 2011
Answers in January 2012
Latvia 22 22 12 21 16 3
Lithuania 37 35 33 46 25 12
Luxembourg 12 9 5 4 60 6
Malta 13 15 21 1 0 0
Netherlands 7 14 36 16 5 12
Norway 2 2 0 75 2 10
Poland 18 53 35 312 48 507
Portugal 75 80 10 10 2 322
Romania 315 210 210 220 149 50
Slovakia 0 28 1 2 2 5
Slovenia 9 92 4 75 52 12
Spain 21 600 12 244 12 224
Sweden 51 12 13 38 24 37
Switzerland 6 3 6 4 4 3
Turkey 130 123 128 838 543 27
United Kingdom 27 22 34 25 77 29
TOTAL 4106 3591 3363 3782 3634 3687
Ninth Economic Impact Survey January 2012
Jan 2012 Secretariat of the ACE, Brussels www.ace-cae.eu
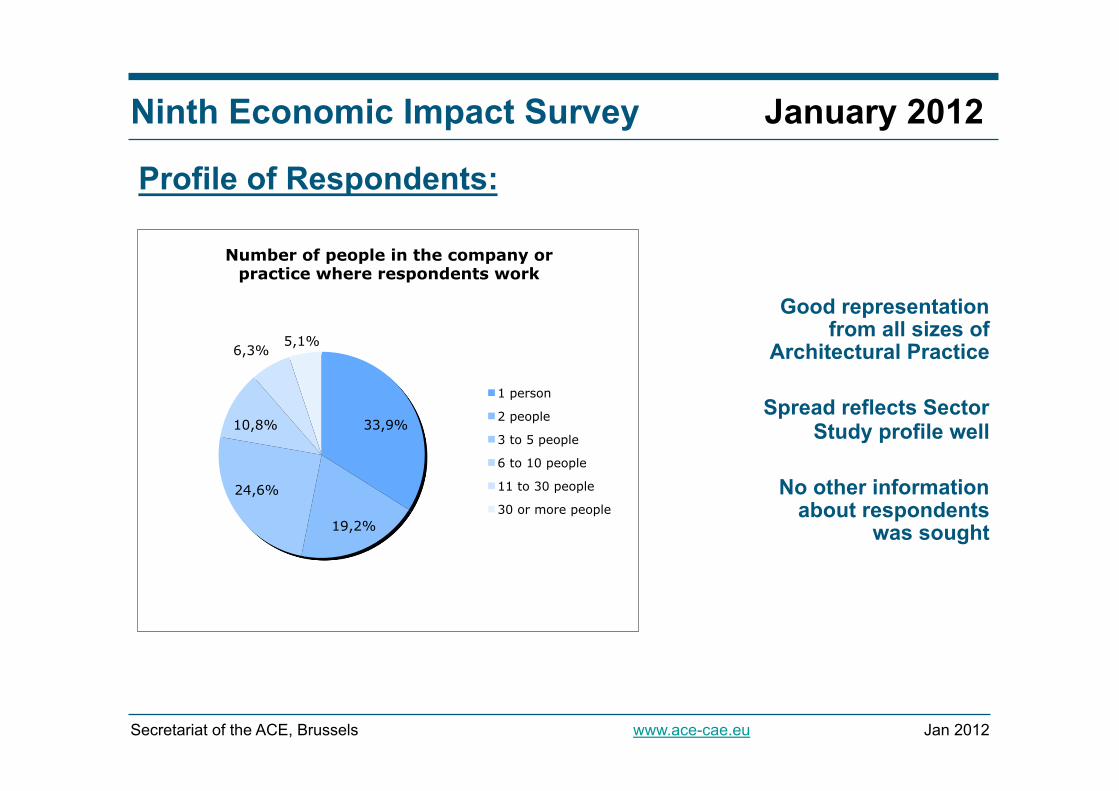
Profile of Respondents:
Good representation from all sizes of
Architectural Practice
Spread reflects Sector Study profile well
No other information
about respondents was sought
33,9%
19,2%
24,6%
10,8%
6,3% 5,1%
Number of people in the company or practice where respondents work
1 person
2 people
3 to 5 people
6 to 10 people
11 to 30 people
30 or more people
Ninth Economic Impact Survey January 2012
Jan 2012 Secretariat of the ACE, Brussels www.ace-cae.eu
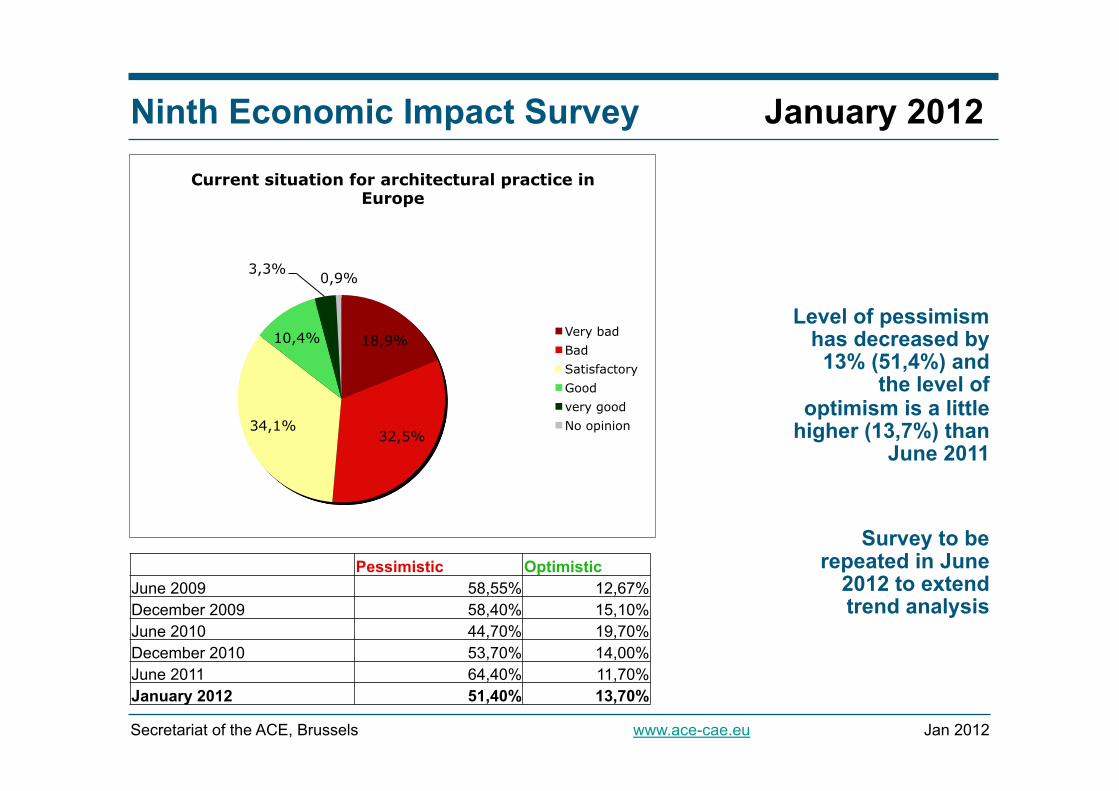
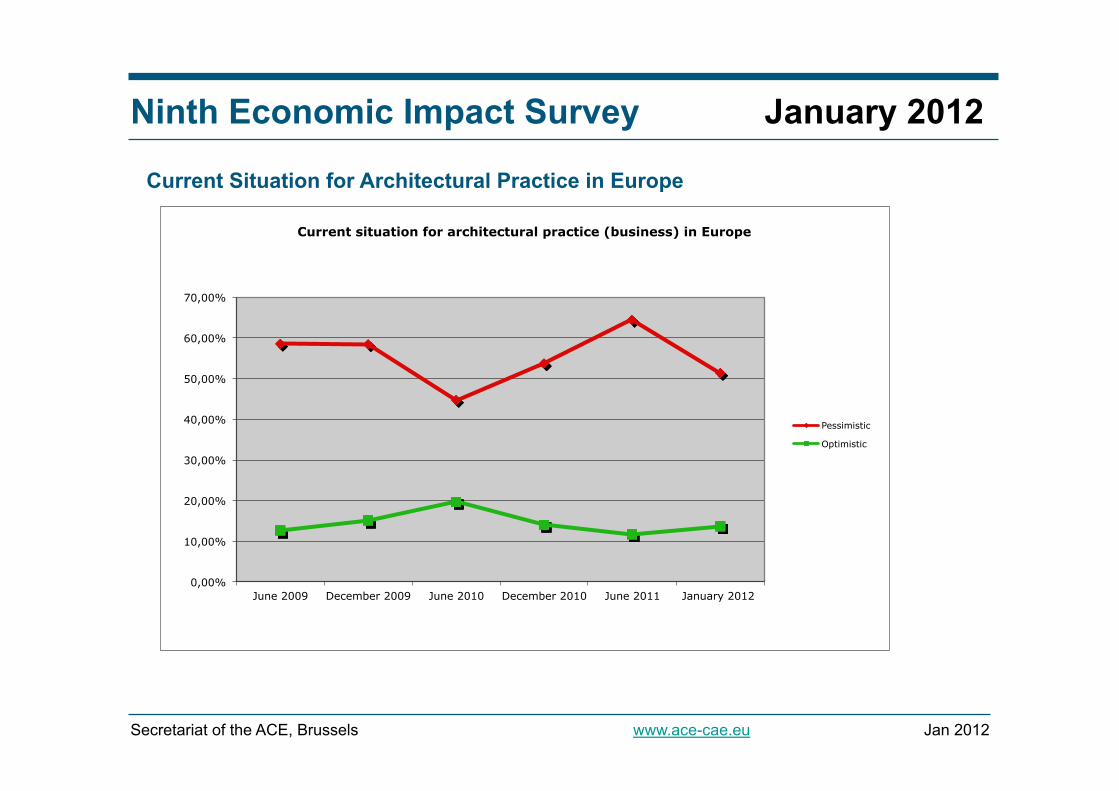
Level of pessimism has decreased by
13% (51,4%) and the level of
optimism is a little higher (13,7%) than
June 2011
Survey to be repeated in June
2012 to extend trend analysis
18,9%
32,5% 34,1%
10,4%
3,3% 0,9%
Current situation for architectural practice in Europe
Very bad Bad Satisfactory Good very good No opinion
Pessimistic Optimistic June 2009 58,55% 12,67% December 2009 58,40% 15,10% June 2010 44,70% 19,70% December 2010 53,70% 14,00% June 2011 64,40% 11,70% January 2012 51,40% 13,70%
Ninth Economic Impact Survey January 2012
Jan 2012 Secretariat of the ACE, Brussels www.ace-cae.eu
Current Situation for Architectural Practice in Europe
0,00%
10,00%
20,00%
30,00%
40,00%
50,00%
60,00%
70,00%
June 2009 December 2009 June 2010 December 2010 June 2011 January 2012
Current situation for architectural practice (business) in Europe
Pessimistic
Optimistic
Ninth Economic Impact Survey January 2012
Jan 2012 Secretariat of the ACE, Brussels www.ace-cae.eu
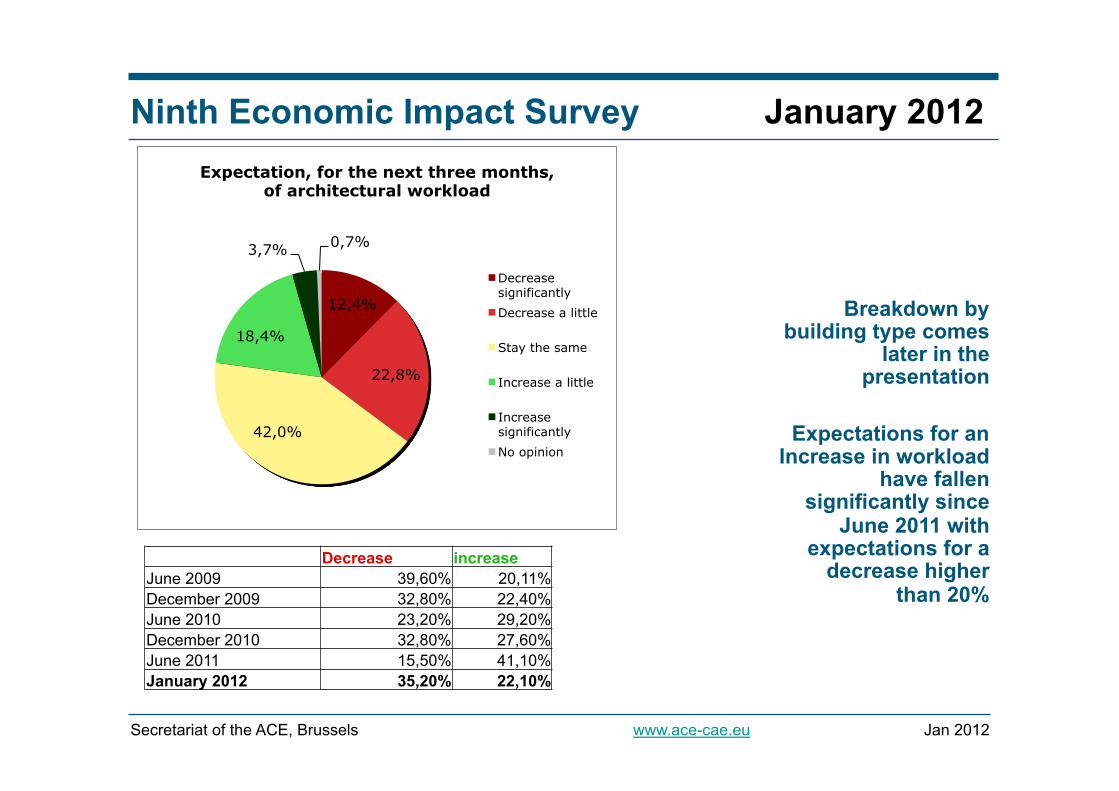
Breakdown by building type comes
later in the presentation
Expectations for an
Increase in workload have fallen
significantly since June 2011 with
expectations for a decrease higher
than 20%
12,4%
22,8%
42,0%
18,4%
3,7% 0,7%
Expectation, for the next three months, of architectural workload
Decrease significantly Decrease a little
Stay the same
Increase a little
Increase significantly No opinion
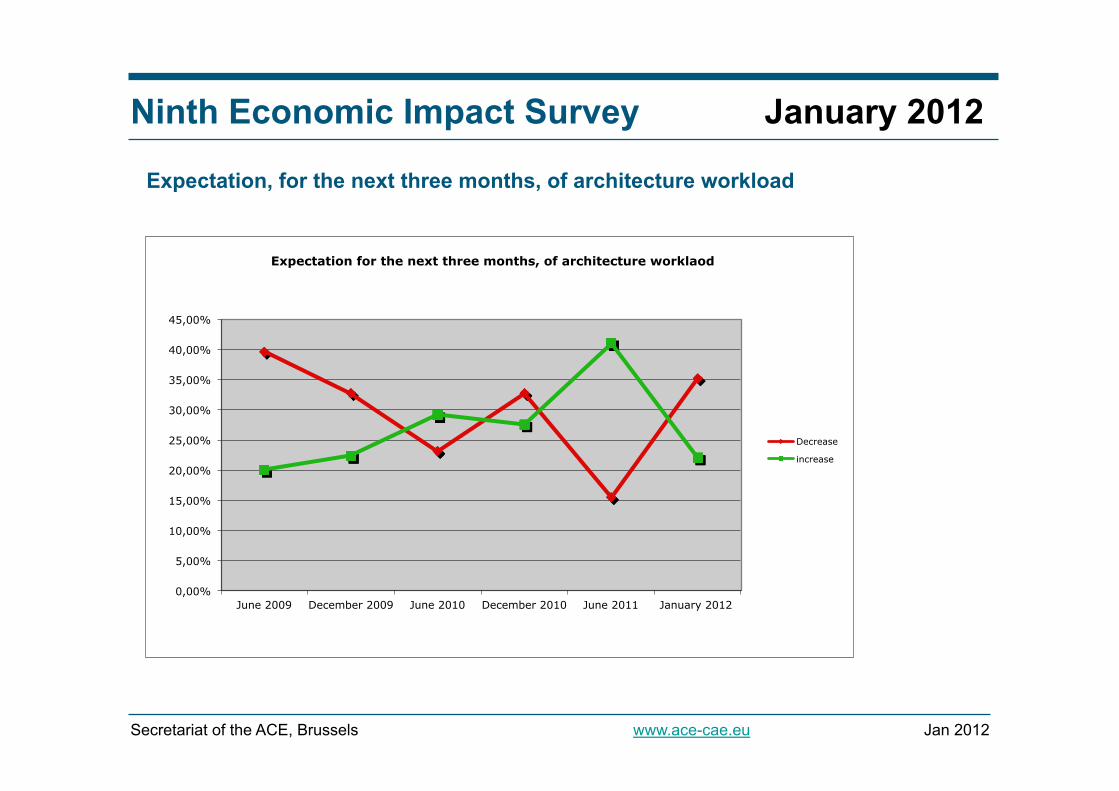
Decrease increase June 2009 39,60% 20,11% December 2009 32,80% 22,40% June 2010 23,20% 29,20% December 2010 32,80% 27,60% June 2011 15,50% 41,10% January 2012 35,20% 22,10%
Ninth Economic Impact Survey January 2012
Jan 2012 Secretariat of the ACE, Brussels www.ace-cae.eu
Expectation, for the next three months, of architecture workload
0,00%
5,00%
10,00%
15,00%
20,00%
25,00%
30,00%
35,00%
40,00%
45,00%
June 2009 December 2009 June 2010 December 2010 June 2011 January 2012
Expectation for the next three months, of architecture worklaod
Decrease
increase
Ninth Economic Impact Survey January 2012
Jan 2012 Secretariat of the ACE, Brussels www.ace-cae.eu
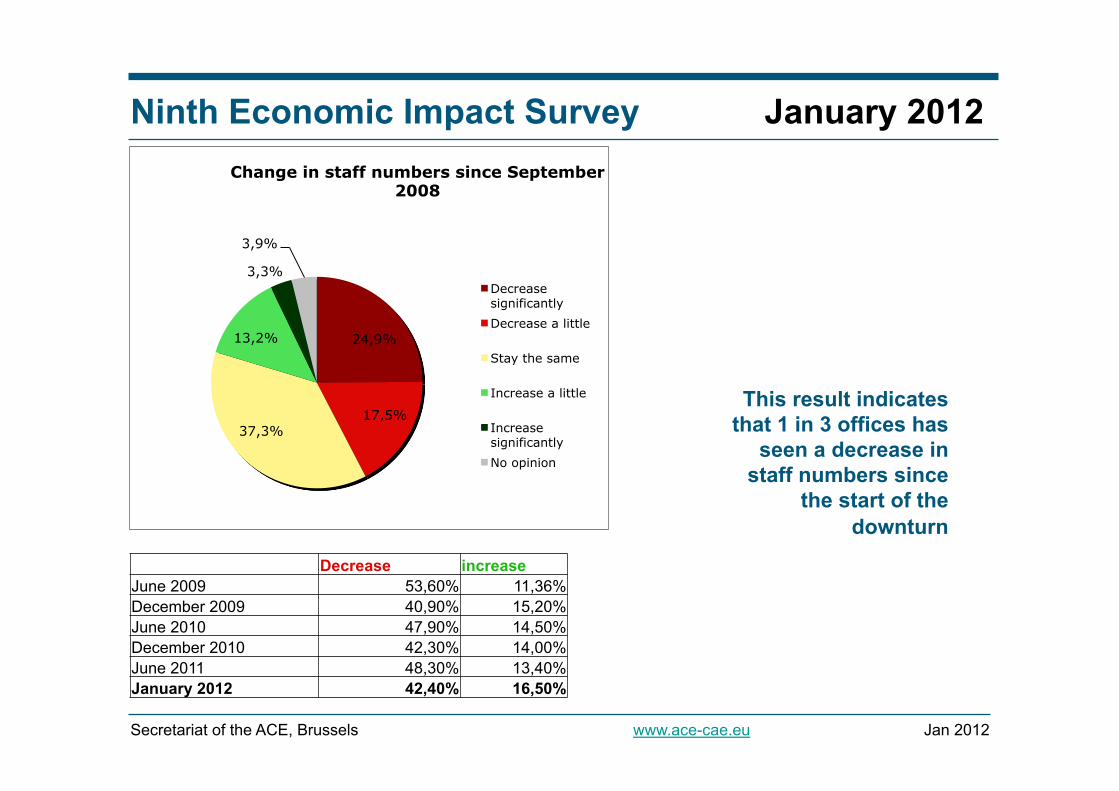
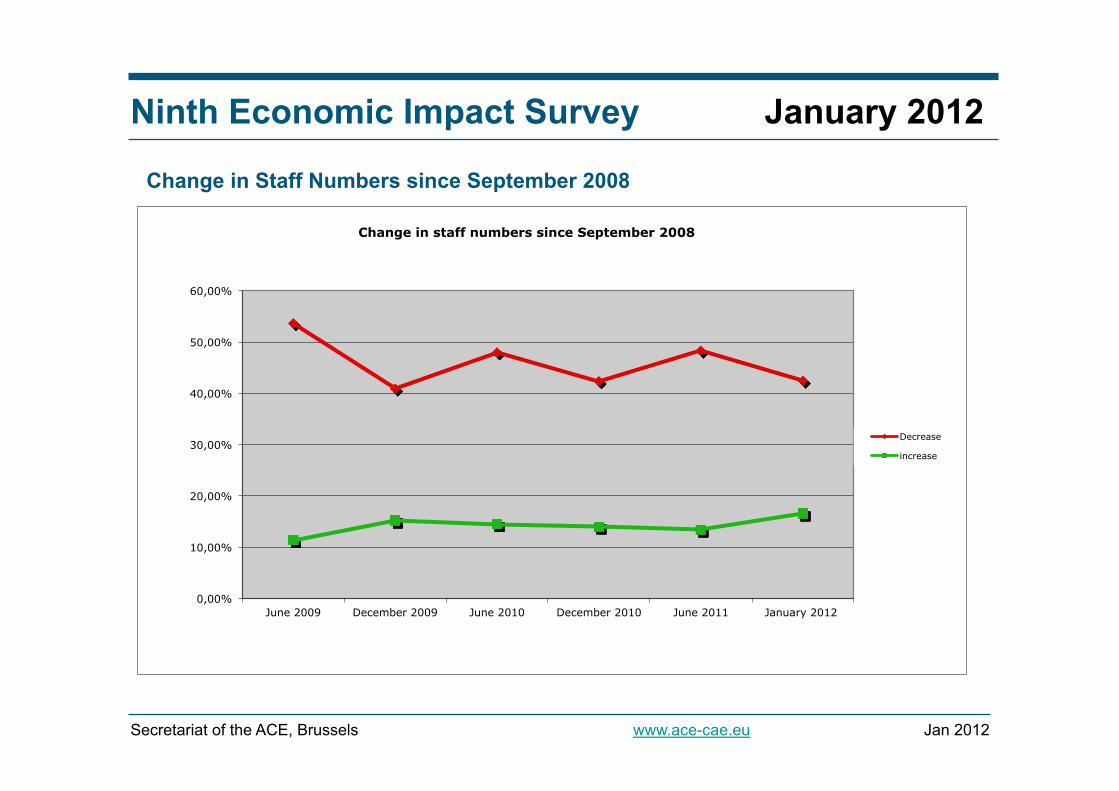
This result indicates that 1 in 3 offices has
seen a decrease in staff numbers since
the start of the downturn
24,9%
17,5% 37,3%
13,2%
3,3%
3,9%
Change in staff numbers since September 2008
Decrease significantly Decrease a little
Stay the same
Increase a little
Increase significantly No opinion
Decrease increase June 2009 53,60% 11,36% December 2009 40,90% 15,20% June 2010 47,90% 14,50% December 2010 42,30% 14,00% June 2011 48,30% 13,40% January 2012 42,40% 16,50%
Ninth Economic Impact Survey January 2012
Jan 2012 Secretariat of the ACE, Brussels www.ace-cae.eu
Change in Staff Numbers since September 2008
0,00%
10,00%
20,00%
30,00%
40,00%
50,00%
60,00%
June 2009 December 2009 June 2010 December 2010 June 2011 January 2012
Change in staff numbers since September 2008
Decrease
increase
Ninth Economic Impact Survey January 2012
Jan 2012 Secretariat of the ACE, Brussels www.ace-cae.eu
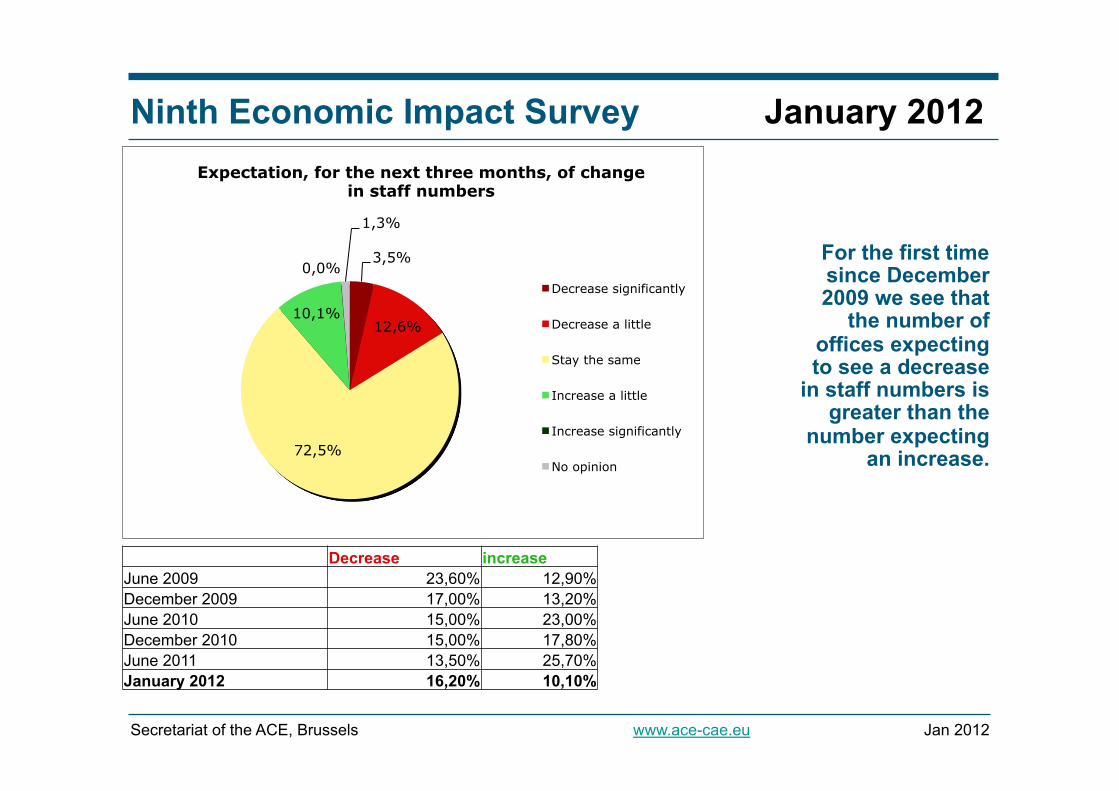
For the first time since December 2009 we see that
the number of offices expecting to see a decrease
in staff numbers is greater than the
number expecting an increase.
3,5%
12,6%
72,5%
10,1%
0,0%
1,3%
Expectation, for the next three months, of change in staff numbers
Decrease significantly
Decrease a little
Stay the same
Increase a little
Increase significantly
No opinion
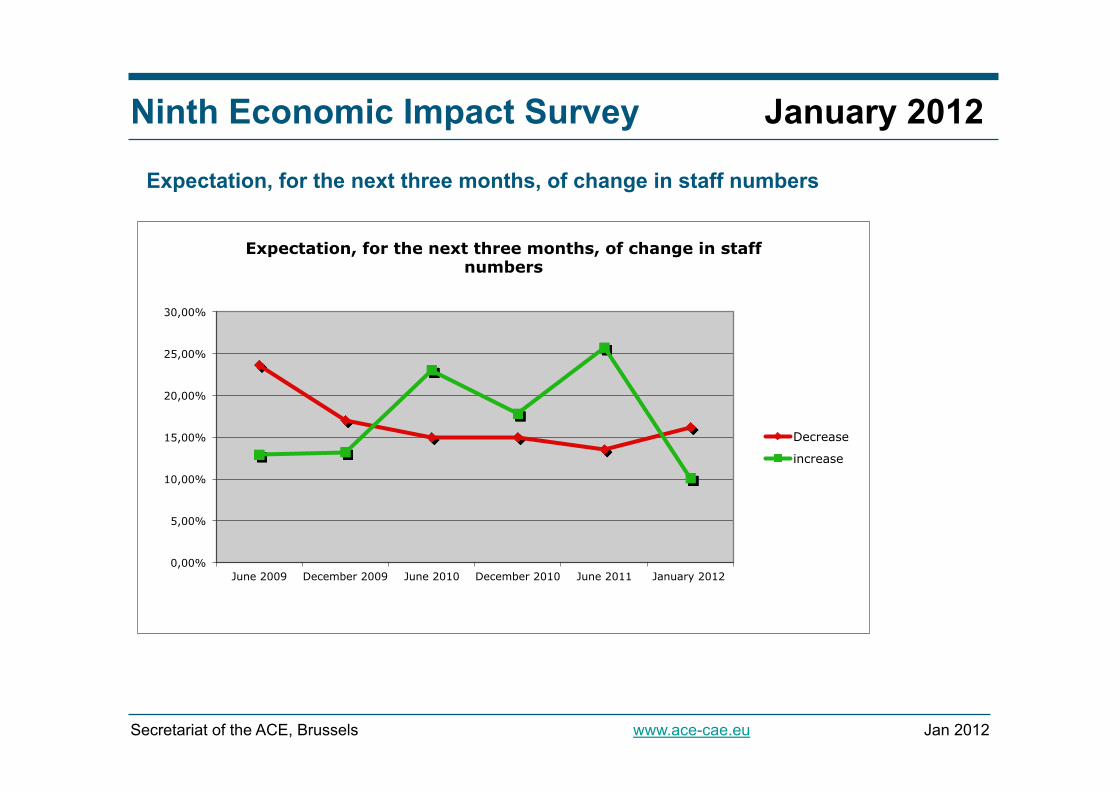
Decrease increase June 2009 23,60% 12,90% December 2009 17,00% 13,20% June 2010 15,00% 23,00% December 2010 15,00% 17,80% June 2011 13,50% 25,70% January 2012 16,20% 10,10%
Ninth Economic Impact Survey January 2012
Jan 2012 Secretariat of the ACE, Brussels www.ace-cae.eu
Expectation, for the next three months, of change in staff numbers
0,00%
5,00%
10,00%
15,00%
20,00%
25,00%
30,00%
June 2009 December 2009 June 2010 December 2010 June 2011 January 2012
Expectation, for the next three months, of change in staff numbers
Decrease
increase
Ninth Economic Impact Survey January 2012
Jan 2012 Secretariat of the ACE, Brussels www.ace-cae.eu
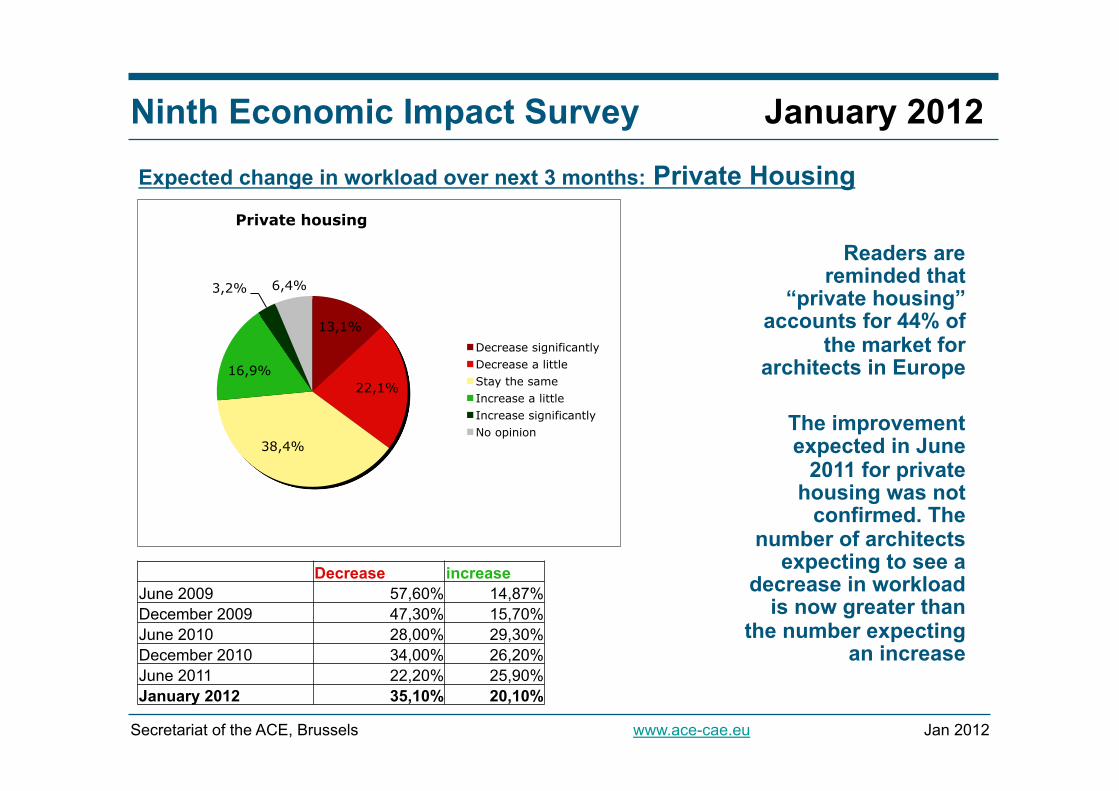
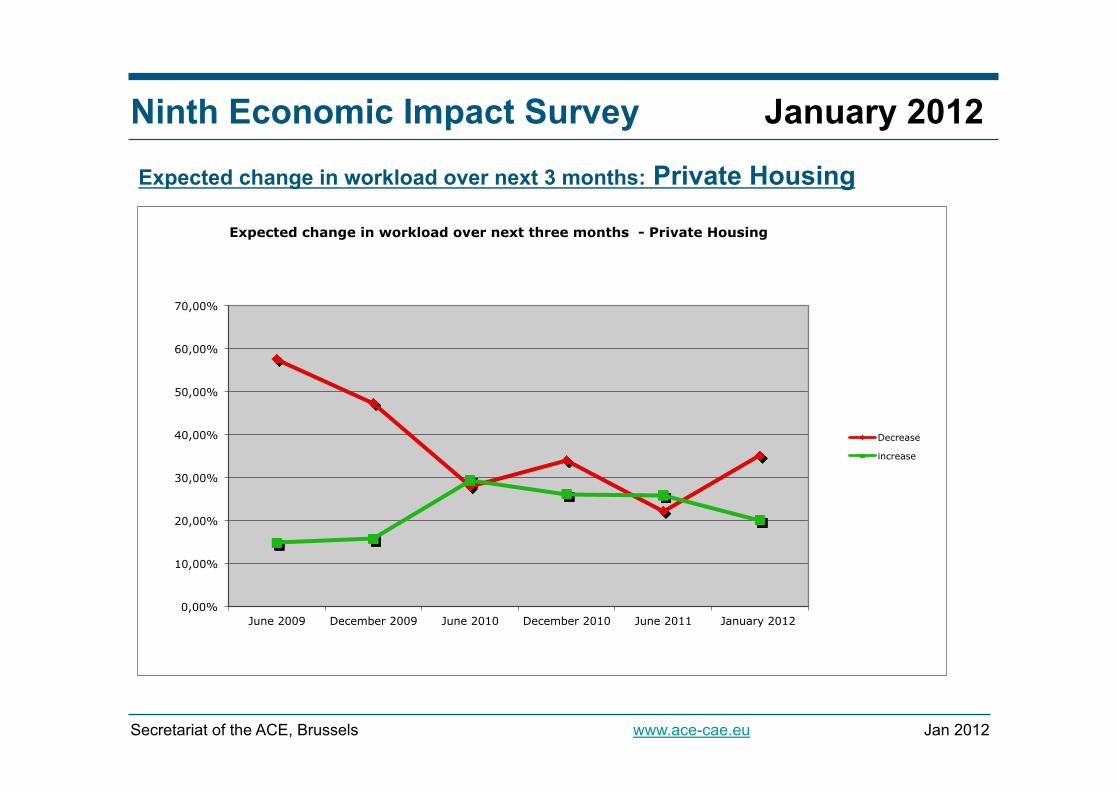
Readers are reminded that
“private housing” accounts for 44% of
the market for architects in Europe
The improvement expected in June
2011 for private housing was not
confirmed. The number of architects
expecting to see a decrease in workload
is now greater than the number expecting
an increase
Expected change in workload over next 3 months: Private Housing
13,1%
22,1%
38,4%
16,9%
3,2% 6,4%
Private housing
Decrease significantly Decrease a little Stay the same Increase a little Increase significantly No opinion
Decrease increase June 2009 57,60% 14,87% December 2009 47,30% 15,70% June 2010 28,00% 29,30% December 2010 34,00% 26,20% June 2011 22,20% 25,90% January 2012 35,10% 20,10%
Ninth Economic Impact Survey January 2012
Jan 2012 Secretariat of the ACE, Brussels www.ace-cae.eu
Expected change in workload over next 3 months: Private Housing
0,00%
10,00%
20,00%
30,00%
40,00%
50,00%
60,00%
70,00%
June 2009 December 2009 June 2010 December 2010 June 2011 January 2012
Expected change in workload over next three months - Private Housing
Decrease
increase
Ninth Economic Impact Survey January 2012
Jan 2012 Secretariat of the ACE, Brussels www.ace-cae.eu
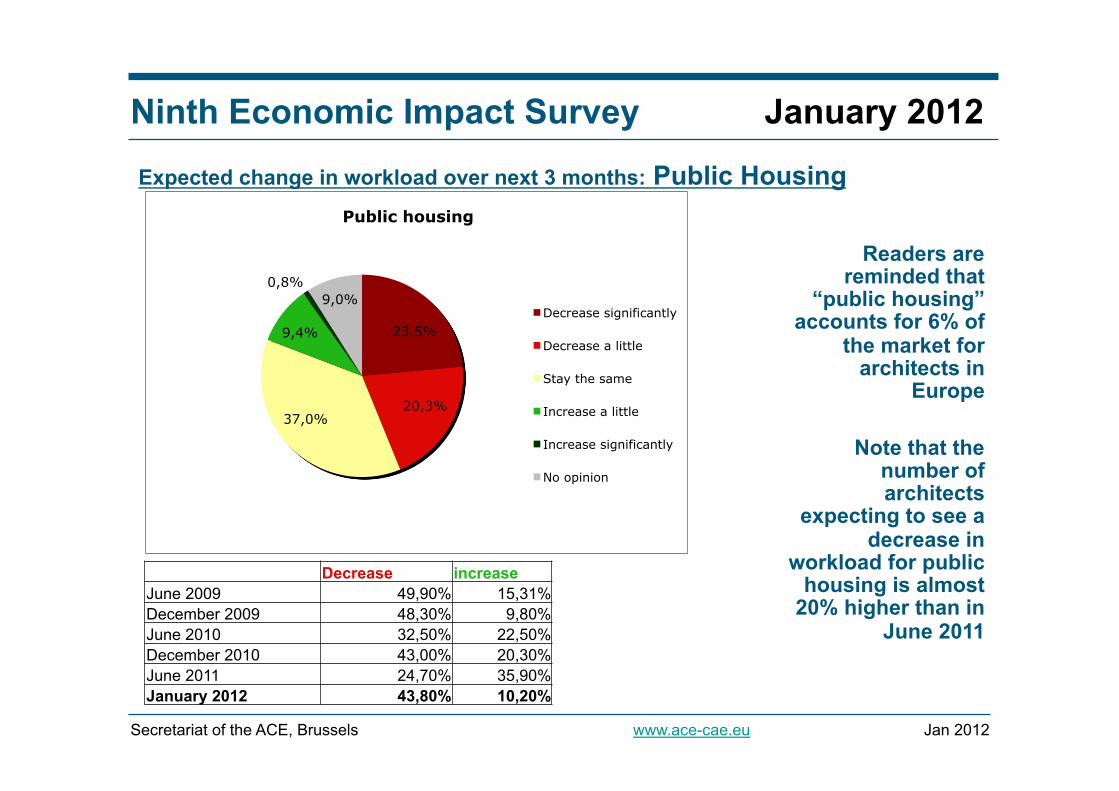
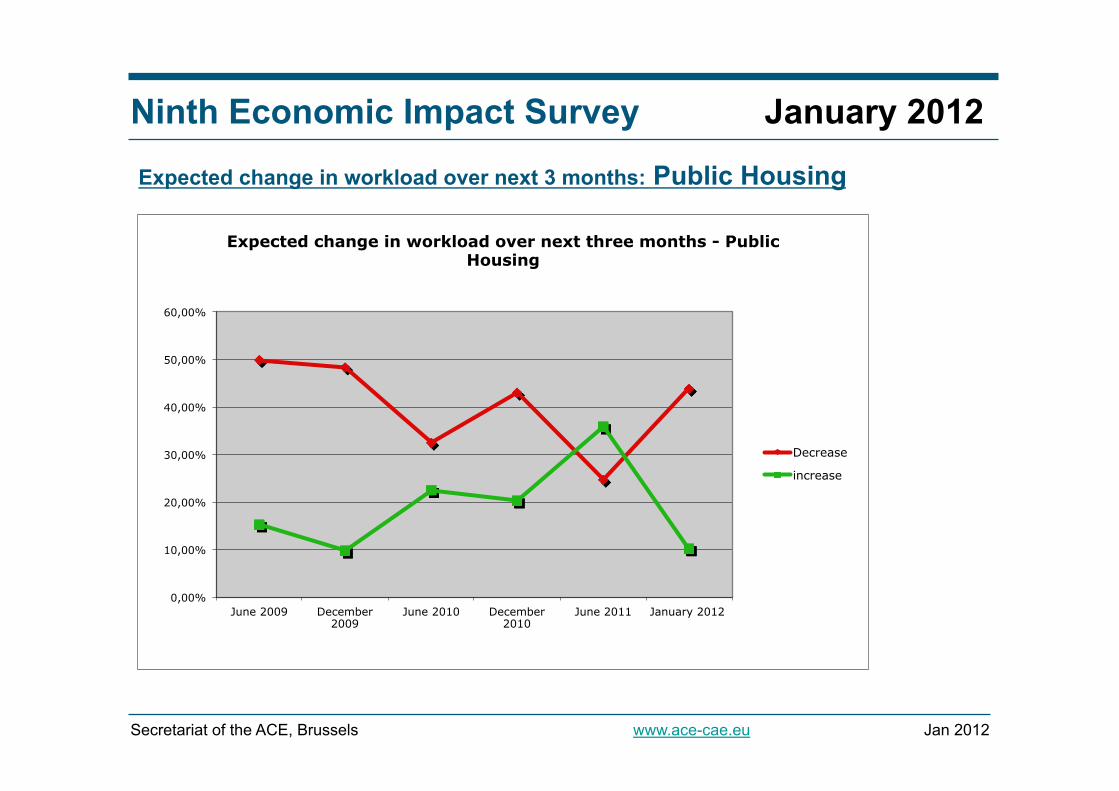
Readers are reminded that
“public housing” accounts for 6% of
the market for architects in
Europe
Note that the number of architects
expecting to see a decrease in
workload for public housing is almost
20% higher than in June 2011
Expected change in workload over next 3 months: Public Housing
23,5%
20,3% 37,0%
9,4%
0,8% 9,0%
Public housing
Decrease significantly
Decrease a little
Stay the same
Increase a little
Increase significantly
No opinion
Decrease increase June 2009 49,90% 15,31% December 2009 48,30% 9,80% June 2010 32,50% 22,50% December 2010 43,00% 20,30% June 2011 24,70% 35,90% January 2012 43,80% 10,20%
Ninth Economic Impact Survey January 2012
Jan 2012 Secretariat of the ACE, Brussels www.ace-cae.eu
Expected change in workload over next 3 months: Public Housing
0,00%
10,00%
20,00%
30,00%
40,00%
50,00%
60,00%
June 2009 December 2009
June 2010 December 2010
June 2011 January 2012
Expected change in workload over next three months - Public Housing
Decrease
increase
Ninth Economic Impact Survey January 2012
Jan 2012 Secretariat of the ACE, Brussels www.ace-cae.eu
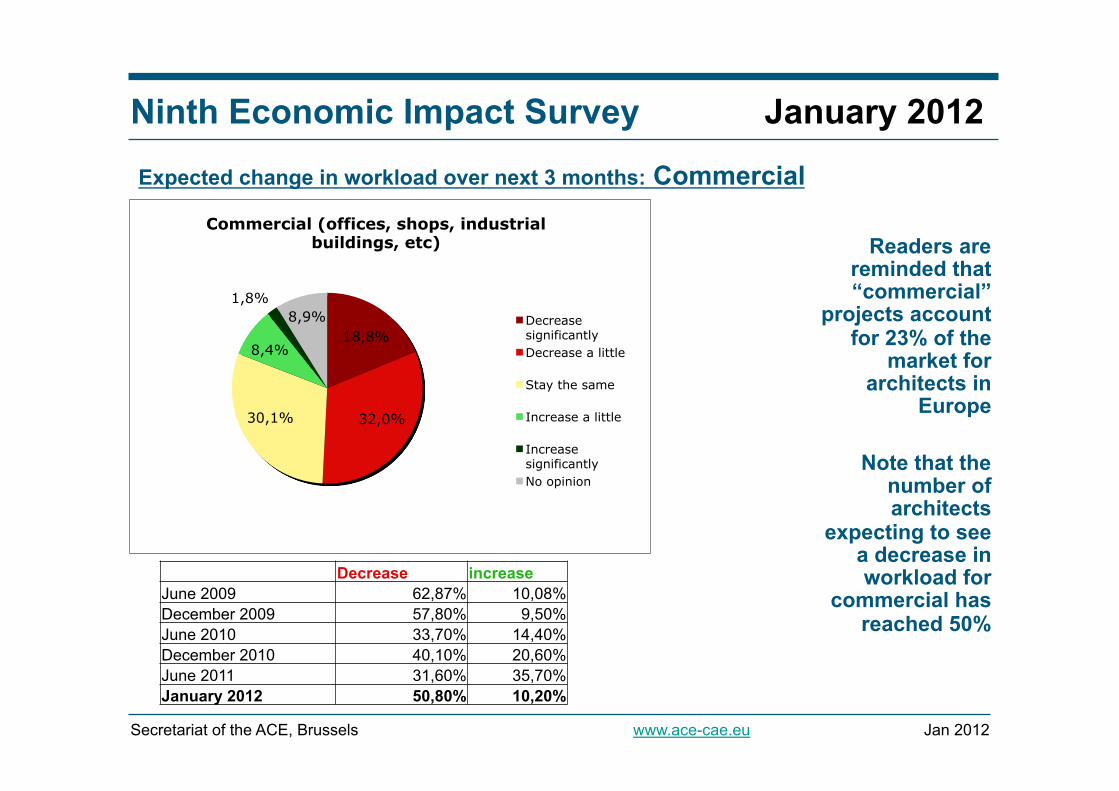
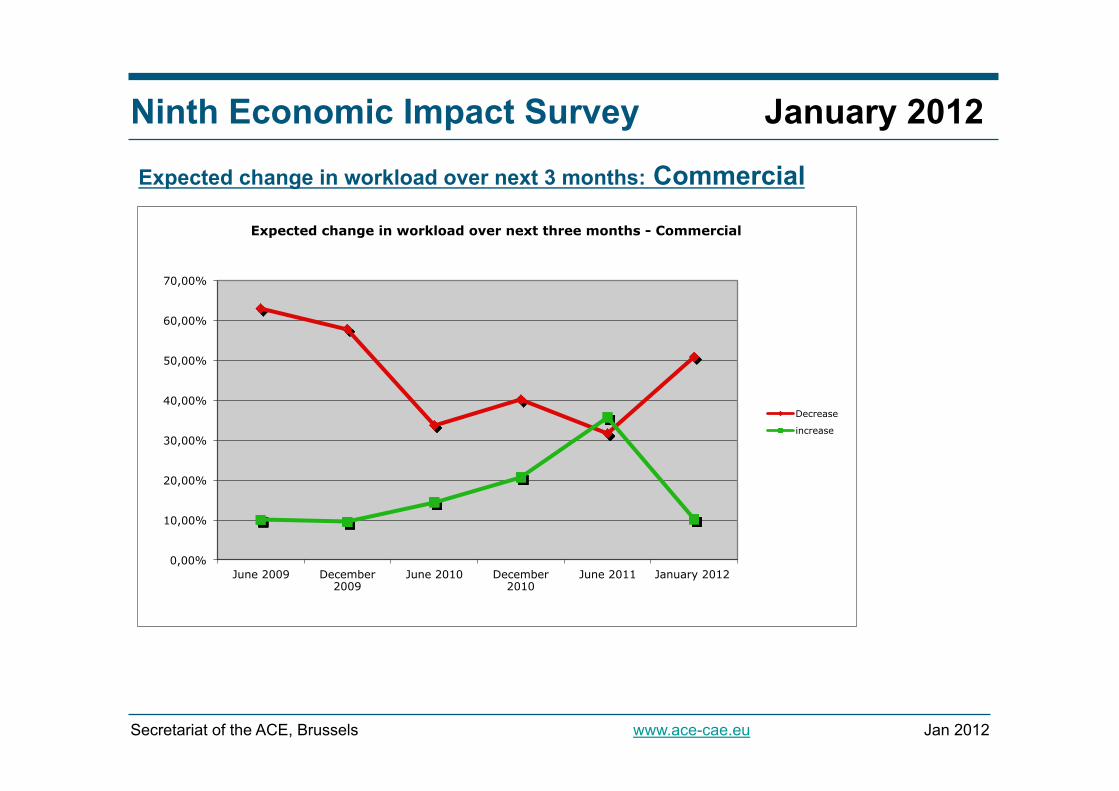
Readers are reminded that “commercial”
projects account for 23% of the
market for architects in
Europe
Note that the number of architects
expecting to see a decrease in workload for
commercial has reached 50%
Expected change in workload over next 3 months: Commercial
Decrease increase June 2009 62,87% 10,08% December 2009 57,80% 9,50% June 2010 33,70% 14,40% December 2010 40,10% 20,60% June 2011 31,60% 35,70% January 2012 50,80% 10,20%
18,8%
32,0% 30,1%
8,4%
1,8% 8,9%
Commercial (offices, shops, industrial buildings, etc)
Decrease significantly Decrease a little
Stay the same
Increase a little
Increase significantly No opinion
Ninth Economic Impact Survey January 2012
Jan 2012 Secretariat of the ACE, Brussels www.ace-cae.eu
Expected change in workload over next 3 months: Commercial
0,00%
10,00%
20,00%
30,00%
40,00%
50,00%
60,00%
70,00%
June 2009 December 2009
June 2010 December 2010
June 2011 January 2012
Expected change in workload over next three months - Commercial
Decrease
increase
Ninth Economic Impact Survey January 2012
Jan 2012 Secretariat of the ACE, Brussels www.ace-cae.eu
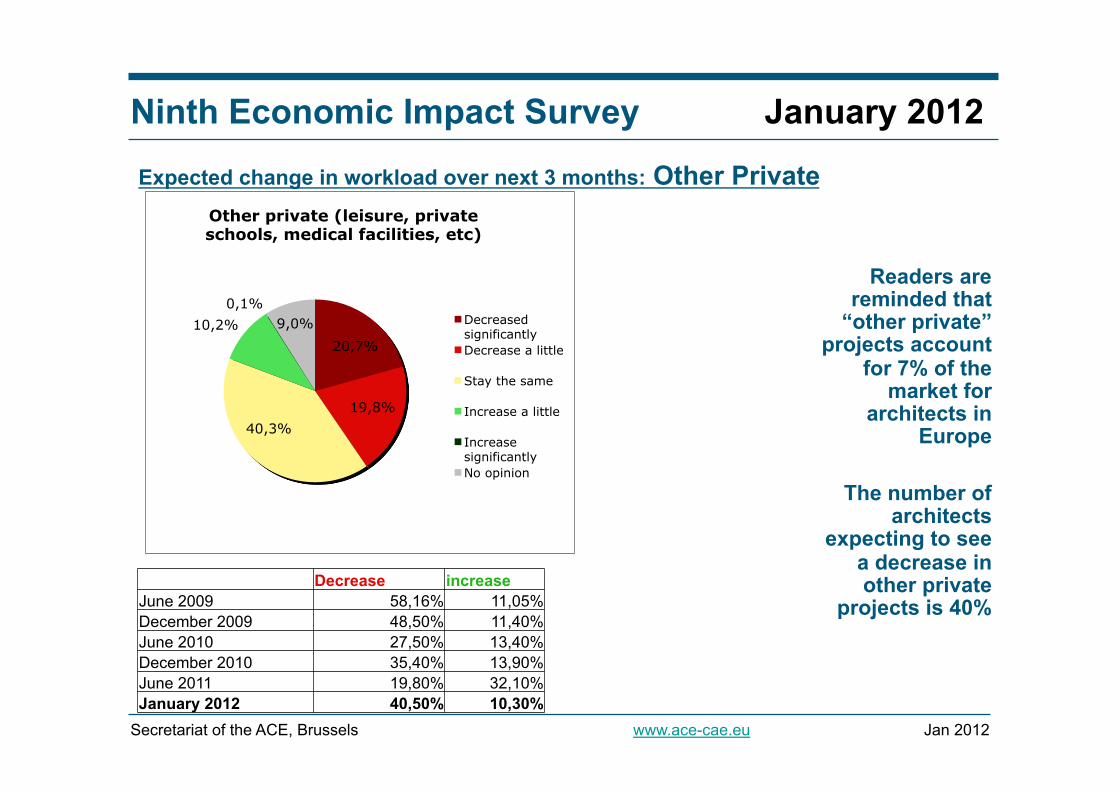
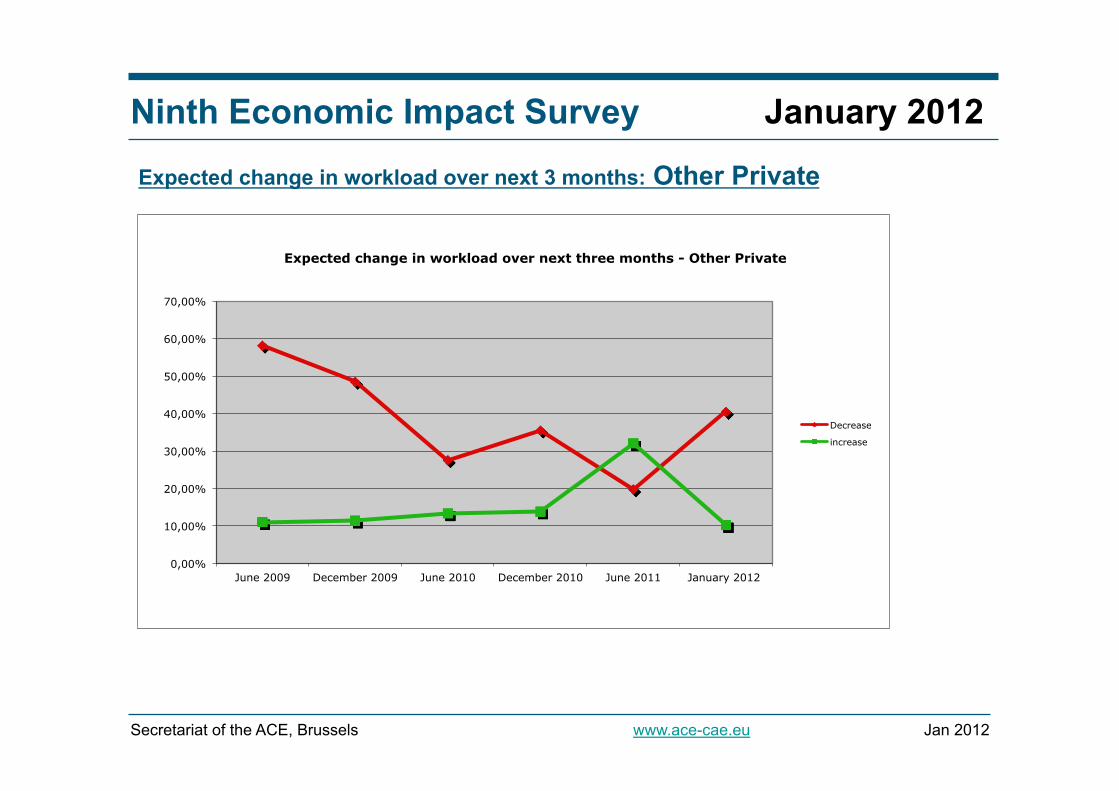
Readers are reminded that
“other private” projects account
for 7% of the market for
architects in Europe
The number of
architects expecting to see
a decrease in other private
projects is 40%
Expected change in workload over next 3 months: Other Private
Decrease increase June 2009 58,16% 11,05% December 2009 48,50% 11,40% June 2010 27,50% 13,40% December 2010 35,40% 13,90% June 2011 19,80% 32,10% January 2012 40,50% 10,30%
20,7%
19,8% 40,3%
10,2% 0,1%
9,0%
Other private (leisure, private schools, medical facilities, etc)
Decreased significantly Decrease a little
Stay the same
Increase a little
Increase significantly No opinion
Ninth Economic Impact Survey January 2012
Jan 2012 Secretariat of the ACE, Brussels www.ace-cae.eu
Expected change in workload over next 3 months: Other Private
0,00%
10,00%
20,00%
30,00%
40,00%
50,00%
60,00%
70,00%
June 2009 December 2009 June 2010 December 2010 June 2011 January 2012
Expected change in workload over next three months - Other Private
Decrease
increase
Ninth Economic Impact Survey January 2012
Jan 2012 Secretariat of the ACE, Brussels www.ace-cae.eu
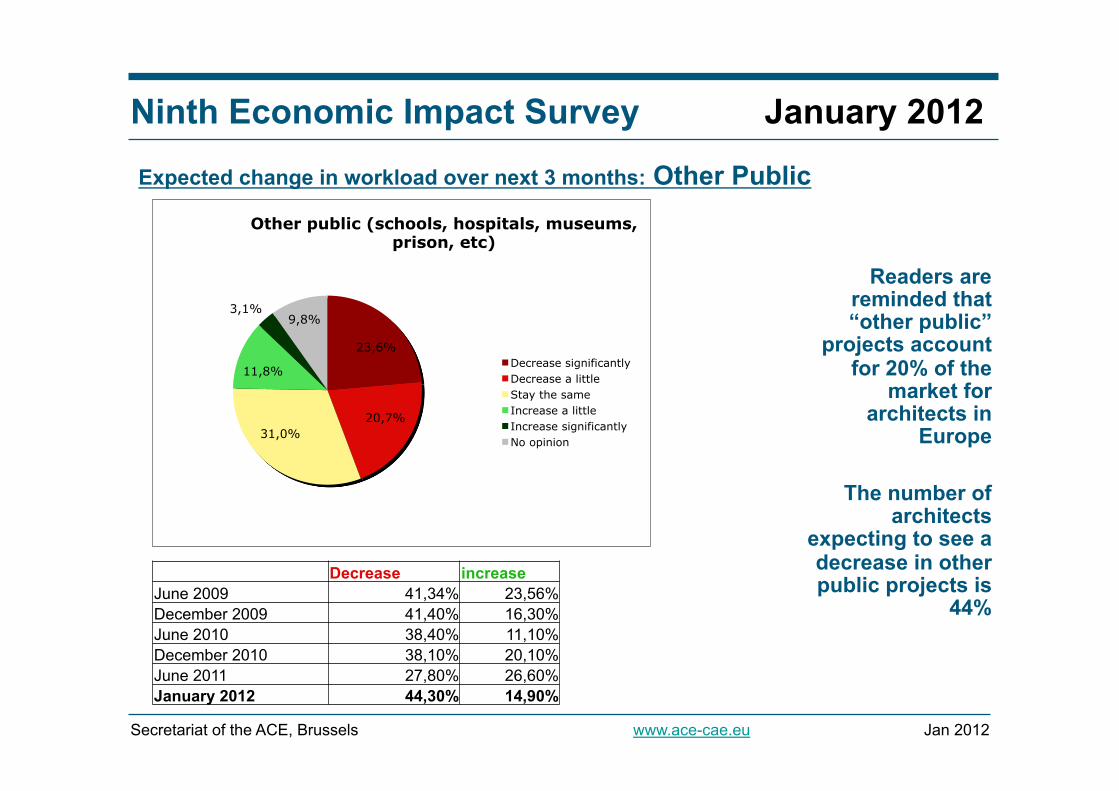
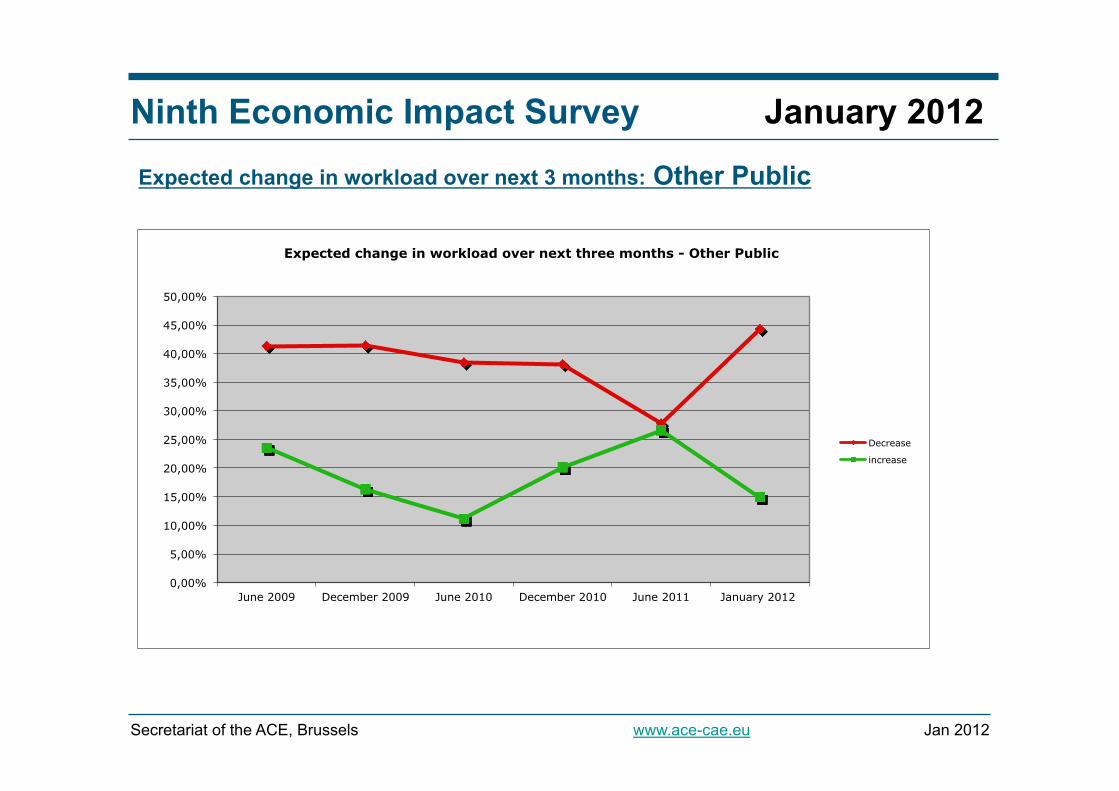
Readers are reminded that “other public”
projects account for 20% of the
market for architects in
Europe
The number of architects
expecting to see a decrease in other public projects is
44%
Expected change in workload over next 3 months: Other Public
Decrease increase June 2009 41,34% 23,56% December 2009 41,40% 16,30% June 2010 38,40% 11,10% December 2010 38,10% 20,10% June 2011 27,80% 26,60% January 2012 44,30% 14,90%
23,6%
20,7% 31,0%
11,8%
3,1% 9,8%
Other public (schools, hospitals, museums, prison, etc)
Decrease significantly Decrease a little Stay the same Increase a little Increase significantly No opinion
Ninth Economic Impact Survey January 2012
Jan 2012 Secretariat of the ACE, Brussels www.ace-cae.eu
Expected change in workload over next 3 months: Other Public
0,00%
5,00%
10,00%
15,00%
20,00%
25,00%
30,00%
35,00%
40,00%
45,00%
50,00%
June 2009 December 2009 June 2010 December 2010 June 2011 January 2012
Expected change in workload over next three months - Other Public
Decrease
increase
Ninth Economic Impact Survey January 2012
Jan 2012 Secretariat of the ACE, Brussels www.ace-cae.eu
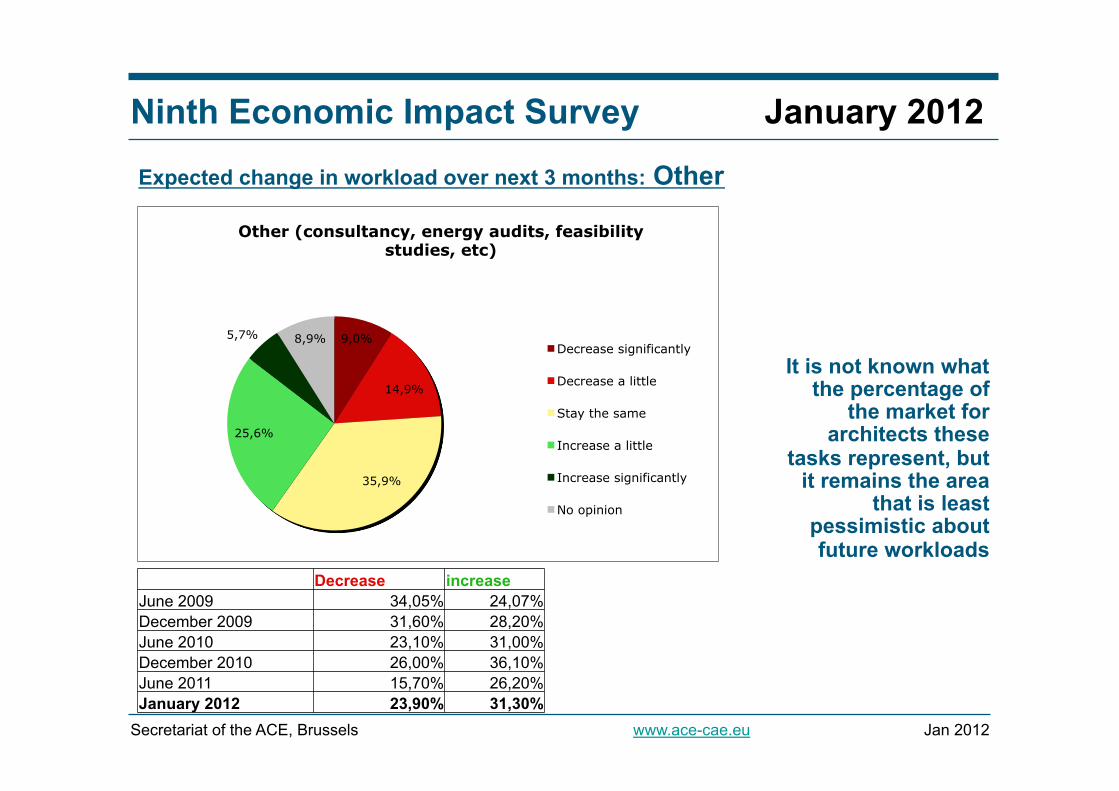
It is not known what the percentage of
the market for architects these
tasks represent, but it remains the area
that is least pessimistic about future workloads
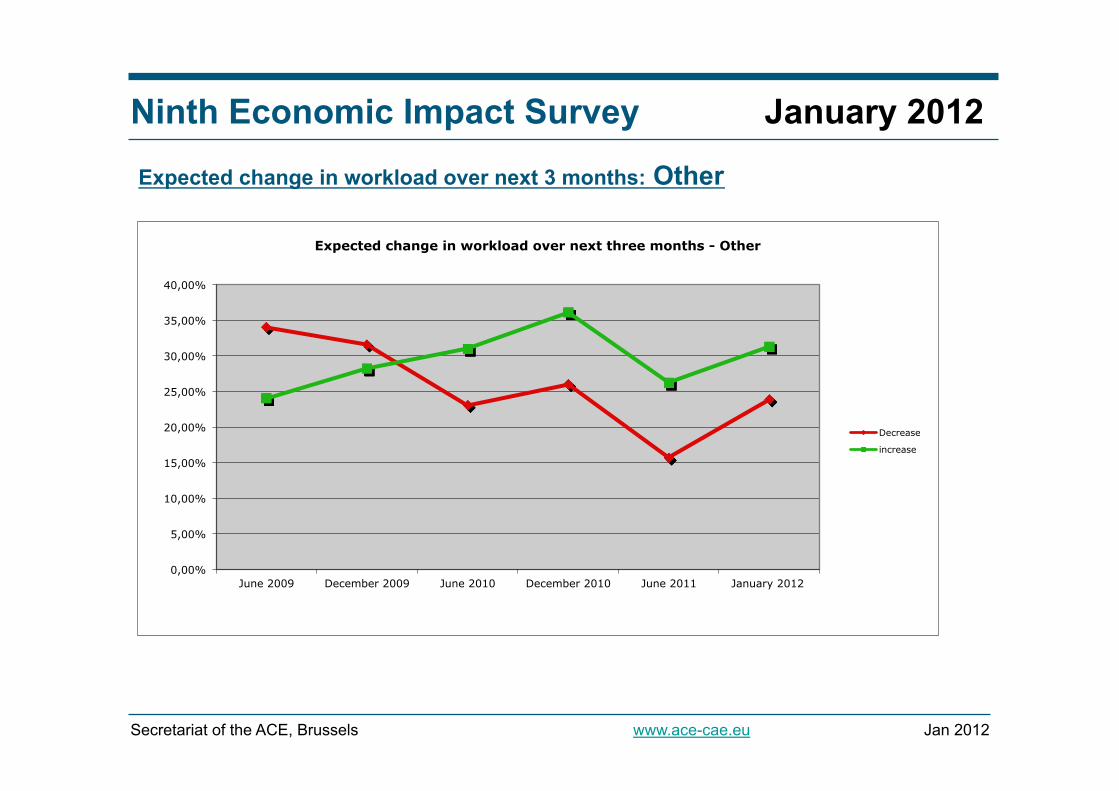
Expected change in workload over next 3 months: Other
Decrease increase June 2009 34,05% 24,07% December 2009 31,60% 28,20% June 2010 23,10% 31,00% December 2010 26,00% 36,10% June 2011 15,70% 26,20% January 2012 23,90% 31,30%
9,0%
14,9%
35,9%
25,6%
5,7% 8,9%
Other (consultancy, energy audits, feasibility studies, etc)
Decrease significantly
Decrease a little
Stay the same
Increase a little
Increase significantly
No opinion
Ninth Economic Impact Survey January 2012
Jan 2012 Secretariat of the ACE, Brussels www.ace-cae.eu
Expected change in workload over next 3 months: Other
0,00%
5,00%
10,00%
15,00%
20,00%
25,00%
30,00%
35,00%
40,00%
June 2009 December 2009 June 2010 December 2010 June 2011 January 2012
Expected change in workload over next three months - Other
Decrease
increase
Ninth Economic Impact Survey January 2012
Jan 2012 Secretariat of the ACE, Brussels www.ace-cae.eu
Conclusions:
§ Although slight improvements recently recorded, the profession has not confirmed the revival announced in June 2011
§ The survey shows little sense of optimism for the next three
months with a decrease in all work areas § Architects should demonstrate extra patience and determination
in coming months, without losing their hope of overcoming the economic downturn