Embed Size (px)
Citation preview

NIOSH HEALTH HAZARD EVALUATION REPORT:
DEPARTMENT OF HEALTH AND HUMAN SERVICESCenters for Disease Control and Prevention
National Institute for Occupational Safety and Health
HETA #2001-0303-2893TRW AutomotiveMt. Vernon, Ohio
October 2002
This Health Hazard Evaluation (HHE) report and any recommendations made herein are for the specific facility evaluated and may not be universally applicable. Any recommendations made are not to be considered as final statements of NIOSH policy or of any agency or individual involved. Additional HHE reports are available at http://www.cdc.gov/niosh/hhe/reports
This Health Hazard Evaluation (HHE) report and any recommendations made herein are for the specific facility evaluated and may not be universally applicable. Any recommendations made are not to be considered as final statements of NIOSH policy or of any agency or individual involved. Additional HHE reports are available at http://www.cdc.gov/niosh/hhe/reports
This Health Hazard Evaluation (HHE) report and any recommendations made herein are for the specific facility evaluated and may not be universally applicable. Any recommendations made are not to be considered as final statements of NIOSH policy or of any agency or individual involved. Additional HHE reports are available at http://www.cdc.gov/niosh/hhe/reports
applicable. Any recommendations made are not to be considered as final statements of NIOSH policy or of any agency or individual involved. Additional HHE reports are available at http://www.cdc.gov/niosh/hhe/reports

ii
PREFACEThe Hazard Evaluations and Technical Assistance Branch (HETAB) of the National Institute forOccupational Safety and Health (NIOSH) conducts field investigations of possible health hazards in theworkplace. These investigations are conducted under the authority of Section 20(a)(6) of the OccupationalSafety and Health (OSHA) Act of 1970, 29 U.S.C. 669(a)(6) which authorizes the Secretary of Health andHuman Services, following a written request from any employer or authorized representative of employees,to determine whether any substance normally found in the place of employment has potentially toxic effectsin such concentrations as used or found.
HETAB also provides, upon request, technical and consultative assistance to Federal, State, and localagencies; labor; industry; and other groups or individuals to control occupational health hazards and toprevent related trauma and disease. Mention of company names or products does not constitute endorsementby NIOSH.
ACKNOWLEDGMENTS AND AVAILABILITY OF REPORTThis report was prepared by Douglas Trout, MD, MHS, and Joshua Harney, MS, of HETAB, Division ofSurveillance, Hazard Evaluations and Field Studies (DSHEFS). Field assistance was provided by theIndustrial Hygiene Section of HETAB. Desktop publishing was performed by Pat McGraw. Review andpreparation for printing were performed by Penny Arthur.
Copies of this report have been sent to union (UAW Local 1939) and management representatives at TRWand the OSHA Regional Office. This report is not copyrighted and may be freely reproduced. Single copiesof this report will be available for a period of three years from the date of this report. To expedite yourrequest, include a self-addressed mailing label along with your written request to:
NIOSH Publications Office4676 Columbia ParkwayCincinnati, Ohio 45226
800-356-4674
After this time, copies may be purchased from the National Technical Information Service (NTIS) at5825 Port Royal Road, Springfield, Virginia 22161. Information regarding the NTIS stock number may beobtained from the NIOSH Publications Office at the Cincinnati address.
For the purpose of informing affected employees, copies of this report shall beposted by the employer in a prominent place accessible to the employees for a periodof 30 calendar days.

iii
Highlights of NIOSH Health Hazard Evaluation
Evaluation of Evaluation of Respiratory Illnesses (Hypersensitivitypneumonitis and occupational asthma)
This Health Hazard Evaluation was requested by the union and management at Mt. Vernon to try to find waysto stop illnesses from occurring among employees in the machining areas.
What NIOSH Did
# We met with management and unionrepresentatives.
# We examined medical records.# We asked employees to fill out a questionnaire
about their health.# We checked the air for the level of coolant, and
the coolant for bacteria and fungi.# We checked the cleaning procedures used in the
machining areas.
What NIOSH Found
# Many employees have been diagnosed withasthma or hypersensitivity pneumonitis (HP)related to work, and some are still restrictedfrom work because of the illnesses.
# No new symptoms related to asthma or HP havebeen reported to doctors since May 2001.
# Employees have reported symptoms that arelikely related to irritation caused by the coolant.
# The coolant used to contain a bacterium calledMycobacteria immunogenum, but the coolanthas been changed and no longer contains livingMycobacteria.
# Most levels of coolant in air were belowNIOSH guidelines, but in some areas air levelswere above our guidelines.
# Many improvements have been made at Mt.Vernon to decrease the level of coolant mist inthe air and to improve management of coolant.
# No exposures at the plant were identified whichwere related to the tremor some employeesexperienced.
What TRW Automotive Managers Can Do
# Maintain a safety and health program foremployees working in the machining areas.
# Use ongoing measurement of coolant mistlevels to help determine where more controls,such as enclosing and ventilating machines,may be needed.
# Use a medical monitoring program to keeptrack of employee symptoms to identify areaswhere exposure to coolant might be causingsymptoms.
# Monitor the use of biocide closely and continueto check the fluid for bacteria.
# Continue to communicate with employees andthe union about health and safety issues.
# Follow appropriate precautions when cleaningthe machines and central systems.
What the TRW Automotive Employees Can Do
# Attend all training sessions given by the unionand management.
# Follow instructions on use and maintenance ofmachines and coolant.
# Report all health problems that might be relatedto work to the plant medical department.
What To Do For More Information:We encourage you to read the full report. If you
would like a copy, either ask your health andsafety representative to make you a copy or call
1-513-841-4252 and ask for HETA Report #2001-0303-2893

iv
Health Hazard Evaluation Report 2001-0303-2893TRW AutomotiveMt. Vernon, Ohio
October 2002
Douglas Trout, MD, MHSJoshua Harney, MS
SUMMARYOn May 11, 2001, the National Institute for Occupational Safety and Health (NIOSH) received a request fromthe United Automobile, Aerospace, and Agricultural Implement Workers of America (UAW) Local 1939 andmanagement at the TRW Automotive plant in Mt. Vernon, Ohio, to conduct a health hazard evaluation(HHE). The request concerned respiratory problems, including hypersensitivity pneumonitis (HP), thoughtto be associated with occupational exposures to metalworking fluids (MWFs). Prior to receipt of the request,on May 9, 2001, a meeting had been held at NIOSH Hamilton Laboratories in Cincinnati, Ohio, withrepresentatives of NIOSH, TRW, and UAW Local 1939 and UAW Health and Safety. At that meeting,respiratory symptoms and illnesses among workers were discussed. It was reported that symptoms began inapproximately October 2000, and that five workers had subsequently been diagnosed by their personalphysicians with HP. Subsequent evaluations and actions taken by TRW responses were also discussed.Among the industrial hygiene and medical issues discussed at the meeting, it was noted that atypicalmycobacteria (Mycobacterium chelonae) had been cultured from the MWF (along with other bacteria) andthat several of the workers first diagnosed with HP had been found to have antibodies to the M. chelonae onprecipitin testing.
Subsequent to the meeting and the HHE request, multiple site visits were made to the Mt. Vernon plant.Environmental evaluations conducted by NIOSH investigators occurred in June and December 2001. Theindustrial hygiene evaluations included records reviews, personal breathing zone (PBZ) and area air samplingduring usual operations as well as during cleaning operations, and bulk sampling of MWF. Medicalevaluation included medical record review, discussions with employees’ private physicians, and aquestionnaire survey.
Initial microbial culture data collected by TRW, and confirmed by subsequent NIOSH sampling, revealedthat the central MWF systems were contaminated with up to 107 colony forming units per milliliter (CFU/ml)total bacteria and 105 CFU/ml Mycobacterium species. In May 2001, the acid fast bacteria (AFB) pellet stain(used to assess the quantity of dead and living Mycobacteria) revealed ‘very high’ and ‘high’ concentrationsin two of the four systems. By mid-August, about six weeks after TRW began using a new biocide (para-chloro, meta-cresol [PCMC]), no fungal or bacterial growth was found from process MWF samples.Repeated AFB pellet stains revealed a slow downward trend in the concentration of Mycobacteria levels overthe course of the HHE.

v
Air sampling data (a mixture of area and PBZ samples) collected by TRW from June 2001 to February 2002were reviewed. The mean concentrations of total particulate for these groups of samples by departmentranged from 0.14 to 0.68 mg/m3. Sixteen PBZ MWF aerosol samples for thoracic fraction of MWF aerosoltaken by NIOSH representatives during normal production on June 29, 2001, ranged from below the limitof detection to 0.37 mg/m3 (mean concentration was 0.23 mg/m3). All samples contained a large percentageof extractable material, indicating that the exposures were primarily MWF aerosol. Aerosol samplingconducted during cleanup operations beginning the night of June 29, 2001, revealed airborne thoracicparticulate concentrations inside the containment area ranging from 0.13 mg/m3 to 0.51 mg/m3 (mean: 0.41mg/m3). Concentrations outside the containment area ranged from 0.03 mg/m3 to 0.2 mg/m3 (mean: 0.1mg/m3). PBZ sampling for MWF aerosol on December 18, 2001, after air-conditioning had been added tothe machining areas, revealed concentrations ranging from 0.14 mg/m3 to 0.69 mg/m3. Five exposures wereabove the NIOSH REL for thoracic particulate (0.4 mg/m3); all five were from operators who worked on aparticular horizontal broach machine as a part of their job rotation.
On May 21-22, 2001, a questionnaire was administered to all employees at the plant. Three hundred five(91%) of 335 employees completed the questionnaire, which included questions concerning respiratory andsystemic symptoms occurring within the year prior to the survey. All symptoms included in the questionnairewere reported more frequently among those employees exposed to MWF compared to those who were notexposed, with prevalence ratios for symptoms ranging from 1.2 - 2.2. All but one of the 95% confidenceintervals (CI) for the prevalence ratios excluded 1, suggesting that these differences were not due to chance.Twenty (77 %) of the 26 persons meeting the case definitions for HP or occupational asthma (OA) in theNovember 2001 medical record review (see below) participated in the questionnaire survey. Both HP andOA were more common among the exposed group compared to the unexposed group, although the CI forboth illnesses included 1.
Records reviewed in November 2001 revealed that 107 workers had been placed on work restriction due torespiratory conditions in the previous 11 months. Among these 107, 70 (65%) had returned to work as ofNovember 2001; 37 (35%) of the total 107 remained on medical leave of absence. Medical records werereviewed for 32 (86%) of the 37 workers. Among these 32 workers, 25 (78%) had primary work duties inthe machining areas of the plant, although all 32 reported intermittent work duties in the machining side ofthe plant. Date of onset of symptoms for these workers ranged from October 2000 to April 2001, with themajority of persons reporting onset of respiratory symptoms in December 2000 and January 2001. Amongthe 32 workers, 14 (44%) met a case definition for OA and 12 (38%) a definition for HP. TRW records fromMarch 2002 revealed that 35 workers were on medical leave of absence; most of these workers had remainedon medical leave of absence since November 2001. Continuing review of records and discussions with theprimary treating physicians in April 2002 revealed clinical diagnoses of HP and/or OA among 41 workers,with onset of symptoms prior to May 2001.
Concerns related to tremor occurring among some workers were raised during the course of the HHE.Review of medical records for seven employees seen by a private neurologist and review of the toxicity ofthe materials and substances used by these workers did not reveal a neurotoxic agent to which workers maybe exposed at TRW. Specifically concerning PCMC (which has not been identified in the medical literatureas an agent causing tremor in the workplace), four of the seven workers for whom the date of onset of tremorwas reported had onset of tremor prior to the first use of PCMC at TRW.

vi
Many TRW Mt. Vernon employees have experienced a spectrum of work-related respiratory illness, withonset of symptoms occurring between the fall of 2000 and April 2001. No employees with onset ofrespiratory symptoms after that time have been identified. The majority of air samples revealedconcentrations of MWF aerosol in the machining areas of the plant to be below the NIOSH REL, but NIOSHair sampling revealed several instances where PBZ exposures exceeded the NIOSH REL during normaloperations. Air sampling during cleanup operations indicated exposures to MWF aerosol at concentrationsabove the NIOSH REL.
Although the exact cause of employees’ symptoms and illnesses has not been determined, evidence fromsimilar outbreaks of illnesses at other workplaces suggests that contamination of the MWF with Mycobacteriasp. is playing a role. Multiple interventions were put in place over time at TRW and we are not able toidentify one specific control measure which has been primarily effective in eliminating the source of theillnesses. Recommendations are provided in this report to assist TRW, the union, and workers at TRW inaddressing occupational exposures in the machining areas and work-related illnesses and symptoms.
KEYWORDS: SIC 3714 (Motor vehicle parts and accessories): hypersensitivity pneumonitis, HP,occupational asthma, metalworking fluids, MWF, machining, Mycobacterium chelonae, Mycobacteriumimmunogenum.

TABLE OF CONTENTSPreface . . . . . . . . . . . . . . . . . . . . . . . . . . . . . . . . . . . . . . . . . . . . . . . . . . . . . . . . . . . . . . . . . . . . . . . . . . . . ii
Acknowledgments and Availability of Report . . . . . . . . . . . . . . . . . . . . . . . . . . . . . . . . . . . . . . . . . . . . . . ii
Summary . . . . . . . . . . . . . . . . . . . . . . . . . . . . . . . . . . . . . . . . . . . . . . . . . . . . . . . . . . . . . . . . . . . . . . . . . . iv
Introduction . . . . . . . . . . . . . . . . . . . . . . . . . . . . . . . . . . . . . . . . . . . . . . . . . . . . . . . . . . . . . . . . . . . . . . . . 1
Background . . . . . . . . . . . . . . . . . . . . . . . . . . . . . . . . . . . . . . . . . . . . . . . . . . . . . . . . . . . . . . . . . . . . . . . . 1
Methods . . . . . . . . . . . . . . . . . . . . . . . . . . . . . . . . . . . . . . . . . . . . . . . . . . . . . . . . . . . . . . . . . . . . . . . . . . . 2Industrial Hygiene . . . . . . . . . . . . . . . . . . . . . . . . . . . . . . . . . . . . . . . . . . . . . . . . . . . . . . . . . . . . . . . . 2
Record Review . . . . . . . . . . . . . . . . . . . . . . . . . . . . . . . . . . . . . . . . . . . . . . . . . . . . . . . . . . . . . . . 2June 2001 Site Visit . . . . . . . . . . . . . . . . . . . . . . . . . . . . . . . . . . . . . . . . . . . . . . . . . . . . . . . . . . . 2December 2001 Site Visit . . . . . . . . . . . . . . . . . . . . . . . . . . . . . . . . . . . . . . . . . . . . . . . . . . . . . . . 4
Medical . . . . . . . . . . . . . . . . . . . . . . . . . . . . . . . . . . . . . . . . . . . . . . . . . . . . . . . . . . . . . . . . . . . . . . . . 4Medical Record Review . . . . . . . . . . . . . . . . . . . . . . . . . . . . . . . . . . . . . . . . . . . . . . . . . . . . . . . . 4Questionnaire . . . . . . . . . . . . . . . . . . . . . . . . . . . . . . . . . . . . . . . . . . . . . . . . . . . . . . . . . . . . . . . . 5
Evaluation Criteria . . . . . . . . . . . . . . . . . . . . . . . . . . . . . . . . . . . . . . . . . . . . . . . . . . . . . . . . . . . . . . . . . . . 5Metalworking Fluids . . . . . . . . . . . . . . . . . . . . . . . . . . . . . . . . . . . . . . . . . . . . . . . . . . . . . . . . . . . . . . 6
MWF Aerosol . . . . . . . . . . . . . . . . . . . . . . . . . . . . . . . . . . . . . . . . . . . . . . . . . . . . . . . . . . . . . . . . 6Microorganisms . . . . . . . . . . . . . . . . . . . . . . . . . . . . . . . . . . . . . . . . . . . . . . . . . . . . . . . . . . . . . . 6MWF Aerosol and Respiratory Illness . . . . . . . . . . . . . . . . . . . . . . . . . . . . . . . . . . . . . . . . . . . . . 7
Results . . . . . . . . . . . . . . . . . . . . . . . . . . . . . . . . . . . . . . . . . . . . . . . . . . . . . . . . . . . . . . . . . . . . . . . . . . . . 7Industrial Hygiene . . . . . . . . . . . . . . . . . . . . . . . . . . . . . . . . . . . . . . . . . . . . . . . . . . . . . . . . . . . . . . . . 7
Initial Record Review and Interim Recommendations . . . . . . . . . . . . . . . . . . . . . . . . . . . . . . . . . 7Record Review of Ongoing Air Sampling Performed by TRW . . . . . . . . . . . . . . . . . . . . . . . . . . 8June Site Visit . . . . . . . . . . . . . . . . . . . . . . . . . . . . . . . . . . . . . . . . . . . . . . . . . . . . . . . . . . . . . . . . 8December Site Visit . . . . . . . . . . . . . . . . . . . . . . . . . . . . . . . . . . . . . . . . . . . . . . . . . . . . . . . . . . 10
Medical . . . . . . . . . . . . . . . . . . . . . . . . . . . . . . . . . . . . . . . . . . . . . . . . . . . . . . . . . . . . . . . . . . . . . . . 11Medical Record Review . . . . . . . . . . . . . . . . . . . . . . . . . . . . . . . . . . . . . . . . . . . . . . . . . . . . . . . 11Neurologic Issues . . . . . . . . . . . . . . . . . . . . . . . . . . . . . . . . . . . . . . . . . . . . . . . . . . . . . . . . . . . . 12Questionnaire . . . . . . . . . . . . . . . . . . . . . . . . . . . . . . . . . . . . . . . . . . . . . . . . . . . . . . . . . . . . . . . 12
Discussion and Conclusions . . . . . . . . . . . . . . . . . . . . . . . . . . . . . . . . . . . . . . . . . . . . . . . . . . . . . . . . . . . 13Industrial Hygiene Issues . . . . . . . . . . . . . . . . . . . . . . . . . . . . . . . . . . . . . . . . . . . . . . . . . . . . . . 14Medical/Epidemiologic Issues . . . . . . . . . . . . . . . . . . . . . . . . . . . . . . . . . . . . . . . . . . . . . . . . . . 15Neurologic Issues (Tremor) . . . . . . . . . . . . . . . . . . . . . . . . . . . . . . . . . . . . . . . . . . . . . . . . . . . . 16
Recommendations . . . . . . . . . . . . . . . . . . . . . . . . . . . . . . . . . . . . . . . . . . . . . . . . . . . . . . . . . . . . . . . . . . 17
References . . . . . . . . . . . . . . . . . . . . . . . . . . . . . . . . . . . . . . . . . . . . . . . . . . . . . . . . . . . . . . . . . . . . . . . . 19

Health Hazard Evaluation Report No. 2001-0303-2893 Page 1
INTRODUCTIONOn May 11, 2001, the National Institute forOccupational Safety and Health (NIOSH) receiveda request from the United Automobile, Aerospace,and Agricultural Implement Workers of America(UAW) Local 1939 and management at the TRWAutomotive plant in Mt. Vernon, Ohio, to conducta health hazard evaluation (HHE). The requestconcerned respiratory problems andhypersensitivity pneumonitis (HP) thought to beassociated with occupational exposures tometalworking fluids (MWFs).
Prior to receipt of the request, on May 9, 2001, ameeting had been held at NIOSH HamiltonLaboratories in Cincinnati, Ohio, amongrepresentatives of NIOSH, TRW, and UAW Local1939 and UAW Health and Safety. Subsequent tothe meeting and the HHE request, multiple sitevisits were made to the Mt. Vernon plant.Environmental evaluations conducted by NIOSHinvestigators occurred in June and December2001. A questionnaire survey was performed inMay 2001. The NIOSH medical officer heldgroup informational meetings with all employeesat the TRW facility in June 2001. Multipleinterim letters, dated June, October, andDecember, 2001, and January 2002, have beensent to the requestors summarizing NIOSHactivities and interim recommendations. Resultsof medical record review and other informationdistributed in the interim letters were brieflysummarized in a Centers for Disease Control andPrevention publication.1 This final report willinclude a summary of the interim letters andprovide final conclusions and recommendationsfor this HHE.
BACKGROUNDApproximately 350 production workers (includingapproximately 150 machinists) were employed atthe TRW Mt. Vernon plant at the time of the HHErequest. The plant manufactures automotive brakecalipers and drums in a 200,000-square foot
facility that is approximately 25 years old. Afloor-to-ceiling wall divides the facilityapproximately in half between assembly andmachining areas. The two areas have separateventilation systems; at the time of the HHErequest the assembly areas had air-conditioning,while the machining areas did not. There are fourprimary central MWF systems, with centralreservoirs ranging in size from 4,500 (one system)to 20,000 (three systems) gallons. These systemsare referred to as the Large, Henry, Small, andMann Hummel systems. The plant also has many‘stand-alone’ machines which receive their MWFfrom smaller, individual sumps. At the time of theHHE request, the primary MWF in use was asemisynthetic fluid (United Chemical Solutions,UCS 4900-SS). A triazine-based biocide was usedon a regular basis, with intermittent additions ofan isothiazolinone-based biocide (generally forlevels of bacteria greater than 105 colony-formingunits per milliliter [CFU/ml] in MWF). The MWFmonitoring program included daily testing fordilution, percent free oil and solids contamination,pH, and total dissolved solids, as well as everyother day testing for microbial contamination.
At the May 9 meeting, it was reported that initialrespiratory symptoms and illnesses amongworkers had begun in approximately October2000; subsequently, five workers were diagnosedby their personal physicians with HP betweenDecember 2000 and April 2001; several of theworkers had been hospitalized at the time ofdiagnosis. It was further reported that, beginningin December 2000 and continuing to the time ofthe HHE request, TRW had responded to theillnesses primarily by: 1) performing cleaningoperations (along with recharging with newMWF) on some of the central systems andindividual machines; 2) cleaning, re-charging, andadding MWF circulation pumps to some of thestand-alone machines; 3) maximizing existinggeneral ventilation in the machining areas; 4)reviewing and improving MWF maintenanceprocedures; 5) increasing industrial hygieneevaluations in the machining areas; and 6)providing screening medical examinations toworkers. Among the industrial hygiene and

Page 2 Health Hazard Evaluation Report No. 2001-0303-2893
medical findings, it was noted that atypicalmycobacteria (Mycobacterium chelonae) had beencultured from the MWF (along with otherbacteria) and that several of the workers firstdiagnosed with HP had been found to haveantibodies to the M. chelonae on precipitin testing.
At the initial meeting it was reported thatemployees diagnosed with HP (and otherrespiratory illness) included employees frommultiple departments. Review of information(such as job locations and job tasks) collected byTRW and their consultants provided no indicationthat one specific MWF system, machine, orportion of the machining area was associated withthe illnesses. Around the time of the HHErequest, and in the weeks afterward, many otherTRW employees reported respiratory and othersymptoms and were evaluated at one or moremedical facilities. In response to the reportedsymptoms and illnesses and evidence of continuedmicrobial contamination of the MWF in thevarious systems at the plant, in June 2001, NIOSHrepresentatives made a series of recommendationsto the plant to decrease health effects related toexposures at the plant. Subsequently, among themajor actions taken by TRW related to bothqualitative (primarily thought to involve microbialcontaminants) and quantitative (aerosolconcentration) aspects of the MWF aerosol were:1) discarding all old MWF, cleaning all centralsystems again (some had been cleaned severaltimes), and re-charging the systems with freshMWF–these actions were completed in July 2001;2) installing a new biocide (para-chloro meta-cresol [4-chloro-3-methyl phenol, PCMC]) knownto be effective against Mycobacteria–July/August 2001; 3) installing new generalventilation (air-conditioning) in the machiningside of the plant – August/September 2001; and 4)adding mist collectors for many of the machines(particularly those identified as producing higherMWF aerosol concentrations) supplied by thecentral systems–December 2001/January 2002.Additionally, TRW enclosed and ventilated partswashers, and took some steps to shroud (partiallyenclose) the Barnes transfer line heads (which
contribute to MWF aerosol levels on themachining side of the plant).
METHODS
Industrial Hygiene
Record Review
During the course of the HHE, interimrecommendations from NIOSH representatives toTRW were guided in part by ongoing review ofindustrial hygiene data collected by both TRWand NIOSH. Only representative data fromamong those collected by TRW will be reviewedin this report. One of the primary tests used toassess microbiologic contamination of the MWFat TRW is the ‘Acid-fast bacteria (AFB) pelletstain.’2 This test has been performed for TRW bya contract laboratory. To perform the AFB pelletstain, 5 milliliters (ml) of MWF is centrifuged andthe resulting pellet is smeared to a microscopeslide. The slide is then stained to differentiateMycobacteria (which may be either alive or dead),and those cells are counted and reported using thefollowing key:
Negative - < 104 cells per ml MWFVery Low - 1-5 cells/slideLow - 1-10 cells/slideLow to Moderate - 1-5 cells/microscope fieldModerate - 5-50 cells/fieldModerate to High - 50-100 cells/fieldHigh - >100 cells/fieldVery High - Almost confluent, impractical tocount
June 2001 Site Visit
During a site visit in June 2001, NIOSH staffassessed occupational exposures in the machiningareas. The NIOSH site visit occurred during aweekend in which TRW was conducting a seriesof cleaning operations involving the machinessupplied by the Large system, as well as othermachines in that general area. The effectiveness

Health Hazard Evaluation Report No. 2001-0303-2893 Page 3
of the containment system was evaluated bothqualitatively and quantitatively to determinewhether workers outside the containment areawere at risk of exposure from airbornecontaminants generated during the vigorouscleanup activities within the containment area. Areal-time aerosol monitor was used inside andoutside the containment area before and duringcleanup operations to give an immediateindication of the containment’s effectiveness.
The plastic containment curtain was observedbefore, during, and after negative pressure wascreated in the containment area. Openings in thecontained area, for example, adjacent doorways tothe assembly side of the plant and openings in thecurtain itself, were challenged with smoke todetermine whether gross airflow moved into or outof the containment area. Air Sampling Methods – Both general area andpersonal breathing zone (PBZ) air samples werecollected during this site visit. Air samples forMWF aerosol were collected on a 37 millimeter(mm) closed-face cassette containing a tared 2m i c r o m e t e r ( µ m ) p o r e - s i z epolytetrafluoroethylene (PTFE) filter. A thoraciccyclone was attached to the sampling cassette sothat only the thoracic fraction of the aerosol wouldbe collected. The thoracic portion of an aerosol isthe portion that will penetrate past thenasopharynx, i.e., those particles with anaerodynamic diameter of 10 µm or less.3 Tygon®tubing connecting the sampler and a personalsampling pump allowed air to be drawn throughthe sampling train at a flow rate of 1.6 liters perminute (Lpm).4 The cassettes containing thefilters and back-up pads for each sample wereplaced into a desiccator for at least 16 hours forequilibration before analysis.
The particulate mass for each sample wasdetermined by measuring the gross weight of eachfilter on an electro balance and subtracting thepreviously determined tare weight of the filter.The filters for each sample were then extractedusing a 1:1:1 blend of dichloromethane, methanol,and toluene. After drying in a vacuum oven for at
least two hours, the filters were allowed to re-equilibrate to balance room conditions for at leasttwo hours. The filters were then reweighed on thesame electro balance. The extractable mass wascalculated by subtracting the post-extraction filterweight from the pre-extraction filter weight. If thecollected aerosol was largely extractable, then itwas presumably MWF.
A bulk sample of process MWF was submittedwith the air samples to make sure it was soluble inthe trisolvent extraction fluid mentioned above.This solubility test indicated that the MWF used atTRW was indeed soluble in the trisolvent, andtherefore suitable for analysis by thismethodology.
The limit of detection (LOD) and limit ofquantification (LOQ) for particulate mass analysiswere determined by using the standard deviationof the mass of five media blanks. The LOD isthree times the standard deviation of the mediablanks, and the LOQ is ten times the standarddeviation of the media blanks. The MWF sampleswere analyzed in two separate batches havingunique analytical limits. For samples numberedMWF 1 through MWF 15, the LOD for particulatemass was 0.05 milligram/sample, which equates toa minimum detectable concentration (MDC) of0.07 milligrams per cubic meter of air (mg/m3)based on an average sample air volume of 681 L.The LOQ was 0.2 mg/sample, yielding a minimumquantifiable concentration (MQC) of 0.29 mg/m3
based on an average sample air volume of 681 L.For MWF 16-30, the LOD was 0.004 mg/sample,yielding an MDC of 0.006 mg/m3 based on asample air volume of 627 L, the average samplevolume for this sample set. The MQC for MWF16-30 was 0.013 mg/m3, based on the sameaverage sample air volume.
Air sampling was also conducted using a portable,real-time, hand-held aerosol monitor (HAMModel 1055, PPM Inc., Knoxville, Tennessee).The HAM was used three separate times duringJune 29-30, 2001: during normal production,immediately before cleanup operations began afterproduction in the Large system machining area

Page 4 Health Hazard Evaluation Report No. 2001-0303-2893
ceased, and during cleanup operations. The HAMgives the user aerosol mass concentrationinformation based on the light scatteringproperties of particulate passing through theinstrument. Therefore, if any two particles havethe same physical dimensions, but have differentlight scattering properties, they will ‘look’different to the HAM. The HAM was initiallycalibrated by the manufacturer using Arizona roaddust, a solid particulate with an uneven surfacetexture. It is unknown how closely the lightscattering properties of the calibration dust are tothose of the MWF aerosol at TRW, primarily aliquid particulate with presumably smoothersurface texture than the Arizona road dust. Thisbeing the case, and because during this study theHAM was not calibrated using a side-by-sidegravimetric method, data gathered with the HAMshould be regarded as qualitative in nature.
December 2001 Site Visit
NIOSH industrial hygienists performed a secondenvironmental evaluation on December 18-19,2001. Personal exposure monitoring for MWFaerosol was conducted during the second shift onDecember 18, 2001, and the third shift onDecember 19, 2001. Twenty PBZ samples werecollected each day, following the methodsdescribed above.
The MWF samples were analyzed in two separatebatches having different analytical limits. Forsamples A1 through A23, the LOD for particulatemass was 0.007 mg/sample, which equates to anMDC of 0.009 mg/m3 based on an average sampleair volume of 796 L. The LOQ was 0.02mg/sample, yielding an MQC of 0.025 mg/m3
based on an average sample air volume of 796 L.For samples A26-46, the LOD was 0.006mg/sample, yielding an MDC of 0.009 mg/m3
based on a sample air volume of 646 L, theaverage sample volume for this sample set. TheMQC for A26-46 was 0.031 mg/m3, based on thesame average sample air volume.
Medical
Medical Record Review
Beginning at the time of the HHE request, theNIOSH medical officer reviewed numerousrecords including: 1) TRW personnel recordsconcerning employee illnesses; and 2) medicalrecords from personal physicians of employeesreporting symptoms or illness. Records werereviewed periodically during the course of theHHE with two primary purposes.
One purpose for the review of physicians’ recordswas to examine the physicians’ diagnoses ofillness. A physician diagnosis of an individualillness is based on ‘clinical’ knowledge andjudgement and may not take into account certaincriteria called for in epidemiologic case definitionsfor that illness. The other purpose for the reviewwas to review records using epidemiologic casedefinitions for HP and occupational asthma (OA).In November 2001, a review of companypersonnel records and medical records wasperformed using the following case definitions.HP was defined as the presence, within theprevious year, of one or more work-relatedrespiratory symptoms (cough, dyspnea, wheezing,or chest tightness) and one or more systemic signsor symptoms (fever, chills, extreme fatigue,myalgia, or night sweats); and an infiltrate seen onchest X-ray (CXR) or high resolution computedtomography (HRCT) scan; and abnormalspirometry (either an obstructive or restrictivepattern). OA was defined as one or more work-related respiratory symptoms (cough, dyspnea,wheezing, or chest tightness) and the absence ofsystemic signs or symptoms; no infiltrate seen onCXR or HRCT scan; and spirometry consistentwith reversible airway obstruction (an obstructivepattern with $20% improvement in forcedexpiratory volume at one second afteradministration of inhaled bronchodilators).
Questionnaire
On May 21-22, 2001, a questionnaire wasadministered to all employees at the plant. Threehundred five (91%) out of 335 employees

Health Hazard Evaluation Report No. 2001-0303-2893 Page 5
completed the questionnaire. The 335 employeesto whom the questionnaire was distributedincluded employees at work on the days of thesurvey, as well as those employees who were onmedical leave of absence and who could bereached by union representatives. The goal of thesurvey was to obtain further informationconcerning the nature of respiratory problemsamong employees at the plant. The questionnaireincluded questions concerning job duties, currentsymptoms, and medical history. Questions aboutsymptoms asked about symptoms experienced inthe year prior to the survey, and possibleresponses included “usually,” “sometimes,” or“never.” The responses to the symptom questionswere combined to create a positive response(“usually” or “sometimes”) and negative response(“never”). Those persons reporting MWF use intheir job were considered to be ‘exposed’ toMWF, and those not reporting MWF to be‘unexposed.’ A second exposure variable wasalso used in evaluating symptoms, ‘high’ and‘low’ exposure areas, with the ‘high/low’distinction based on total particulateconcentrations in air (Table 1). In creating thisvariable, Department W03 was excluded because:1) although the exposures were similar to those inthe ‘high’ exposure group, the median for thedepartment was less than the median for all thedepartments; and 2) there was a relatively smallnumber of observations in this department.
The magnitude of the relationships betweenexposure and symptoms or illness was assessed bythe prevalence ratio (PR); a 95 percent confidenceinterval (95 percent CI) which excluded 1.0, or asignificance level of p # 0.05, was considered toindicate a statistically significant finding. The PRrepresents the prevalence of the symptom in onegroup (“exposed”) relative to the prevalence in thecomparison group (“unexposed”). For example, aPR of one means there is no association betweenthe symptom/illness and “exposure.” A PR ofgreater than one indicates that there is evidence ofan association. A PR of two would mean that aperson in the “exposed” group may be two timesmore likely to have reported the symptom than aperson in the “unexposed” group. Further analysis
of some aspects of the questionnaire data relatedto respiratory illness is presented in the Appendix.
EVALUATION CRITERIAAs a guide to the evaluation of the hazards posedby workplace exposures, NIOSH field staffemploy environmental evaluation criteria for theassessment of a number of chemical and physicalagents. These criteria are intended to suggestlevels of exposure to which most workers may beexposed up to 10 hours per day, 40 hours per weekfor a working lifetime without experiencingadverse health effects. It is, however, important tonote that not all workers will be protected fromadverse health effects even though their exposuresare maintained below these levels. A smallpercentage may experience adverse health effectsbecause of individual susceptibility, a pre-existingmedical condition, and/or a hypersensitivity(allergy). In addition, some hazardous substancesmay act in combination with other workplaceexposures, the general environment, or withmedications or personal habits of the worker toproduce health effects even if the occupationalexposures are controlled at the level set by thecriteria. These combined effects are often notconsidered in the evaluation criteria. Also, somesubstances are absorbed by direct contact with theskin and mucous membranes, and thus potentiallyincreases the overall exposure. Finally, evaluationcriteria may change over the years as newinformation on the toxic effects of an agentbecome available.
The primary sources of environmental evaluationcriteria for the workplace are: (1) NIOSHRecommended Exposure Limits (RELs),5 (2) theAmerican Conference of Governmental IndustrialHygienists’ (ACGIH®) Threshold Limit Values(TLVs®),3 and (3) the U.S. Department of Labor,Occupational Safety and Health Administration(OSHA) Permissible Exposure Limits (PELs).6
Employers are encouraged to follow the OSHAlimits, the NIOSH RELs, the ACGIH TLVs, orwhichever is the more protective criterion.

Page 6 Health Hazard Evaluation Report No. 2001-0303-2893
OSHA requires an employer to furnish employeesa place of employment that is free fromrecognized hazards that are causing or are likely tocause death or serious physical harm[Occupational Safety and Health Act of 1970,Public Law 91–596, sec. 5(a)(1)]. Thus,employers should understand that not allhazardous chemicals have specific OSHAexposure limits such as PELs and short-termexposure limits (STELs). An employer is stillrequired by OSHA to protect their employeesfrom hazards, even in the absence of a specificOSHA PEL.
A time-weighted average (TWA) exposure refersto the average airborne concentration of asubstance during a normal 8- to 10-hour workday.Some substances have recommended STEL orceiling values which are intended to supplementthe TWA where there are recognized toxic effectsfrom higher exposures over the short-term.
Metalworking Fluids
MWF Aerosol
NIOSH recommends that occupational exposuresto MWF aerosols be limited to 0.4 mg/m3 ofthoracic particulate mass as a TWA concentrationfor up to 10 hours (hrs)/day during a 40-hr workweek, measured according to NIOSH Method0500.7 The 0.4 mg/m3 concentration thoracicparticulate mass corresponds to approximately0.5 mg/m3 total particulate mass. Both of theseREL values will be referred to in this reportbecause both types of sampling were done.
This REL is intended to reduce the respiratorydisorders associated with MWF exposures in theworkplace. However, concentrations of MWFaerosols should be kept below the REL wherepossible because some workers have developedHP/OA, or other adverse respiratory effects whenexposed to MWFs at lower concentrations.7
Limiting exposure to MWF aerosols is alsoprudent because certain MWF exposures havebeen associated with various cancers. In addition,
limiting dermal (skin) exposures is critical topreventing allergic and irritant skin disordersrelated to MWF exposure. In most metalworkingoperations, it is technologically feasible to limitMWF aerosol exposures to 0.4 mg/m3 or less.
Microorganisms
Historically, microbial contamination of MWF hasbeen a problem primarily because of the microbialgrowth effects on fluid quality and performance.Fluid degredation from microorganisms may resultin changes in fluid viscosity, and the acid productsof fermentation may lower the pH of the fluids,causing corrosion of machined parts. Anaerobicbacteria, specifically the sulfate reducers, mayproduce hydrogen sulfide and other toxic gases.Excessive microbial growth may result in cloggedfilters and ports and may interfere with themachining operations.
Water-based MWFs are excellent nutritionalsources for many kinds of bacteria and fungi. Thepredominant species routinely recovered fromMWFs are virtually identical to those routinelyrecovered from natural water systems. Manyspecies that grow in MWFs secrete waste productsthat serve as a nutritional substrate for organismswith more restrictive nutritional needs. Well-maintained MWFs should have bacterial concen-trations below 106 colony forming units per mL(CFU/mL) of fluid.8
Some individuals manifest increased immunologicresponses to microorganisms, or their metabolites,in the environment. Although microbialcontamination of MWFs poses a potentialoccupational hazard, there are insufficient data todetermine acceptable levels of microbialcontamination in the air. In addition, allergic orhypersensitivity reactions can occur even withrelatively low air concentrations of allergens, andindividuals differ with respect to immunologicsusceptibilities. Although some pathogenicorganisms have been identified in oil emulsionMWFs in the past,9,10 most pathogens do notpersist well in most MWFs.11,12,13,14

Health Hazard Evaluation Report No. 2001-0303-2893 Page 7
MWF Aerosol and RespiratoryIllness
Studies summarized in the NIOSH CriteriaDocument provide evidence that occupationalexposure to MWF aerosols causes symptomsconsistent with airways irritation, chronicbronchitis, asthma, and HP. HP has beendescribed as occurring at facilities performing avariety of machining operations;15,16 in generalthose facilities have used water-based MWF.17 Inmany cases, the specific agent(s) responsible forHP and other illnesses is (are) not known. HP(also called extrinsic allergic alveolitis) is aspectrum of granulomatous, interstitial lungdiseases which occur after repeated inhalation andsensitization to a wide variety of microbial agents(bacteria, fungi, amoebae), animal proteins, andlow-molecular weight chemical antigens. Thepresence of Mycobacteria has been associatedwith many of the reported outbreaks of HP inmachining environments.17,18 The Mycobacteriaisolated from TRW (as discussed above and inResults) was initially identified as M. chelonae, amycobacteria that has been found as a contaminantin other machining plants where there have beenoutbreaks of HP. Recently M. immunogenum hasbeen identified as new species of the M.abscessus/M. chelonae group.19 Samples fromTRW (and other machining environments),previously identified as M. chelonae, have beenre-examined and found to be M. immunogenum.
In general, the time of onset of HP after initialexposure to an antigen may range from a period ofweeks to years. HP is marked by a pneumonitis,which is reversible if exposure to the antigen isstopped; continued exposure can lead to a chronicinterstitial fibrosis or scarring of the lungs. Ingeneral, HP is marked by nonspecific symptoms.Acute HP begins in the first 12 hours afterexposure with cough, dyspnea (shortness ofbreath), chest tightness, fevers, chills, malaise, andmyalgias (muscle aches). The symptoms of thesubacute and chronic forms of HP include cough,dyspnea, wheezing, loss of appetite, and weightloss. The diagnosis should be considered inanyone with recurrent “pneumonia” or recurrent or
persistent unexplained respiratory symptoms;suggestions for uniform criteria for the diagnosisof HP have been published.20,21
RESULTS
Industrial Hygiene
Initial Record Review andInterim Recommendations
Microbial culture data were among the first datareviewed for this HHE. Cultures collected onApril 19, 2001 (prior to the HHE request but aftercleaning and maintenance changes had beeninitiated at the plant), revealed that bulk samplesof MWF taken from the Large system had 40CFU/ml bacteria (no genus or species identified)and 400 endotoxin units/ml (EU/ml), and a samplefrom the Small system had 1.3 x 10⁷ CFU/ml totalbacteria and 40,000 EU/ml. On May 7-8, 2001,two bulk samples of MWF taken from the Smallsystem after the first cleaning of that systemcontained 105 CFU/ml Mycobacterium species.Other samples from all four central MWF systems,taken prior to the HHE request (not reported here)also contained Mycobacterium sp. Bulk samplestaken on May 25, 2001, from the four centralMWF systems indicated that viable (alive)bacterial, fungal, and Mycobacteria counts werebelow the limit that could be detected (< 1CFU/ml for bacteria, and < 10 CFU/ml for fungi)for all four systems. The bulk samples also wereanalyzed using the AFB pellet stain to assess thequantity of dead and alive Mycobacteria. Thetesting on that date revealed the following: Henrysystem - ‘very high;’ Large system - ‘high;’ Smallsystem - ‘very low;’ and Mann Hummel system -‘very low.’ These results indicated that at thattime the Large system and the Henry system hadconcentrations of dead Mycobacteria much greaterthan those found in the other two central systems.It should be noted that the Small system (whichpreviously had relatively high concentrations of

Page 8 Health Hazard Evaluation Report No. 2001-0303-2893
microorganisms) had been cleaned twice in thefive weeks prior to the May 25 testing.
Results of bulk MWF sampling after August 2001consistently revealed that most bulk samples hadviable (alive) bacterial and fungal counts belowthe limit that could be detected. A summary ofAFB pellet stain results is presented in Figure 1.TRW had been collecting AFB pellet staininformation on a frequent basis (during that timeperiod, every several days for much of the time).The data in Figure 1 include representativebimonthly sample results from the four centralsystems, and show a downward trend over theperiod from May 2001 through August 2002. TheLarge system is the only system that has had fairlyconsistent negative results on the AFB pelletstains recently; the other systems have hadnegative test results alternating with test results ofvery low or low.
Record Review of Ongoing AirSampling Performed by TRW
Air sampling data collected over the period ofJune 2001 to February 2002 were reviewed.These data represented a mixture of area and PBZsamples taken by TRW and consultants inmultiple departments over many different dates.The results are summarized briefly in Table 1 bydepartment. Some of the air concentrations werereported as less than the MDC; in those cases, forthe purpose of this review, the average MDCvalue for the department over the time period ofthe sampling was substituted as the concentration.As Table 1 shows, the median concentrations forthese groups of samples were below the NIOSHREL for total particulate of 0.5 mg/m3, althoughall departments except one had one or moresamples above the NIOSH REL. Based on theinformation in Table 1, machining departmentscan be divided into ‘high’ exposure departments(Departments 1, 2, 4, and 6) and ‘low’ exposuredepartments (Departments 7, 17, and 57).Reported symptoms and illnesses were compared
between these ‘high’ and ‘low’ exposure areas, asmentioned in Methods.
In many cases, the extractable portion of the totalparticulate was analyzed in the samples collectedby TRW or consultants. Review of these datareveals that the percentage of extractable material(representing MWF) was variable, ranging fromnear zero to 100%. This in part reflects that factthat these sampling data included sampling froma wide variety of locations in the plant.
June Site Visit
Results from PBZ MWF aerosol samplingconducted by NIOSH during normal productionon June 29, 2001, are listed in Table 2. Foursamples were collected on the assembly side of theplant (samples numbered MWF 7, 10, 12, 16);thoracic particulate concentrations from thosesamples ranged from ‘not detected’ (nd) to 0.07mg/m3. Sixteen samples were collected frompersonnel working on the machining side of theplant. Full-shift exposures ranged from nd(collected from a Kirby operator whose machinewas offline most of the shift) to 0.37 mg/m3 for theHonsberg operator. One partial-shift exposure(PHN131 anchor broach) exceeded 0.4 mg/m3,indicating the potential for over exposureassociated with that operation. The meanexposure for those working on the machining side(excluding the Kirby operators) was 0.23 mg/m3.All samples contained a large percentage ofextractable material, indicating that the exposureswere primarily MWF aerosol.
Table 3 details results of the aerosol samplingconducted during cleanup operations beginningthe night of June 29, 2001. One PBZ sample wascollected from a steam cleaning assistant; the restof the samples were area samples. Airbornethoracic particulate concentrations inside thecontainment area ranged from 0.13 mg/m3 to 0.51mg/m3 (mean = 0.41 mg/m3). Concentrationsoutside the containment area on the machiningside ranged from 0.03 mg/m3 to 0.2 mg/m3 (mean= 0.1 mg/m3). These samples were also largelycomprised of extractable material.

Health Hazard Evaluation Report No. 2001-0303-2893 Page 9
As shown in Table 4, based on HAM data, theoutdoor concentrations of airborne particulatewere 0.07 mg/m3, and concentrations in theassembly side of the plant were consistently lessthan 0.1 mg/m3 on June 29. During this sametime, concentrations on the machining side of theplant ranged from 0.2 mg/m3 in the aisle along thenorth wall of the building to 0.5 mg/m3 by thePHN131 horizontal broach, with higher readingsobtained near certain work stations such as theBarnes transfer machine. Particulateconcentrations at the Barnes transfer stations #11and #15 were 0.3 mg/m3 and 0.8 mg/m3,respectively. Stations #5 and #7 were 1.2 mg/m3
and 1.5 mg/m3, respectively. Because of thequalitative nature of these HAM values, theymerely illustrate a general increase in aerosolconcentrations from the northern end to thesouthern end of the areas monitored.
Table 5 compares HAM aerosol concentrationsimmediately preceding and during cleanupoperations at seven locations, both inside andoutside the containment. The measurements takenduring cleanup were all within 10% of those takenpreceding cleanup operations. The exceptionoccurred at the north-south aisle on the west sideof the plant, where the concentration duringcleanup was about 80% of that measured prior tocleanup.
Cleaning Process Description– In preparation forcleaning of the Large system, the utility boxes andmotors on each machine were covered with plasticto prevent damage from the steam cleaners. Next,a degreaser and machine tool cleaner were sprayedon those machine surfaces that had MWF contact.Following this, steam cleaning and a visualinspection were done. If MWF residue was stillvisible, more steam cleaning was done until themachines were visibly clean. All the runoff waschanneled through the floor flumes back to thecentral sump. After the machines were cleaned inthis manner, a high-pressure ‘snake hose’ wasdrawn through the floor flumes to clean the flumesand underside of the flume cover-plates. Then theflumes were flushed for one hour with water andmachine tool cleaner. After this flushing, a
mixture of water, 2.5% MWF and 2000 parts permillion (ppm) PCMC (biocide) was run throughthe system for about 2 hours. Next, a mixture of5% coolant, 2000 ppm PCMC, and a defoameragent was run through the system. This preparedthe system to be recharged with virgin MWF andthe required mixture of biocide, defoamer, andother additives before production resumed.
Workers involved with cleanup procedures worevarious personal protective equipment (PPE).Those directly conducting steam cleaning worefull-facepiece respirators with P100 cartridges,while their assistants used P95 filtering facepieces.All workers, including those taping off the motorsand utility boxes on the machining centers, woreTyvek™ outer garments and nitrile gloves.
Containment effectiveness evaluation – When theplastic sheeting separating the Large systemmachining areas from the rest of the plant wasinstalled, it was initially observed to billow outaway from the Large machining area. Thisindicated that that area was under positivepressure relative to the adjacent areas. Afterproduction in this area was halted, the rooftopmake-up fan was shut off and the rooftop exhaustfan was on. Other large fans were used to exhaustair from this space. As a result, the plasticsheeting billowed into the Large systemmachining area, indicating that during cleanupoperations this area was under negative pressurerelative to the adjacent areas of the building.
Under these conditions, smoke tubes were used tohelp visualize the effectiveness of the containmentsystem. Smoke was introduced near openings inthe plastic in the following areas: eastern-mostaisle running north-south on the machining side,western-most aisle running north-south, basketassembly/pallet pass-through in wall betweenmachining and assembly, and at several seams inthe plastic along the aisle separating the Largemachining area from the Henry machining area.In all cases, smoke was drawn into thecontainment area, confirming that it was undernegative pressure relative to adjacent areas.

Page 10 Health Hazard Evaluation Report No. 2001-0303-2893
Bulk MWF microbial analyses – Table 6 showsthe results of microbial analysis of bulk MWFcollected from the June site visit, as well as fromtwo other days. With the exception of M.chelonae,*,22 the other organisms found are fairlytypical of water-based MWFs. While Largesystem and Henry system samples from May 2001included several species of culturable bacteria inaddition to M. chelonae, in June 2001 M. chelonaewas the dominant organism in the MWF of thesecentral systems. During this same period, theSmall system contained only M. chelonae, whichincreased in concentration to levels matchingthose of the Large and Henry systems,approximately 106 CFU/mL. The Mann-Hummelsystem, though it was not at the time being usedfor normal production, also yielded only M.chelonae on May and June 2001 cultures. TheMWF from the PHN131 broach had several othertypes of bacteria present in addition to theMycobacteria. M. chelonae was also found in theZJ parts washer in June, along with very highlevels of Gram-negative bacteria. By mid-August,about six weeks after TRW began using PCMCbiocide, no fungal or bacterial growth wasobtainable from process MWF samples collectedat the locations listed in Table 6. At the time ofeach NIOSH sample collection, endotoxin levelswere generally lower than is usually found inother water-containing MWF systems whereGram-negative organisms typically predominate.23
December Site Visit
PBZ results from MWF aerosol samplingconducted during second shift on December 18,2001, are listed in Table 7. Most samplescontained a large percentage of extractablematerial, indicating that the exposures were
primarily MWF aerosol. The exceptions were thetool and die operator (sample #A15), who did notuse any machinery with MWF during this shift, anOTS operator in WO2 (sample #A9), and one ofthe Kirby operators in WO7 (sample #A5). Theconcentrations from these three samples werebelow 0.2 mg/m3. The rest of the concentrationsranged from 0.23 mg/m3 to 0.69 mg/m3 (mean =0.37 mg/m3). Five exposures were above theNIOSH REL (0.4 mg/m3); all five were fromoperators who worked on a horizontal broachmachine as a part of their job rotation.
Table 8 details results of the aerosol samplingconducted during third shift operations beginningthe afternoon of December 19, 2001. Thesesamples were all largely comprised of extractablematerial. The concentrations ranged from 0.14mg/m3 to 0.4 mg/m3 (mean = 0.27 mg/m3).
During the December 2001 site visit engineeringcontrols were observed. At the Barnes transferline, parts rotate past stationary machining stations(called ‘heads’) that have cutting actions thatretract from the cutting zone while the transfer linemoves a new part into place to be machined. Fiveof six heads on the north Barnes line are splash-guarded on three sides. On the south Barnestransfer line, three of seven heads are splash-guarded on three sides, while the remaining fourheads are splash-guarded only in the front, or inthe front and one side. Both the north and southsides of the Barnes transfer line have several headswhere the cutting tool remains on, rotatingquickly, and the MWF is forcibly expelled into thecutting zone even while there is no part within thezone. This creates large amounts of aerosol dueboth to the impaction of the fluid on the surfaceopposite its injection point, and to the spinningaction of the cutting tools bathed in MWF. Twoheads were observed during third shift operationson December 19, 2001. Head #9 operated with acutting time of roughly 11 seconds per part, and anon-cutting time of roughly 12 seconds betweenparts. Head #8 had cutting times averagingroughly 8 seconds, and non-cutting timesaveraging 15 seconds between parts. In both
* The identification of mycobacteria presentin MWF is an active field of investigation. Itappears that some mycobacteria previouslyidentified as M. chelonae is now moreaccurately identified as M. immunogenum. Future work will help clarify the types ofmycobacteria present as contaminants in MWF.

Health Hazard Evaluation Report No. 2001-0303-2893 Page 11
cases, non-cutting times occasionally increased upto over one minute.
Medical
Medical Record Review
One of the primary purposes of the medical recordreview during the early stages of the HHE was todetermine whether workers were becoming newlysymptomatic during the time TRW was takingmeasures to eliminate (or minimize) the cause(s)of the respiratory illnesses which were occurringamong employees. During June and July of 2001many employees were being evaluated forrespiratory symptoms and other concerns byseveral different healthcare providers. Althoughit could not be formally documented during thattime because of the large number of workerscontinuing to present for evaluations, discussionswith the two primary healthcare providers forTRW employees indicated that many of theworkers presenting for evaluation had beensymptomatic for many weeks or months.
TRW records reviewed in November 2001revealed that 107 workers had been placed onwork restriction due to respiratory conditions inthe previous 11 months. Among these 107, 70(65%) had returned to work as of November 2001.Nineteen (27%) of those 70 workers weremedically restricted by their treating physicianfrom exposure to MWF – (medical restrictionincluded either use of respiratory protection orrestrictions from working in the machining areasof the plant). Fifty-one (73%) of the 70 hadmedical restrictions prior to November 2001which had subsequently been removed by theirtreating physician. Thirty-seven (35%) of the total107 remained on medical leave of absence as ofNovember 2001. Medical records were reviewedfor 32 (86%) of the 37 workers. Among these 32workers, 25 (78%) had primary work duties in themachining areas of the plant, although all 32reported intermittent work duties in the machiningside of the plant. The median length of timeworking at TRW for these 32 workers was 18
years. Date of onset of symptoms for theseworkers ranged from October 2000 to April 2001,with the majority of persons reporting onset ofrespiratory symptoms in December 2000 andJanuary 2001. Among the 32 workers, 14 (44%)met the definition (defined in Methods) for OAand 12 (38%) the definition for HP. Six (19%) ofthe 32 had illnesses characterized primarily byrespiratory or upper respiratory symptoms but didnot meet the definitions for OA or HP; thesepersons had symptoms consistent with work-related bronchitis or rhinosinusitis.
The date of onset of symptoms refers to the dateemployees reported that they first had symptomsrelated to their illness. In most cases this date isdifferent (often by several months or more) fromthe date employees first saw a health careprovider. The difference between these dates islikely due to several factors, including employeesnot considering their symptoms serious enough torequire medical care as well as other issues relatedto access to medical care.
TRW records from March 2002 revealed that 35workers were on medical leave of absence due torespiratory conditions. Of the 35, 30 of theworkers had been on medical leave of absence asof the November 2001 record review and hadremained off work. Three of the 35 had not beenmedically restricted in November 2001, and 2 ofthe 35 had been medically restricted (work in thenon-machining areas) as of November 2001.Twenty-one workers were medically restricted asof the March 2002 record review. Of the 21, 16had been similarly restricted in November 2001, 3had not been medically restricted as of November2001, and 2 had previously been on medical leaveof absence. Several issues were discussed in a meeting withone of the primary treating pulmonologists inApril 2002. Regarding the possibility of newlysymptomatic workers (the recognition of newlysymptomatic employees could be used as anindicator of the effectiveness of control measuresat the plant), the physician reported that no TRWworkers hired to replace workers out on medical

Page 12 Health Hazard Evaluation Report No. 2001-0303-2893
disability had been seen for respiratory illness; thephysician agreed with the findings of symptomonset reported in the record review above. Thephysician’s own summaries of illness amongTRW workers at that time included: 18 personsdiagnosed with HP, 10 with OA, 13 with a mixedHP/OA illness, 5 with other respiratorydiagnoses, and 7 not categorized. The physiciannoted that a primary symptom which had persistedamong many of the ill workers, and which was aprimary reason for inability to return to work, wasa profound fatigue (in many cases, occurring inthe setting of normal pulmonary function tests).
Neurologic Issues
In the course of the HHE, concerns related toneurologic symptoms among some workers wereraised. The exact number of workers reportingthese symptoms was not determined precisely,however union representatives reported thatapproximately 10-20 workers may have reportedthese symptoms. Specifically, workers hadreported to healthcare providers that they wereexperiencing tremors, and they were concernedthat the tremors were related to occupationalexposures at the TRW facility. Some of theemployees reporting these symptoms werereferred to a neurologist. In April 2002, theNIOSH medical officer reviewed seven medicalrecords from the consulting neurologist andinterviewed an eighth worker with tremor (butwho had not yet seen a neurologist). Of thoseeight persons, seven worked primarily in themachining areas, and the other worked primarilyin assembly but performed overtime work in themachining areas. The records of six workers hadsome information on physical findings, and eachdemonstrated abnormal findings on the neurologicexamination; most commonly the workers werenoted to have fine postural tremor with someintention tremor as well. One person had a historyof head tremor. In several cases, the records noted“mild” or “minimal” evidence of cogwheelrigidity (which is among the findings consistentwith Parkinson’s Disease). The onset of tremor(for all seven workers for which this informationwas available) was noted to be January 2001 (two
persons), May 2001 (two persons), July 2001 (oneperson), ‘fall’ 2001 (one person), and Febraury2002 (one person). The consulting neurologistperformed a medical evaluation for tremor(including blood tests and magnetic resonanceimaging of the brain in most cases) and could notidentify a specific cause or underlying reason forthe observed clinical findings. Conclusions fromthe neurologist for each of the seven personsincluded concerns about possible work-related“chemical” or “toxic” exposures; no specificchemicals or toxins were described in the recordsas possible agents causing the observed findings.
Material safety data sheets for all of the agentsused in manufacturing processes in the machiningportion of the plant around January 2001 werereviewed, and none of the materials containedsubstances that have been found to be associatedwith parkinsonism or tremor. A thorough reviewof agents (chemicals or toxins) known to beassociated with movement disorders (such asparkinsonism and tremor) did not reveal any suchsubstances to be in use (or produced) at TRW.24
Questionnaire
Among the 305 persons completing thequestionnaire, 168 (57%) were from 1st shift (day),107 (36%) from 2nd shift (afternoon), and 22 (7%)from 3rd shift (nights). Descriptive statistics ofparticipants are included in Table 9, grouped byself-reported exposure to MWF in their job.
The questionnaire was used to try to identifyspecific machines, systems, or areas that might beassociated with an increase of reported symptomsor illnesses. Sixty-one (21%) workers reportedthat they usually work on one machine; this isconsistent with the frequent job rotation which hadbeen reported by management and employeerepresentatives. Among the 270 persons whoreported at least one respiratory or systemicsymptom in the year prior to the survey, only 76(28%) reported that the symptoms were related toa specific work activity or job task. A summary ofthe work activities or job tasks associated by these76 persons with symptoms, categorized by self-

Health Hazard Evaluation Report No. 2001-0303-2893 Page 13
reported work with MWF in their usual job, ispresented in Table 10. Among the 76 persons, 44(58%) identified exposure to MWF (or some taskrelated to using MWF) as being related to theirsymptoms, but very few individual specific areas,systems, or machines were identified as beingrelated to symptoms.
All symptoms included in the questionnaire werereported more frequently among those employeesexposed to MWF (Table 11), with prevalenceratios for symptoms ranging from 1.2 - 2.2. CI forthe prevalence ratio for one of the symptoms(“ache all over”) included 1; all other CI weregreater than 1. Twenty (77 %) of the 26 personsmeeting the case definitions for HP or OA in themedical record review (discussed above)participated in the questionnaire survey. Both HPand OA were more commonly observed amongthe exposed group compared to the unexposedgroup, although the difference between the twogroups was not statistically significant. Of thefive persons with HP or OA unexposed to MWF,four worked in Department W21 (a department inwhich machining with MWF occurred). One ofthe five worked in W08 (assembly, no MWF usedroutinely), but did report (in the medical record)daily presence in machining areas.
Reported symptoms were also analyzed by ‘high’and ‘low’ exposure status. Based on summarydata presented in Table 1, Departments 1, 2, 4, and6 were categorized as ‘high’ exposure areas; 53participants from the questionnaire survey workedprimarily in those departments. Departments 7,17, and 57 (toolroom) were grouped as ‘low’exposure areas; 21 participants from thequestionnaire survey worked primarily in thosedepartments. Table 12 shows there were nostatistically significant differences in symptoms orillnesses between these two groups. In general,systemic symptoms (fever, aches, and chills) hadthe highest PR between the groups, while severalrespiratory symptoms (cough, shortness of breath,and chest tightness) were reported by similarpercentages in both groups. Although the smallnumbers make detecting statistically significantcomparisons difficult, similar percentages of
workers with the two illnesses (HP and OA) werefound among both the ‘high’ and ‘low’ exposuregroups.
DISCUSSION ANDCONCLUSIONS
Our evaluation documented that many TRW Mt.Vernon employees have experienced work-relatedrespiratory illness, with first reported onset ofsymptoms in the fall of 2000. As has beenobserved in other outbreaks of respiratory illnessamong workers exposed to MWF in machineshops,16 a spectrum of illness was observed amongTRW workers. Record review concerningworkers on medical leave of absence in November2001 found that 12 and 14 workers, respectively,met case definitions for HP and OA. Ongoingrecord review in April 2002 revealed that theprimary treating pulmonologist had diagnosed atleast 41 persons with HP, OA, or somecombination of these two illnesses. The largernumber of clinically-defined cases of illnessrelative to the epidemiologically-defined cases isnot unexpected, and likely involves a number offactors. In many cases, clinicians will(appropriately) make a diagnosis of illness (suchas OA or HP) and begin treatment based onhistory and physical findings. Testing, oftenincluded as necessary components ofepidemiologic case definitions, may not beperformed in all clinical cases (or the test resultsmay not be available when the record review isperformed). Additionally, the record reviewperformed for this HHE in November 2001included only workers off work due to respiratoryillness. Although, in most cases, personsdiagnosed with HP or OA in 2001 had beenremoved from work and had not returned to workprior to the November 2001 record review, it ispossible that a small number of workers who hadbeen sick had returned to restricted duty, andwould therefore not have been included in therecord review. It is also likely that the actualnumber of workers with diagnosed illness isgreater than that reported above from either record

Page 14 Health Hazard Evaluation Report No. 2001-0303-2893
review because: 1) the review of clinicians’records for this HHE included review of records ofthe two primary treating physicians, and someTRW employees likely sought medical care fromother physicians from whom records were notreveiwed; and 2) due to the ongoing nature of themedical evaluations of the primary physicians, areview by NIOSH representatives at any point intime could have been incomplete.
In addition to diagnosed illnesses, ourquestionnaire survey and medical record reviewsconfirmed that a substantial percentage of TRWemployees have been symptomatic withrespiratory and/or systemic symptoms (notnecessarily meeting the criteria for diagnosis ofHP or OA). Some of these symptomatic workershave been diagnosed with a variety of otherconditions (such as rhinosinusitis and bronchitis).Workers exposed to MWF are known toexperience respiratory and upper respiratorysymptoms more commonly than comparisongroups of workers.25,26 It is not known whethersuch symptoms represent milder forms of theillnesses that have been diagnosed, irritant effectsof the aerosol in the machining areas not related tothe observed illnesses, or some other effect.
Although the exact cause of employees’ symptomsand illnesses has not been determined, evidencefrom similar outbreaks of illnesses at otherworkplaces suggests that contamination of theMWF with Mycobacteria sp. is playing a role.Multiple interventions (control measures) were putin place over time at TRW. During the course ofthe HHE, it was sometimes difficult to distinguishbetween new onset of symptoms and newlydiagnosed illnesses. It was several months untilthe records were available to document that newdiagnoses of respiratory illness were being madeamong workers who had onset of symptoms quitea bit earlier (many months in some instances).Our review found that no workers had onset ofsymptoms after May 2001; however, we are notable to identify one specific control measurewhich has been primarily effective in eliminatingthe source of the illnesses. Actions taken by TRWto eliminate (or minimize) the source of work-
related illnesses prior to May 2001 includedprimarily improvement in MWF maintenanceprocedures, cleaning machines and centralsystems, and recharging the systems with freshMWF. Many other control measures wereinstituted after May 2001, and it is not clearwhether or not new illnesses would havecontinued to occur (or if pre-existing symptomswould have worsened) in the absence of anyspecific control(s). The assessment of theeffectiveness of controls to prevent new illnessesmay be particularly difficult in situations in whichsome workers may have been “sensitized” to asubstance (or antigen) in the plant, and who maystill may be symptomatic from exposure to muchdecreased levels of that substance (antigen).
Industrial Hygiene Issues
Review of air sampling data collected over June2001 - February 2002 confirmed that somemachining departments had higher airconcentrations of MWF aerosol than others. PBZair monitoring conducted by NIOSH duringnormal production in June 2001 revealed noexposures above the NIOSH REL for MWFaerosol. Five exposures exceeded the NIOSHREL during the December 2001 site visit, whichoccurred after the general ventilationimprovements in the machining areas(August/September 2001) but prior to installationof mist collectors on a number of the machines(December 2001/January 2002). The meanexposure for the samples taken on December 18,2001, was 0.37 mg/m3, compared to a mean of0.23 mg/m3 for the samples taken on June 29,2001. The increase in number of exposures abovethe REL, and the increase in the mean exposurefor the sample sets, may have resulted from thegreater percentage of samples collected fromoperators who work on machines that wereexpected to produce more MWF aerosol thanother machines. These “high-exposure” jobs werea point of focus so that after mist collectors wereinstalled a repeated exposure assessment (notperformed as part of this HHE) could documentthe effects of improved engineering controls.Therefore air sampling performed by NIOSH is

Health Hazard Evaluation Report No. 2001-0303-2893 Page 15
not suitable to determine the effectiveness ofincreased general ventilation in lowering MWFaerosol concentrations.
Observations from several site visits indicated thatit may be feasible to further reduce the amount ofMWF aerosol produced by some of the largermachining centers which may be more difficult toenclose and/or ventilate. Regarding the Barnestransfer line, one possible approach is to optimizethe flow of MWF and tool rotation speeds so thatMWF is applied to the work area only when partsare machined, not during non-production cycletime. In general, when a part is not beingmachined by a head, reducing or stopping theMWF flow and tool rotation would be expected toproduce decreased levels of MWF aerosol.
Air sampling done during cleanup operationsindicates that the potential for exposures to MWFaerosol above the NIOSH REL exists during suchwork. Because of this, and the potential forsignificant bioaerosol exposure during suchcleaning operations, PPE should be used bycleanup personnel (as it was at TRW during theJune 2001 cleaning operations). Based onqualitative observations of the containment systemand aerosol measurements, isolation of the Largesystem area during cleanup was effective with onepossible exception. One area sample (numberedMWF28 – south across the aisle from the 9 stationanchor dial, see Table 2) was collected outside thecontainment area and had a higher concentrationthan other similar area samples. We could notdetermine whether that higher concentrationoriginated from cleaning operations inside thecontainment area or from some operation outsidethe containment area in close proximity to MWF28.
Total concentrations of culturable bacteriameasured during this HHE have not been abovelevels typically seen at similar facilities.However, the relatively high concentrations ofMycobacteria in May and June 2001 (compared tothe concentrations of more common Gram-negative bacteria) does represent a potentiallyimportant qualitative difference in the bacterial
contamination of the MWF compared to that ofsimilar facilities. Since the steam cleaningprocedures, the improvements in MWFmaintenance, and the change in biocide in lateJuly/August 2001, microbial growth in the MWFhas been minimal. Repeated AFB pellet stainsused to detect total (alive and dead) Mycobacteriahas revealed a downward trend over the course ofthe HHE. The fact that the pellet stainconcentrations decreased slowly probablyindicates that these organisms have existed inareas within the MWF systems that areinaccessible to cleaning methods (sometimesreferred to as existing in a “biofilm”). It seemsreasonable that as the “biofilm” deteriorates it willslough dead cells into the MWF.27
Medical/Epidemiologic Issues
The PRs for symptoms reported among workersexposed to MWF (compared to those unexposed)are similar to those PRs found among workers inother HHEs at other machining shops with andwithout diagnosed cases of HP and/or OA.25,26
However, in comparison to other machine shopswhere we have performed similar surveys, theabsolute numbers (and percentages) of workers atTRW reporting symptoms was higher in both theexposed and the unexposed groups. The reason(s)for this are not clear. MWF aerosolconcentrations were not substantially higher atTRW relative to other machine shops in whichNIOSH has conducted HHEs. It is possible thatthe great concern over illnesses among TRWemployees around the time of the HHE was onefactor leading to increased reporting of symptomsin the questionnaire survey.
The analyses of symptoms and PRs between‘high’ and ‘low’ exposure groups consisted of asmaller number of persons compared to the similaranalyses among ‘exposed’ and ‘unexposed.’ Thesmaller numbers make it harder to drawconclusions about statistical differences betweengroups; however, it appears that both respiratorysymptoms and illnesses were reportedapproximately equally between the ‘high’ and‘low’ exposure groups. One possible conclusion

Page 16 Health Hazard Evaluation Report No. 2001-0303-2893
from this comparison is that exposure to MWFaerosol at concentrations observed in both the‘high’ and ‘low’ exposure areas is sufficient tocause respiratory effects. There are severallimitations in this type of comparison. Forexample, many of the air concentrations used todetermine the ‘high’ and ‘low’ groups were areasamples, and may not be representative of actualexposures. Also, TRW workers rotated jobsfrequently, and our questionnaire did notdetermine how much time an employee reportinga usual job in any given department actuallyspends in that department (versus anotherdepartment). And finally, it is likely that MWFaerosol exposures may vary widely within anygiven department. Further data are needed beforeany conclusions could be drawn from these dataconcerning the level of MWF aerosol associatedwith respiratory symptoms and illnesses.
Neurologic Issues (Tremor)
Review of the medical records involvingemployees with tremor, as well as review ofinformation concerning substances used in themachining areas of the plant relative to possibleneurologic effects, did not reveal any substancesor chemical compounds associated withneurotoxicity to which workers may be exposed atTRW. The most common finding in the medicalrecords which were reviewed was of posturaltremor. Postural tremor is a tremor which isgreatest when the limb (arm or leg) is activelymaintained against gravity. Acute onset ofpostural tremor has been thought to be related tospecific toxic exposures, metabolic factors (suchas those related to systemic illness) or stress.28
One person’s tremor appeared, by history, to bemore consistent with essential tremor (tremor ofuncertain cause, thought to be familial). Althoughthe consulting neurologist could not identify asingle source for the reported symptoms andobserved abnormalities, several issues werementioned in the records that may be playing arole. These issues include co-morbidity (otherillness, such as respiratory illness, that could becontributing to tremor) and medication use. Forexample, among the three workers who had the
most severe clinical illness with HP, all reportedtremor, and two of the three reported tremorstarting around the same time as their pulmonaryillness. Among the workers for whom recordswere reviewed, several reported use ofmedications to treat pulmonary symptoms, and itis possible that some of those medications (such asinhaled beta-agonists) could have beencontributing to the observed tremor. In one case,one person had a history of use of a medicationknown to cause tremor as an adverse effect.
When we considered potential occupationalexposures at TRW related to tremor, it was notedthat the onset of the reported tremors ranged fromJanuary 2001 to February 2002. Over that timeperiod, the MWF and biocides in use at the plantchanged, and substantial changes were also madein ventilation in the machining areas of the plant.Specifically concerning PCMC (the phenolbiocide which was first used in the plant inJuly/August 2001), four of the seven workers forwhom the date of onset of tremor was reported hadonset of tremor prior to the first use of PCMC atTRW. These facts make it unlikely that theMWFs, or additives to the MWFs, were related tothe observed tremors. Continued clinical follow-up for workers experiencing tremor would beappropriate in addressing continued concernsrelated to these symptoms and to further examineother potential causes.
RECOMMENDATIONSA comprehensive safety and health programregarding MWFs (including engineering controls,fluid maintenance, environmental surveillance,and medical moni tor ing) fo l lowingrecommendations published in the NIOSH CriteriaDocument “Occupational Exposure toMetalworking Fluids” should continue to beimplemented to minimize health effects related toMWF exposure in the machining environment.7Portions of this type of program have already beenput in place at TRW Mt. Vernon. Some of thespecific components of this type of programinclude the following:
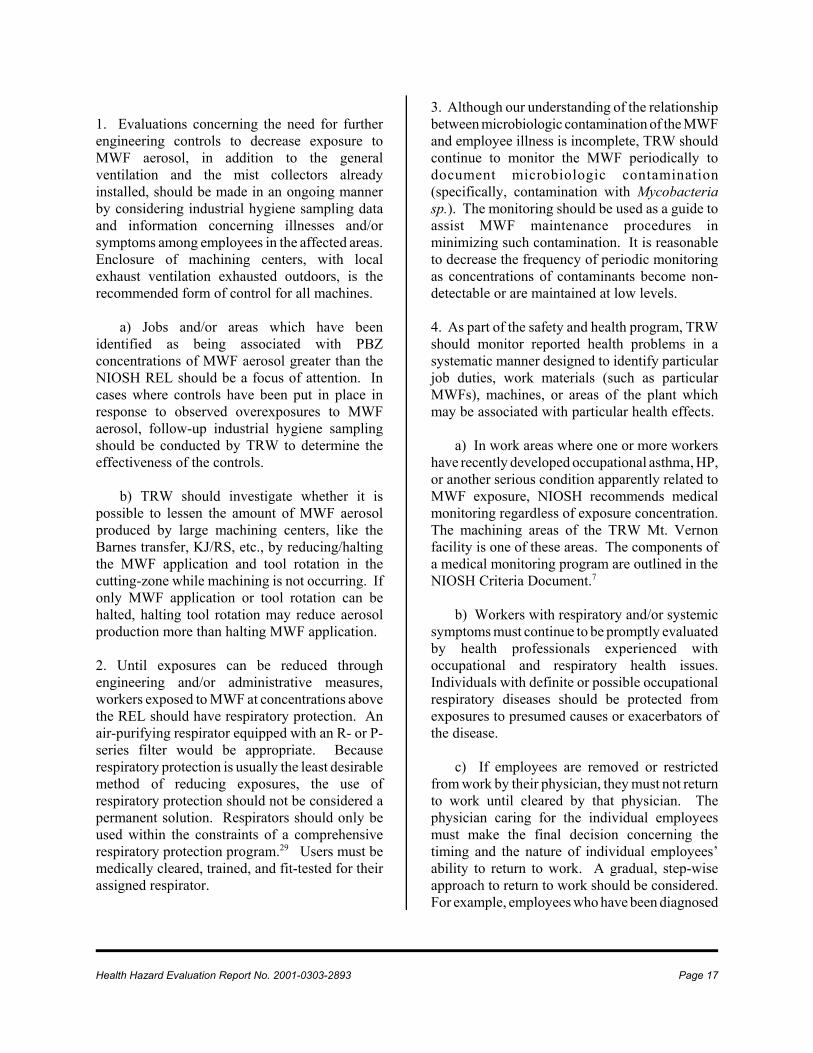
Health Hazard Evaluation Report No. 2001-0303-2893 Page 17
1. Evaluations concerning the need for furtherengineering controls to decrease exposure toMWF aerosol, in addition to the generalventilation and the mist collectors alreadyinstalled, should be made in an ongoing mannerby considering industrial hygiene sampling dataand information concerning illnesses and/orsymptoms among employees in the affected areas.Enclosure of machining centers, with localexhaust ventilation exhausted outdoors, is therecommended form of control for all machines.
a) Jobs and/or areas which have beenidentified as being associated with PBZconcentrations of MWF aerosol greater than theNIOSH REL should be a focus of attention. Incases where controls have been put in place inresponse to observed overexposures to MWFaerosol, follow-up industrial hygiene samplingshould be conducted by TRW to determine theeffectiveness of the controls.
b) TRW should investigate whether it ispossible to lessen the amount of MWF aerosolproduced by large machining centers, like theBarnes transfer, KJ/RS, etc., by reducing/haltingthe MWF application and tool rotation in thecutting-zone while machining is not occurring. Ifonly MWF application or tool rotation can behalted, halting tool rotation may reduce aerosolproduction more than halting MWF application.
2. Until exposures can be reduced throughengineering and/or administrative measures,workers exposed to MWF at concentrations abovethe REL should have respiratory protection. Anair-purifying respirator equipped with an R- or P-series filter would be appropriate. Becauserespiratory protection is usually the least desirablemethod of reducing exposures, the use ofrespiratory protection should not be considered apermanent solution. Respirators should only beused within the constraints of a comprehensiverespiratory protection program.29 Users must bemedically cleared, trained, and fit-tested for theirassigned respirator.
3. Although our understanding of the relationshipbetween microbiologic contamination of the MWFand employee illness is incomplete, TRW shouldcontinue to monitor the MWF periodically todocument microbiologic contamination(specifically, contamination with Mycobacteriasp.). The monitoring should be used as a guide toassist MWF maintenance procedures inminimizing such contamination. It is reasonableto decrease the frequency of periodic monitoringas concentrations of contaminants become non-detectable or are maintained at low levels.
4. As part of the safety and health program, TRWshould monitor reported health problems in asystematic manner designed to identify particularjob duties, work materials (such as particularMWFs), machines, or areas of the plant whichmay be associated with particular health effects.
a) In work areas where one or more workershave recently developed occupational asthma, HP,or another serious condition apparently related toMWF exposure, NIOSH recommends medicalmonitoring regardless of exposure concentration.The machining areas of the TRW Mt. Vernonfacility is one of these areas. The components ofa medical monitoring program are outlined in theNIOSH Criteria Document.7
b) Workers with respiratory and/or systemicsymptoms must continue to be promptly evaluatedby health professionals experienced withoccupational and respiratory health issues.Individuals with definite or possible occupationalrespiratory diseases should be protected fromexposures to presumed causes or exacerbators ofthe disease.
c) If employees are removed or restrictedfrom work by their physician, they must not returnto work until cleared by that physician. Thephysician caring for the individual employeesmust make the final decision concerning thetiming and the nature of individual employees’ability to return to work. A gradual, step-wiseapproach to return to work should be considered.For example, employees who have been diagnosed

Page 18 Health Hazard Evaluation Report No. 2001-0303-2893
1. Weiss L, Pue C, Rossmoore H, Lewis R, FinkJ, Harney J, and Trout D [2002]. RespiratoryIllness in Workers Exposed to Metalworking FluidContaminated with Nontuberculous Mycobacteria,Ohio, 2001. MMWR 51(16):349-52.
2. Harold Rossmoore, PhD, Biosan Laboratory,personal communication, 2001.
with HP, occupational asthma, or similar illness,when judged able to return to work by theirhealthcare provider, may benefit from an initialtrial of work in areas of the plant physicallyremoved from machining processes (such as theassembly area). Subsequent issues, includingreturn to work in the machining areas, as well asissues concerning potential use of respiratoryprotection, must then be handled on a case-by-casebasis. Close clinical follow-up is required for allemployees returning to work after having beenrestricted due to respiratory or systemic illness.Employees who have developed HP or similarillness related to a substance(s) in the MWF maybecome symptomatic upon return to specific areasof the facility even after cleaning of the machinesand the MWF systems and improvement ofventilation and engineering controls (even if MWFaerosol concentrations are less than the NIOSHREL).
d) In some cases, reassignment to areas whereexposure is minimized or nonexistent may bemedically advisable. In such cases, the reassignedworker should retain wages, seniority, and otherbenefits that might otherwise be lost by such a jobtransfer.
5. TRW and the union should continue to educateall TRW workers concerning occupational healthconcerns at TRW, and should continue toencourage employees to report health symptomspossibly related to workplace exposures toappropriate health professionals as soon as theyoccur.
6. The employee(s) in charge of MWFmanagement should be given the authority toensure that fluids are not tampered with, thatadditions are made appropriately, and that systemsare routinely cleaned. No unauthorized additionsshould be made.
7. During any future cleaning of the MWFsystems and machines with pressurized water orsteam, the following are recommended (thesesteps are similar to the steps for containment that
were used during the cleanup of the Large systemin June 2001):
a) Management should require work practicesand PPE intended to minimize worker skin contactwith MWF components or contaminants duringthe cleaning process.
b) Management should require work practicesintended to minimize aerosolization of MWFcomponents or contaminants during the cleaningprocess.
c) Cleaning of the MWF systems should bedone without exposing workers in adjacent plantareas to aerosols produced during the cleaningactivity (ideally the cleaning should be done whenthere are a minimum number of other employeesin the areas surrounding the areas involved incleaning).
d) Management should require thatappropriate respiratory protection be used byworkers performing the cleaning, and by workersin areas adjacent to the cleaning activities. Use ofrespiratory protection must follow provisions ofthe OSHA Respiratory Protection Standard.29
8. Although not the focus of this HHE, preventionof skin contact with MWF and MWF additivesshould be a primary focus of a MWF safety andhealth program. Skin contact with thesesubstances should be reduced as much as possibleby the use of engineering controls andmodification of work practices, and lastly, by theuse of appropriate personal protective equipment.
REFERENCES

Health Hazard Evaluation Report No. 2001-0303-2893 Page 19
3. ACGIH [2001]. 2001 TLVs® and BEIs®:threshold limit values for chemical substances andphysical agents and biological exposure indices.Cincinnati, OH: American Conference ofGovernmental Industrial Hygienists.
4. NIOSH [1994]. Metalworking fluids (allcategories) (DRAFT Method 5524). In: EllerPM, Cassinelli ME, eds. NIOSH manual ofanalytical methods. 4th ed. Cincinnati, OH: U.S.Department of Health and Human Services, PublicHealth Service, Centers for Disease Control andPrevention, National Institute for OccupationalSafety and Health.
5. NIOSH [1992]. Recommendations foroccupational safety and health: compendium ofpolicy documents and statements. Cincinnati, OH:U.S. Department of Health and Human Services,Public Health Service, Centers for Disease Controland Prevention, National Institute for Occupational Safety and Health, DHHS(NIOSH) Publication No. 92-100.
6. CFR [1997]. 29 CFR 1910.1000. Code ofFederal Regulations. Washington, DC: U.S.Government Printing Office, Office of the FederalRegister.
7. NIOSH [1998a]. Criteria for a recommendedstandard: occupational exposure to metalworkingfluids. Cincinnati, OH: Department of Health andHuman Services, Public Health Service, Centersfor Disease Control and Prevention, NationalInstitute for Occupational Safety and Health.DHHS (NIOSH) publication number 98-102.
8. Rossmore LA, Rossmore HW [1994].Metalworking fluid microbiology. In: Byers J, ed.Metalworking Fluids. New York, NY: MarcelDekker, Inc., pp. 247-271.
9. Tant CO, Bennett EO [1956]. The isolationof Pathogenic Bacteria from Used Emulsion Oils.Applied Microbiology. 4:332-338.
10. Holdom, RS [1976]. Microbial spoilage ofengineering materials. Part 3: Are infected oilemulsions a health hazard to workers and to the
public. Tribology International. December, pp.271-280.
11. Tant CO, Bennett EO [1958]. The growth ofaerobic bacteria in metal-cutting fluids. AppliedMicrobiology. 6:388-391.
12. Rossmore HW [1967]. Survival ofcoagulase-positive staphylococci in soluble cuttingoils. Health Laboratory Science. 4:160-165.
13. Bennett, EO [1972]. The biology of metal-working fluids. Lubrication Engineering. July,pp. 237-247.
14. Hill EC [1983]. Microbial aspects of healthhazards from water-based metal-working fluids.Tribology International. 16(3):136-140.
15. CDC [1996]. Biopsy-confirmedhypersensitivity pneumonitis in automobileproduction workers exposed to metalworkingfluids -- Michigan. MMWR. 45(28): 606-610.
16. Zacharisen MC, et al.[1998]. The spectrumof respiratory disease associated with exposure tometal working fluids. JOEM. 40(7):640-647.
17. Kreiss K, Cox-Ganser J. Metalworking fluid-associated hypersensitivity pneumonitis: aworkshop summary. AJIM 1997;32:423-32.
18. Shelton BG, Flanders WD, Morris GK.Mycobacterium sp. as a possible cause ofhypersensitivity pneumonitis in machine workers.Emerg Infect Dis. [serial online] 1999 Mar-Apr[cited 2001 Dec 4];5(2). Available athttp://www.cdc.gov/ncidod/eid/vol5no2/shelton.htm
19. Wilson RW, Steingrube VA, Bottger EC, etal. Mycobacterium immunogenum sp. nov., anovel species related to Mycobacterium abscessusand associated with clinical disease, pseudo-outbreaks and contaminated metalworking fluids:an international cooperative study onmycobacterial taxonomy. Int J Systematic andEvolutionary Micro 2001. 51:1751-1764.

Page 20 Health Hazard Evaluation Report No. 2001-0303-2893
20. Terho EO [1986]. Diagnostic criteria forfarmer's lung disease. AJIM. 10:329.
21. Fox, J, et al. [1999]. Metal working fluid-associated hypersensitivity pneumonitis: anoutbreak investigation and case-control study.AJIM 35:58-67.
22. Wilson RW, Steingrube VA, Bottger EC, etal. [2001]. Mycobacterium immunogenum sp.nov., a novel species related to Mycobacteriumabscessus and associated with clinical disease,pseudo-outbreaks and contaminated metalworkingfluids: an international cooperative study onmycobacterial taxonomy. Int J Systematic andEvolutionary Micro. 51:1751-1764.
23. Olenchock S [1997]. Ch. 71: AirborneEndotoxin, in: Manual of EnvironmentalMicrobiology, Hurst CJ, ed., ASM Press,Washington, D.C. pp. 661-665.
24. Filley CM and Kelly JP [2001]. Clinicalneurotoxicology and neurobehavioral toxicology.In: Sullivan JB and Krieger GR, eds. ClinicalEnvironmental Health and Toxic Exposures, 2nd
Edition. Lippincott Williams and Wilkins,Philadelphia, PA, pp. 247-260.
25. NIOSH [1998b]. Hazard Evaluations andTechnical Assistance report: Ford Electronics andRefrigeration Corporation, Connersville, IN.Cincinnati, OH: U.S. Department of Health andHuman Services, Public Health Service, Centersfor Disease Control and Prevention; NIOSH.HETA 96-0156-2712.
26. NIOSH [1998c]. Hazard Evaluations andTechnical Assistance report: Pratt and Whitney,TAPC, North Haven, CT. Cincinnati, OH: U.S.Department of Health and Human Services, PublicHealth Service, Centers for Disease Control andPrevention; NIOSH. HETA 98-0030-2697.
27. Donlan RM [2002]. Biofilms: microbial lifeon surfaces. Emerg Infect Dis [serial online] 2002Sep [date accessed August 23, 2002];8 Availablefrom: URL: http://www.cdc.gov/ncidod/EID/vol8no9/02-0063.htm
28. Olney RK and Aminoff MJ. [2001].Weakness, myalgias, disorders of movment andimbalance. In: Braunwald E, et al., eds.Harrison’s Principles of Internal Medicine, 15th
Edition. McGraw Hill, New York, NY, pp. 124-126.
29. OSHA [1998]. 29 CFR 1910.134.Respiratory Protection Standard. Federal Register63 FR 1152, January 8, 1998.

Health Hazard Evaluation Report No. 2001-0303-2893 Page 21
Table 1Review of Total Particulate Air Sampling* (in mg/m3) in Machining Areas Performed by TRW
June 2001 to February 2002HETA #2001-0303, TRW Automotive, June 29, 2001
Department N (#samples)
Mean Median Minimum Maximum
W01 80 0.42 0.32 0.059 3.3
W02 121 0.51 0.4 0.1 3.5
W03 25 0.39 0.27 0.06 1.3
W04 139 0.68 0.59 0.1 2.1
W06 131 0.4 0.38 0.067 1.6
W07 65 0.2 0.17 0.067 0.52
W17 32 0.16 0.15 0.069 0.36
Toolroom (W57) 19 0.21 0.14 0.062 0.65
“High” ExposureAreas (W1, W2, W4,
W6)
471 0.52 0.42 0.059 3.5
“Low” ExposureAreas (W7, W17,
W57)
116 0.19 0.15 0.0069 0.65
* Includes area and PBZ samples

Page 22 Health Hazard Evaluation Report No. 2001-0303-2893
Table 2 Personal breathing zone MWF aerosol sample results from normal production
HETA #2001-0303, TRW Automotive, June 29, 2001Work location Sample # Sample time
(min.)sample
volume (L)Concentration,
mg/m3%
Extractable
Neon caliper assembly line MWF 12 462 739 nd n/a
Neon caliper assembly line MWF 7 373 597 nd n/a
RS/ KJ assembly MWF 10 455 728 nd n/a
RS drum assembly MWF 16 451 722 0.07 67
8/12 station RS/KJ, operator MWF 14 442 707 (0.28) 65
OTS operator, WO-4 MWF 1 488 781 (0.26) 70
OTS operator, Barnes washer MWF 3 487 779 0.32 76
PHN131 anchor broach MWF 20 293 468 0.41 79
Inspector MWF 19 481 770 0.27 81
CNC operator Honsberg MWF 18 473 757 0.37 79
RS/KJ 10 station, WO-2 MWF 17 493 789 0.15 80
PTech., neon w/c assembly MWF 8 480 768 (0.08) 83
CNC operator LeBlond,WO-1
MWF 6 418 669 (0.11) 71
PHN131 9 station MWF 11 180 448 (0.22) 90
Supervisor 01, 04, 09 MWF 9 375 600 (0.13) 75
Kirby operator, WO-7 MWF 13 502 803 (0.06) 80
Kirby operator, WO-7 MWF 5 145 232 nd n/a
PHN131 caliper broachoperator, WO-2
MWF 15 492 787 (0.25) 80
PHN131caliper 12 stationoperator, WO-2
MWF 4 488 781 (0.13) 60
Vertical broach operator,WO-2
MWF 2 496 794 0.33 81
NIOSH REL 0.4 mg/m3
nd = ‘not detected’; mass on filter was less than the LODn/a = not applicable( ) = values in parentheses are between the MDC and the MQC, and should be considered semi-quantitative
Table 3

Health Hazard Evaluation Report No. 2001-0303-2893 Page 23
MWF thoracic aerosol sample results collected during cleanup operationsHETA #2001-0303, TRW Automotive, June 29, 2001
Sample location Inside/Outsidecontainment
area
Sample # Sampletime
(min.)
Samplevol. (L)
Concentration,mg/m3
%Extractable
Steam clean asst.* Inside MWF 21 270 432 0.44 79
Between 9-station and P131 anchorbroach
Inside MWF 22 386 618 0.45 86
Center of WO1,North of BarnesTransfer
Inside MWF 23 388 621 0.13 79
Operator’s tablenear Honsberg
Inside MWF 24 394 630 0.51 84
WO4, near caliperbroach
Inside MWF 25 391 626 0.5 81
Break room, on topof vendingmachines on Southwall
Outside MWF 26 403 645 0.03 n/a
KJ/RS machine Outside MWF 27 306 490 0.09 85
South across aislefrom 9 stationanchor
Outside MWF 28 373 597 0.2 78
Assembly,Southwest cornerof WO9
Outside MWF 29 401 642 0.03 n/a
South across aislefrom West end of Barnes Transfer
Outside MWF 30 374 599 0.06 91
NIOSH REL 0.4 mg/m3
*PBZ sample; all other samples are area samples.

Page 24 Health Hazard Evaluation Report No. 2001-0303-2893
Table 4 Real-time aerosol measurements during normal production
HETA #2001-0303, TRW Automotive, June 29, 2001
Sample location Aerosol concentration*, mg/m3
Normal production
NE corner of machine side 0.23
Middle of Northmost aisle 0.2
NW corner of machine side 0.25
At Northmost parts washer 0.5
Barnes transfer, station #15 0.8
Barnes transfer, station #11 0.3
Barnes transfer, station #7 1.2
Barnes transfer, station #5 1.5
E. aisle, by N. garage door 0.25
E. aisle, by payphone 0.2
PHN 131 broach 0.5
Near pole B6 0.35
Aisle near RS 10 station 0.25
Aisle N of Mann-Hummel Kirby machines 0.2
Machine shop 0.2
SW corner of machine side 0.2
SE corner of machine side, near open garage door 0.15
Assembly side aisles 0.09
Outside SE corner of machine side 0.07*During this study the HAM was not calibrated using a side-by-side gravimetric method. Data gathered with the HAMshould be regarded as qualitative in nature, and are best used in this case as a means to compare aerosol concentrationswithin the plant on a relative basis.

Health Hazard Evaluation Report No. 2001-0303-2893 Page 25
Table 5 Real-time aerosol measurements from machining side of plant
HETA #2001-0303, TRW Automotive, June 29-30, 2001
Sample location Aerosol concentration*, mg/m3
Immediately precedingcleanup operations
During cleanup
NE corner of machining side 0.12 0.12
Middle of E aisle insidecontainment
0.13 0.12
E-W aisle in front of KJ/RS(machines not running)
0.12 0.12
E-W aisle, outside containment,due S of W end of Barnes Transfer(by seam in plastic)
0.21 0.22
E-W aisle, outside containment,near horizontal broach
0.22 0.2
West-most N-S aisle outsidecontainment, near seam in plastic
0.22 0.18
SW corner of containment, by Wwall of bldg. by opening in plastic
0.25 0.25
*During this study the HAM was not calibrated using a side-by-side gravimetric method. Data gathered with the HAMshould be regarded as qualitative in nature, and are best used in this case as a means to compare aerosol concentrationswithin the plant on a relative basis.

Page 26 Health Hazard Evaluation Report No. 2001-0303-2893
Table 6Microbial analysis of bulk MWF samples
HETA #2001-0303, TRW AutomotiveSamplelocation
Date Predominant fungaltaxa, cfu/mL
Totalbacteria,cfu/mL
Predominant bacterial taxa, cfu/mL Endotoxin,EU/mL
‘Largesystem’centralsump
5/10/01 ng > 3.6 x10⁶
Mycobacterium chelonae,>3.6x10⁶
Alcaligenes faecalis, 220Pseudomonas pseudoalcaligenes,110
1706
6/14/01 ng > 3.6 x10⁶
Mycobacterium chelonae,>3.6x10⁶
3153
8/15/01 ng ng n/a n/a
‘Henrysystem’centralsump
5/10/01 ng 2.4 x 10⁶ Acinetobacter non-hemolyticasacchar, 110 Alcaligenes faecalis, 1210Alcaligenes xylosoxidans, 110 Brevundimonas diminuta, 440 Comamonas testosteroni, 660 Mycobacterium chelonae, 2.4 x10⁶
12500
6/14/01 ng > 3.6 x10⁶
Mycobacterium chelonae,>3.6x10⁶
1859
8/15/01 ng ng n/a n/a
‘Smallsystem’
5/10/01 ng 220 Mycobacterium chelonae, 220 2859
6/14/01 ng > 3.6 x10⁶
Mycobacterium chelonae,>3.6x10⁶
4453
8/15/01 ng ng n/a n/a
‘Mann-Hummel’collected atKirby #2
5/10/01 ng 770 Mycobacterium chelonae, 770 240
6/14/01 ng 2728 Mycobacterium chelonae, 2728 75
8/15/01 ng ng n/a n/a

Health Hazard Evaluation Report No. 2001-0303-2893 Page 27
Table 6 - Continued
Samplelocation
Datecollected
Predominantfungal taxa,
cfu/mL
Totalbacteria,cfu/mL
Predominant bacterial taxa,cfu/mL
Endotoxin,EU/mL
PHN131Anchorbroach
5/10/01 ng 1.1 x 10⁶ Mycobacterium chelonae, 1.1 x10⁶
209
6/14/01 Acremonium sp.2310,
Aureobasidiumpululans 3960,
Fusarium sp. 1650
1.4 x 10⁵ Alcaligenes faecalis, 3.3x10⁴
Comamonas testosteroni, 7.7x10⁴
Gemella morbillorum, 3.3x10⁴
Mycobacterium chelonae, 1.1x10⁴
5593
8/15/01 ng ng n/a n/a
CJ partswasherfluid, washside
6/14/01 Cylindrocarpon sp.440
overloaded
Mycobacterium chelonae, 3036other species represented:Acinetobacter sp., Alcaligenesfaecalis, Comamonas testosteroni,Pseudomonas pseudoalcaligenes
1.05x10⁵
Barnes partswasher,wash side
6/14/01 ng ng n/a 8
‘Add’ waterfrom aHenrysystemmachine
6/14/01 ng ng n/a 3
‘Clean tank’in MWFrecyclingtank farm
8/15/01 ng ng n/a n/a
East verticalbroach
8/15/01 ng grampositive
rods
unable to speciate, 330 n/a
CNC mill,machineshop
8/15/01 Acremoniumstrictum 110sterile fungi 550Tricliothecium sp110 yeasts 110
ng n/a n/a
DR bracketbroach(Detroithorizontalbroach)
8/15/01 ng ng n/a n/a
ng = no growth; n/a - not applicable; EU/mL = ‘endotoxin units per milliliter of fluid’, 10 EU = 1 nanogramendotoxin; Table 7

Page 28 Health Hazard Evaluation Report No. 2001-0303-2893
Personal breathing zone thoracic particulate results from 2nd shiftHETA #2001-0303, TRW Automotive, December 18, 2001
Work location Sample # Sampletime
(min.)
samplevolume (L)
Concentration, mg/m3
%Extractable
Honsberg, operator (op.) A19 571 915 0.27 80
Honsberg op. A4 569 911.5 0.27 80
PHN 131 broach (adapterline), OTS op.
A17 420 673 0.46 81
9-station, PHN 131(adapter line), OTS op.
A21 407 652 0.49 72
KJ/RS wash, P-tech A6 462 740.4 0.27 85
Kirby-knuckle, op. A11 577 923.9 0.28 89
R&B knuckle dial, op. A16 575 920.8 0.27 84
Knuckle press, op. A10 565 905.2 0.23 76.2
Barnes set-up A13 398 638 0.33 91
Barnes P-tech A7 558 893.8 0.36 88
Barnes (Detroit) broach -OTS op.
A1 564 902.6 0.55 82
PL (Barnes) broach A3 551 883 0.69 79
KJ/RS wash A14 540 864.2 0.28 92
PL (Barnes) broach, OTSop.
A18 473 757.4 0.44 100
Barnes wash, P-tech A12 463 741.2 0.36 78
12&6-station/broachrotation, WO2, OTS op.
A9 459 735.7 0.19* trace
Tool & die op. A15 455 728.4 0.18 trace
Kirby DR line, WO7,CNC op.
A5 451 722.2 0.14 trace
Vertical broach OTS op. A8 443 709.1 0.31 96
KJ/RS 12&8-station,CNC op.
A2 437 699.2 0.37 69
NIOSH REL 0.4 mg/m3
* worked on assembly side for 3hrs.
Table 8 Personal breathing zone thoracic particulate results from 3rd shift

Health Hazard Evaluation Report No. 2001-0303-2893 Page 29
HETA #2001-0303, TRW Automotive, December 19, 2001
Sample location Sample#
Sampletime (min.)
Samplevol. (L)
Concentration,mg/m3
%Extractable
Assembly, WO9 A40 479 767.1 0.14 66
Ball joint press & Spindle press A42 438 701.7 0.17 62
Barnes Kirby A36 469 750.5 0.19 86
Barnes wash, WO4 A34 437 700.6 0.36 88
Barnes load / broach rotation A32 436 698.5 0.4 86
Barnes set-up A29 463 741.2 0.35 100
DR broach A41 332 532.7 0.39 71
DR anchor/6-station rotation A43 430 688.4 0.33 83
DR anchor/6-station rotation A27 421 673.8 0.24* 94
Honsberg op. A28 420 673 0.28 74
RS wash A39 451 722.4 0.25 94
RS wash A37 454 726.8 0.26 90
RS 10-station A33 401 642.5 0.22 100
RS 10-station, OTS op. A35 397 635.8 0.2 100
Vert. broach op. A30 432 692 0.22** 93
KJ/RS 12-station A31 433 693.8 0.33 100
WO2, 12&6 station/broach rotation
A45 423 676.8 0.19 100
Kirby op., WO7 A38 413 661.6 0.14 100
Kirby op., WO7 A46 412 659.7 0.23 64
131 wash A44 345 552.9 0.18 100
NIOSH REL 0.4 mg/m3
*worker initially wore pump for ~30 minutes, then set it on shelf near workstation, therefore this sample may notaccurately represent his true exposure**vertical broach not working; worked WO2 12&6 station/broach rotation

Page 30 Health Hazard Evaluation Report No. 2001-0303-2893
Table 9Description of survey participants
HETA 2001-0303, TRW Automotive, June 29, 2001
N # (%)Male
Mean Age(Years), Range
Mean # Years atPlant (years),
Range
# (%) CurrentCigarette Smokers
# (%) EverCigaretteSmokers
# (%) ReportingWorking on
Single Machine
Exposed to MWF 137 113 (82) 45, (20-68) 14, (1-26) 57 (43%) 87 (67%) 30 (22%)
Unexposed toMWF
158 112 (71) 48, (27-63) 14, (1-26) 48 (32%) 90 (63%) 31 (21%)

Health Hazard Evaluation Report No. 2001-0303-2893 Page 31
Table 10Work activities or job tasks reported by workers (N=76)* to be related to symptoms reported in the questionnaire
HETA #2001-0303, TRW Automotive
Exposure Work Activities or Job Tasks
Unexposed (report not using MWF in their usual job)N=29
Nothing specific (14 workers)Exposure to MWF or working in areas where MWF used (8 workers)
Riveting or grinding operatins (4 workers)Steam-cleaning machining equipment (3 workers)
Exposed (report using MWF in their usual job)N=47
Being exposed to MWF (coolant) (19 workers)Working on machines or in areas in which MWF was used (14
workers)Working near parts washers (5 workers)
Nothing specific (5 workers)Other tasks (4 workers)
* Among 270 persons reporting at least one respiratory or systemic symptom in the questionnaire, 76 (28%) reported that the symptom(s) was relatedto a specific work activity or task.

Page 32 Health Hazard Evaluation Report No. 2001-0303-2893
Table 11Reported symptoms/illnesses among employees exposed and unexposed to MWF1
HETA 2001-0303, TRW AutomotiveSymptom/Illness Number of
Exposed (%)reporting
symptom/illness
Number ofUnexposed (%)
reportingsymptom/illness
Prevalence Ratio2
[95% ConfidenceInterval]
Fever or sweats 70 (51) 37 (23) 2.2 [1.6 - 3.0]
Rash, dermatitis, or eczema 60 (44) 32 (20) 2.2 [1.5 - 3.1]
Chills or shivering 47 (34) 33 (21) 1.6 [1.1 - 2.4]
Tightness in chest3 93 (68) 67 (42) 1.6 [1.3 - 2.0]
Wheezing or whistling in chest3 99 (72) 71 (45) 1.6 [1.3 - 2.0]
Unusual shortness of breath3 102 (74) 75 (48) 1.6 [1.3 - 1.9]
Ache all over 81 (59) 73 (46) 1.3 [1.0 - 1.6]
Unusual tiredness or fatigue 109 (80) 100 (63) 1.3 [1.1 - 1.5]
Cough3 124 (91) 117 (74) 1.2 [1.1 - 1.4]
HP 4 7 (5) 1 (0.6) 8.1 [1.0-65]
OA4 7 (5) 4 (3) 2.0 [0.6 - 6.7]
1 Based on the response to the question “Do you work with metalworking fluid in your job?”2 Prevalence ratio for the reporting of the symptom among the MWF-exposed group compared with the
MWF-unexposed group.3 Unadjusted data presented - PR and CI were similar after adjusting for current cigarette use.4 HP, OA - meeting case definition for HP and OA as discussed in Methods.

Health Hazard Evaluation Report No. 2001-0303-2893 Page 33
TABLE 12Reported Symptoms/Illnesses Among Employees Exposed to ‘High’ and ‘Low’ Concentrations of
MWF aerosol1
HETA 2001-0303, TRW AutomotiveSymptom/Illness Number in
“Higher-Exposed”(%) reporting
symptom/illness(N=53)
Number in “Lower-Exposed” (%)
reportingsymptom/illness
(N=21)
Prevalence Ratio2
[95% ConfidenceInterval]
Fever or sweats 27 (51) 6 (29) 1.8 [0.9 - 3.7]
Ache all over 33 (62) 8 (38) 1.6 [0.9 - 2.9]
Chills or shivering 19 (36) 5 (24) 1.5 [0.6 - 3.5]
Unusual tiredness or fatigue 42 (79) 14 (67) 1.2 [0.9 - 1.7]
Wheezing or whistling in chest 39 (74) 13 (62) 1.2 [0.8 - 1.7]
Rash, dermatitis, or eczema 22 (42) 9 (43) 1.0 [0.5 - 1.7]
Tightness in chest 35 (66) 14 (67) 1.0 [0.7 - 1.4]
Unusual shortness of breath 38 (72) 15 (71) 1.0 [0.7 - 1.4]
Cough 50 (94) 20 (95) 1.0 [0.9 - 1.1]
HP3 5 (9) 2 (10) 1.0 [0.2-4.7]
OA3 2 (4) 1 (5) 0.8 [0.1 - 8.3]
1 Participants were grouped based on sampling data presented in Table 1. Those reporting working inDepartments 1, 2, 4, and 6 were placed in the “higher” group and those in Departments 7, 17, and 57(toolroom) were place in the “lower” group.
2 Prevalence ratio for the reporting of the symptom among the “higher-exposed” group compared with the“lower-exposed” group.
3 HP, OA - meeting case definition for HP and OA as discussed in Methods.

Page 34 Health Hazard Evaluation Report No. 2001-0303-2893
Figure 1 – Pellet Stain Results, Bimonthly, May 2001 – August 2002HETA 2001-0303, TRW, Mt. Vernon, Ohio
01
2
34
5
6
78
May-01
Jul-01
Sep-01
Nov-01
Jan-02
Mar-02
May-02
Jul-02
HenryLargeSmallMann
Y –Axis Key0-negative1-very low2-low3-low/moderate4-moderate5-moderate/high6-high7-very high

Health Hazard Evaluation Report No. 2001-0303-2893 Page 35
APPENDIX
In order to learn more about the type of questions that might be useful as components of a screeningquestionnaire for respiratory health concerns among workers exposed to MWF, a comparison was made ofthe sensitivity and specificity of some of the questions. These comparisons were made relative to theendpoint of respiratory illness (either occupational asthma [OA] or hypersensitivity pneumonitis [HP]) asdefined using the case definitions for the November 2001 record review. Twenty workers who met our casedefinitions for OA or HP participated in our screening questionnaire – those 20 questionnaires were used inthis analysis. Sensitivity is defined as the probability of answering a question positively if the illness ispresent; specificity is defined as the probability of answering a question negatively if the illness is not present.Two types of “positive” responses to questions about symptoms were evaluated here. Initially, a “positive”response included responses of “usually” or “sometimes” when the respondent was asked whether thesymptom was present in the year prior to the survey (and was compared to the negative response of “never”).Comparisons were also made with a “positive” response being defined as “usually” experiencing the symptom(compared to the “negative” response of “sometimes” or “never” experiencing the symptom). Additionally,“work-related” symptoms were also evaluated. A “work-related” symptom was defined as a symptomreported to occur “usually” or “sometimes” within the year prior to the survey which the worker felt wasrelated to work and which either improved or may have improved (response of “yes” or “unsure” when askedif symptoms improved) on days off.
The table summarizes the sensitivity and specificity for selected questions and combination of questions.Several of the questions related to specific symptoms using the broader definition of “positive response”(where “positive” was defined as being a report of “usually” or “sometimes” having a symptom in year priorto the survey) were sensitive but not specific. As the most broadly-defined positive responses were modified,either by restricting the positive response to “usually” experiencing the symptom (versus the negativeresponse of “sometimes” or “never”), linking a work-related component, or by combining symptoms, thesensitivity of the questions decreased while specificity increased.
The NIOSH Criteria Document recommends medical monitoring for workers exposed to MWF; a majorobjective of that monitoring is the early identification of workers who develop symptoms of MWF-relatedconditions such as OA or HP. Periodic examinations recommended as part of the medical monitoringprogram should include a brief questionnaire to determine the presence or absence of respiratory symptoms.The data here support the use of the most broadly-defined questions concerning respiratory symptoms in orderthat the questionnaire have the greatest sensitivity in detecting potentially affected workers. Follow-upmedical examinations (possibly including individual history and physical examination and objective testingsuch as spirometry or pulmonary function testing) would then be appropriate in characterizing the nature ofrespiratory symptoms reported among the exposed workers.
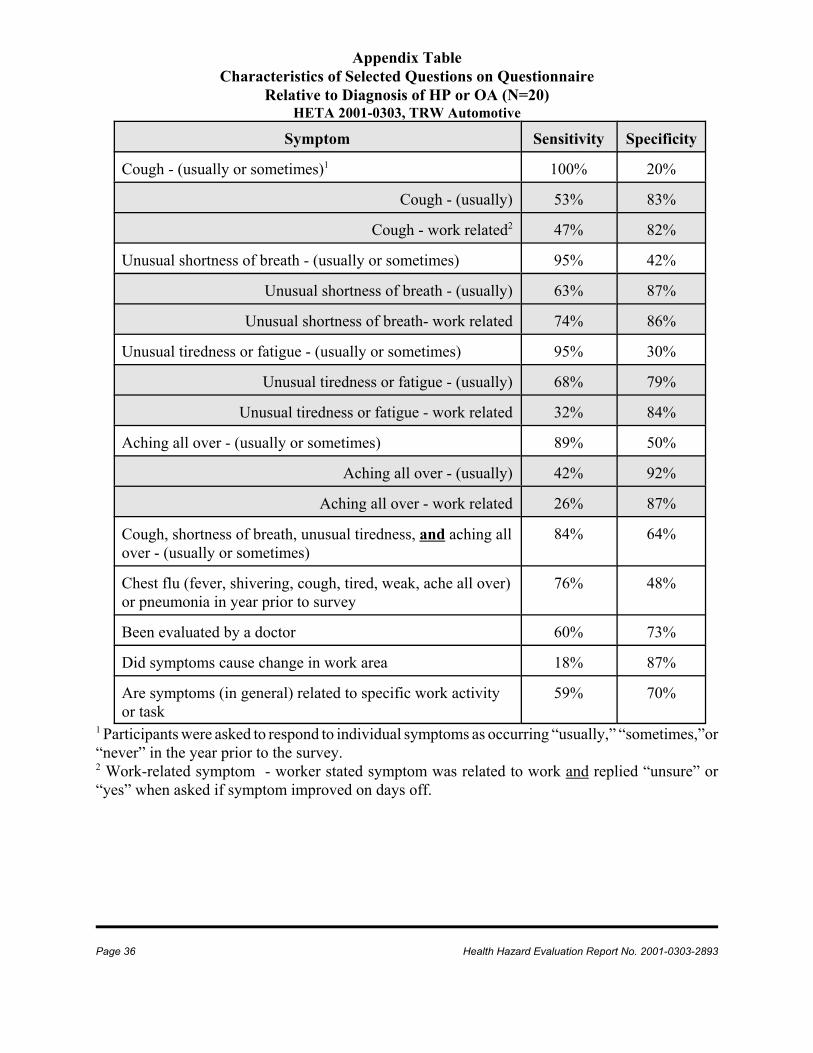
Page 36 Health Hazard Evaluation Report No. 2001-0303-2893
Appendix TableCharacteristics of Selected Questions on Questionnaire
Relative to Diagnosis of HP or OA (N=20)HETA 2001-0303, TRW Automotive
Symptom Sensitivity Specificity
Cough - (usually or sometimes)1 100% 20%
Cough - (usually) 53% 83%
Cough - work related2 47% 82%
Unusual shortness of breath - (usually or sometimes) 95% 42%
Unusual shortness of breath - (usually) 63% 87%
Unusual shortness of breath- work related 74% 86%
Unusual tiredness or fatigue - (usually or sometimes) 95% 30%
Unusual tiredness or fatigue - (usually) 68% 79%
Unusual tiredness or fatigue - work related 32% 84%
Aching all over - (usually or sometimes) 89% 50%
Aching all over - (usually) 42% 92%
Aching all over - work related 26% 87%
Cough, shortness of breath, unusual tiredness, and aching allover - (usually or sometimes)
84% 64%
Chest flu (fever, shivering, cough, tired, weak, ache all over)or pneumonia in year prior to survey
76% 48%
Been evaluated by a doctor 60% 73%
Did symptoms cause change in work area 18% 87%
Are symptoms (in general) related to specific work activityor task
59% 70%
1 Participants were asked to respond to individual symptoms as occurring “usually,” “sometimes,”or“never” in the year prior to the survey.2 Work-related symptom - worker stated symptom was related to work and replied “unsure” or“yes” when asked if symptom improved on days off.

SAFER • HEALTHIER • PEOPLE™ SAFER • HEALTHIER • PEOPLE™
To receive NIOSH documents or informationabout occupational safety and health topics
contact NIOSH at:
1–800–35–NIOSH (356–4674)Fax: 1-513-533-8573
E-mail: [email protected] visit the NIOSH web site at:
www.cdc.gov/niosh
SAFER • HEALTHIER • PEOPLE™ SAFER • HEALTHIER • PEOPLE™
Delivering on the Nation’s promise:Safety and health at work for all people
through research and prevention


![UAW Radio Programming Guide - Uniforms and …uniforms4all.com/RadioProgrammingManual.pdf · [1] UAW Radio Programming Guide Required Items - UAW Brand Radio (UA500, UA501, UA550,](https://img.pdfslide.net/doc/110x75/5ae776bb7f8b9a8b2b8ea3d3/uaw-radio-programming-guide-uniforms-and-1-uaw-radio-programming-guide-required.jpg)