Embed Size (px)
Citation preview

1
NIPTE-FDA Collaborative Case StudyOn Model-based Design Space Development
Across Scales & with Stability Considerations
Design Space Integration

2
Design Space Integration
• Considered– Degradation
• NMT 0.4 mole % lactam– Hardness
• NLT 3 kP– Weight variation
• 90 % - 110%• % RSD NMT 6%
– Dissolution• NLT 40% @ 5 min
– Disintegration• NMT 10 min

3
Shelf Life Design Space
Probability of lactam < 0.4 mole % after 2 years @
22°C
Low Moisture max p=0.7Medium Moisture max p=0.71
0
~
a
obs
o
ERT
obs
o
dLk
dtL L
k Ae
A D

4
Tabletting Design Space
20
30
40
50
60
70
Mea
n D
isso
lutio
n 1
5
Leve
rage
Re
sid
uals
0 50 100 150 200 250
Hydrophobicity
Leverage, P=0.0271
20
30
40
50
60
70
Mea
n D
isso
lutio
n 1
5
Leve
rage
Re
sid
uals
0 5 10 15
Mean Tablet Hardness
Leverage, P<.0001
0
5
10
15
20
25
Ave
rag
e di
sin
tegr
atio
n
time
Lev
era
ge
Res
idu
als
50 100 150 200 250
Hydrophobicity
Leverage, P<.0001
0
5
10
15
20
25
Ave
rag
e di
sin
tegr
atio
n
time
Lev
era
ge
Res
idu
als
0 2 4 6 8 10 12 14 16 18
Mean Tablet Hardness
Leverage, P<.0001
disintegration time =-4.54 + 0.86 * hydrophobicity+ 0.06 * hardness
Hydrophobicity Hardness
% dissolved @5 min =78.1 – 0.1 * hydrophobicity– 3.0 * hardness

5
Tabletting Design Space
Disintegration
Dissolution
Hydrophobicity = -26 + 36 * Blend Time
=># of rotations are limited
50
100
150
200
250
Hyd
rop
hobi
city
Act
ual
50 100 150 200 250
Hydrophobicity Predicted
P<.0001 RSq=0.64 RMSE=37.617

6
Dissolution Data (provided by FDA)
0 5 10 15 20 25 30 35 40 45 500
20
40
60
80
100
120
96251-2 #1
96251-3 #1
96251-4
96251-5
96251-6
96251-7
96251-8
96251-9
96251-10
96251-11
96251-12 #1
96251-13
96251-14
96251-15
Time (h)
% d
isso
lved

7
Dissolution
20
30
40
50
60
70M
ean
Diss
olut
ion
15
0 5 10 15 20 25
Average disintegration time
% dissolved @5 min = 63.3 – 2.4 * disintegration time
Disintegration is often limiting step for highly soluble drugs

8
Single Unit Op

9
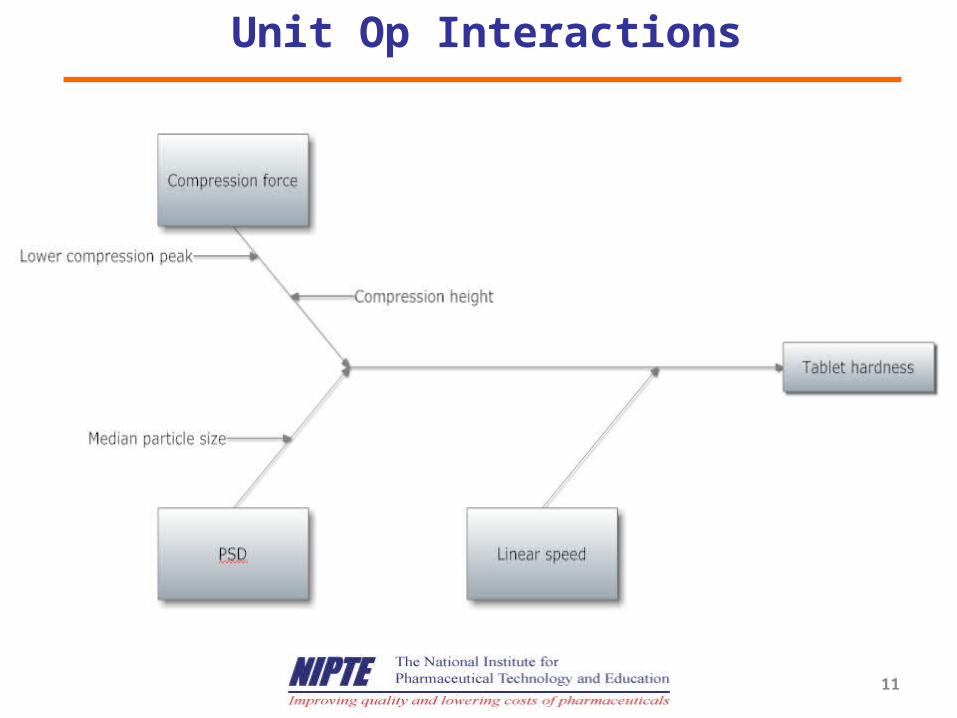
Unit Op Interactions

10
Design SpaceSingle Unit Op
11
Unit Op Interactions
12
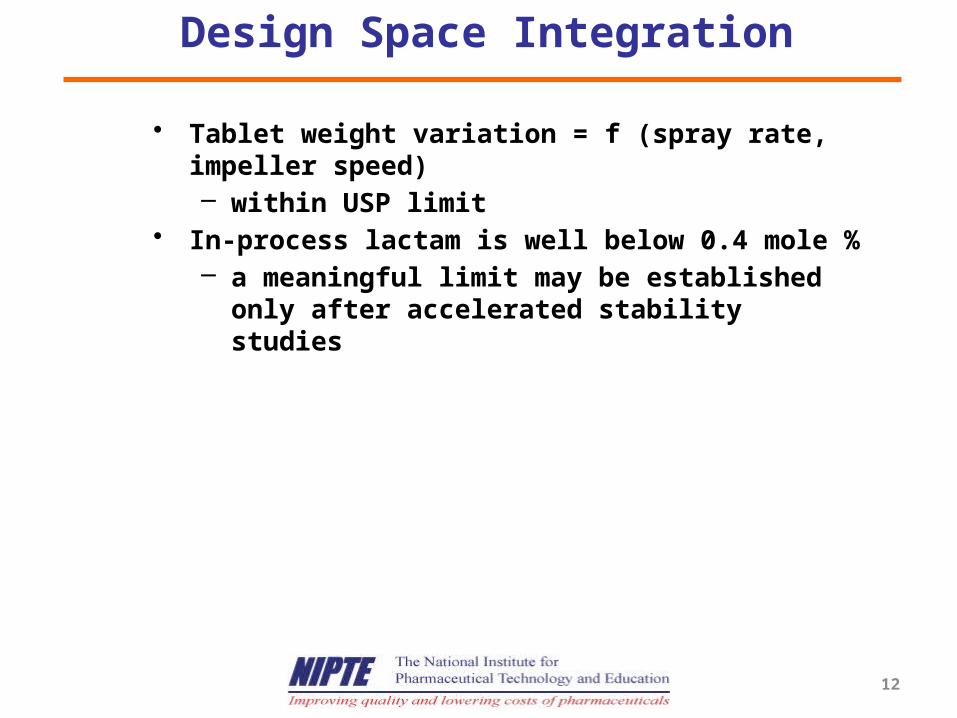
Design Space Integration
• Tablet weight variation = f (spray rate, impeller speed)– within USP limit
• In-process lactam is well below 0.4 mole %– a meaningful limit may be established only after
accelerated stability studies
13
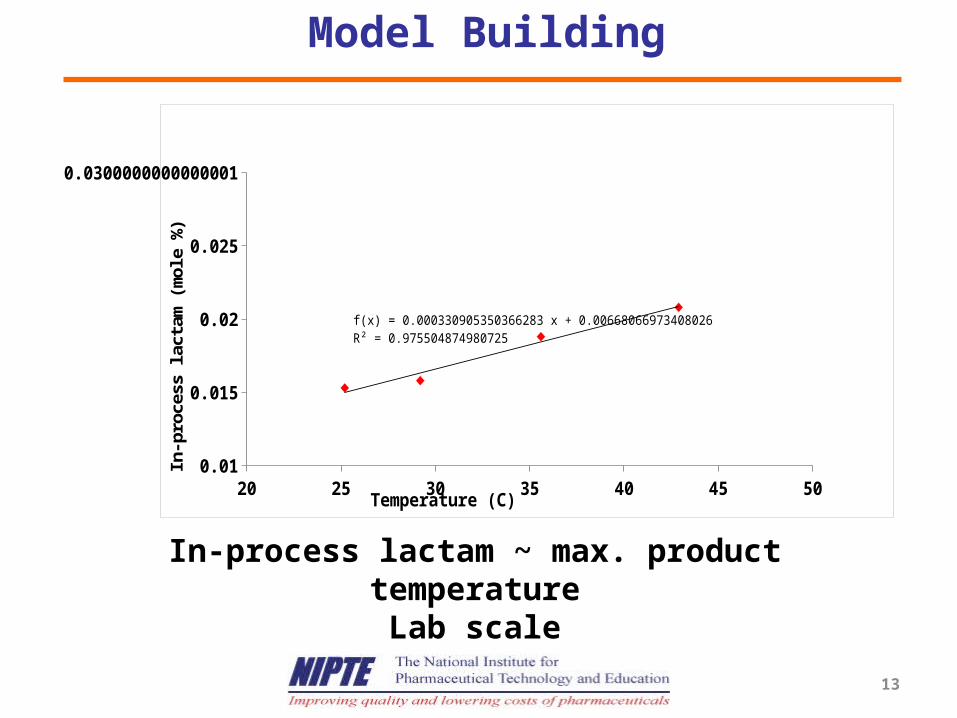
Model Building
20 25 30 35 40 45 500.01
0.015
0.02
0.025
0.0300000000000001
f(x) = 0.000330905350366283 x + 0.00668066973408026R² = 0.975504874980725
Temperature (C)
In-p
roce
ss la
ctam
(mo
le %
)
In-process lactam ~ max. product temperatureLab scale

14
Model Validation (Lab Scale)
0 242.7 485.4 728.1 970.8 1213.5 1456.2 1698.9 1941.6 2184.3 2427
16.4728
24.7093
32.9457
41.1821
49.4185
57.6549
65.8914
74.1278
82.3642
Fluidized bed drying
Time (s)
Tem
pera
ture
(C
)
Inlet air temperature
Inlet air temperature, smoothed
Granule temperature
Predicted granule temperature

15
Model Prediction
EEF EMT0.175 0.50.175 10.45 1
0.45 0.5
No need to run full factorial!!!
Single experiment to calibrate model parametersSecond experiment to verify model predictions

16
Model Prediction (Intermediate Scale)
0 250 500 750 1000 1250 1500 1750 2000 2250 2500
10.1
20.2
30.3
40.4
50.5
60.6
70.7
80.8
90.9
101
Fluidized bed drying
Time (s)
Tem
pera
ture
(C
)
Inlet air temperature
Predicted granule temperature
17
Summary
• Design space for shelf life stability determined• Unit op interactions determined• Design space for each unit op can be determined by
backward propagation• Models help to predict process behavior at larger
scale => save on experimental effort