Embed Size (px)
Citation preview
Nissan LEAF Range Calculation
L. David Roper, http://arts.bev.net/roperldavid/, [email protected] , March 2012
Introduction
This article delineates the equations needed to calculate the range of the 2012 Nissan LEAF. The
ranges for two example drives of the Nissan LEAF from the author’s home in Blacksburg VA
are given and the results agree well with the actual drives.
State-Of-Charge Meter
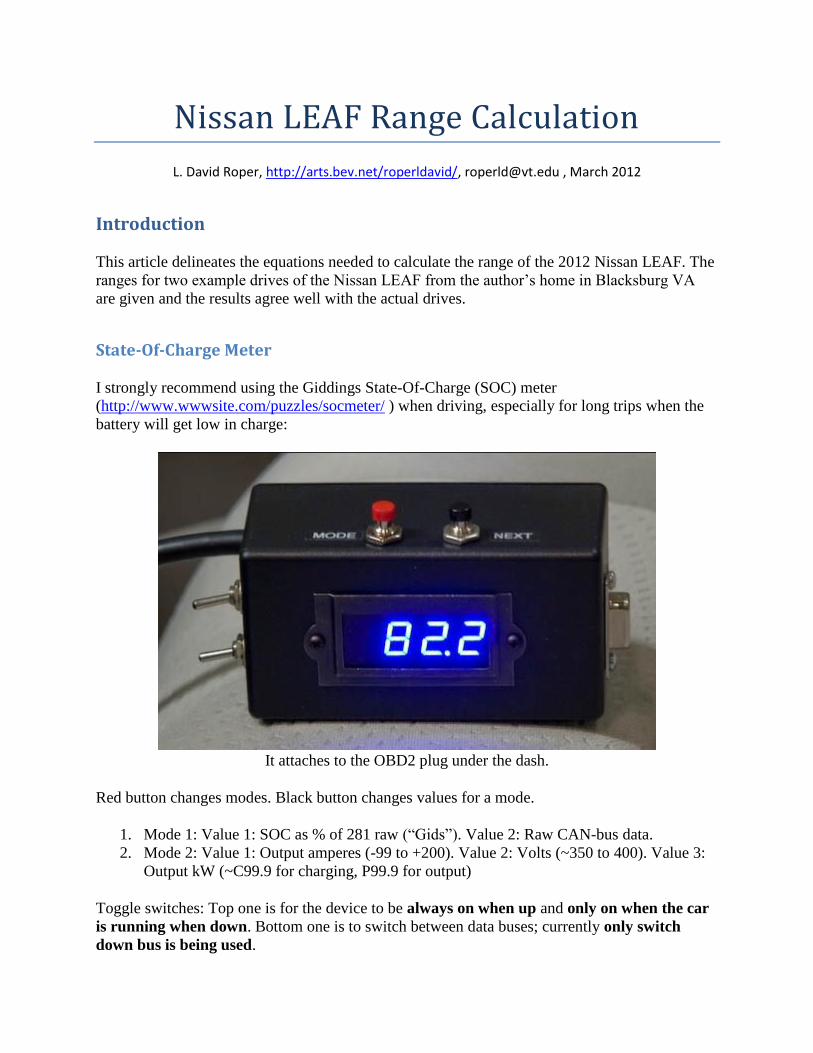
I strongly recommend using the Giddings State-Of-Charge (SOC) meter
(http://www.wwwsite.com/puzzles/socmeter/ ) when driving, especially for long trips when the
battery will get low in charge:
It attaches to the OBD2 plug under the dash.
Red button changes modes. Black button changes values for a mode.
1. Mode 1: Value 1: SOC as % of 281 raw (“Gids”). Value 2: Raw CAN-bus data.
2. Mode 2: Value 1: Output amperes (-99 to +200). Value 2: Volts (~350 to 400). Value 3:
Output kW (~C99.9 for charging, P99.9 for output)
Toggle switches: Top one is for the device to be always on when up and only on when the car
is running when down. Bottom one is to switch between data buses; currently only switch
down bus is being used.
I mount it on the ledge just behind the top of the center console.
I find this device to be a great help when taking long trips on which the battery is near depletion
at the end; it is a more reliable indicator than the “miles to go” LEAF indicator of what speed
should be driven to get to the destination. Combining its reading with the navigation’s “distance
to go” and the LEAF’s “miles to go” help get there without running out of charge. Every LEAF
driver should have it!
Another similar device, LEAFSCAN, is being developed
(http://www.mynissanleaf.com/viewtopic.php?f=37&t=8251 ).
How Low for the Battery Should One Drive?
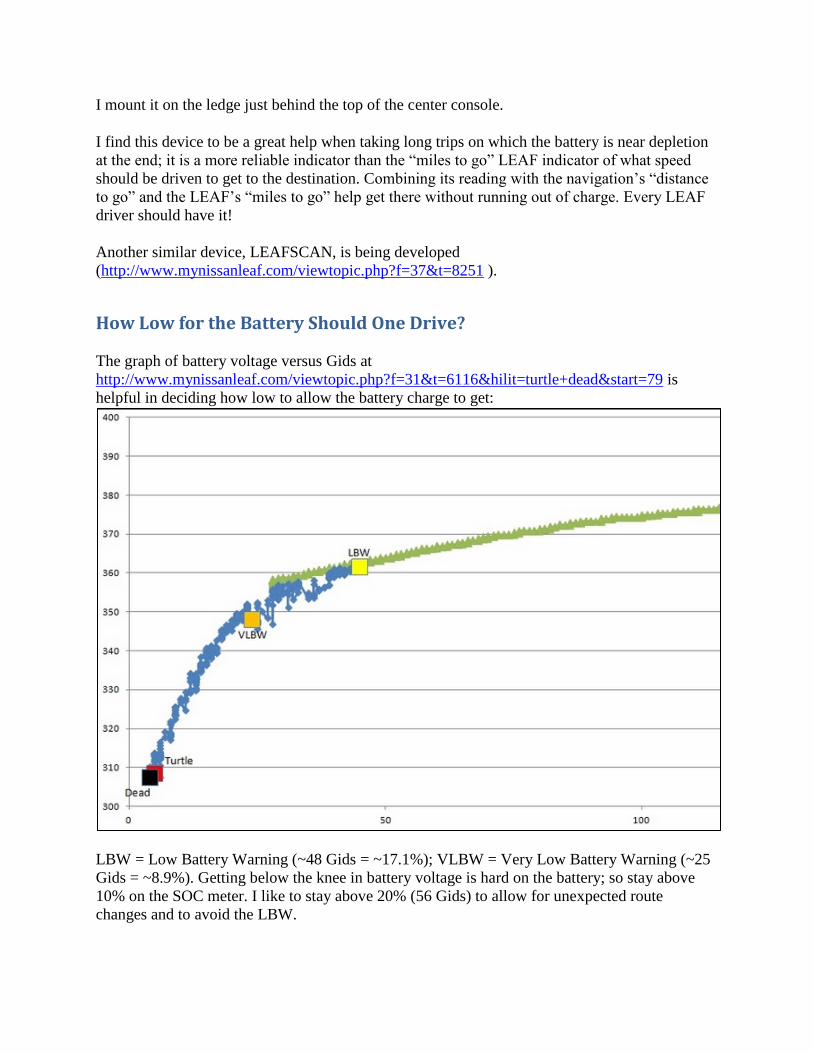
The graph of battery voltage versus Gids at
http://www.mynissanleaf.com/viewtopic.php?f=31&t=6116&hilit=turtle+dead&start=79 is
helpful in deciding how low to allow the battery charge to get:
LBW = Low Battery Warning (~48 Gids = ~17.1%); VLBW = Very Low Battery Warning (~25
Gids = ~8.9%). Getting below the knee in battery voltage is hard on the battery; so stay above
10% on the SOC meter. I like to stay above 20% (56 Gids) to allow for unexpected route
changes and to avoid the LBW.
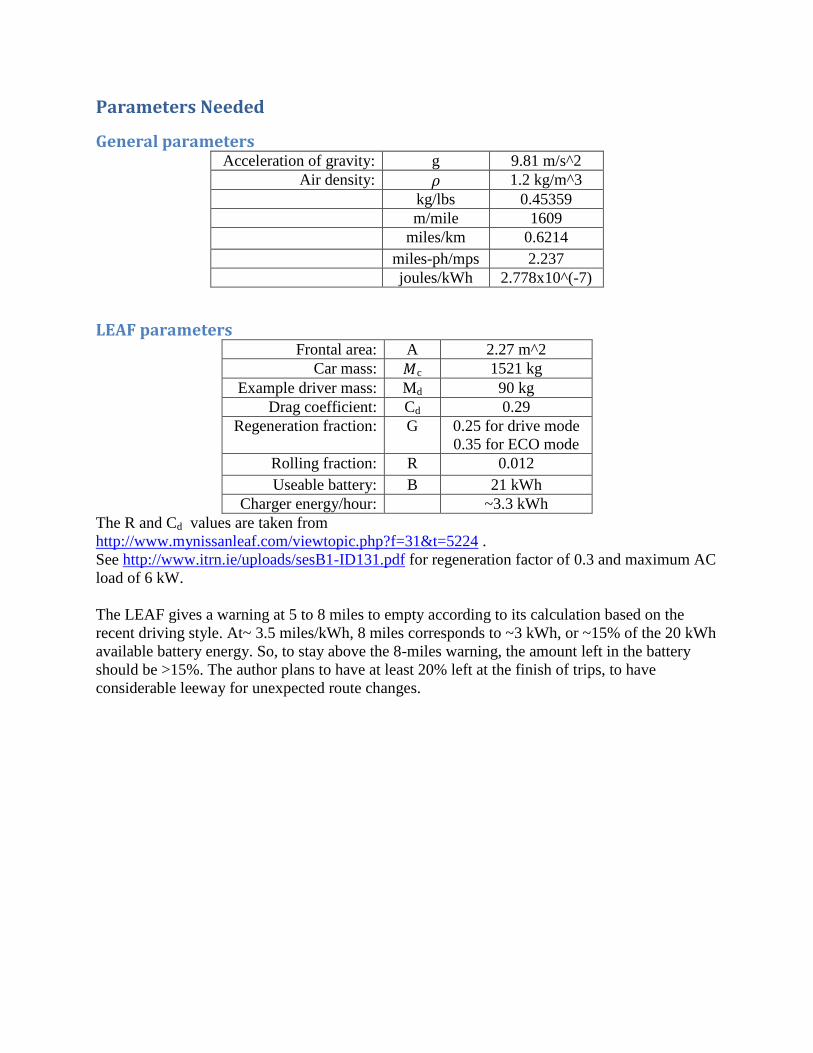
Parameters Needed
General parameters Acceleration of gravity: g 9.81 m/s^2
Air density: 𝜌 1.2 kg/m^3
kg/lbs 0.45359
m/mile 1609
miles/km 0.6214
miles-ph/mps 2.237
joules/kWh 2.778x10^(-7)
LEAF parameters Frontal area: A 2.27 m^2
Car mass: 𝑀c 1521 kg
Example driver mass: Md 90 kg
Drag coefficient: Cd 0.29
Regeneration fraction: G 0.25 for drive mode
0.35 for ECO mode
Rolling fraction: R 0.012
Useable battery: B 21 kWh
Charger energy/hour: ~3.3 kWh
The R and Cd values are taken from
http://www.mynissanleaf.com/viewtopic.php?f=31&t=5224 .
See http://www.itrn.ie/uploads/sesB1-ID131.pdf for regeneration factor of 0.3 and maximum AC
load of 6 kW.
The LEAF gives a warning at 5 to 8 miles to empty according to its calculation based on the
recent driving style. At~ 3.5 miles/kWh, 8 miles corresponds to ~3 kWh, or ~15% of the 20 kWh
available battery energy. So, to stay above the 8-miles warning, the amount left in the battery
should be >15%. The author plans to have at least 20% left at the finish of trips, to have
considerable leeway for unexpected route changes.
Regeneration Factor
According to http://www.wwwsite.com/puzzles/socmeter/ , the Giddings SOC meter shows
either 0-281 or 0%-100% of 21 kWh as a measure of the charge left in the battery. The ratio is
100/281 = 0.35587 .
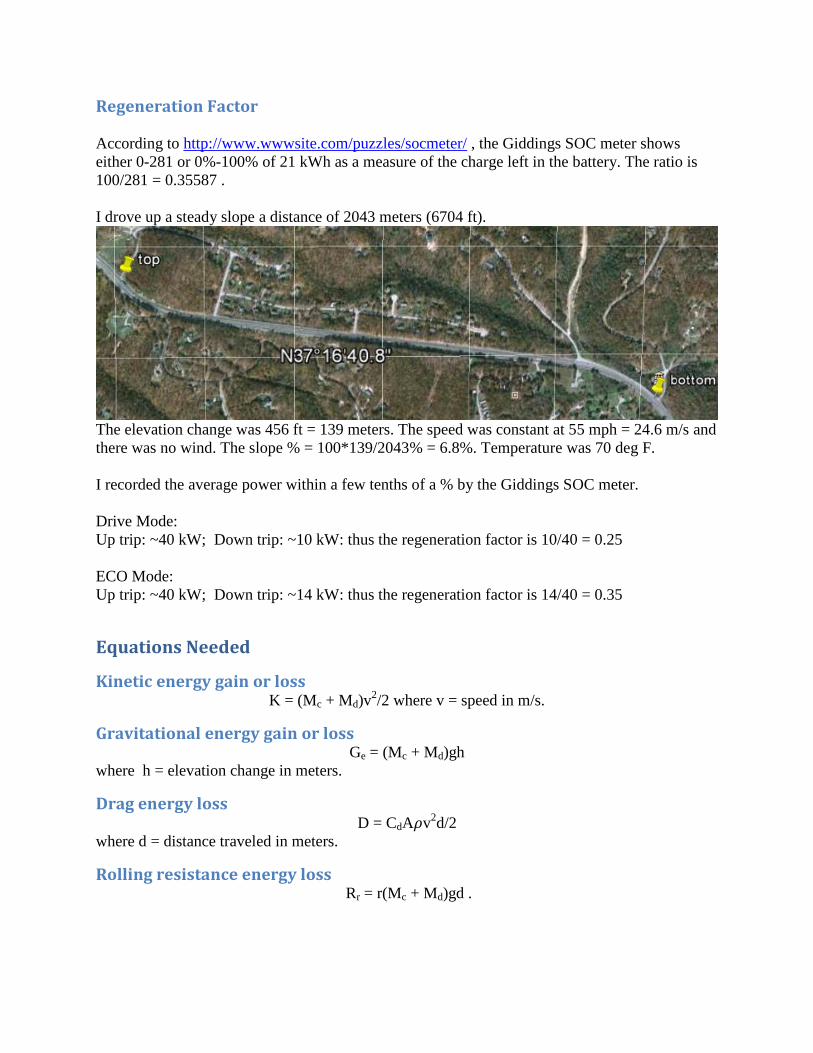
I drove up a steady slope a distance of 2043 meters (6704 ft).
The elevation change was 456 ft = 139 meters. The speed was constant at 55 mph = 24.6 m/s and
there was no wind. The slope % = 100*139/2043% = 6.8%. Temperature was 70 deg F.
I recorded the average power within a few tenths of a % by the Giddings SOC meter.
Drive Mode:
Up trip: ~40 kW; Down trip: ~10 kW: thus the regeneration factor is 10/40 = 0.25
ECO Mode:
Up trip: ~40 kW; Down trip: ~14 kW: thus the regeneration factor is 14/40 = 0.35
Equations Needed
Kinetic energy gain or loss K = (Mc + Md)v
2/2 where v = speed in m/s.
Gravitational energy gain or loss Ge = (Mc + Md)gh
where h = elevation change in meters.
Drag energy loss D = CdA𝜌v
2d/2
where d = distance traveled in meters.
Rolling resistance energy loss Rr = r(Mc + Md)gd .
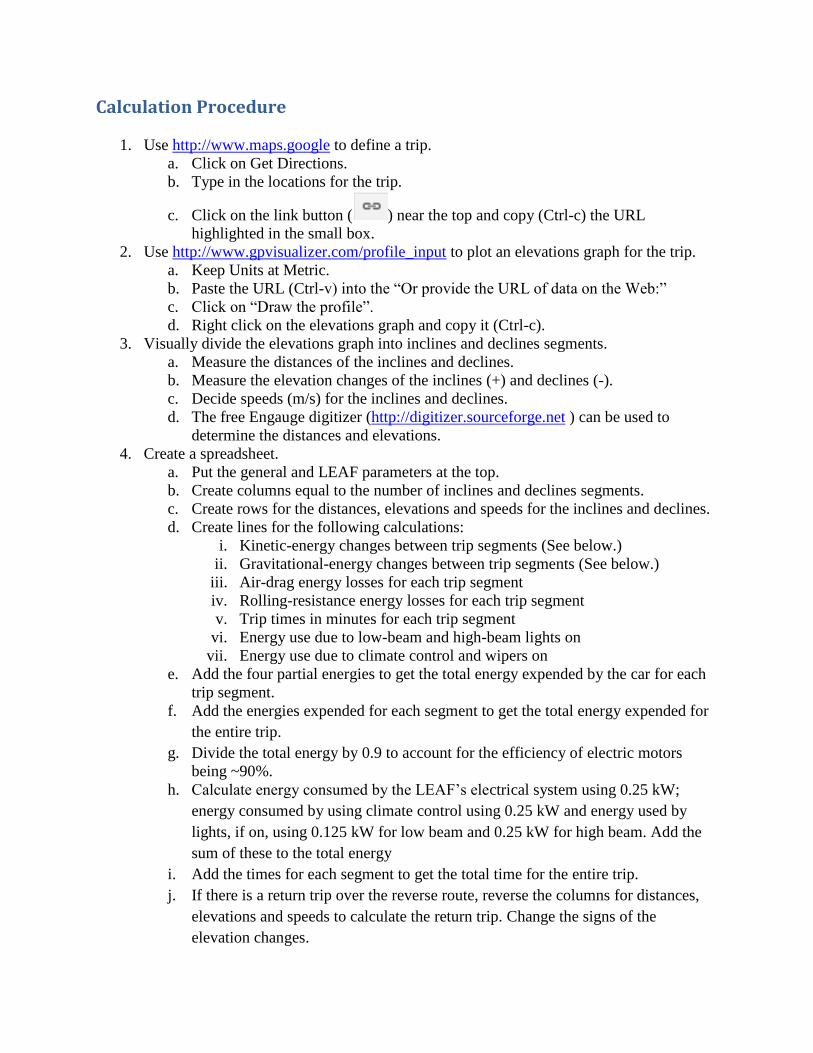
Calculation Procedure
1. Use http://www.maps.google to define a trip.
a. Click on Get Directions.
b. Type in the locations for the trip.
c. Click on the link button ( ) near the top and copy (Ctrl-c) the URL
highlighted in the small box.
2. Use http://www.gpvisualizer.com/profile_input to plot an elevations graph for the trip.
a. Keep Units at Metric.
b. Paste the URL (Ctrl-v) into the “Or provide the URL of data on the Web:”
c. Click on “Draw the profile”.
d. Right click on the elevations graph and copy it (Ctrl-c).
3. Visually divide the elevations graph into inclines and declines segments.
a. Measure the distances of the inclines and declines.
b. Measure the elevation changes of the inclines (+) and declines (-).
c. Decide speeds (m/s) for the inclines and declines.
d. The free Engauge digitizer (http://digitizer.sourceforge.net ) can be used to
determine the distances and elevations.
4. Create a spreadsheet.
a. Put the general and LEAF parameters at the top.
b. Create columns equal to the number of inclines and declines segments.
c. Create rows for the distances, elevations and speeds for the inclines and declines.
d. Create lines for the following calculations:
i. Kinetic-energy changes between trip segments (See below.)
ii. Gravitational-energy changes between trip segments (See below.)
iii. Air-drag energy losses for each trip segment
iv. Rolling-resistance energy losses for each trip segment
v. Trip times in minutes for each trip segment
vi. Energy use due to low-beam and high-beam lights on
vii. Energy use due to climate control and wipers on
e. Add the four partial energies to get the total energy expended by the car for each
trip segment.
f. Add the energies expended for each segment to get the total energy expended for
the entire trip.
g. Divide the total energy by 0.9 to account for the efficiency of electric motors
being ~90%.
h. Calculate energy consumed by the LEAF’s electrical system using 0.25 kW;
energy consumed by using climate control using 0.25 kW and energy used by
lights, if on, using 0.125 kW for low beam and 0.25 kW for high beam. Add the
sum of these to the total energy
i. Add the times for each segment to get the total time for the entire trip.
j. If there is a return trip over the reverse route, reverse the columns for distances,
elevations and speeds to calculate the return trip. Change the signs of the
elevation changes.
k. If there are rapid speed changes (e.g., going around many curves) add ~1 kWh to
the total energy
Kinetic-Energy-Changes Calculation
When the speed changes between two trip segments, there are four different considerations:
At the beginning of the trip, calculate the kinetic energy for the speed of the first trip
segment.
When the speed increases between two trip segments, calculate the difference between
the two kinetic energies.
When the speed decreases between two trip segments, calculate the difference between
the two kinetic energies and multiply it by the regeneration coefficient, G.
When the car stops, use the final speed to calculate the loss in kinetic energy and multiply
it by the regeneration coefficient, G.
Gravitational-Energy-Changes Calculation
When the elevation changes between two trip segments, there are two different considerations:
When the elevation increases between two trip segments, just calculate the difference
between the two gravitational energies.
When the elevation decreases between two trip segments, calculate the difference
between the two gravitational energies and multiply it by the regeneration coefficient, G.
Energy Use Due to Lights
The LEAF energy display shows ~1.25 kW power for low-beam lights and ~2.5 kW power for
high-beam lights. So, one needs to estimate the % of time the lights are on and the high-beams
are on.
Energy Use Due to Climate Control and Wipers
This is harder to estimate. I use 2 kW as an average power when climate control and/or wipers
are used.
Example Calculations
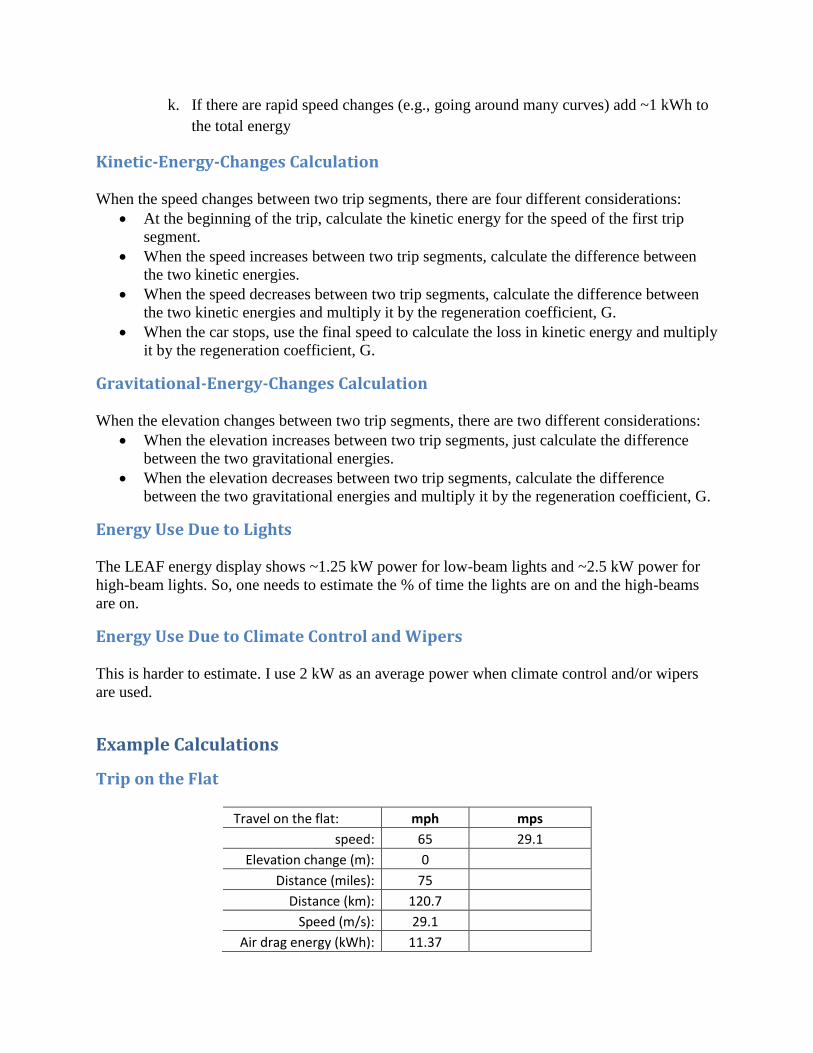
Trip on the Flat
Travel on the flat: mph mps
speed: 65 29.1
Elevation change (m): 0
Distance (miles): 75
Distance (km): 120.7
Speed (m/s): 29.1
Air drag energy (kWh): 11.37
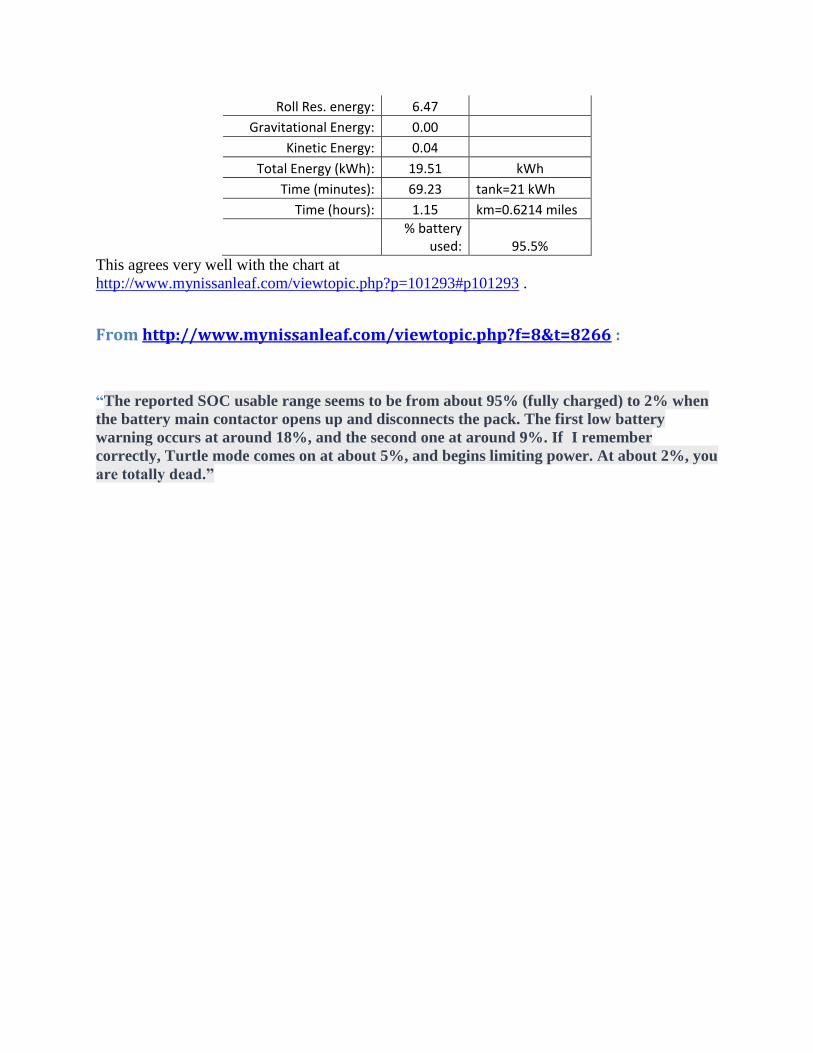
Roll Res. energy: 6.47
Gravitational Energy: 0.00
Kinetic Energy: 0.04
Total Energy (kWh): 19.51 kWh
Time (minutes): 69.23 tank=21 kWh
Time (hours): 1.15 km=0.6214 miles
% battery
used: 95.5%
This agrees very well with the chart at
http://www.mynissanleaf.com/viewtopic.php?p=101293#p101293 .
From http://www.mynissanleaf.com/viewtopic.php?f=8&t=8266 :
“The reported SOC usable range seems to be from about 95% (fully charged) to 2% when
the battery main contactor opens up and disconnects the pack. The first low battery
warning occurs at around 18%, and the second one at around 9%. If I remember
correctly, Turtle mode comes on at about 5%, and begins limiting power. At about 2%, you
are totally dead.”
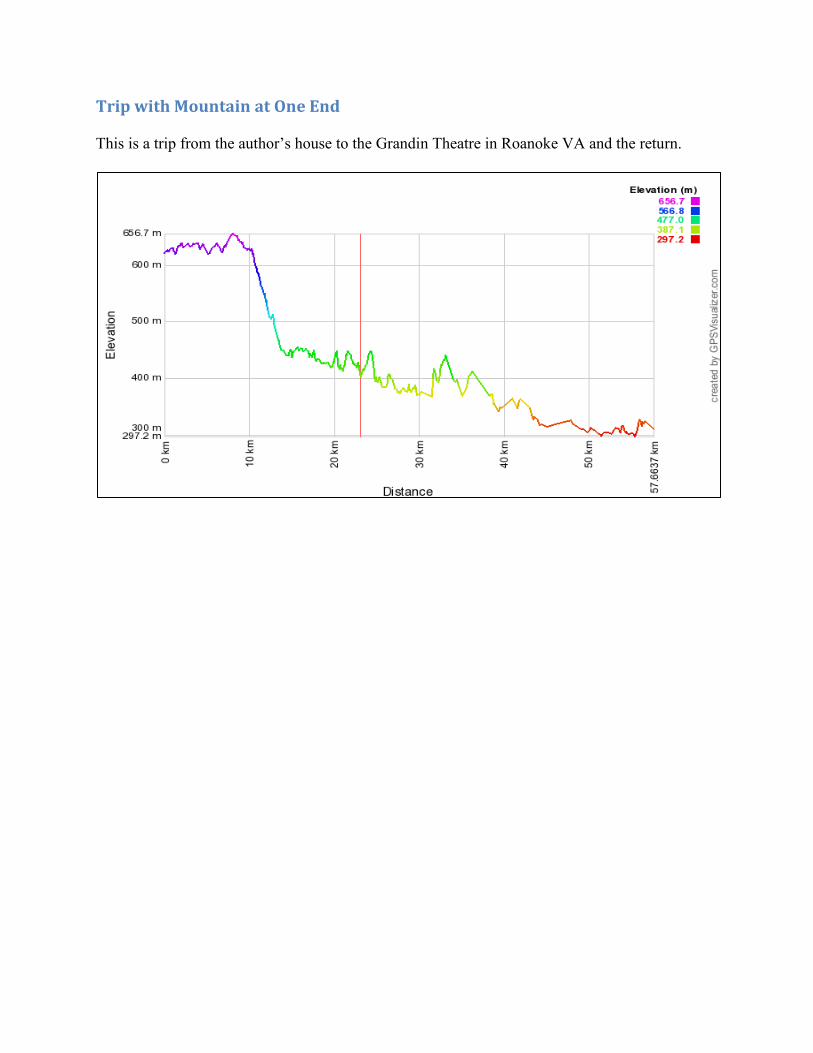
Trip with Mountain at One End
This is a trip from the author’s house to the Grandin Theatre in Roanoke VA and the return.
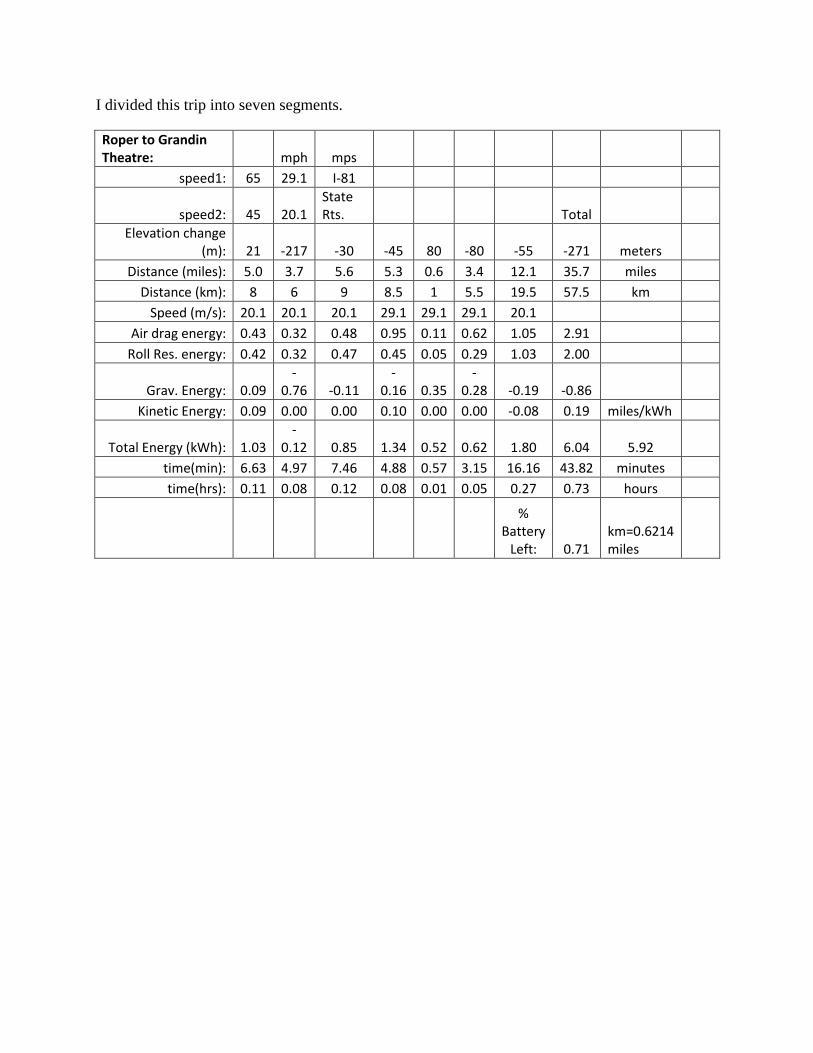
I divided this trip into seven segments.
Roper to Grandin Theatre: mph mps
speed1: 65 29.1 I-81
speed2: 45 20.1 State Rts. Total
Elevation change (m): 21 -217 -30 -45 80 -80 -55 -271 meters
Distance (miles): 5.0 3.7 5.6 5.3 0.6 3.4 12.1 35.7 miles
Distance (km): 8 6 9 8.5 1 5.5 19.5 57.5 km
Speed (m/s): 20.1 20.1 20.1 29.1 29.1 29.1 20.1
Air drag energy: 0.43 0.32 0.48 0.95 0.11 0.62 1.05 2.91
Roll Res. energy: 0.42 0.32 0.47 0.45 0.05 0.29 1.03 2.00
Grav. Energy: 0.09 -
0.76 -0.11 -
0.16 0.35 -
0.28 -0.19 -0.86
Kinetic Energy: 0.09 0.00 0.00 0.10 0.00 0.00 -0.08 0.19 miles/kWh
Total Energy (kWh): 1.03 -
0.12 0.85 1.34 0.52 0.62 1.80 6.04 5.92
time(min): 6.63 4.97 7.46 4.88 0.57 3.15 16.16 43.82 minutes
time(hrs): 0.11 0.08 0.12 0.08 0.01 0.05 0.27 0.73 hours
% Battery
Left: 0.71 km=0.6214 miles
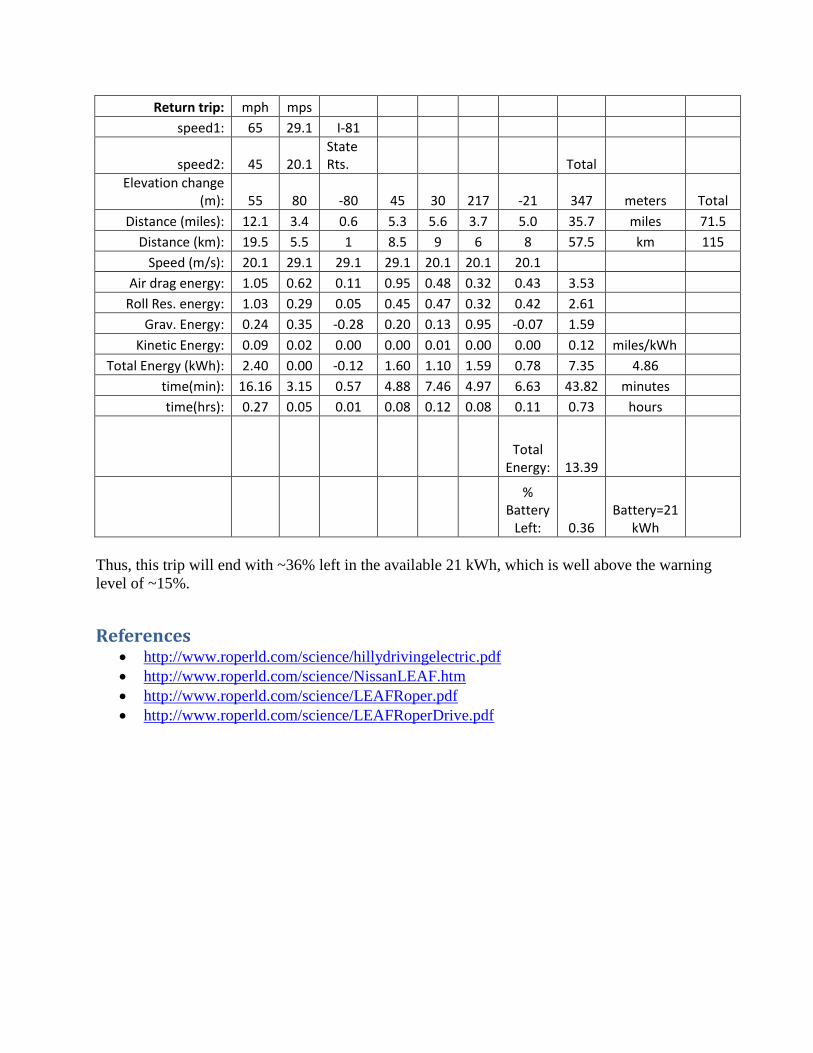
Return trip: mph mps
speed1: 65 29.1 I-81
speed2: 45 20.1 State Rts. Total
Elevation change (m): 55 80 -80 45 30 217 -21 347 meters Total
Distance (miles): 12.1 3.4 0.6 5.3 5.6 3.7 5.0 35.7 miles 71.5
Distance (km): 19.5 5.5 1 8.5 9 6 8 57.5 km 115
Speed (m/s): 20.1 29.1 29.1 29.1 20.1 20.1 20.1
Air drag energy: 1.05 0.62 0.11 0.95 0.48 0.32 0.43 3.53
Roll Res. energy: 1.03 0.29 0.05 0.45 0.47 0.32 0.42 2.61
Grav. Energy: 0.24 0.35 -0.28 0.20 0.13 0.95 -0.07 1.59
Kinetic Energy: 0.09 0.02 0.00 0.00 0.01 0.00 0.00 0.12 miles/kWh
Total Energy (kWh): 2.40 0.00 -0.12 1.60 1.10 1.59 0.78 7.35 4.86
time(min): 16.16 3.15 0.57 4.88 7.46 4.97 6.63 43.82 minutes
time(hrs): 0.27 0.05 0.01 0.08 0.12 0.08 0.11 0.73 hours
Total
Energy: 13.39
% Battery
Left: 0.36 Battery=21
kWh
Thus, this trip will end with ~36% left in the available 21 kWh, which is well above the warning
level of ~15%.
References http://www.roperld.com/science/hillydrivingelectric.pdf
http://www.roperld.com/science/NissanLEAF.htm
http://www.roperld.com/science/LEAFRoper.pdf
http://www.roperld.com/science/LEAFRoperDrive.pdf