Embed Size (px)
Citation preview

NITCO LImITedAnnuAlr e p o rt 2012-13
Corporate InformationBoard of DirectorsMr. Vivek Talwar, Managing Director
Mr. Pradeep Saxena, Director
Mr. Vishal Malik, Director
Mr. Rohan Talwar, Director
Registered office
Nitco House
Recondo Compound
SK Ahire Marg, Worli
Mumbai 400 030
Tel: 91 22 66164555
Fax : 91 22 66164657
Works Ceramic tile division
Village Shrigaon, Taluka Alibaug,
Post Poynad,
District Raigad, Maharashtra
Marble division (Mumbai)
Nitco Marble Land,
Plot no. 3, Kanjur village Road
Kanjur Marg (East),
Mumbai 400 078, Maharashtra
Marble division (Silvassa)
Survey No. 176, Village Silli,
Silvassa 330 396
Corporate OfficeNitco Marble Land,
Plot no. 3, Kanjur village Road
Kanjur Marg (East),
Mumbai 400 078, Maharashtra
Tel: 91 22 67521555
Fax : 91 22 67521500
Chief Executive OfficerMr. Ashok Goyal
Chief Finance OfficerMr. B.G. Borkar
Company Secretary and Compliance OfficerMrs. Reena Raje
AuditorsA. Husein Noumanali & Co.,
Chartered Accountant
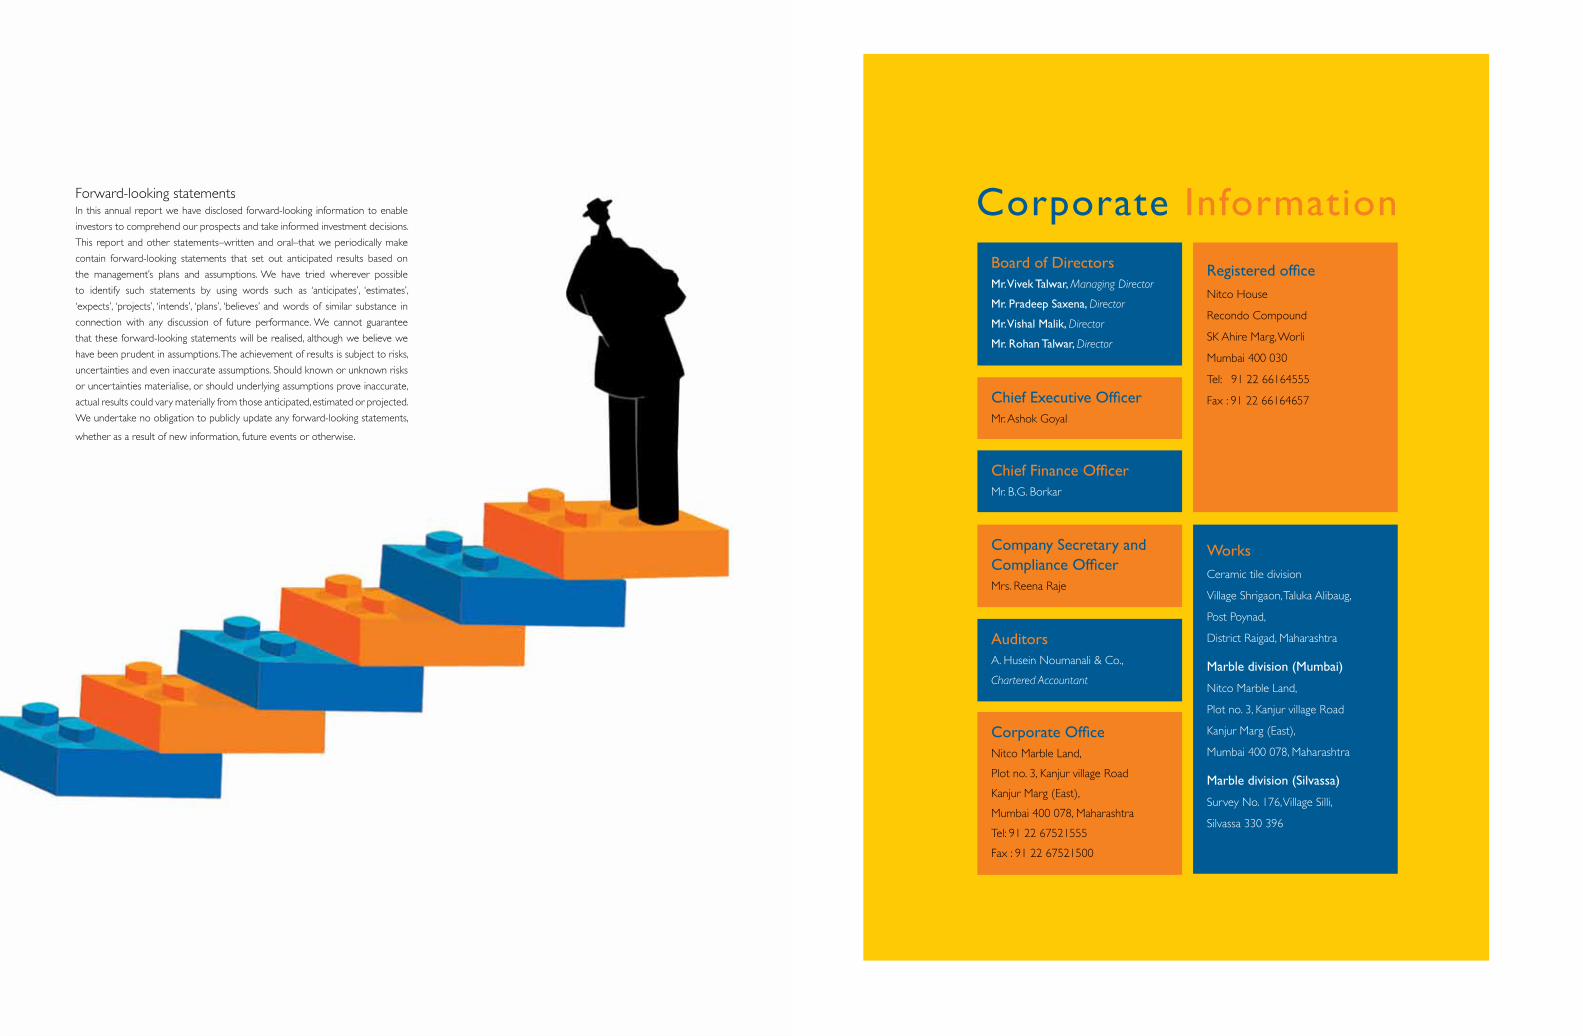
Forward-looking statements In this annual report we have disclosed forward-looking information to enable
investors to comprehend our prospects and take informed investment decisions.
This report and other statements–written and oral–that we periodically make
contain forward-looking statements that set out anticipated results based on
the management’s plans and assumptions. We have tried wherever possible
to identify such statements by using words such as ‘anticipates’, ‘estimates’,
‘expects’, ‘projects’, ‘intends’, ‘plans’, ‘believes’ and words of similar substance in
connection with any discussion of future performance. We cannot guarantee
that these forward-looking statements will be realised, although we believe we
have been prudent in assumptions. The achievement of results is subject to risks,
uncertainties and even inaccurate assumptions. Should known or unknown risks
or uncertainties materialise, or should underlying assumptions prove inaccurate,
actual results could vary materially from those anticipated, estimated or projected.
We undertake no obligation to publicly update any forward-looking statements,
whether as a result of new information, future events or otherwise.
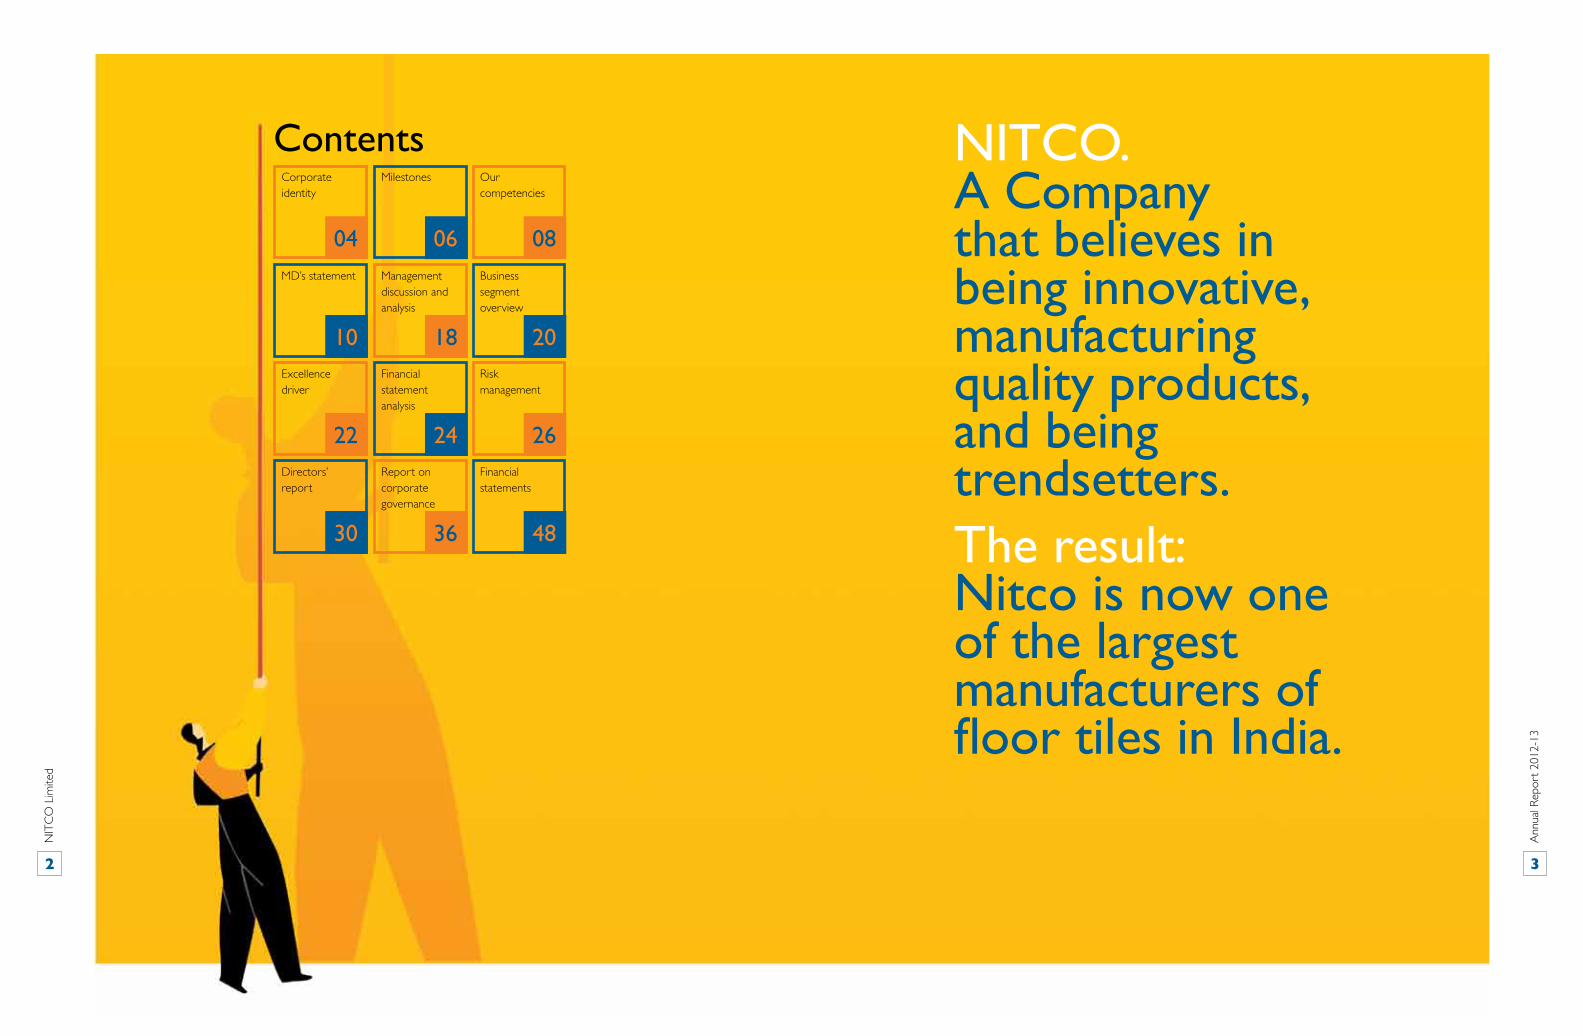
nItCo. A Company that believes in being innovative, manufacturing quality products, and being trendsetters.the result: nitco is now one of the largest manufacturers of floor tiles in India.
ContentsCorporate identity
04
Our competencies
08
Milestones
06MD’s statement
10Risk management
26Report on corporate governance
36
Directors’ report
30
Financial statements
48
Business segment overview
20Financial statement analysis
24
Management discussion and analysis
18Excellence driver
22
NIT
CO
Lim
ited
2
Ann
ual R
epor
t 20
12-1
3
3

At nItCo, we are taking our business ahead through joint ventures and contract production arrangements, with the potential to translate into higher margins, profits and shareholder value.
What we are? NITCO (established in 1966 by Mr.
Pran Nath Talwar) is among the top
premium tile companies in India.
The Company manufactures a vast
portfolio of tiles(floor and wall), marble,
mosaic or metal craft.
Where we are? The Company is headquartered in
Mumbai, India.
Its pan-India presence is facilitated
through 22 offices.
Its strong distribution network
comprises more than 1100 direct dealers.
The Company exports tiles to
countries like Belgium, The Netherlands,
Muscat, Saudi Arabia, Bahrain, Qatar, Oman
and other European and African countries.
The Company’s shares are listed on the
BSE and NSE.
The promoters own 48.90% of the
Company’s equity.
Pioneering presenceThe Company has carved out a
distinctive reputation through the
manufacture of pioneering and
innovative products comprising the
following:
Environment-friendly, LEED certified
tiles.
Rustic tiles utilising a unique ‘dry
powder application’ technology which
enhances a natural ‘stone’ feel; undulated
surfaces can be embellished using special
glazes to replicate a natural stone finish.
Super gloss floor tiles with enhanced
aesthetic finish similar to natural stone.
600x600 mm glazed vitrified tiles of
which the Company is among the largest
manufacturers in India.
100% matte finish tiles in satin and
rustic finish with anti-skid properties
addressing medium and heavy footfall
traffic.
Dirt-free tiles leveraging unique
sharp-edge technology; tiles are cut to
a perfect square with minimal joints; the
micro-porosity keeps tiles dirt-free and
impervious to bacterial decay.
Rectangular wood strips, which
reconcile the texture and colours
of natural wood with the durability
of superior quality porcelain; easy to
maintain.
Products Portfolio
Floor tiles Ceramic tiles, vitrified tiles, polished glazed vitrified tiles, naturoc
gres tiles and duracottura tiles.
Wall tiles HD digital tiles and mosaic highlighters
Marble Natural marble and engineered marble
Mosaic Signature collection, magnum opus collection, décor collection,
solitaire collection, naturale collection, crust collection, frame
collection, steps, risers and skirting
Our product portfolio
VisionTo continuously improve the
quality and design of products and
constantly increase customer focus
is our prime vision.
Mission To launch innovative and world-class products to help customers realise their
dreams.
To manufacture products of the highest quality, creating industry benchmarks.
To be fast and flexible to be able to grasp opportunities in a fast-changing world.
To be transparent and fair to customers, shareholders, suppliers and employees in
all our dealings.
NIT
CO
Lim
ited
Ann
ual R
epor
t 20
12-1
3
4 5
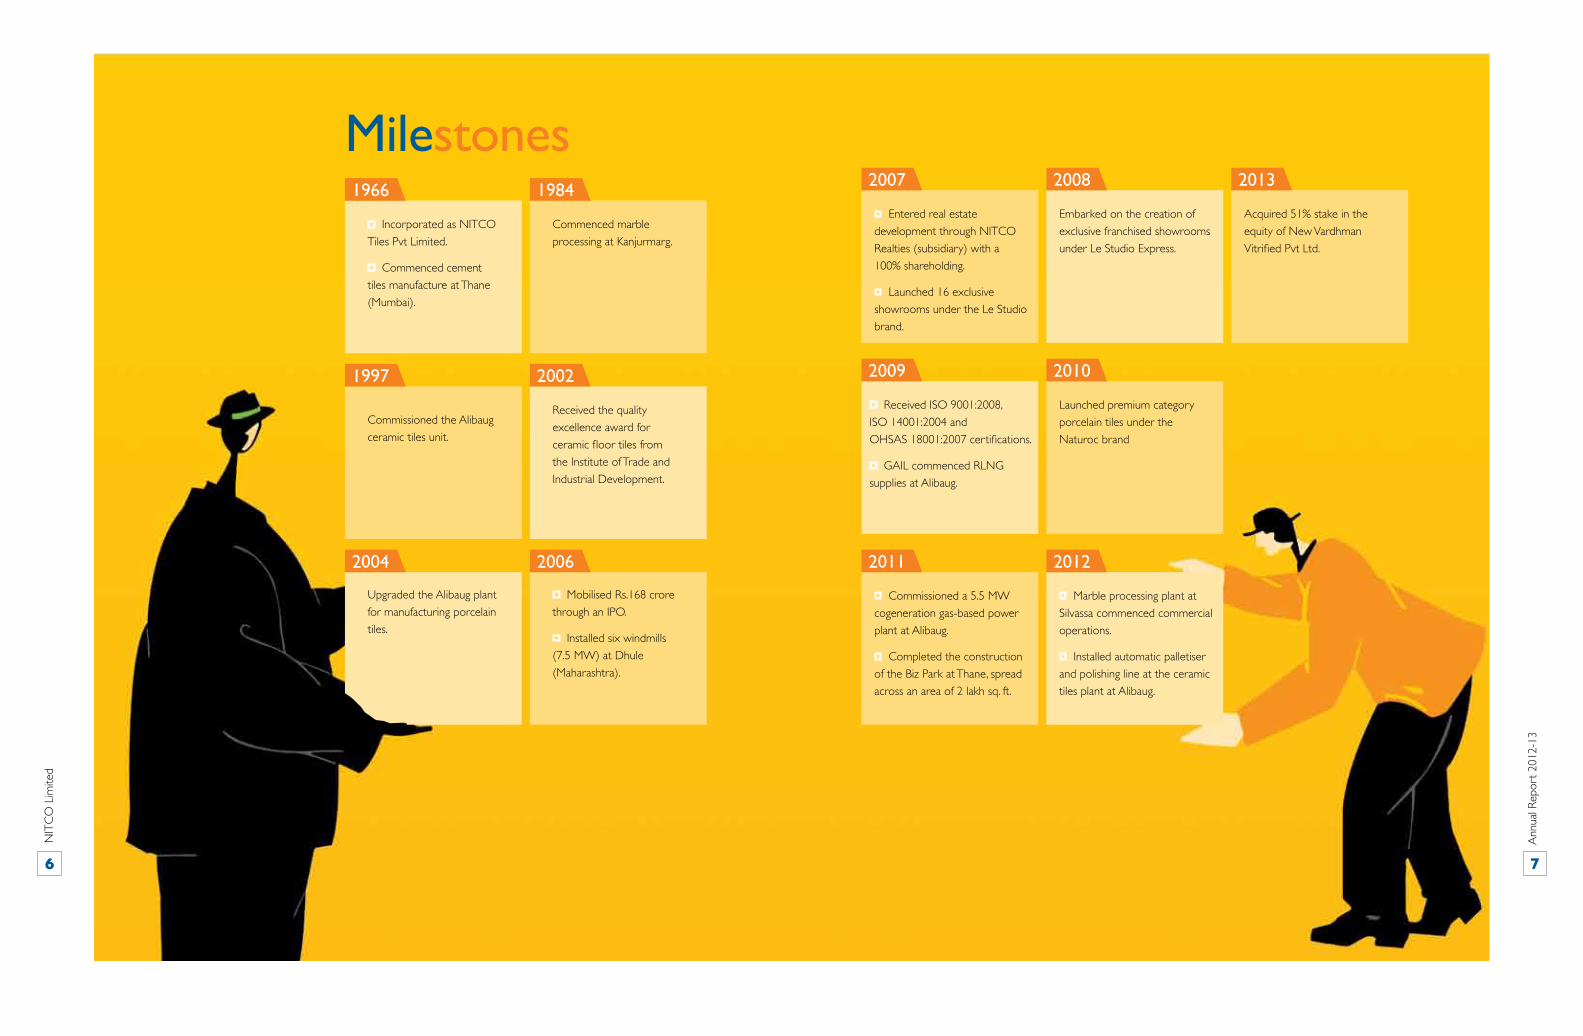
Milestones Incorporated as NITCO
Tiles Pvt Limited.
Commenced cement
tiles manufacture at Thane
(Mumbai).
1966
Commenced marble
processing at Kanjurmarg.
1984
Upgraded the Alibaug plant
for manufacturing porcelain
tiles.
2004
Mobilised Rs.168 crore
through an IPO.
Installed six windmills
(7.5 MW) at Dhule
(Maharashtra).
2006
Commissioned the Alibaug
ceramic tiles unit.
1997
Received the quality
excellence award for
ceramic floor tiles from
the Institute of Trade and
Industrial Development.
2002
Entered real estate
development through NITCO
Realties (subsidiary) with a
100% shareholding.
Launched 16 exclusive
showrooms under the Le Studio
brand.
2007
Embarked on the creation of
exclusive franchised showrooms
under Le Studio Express.
2008
Commissioned a 5.5 MW
cogeneration gas-based power
plant at Alibaug.
Completed the construction
of the Biz Park at Thane, spread
across an area of 2 lakh sq. ft.
2011
Marble processing plant at
Silvassa commenced commercial
operations.
Installed automatic palletiser
and polishing line at the ceramic
tiles plant at Alibaug.
2012
Received ISO 9001:2008,
ISO 14001:2004 and
OHSAS 18001:2007 certifications.
GAIL commenced RLNG
supplies at Alibaug.
2009
Launched premium category
porcelain tiles under the
Naturoc brand
2010
Acquired 51% stake in the
equity of New Vardhman
Vitrified Pvt Ltd.
2013
NIT
CO
Lim
ited
Ann
ual R
epor
t 20
12-1
3
6 7
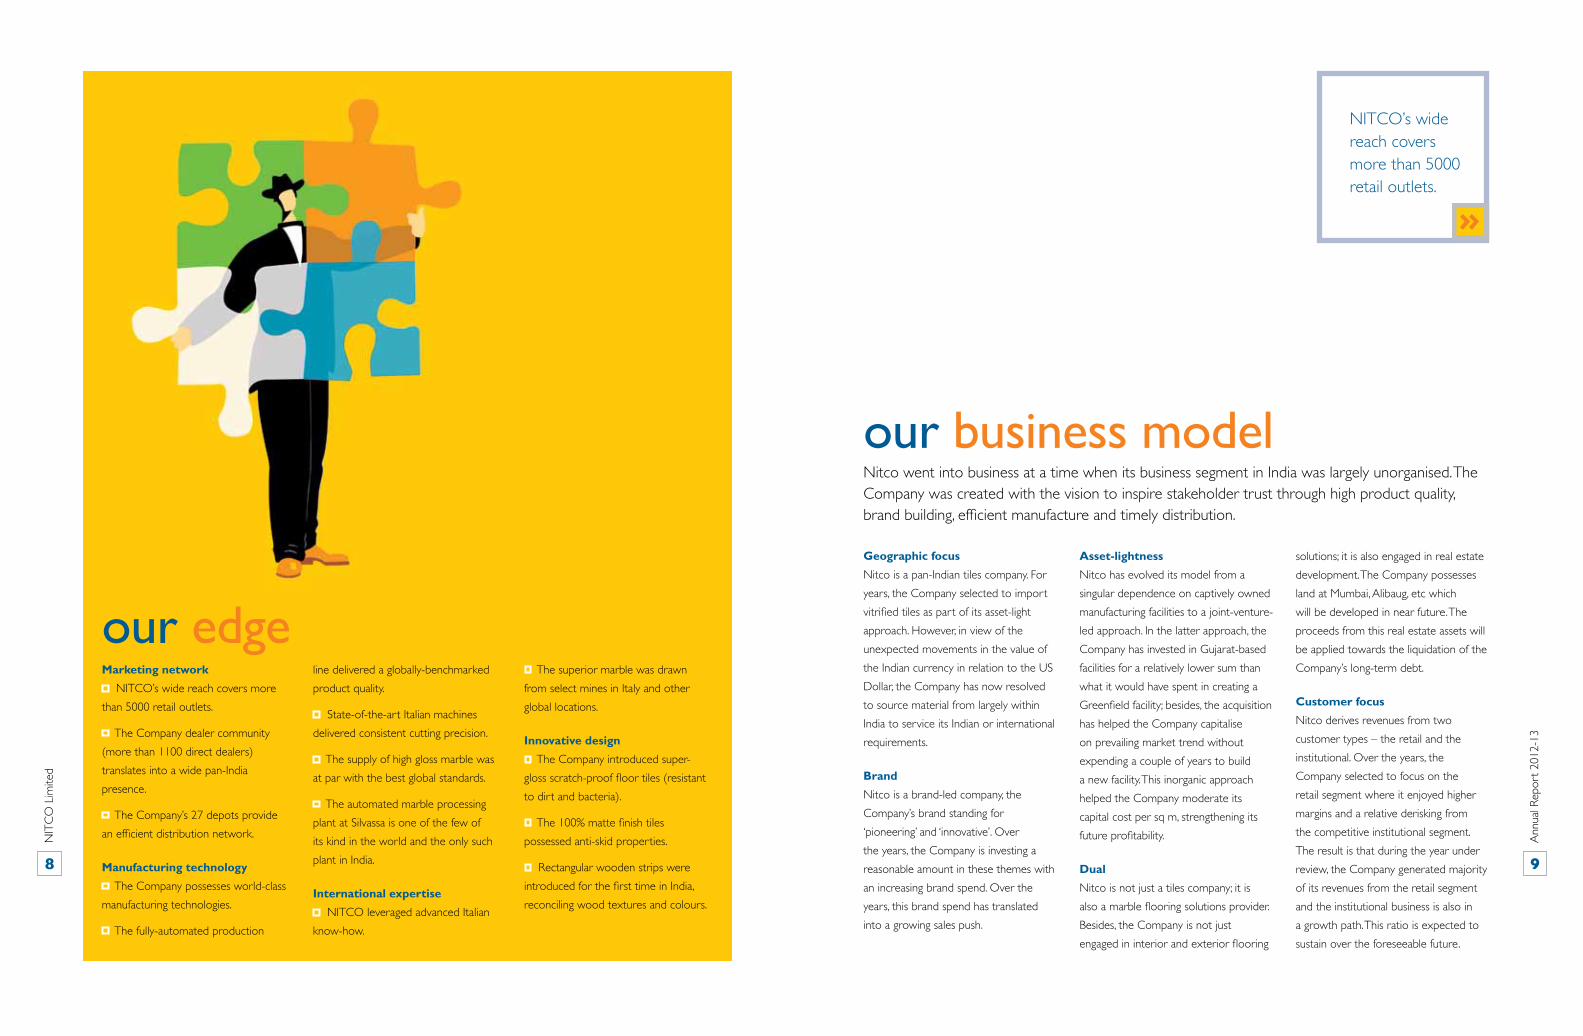
our business model
Geographic focus Nitco is a pan-Indian tiles company. For
years, the Company selected to import
vitrified tiles as part of its asset-light
approach. However, in view of the
unexpected movements in the value of
the Indian currency in relation to the US
Dollar, the Company has now resolved
to source material from largely within
India to service its Indian or international
requirements.
BrandNitco is a brand-led company, the
Company’s brand standing for
‘pioneering’ and ‘innovative’. Over
the years, the Company is investing a
reasonable amount in these themes with
an increasing brand spend. Over the
years, this brand spend has translated
into a growing sales push.
Asset-lightness Nitco has evolved its model from a
singular dependence on captively owned
manufacturing facilities to a joint-venture-
led approach. In the latter approach, the
Company has invested in Gujarat-based
facilities for a relatively lower sum than
what it would have spent in creating a
Greenfield facility; besides, the acquisition
has helped the Company capitalise
on prevailing market trend without
expending a couple of years to build
a new facility. This inorganic approach
helped the Company moderate its
capital cost per sq m, strengthening its
future profitability.
dual Nitco is not just a tiles company; it is
also a marble flooring solutions provider.
Besides, the Company is not just
engaged in interior and exterior flooring
solutions; it is also engaged in real estate
development. The Company possesses
land at Mumbai, Alibaug, etc which
will be developed in near future. The
proceeds from this real estate assets will
be applied towards the liquidation of the
Company’s long-term debt.
Customer focus Nitco derives revenues from two
customer types – the retail and the
institutional. Over the years, the
Company selected to focus on the
retail segment where it enjoyed higher
margins and a relative derisking from
the competitive institutional segment.
The result is that during the year under
review, the Company generated majority
of its revenues from the retail segment
and the institutional business is also in
a growth path. This ratio is expected to
sustain over the foreseeable future.
Nitco went into business at a time when its business segment in India was largely unorganised. The Company was created with the vision to inspire stakeholder trust through high product quality, brand building, efficient manufacture and timely distribution.
our edgemarketing network
NITCO’s wide reach covers more
than 5000 retail outlets.
The Company dealer community
(more than 1100 direct dealers)
translates into a wide pan-India
presence.
The Company’s 27 depots provide
an efficient distribution network.
manufacturing technology The Company possesses world-class
manufacturing technologies.
The fully-automated production
line delivered a globally-benchmarked
product quality.
State-of-the-art Italian machines
delivered consistent cutting precision.
The supply of high gloss marble was
at par with the best global standards.
The automated marble processing
plant at Silvassa is one of the few of
its kind in the world and the only such
plant in India.
International expertise NITCO leveraged advanced Italian
know-how.
The superior marble was drawn
from select mines in Italy and other
global locations.
Innovative design The Company introduced super-
gloss scratch-proof floor tiles (resistant
to dirt and bacteria).
The 100% matte finish tiles
possessed anti-skid properties.
Rectangular wooden strips were
introduced for the first time in India,
reconciling wood textures and colours.
NITCO’s wide reach covers more than 5000 retail outlets.
NIT
CO
Lim
ited
Ann
ual R
epor
t 20
12-1
3
8 9
A: The challenging circumstances that the Company had
encountered earlier, a sharp devaluation in the value of the
Indian currency resulting in an increase in import costs without
a corresponding increase in realisations, extended into the year
under review as well. The Company was contracted to deliver
tile volumes at a pre-agreed price across a certain period
of time. The Company addressed its commitments, resulting
in a deficit that extended into the year under review. The
devaluation of the Indian currency increased our landed cost of
imported material which majorly contributed to our EBITDA
loss of Rs. 39.64 crore.
Q: How did the Company perform during the year under review?
A: There are a number of initiatives that NITCO has embarked
upon to return to erstwhile growth. Principally, the Company
has resolved that its business model will combine products
arising out of direct manufacture on the one hand and
outsourced manufacture on the other. Within the ambit of this
model, the Company recognises that all growth would need
to be asset-light. So the Company has resolved that over the
foreseeable future, it will expand capacity at its existing locations
and strengthen manufacturing alliances with companies that
already possess on-the-ground manufacturing capacities. What I
am pleased to state is that this is not a wish list: much work has
already happened and one can state categorically that had it not
been for these initiatives, the impact on the Company’s bottom
line would have been more severe in 2012-13.
Q: What shareholders would want to know is how the Company expects to protect itself from a recurrence of such an impact and how it expects to grow.
A: Through a combination of defensive action following which
we expect to reduce our costs and through aggressive action
by which we expect to enhance our revenues. Let me start by
discussing defensive action: when we were engaged in the import
of vitrified tiles, we needed to import in large shiploads to be
able to rationalise logistic costs. Thereafter, this inventory needed
to be warehoused for onward despatch as and when demand
arose. This worked well in a stable currency environment with an
order-to-sales cycle that ran into a few months. However, when
the Company recognised that the safest thing would be to source
material from within the country and hedge the currency risk, it
resolved to reduce its warehousing presence; whatever needed
to be supplied would be provided directly from the Company’s
factories to the extent possible. In this way, we reduced the
warehousing space as well as the warehousing cost. Besides, we
increased the procurement of tiles from our recently - acquired
subsidiary which will further reduce the cost of purchase and
increase margins in the year to come.
Q: One would have expected most of the Company’s efforts to be focused on fire-fighting. How did the Company strengthen its business instead in 2012-13?
A: At NITCO, we recognised that the most effective strategy
to fight the economic slowdown on the one hand and the
Company’s financial position on the other was through portfolio
growth. The Company would not just market the same
products it had in the past; it would increase the product range,
it would enhance a sense of wow and its brand would continue
to stand for the one thing for which it became prominent:
cutting-edge products. In line with this, the Company launched
vitrified polished tiles in November 2012 and wall tiles in May
2013. These products are value-added and we expect that over
the next few years, we should be able to scale these brands to
double the annual revenues from them.
Q: What are the aggressive initiatives that the Company has taken to return to profitability.
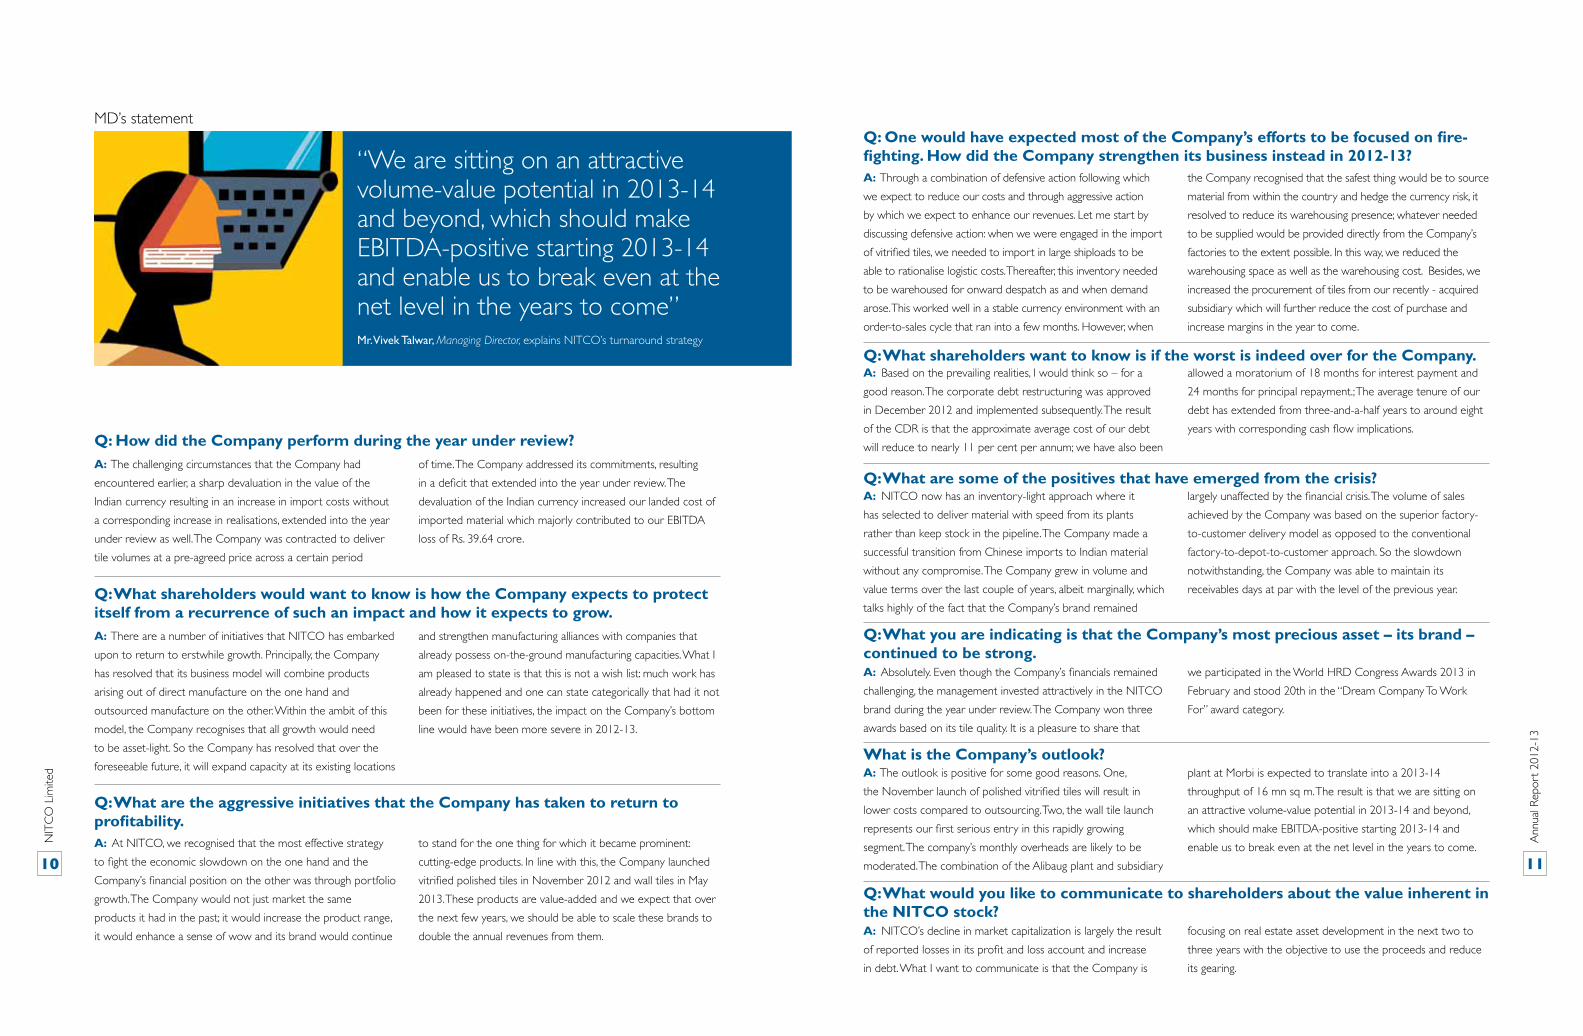
“We are sitting on an attractive volume-value potential in 2013-14 and beyond, which should make EBITDA-positive starting 2013-14 and enable us to break even at the net level in the years to come” Mr. Vivek Talwar, Managing Director, explains NITCO’s turnaround strategy
A: Based on the prevailing realities, I would think so – for a
good reason. The corporate debt restructuring was approved
in December 2012 and implemented subsequently. The result
of the CDR is that the approximate average cost of our debt
will reduce to nearly 11 per cent per annum; we have also been
allowed a moratorium of 18 months for interest payment and
24 months for principal repayment.; The average tenure of our
debt has extended from three-and-a-half years to around eight
years with corresponding cash flow implications.
Q: What shareholders want to know is if the worst is indeed over for the Company.
A: NITCO now has an inventory-light approach where it
has selected to deliver material with speed from its plants
rather than keep stock in the pipeline. The Company made a
successful transition from Chinese imports to Indian material
without any compromise. The Company grew in volume and
value terms over the last couple of years, albeit marginally, which
talks highly of the fact that the Company’s brand remained
largely unaffected by the financial crisis. The volume of sales
achieved by the Company was based on the superior factory-
to-customer delivery model as opposed to the conventional
factory-to-depot-to-customer approach. So the slowdown
notwithstanding, the Company was able to maintain its
receivables days at par with the level of the previous year.
Q: What are some of the positives that have emerged from the crisis?
A: Absolutely. Even though the Company’s financials remained
challenging, the management invested attractively in the NITCO
brand during the year under review. The Company won three
awards based on its tile quality. It is a pleasure to share that
we participated in the World HRD Congress Awards 2013 in
February and stood 20th in the “Dream Company To Work
For” award category.
Q: What you are indicating is that the Company’s most precious asset – its brand – continued to be strong.
A: NITCO’s decline in market capitalization is largely the result
of reported losses in its profit and loss account and increase
in debt. What I want to communicate is that the Company is
focusing on real estate asset development in the next two to
three years with the objective to use the proceeds and reduce
its gearing.
Q: What would you like to communicate to shareholders about the value inherent in the NITCO stock?
A: The outlook is positive for some good reasons. One,
the November launch of polished vitrified tiles will result in
lower costs compared to outsourcing. Two, the wall tile launch
represents our first serious entry in this rapidly growing
segment. The company’s monthly overheads are likely to be
moderated. The combination of the Alibaug plant and subsidiary
plant at Morbi is expected to translate into a 2013-14
throughput of 16 mn sq m. The result is that we are sitting on
an attractive volume-value potential in 2013-14 and beyond,
which should make EBITDA-positive starting 2013-14 and
enable us to break even at the net level in the years to come.
What is the Company’s outlook?
MD’s statement
NIT
CO
Lim
ited
Ann
ual R
epor
t 20
12-1
3
10 11

nvent it. the best way to predict the future is to
Alan Kay
In the competitive business of tile manufacture, there was for long a contradictory reality: each time the Company raised its production capacity, it increases its break-even point as a result of the relatively higher cost of fresh capacity.
In the last couple of years, NITCO, among select few Indian companies,
reversed this longstanding anomaly. The Company successfully enhanced its
effective production capacity without correspondingly increasing its average
cost of sq metre (except for the increases in power and fuel costs which
are beyond the control of the Company).
NITCO countered a lingering disadvantage through the following initiatives:
The Company responded innovatively through the acquisition of a 51%
equity stake in New Vardhman Vitrified Pvt. Ltd. that owned manufacturing
facilities in Morbi.
This acquisition provided the Company with approximately 8 million
square metres of manufacturing capacity at a cost lower than greenfield
costs
The outsourced sales from the newly acquired subsidiary at Morbi will have
a positive implication on the Company’s margins.
Strengthening its competitiveness.
The acquisition of a 51% equity stake in New Vardhman Vitrified Pvt. Ltd. has provided Nitco an extended manufacturing capacity of 8 million square metres.
NIT
CO
Lim
ited
Ann
ual R
epor
t 20
12-1
3
12 13

In the competitive business of tile manufacture, it would be relatively simple to cut costs and carve out a large market share; it would be considerably more challenging to enrich the product mix, enhance realizations and increase market share.
At NITCO, we focused on doing the more difficult.
During a year when most buyers were hesitant to buy higher
priced products, NITCO responded through contrarian initiatives.
The Company introduced HD Digital wall tiles for the first time in
its existence.
Strengthening its realizations.
better pr duct.
Any fool can reduce prices, but it takes genius to produce a
Anonymous
At NITCO, we focused on doing the more difficult by including the manufacture of HD Digital wall tiles for the first time in its existence
NIT
CO
Lim
ited
Ann
ual R
epor
t 20
12-1
3
14 15
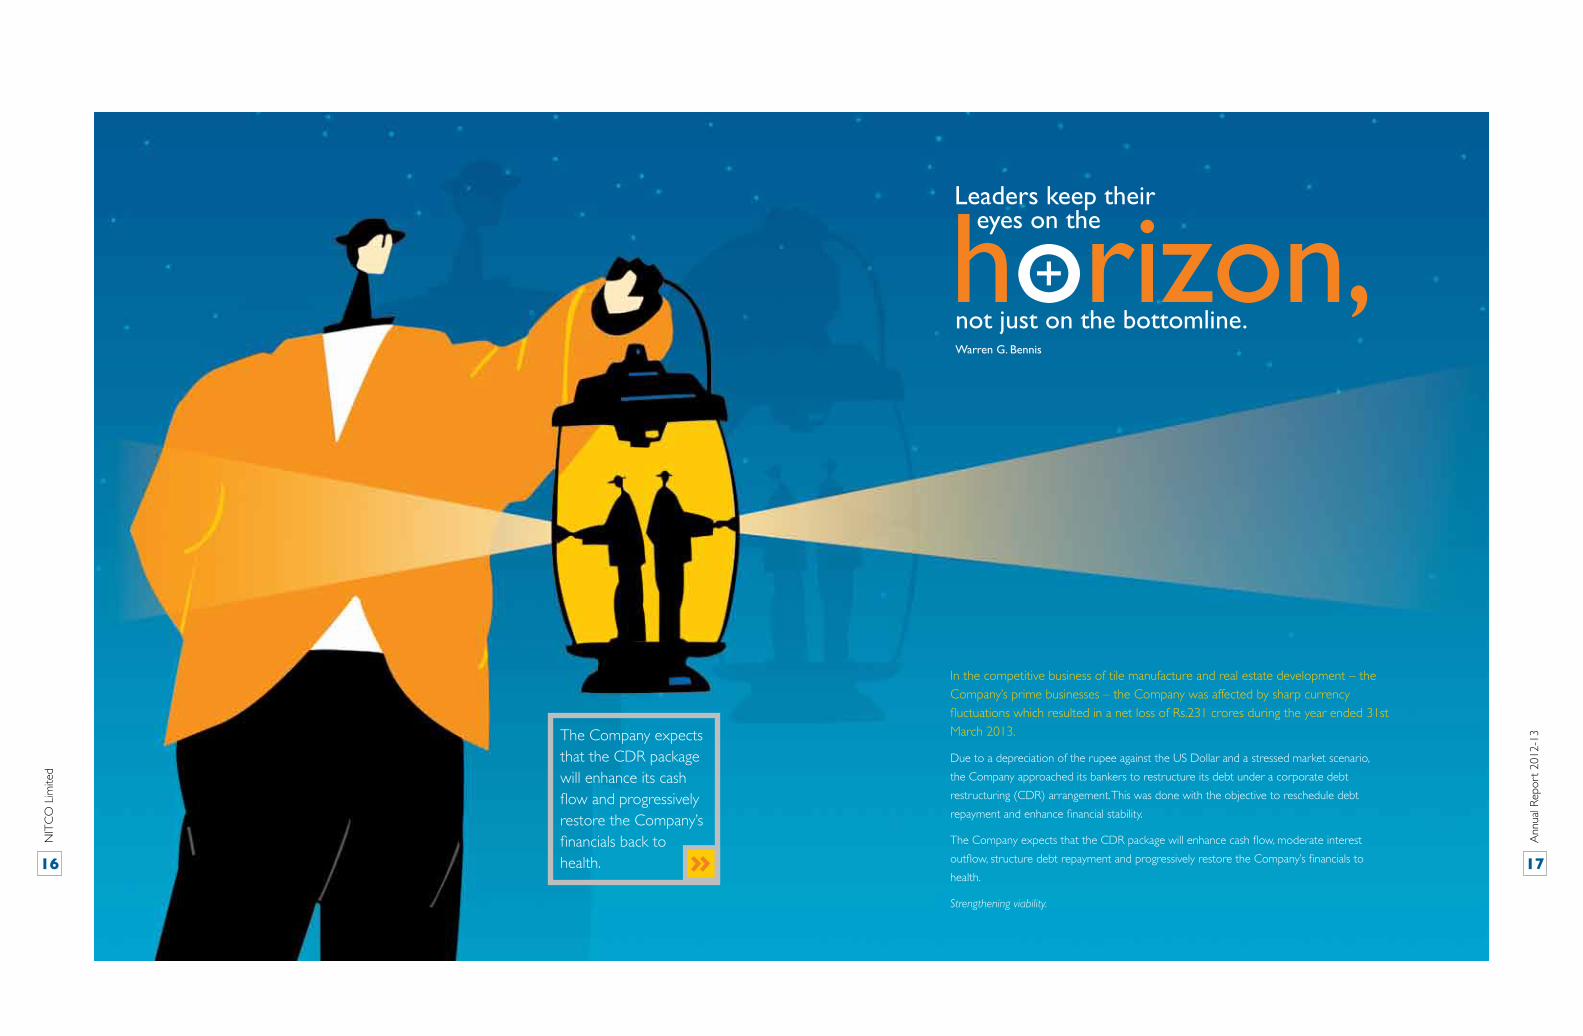
In the competitive business of tile manufacture and real estate development – the Company’s prime businesses – the Company was affected by sharp currency fluctuations which resulted in a net loss of Rs.231 crores during the year ended 31st March 2013.
Due to a depreciation of the rupee against the US Dollar and a stressed market scenario,
the Company approached its bankers to restructure its debt under a corporate debt
restructuring (CDR) arrangement. This was done with the objective to reschedule debt
repayment and enhance financial stability.
The Company expects that the CDR package will enhance cash flow, moderate interest
outflow, structure debt repayment and progressively restore the Company’s financials to
health.
Strengthening viability.
horizon,Leaders keep their eyes on the
not just on the bottomline.Warren G. Bennis
The Company expects that the CDR package will enhance its cash flow and progressively restore the Company’s financials back to health.
NIT
CO
Lim
ited
Ann
ual R
epor
t 20
12-1
3
16 17

Indian economyIndia’s economic growth decelerated for
the second year in succession, declining
from 6.2% in 2011-12 to 5% in 2012-13,
the slowest growth in a decade. In turn,
the subdued performance of the services
sector was largely due to a slowdown
in the global economy. India’s industrial
output declined 1.8%, led mainly by a
sharp contraction in the manufacturing,
mining and capital goods sectors
(proxies for investment activity). The
issues constraining industrial production
growth were low investment on account
of high interest rates, depreciating rupee,
inflation and policy slowdown.
CRISIL estimates that the economy
could grow 6.7% in 2013-14 due to a
consumption revival catalysed by an
acceleration in the agricultural sector
(predicated on a normal monsoon),
lower interest rates and higher
governmental spending.
Ceramic tiles industry in india – overviewCeramic tiles have become an integral
part of home improvement. It can make
a huge difference to the way one’s
interiors and outdoors should look. The
Indian tile industry, despite an overall
slowdown of the economy, continues
to grow at a healthy 15% per annum.
Investments in the last five years have
aggregated over Rs. 5,000 crore. The
overall size of the Indian ceramic tile
industry is approximately Rs 18,000
crore (FY12). Production during
2011-12 stood at approximately 600
million square metres.
The Indian tile industry is divided into
the organised and unorganised sectors.
The organised sector comprises
approximately 14 large players. The
current size of the organised sector is
about Rs 7,200 crore. The unorganised
sector accounts for nearly 60% of the
total industry.
India ranks in the top three countries in
terms of tile production. With planning
and better quality control, India’s exports
(presently insignificant) can significantly
increase.
The Indian tile industry addresses the
bottom end of the export market. In
terms of volume it constitutes less than
half a percent of the global market.
But this reality could change as Indian
exports are rapidly rising. The top-end of
the global export market is dominated
by China (36.8%) and Italy (15.1%).
Global ceremic tiles industryGlobal industry analysts predict the
global ceramic tile market could grow
to a volume of almost 93 billion square
feet by 2015. The global ceramic tiles
market is expected to reach almost $18
billion by 2017 fuelled by technological
innovation and demand from new end-
use markets.
The building construction industry
is an important end-use market for
ceramic tiles, demand continues to hinge
on factors like the economic climate,
purchasing power, construction activity
and GDP growth. Industry players need
to constantly innovate to satisfy demand,
which is influenced by parameters such
as style and sustainability. The report
states that Asia Pacific and Europe
collectively account for more than 80%
share of the global market.
drivers of tile industry in indiaIncreasing population of India: The
Indian population is expected to grow at
a CAGR of 1.2% during 2010-2020.
Growth of urban India: There are
42 cities in India with a population in
excess of a million people. This number
is expected to grow to 68 cities by end
2030 translating into a population of 590
million.
Growth of real estate: India’s real estate
sector is estimated to have 3.6 billion
sq ft lined up for completion in 2013,
with about 98% concentrated in the
residential segment.
Hospitality industry: India’s sector is
expected to grow at 10% CAGR over
the next five years.
Organised retail: With per capita
income crossing the USD 1,000-mark,
India is now an important global retail
destination. As Indian retail becomes
more organised, the offtake of large
format polished tiles could increase.
Rising incomes: India’s per capita
income is estimated to have gone up
11.7 percent to Rs 5,729 per month in
2012-13 compared with Rs 5,130 in the
previous fiscal.
Growing middle-class: The Indian
middle-class is expected to grow from
58 million in 2010 to 110 million by
2020. This segment is evolving towards
international standards, translating into an
upsurge in the demand for modern tiles.
Management discussion and analysis
1. World production 9,515 million sq.mt
2. India's share 600 million Sq.mt.
3. World ranking (in production) 3
4. Per capita consumption 0.50 sq.mt.
5. Global industry growth rate 11%
6. Growth rate (Indian domestic market) 15%
7. National player's turnover (India) Rs 7,200 crore
a) Glazed wall tile share 20%
b) Glazed floor tile share 23%
c) Vitrified tile share 50%
8. Regional player's turnover Rs 10,800 crore
9. National sector:
a) Share of production 40%
b) No. of units 14
10. Regional sector
a) Share of production 60%
b) No. of units 200 (approx) (70%-based in Gujarat)
Ceramic tile industry statistics
NIT
CO
Lim
ited
Ann
ual R
epor
t 20
12-1
3
18 19
Business segment overview
OverviewThe segment constitutes three products
– ceramic floor and wall tiles, vitrified
tiles and naturoc tiles. The product
portfolio encompasses tiles with gloss,
matte, wood, metal, stone and rustic
finishes.
The Company’s total tile production
capacity was approximately 16 million
sq m as on 31st March 2013. The total
manufacturing capacity of ceramic tiles
stood at 8 million sq m at Alibaug and 8
million sq m (vitrified and wall tiles) at
the subsidiary plant at Morbi.
Vitrified tiles: The Company
manufactures niche products like
abrasion-resistant and stain-resistant
vitrified tiles.
Naturoc tiles: NITCO launched a one-
of-a-kind premium full-body porcelain
tile under the Naturoc brand in 2010.
The gloss and matte finished products
were coupled with enhanced tile
strength and anti-skid quality.
Duracottura tiles: These tiles
characterised a unique blend of cutting-
edge technology and high-grade raw
materials. These tiles emerged as the
preferred choice in a competitive
environment due to their superior finish,
tensility and diverse designs.
Key highlights, 2012-13 Economic Times ACETECH awarded
the Best Tile Design to TruLife design
Mayan Moss. NITCO’s reputation as an
innovator and premium company was
endorsed by the response from the
trade and consumers.
The first set of digital tiles was
introduced.
Outlook, 2013-14 In the floor and wall segment, NITCO
intends to manufacture large tiles.
Volume, value and margins are likely
to be enhanced through premium
products.
Business Segment 1
tiles
OverviewThe Company’s state-of-the-art plant
at Silvassa processes imported marble
blocks. The marble comprises superior
designs and quality used in flooring
solutions (interior and exterior).
Our ProductsNatural Marble: NITCO is one of India’s
largest natural marble importers from
Italy, Spain, Turkey, Egypt and China. The
Company’s high-end marble variants
are available in more than 200 different
shades. The Company is one of the
world’s few to possess an integrated
plant at Silvassa using Breton technology.
Engineered Marble: This cost-effective
alternative to natural marble (comprising
resin, pigments and additives) ensures
consistency and durability
Outlook, 2013-14Due to the initiation of a number of
luxury projects, the production of
marbles is expected to increase by
around 10-15%.
Business Segment II
Marble
OverviewThe Company ventured into the realm
of real estate development through
NITCO Realties (100% subsidiary) to
unlock the value of its real estate assets
at prime locations in Mumbai, Thane and
Alibaug.
The Company completed its first
premium project in 2011 (NITCO Biz
Park) at Thane, a six-storey building
spread across 2,00,000 sq.ft with a
three-storied landscaped atrium. The
environment-friendly building is equipped
with modern amenities comprising
cutting-edge security surveillance,
dedicated security control room and
an ‘intelligent’ building management
system with a 100%-power backup. The
environment-friendly and energy-efficient
focus resulted in the building being
awarded a LEED (Leadership in Energy
and Efficient Design) pre-certification.
Following the amalgamation with
Particle Boards India Ltd., the Company
acquired a plot measuring 4.01 acres
at Kanjurmarg (Mumbai), which will be
developed following approvals from
relevant authorities.
Going forward, NITCO and its
subsidiaries expect to enhance their
exposure in residential and commercial
projects.
Business Segment III
real estate development
The Company is one of the world’s few to possess an integrated plant at Silvassa using Breton technology.
NIT
CO
Lim
ited
Ann
ual R
epor
t 20
12-1
3
20 21
excellence driver
Overview In an industry marked by intense
competition, the parameters that
determine supremacy are plant efficiency,
productivity and optimal energy
consumption. Over the years, NITCO
invested in state-of-art technological
resources and fully-automated assets to
reinforce its foundation.
Key highlights, 2012-13 The Company utilised alternative
materials leading to cost reduction.
Increased the production of value-
added products.
Installed digital printing machines from
Italy.
Sustained energy-efficiency in ceramic
tile manufacture by using 100% of waste
heat from the gas turbine.
Key initiatives, 2012-13 Modified the process without
affecting the overall quality and by
reducing power consumption.
Optimised costs by installing air-less
devices for reducing engobe and glazes.
Minimised shade variations;
introduced tintometric systems
(automatic color matching system).
To reduce process time, the Company
invested in new equipment (airless
devices, digital printing machine, surface
inspection at green stages and Kiln
energy savings).
Strengthened quality checks of
finished products using electronic
devices.
Upgraded its laboratory through a
stringent control of incoming
raw-materials in line with LEED
certification standards (Green Building).
excellence driver I
operations
command-and-control management style
to the coach-and-collaborate model.
Key initiatives
Recruitment
The Company added around 158
employees to manage its increasing
operations and marketing. It hired
various employees through campus
hiring as management trainees, executive
trainees and graduate engineering
trainees.
Training
Quality training was provided to
workers for an enhanced insight into
product manufacture.
The Company initiated a course for
young prospective engineers through
shop-floor training.
Leadership
Launched job posting programmes
identifying talent development potential.
This enhanced lateral and vertical
movement within the organisation.
Overview Nitco is driven by a team of 1121
individuals (as on 31st March 2013)
translating into improvements in quality,
efficiency, output and innovation.
Key highlights, 2012-13 Training was conducted across
various disciplines including leadership
development, marketing and behavioral
aspects.
Created a culture of engaging Gen
Y - moving NITCO from a traditional
excellence driver II
Intellectual capital
Overview At NITCO, information technology
forms the cornerstone around which
the superstructure of the Company has
been erected. This is a critical business
driver, assimilating the Company’s
widespread manufacturing and marketing
operations and helping it stay connected
with dealers 24x7.
Key highlights, 2012-13 Implemented the SAP ERP system
to facilitate the efficient processing of
Morbi-based outsourced tile planning,
procurement and dispatch.
Automated the planning and
procurement systems of the Alibaug
factory; outsourced vendor locations,
which improved inventory and working
capital management.
Strengthened the Customer
Relationship Management (CRM)
system for the sales team for the
effective use of online order discount
approvals, order and inventory status,
customer account details, MIS etc., which
improved productivity and customer
responsiveness.
Rolled out SAP Payroll module for
the entire payroll processing of NITCO
employees.
Implemented online MIS dashboards
and reports for senior management
through SAP Data Warehouse and SAP
Business Intelligence system; facilitated
decision making and operations
monitoring.
Simplified various paper-based
approval processes by converting these
into online processes, which helped
advance speed and efficiency.
Automated the sales team’s incentives
and dealer schemes processes for online
computation and efficient processing.
Introduced checks and balances in
supply chain and commercial processes,
through automation and SAP process
controls, to facilitate monitoring and
decision making in freight management
and debtor’s control.
Implemented backup connectivity
to the Alibaug factory and major
warehouses. Initiated primary
connectivity to all new warehouse
locations.
Optimised IT operating expenses
through video conferencing solutions,
printing solutions and consolidation of
network connectivity.
Outlook 2013-14 The SAP system was upgraded
to a higher version, ensuring better
performance and stability to the
information systems.
To ensure high availability and
performance management, the Company
plans to restore major servers, storage
and key IT infrastructure.
NITCO’s major focal point will be
on the deployment of mobility-based
solutions to be executed through
smart phones and tablets in sales force
automation, workflow management and
decision-making tools.
SAP ERP systems will be prime focus
areas for business process improvements,
MIS, process controls and decision
making support.
Cost reduction through the
innovative use of cloud computing
solutions, productivity improvement
solutions and virtual desktop initiatives
excellence driver III
Information technology
NIT
CO
Lim
ited
Ann
ual R
epor
t 20
12-1
3
22 23
Financial Statement Analysis
Segment-wise highlights Vitrified Tiles
Comprised 50% of the total turnover
of the Company in 2012-13.
Volume decreased by 6% from 93
lakhs sq m in 2011-12 to 87 lakhs sq m
in 2012-13
Divisional turnover decreased by 17%
from Rs. 52,818 lakhs in 2011-12 to
Rs. 43,813 lakhs in 2012-13.
Average realisation decreased 11%
from Rs. 567 per sq m in 2011-12 to
Rs. 505 per sq m in 2012-13.
Ceramic and Gres Porcelain Tiles Comprised 40% of the total turnover
of the Company in 2012-13.
Volume increased by 14% from 63
lakhs sq m in 2011-12 to 72 lakhs sq m
in 2012-13
Divisional turnover increased by 28%
from Rs. 27,628 lakhs in 2011-12 to
Rs. 35,311 lakhs in 2012-13.
Average realisation increased 13%
from Rs. 437 per sq m in 2011-12 to
Rs. 492 per sq m in 2012-13.
Marble
Comprised 8% of the total turnover
of the Company in 2012-13.
Volume decreased by 51% from 61
lakhs sq. feet in 2011-12 to 30 lakhs sq.
feet in 2012-13
Divisional turnover decreased by 52%
from Rs. 14,404 lakhs in 2011-12 to
Rs. 6,945 lakhs in 2012-13.
Average realisation dropped by 1%
from Rs. 236 per sq. foot in 2011-12 to
Rs. 235 per sq. foot in 2012-13.
Real Estate Sales value increased to Rs.1,850 lakhs in
2012-13 from Rs. 1,120 lakhs in 2011-12,
an increase of 65%.
Export SalesSales value increased by Rs. 385 lakhs to
Rs. 1,220 lakhs in 2012-13 from Rs. 835
lakhs in 2011-12, an increase of 46%.
Domestic SalesSales value decreased by Rs. 8,438 lakhs
to Rs. 86,578 lakhs in 2012-13 from
Rs. 95,016 lakhs in 2011-12, a drop of 9%.
Revenues by sourceOther operating revenues increased
from Rs. 119 lakhs to Rs.121 lakhs, mainly
due to increased rent received during
the year from the lease of office space at
the newly constructed Thane Biz Park.
Expense Analysis Cost of goods sold: Material costs, as
a proportion of net sales, increased by
3.16% and accounted for 68.46% of net
sales due to the sale of imported trade
in stock goods procured at a higher cost
in the earlier yearsr.
Power and fuel: It increased 39%
from Rs. 3,825.18 lakhs in 2011-12 to
Rs.5,309.25 lakhs in 2012-13, due to
increase in capacity utilization and also
due to a rise in the price of RLNG.
Employee benefit expense: It
increased 40.75% from Rs. 4,665.09 lakhs
in 2011-12 to Rs.6,566.14 lakhs in
2012-13, owing to new recruitments,
annual increments and salary corrections
in line with market requirements.
Finance costs: It increased from
Rs.7,511.39 lakhs in 2011-12 to
Rs.15,167.39 lakhs in 2012-13. In the
year 2011-12, the finance cost of
Rs. 7511.39 lakhs was exclusive of
interest capitalised of Rs. 2,520.38 lakhs.
The total increase in interest cost was
101.93 %. Consequent to the Corporate
Debt Restructuring and funding of
interest, the borrowings of the Company
increased resulting in increased
borrowing cost. Please refer to Note no
23 of the Financial Statements.
Expenses excluding power and fuel It increased 36.93% from Rs.12,017.11
lakhs in 2011-12 to Rs.16,454.64 lakhs in
2012-13. This comprised an increase in
rent due to higher warehouse space to
cater to the storage of higher inventories.
Consumption of stores increased on
account of overhauling equipments at
the plant. Freight forwarding expenses
increased due to an increase in freight
and change in business model from
imports-led sourcing to domestic base
sourcing. Legal & professional expenses
increased on account of services availed
for improved operations.
Depreciation and amortization
expenses: The Company provided
depreciation on the Straight Line
Method in accordance with and rates
prescribed in the Companies Act, 1956.
Tax: No tax was provided on account
of losses during the year as well as the
previous year.
Balance Sheet Analysis Equity and Liabilities Equity share capital
The equity share capital of the Company
was Rs. 3,260.01 lakhs comprising
32,600,132 shares of Rs. 10 each.
Reserves and surplus
Reserves and surplus decreased by
Rs.23,133.82 lakhs from Rs. 44,747.49
lakhs in 2011-12 to Rs. 21,613.67 lakhs in
2012-13. This decrease was on account
of losses incurred during the year.
Non-Current Liabilities
Total Non-Current liabilities increased
from Rs.34,562.22 lakhs in FY 2011-12
to Rs.117,066.73 lakhs in FY 2012-13.
The increase in loan was consequent
to the restructuring under the CDR
mechanism under which short-term
facilities were converted into long-term
loans (including Working Capital Loans)
as well as funding of interest. Please
also refer to Note No 3 of the Financial
Statements.
Current Liabilities
Current liabilities decreased from
Rs. 93,012.70 lakhs in FY 2011-12 to
Rs.13,165.93 lakhs in FY 2012-13 mainly
due to a decrease in trade payables on
account of the conversion of short-term
facilities from banks into long-term and
decrease in trade payables.
Assets
Non current assets
Total Non-Current assets increased
from Rs. 90,935.84 lakhs in FY 2011-12
to Rs.91,830.78 lakhs in FY 2012-13
mainly due to investment of 51% stake
in New Vardhman Vitrified Pvt Ltd. and
advances given to them. This was offset
by decrease in net block by Rs. 2,846.88
lakhs on account of depreciation
provision.
Current Assets
Current assets decreased from
Rs. 84,646.58 lakhs in FY 2011-12 to
Rs.66,075.56 lakhs in FY 2012-13 mainly
on account of decrease in inventories.
Inventories
Inventories decreased from Rs. 38,936.51
lakhs in 2011-12 to Rs.23,270.99 lakhs
in 2012-13 owing to an decrease in
Stock in Trade and Finished Goods stock
inventory.
Trade receivables
Trade receivables reduced marginally
from Rs. 9,533.15 lakhs in 2011-12 to
Rs.9,500.56 Lakhs in 2012-13.
Cash and cash equivalents:
The cash and cash equivalents decreased
from Rs. 5,708.09 lakhs in 2011-12 to
Rs.2,328.02 lakhs in 2012-13.
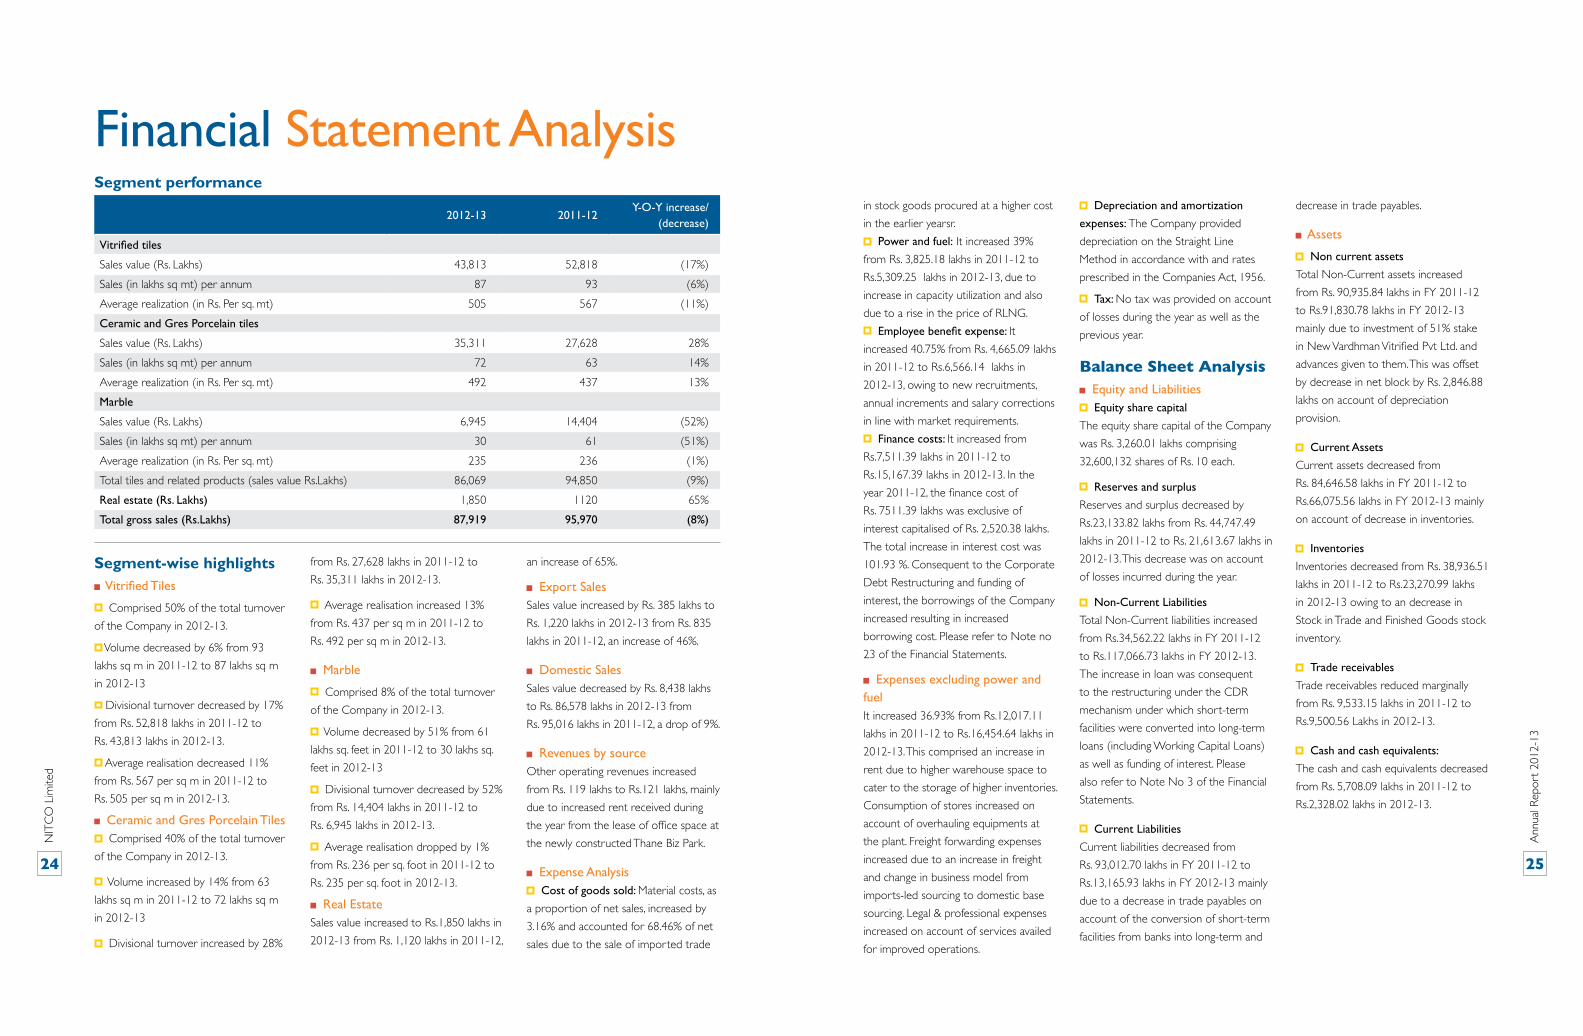
Segment performance
2012-13 2011-12Y-O-Y increase/
(decrease)
Vitrified tiles
Sales value (Rs. Lakhs) 43,813 52,818 (17%)
Sales (in lakhs sq mt) per annum 87 93 (6%)
Average realization (in Rs. Per sq. mt) 505 567 (11%)
Ceramic and Gres Porcelain tiles
Sales value (Rs. Lakhs) 35,311 27,628 28%
Sales (in lakhs sq mt) per annum 72 63 14%
Average realization (in Rs. Per sq. mt) 492 437 13%
Marble
Sales value (Rs. Lakhs) 6,945 14,404 (52%)
Sales (in lakhs sq mt) per annum 30 61 (51%)
Average realization (in Rs. Per sq. mt) 235 236 (1%)
Total tiles and related products (sales value Rs.Lakhs) 86,069 94,850 (9%)
Real estate (Rs. Lakhs) 1,850 1120 65%
Total gross sales (Rs.Lakhs) 87,919 95,970 (8%)
NIT
CO
Lim
ited
Ann
ual R
epor
t 20
12-1
3
24 25
risk management
Risk is inherent in every business. Some focus on its mere mitigation, others treat it as an opportunity to face challenges, strengthening business tenacity, to learn and accelerate growth of the business, the industry and the economy. At NITCO, we believe in the latter approach.
Business slowdown riskA slowdown in India’s economic progress could create a huge gap between the estimated budget and ground realities.
Mitigation argument: An economic deceleration primarily impacts metros and
urban cities. Besides, a majority of the demand for consumer products is emerging from
Tier-II and III towns, which usually remains largely unaffected by economic slowdowns.
The Company strengthened its distribution network in new demand pockets leading to a
significant out-performance.
Foreign Exchange Risk riskA weaker Indian currency is a threat to importers.
Mitigation argument: The Company has shifted its dependence from Chinese
imports to indigenous sourcing. A small portion of the Company’s turnover is still
imported from China as per the requirement of its clients. The Company fully covers its
foreign exchange exposure; selling the products at margin-plus-actual landed cost basis.
The Company generally finalises the price negotiation of products with client before
actual imports take place.
Perception riskInability to sustain historical growth rates could adversely impact perception.
Mitigation argument: The Company may not be able to sustain the growth
rate of the earlier years as the base has expanded over a short time. While the growth
percentage could be lower than the historic average, the absolute growth numbers
could continue to be larger than the previous years due to a dynamic business plan that
encompasses sustained volume increase, continuous innovation towards a sales-mix
skewed in favour of value-added products and improving operational efficiencies. As a
result, the Company will continue to outperform the average industry growth.
Competition riskCompetition from organised and the unorganised players hamper margins.
Mitigation argument: The Indian tile industry is undergoing a consolidation phase
where organised/branded players (with marketing skills and a vast distribution network)
are partnering with unbranded players (with low-cost manufacturing expertise). As a
result, competition from the unbranded sector is expected to decline.
Technology obsolescence risk Technology obsolescence may result in compromise of quality standards.
Mitigation argument: The Company scaled its IT infrastructure by investing in SAP,
enabling real-time open communication between the sales, distribution and manufacturing
divisions.
Client attrition risk Institutional clients constitute a substantial portion of the Company’s total sales; client attrition can impact growth
Mitigation argument: The Company has initiated measures like providing post-sale
services to retail customers and offering guidance programmes for institutional customers
to reinforce their relationship with the customers. It also customises products to cater to
specific requirements.
Its products are recommended by brand-enhancing customers like Pantaloons, Reliance
Retail, Rahejas, Godrej, Oberoi Construction, DLF, L&T and Unitech.
Human Resource risk Attrition of key executives and personnel could affect the Company’s efficiency.
Mitigation argument: Retaining the existing talent pool and attracting new
manpower are major risks. The Company has initiated various measures such as roll out of
strategic talent management system, training and integration of learning activities. Various
HR initiatives have been initiated to involve and encourage staff for decision making and
participation management.
Dealer Attrition risk Reduction in the number of dealers could affect sales.
Mitigation argument: The Company furthered its dealer network by introducing
the fast-moving range of tiles.
It helped increase dealer income prospects by widening product assortment.
It provides a variety of dealer-centric options for efficient working (online order
placement, tracking stock movement and secure payment processing).
It represented one of the largest industry dealership networks by adding new dealers
in 2012-13, bringing the total direct dealers to around 1,100.
Fuel cost riskRising gas prices could affect profitability.
Mitigation argument: The sustained increase in gas prices is completely beyond
the control of the Company; it impacts sectoral profitability. To minimise the impact, the
Company is raising the share of value-added products (large format tiles, vitrified tiles and
digitally printed tiles).
NIT
CO
Lim
ited
Ann
ual R
epor
t 20
12-1
3
26 27
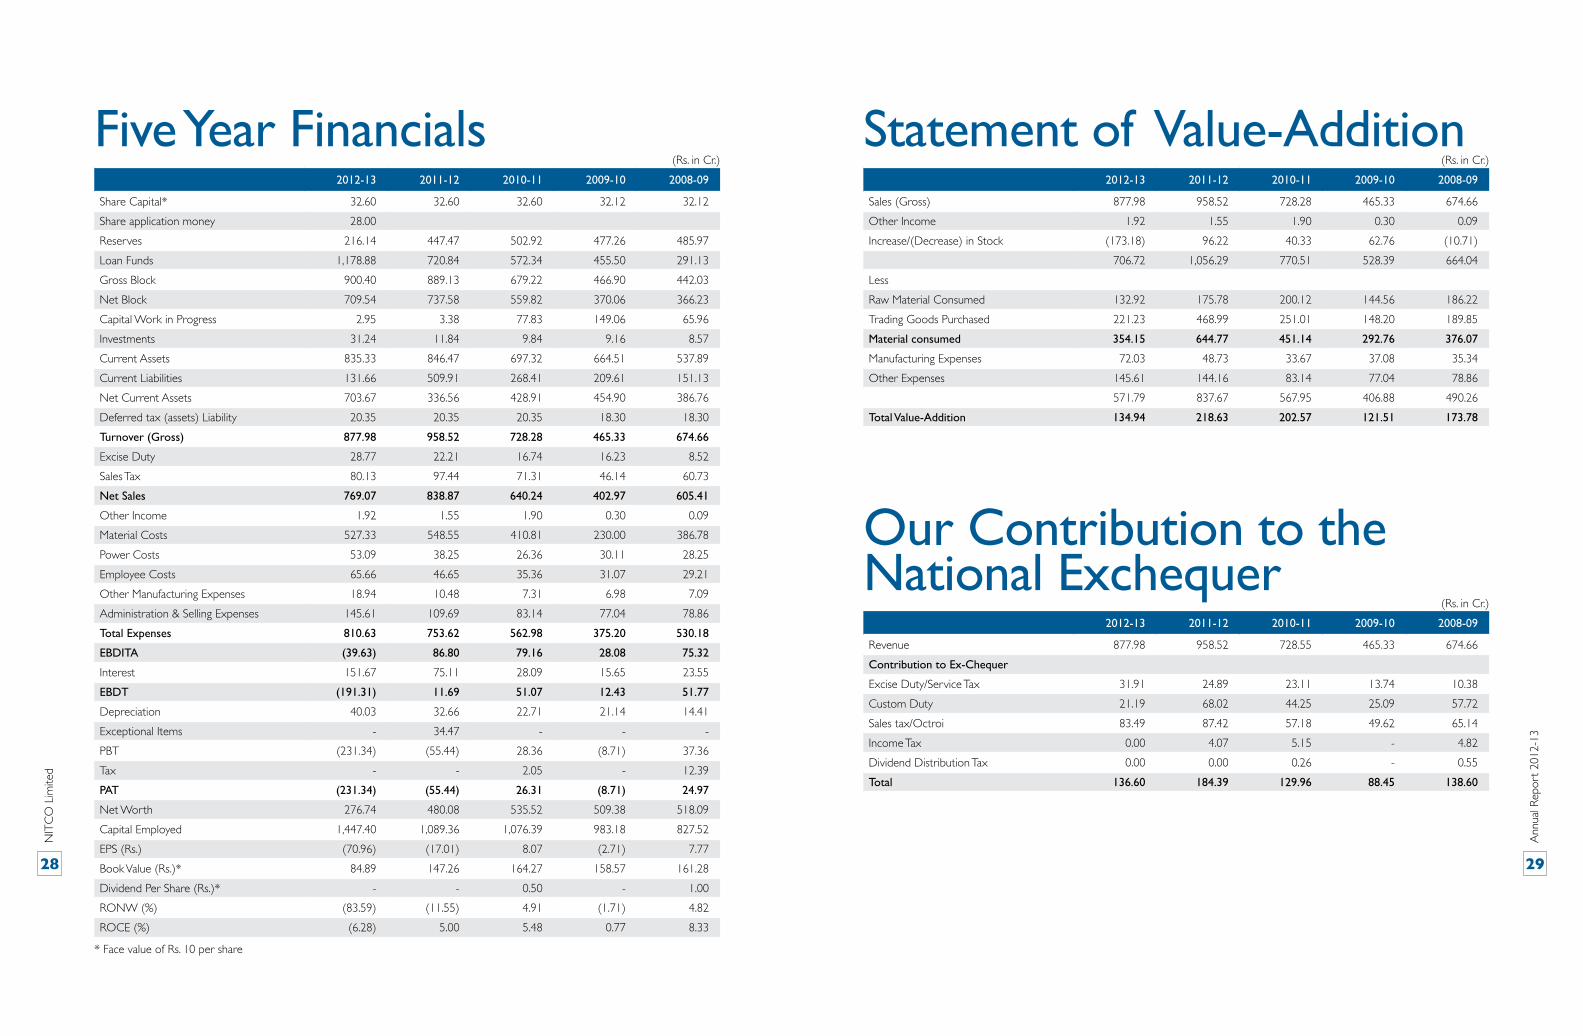
Five Year Financials2012-13 2011-12 2010-11 2009-10 2008-09
Share Capital* 32.60 32.60 32.60 32.12 32.12
Share application money 28.00
Reserves 216.14 447.47 502.92 477.26 485.97
Loan Funds 1,178.88 720.84 572.34 455.50 291.13
Gross Block 900.40 889.13 679.22 466.90 442.03
Net Block 709.54 737.58 559.82 370.06 366.23
Capital Work in Progress 2.95 3.38 77.83 149.06 65.96
Investments 31.24 11.84 9.84 9.16 8.57
Current Assets 835.33 846.47 697.32 664.51 537.89
Current Liabilities 131.66 509.91 268.41 209.61 151.13
Net Current Assets 703.67 336.56 428.91 454.90 386.76
Deferred tax (assets) Liability 20.35 20.35 20.35 18.30 18.30
Turnover (Gross) 877.98 958.52 728.28 465.33 674.66
Excise Duty 28.77 22.21 16.74 16.23 8.52
Sales Tax 80.13 97.44 71.31 46.14 60.73
Net Sales 769.07 838.87 640.24 402.97 605.41
Other Income 1.92 1.55 1.90 0.30 0.09
Material Costs 527.33 548.55 410.81 230.00 386.78
Power Costs 53.09 38.25 26.36 30.11 28.25
Employee Costs 65.66 46.65 35.36 31.07 29.21
Other Manufacturing Expenses 18.94 10.48 7.31 6.98 7.09
Administration & Selling Expenses 145.61 109.69 83.14 77.04 78.86
Total Expenses 810.63 753.62 562.98 375.20 530.18
EBDITA (39.63) 86.80 79.16 28.08 75.32
Interest 151.67 75.11 28.09 15.65 23.55
EBDT (191.31) 11.69 51.07 12.43 51.77
Depreciation 40.03 32.66 22.71 21.14 14.41
Exceptional Items - 34.47 - - -
PBT (231.34) (55.44) 28.36 (8.71) 37.36
Tax - - 2.05 - 12.39
PAT (231.34) (55.44) 26.31 (8.71) 24.97
Net Worth 276.74 480.08 535.52 509.38 518.09
Capital Employed 1,447.40 1,089.36 1,076.39 983.18 827.52
EPS (Rs.) (70.96) (17.01) 8.07 (2.71) 7.77
Book Value (Rs.)* 84.89 147.26 164.27 158.57 161.28
Dividend Per Share (Rs.)* - - 0.50 - 1.00
RONW (%) (83.59) (11.55) 4.91 (1.71) 4.82
ROCE (%) (6.28) 5.00 5.48 0.77 8.33
(Rs. in Cr.)
Statement of Value-Addition2012-13 2011-12 2010-11 2009-10 2008-09
Sales (Gross) 877.98 958.52 728.28 465.33 674.66
Other Income 1.92 1.55 1.90 0.30 0.09
Increase/(Decrease) in Stock (173.18) 96.22 40.33 62.76 (10.71)
706.72 1,056.29 770.51 528.39 664.04
Less
Raw Material Consumed 132.92 175.78 200.12 144.56 186.22
Trading Goods Purchased 221.23 468.99 251.01 148.20 189.85
Material consumed 354.15 644.77 451.14 292.76 376.07
Manufacturing Expenses 72.03 48.73 33.67 37.08 35.34
Other Expenses 145.61 144.16 83.14 77.04 78.86
571.79 837.67 567.95 406.88 490.26
Total Value-Addition 134.94 218.63 202.57 121.51 173.78
(Rs. in Cr.)
our Contribution to the national exchequer
2012-13 2011-12 2010-11 2009-10 2008-09
Revenue 877.98 958.52 728.55 465.33 674.66
Contribution to Ex-Chequer
Excise Duty/Service Tax 31.91 24.89 23.11 13.74 10.38
Custom Duty 21.19 68.02 44.25 25.09 57.72
Sales tax/Octroi 83.49 87.42 57.18 49.62 65.14
Income Tax 0.00 4.07 5.15 - 4.82
Dividend Distribution Tax 0.00 0.00 0.26 - 0.55
Total 136.60 184.39 129.96 88.45 138.60
(Rs. in Cr.)
* Face value of Rs. 10 per share
NIT
CO
Lim
ited
Ann
ual R
epor
t 20
12-1
3
28 29
Director’s report
Your Directors are pleased to present the Annual Report with the audited statement of accounts of the Company for the year ended
March 31, 2013.
Financial resultsThe highlights of the financial results for the year ended March 31, 2013 are as follows:
Review of operationDuring the year under review, your Company’s gross sales
have declined by 8.38% over last year. The increase in costs of
production, interest cost etc resulted in increase in net loss to
Rs. 23134 lakhs.
Continued Challenges faced by the CompanyThe slump in real estate has taken a toll on volumes as well
as sales realization. While the costs have increased sharply due
to devaluation of currency, increase in power and fuel cost,
employee cost and the interest cost, the competition from
unorganised sector and weak market has restricted our ability
to pass on increased cost to customers. Consequently the gross
sales of the Company during year ended 31st March 2013 has
dropped to Rs. 87919 lakhs as against Rs. 95970 lakhs during
previous year ended 31st March 2012.
Demand for Tiles is primarily linked with growth of Real Estate
sector. Real Estate sector has been grappling with problems.
Slow sales and a glut of properties are hampering the real estate
market in major metro and A-class cities in India. The glut is likely
to extend into 2014 as steady streams of new developments are
launched on the market. The overall sentiments of the market
and the consistent rate of new project launches in major cities
give a clear indication of an impending oversupply in 2013 and
2014. Analysts tracking the prices and unsold property inventory
levels believe that the fall would continue for a longer period and
prices would remain stagnant for some time.
As the economy shows signs of decreasing GDP growth rate,
the Indian real estate industry faces its own share of concerns.
Real estate developers are reeling under high debt and FDI
inflows have also slowed down. Amidst these macroeconomic
conditions, Indian real estate asset classes across the prime cities
of India have seen mixed sentiments.
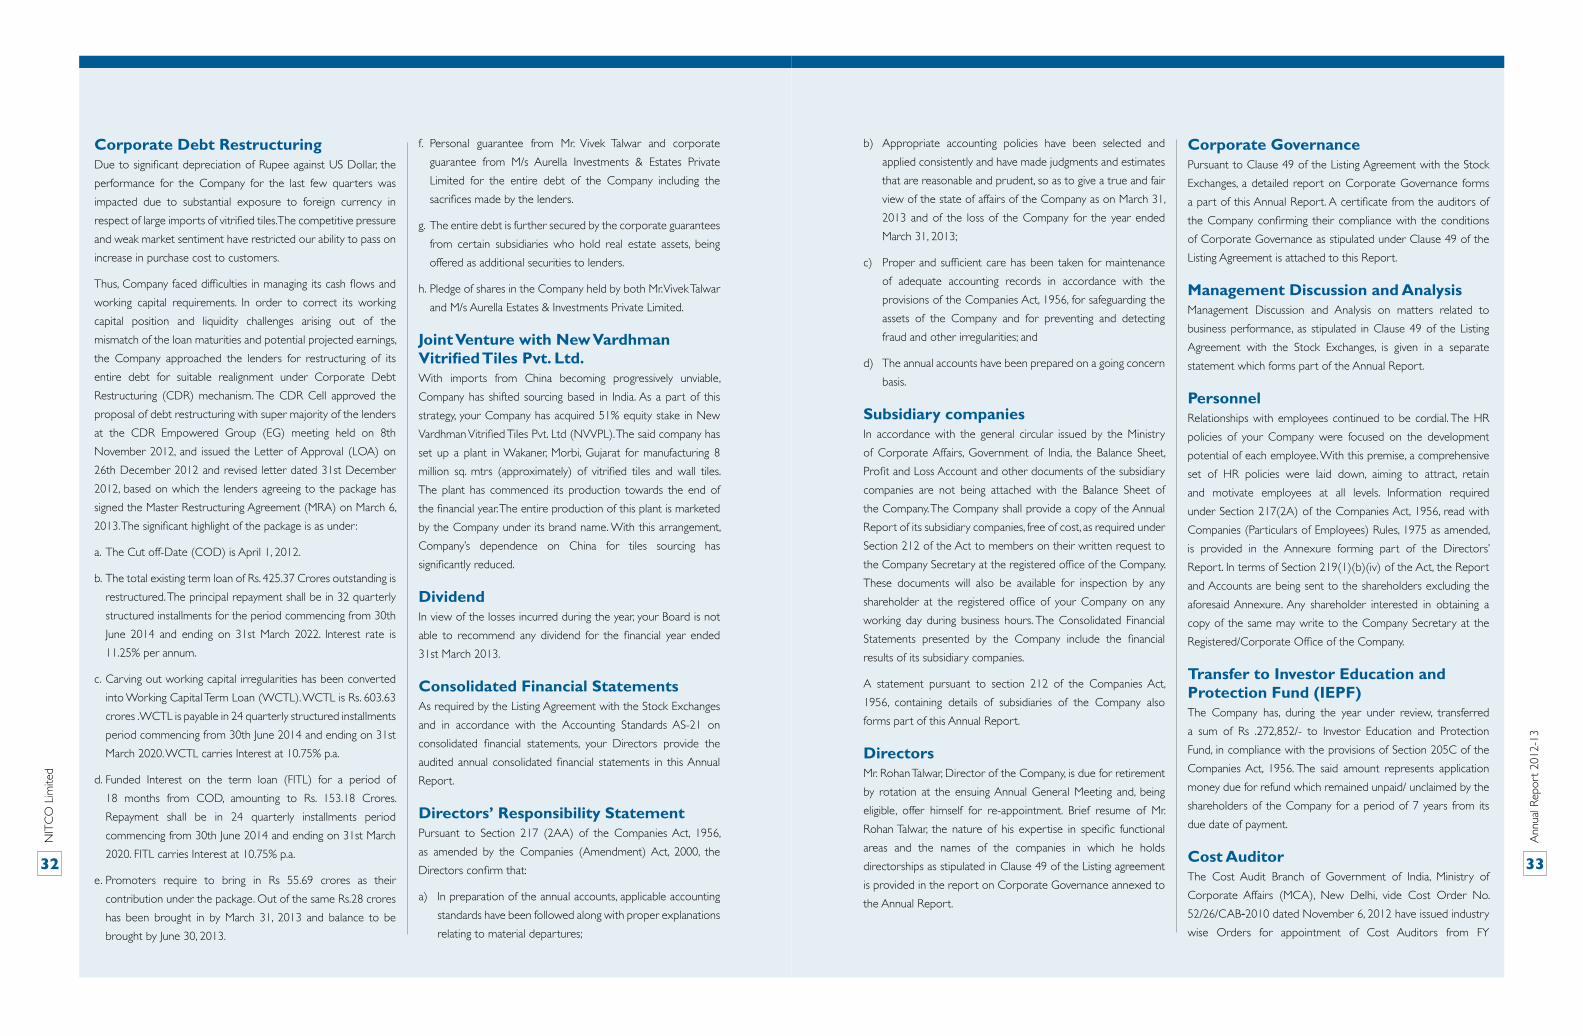
Increased cost of Regasified liquefied natural gas (RLNG) Power and Fuel forms a substantial part of cost of production in
the tile industry. Our Company depends on RLNG supplied by
GAIL for firing its kiln and dryers and generating power through
gas turbine. As will be seen from the table below, the Company
has been subjected to monthly increase in RLNG prices thereby
increasing its cost of production. Due to severe competitive
pressures, Company was unable to pass on the increased cost of
RLNG to its customers.
(Rs. in lakhs)
For the year ended march 31 2013 2012
Gross Sales 87919 95970
Profit before interest depreciation and tax (3964) 8680
Interest & Financial Charges (Net) 15167 7511
Depreciation 4003 3266
Exceptional Items – 3447
Profit/(loss) before tax (23134) (5544)
Provision for tax – –
Profit/(loss) after tax (23134) (5544)
Balance brought forward from previous year 7188 12732
Balance carried forward (15946) 7188
The below graph shows the increase in the cost of RLNG per MMBTU from April 2012 to March 2013:
Am
ount
in R
s.
Apr-1
2
Jul-1
2
Oct-
12
Jan-1
3
May
-12
Aug-1
2
Nov
-12
Feb-
13
Jun-1
2
Sep-
12
Dec-1
2
Mar-
13
900
850
800
750
700
650
600
RLNG – Rs. per MMBTU
646
701
729 739756 751 759
787802 810
821842
NIT
CO
Lim
ited
Ann
ual R
epor
t 20
12-1
3
30 31
Corporate debt RestructuringDue to significant depreciation of Rupee against US Dollar, the
performance for the Company for the last few quarters was
impacted due to substantial exposure to foreign currency in
respect of large imports of vitrified tiles. The competitive pressure
and weak market sentiment have restricted our ability to pass on
increase in purchase cost to customers.
Thus, Company faced difficulties in managing its cash flows and
working capital requirements. In order to correct its working
capital position and liquidity challenges arising out of the
mismatch of the loan maturities and potential projected earnings,
the Company approached the lenders for restructuring of its
entire debt for suitable realignment under Corporate Debt
Restructuring (CDR) mechanism. The CDR Cell approved the
proposal of debt restructuring with super majority of the lenders
at the CDR Empowered Group (EG) meeting held on 8th
November 2012, and issued the Letter of Approval (LOA) on
26th December 2012 and revised letter dated 31st December
2012, based on which the lenders agreeing to the package has
signed the Master Restructuring Agreement (MRA) on March 6,
2013. The significant highlight of the package is as under:
a. The Cut off-Date (COD) is April 1, 2012.
b. The total existing term loan of Rs. 425.37 Crores outstanding is
restructured. The principal repayment shall be in 32 quarterly
structured installments for the period commencing from 30th
June 2014 and ending on 31st March 2022. Interest rate is
11.25% per annum.
c. Carving out working capital irregularities has been converted
into Working Capital Term Loan (WCTL). WCTL is Rs. 603.63
crores . WCTL is payable in 24 quarterly structured installments
period commencing from 30th June 2014 and ending on 31st
March 2020. WCTL carries Interest at 10.75% p.a.
d. Funded Interest on the term loan (FITL) for a period of
18 months from COD, amounting to Rs. 153.18 Crores.
Repayment shall be in 24 quarterly installments period
commencing from 30th June 2014 and ending on 31st March
2020. FITL carries Interest at 10.75% p.a.
e. Promoters require to bring in Rs 55.69 crores as their
contribution under the package. Out of the same Rs.28 crores
has been brought in by March 31, 2013 and balance to be
brought by June 30, 2013.
f. Personal guarantee from Mr. Vivek Talwar and corporate
guarantee from M/s Aurella Investments & Estates Private
Limited for the entire debt of the Company including the
sacrifices made by the lenders.
g. The entire debt is further secured by the corporate guarantees
from certain subsidiaries who hold real estate assets, being
offered as additional securities to lenders.
h. Pledge of shares in the Company held by both Mr. Vivek Talwar
and M/s Aurella Estates & Investments Private Limited.
Joint Venture with New Vardhman Vitrified Tiles Pvt. Ltd.With imports from China becoming progressively unviable,
Company has shifted sourcing based in India. As a part of this
strategy, your Company has acquired 51% equity stake in New
Vardhman Vitrified Tiles Pvt. Ltd (NVVPL). The said company has
set up a plant in Wakaner, Morbi, Gujarat for manufacturing 8
million sq. mtrs (approximately) of vitrified tiles and wall tiles.
The plant has commenced its production towards the end of
the financial year. The entire production of this plant is marketed
by the Company under its brand name. With this arrangement,
Company’s dependence on China for tiles sourcing has
significantly reduced.
dividendIn view of the losses incurred during the year, your Board is not
able to recommend any dividend for the financial year ended
31st March 2013.
Consolidated Financial StatementsAs required by the Listing Agreement with the Stock Exchanges
and in accordance with the Accounting Standards AS-21 on
consolidated financial statements, your Directors provide the
audited annual consolidated financial statements in this Annual
Report.
directors’ Responsibility StatementPursuant to Section 217 (2AA) of the Companies Act, 1956,
as amended by the Companies (Amendment) Act, 2000, the
Directors confirm that:
a) In preparation of the annual accounts, applicable accounting
standards have been followed along with proper explanations
relating to material departures;
b) Appropriate accounting policies have been selected and
applied consistently and have made judgments and estimates
that are reasonable and prudent, so as to give a true and fair
view of the state of affairs of the Company as on March 31,
2013 and of the loss of the Company for the year ended
March 31, 2013;
c) Proper and sufficient care has been taken for maintenance
of adequate accounting records in accordance with the
provisions of the Companies Act, 1956, for safeguarding the
assets of the Company and for preventing and detecting
fraud and other irregularities; and
d) The annual accounts have been prepared on a going concern
basis.
Subsidiary companiesIn accordance with the general circular issued by the Ministry
of Corporate Affairs, Government of India, the Balance Sheet,
Profit and Loss Account and other documents of the subsidiary
companies are not being attached with the Balance Sheet of
the Company. The Company shall provide a copy of the Annual
Report of its subsidiary companies, free of cost, as required under
Section 212 of the Act to members on their written request to
the Company Secretary at the registered office of the Company.
These documents will also be available for inspection by any
shareholder at the registered office of your Company on any
working day during business hours. The Consolidated Financial
Statements presented by the Company include the financial
results of its subsidiary companies.
A statement pursuant to section 212 of the Companies Act,
1956, containing details of subsidiaries of the Company also
forms part of this Annual Report.
directorsMr. Rohan Talwar, Director of the Company, is due for retirement
by rotation at the ensuing Annual General Meeting and, being
eligible, offer himself for re-appointment. Brief resume of Mr.
Rohan Talwar, the nature of his expertise in specific functional
areas and the names of the companies in which he holds
directorships as stipulated in Clause 49 of the Listing agreement
is provided in the report on Corporate Governance annexed to
the Annual Report.
Corporate GovernancePursuant to Clause 49 of the Listing Agreement with the Stock
Exchanges, a detailed report on Corporate Governance forms
a part of this Annual Report. A certificate from the auditors of
the Company confirming their compliance with the conditions
of Corporate Governance as stipulated under Clause 49 of the
Listing Agreement is attached to this Report.
management discussion and AnalysisManagement Discussion and Analysis on matters related to
business performance, as stipulated in Clause 49 of the Listing
Agreement with the Stock Exchanges, is given in a separate
statement which forms part of the Annual Report.
PersonnelRelationships with employees continued to be cordial. The HR
policies of your Company were focused on the development
potential of each employee. With this premise, a comprehensive
set of HR policies were laid down, aiming to attract, retain
and motivate employees at all levels. Information required
under Section 217(2A) of the Companies Act, 1956, read with
Companies (Particulars of Employees) Rules, 1975 as amended,
is provided in the Annexure forming part of the Directors’
Report. In terms of Section 219(1)(b)(iv) of the Act, the Report
and Accounts are being sent to the shareholders excluding the
aforesaid Annexure. Any shareholder interested in obtaining a
copy of the same may write to the Company Secretary at the
Registered/Corporate Office of the Company.
Transfer to Investor education and Protection Fund (IePF)The Company has, during the year under review, transferred
a sum of Rs .272,852/- to Investor Education and Protection
Fund, in compliance with the provisions of Section 205C of the
Companies Act, 1956. The said amount represents application
money due for refund which remained unpaid/ unclaimed by the
shareholders of the Company for a period of 7 years from its
due date of payment.
Cost AuditorThe Cost Audit Branch of Government of India, Ministry of
Corporate Affairs (MCA), New Delhi, vide Cost Order No.
52/26/CAB‐2010 dated November 6, 2012 have issued industry
wise Orders for appointment of Cost Auditors from FY
NIT
CO
Lim
ited
Ann
ual R
epor
t 20
12-1
3
32 33
Particulars as per the Companies
(Disclosure of particulars in the
report of the Board of Directors)
Rules, 1988.
A) Conservation of energy:The Company’s manufacturing
operations are energy intensive.
The concern for more efficient
utilization and conservation of
energy has remained not only in
the domain of the top management
but has also percolated to the shop
floor. Continuous improvements in
the manufacturing processes and
practices are carried out with one of
the objectives of energy conservation.
The Company has installed a 5.5 MW
captive power plant. The waste heat
generated from this captive power
plant is used in spray driers resulting
in a daily savings of RLNG.
B) Technology Absorption:The state of the art Marble processing
plant commenced operations
during financial year 2011-12. Major
equipments have been imported from
leading equipment manufacturers like
Breton (Italy), Omis (Italy), Fraccarole
E Balzan SPA (Italy) and Matec (Italy).
The Company’s technicians have been
imparted training in maintenance
of this equipment by supplier’s
technicians. Technology has been fully
absorbed.
C) Foreign exchange earnings and outgo:The information on foreign exchange
earnings and outgo is furnished in the
Notes to the Accounts.
For and on behalf of the Board
Sd/- Sd/-
Date: 30th May, 2013 Vivek Talwar Vishal malikPlace: Mumbai Managing Director Director
Annexure to Director’s report
2013-14 onwards for companies engaged in the manufacturing of
Ceramic and Marble products. The provisions of The Companies
(Cost Accounting Records) Rules, 2011 shall be applicable to all
the products/activities of the Company and pursuant to the same
the Board of Directors of the Company has appointed M/s. R. K.
Bhandari & Co. Cost Accountants, Jaipur, as the “Cost Auditor”
and “Cost Accountant” under Section 233B and Section 209(1)
(d) of the Companies Act, 1956 for the Financial year 2013-14.
Corporate Social ResponsibilityToday’s business environment demands that corporate play a
pivotal role in shouldering social responsibility. You will be happy
to note that in the year under review your Company executed
several Corporate Social Responsibility (CSR) programmes for
the benefit of the communities where your Company operates.
Your Company contributed actively towards community welfare
measures, taking several initiatives related to education, health,
environmental improvement and other development measures
such as:
Regular medical check up
Blood donation camps
Tree plantation programmes on World Environment Day and
Earth Day to promote awareness about the effect of climate
change and importance of environment protection
Conducting Safety Awareness programmes regularly
Support to sports activities including local sports championships
for kabaddi and cricket.
First aid centre at manufacturing facility
Occupational Health centre at manufacturing facility
Donations to local temples for their renovation
Conservation of energy, Technology Absorption and Foreign exchange earnings/Outgo The information required under Section 217(1)(e) of the
Companies Act, 1956, read with the Companies (Disclosure of
Particulars in the Report of Board of Directors) Rules, 1988, with
respect to conservation of energy, technology absorption and
foreign exchange earnings/outgo is given in Annexure A, which
forms part of this Report.
Risk and ConcernChanges in macro economic factors like inflation, energy cost,
interest rate, world trade, exchange rate, etc. also play an
important role in our industry thereby affecting the operations
of business. Any adverse change in the above may affect the
performance of your Company. Your Company periodically
reviews the risk associated with the business and takes steps to
mitigate and minimise the impact of risk.
Quality Safety and environmentYour Company, in order to ensure highest standard of safety,
has implemented and initiated various measures with respect
to Quality, Safety and Environment Management Systems. The
initiatives by your Company have been rewarded with several
recognitions.
Internal control frameworkYour Company conducts its business with integrity and high
standards of ethical behavior and in compliance with the laws
and regulations that govern its business. Your Company has a well
established framework of internal controls in operation, including
suitable monitoring procedures. In addition to the external audit,
the financial and operating controls of your Company at various
locations are reviewed by Internal Auditors, who report their
observations to the Audit Committee of the Board.
Auditors’ ReportThe Board has duly examined the statutory auditor’s report
to accounts and clarifications, wherever necessary, have been
included in the Notes to Accounts section of the Annual Report.
AuditorsThe present auditors of the Company, M/s. A. Husein Noumanali
& Co., Chartered Accountants, retire at the conclusion of the
Annual General Meeting and being eligible, offer themselves
for re-appointment. Your Directors recommend their
re-appointment.
Appreciation and acknowledgementYour Directors acknowledges with gratitude and wish to
place on record, their deep appreciation of continued support
and co-operation received by the Company from the various
Government authorities, Shareholders, Bankers, Lenders,
Business Associates, Dealers, Customers, Financial Institutions and
Investors during the year.
NIT
CO
Lim
ited
Ann
ual R
epor
t 20
12-1
3
34 35
mr. Pradeep Saxena, aged 65 years, joined the Company
as Director in the Board Meeting held on 3rd May, 2012. His
career spans thirty years in International Banking and five
years in Information Technology. He was President of e-Funds
International from 2000 to 2003. Earlier he was Managing
Director and CEO, South Asia Region of ING Barings and
Executive Director with Merrill Lynch International. Starting his
career with Grindlays Bank, he has worked in senior management
positions for the Gulf International Bank, the American Express
Bank, and Grindlays Bank in the US, UK, Europe, the Gulf and India.
Mr. Saxena is a Consultant and Specialist Advisor engaged primarily
with SMEs and Start-ups for advice on Corporate Strategy and
Management and Business Development. Among his assignments,
he serves as the Executive Director of The Indian Institute for
Human Settlements (IIHS), a prospective independent national
University for innovation, initiative which has been established by
a group of publically-minded citizens. He has a Bachelor’s Degree
in Economics and a Master’s in Management Sciences, from the
University of Bombay. He is a Fellow of the Institute of Financial
Services, London.
mr. Vishal malik, aged 41 years, has been appointed as the
Director of the Company at its Board Meeting held on 3rd May,
2012. He has over 18 years of experience in the Investment
Banking industry, having done extensive work in the areas
of M&A, private equity and real estate financing. He formerly
worked in the Treasury of Reliance Industries and was a part
of the founding team of Stratcap Securities India Pvt ltd, a full
service investment bank. He is currently the Managing Partner
of Knox Capital Advisors, a boutique investment bank focusing
on financing in the SME segment. Vishal is an MBA from Asian
Institute of Management, Manila and a Chemical Engineer from
Mumbai University.
mr. Rohan Talwar, aged 28 years, has been appointed as a Non
Executive Director of the Company at its Board Meeting held
on 3rd May, 2012. He is the son of Mr. Vivek Talwar, the Managing
Director of the Company. He has completed his Bachelor’s in
Business Administration from Carnegie Mellon University, USA.
He is currently looking after his business in the hospitality sector.
He is not involved in the business of the Company. He retires by
rotation and is eligible for reappointment at the ensuing Annual
General Meeting. He is a Director in the following Companies:
Sr. No.
Name of the Companies / Firms
Nature of Interest
1. IB Hospitality Private Limited Director
2. Digital Symphony Private Limited Director
3. Strongbase Properties Private
Limited
Director
4. Firstlife Properties Private Limited Director
5. Watco Engineering Company Private
Limited
Director
6. Watco Trading Private Limited Director
7. Watco Chennai Real Estates Private
Limited
Director
8. Watco Hyderabad Properties Private
Limited
Director
9. Guest Infraprojects Private Limited Director
2. Board procedureTo follow transparency, the Board follows the procedure of
planning in advance, the matters requiring discussions/decisions
by the Board. The Board is given presentations on finance, sales,
marketing, major business segments and operations of the
Company and other matters, as members want. The Managing
Director along with the Company Secretary finalises the
agenda papers for the Board meeting in consultation with other
persons concerned. The agenda folder is sent to each Director in
advance of the meetings. The minutes of the proceedings of each
Board meeting are maintained in terms of statutory provisions.
Meetings of various Committees are held properly. The minutes
of Committees and Board meetings of subsidiary companies are
placed regularly before the Board for its review.
3. directorships and attendanceYour Company had four Directors as on 31st March, 2013.
The names and categories of the Directors on the Board,
their attendance at Board meetings held during the year and
the number of directorships and committee chairmanships/
memberships held by them in other companies is given below.
Corporate Governance pertains to the system by which
companies are directed and controlled, keeping in mind the
long-term interests of stakeholders. It refers to the blend of law,
regulations and voluntary practices, which enable the Company
to attract financial and human capital, perform efficiently and
thereby perpetually generate long-term economic value for its
shareholders, while respecting and balancing the interests of
other stakeholders and society as a whole.
It aims to align the interest of the Company with that of its
shareholders and other key stakeholders. The incentive for
companies, and for those who own and manage them, to adopt
global governance standards which will help them achieve a
long-term partnership with their stakeholders and achieve their
corporate objectives efficiently. The principal characteristics
of Corporate Governance are transparency, independence,
accountability, fairness and social responsibility.
In sum, Corporate Governance focuses on the treatment of all
shareholders and reinforces the belief among the shareholders
that it is “Your Company” as it belongs to them. The Chairman
and Board of Directors are the shareholders’ fiduciaries and
trustees pushing the business forward and maximising long-term
value for them.
A good governance process provides transparency of corporate
policies, strategies and the decision-making process and also
strengthens internal control systems and helps in building
relationships with all stakeholders. We at NITCO believe in
being transparent and commit ourselves to adherence to good
Corporate Governance practices at all times, as we believe that
good governance generates goodwill among business partners,
customers and investors and helps the Company grow.
A. Board of directors 1. Composition of the Board and a brief profile of directors
The Board of Nitco consists of two Independent Directors,
which together constitute 50% of the total number of Board of
Directors.
The composition of the Board of Directors is in conformity with
Clause 49 of the Listing Agreement.
The day-to-day management of the Company is conducted by
the Managing Director.
mr. Vivek Talwar, son of Late Mr. Pran Nath Talwar and aged
56 years, is the Managing Director of your Company. He holds a
Bachelor’s Degree in Science and has a rich experience of over
30 years in the tile industry. He joined the Company as a Director
in 1980. The operational responsibility and day-to-day functioning
of the Company were gradually handed over to him. He was
instrumental in setting up a plant at Alibaug to manufacture
ceramic floor tiles and also in diversifying the business of the
Company by entering into new activities such as marketing of
imported marble, vitrified tiles and cement in India. Mr. Vivek
Talwar holds 63,23,669 equity shares in the Company.
report on Corporate Governance
NIT
CO
Lim
ited
Ann
ual R
epor
t 20
12-1
3
36 37
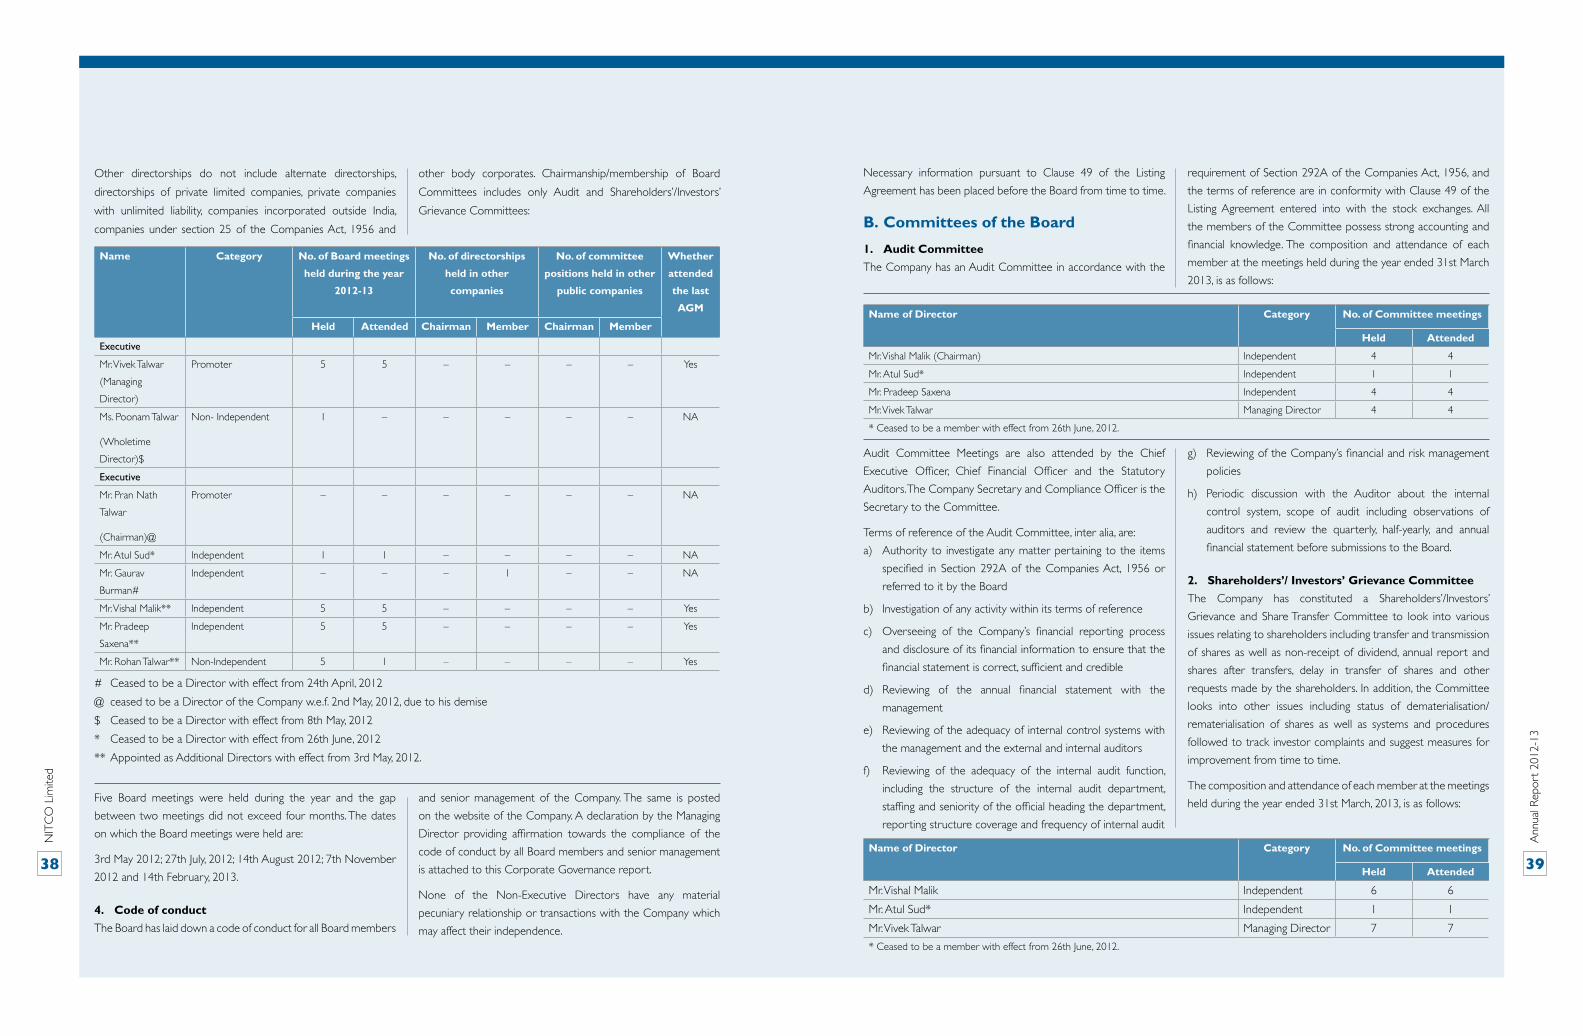
Other directorships do not include alternate directorships,
directorships of private limited companies, private companies
with unlimited liability, companies incorporated outside India,
companies under section 25 of the Companies Act, 1956 and
other body corporates. Chairmanship/membership of Board
Committees includes only Audit and Shareholders’/Investors’
Grievance Committees:
Five Board meetings were held during the year and the gap
between two meetings did not exceed four months. The dates
on which the Board meetings were held are:
3rd May 2012; 27th July, 2012; 14th August 2012; 7th November
2012 and 14th February, 2013.
4. Code of conductThe Board has laid down a code of conduct for all Board members
and senior management of the Company. The same is posted
on the website of the Company. A declaration by the Managing
Director providing affirmation towards the compliance of the
code of conduct by all Board members and senior management
is attached to this Corporate Governance report.
None of the Non-Executive Directors have any material
pecuniary relationship or transactions with the Company which
may affect their independence.
Necessary information pursuant to Clause 49 of the Listing
Agreement has been placed before the Board from time to time.
B. Committees of the Board
1. Audit Committee The Company has an Audit Committee in accordance with the
requirement of Section 292A of the Companies Act, 1956, and
the terms of reference are in conformity with Clause 49 of the
Listing Agreement entered into with the stock exchanges. All
the members of the Committee possess strong accounting and
financial knowledge. The composition and attendance of each
member at the meetings held during the year ended 31st March
2013, is as follows:
Audit Committee Meetings are also attended by the Chief
Executive Officer, Chief Financial Officer and the Statutory
Auditors. The Company Secretary and Compliance Officer is the
Secretary to the Committee.
Terms of reference of the Audit Committee, inter alia, are:
a) Authority to investigate any matter pertaining to the items
specified in Section 292A of the Companies Act, 1956 or
referred to it by the Board
b) Investigation of any activity within its terms of reference
c) Overseeing of the Company’s financial reporting process
and disclosure of its financial information to ensure that the
financial statement is correct, sufficient and credible
d) Reviewing of the annual financial statement with the
management
e) Reviewing of the adequacy of internal control systems with
the management and the external and internal auditors
f) Reviewing of the adequacy of the internal audit function,
including the structure of the internal audit department,
staffing and seniority of the official heading the department,
reporting structure coverage and frequency of internal audit
g) Reviewing of the Company’s financial and risk management
policies
h) Periodic discussion with the Auditor about the internal
control system, scope of audit including observations of
auditors and review the quarterly, half-yearly, and annual
financial statement before submissions to the Board.
2. Shareholders’/ Investors’ Grievance Committee The Company has constituted a Shareholders’/Investors’
Grievance and Share Transfer Committee to look into various
issues relating to shareholders including transfer and transmission
of shares as well as non-receipt of dividend, annual report and
shares after transfers, delay in transfer of shares and other
requests made by the shareholders. In addition, the Committee
looks into other issues including status of dematerialisation/
rematerialisation of shares as well as systems and procedures
followed to track investor complaints and suggest measures for
improvement from time to time.
The composition and attendance of each member at the meetings
held during the year ended 31st March, 2013, is as follows:
Name Category No. of Board meetings
held during the year
2012-13
No. of directorships
held in other
companies
No. of committee
positions held in other
public companies
Whether
attended
the last
AGm
Held Attended Chairman member Chairman member
Executive
Mr. Vivek Talwar
(Managing
Director)
Promoter 5 5 – – – – Yes
Ms. Poonam Talwar
(Wholetime
Director)$
Non- Independent 1 – – – – – NA
Executive
Mr. Pran Nath
Talwar
(Chairman)@
Promoter – – – – – – NA
Mr. Atul Sud* Independent 1 1 – – – – NA
Mr. Gaurav
Burman#
Independent – – – 1 – – NA
Mr. Vishal Malik** Independent 5 5 – – – – Yes
Mr. Pradeep
Saxena**
Independent 5 5 – – – – Yes
Mr. Rohan Talwar** Non-Independent 5 1 – – – – Yes
Name of director Category No. of Committee meetings
Held Attended
Mr. Vishal Malik (Chairman) Independent 4 4
Mr. Atul Sud* Independent 1 1
Mr. Pradeep Saxena Independent 4 4
Mr. Vivek Talwar Managing Director 4 4
* Ceased to be a member with effect from 26th June, 2012.
Name of director Category No. of Committee meetings
Held Attended
Mr. Vishal Malik Independent 6 6
Mr. Atul Sud* Independent 1 1
Mr. Vivek Talwar Managing Director 7 7
* Ceased to be a member with effect from 26th June, 2012.
# Ceased to be a Director with effect from 24th April, 2012
@ ceased to be a Director of the Company w.e.f. 2nd May, 2012, due to his demise
$ Ceased to be a Director with effect from 8th May, 2012
* Ceased to be a Director with effect from 26th June, 2012
** Appointed as Additional Directors with effect from 3rd May, 2012.
NIT
CO
Lim
ited
Ann
ual R
epor
t 20
12-1
3
38 39
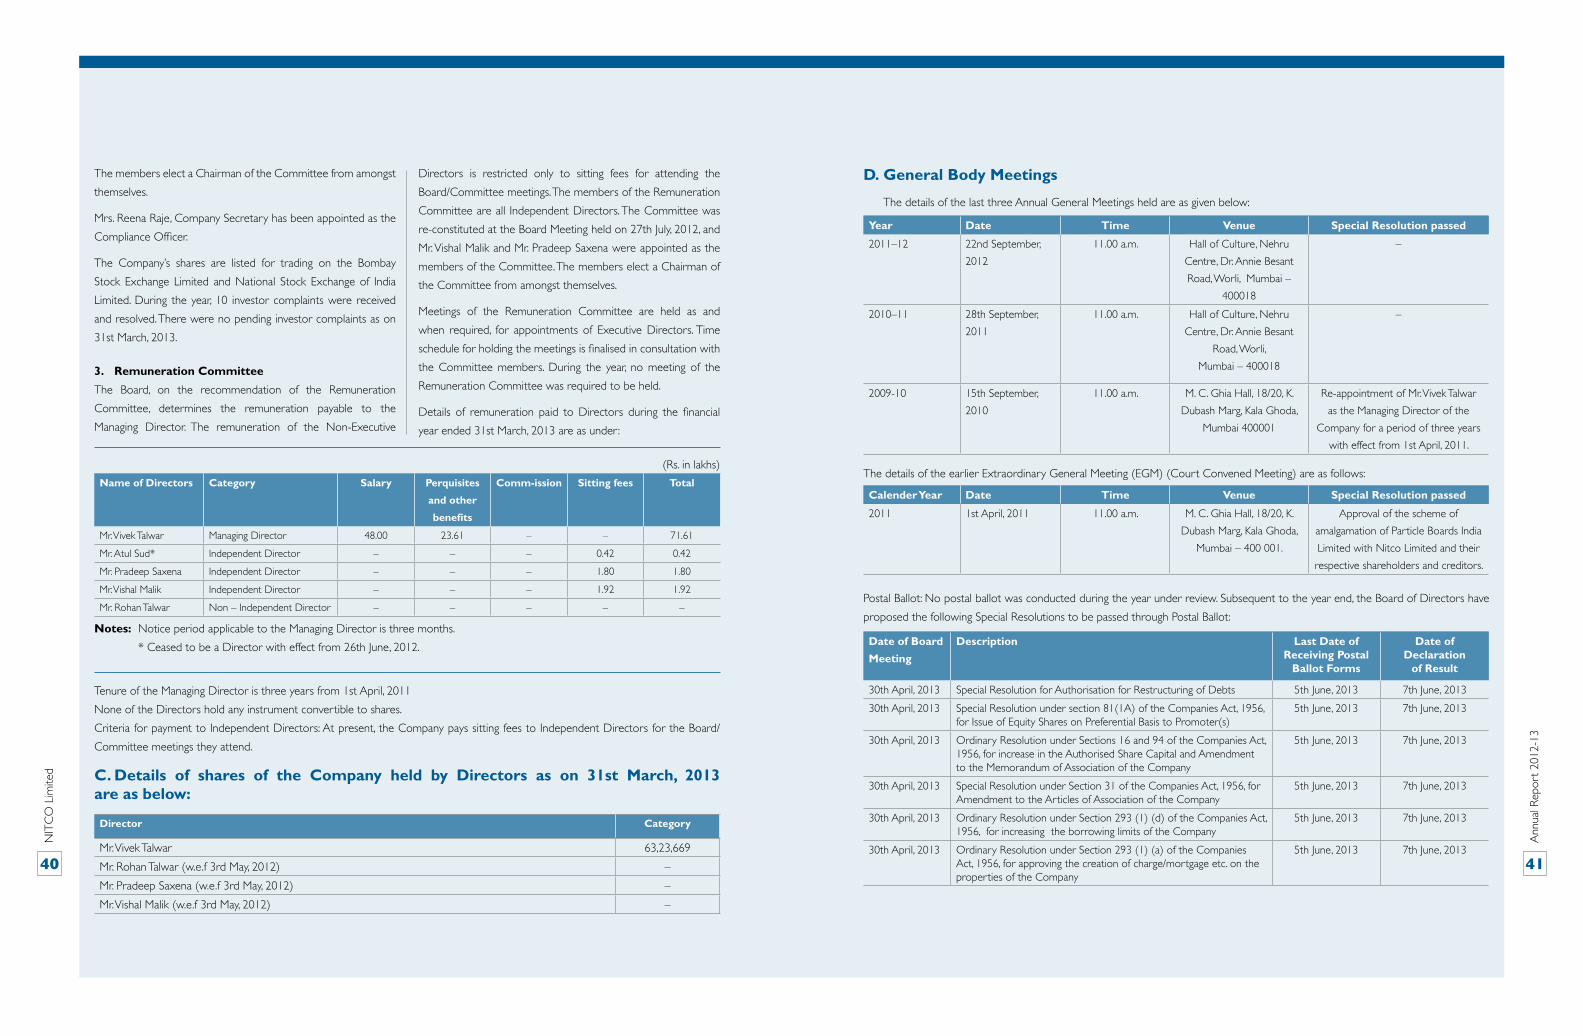
The members elect a Chairman of the Committee from amongst
themselves.
Mrs. Reena Raje, Company Secretary has been appointed as the
Compliance Officer.
The Company’s shares are listed for trading on the Bombay
Stock Exchange Limited and National Stock Exchange of India
Limited. During the year, 10 investor complaints were received
and resolved. There were no pending investor complaints as on
31st March, 2013.
3. Remuneration CommitteeThe Board, on the recommendation of the Remuneration
Committee, determines the remuneration payable to the
Managing Director. The remuneration of the Non-Executive
Directors is restricted only to sitting fees for attending the
Board/Committee meetings. The members of the Remuneration
Committee are all Independent Directors. The Committee was
re-constituted at the Board Meeting held on 27th July, 2012, and
Mr. Vishal Malik and Mr. Pradeep Saxena were appointed as the
members of the Committee. The members elect a Chairman of
the Committee from amongst themselves.
Meetings of the Remuneration Committee are held as and
when required, for appointments of Executive Directors. Time
schedule for holding the meetings is finalised in consultation with
the Committee members. During the year, no meeting of the
Remuneration Committee was required to be held.
Details of remuneration paid to Directors during the financial
year ended 31st March, 2013 are as under:
Year date Time Venue Special Resolution passed
2011–12 22nd September,
2012
11.00 a.m. Hall of Culture, Nehru
Centre, Dr. Annie Besant
Road, Worli, Mumbai –
400018
–
2010–11 28th September,
2011
11.00 a.m. Hall of Culture, Nehru
Centre, Dr. Annie Besant
Road, Worli,
Mumbai – 400018
–
2009-10 15th September,
2010
11.00 a.m. M. C. Ghia Hall, 18/20, K.
Dubash Marg, Kala Ghoda,
Mumbai 400001
Re-appointment of Mr. Vivek Talwar
as the Managing Director of the
Company for a period of three years
with effect from 1st April, 2011.
Tenure of the Managing Director is three years from 1st April, 2011
None of the Directors hold any instrument convertible to shares.
Criteria for payment to Independent Directors: At present, the Company pays sitting fees to Independent Directors for the Board/
Committee meetings they attend.
C. details of shares of the Company held by directors as on 31st march, 2013 are as below:
d. General Body meetings
The details of the last three Annual General Meetings held are as given below:
Calender Year date Time Venue Special Resolution passed
2011 1st April, 2011 11.00 a.m. M. C. Ghia Hall, 18/20, K.
Dubash Marg, Kala Ghoda,
Mumbai – 400 001.
Approval of the scheme of
amalgamation of Particle Boards India
Limited with Nitco Limited and their
respective shareholders and creditors.
The details of the earlier Extraordinary General Meeting (EGM) (Court Convened Meeting) are as follows:
date of Board meeting
description Last date of Receiving Postal
Ballot Forms
date of declaration
of Result
30th April, 2013 Special Resolution for Authorisation for Restructuring of Debts 5th June, 2013 7th June, 2013
30th April, 2013 Special Resolution under section 81(1A) of the Companies Act, 1956, for Issue of Equity Shares on Preferential Basis to Promoter(s)
5th June, 2013 7th June, 2013
30th April, 2013 Ordinary Resolution under Sections 16 and 94 of the Companies Act, 1956, for increase in the Authorised Share Capital and Amendment to the Memorandum of Association of the Company
5th June, 2013 7th June, 2013
30th April, 2013 Special Resolution under Section 31 of the Companies Act, 1956, for Amendment to the Articles of Association of the Company
5th June, 2013 7th June, 2013
30th April, 2013 Ordinary Resolution under Section 293 (1) (d) of the Companies Act, 1956, for increasing the borrowing limits of the Company
5th June, 2013 7th June, 2013
30th April, 2013 Ordinary Resolution under Section 293 (1) (a) of the Companies Act, 1956, for approving the creation of charge/mortgage etc. on the properties of the Company
5th June, 2013 7th June, 2013
Postal Ballot: No postal ballot was conducted during the year under review. Subsequent to the year end, the Board of Directors have
proposed the following Special Resolutions to be passed through Postal Ballot:
director Category
Mr. Vivek Talwar 63,23,669
Mr. Rohan Talwar (w.e.f 3rd May, 2012) –
Mr. Pradeep Saxena (w.e.f 3rd May, 2012) –
Mr. Vishal Malik (w.e.f 3rd May, 2012) –
Name of directors Category Salary Perquisites
and other
benefits
Comm-ission Sitting fees Total
Mr. Vivek Talwar Managing Director 48.00 23.61 – – 71.61
Mr. Atul Sud* Independent Director – – – 0.42 0.42
Mr. Pradeep Saxena Independent Director – – – 1.80 1.80
Mr. Vishal Malik Independent Director – – – 1.92 1.92
Mr. Rohan Talwar Non – Independent Director – – – – –
Notes: Notice period applicable to the Managing Director is three months.
* Ceased to be a Director with effect from 26th June, 2012.
(Rs. in lakhs)
NIT
CO
Lim
ited
Ann
ual R
epor
t 20
12-1
3
40 41

Mr. Nilesh Shah, Practicing Company Secretary, acted as a
Scrutiniser for conducting the Postal Ballot process in a fair and
transparent manner.
The procedure of the Postal Ballot is as per section 192A of the
Companies Act, 1956 and Companies (Passing of the Resolution
by Postal Ballot) Rules, 2011.
e. Subsidiary companiesThe Clause 49 of the Listing Agreement defines a “material non
- listed Indian subsidiary” as an unlisted subsidiary, incorporated
in India, whose turnover or net worth (i.e. paid-up capital and
free reserves) exceeds 20% of the consolidated turnover or
net worth respectively, of the listed holding company and its
subsidiaries in the immediately preceding accounting year.
Under this definition, the Company does not have any “material
non- listed Indian subsidiary” during the year under review. The
Audit Committee reviews the financial statements and the
working of the unlisted subsidiary companies.
F. disclosuresa) Related-party transactions are disclosed in the Notes to
Accounts in the financial statements as on 31st March, 2013.
However the Company did not have any related-party
transactions, which may have potential conflict with the
interests of the Company at large.
b) The Company complied with all the provisions of the Listing
Agreement entered into with the stock exchanges as well
as SEBI regulations and guidelines, wherever applicable. No
penalties have been imposed or strictures issued by SEBI,
the stock exchanges or any statutory authority on matters
relating to capital markets in the last three years.
c) The Company complied with non-mandatory requirements
relating to the Remuneration Committee and that the
financial statements of the Company are unqualified.
d) A qualified Practicing Company Secretary carried out a
secretarial audit to reconcile the total admitted capital with
National Securities Depository Limited (NSDL) and Central
Depository Services (India) Limited (CDSL), total issued and
listed capital. The secretarial audit report, provided quarterly,
confirms that the total issued/paid up capital is in agreement
with the total number of shares in physical form and number
of dematerialised shares held with NSDL and CDSL.
e) In compliance with the SEBI’s regulations on prevention of
insider trading, the Company has instituted a comprehensive
code of conduct for the prevention of insider trading for
its Directors, officers and designated employees. The code
lays down guidelines which advise them on the procedures
to be followed and disclosures to be made, while dealing
with the shares of the Company and cautioning them of the
consequences of violations.
G. Risk managementYour Company has a well-defined risk management framework
in place. The risk management framework adopted by the
Company is discussed in detail in the management discussion and
analysis chapter of this annual report. Your Company established
procedures for minimising the risk and steps are taken by it for
mitigating the risk.
H. means of communication The quarterly and half-yearly results of the Company are
published within 48 hours in one English language and One
Marathi newspaper with wide circulation. The results, press
releases and the shareholding pattern of the Company are
displayed on the Company’s website www.nitco.in from time
to time. Presentations, if any, made to institutional investors
and analysts after the declaration of quarterly, half-yearly and
annual results are also displayed on the Company’s website.
The Company also informs, by way of intimation, to the stock
exchanges all price-sensitive matters or such other matters
which in its opinion are material and relevant to shareholders.
All data/reports required to be filed with the stock exchanges
have been regularly filed with them.
management discussion and analysis: A report on
management discussion and analysis is appended and forms
part of this annual report.
NSe electronic Application Processing System (NeAPS): The NEAPS is a web based application designed
by NSE for Corporates. All periodical compliance filings
like shareholding pattern, corporate governance report,
announcements, etc. are filed electronically on NEAPS.
SeBI Complaints Redress System (SCOReS): The
investor complaints are processed in a centralised web based
complaints redress system.
The salient features of this system are: Centralised database of all
complaints, online upload of Action Taken Reports (ATRs) by the
concerned companies and online viewing by investors of actions
taken on the complaint and its current status.
I. Shareholders’ information a) The Annual General Meeting is scheduled to be held on
Monday the 30th Day of September 2013 at 11.00 am
at Hall of Culture, Nehru Centre, Dr. Annie Besant Road,
Worli, Mumbai - 400 018.
b) Financial year: The Company follows April-March as its
financial year.
c) Date of book closure: 23rd September, 2013 to 30th
September, 2013 (both days inclusive).
d) Dividend Payment Date: Not Applicable.
e) Listing on stock exchanges: The Company’s equity shares
are listed on the National Stock Exchange of India Limited
and Bombay Stock Exchange Limited. The Company has
paid listing fees to the stock exchanges for the financial year
2013-14.
f) Stock code/symbol
BSE - 532722
NSE - NITCO
Demat International Security Identification
Number in NSDL and CDSL for equity
shares - ISIN - INE858F01012.
g) Market price data: The monthly high and low price of shares traded on the Bombay Stock Exchange Ltd. and the National Stock
Exchange of India Ltd. are as follows:
month BSe NSe
High Low High Low
April ‘12 45.65 38.00 44.80 37.75
May ‘ 12 40.50 26.50 40.55 26.20
June ‘12 28.70 24.50 28.60 24.20
July ‘12 33.65 23.65 34.95 24.10
August ‘12 26.80 18.60 26.60 18.75
September ‘12 25.40 18.50 25.50 18.85
October ‘12 27.70 21.70 28.50 21.75
November ‘12 28.25 23.45 28.30 23.10
December ‘12 25.75 22.40 26.00 21.70
January ‘13 24.10 19.95 25.90 20.00
February ‘13 22.60 16.15 22.65 16.45
March ‘13 17.00 11.45 17.05 11.50
(in Rs.)
NIT
CO
Lim
ited
Ann
ual R
epor
t 20
12-1
3
42 43
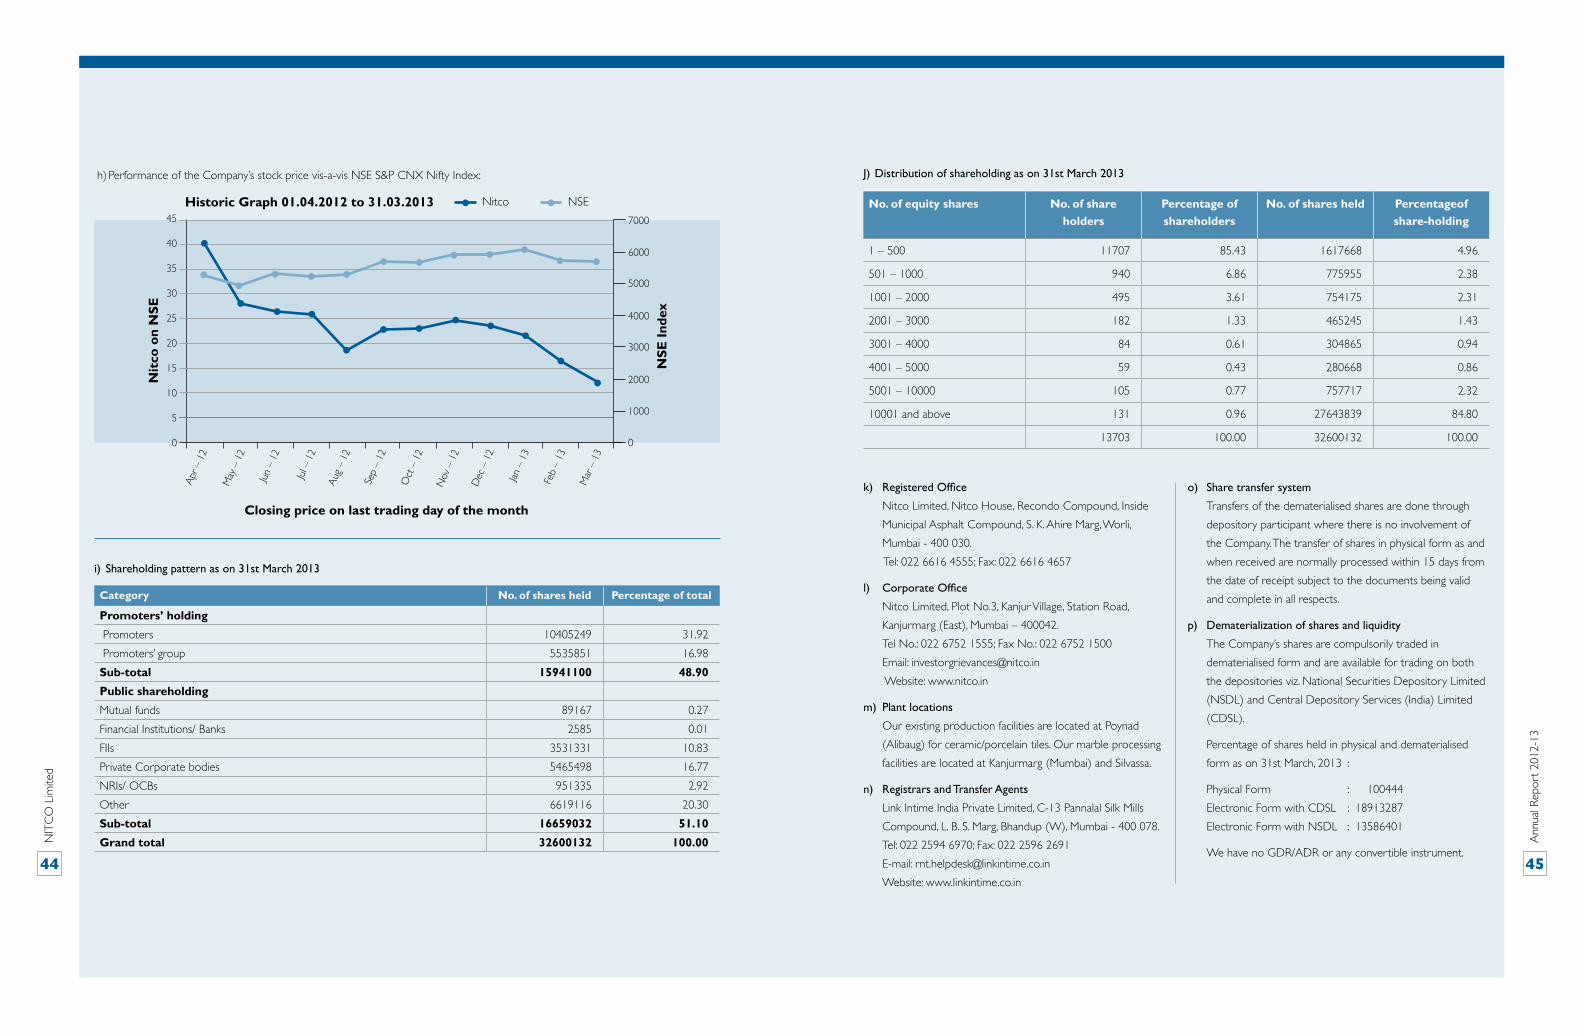
h) Performance of the Company’s stock price vis-a-vis NSE S&P CNX Nifty Index:
i) Shareholding pattern as on 31st March 2013
Closing price on last trading day of the month
0
5
10
15
20
25
30
35
40
45
0
1000
2000
3000
4000
5000
6000
7000
Historic Graph 01.04.2012 to 31.03.2013
Nit
co o
n N
Se
NSe
Inde
x
Apr
– 1
2
May
– 1
2
Jun
– 12
Jul –
12
Aug
– 1
2
Sep
– 12
Oct
– 1
2
Nov
– 1
2
Dec
– 1
2
Jan –
13
Feb
– 13
Mar
– 1
3
Nitco NSE
Category No. of shares held Percentage of total
Promoters’ holding
Promoters 10405249 31.92
Promoters’ group 5535851 16.98
Sub-total 15941100 48.90
Public shareholding
Mutual funds 89167 0.27
Financial Institutions/ Banks 2585 0.01
FIIs 3531331 10.83
Private Corporate bodies 5465498 16.77
NRIs/ OCBs 951335 2.92
Other 6619116 20.30
Sub-total 16659032 51.10
Grand total 32600132 100.00
J) Distribution of shareholding as on 31st March 2013
No. of equity shares No. of share holders
Percentage of shareholders
No. of shares held Percentageof share-holding
1 – 500 11707 85.43 1617668 4.96
501 – 1000 940 6.86 775955 2.38
1001 – 2000 495 3.61 754175 2.31
2001 – 3000 182 1.33 465245 1.43
3001 – 4000 84 0.61 304865 0.94
4001 – 5000 59 0.43 280668 0.86
5001 – 10000 105 0.77 757717 2.32
10001 and above 131 0.96 27643839 84.80
13703 100.00 32600132 100.00
k) Registered Office
Nitco Limited, Nitco House, Recondo Compound, Inside
Municipal Asphalt Compound, S. K. Ahire Marg, Worli,
Mumbai - 400 030.
Tel: 022 6616 4555; Fax: 022 6616 4657
l) Corporate Office
Nitco Limited, Plot No.3, Kanjur Village, Station Road,
Kanjurmarg (East), Mumbai – 400042.
Tel No.: 022 6752 1555; Fax No.: 022 6752 1500
Email: [email protected]
Website: www.nitco.in
m) Plant locations
Our existing production facilities are located at Poynad
(Alibaug) for ceramic/porcelain tiles. Our marble processing
facilities are located at Kanjurmarg (Mumbai) and Silvassa.
n) Registrars and Transfer Agents
Link Intime India Private Limited, C-13 Pannalal Silk Mills
Compound, L. B. S. Marg, Bhandup (W), Mumbai - 400 078.
Tel: 022 2594 6970; Fax: 022 2596 2691
E-mail: [email protected]
Website: www.linkintime.co.in
o) Share transfer system
Transfers of the dematerialised shares are done through
depository participant where there is no involvement of
the Company. The transfer of shares in physical form as and
when received are normally processed within 15 days from
the date of receipt subject to the documents being valid
and complete in all respects.
p) Dematerialization of shares and liquidity
The Company’s shares are compulsorily traded in
dematerialised form and are available for trading on both
the depositories viz. National Securities Depository Limited
(NSDL) and Central Depository Services (India) Limited
(CDSL).
Percentage of shares held in physical and dematerialised
form as on 31st March, 2013 :
Physical Form : 100444
Electronic Form with CDSL : 18913287
Electronic Form with NSDL : 13586401
We have no GDR/ADR or any convertible instrument.
NIT
CO
Lim
ited
Ann
ual R
epor
t 20
12-1
3
44 45
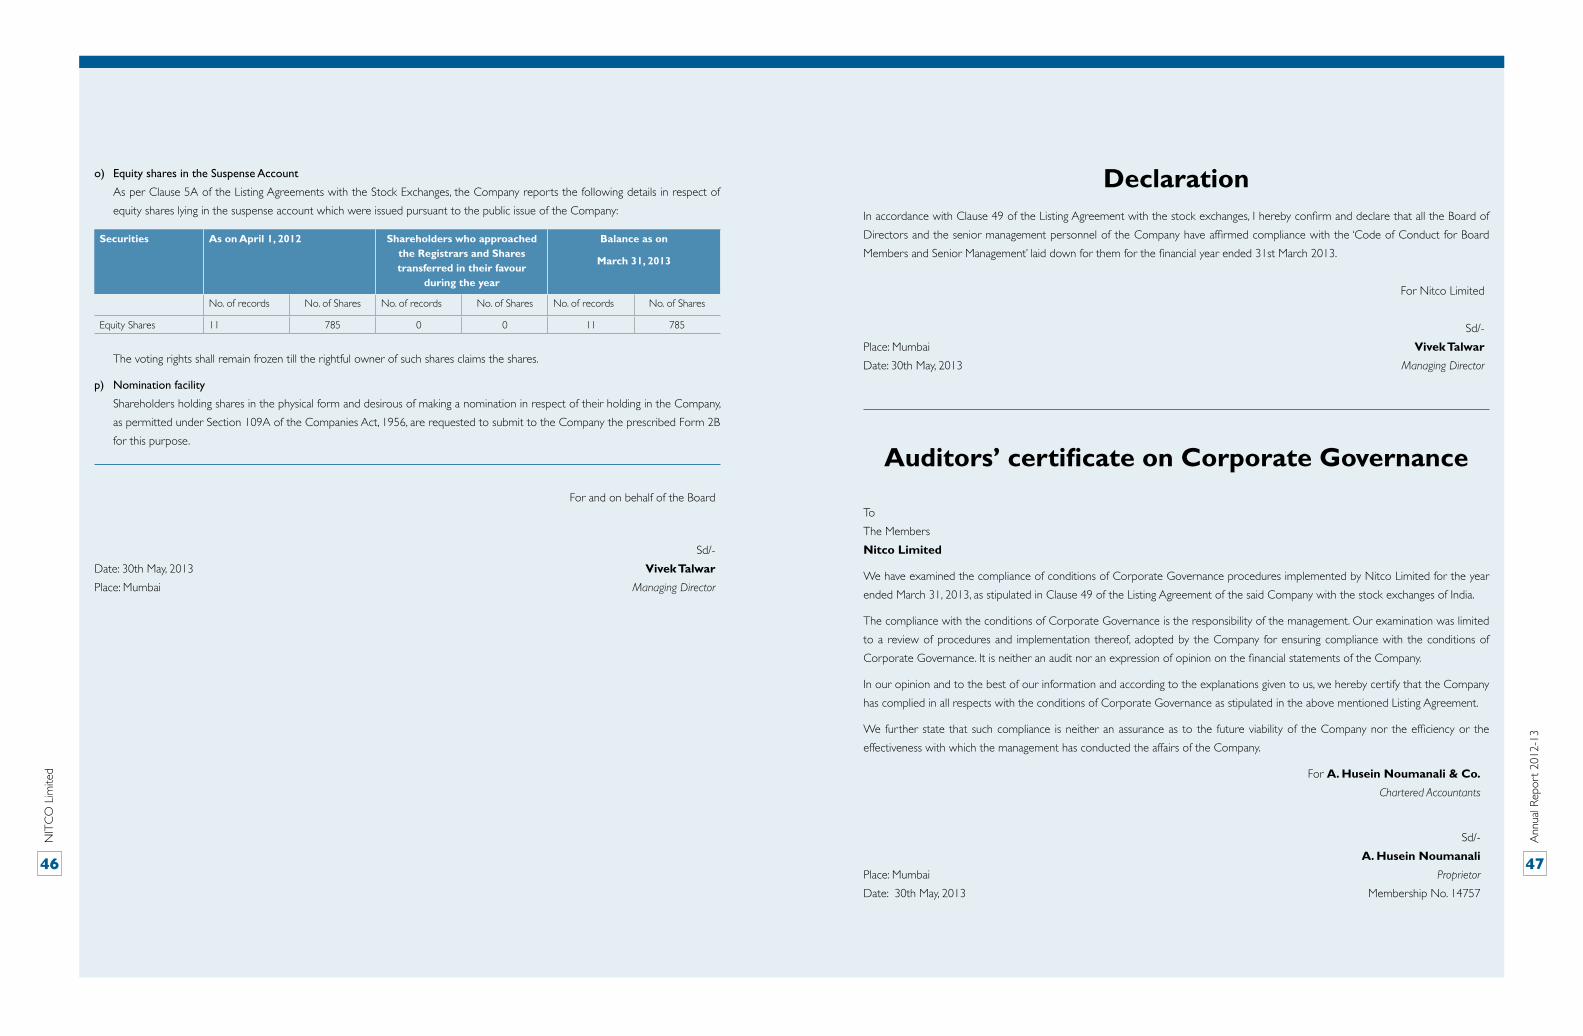
o) Equity shares in the Suspense Account
As per Clause 5A of the Listing Agreements with the Stock Exchanges, the Company reports the following details in respect of
equity shares lying in the suspense account which were issued pursuant to the public issue of the Company:
declaration
Auditors’ certificate on Corporate Governance
The voting rights shall remain frozen till the rightful owner of such shares claims the shares.
p) Nomination facility
Shareholders holding shares in the physical form and desirous of making a nomination in respect of their holding in the Company,
as permitted under Section 109A of the Companies Act, 1956, are requested to submit to the Company the prescribed Form 2B
for this purpose.
For and on behalf of the Board
Sd/-
Date: 30th May, 2013 Vivek Talwar Place: Mumbai Managing Director
Securities As on April 1, 2012 Shareholders who approached the Registrars and Shares transferred in their favour
during the year
Balance as on
march 31, 2013
No. of records No. of Shares No. of records No. of Shares No. of records No. of Shares
Equity Shares 11 785 0 0 11 785
In accordance with Clause 49 of the Listing Agreement with the stock exchanges, I hereby confirm and declare that all the Board of
Directors and the senior management personnel of the Company have affirmed compliance with the ‘Code of Conduct for Board
Members and Senior Management’ laid down for them for the financial year ended 31st March 2013.
For Nitco Limited
Sd/-
Place: Mumbai Vivek Talwar Date: 30th May, 2013 Managing Director
To
The Members
Nitco Limited
We have examined the compliance of conditions of Corporate Governance procedures implemented by Nitco Limited for the year
ended March 31, 2013, as stipulated in Clause 49 of the Listing Agreement of the said Company with the stock exchanges of India.
The compliance with the conditions of Corporate Governance is the responsibility of the management. Our examination was limited
to a review of procedures and implementation thereof, adopted by the Company for ensuring compliance with the conditions of
Corporate Governance. It is neither an audit nor an expression of opinion on the financial statements of the Company.
In our opinion and to the best of our information and according to the explanations given to us, we hereby certify that the Company
has complied in all respects with the conditions of Corporate Governance as stipulated in the above mentioned Listing Agreement.
We further state that such compliance is neither an assurance as to the future viability of the Company nor the efficiency or the
effectiveness with which the management has conducted the affairs of the Company.
For A. Husein Noumanali & Co. Chartered Accountants
Sd/-
A. Husein NoumanaliPlace: Mumbai Proprietor
Date: 30th May, 2013 Membership No. 14757
NIT
CO
Lim
ited
Ann
ual R
epor
t 20
12-1
3
46 47
Financial Statements
NIT
CO
Lim
ited
48
Ann
ual R
epor
t 20
12-1
3
49
Independent Auditors’ ReportTo
The Members of Nitco Limited
Report on the Financial Statements
We have audited the accompanying financial statements of NITCO
Limited (“the Company”), which comprise the Balance Sheet as at
March 31, 2013, the Statement of Profit and Loss and Cash Flow
Statement for the year then ended and a summary of significant
accounting policies and other explanatory information.
Management’s Responsibility for the Financial Statements
Management is responsible for the preparation of these financial
statements that give a true and fair view of the financial position,
financial performance and cash flows of the Company in accordance
with the accounting principles generally accepted in India including
Accounting Standards referred to in Section 211(3C) of the
Companies Act, 1956 (“the Act”). This responsibility includes the
design, implementation and maintenance of internal control relevant
to the preparation and presentation of the financial statements that
give a true and fair view and are free from material misstatement,
whether due to fraud or error.
Auditors’ Responsibility
Our responsibility is to express an opinion on these financial
statements based on our audit. We conducted our audit in
accordance with the Standards on Auditing issued by the Institute
of Chartered Accountants of India. Those Standards require that we
comply with ethical requirements and plan and perform the audit to
obtain reasonable assurance about whether the financial statements
are free from material misstatements.
An audit involves performing procedures to obtain audit evidence
about the amounts and disclosures in the financial statements. The
procedures selected depend on the auditor’s judgment, including
the assessment of the risks of material misstatement of the financial
statements, whether due to fraud or error. In making those risk
assessments, the auditor considers internal control relevant to
the Company’s preparation and fair presentation of the financial
statements in order to design audit procedures that are appropriate
in the circumstances. An audit also includes evaluating the
appropriateness of accounting policies used and the reasonableness
of the accounting estimates made by management, as well as
evaluating the overall presentation of the financial statements.
We believe that the audit evidence we have obtained is sufficient and
appropriate to provide a basis for our audit opinion.
Opinion
In our opinion and to the best of our information and according
to the explanations given to us, the financial statements give the
information required by the Act in the manner so required and give
a true and fair view in conformity with the accounting principles
generally accepted in India:
a. In the case of the Balance Sheet, of the state of affairs of the
Company as at March 31, 2013;
b. In the case of the Statement of Profit and Loss, of the loss for
the year ended on that date; and
c. In the case of the Cash Flow Statement, of the cash flows for
the year ended on that date.
Emphasis of Matter
Without qualifying, attention is drawn as under:
a) Note no. 37 to the financial statements relating to Corporate
Debt Restructuring (CDR) package approved by the CDR
Empowered Group.
b) The balances of Funded interest on Term Loan from banks
aggregating to Rs. 9,004.67 Lacs are subject to reconciliation.
c) The balances of Working Capital Term Loan from banks
aggregating to Rs. 59,070.12 Lacs are subject to reconciliation.
Report on Other Legal and Regulatory Requirements
1. As required by the Companies (Auditor’s Report) Order, 2003
(“the Order”) as amended, issued by the Central Government
of India in terms of Sub Section (4A) of section 227 of the Act,
we give in the Annexure a statement on the matters specified
in paragraphs 4 and 5 of the Order.
2. As required by Section 227(3) of the Act, we report that:
i. We have obtained all the information and explanations
which to the best of our knowledge and belief were
necessary for the purpose of our audit;
ii. In our opinion, proper books of account as required by law
have been kept by the Company so far as appears from
our examination of those books.
iii. The Balance Sheet, the Statement of Profit and Loss, and
the Cash Flow Statement dealt with by this Report are in
agreement with the books of account.
iv. In our opinion, the Balance Sheet, the Statement of Profit
and Loss, and the Cash Flow Statement comply with the
Accounting Standards referred to in sub-section (3C) of
section 211 of the Companies Act, 1956;
v. On the basis of the written representations received from
the directors as on March 31, 2013, taken on record by the
Board of Directors, none of the directors is disqualified as
on March 31, 2013, from being appointed as a director in
terms of clause (g) of Sub-Section (1) of section 274 of the
Companies Act, 1956.
For A. Husein Noumanali & Co.
Chartered Accountants
Firm Registration No. 107173W
(A. Husein Noumanali)
Place: Mumbai Proprietor
Date: May 30, 2013 M.No. 14757
Ann
ual R
epor
t 20
12-1
3
51
statutory dues including Provident Fund, Investor Education and Protection Fund, Employees’ State Insurance, Income-Tax / TDS, Sales Tax, Wealth Tax, Service Tax, Customs Duty, Excise Duty, Cess, and other statutory dues have been generally regularly deposited with the appropriate authorities. According to the information and explanations given to us, no undisputed amounts payable in respect of the aforesaid dues were outstanding as at March 31, 2013 for a period of more than six months from the date of becoming payable.
b) The disputed statutory dues that have not been deposited on account of disputed matters pending before appropriate authorities are as under:
Rs. In lacs
Name of Statute Nature of the dues
Forum Period to which amount relatesCommissioner Central
Excise & Customs.Customs, Excise & Service Tax Appellate Tribunal, (CESTAT), Mumbai
Central Excise Act,1944 Excise Duty 21.66 1,454.77 2004-05, 2011-12, 2012-13Customs Act, 1962 Customs Duty - 1,591.78 2004-05 & 2008-09
10. The Company has accumulated losses at the end of financial year which are less than fifty percent of its net worth. Further the Company has incurred cash losses during the financial year covered by our audit and the immediately preceding financial year.
11. There have been defaults in repayment of dues to the banks, and financial institutions during the year, which have been subsequently either rescheduled by way of Corporate Debt Restructuring package (CDR) or repaid upto the date of our report.
12. In our opinions and according to the explanations given to us and based on the information available, no loans and advances have been granted by the Company on the basis of security by way of pledge of shares, debentures and other securities.
13. In our opinion, the Company is not a chit fund / nidhi / mutual benefit fund / society. Therefore, the provisions of clause (xiii) of paragraph 4 of the Order are not applicable to the Company.
14. In our opinion and according to the information and explanations given to us, the Company is not dealing in or trading in shares, securities, debentures and other investments. Accordingly, the provisions of clause 4 (xiv) of the Companies (Auditor’s Report) Order, 2003 are not applicable to the Company.
15. According to the information and explanations given to us, the company has not given any guarantee for loans taken by others from banks and financial institutions.
16. In our opinion, the term loans are being applied for the purpose for which they were obtained.
17. According to the information and explanations given to us and on overall examination of balance sheet of the company, we report that no funds raised on short-term basis has been used during the year for long-term investment and no long term funds have been used to finance short term assets except the loans which has been reclassified under the implementation of CDR package.
18. The Company has not made any preferential allotment of shares to parties and companies covered in the Register maintained under Section 301 of the Companies Act, 1956.
19. The Company has not issued any secured debentures during the year. Hence, provisions of Clause 4 (xix) of the Companies (Auditor’s Report) Order, 2003 are not applicable to the Company.
20. The company has not raised any money by public issue during the year.
21. In our opinion and according to the information and explanations given to us, no material fraud on or by the Company has been noticed or reported during the year.
For A. Husein Noumanali & Co. Chartered Accountants Firm Registration No. 107173W
(A. Husein Noumanali)Place: Mumbai ProprietorDate: May 30, 2013 M.No. 14757

NIT
CO
Lim
ited
Ann
ual R
epor
t 20
12-1
3
52 53
Balance Sheet as at March 31, 2013 Statement of Profit and Loss for the year ended March 31, 2013 Rs. in Lacs Particulars Note As at
March 31, 2013
As at
March 31, 2012I. EQUITY AND LIABILITIES
1 Shareholders’ funds (a) Share capital 1 3,260.01 3,260.01 (b) Reserves and surplus 2 21,613.67 44,747.49
Total Shareholders' Funds 24,873.68 48,007.50 2 Share application money pending allotment 38 2,800.00 - 3 Non-current liabilities
(a) Long-term borrowings 3 1,13,899.69 30,061.65 (b) Deferred tax liabilities (Net) 2,034.84 2,034.84 (c) Other Long term liabilities 4 1,132.20 2,465.73
Total Non-Current Liabilities 1,17,066.73 34,562.22 4 Current liabilities
(a) Short-term borrowings 5 2,383.48 32,159.19 (b) Trade payables 6 8,134.04 48,952.60 (c) Other current liabilities 7 2,565.66 11,831.33 (d) Short-term provisions 8 82.75 69.58
Total Current Liabilities 13,165.93 93,012.70 TOTAL - Equity & Liabilities 1,57,906.34 1,75,582.42 II. ASSETS 1 Non-current assets
(a) Fixed Assets 9 & 10 (i) Tangible assets 70,954.41 73,758.01 (ii) Capital work-in-progress 295.01 338.29 Total Fixed Assets 71,249.42 74,096.30
(b) Non-current investments 11 3,123.75 1,184.08 (c) Long-term loans and advances 12 17,457.61 15,655.46
Total Non-Current Assets 20,581.36 16,839.54 2 Current Assets
(a) Current investments 13 9.27 10.00 (b) Inventories 14 23,270.99 38,936.51 (c) Inventories - Real Estate 15 18,600.77 19,290.75 (d) Trade receivables 16 9,500.56 9,533.15 (e) Cash and cash equivalents 17 2,328.02 5,708.09 (f) Short-term loans and advances 18 3,019.77 3,328.09 (g) Other current assets 19 9,346.18 7,839.99
Total Current Assets 66,075.56 84,646.58 TOTAL – Assets 1,57,906.34 1,75,582.42
Rs. in Lacs Particulars Note Year ended
March 31, 2013
Year ended
March 31, 2012I. Revenue From Operations
Sale of products 20 87,797.98 95,851.96
Less: Excise Duty 2,877.25 2,220.88
Less: Sales Tax 8,013.46 9,743.75
Other operating revenues 120.90 118.56
Net Sales 77,028.17 84,005.89
II. Other income 71.17 36.36
III. Total Revenue (I + II) 77,099.34 84,042.25
IV. Expenses:
Cost of materials consumed 21 13,292.00 17,577.98
Purchases of Stock-in-Trade 22,122.98 46,899.14
Changes in inventories of finished goods work-in- progress and
Stock-in-Trade
17,317.63 (9,622.35)
Employee benefits expense 22 6,566.14 4,665.09
Finance costs 23 15,167.39 7,511.39
Depreciation and amortization expense 4,003.13 3,265.87
Other expenses 24 21,763.90 15,842.29
Total Expenses 1,00,233.17 86,139.41
V. Loss before exceptional and extraordinary items and tax (III-IV) (23,133.83) (2,097.16)
VI. Exceptional items 25 - 3,447.48
VII. Loss before extraordinary items and tax (V - VI) (23,133.83) (5,544.64)
VIII. Extraordinary Items
IX. Loss before tax (VII- VIII) (23,133.83) (5,544.64)
X. Tax expense: 26
(1) Current tax - -
(2) Deferred tax - -
XI. Loss for the period from continuing operations (VII-VIII) (23,133.83) (5,544.64)
XII. Profit/(loss) from discontinuing operations - -
XIII. Tax expense of discontinuing operations - -
XIV. Profit/(loss) from Discontinuing operations (after tax) (XII-XIII) - -
XV. Loss for the period (XI + XIV) (23,133.83) (5,544.64)
XVI. Earnings per equity share:
(1) Basic (70.96) (17.01)
(2) Diluted (70.96) (17.01)
As per our report of even date For and on Behalf of the Board
For A. Husein Noumanali & Co.
Chartered Accountants
Firm Registration No: 107173W
A. Husein Noumanali Vivek Talwar Vishal Malik Reena Raje
Proprietor Managing Director Director Company Secretary
Membership No. 14757
Mumbai,
30th May, 2013
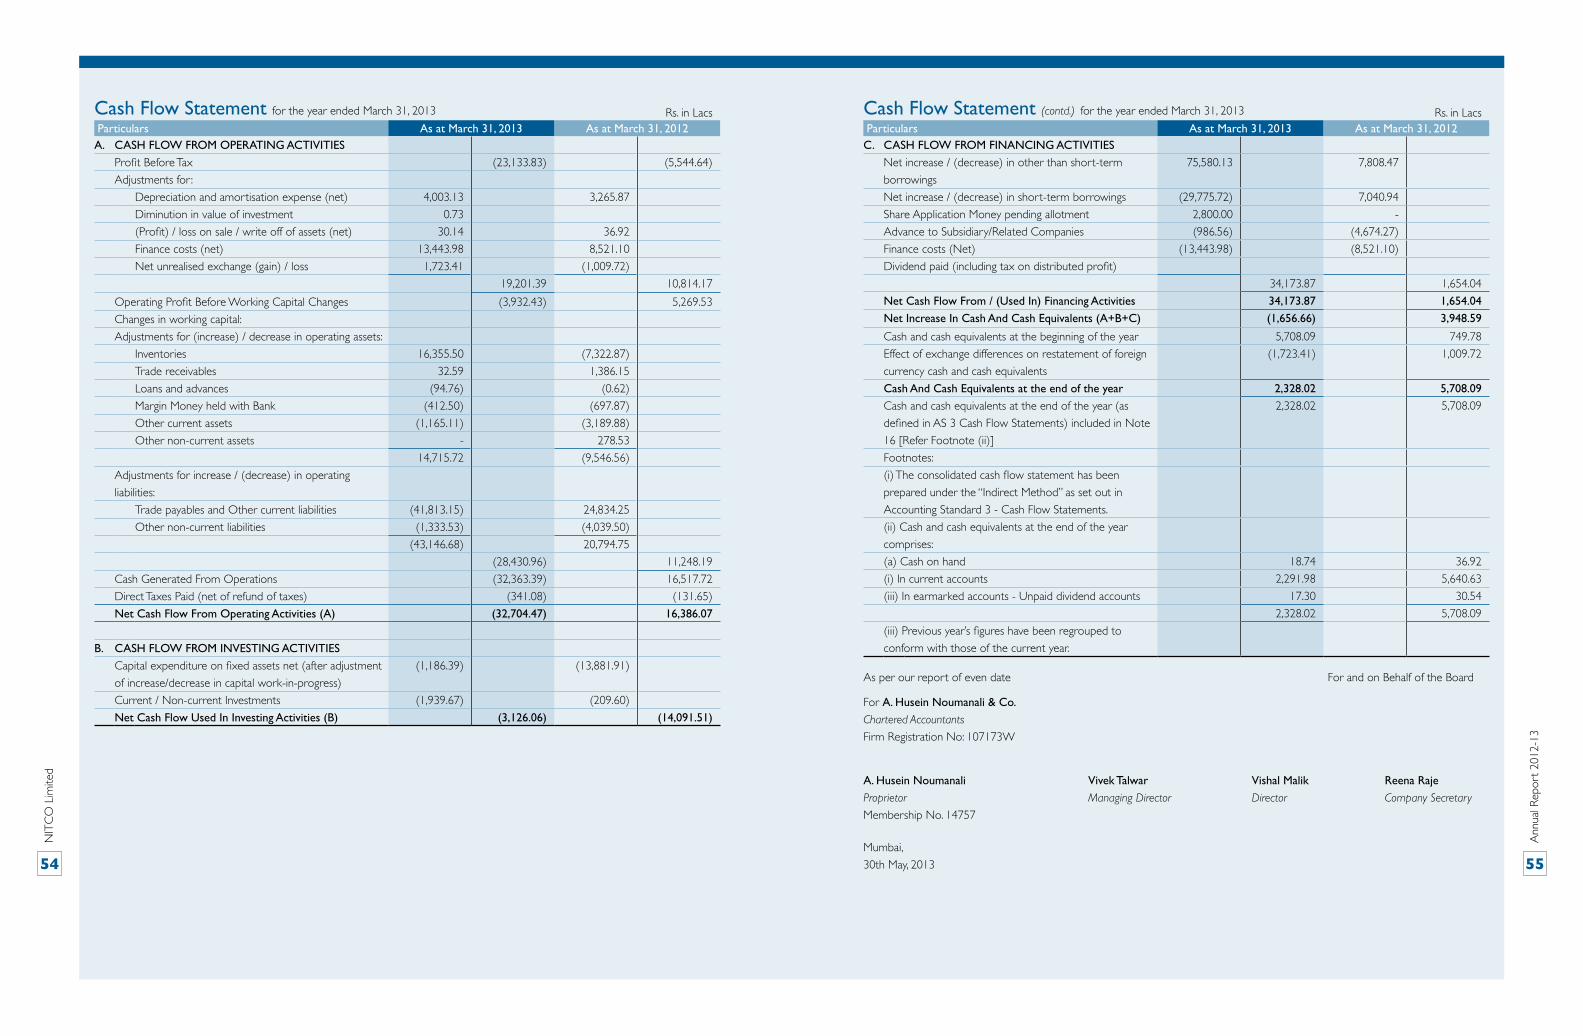
NIT
CO
Lim
ited
Ann
ual R
epor
t 20
12-1
3
54 55
Cash Flow Statement for the year ended March 31, 2013 Cash Flow Statement (contd.) for the year ended March 31, 2013 Rs. in Lacs Particulars As at March 31, 2013 As at March 31, 2012A. CASH FLOW FROM OPERATING ACTIVITIES
Profit Before Tax (23,133.83) (5,544.64)
Adjustments for :
Depreciation and amortisation expense (net) 4,003.13 3,265.87
Diminution in value of investment 0.73
(Profit) / loss on sale / write off of assets (net) 30.14 36.92
Finance costs (net) 13,443.98 8,521.10
Net unrealised exchange (gain) / loss 1,723.41 (1,009.72)
19,201.39 10,814.17
Operating Profit Before Working Capital Changes (3,932.43) 5,269.53
Changes in working capital:
Adjustments for (increase) / decrease in operating assets:
Inventories 16,355.50 (7,322.87)
Trade receivables 32.59 1,386.15
Loans and advances (94.76) (0.62)
Margin Money held with Bank (412.50) (697.87)
Other current assets (1,165.11) (3,189.88)
Other non-current assets - 278.53
14,715.72 (9,546.56)
Adjustments for increase / (decrease) in operating
liabilities:
Trade payables and Other current liabilities (41,813.15) 24,834.25
Other non-current liabilities (1,333.53) (4,039.50)
(43,146.68) 20,794.75
(28,430.96) 11,248.19
Cash Generated From Operations (32,363.39) 16,517.72
Direct Taxes Paid (net of refund of taxes) (341.08) (131.65)
Net Cash Flow From Operating Activities (A) (32,704.47) 16,386.07
B. CASH FLOW FROM INVESTING ACTIVITIES
Capital expenditure on fixed assets net (after adjustment
of increase/decrease in capital work-in-progress)
(1,186.39) (13,881.91)
Current / Non-current Investments (1,939.67) (209.60)
Net Cash Flow Used In Investing Activities (B) (3,126.06) (14,091.51)
Rs. in Lacs Particulars As at March 31, 2013 As at March 31, 2012C. CASH FLOW FROM FINANCING ACTIVITIES
Net increase / (decrease) in other than short-term
borrowings
75,580.13 7,808.47
Net increase / (decrease) in short-term borrowings (29,775.72) 7,040.94
Share Application Money pending allotment 2,800.00 -
Advance to Subsidiary/Related Companies (986.56) (4,674.27)
Finance costs (Net) (13,443.98) (8,521.10)
Dividend paid (including tax on distributed profit)
34,173.87 1,654.04
Net Cash Flow From / (Used In) Financing Activities 34,173.87 1,654.04
Net Increase In Cash And Cash Equivalents (A+B+C) (1,656.66) 3,948.59
Cash and cash equivalents at the beginning of the year 5,708.09 749.78
Effect of exchange differences on restatement of foreign
currency cash and cash equivalents
(1,723.41) 1,009.72
Cash And Cash Equivalents at the end of the year 2,328.02 5,708.09
Cash and cash equivalents at the end of the year (as
defined in AS 3 Cash Flow Statements) included in Note
16 [Refer Footnote (ii)]
2,328.02 5,708.09
Footnotes:
(i) The consolidated cash flow statement has been
prepared under the “Indirect Method” as set out in
Accounting Standard 3 - Cash Flow Statements.
(ii) Cash and cash equivalents at the end of the year
comprises:
(a) Cash on hand 18.74 36.92
(i) In current accounts 2,291.98 5,640.63
(iii) In earmarked accounts - Unpaid dividend accounts 17.30 30.54
2,328.02 5,708.09
(iii) Previous year’s figures have been regrouped to
conform with those of the current year.
As per our report of even date For and on Behalf of the Board
For A. Husein Noumanali & Co.
Chartered Accountants
Firm Registration No: 107173W
A. Husein Noumanali Vivek Talwar Vishal Malik Reena Raje
Proprietor Managing Director Director Company Secretary
Membership No. 14757
Mumbai,
30th May, 2013
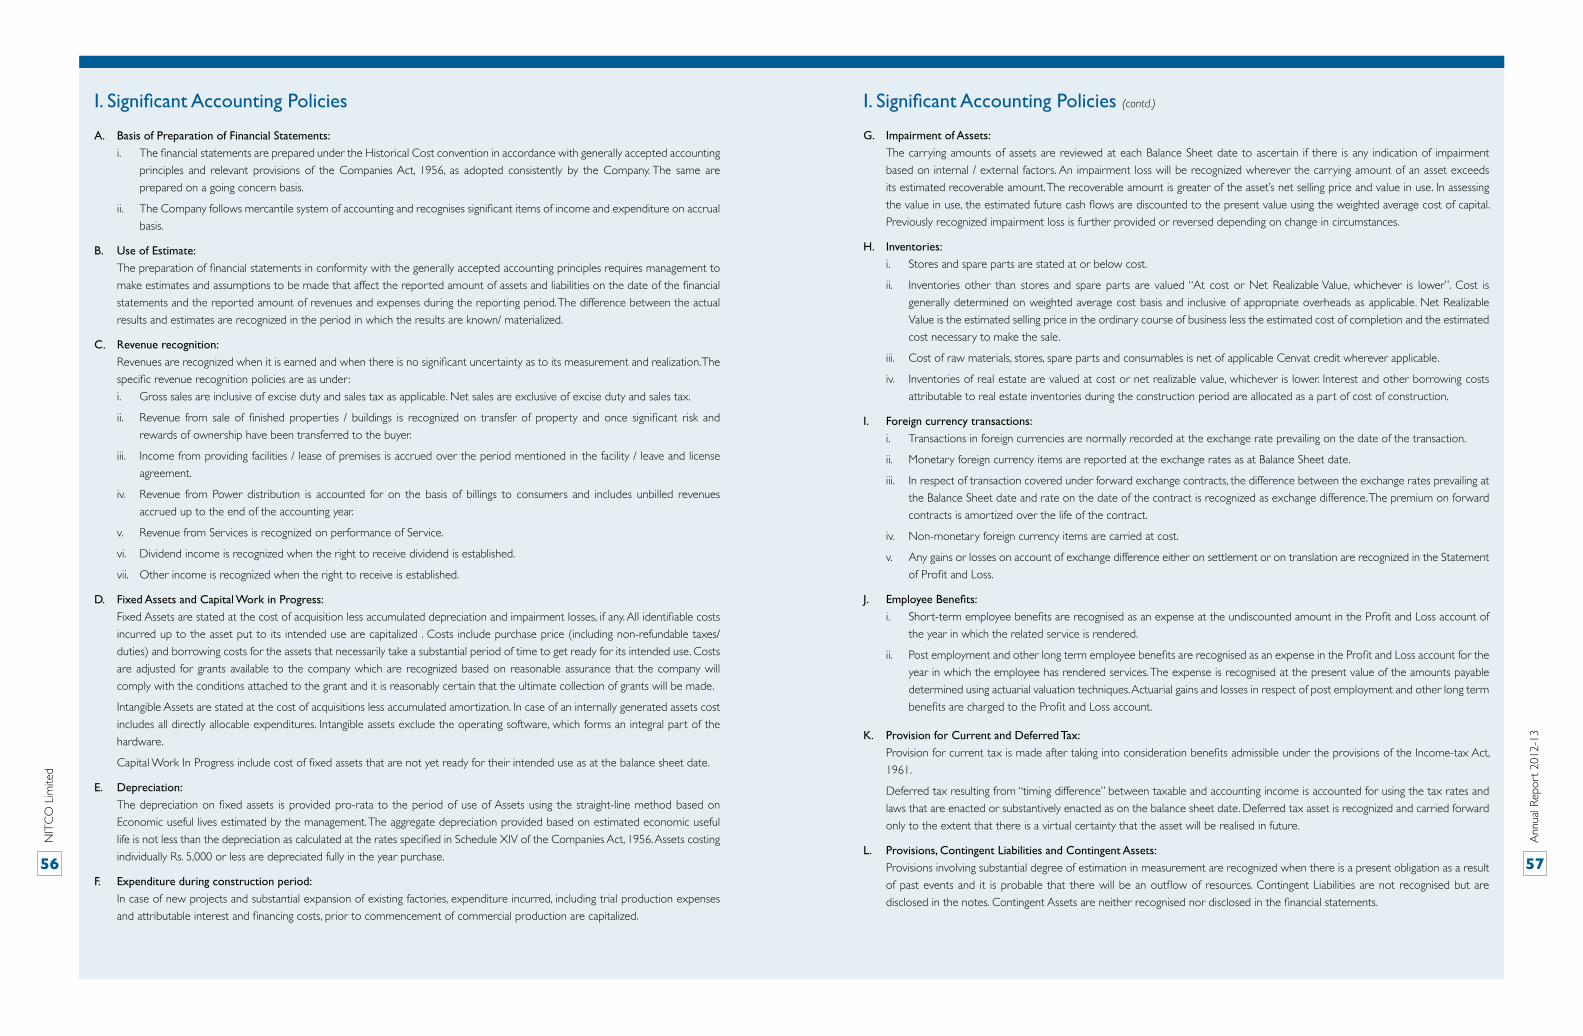
NIT
CO
Lim
ited
Ann
ual R
epor
t 20
12-1
3
56 57
I. Significant Accounting Policies I. Significant Accounting Policies (contd.)
A. Basis of Preparation of Financial Statements:
i. The financial statements are prepared under the Historical Cost convention in accordance with generally accepted accounting
principles and relevant provisions of the Companies Act, 1956, as adopted consistently by the Company. The same are
prepared on a going concern basis.
ii. The Company follows mercantile system of accounting and recognises significant items of income and expenditure on accrual
basis.
B. Use of Estimate:
The preparation of financial statements in conformity with the generally accepted accounting principles requires management to
make estimates and assumptions to be made that affect the reported amount of assets and liabilities on the date of the financial
statements and the reported amount of revenues and expenses during the reporting period. The difference between the actual
results and estimates are recognized in the period in which the results are known/ materialized.
C. Revenue recognition:
Revenues are recognized when it is earned and when there is no significant uncertainty as to its measurement and realization. The
specific revenue recognition policies are as under:
i. Gross sales are inclusive of excise duty and sales tax as applicable. Net sales are exclusive of excise duty and sales tax.
ii. Revenue from sale of finished properties / buildings is recognized on transfer of property and once significant risk and
rewards of ownership have been transferred to the buyer.
iii. Income from providing facilities / lease of premises is accrued over the period mentioned in the facility / leave and license
agreement.
iv. Revenue from Power distribution is accounted for on the basis of billings to consumers and includes unbilled revenues
accrued up to the end of the accounting year.
v. Revenue from Services is recognized on performance of Service.
vi. Dividend income is recognized when the right to receive dividend is established.
vii. Other income is recognized when the right to receive is established.
D. Fixed Assets and Capital Work in Progress:
Fixed Assets are stated at the cost of acquisition less accumulated depreciation and impairment losses, if any. All identifiable costs
incurred up to the asset put to its intended use are capitalized . Costs include purchase price (including non-refundable taxes/
duties) and borrowing costs for the assets that necessarily take a substantial period of time to get ready for its intended use. Costs
are adjusted for grants available to the company which are recognized based on reasonable assurance that the company will
comply with the conditions attached to the grant and it is reasonably certain that the ultimate collection of grants will be made.
Intangible Assets are stated at the cost of acquisitions less accumulated amortization. In case of an internally generated assets cost
includes all directly allocable expenditures. Intangible assets exclude the operating software, which forms an integral part of the
hardware.
Capital Work In Progress include cost of fixed assets that are not yet ready for their intended use as at the balance sheet date.
E. Depreciation:
The depreciation on fixed assets is provided pro-rata to the period of use of Assets using the straight-line method based on
Economic useful lives estimated by the management. The aggregate depreciation provided based on estimated economic useful
life is not less than the depreciation as calculated at the rates specified in Schedule XIV of the Companies Act, 1956. Assets costing
individually Rs. 5,000 or less are depreciated fully in the year purchase.
F. Expenditure during construction period:
In case of new projects and substantial expansion of existing factories, expenditure incurred, including trial production expenses
and attributable interest and financing costs, prior to commencement of commercial production are capitalized.
G. Impairment of Assets:
The carrying amounts of assets are reviewed at each Balance Sheet date to ascertain if there is any indication of impairment
based on internal / external factors. An impairment loss will be recognized wherever the carrying amount of an asset exceeds
its estimated recoverable amount. The recoverable amount is greater of the asset’s net selling price and value in use. In assessing
the value in use, the estimated future cash flows are discounted to the present value using the weighted average cost of capital.
Previously recognized impairment loss is further provided or reversed depending on change in circumstances.
H. Inventories:
i. Stores and spare parts are stated at or below cost.
ii. Inventories other than stores and spare parts are valued “At cost or Net Realizable Value, whichever is lower”. Cost is
generally determined on weighted average cost basis and inclusive of appropriate overheads as applicable. Net Realizable
Value is the estimated selling price in the ordinary course of business less the estimated cost of completion and the estimated
cost necessary to make the sale.
iii. Cost of raw materials, stores, spare parts and consumables is net of applicable Cenvat credit wherever applicable.
iv. Inventories of real estate are valued at cost or net realizable value, whichever is lower. Interest and other borrowing costs
attributable to real estate inventories during the construction period are allocated as a part of cost of construction.
I. Foreign currency transactions:
i. Transactions in foreign currencies are normally recorded at the exchange rate prevailing on the date of the transaction.
ii. Monetary foreign currency items are reported at the exchange rates as at Balance Sheet date.
iii. In respect of transaction covered under forward exchange contracts, the difference between the exchange rates prevailing at
the Balance Sheet date and rate on the date of the contract is recognized as exchange difference. The premium on forward
contracts is amortized over the life of the contract.
iv. Non-monetary foreign currency items are carried at cost.
v. Any gains or losses on account of exchange difference either on settlement or on translation are recognized in the Statement
of Profit and Loss.
J. Employee Benefits:
i. Short-term employee benefits are recognised as an expense at the undiscounted amount in the Profit and Loss account of
the year in which the related service is rendered.
ii. Post employment and other long term employee benefits are recognised as an expense in the Profit and Loss account for the
year in which the employee has rendered services. The expense is recognised at the present value of the amounts payable
determined using actuarial valuation techniques. Actuarial gains and losses in respect of post employment and other long term
benefits are charged to the Profit and Loss account.
K. Provision for Current and Deferred Tax:
Provision for current tax is made after taking into consideration benefits admissible under the provisions of the Income-tax Act,
1961.
Deferred tax resulting from “timing difference” between taxable and accounting income is accounted for using the tax rates and
laws that are enacted or substantively enacted as on the balance sheet date. Deferred tax asset is recognized and carried forward
only to the extent that there is a virtual certainty that the asset will be realised in future.
L. Provisions, Contingent Liabilities and Contingent Assets:
Provisions involving substantial degree of estimation in measurement are recognized when there is a present obligation as a result
of past events and it is probable that there will be an outflow of resources. Contingent Liabilities are not recognised but are
disclosed in the notes. Contingent Assets are neither recognised nor disclosed in the financial statements.
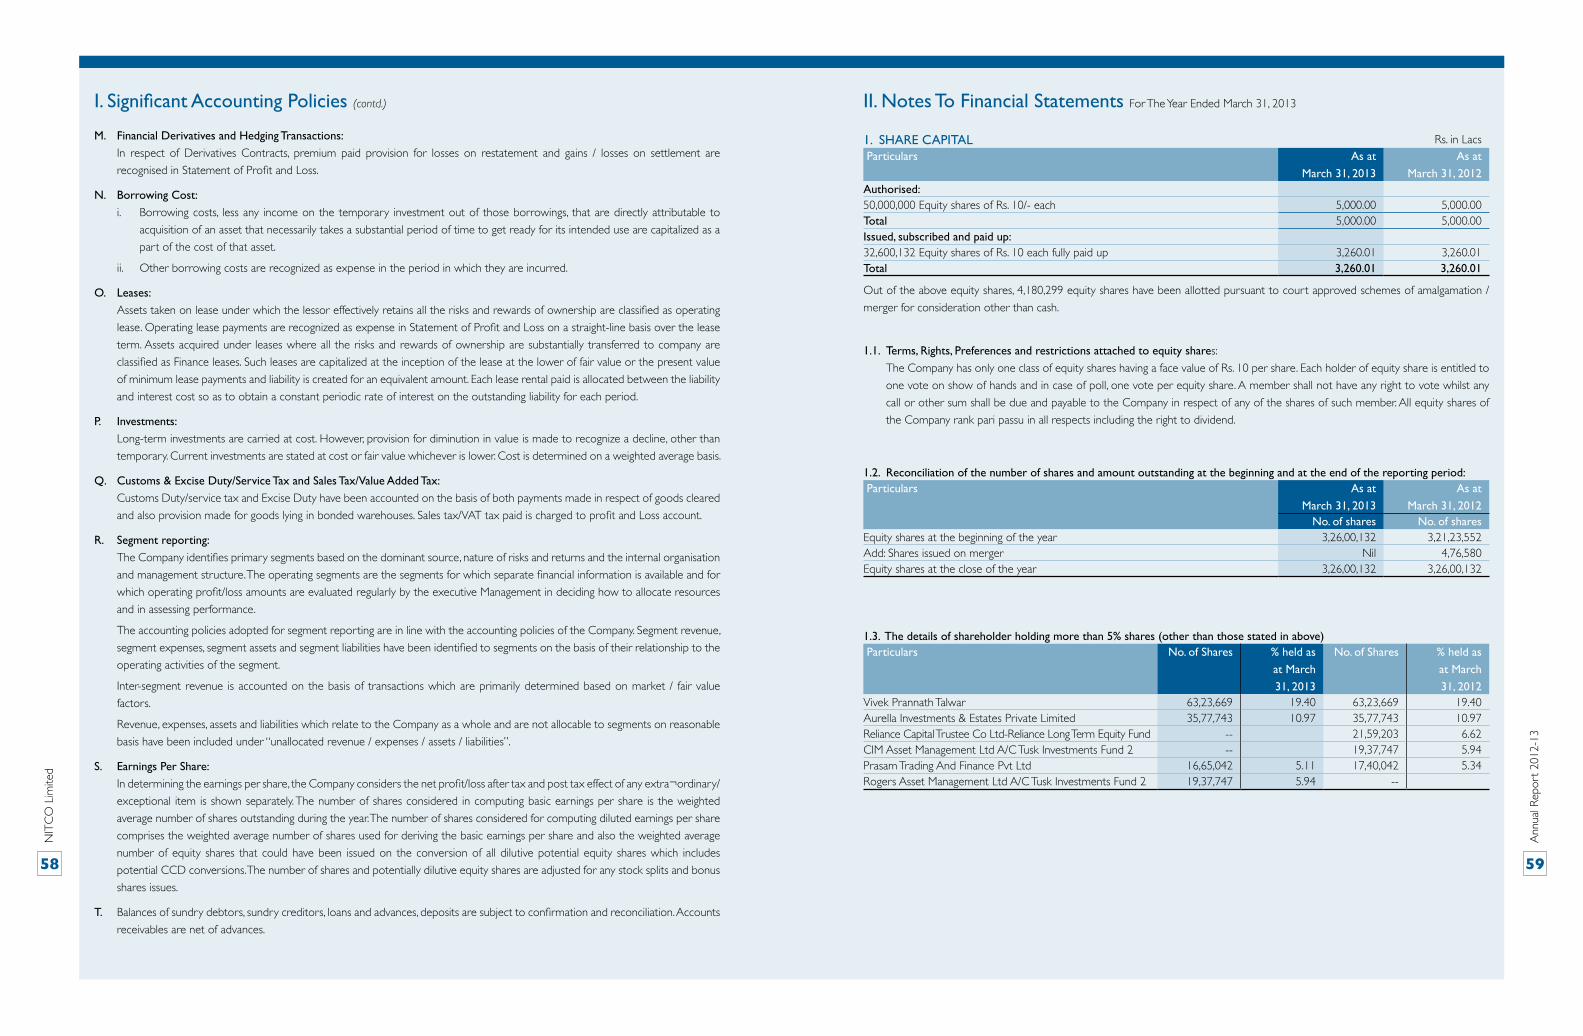
NIT
CO
Lim
ited
Ann
ual R
epor
t 20
12-1
3
58 59
M. Financial Derivatives and Hedging Transactions:
In respect of Derivatives Contracts, premium paid provision for losses on restatement and gains / losses on settlement are
recognised in Statement of Profit and Loss.
N. Borrowing Cost:
i. Borrowing costs, less any income on the temporary investment out of those borrowings, that are directly attributable to
acquisition of an asset that necessarily takes a substantial period of time to get ready for its intended use are capitalized as a
part of the cost of that asset.
ii. Other borrowing costs are recognized as expense in the period in which they are incurred.
O. Leases:
Assets taken on lease under which the lessor effectively retains all the risks and rewards of ownership are classified as operating
lease. Operating lease payments are recognized as expense in Statement of Profit and Loss on a straight-line basis over the lease
term. Assets acquired under leases where all the risks and rewards of ownership are substantially transferred to company are
classified as Finance leases. Such leases are capitalized at the inception of the lease at the lower of fair value or the present value
of minimum lease payments and liability is created for an equivalent amount. Each lease rental paid is allocated between the liability
and interest cost so as to obtain a constant periodic rate of interest on the outstanding liability for each period.
P. Investments:
Long-term investments are carried at cost. However, provision for diminution in value is made to recognize a decline, other than
temporary. Current investments are stated at cost or fair value whichever is lower. Cost is determined on a weighted average basis.
Q. Customs & Excise Duty/Service Tax and Sales Tax/Value Added Tax:
Customs Duty/service tax and Excise Duty have been accounted on the basis of both payments made in respect of goods cleared
and also provision made for goods lying in bonded warehouses. Sales tax/VAT tax paid is charged to profit and Loss account.
R. Segment reporting:
The Company identifies primary segments based on the dominant source, nature of risks and returns and the internal organisation
and management structure. The operating segments are the segments for which separate financial information is available and for
which operating profit/loss amounts are evaluated regularly by the executive Management in deciding how to allocate resources
and in assessing performance.
The accounting policies adopted for segment reporting are in line with the accounting policies of the Company. Segment revenue,
segment expenses, segment assets and segment liabilities have been identified to segments on the basis of their relationship to the
operating activities of the segment.
Inter-segment revenue is accounted on the basis of transactions which are primarily determined based on market / fair value
factors.
Revenue, expenses, assets and liabilities which relate to the Company as a whole and are not allocable to segments on reasonable
basis have been included under “unallocated revenue / expenses / assets / liabilities”.
S. Earnings Per Share:
In determining the earnings per share, the Company considers the net profit/loss after tax and post tax effect of any extra¬ordinary/
exceptional item is shown separately. The number of shares considered in computing basic earnings per share is the weighted
average number of shares outstanding during the year. The number of shares considered for computing diluted earnings per share
comprises the weighted average number of shares used for deriving the basic earnings per share and also the weighted average
number of equity shares that could have been issued on the conversion of all dilutive potential equity shares which includes
potential CCD conversions. The number of shares and potentially dilutive equity shares are adjusted for any stock splits and bonus
shares issues.
T. Balances of sundry debtors, sundry creditors, loans and advances, deposits are subject to confirmation and reconciliation. Accounts
receivables are net of advances.
I. Significant Accounting Policies (contd.) II. Notes To Financial Statements For The Year Ended March 31, 2013
1. SHARE CAPITAL Rs. in Lacs Particulars As at
March 31, 2013
As at
March 31, 2012Authorised: 50,000,000 Equity shares of Rs. 10/- each 5,000.00 5,000.00 Total 5,000.00 5,000.00 Issued, subscribed and paid up: 32,600,132 Equity shares of Rs. 10 each fully paid up 3,260.01 3,260.01 Total 3,260.01 3,260.01
1.2. Reconciliation of the number of shares and amount outstanding at the beginning and at the end of the reporting period: Particulars As at
March 31, 2013
As at
March 31, 2012No. of shares No. of shares
Equity shares at the beginning of the year 3,26,00,132 3,21,23,552Add: Shares issued on merger Nil 4,76,580Equity shares at the close of the year 3,26,00,132 3,26,00,132
1.3. The details of shareholder holding more than 5% shares (other than those stated in above) Particulars No. of Shares % held as
at March
31, 2013
No. of Shares % held as
at March
31, 2012Vivek Prannath Talwar 63,23,669 19.40 63,23,669 19.40Aurella Investments & Estates Private Limited 35,77,743 10.97 35,77,743 10.97Reliance Capital Trustee Co Ltd-Reliance Long Term Equity Fund -- 21,59,203 6.62CIM Asset Management Ltd A/C Tusk Investments Fund 2 -- 19,37,747 5.94Prasam Trading And Finance Pvt Ltd 16,65,042 5.11 17,40,042 5.34Rogers Asset Management Ltd A/C Tusk Investments Fund 2 19,37,747 5.94 --
Out of the above equity shares, 4,180,299 equity shares have been allotted pursuant to court approved schemes of amalgamation /
merger for consideration other than cash.
1.1. Terms, Rights, Preferences and restrictions attached to equity shares:
The Company has only one class of equity shares having a face value of Rs. 10 per share. Each holder of equity share is entitled to
one vote on show of hands and in case of poll, one vote per equity share. A member shall not have any right to vote whilst any
call or other sum shall be due and payable to the Company in respect of any of the shares of such member. All equity shares of
the Company rank pari passu in all respects including the right to dividend.

NIT
CO
Lim
ited
Ann
ual R
epor
t 20
12-1
3
60 61
2. RESERVES AND SURPLUS Rs. in Lacs Particulars As at
March 31, 2013
As at
March 31, 2012Capital Reserve As per last year balance sheet 125.68 125.68Capital Redemption Reserve As per last year balance sheet 965.00 965.00Securities Premium Account As per last year balance sheet 32,112.39 32,112.39General Reserve As per last year balance sheet 4,356.63 4,356.63Balance in Profit & Loss Account Opening balance 7,187.79 12,732.43(+) Net Loss For the current year (23,133.83) (5,544.64)Closing Balance (15,946.03) 7,187.79Total 21,613.67 44,747.49
3. LONG TERM BORROWINGS
3.1 Long-Term BorrowingsTerm Loans - from banks 1,07,578.94 24917.72Term Loans - from Financial Institutions 4,003.51 2183.33Term Loans - from other parties 2,211.31 2,792.03Long term maturities of finance lease 105.93 168.57Total 1,13,899.69 30,061.65
II. Notes To Financial Statements For The Year Ended March 31, 2013 II. Notes To Financial Statements For The Year Ended March 31, 2013
The Company’s proposal for restructuring of its debts is sanctioned by the Corporate Debt Restructuring Empowered Group (CDR EG) vide sanction letter dated December 26, 2012 read along with letter dated 31st December 2012. For details, refer Note 37.
i. Term loans include Working Capital Demand Loan (WCTL) and Funded Interest Term loan (FITL).
ii. Loans received from NBFCs and foreign bank have not been restructured.
iii. Repayment of term loan shall be in 32 structured quarterly installments commencing from June 30, 2014 and carrying interest rate at 11.25% per annum; repayment of WCTL shall be in 24 quarterly structured installments commencing from June 30, 2014 and carrying interest rate at 10.75% per annum; repayment of FITL shall be in 24 quarterly structured installments commencing from June 30, 2014 and carrying interest rate at 10.75% per annum;
iv. Working capital loan carries interest at 11% per annum.
3.2. Security Offered
i. The existing term loans including new WCTL and FITL are secured/ to be secured by first pari passu charge on the fixed assets and parri passu second charge on the current assets of the Company.
ii. The existing and fresh working capital facilities are secured / to be secured by the first pari passu charge on current assets and second pari passu charge on fixed assets of the Company.
iii. Lenders having exclusive charge over securities prior to restructuring are continuing to have exclusive charge over those securities post restructuring.
iv. First pari passu charge over all bank accounts of the Company, including the Trust and Retention Accounts (and all sub- accounts thereof).
v. Pledge of shares in the Company held by both Mr. Vivek Talwar and M/s Aurella Estates & Investments Private Limited.
vi. Personal guarantee from Mr. Vivek Talwar and corporate guarantee from M/s Aurella Estates & Investments Private Limited for the entire debt of the Company including the sacrifices made by the lenders.
vii. The entire debt is further secured by the corporate guarantees from certain subsidiaries who hold real estate assets, being offered as additional securities to lenders.
3.3. Maturity profile of Secured Term Loans is as below: Rs. In LacsNature of facility and Rate
of interest
Maturity Profile of restructured loanMar-14 Mar-15 Mar-16 Mar-17 Mar-18 Mar-19 Mar-20 Mar-21
Term loan – 11.25% p.a. 375.00 8,257.63 4,128.82 4,128.82 6,193.23 4,128.82 4,128.82 4,128.82WCTL – 10.75% p.a. - 18,109.01 6,036.34 6,036.34 9,054.51 9,054.51 12,072.68 -FITL – 10.75% p.a. - 2,836.00 945.33 945.33 1,418.00 1,418.00 1,890.67 -Total 375.00 29,202.64 11,110.49 11,110.49 16,665.74 14,601.33 18,092.17 4,128.82
Rs. In LacsNature of facility and Rate of interest Maturity profile of non- restructured lenders
Mar-14 Mar-15 Mar-16 Mar-17Foreign Bank - 10% 805.00 805.00 402.00 -NBFCs - 13.70% 800.00 800.00 800.00 611.00Total 1,605.00 1,605.00 1,202.00 611.00
The package envisages disposal of certain real estate assets owned by the Company and some of its subsidiaries which will be used for
repayment of restructured loan.
4. OTHER LONG TERM LIABILITIES Rs. in Lacs Particulars As at
March 31, 2013
As at
March 31, 2012Provision for employee benefits 266.83 285.00 Deposits from dealers and others 860.43 820.07 Other Liabilities 4.94 1,360.66 Total 1,132.20 2,465.73
5. SHORT TERM BORROWINGSLoan Repayable on Demand Secured From Banks - Cash Credit 2,008.48 18,495.63 Unsecured From Banks 375.00 11,396.63 From Others - 2,266.93 Total 2,383.48 32,159.19 * For details of Securities offered in respect of cash credit facility refer note no. 3.2
6. TRADE PAYABLEMicro, Small and Medium Enterprises 10.65 3.26 Other 8,123.39 48,949.34 Total 8,134.04 48,952.60
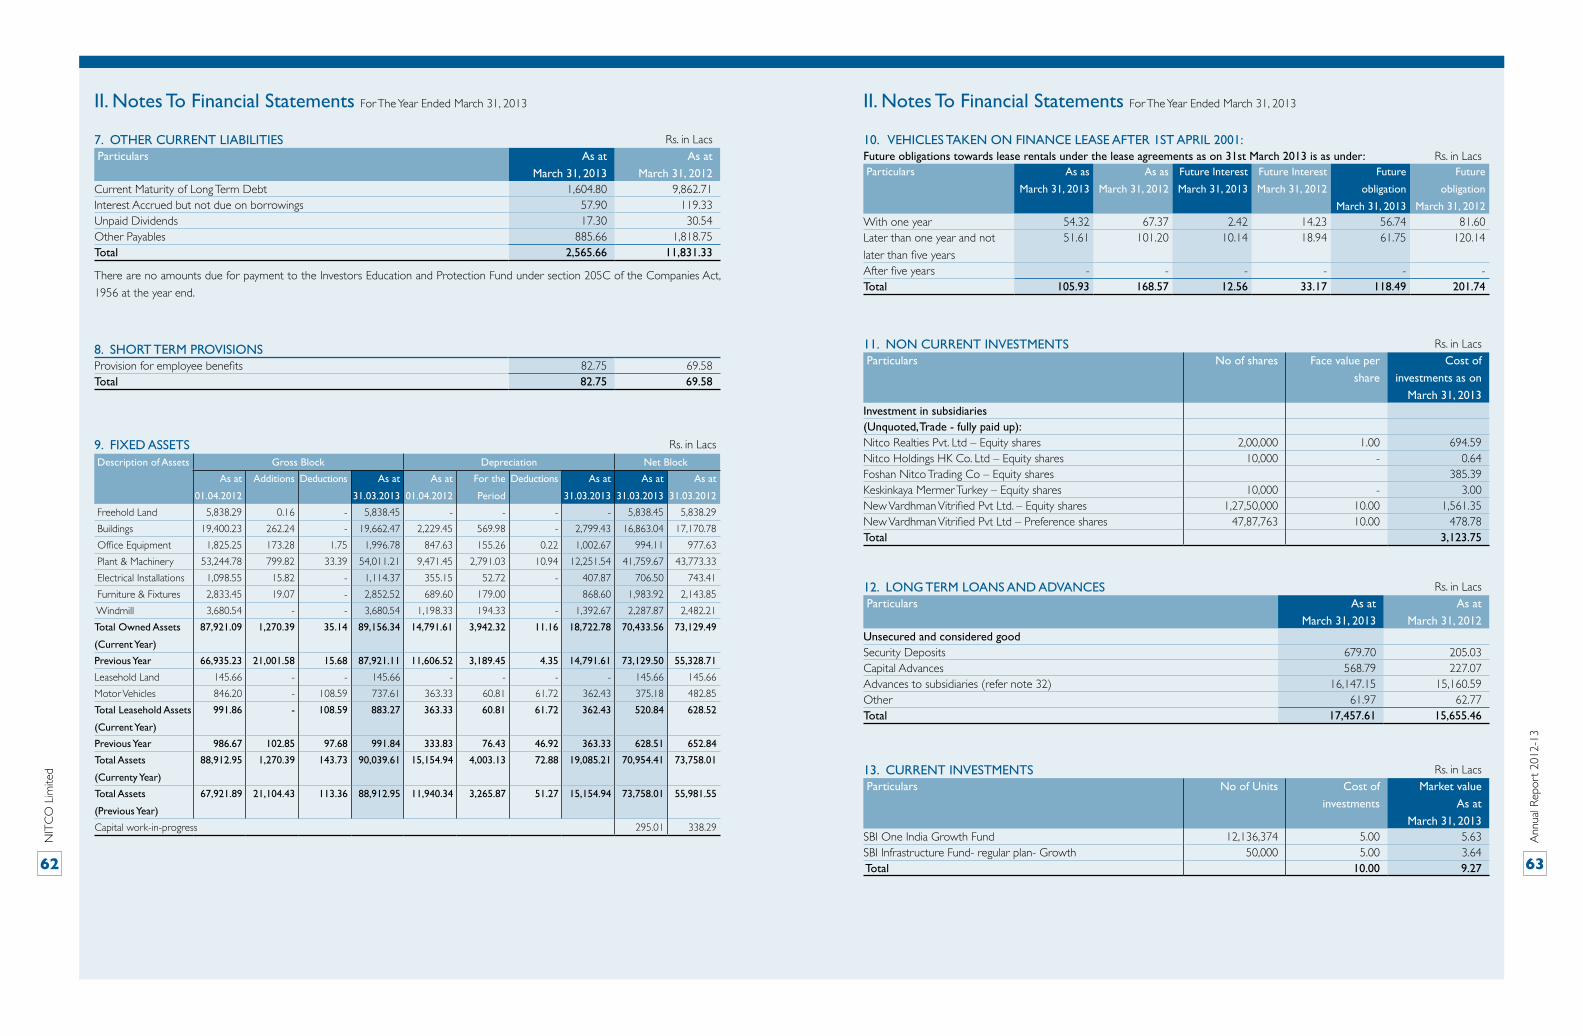
NIT
CO
Lim
ited
Ann
ual R
epor
t 20
12-1
3
62 63
II. Notes To Financial Statements For The Year Ended March 31, 2013 II. Notes To Financial Statements For The Year Ended March 31, 2013
7. OTHER CURRENT LIABILITIES Rs. in Lacs Particulars As at
March 31, 2013
As at
March 31, 2012Current Maturity of Long Term Debt 1,604.80 9,862.71 Interest Accrued but not due on borrowings 57.90 119.33 Unpaid Dividends 17.30 30.54 Other Payables 885.66 1,818.75 Total 2,565.66 11,831.33
There are no amounts due for payment to the Investors Education and Protection Fund under section 205C of the Companies Act,
1956 at the year end.
11. NON CURRENT INVESTMENTS Rs. in Lacs Particulars No of shares Face value per
share
Cost of
investments as on
March 31, 2013Investment in subsidiaries(Unquoted, Trade - fully paid up):Nitco Realties Pvt. Ltd – Equity shares 2,00,000 1.00 694.59 Nitco Holdings HK Co. Ltd – Equity shares 10,000 - 0.64 Foshan Nitco Trading Co – Equity shares 385.39 Keskinkaya Mermer Turkey – Equity shares 10,000 - 3.00 New Vardhman Vitrified Pvt Ltd. – Equity shares 1,27,50,000 10.00 1,561.35 New Vardhman Vitrified Pvt Ltd – Preference shares 47,87,763 10.00 478.78 Total 3,123.75
13. CURRENT INVESTMENTS Rs. in Lacs Particulars No of Units Cost of
investments
Market value
As at
March 31, 2013SBI One India Growth Fund 12,136,374 5.00 5.63SBI Infrastructure Fund- regular plan- Growth 50,000 5.00 3.64 Total 10.00 9.27
10. VEHICLES TAKEN ON FINANCE LEASE AFTER 1ST APRIL 2001:Future obligations towards lease rentals under the lease agreements as on 31st March 2013 is as under: Rs. in Lacs Particulars As as
March 31, 2013
As as
March 31, 2012
Future Interest
March 31, 2013
Future Interest
March 31, 2012
Future
obligation
March 31, 2013
Future
obligation
March 31, 2012With one year 54.32 67.37 2.42 14.23 56.74 81.60Later than one year and not
later than five years
51.61 101.20 10.14 18.94 61.75 120.14
After five years - - - - - -Total 105.93 168.57 12.56 33.17 118.49 201.74
8. SHORT TERM PROVISIONS Provision for employee benefits 82.75 69.58 Total 82.75 69.58
12. LONG TERM LOANS AND ADVANCES Rs. in Lacs Particulars As at
March 31, 2013
As at
March 31, 2012Unsecured and considered good Security Deposits 679.70 205.03Capital Advances 568.79 227.07Advances to subsidiaries (refer note 32) 16,147.15 15,160.59Other 61.97 62.77Total 17,457.61 15,655.46
9. FIXED ASSETS Rs. in Lacs
Description of Assets Gross Block Depreciation Net Block
As at
01.04.2012
Additions Deductions As at
31.03.2013
As at
01.04.2012
For the
Period
Deductions As at
31.03.2013
As at
31.03.2013
As at
31.03.2012
Freehold Land 5,838.29 0.16 - 5,838.45 - - - - 5,838.45 5,838.29
Buildings 19,400.23 262.24 - 19,662.47 2,229.45 569.98 - 2,799.43 16,863.04 17,170.78
Office Equipment 1,825.25 173.28 1.75 1,996.78 847.63 155.26 0.22 1,002.67 994.11 977.63
Plant & Machinery 53,244.78 799.82 33.39 54,011.21 9,471.45 2,791.03 10.94 12,251.54 41,759.67 43,773.33
Electrical Installations 1,098.55 15.82 - 1,114.37 355.15 52.72 - 407.87 706.50 743.41
Furniture & Fixtures 2,833.45 19.07 - 2,852.52 689.60 179.00 868.60 1,983.92 2,143.85
Windmill 3,680.54 - - 3,680.54 1,198.33 194.33 - 1,392.67 2,287.87 2,482.21
Total Owned Assets
(Current Year)
87,921.09 1,270.39 35.14 89,156.34 14,791.61 3,942.32 11.16 18,722.78 70,433.56 73,129.49
Previous Year 66,935.23 21,001.58 15.68 87,921.11 11,606.52 3,189.45 4.35 14,791.61 73,129.50 55,328.71
Leasehold Land 145.66 - - 145.66 - - - - 145.66 145.66
Motor Vehicles 846.20 - 108.59 737.61 363.33 60.81 61.72 362.43 375.18 482.85
Total Leasehold Assets
(Current Year)
991.86 - 108.59 883.27 363.33 60.81 61.72 362.43 520.84 628.52
Previous Year 986.67 102.85 97.68 991.84 333.83 76.43 46.92 363.33 628.51 652.84
Total Assets
(Currenty Year)
88,912.95 1,270.39 143.73 90,039.61 15,154.94 4,003.13 72.88 19,085.21 70,954.41 73,758.01
Total Assets
(Previous Year)
67,921.89 21,104.43 113.36 88,912.95 11,940.34 3,265.87 51.27 15,154.94 73,758.01 55,981.55
Capital work-in-progress 295.01 338.29
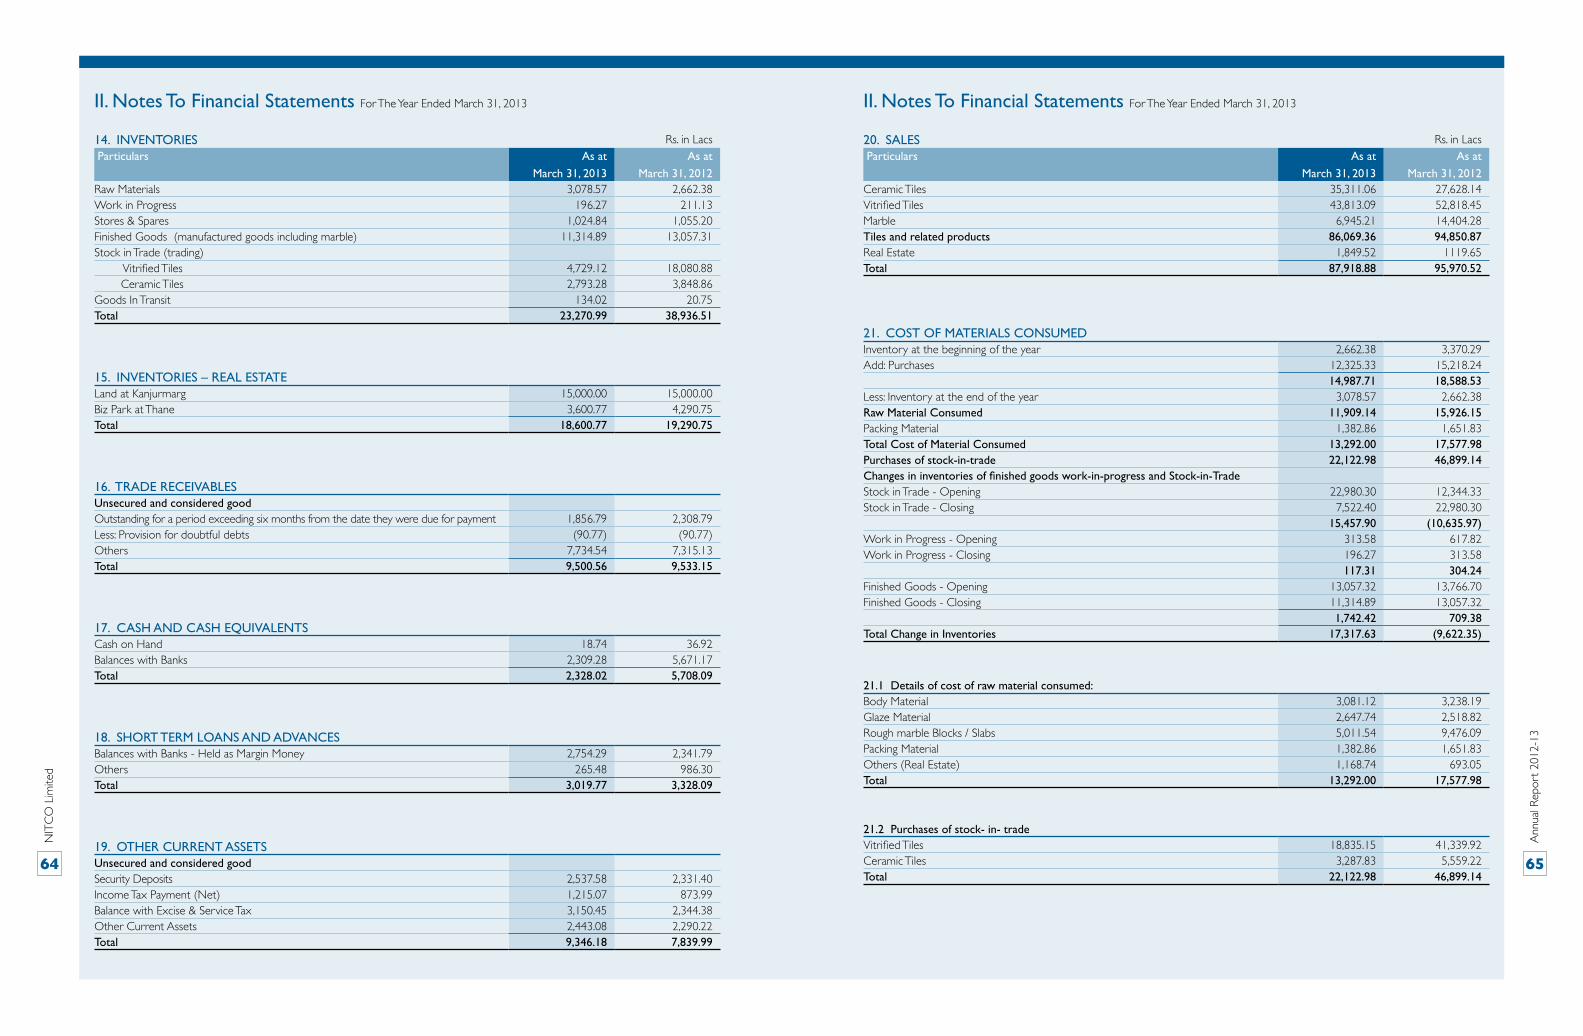
NIT
CO
Lim
ited
Ann
ual R
epor
t 20
12-1
3
64 65
II. Notes To Financial Statements For The Year Ended March 31, 2013 II. Notes To Financial Statements For The Year Ended March 31, 2013
14. INVENTORIES Rs. in Lacs Particulars As at
March 31, 2013
As at
March 31, 2012Raw Materials 3,078.57 2,662.38 Work in Progress 196.27 211.13 Stores & Spares 1,024.84 1,055.20 Finished Goods (manufactured goods including marble) 11,314.89 13,057.31 Stock in Trade (trading) Vitrified Tiles 4,729.12 18,080.88 Ceramic Tiles 2,793.28 3,848.86 Goods In Transit 134.02 20.75 Total 23,270.99 38,936.51
20. SALES Rs. in Lacs Particulars As at
March 31, 2013
As at
March 31, 2012Ceramic Tiles 35,311.06 27,628.14 Vitrified Tiles 43,813.09 52,818.45 Marble 6,945.21 14,404.28 Tiles and related products 86,069.36 94,850.87 Real Estate 1,849.52 1119.65Total 87,918.88 95,970.52
21. COST OF MATERIALS CONSUMED Inventory at the beginning of the year 2,662.38 3,370.29 Add: Purchases 12,325.33 15,218.24 14,987.71 18,588.53 Less: Inventory at the end of the year 3,078.57 2,662.38 Raw Material Consumed 11,909.14 15,926.15 Packing Material 1,382.86 1,651.83 Total Cost of Material Consumed 13,292.00 17,577.98 Purchases of stock-in-trade 22,122.98 46,899.14 Changes in inventories of finished goods work-in-progress and Stock-in-Trade Stock in Trade - Opening 22,980.30 12,344.33 Stock in Trade - Closing 7,522.40 22,980.30 15,457.90 (10,635.97)Work in Progress - Opening 313.58 617.82 Work in Progress - Closing 196.27 313.58 117.31 304.24 Finished Goods - Opening 13,057.32 13,766.70 Finished Goods - Closing 11,314.89 13,057.32 1,742.42 709.38 Total Change in Inventories 17,317.63 (9,622.35)
15. INVENTORIES – REAL ESTATELand at Kanjurmarg 15,000.00 15,000.00 Biz Park at Thane 3,600.77 4,290.75 Total 18,600.77 19,290.75
17. CASH AND CASH EQUIVALENTSCash on Hand 18.74 36.92 Balances with Banks 2,309.28 5,671.17 Total 2,328.02 5,708.09
18. SHORT TERM LOANS AND ADVANCES Balances with Banks - Held as Margin Money 2,754.29 2,341.79Others 265.48 986.30Total 3,019.77 3,328.09
16. TRADE RECEIVABLES Unsecured and considered goodOutstanding for a period exceeding six months from the date they were due for payment 1,856.79 2,308.79Less: Provision for doubtful debts (90.77) (90.77)Others 7,734.54 7,315.13 Total 9,500.56 9,533.15
19. OTHER CURRENT ASSETS Unsecured and considered good Security Deposits 2,537.58 2,331.40Income Tax Payment (Net) 1,215.07 873.99Balance with Excise & Service Tax 3,150.45 2,344.38Other Current Assets 2,443.08 2,290.22Total 9,346.18 7,839.99
21.1 Details of cost of raw material consumed:Body Material 3,081.12 3,238.19 Glaze Material 2,647.74 2,518.82 Rough marble Blocks / Slabs 5,011.54 9,476.09 Packing Material 1,382.86 1,651.83 Others (Real Estate) 1,168.74 693.05 Total 13,292.00 17,577.98
21.2 Purchases of stock- in- tradeVitrified Tiles 18,835.15 41,339.92 Ceramic Tiles 3,287.83 5,559.22 Total 22,122.98 46,899.14

NIT
CO
Lim
ited
Ann
ual R
epor
t 20
12-1
3
66 67
II. Notes To Financial Statements For The Year Ended March 31, 2013 II. Notes To Financial Statements For The Year Ended March 31, 2013
22. EMPLOYEES BENEFIT EXPENSES (REFER NOTE 34) Rs. in Lacs Particulars As at
March 31, 2013
As at
March 31, 2012Salaries and incentives 5,975.43 3,930.84 Contributions to Provident & Other Funds 378.58 402.94 Staff Welfare Expenses 212.13 331.31 Total 6,566.14 4,665.09
28. EARNINGS IN FOREIGN EXCHANGE (EXPORTS) Rs. in Lacs Particulars As at
March 31, 2013
As at
March 31, 2012FOB Value of Exports 1,220.25 835.27 Revenue from Carbon Credits 13.49 13.29 Total 1,233.74 848.56
27. VALUE OF RAW MATERIALS, SPARES AND COMPONENTS CONSUMED DURING THE YEAR: Particulars March 31, 2013 March 31, 2012
Rs. in Lacs % Rs. in Lacs %Raw Materials Imported 5,094.80 38.33% 4,393.54 24.99%Indigenous 8,197.20 61.67% 13,184.44 75.01%Total 13,292.00 100.00% 17,577.98 100.00%Spares & Components Imported 837.40 49.96% 281.96 34.09%Indigenous 838.85 50.04% 545.23 65.91%Total 1,676.25 100.00% 827.19 100.00%
24. OTHER EXPENSES Power and fuel. 5,309.25 3,825.18 Consumption of stores and spare parts. 1,676.25 827.19 Rent Rates and Taxes 2,369.51 1,320.03 Electricity Charges Office & Depot 116.63 111.08 Processing Charges Mosaico/Marble 217.38 220.81 Water Charges 44.60 52.07 Postage and Telephone 284.98 266.76 Printing and Stationery 39.72 71.97 Insurance 124.23 230.23 Legal and Professional Fees 521.41 56.67 Travelling & Conveyance Expenses 1,198.04 811.12 Audit Fees 26.66 26.00 Hire Charges 240.62 219.32 Security Charges 92.88 71.29 Repairs and Maintenance Buildings 24.43 24.18 Machinery 183.43 87.50 Others Repairs & Maintenance 213.79 175.58 Advertisement & Sales Promotion Expenses 1,044.17 907.75 Freight Forwarding & Distribution Expenses 6,286.44 4,832.04 C&F Charges 1,544.62 1,491.42 Bad Debts 27.45 24.26 Miscellaneous Expenses 177.41 189.84 Total 21,763.90 15,842.29
23. FINANCE COST (REFER NOTE 37)Interest expense 12,817.12 5,478.74 Other borrowing costs 626.86 1,022.94 Applicable net gain/loss on foreign currency transactions and translation 1,723.41 1,009.71 Total 15,167.39 7,511.39
Note: Interest Expense is net of Rs. Nil (previous year Rs. 2,520.38 Lacs) being the interest capitalized pertaining to qualifying assets.
29. VALUE OF IMPORTS CALCULATED ON CIF BASIS:Goods for Resale 6,350.12 33,200.54 Raw Material 3,348.11 2,340.28 Capital Goods 409.00 28.33 Spare Parts & Components 647.46 441.49 Total 10,754.69 36,010.64
30. EXPENDITURE IN FOREIGN CURRENCY:Interest 563.68 507.11 Travel & Lodging 335.07 258.05 Total 898.75 765.16
31. PAYMENT TO AUDITORSStatutory audit fees 26.66 26.00 Total 26.66 26.00
25. The management has identified obsolete, slow moving and defective inventory of Rs. Nil (previous Year Rs. 3,447.47 Lacs) and
the same has been written off as exceptional items.
26. PROVISION FOR TAXATION
i. Current year charge:
No provision for Income tax has been made on account of losses during the year.
ii. Deferred Tax:
The Company has been recognizing in the financial statements the deferred tax assets / liabilities, in accordance with
Accounting Standard 22 “Accounting for Taxes on Income” issued by the Institute of Chartered Accountants of India. No
provision for deferred tax has been made on account of losses during the year.
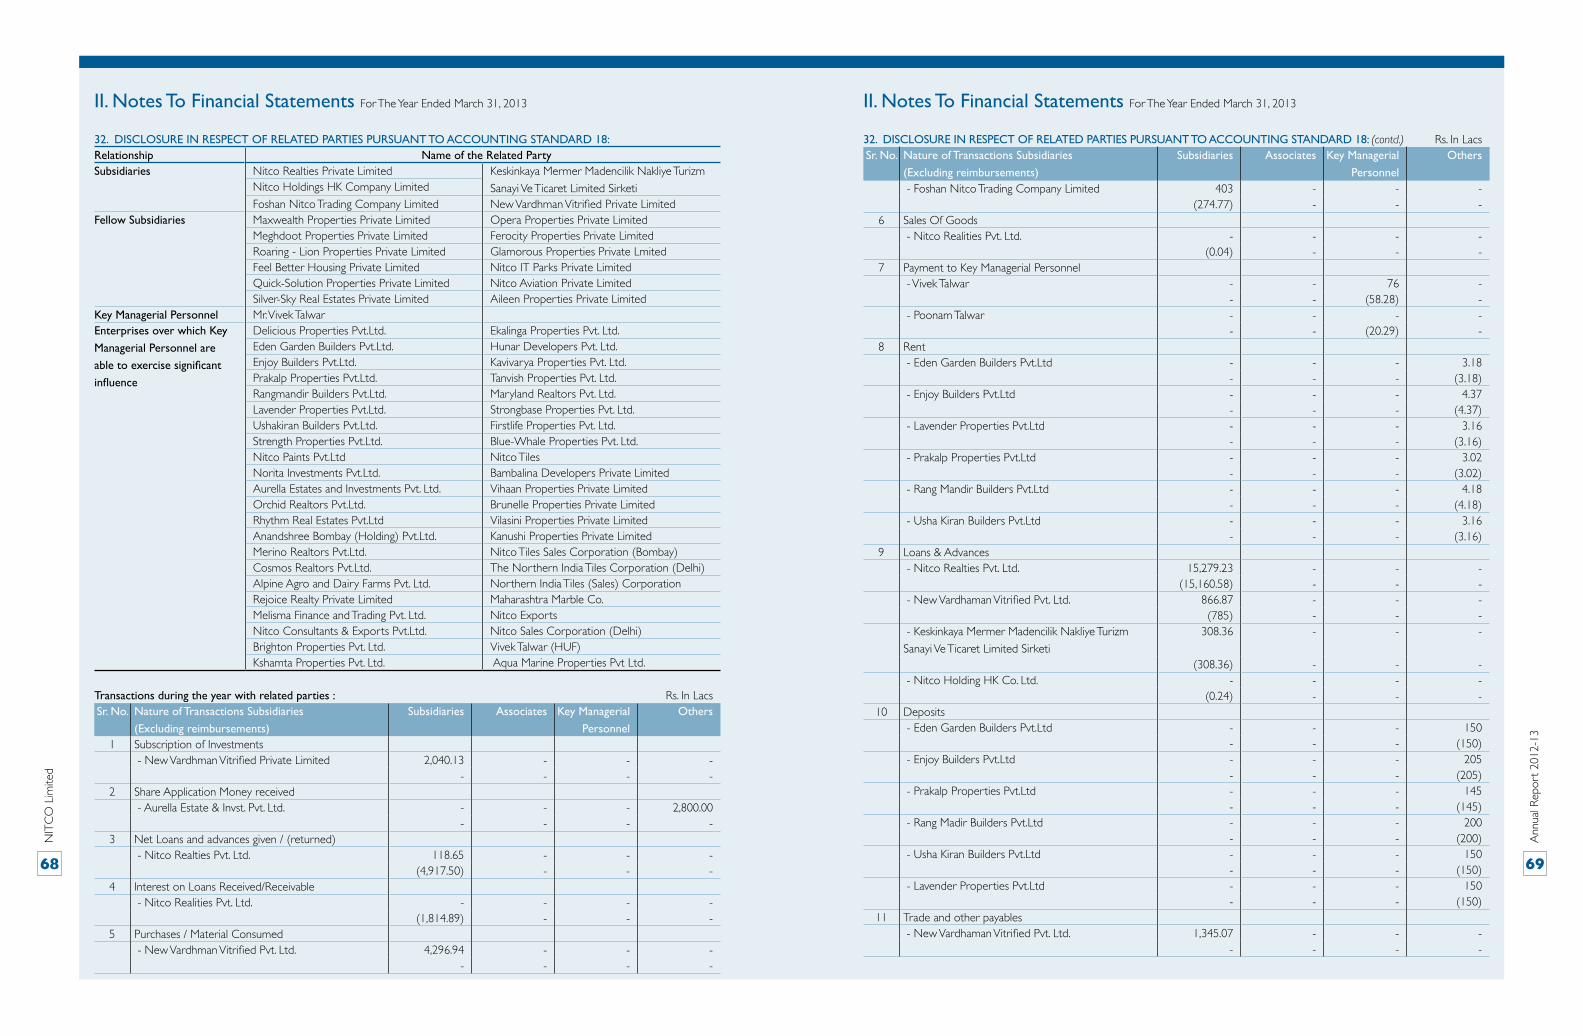
NIT
CO
Lim
ited
Ann
ual R
epor
t 20
12-1
3
68 69
II. Notes To Financial Statements For The Year Ended March 31, 2013 II. Notes To Financial Statements For The Year Ended March 31, 2013
32. DISCLOSURE IN RESPECT OF RELATED PARTIES PURSUANT TO ACCOUNTING STANDARD 18:Relationship Name of the Related PartySubsidiaries Nitco Realties Private Limited Keskinkaya Mermer Madencilik Nakliye Turizm
Sanayi Ve Ticaret Limited SirketiNitco Holdings HK Company Limited
Foshan Nitco Trading Company Limited New Vardhman Vitrified Private LimitedFellow Subsidiaries Maxwealth Properties Private Limited Opera Properties Private Limited
Meghdoot Properties Private Limited Ferocity Properties Private LimitedRoaring - Lion Properties Private Limited Glamorous Properties Private LmitedFeel Better Housing Private Limited Nitco IT Parks Private LimitedQuick-Solution Properties Private Limited Nitco Aviation Private LimitedSilver-Sky Real Estates Private Limited Aileen Properties Private Limited
Key Managerial Personnel Mr. Vivek TalwarEnterprises over which Key
Managerial Personnel are
able to exercise significant
influence
Delicious Properties Pvt.Ltd. Ekalinga Properties Pvt. Ltd.Eden Garden Builders Pvt.Ltd. Hunar Developers Pvt. Ltd.Enjoy Builders Pvt.Ltd. Kavivarya Properties Pvt. Ltd.Prakalp Properties Pvt.Ltd. Tanvish Properties Pvt. Ltd.Rangmandir Builders Pvt.Ltd. Maryland Realtors Pvt. Ltd.Lavender Properties Pvt.Ltd. Strongbase Properties Pvt. Ltd.Ushakiran Builders Pvt.Ltd. Firstlife Properties Pvt. Ltd.Strength Properties Pvt.Ltd. Blue-Whale Properties Pvt. Ltd.Nitco Paints Pvt.Ltd Nitco TilesNorita Investments Pvt.Ltd. Bambalina Developers Private LimitedAurella Estates and Investments Pvt. Ltd. Vihaan Properties Private LimitedOrchid Realtors Pvt.Ltd. Brunelle Properties Private LimitedRhythm Real Estates Pvt.Ltd Vilasini Properties Private LimitedAnandshree Bombay (Holding) Pvt.Ltd. Kanushi Properties Private LimitedMerino Realtors Pvt.Ltd. Nitco Tiles Sales Corporation (Bombay)Cosmos Realtors Pvt.Ltd. The Northern India Tiles Corporation (Delhi)Alpine Agro and Dairy Farms Pvt. Ltd. Northern India Tiles (Sales) CorporationRejoice Realty Private Limited Maharashtra Marble Co.Melisma Finance and Trading Pvt. Ltd. Nitco ExportsNitco Consultants & Exports Pvt.Ltd. Nitco Sales Corporation (Delhi)Brighton Properties Pvt. Ltd. Vivek Talwar (HUF)Kshamta Properties Pvt. Ltd. Aqua Marine Properties Pvt Ltd.
Transactions during the year with related parties : Rs. In LacsSr. No. Nature of Transactions Subsidiaries
(Excluding reimbursements)
Subsidiaries Associates Key Managerial
Personnel
Others
1 Subscription of Investments - New Vardhman Vitrified Private Limited 2,040.13 - - -
- - - - 2 Share Application Money received
- Aurella Estate & Invst. Pvt. Ltd. - - - 2,800.00 - - - -
3 Net Loans and advances given / (returned) - Nitco Realties Pvt. Ltd. 118.65 - - -
(4,917.50) - - - 4 Interest on Loans Received/Receivable
- Nitco Realities Pvt. Ltd. - - - -(1,814.89) - - -
5 Purchases / Material Consumed - New Vardhman Vitrified Pvt. Ltd. 4,296.94 - - -
- - - -
- Foshan Nitco Trading Company Limited 403 - - -(274.77) - - -
6 Sales Of Goods - Nitco Realities Pvt. Ltd. - - - -
(0.04) - - - 7 Payment to Key Managerial Personnel
- Vivek Talwar - - 76 - - - (58.28) -
- Poonam Talwar - - - - - - (20.29) -
8 Rent - Eden Garden Builders Pvt.Ltd - - - 3.18
- - - (3.18) - Enjoy Builders Pvt.Ltd - - - 4.37
- - - (4.37) - Lavender Properties Pvt.Ltd - - - 3.16
- - - (3.16) - Prakalp Properties Pvt.Ltd - - - 3.02
- - - (3.02) - Rang Mandir Builders Pvt.Ltd - - - 4.18
- - - (4.18) - Usha Kiran Builders Pvt.Ltd - - - 3.16
- - - (3.16)9 Loans & Advances
- Nitco Realties Pvt. Ltd. 15,279.23 - - -(15,160.58) - - -
- New Vardhaman Vitrified Pvt. Ltd. 866.87 - - -(785) - - -
- Keskinkaya Mermer Madencilik Nakliye Turizm
Sanayi Ve Ticaret Limited Sirketi
308.36 - - -
(308.36) - - - - Nitco Holding HK Co. Ltd. - - - -
(0.24) - - - 10 Deposits
- Eden Garden Builders Pvt.Ltd - - - 150 - - - (150)
- Enjoy Builders Pvt.Ltd - - - 205 - - - (205)
- Prakalp Properties Pvt.Ltd - - - 145 - - - (145)
- Rang Madir Builders Pvt.Ltd - - - 200 - - - (200)
- Usha Kiran Builders Pvt.Ltd - - - 150 - - - (150)
- Lavender Properties Pvt.Ltd - - - 150 - - - (150)
11 Trade and other payables - New Vardhaman Vitrified Pvt. Ltd. 1,345.07 - - -
- - - -
32. DISCLOSURE IN RESPECT OF RELATED PARTIES PURSUANT TO ACCOUNTING STANDARD 18: (contd.) Rs. In LacsSr. No. Nature of Transactions Subsidiaries
(Excluding reimbursements)
Subsidiaries Associates Key Managerial
Personnel
Others
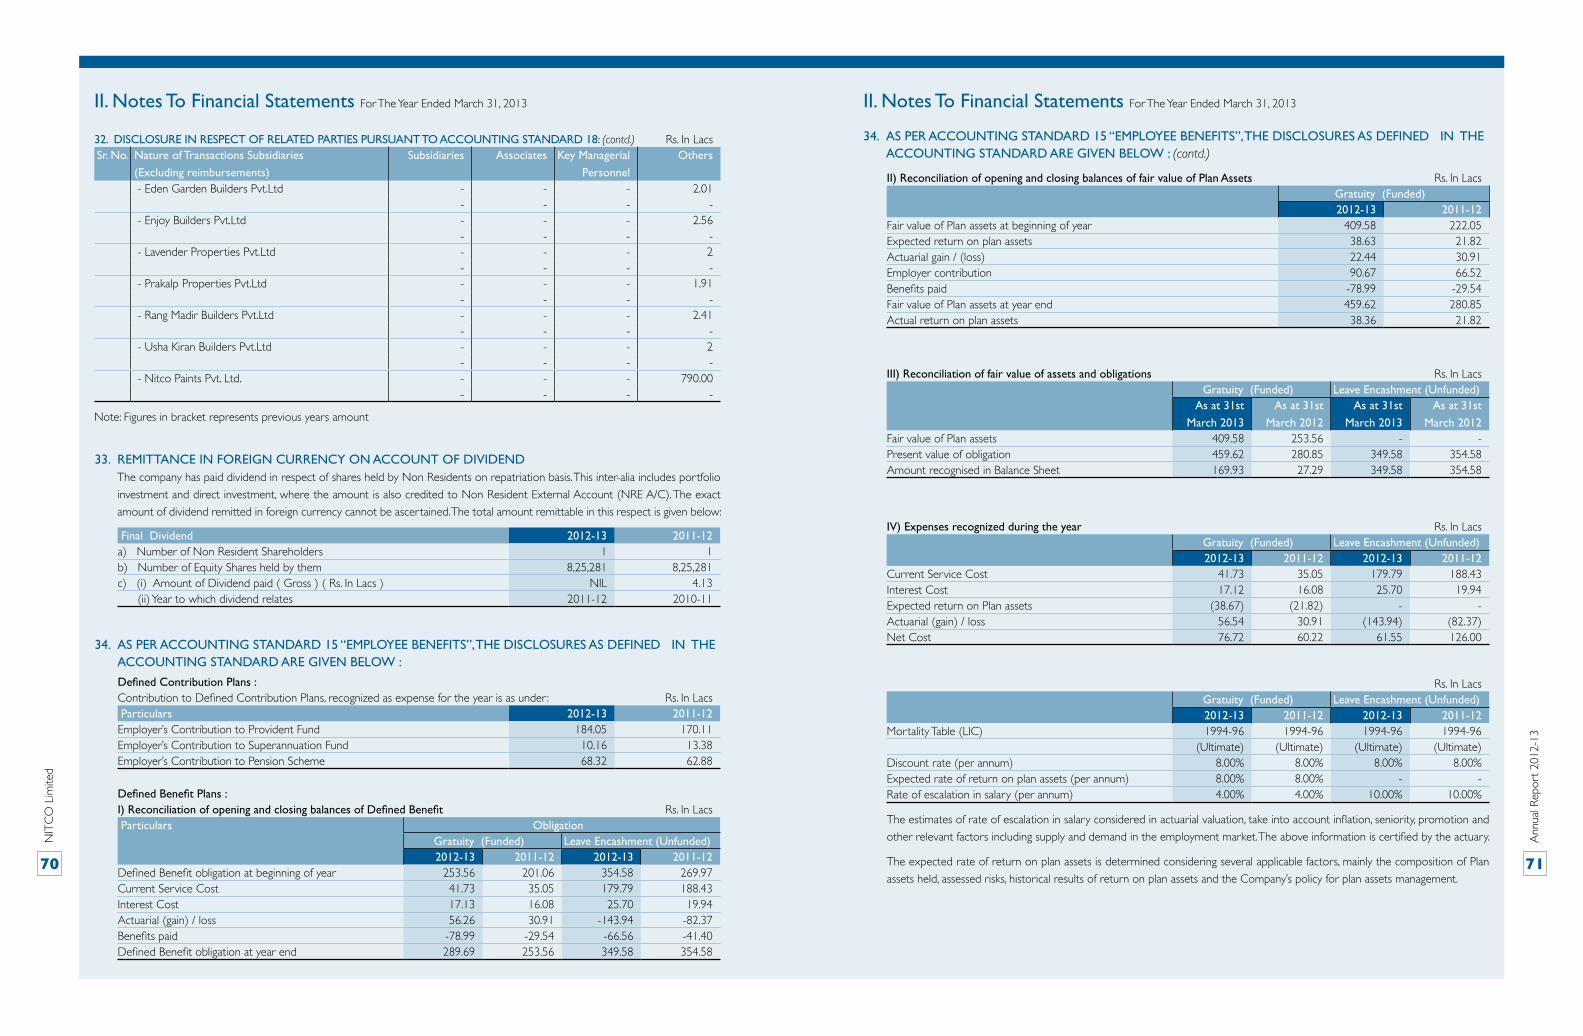
NIT
CO
Lim
ited
Ann
ual R
epor
t 20
12-1
3
70 71
II. Notes To Financial Statements For The Year Ended March 31, 2013 II. Notes To Financial Statements For The Year Ended March 31, 2013
32. DISCLOSURE IN RESPECT OF RELATED PARTIES PURSUANT TO ACCOUNTING STANDARD 18: (contd.) Rs. In LacsSr. No. Nature of Transactions Subsidiaries
(Excluding reimbursements)
Subsidiaries Associates Key Managerial
Personnel
Others
33. REMITTANCE IN FOREIGN CURRENCY ON ACCOUNT OF DIVIDEND The company has paid dividend in respect of shares held by Non Residents on repatriation basis. This inter-alia includes portfolio
investment and direct investment, where the amount is also credited to Non Resident External Account (NRE A/C). The exact
amount of dividend remitted in foreign currency cannot be ascertained. The total amount remittable in this respect is given below:
Final Dividend 2012-13 2011-12a) Number of Non Resident Shareholders 1 1b) Number of Equity Shares held by them 8,25,281 8,25,281c) (i) Amount of Dividend paid ( Gross ) ( Rs. In Lacs ) NIL 4.13 (ii) Year to which dividend relates 2011-12 2010-11
34. AS PER ACCOUNTING STANDARD 15 “EMPLOYEE BENEFITS”, THE DISCLOSURES AS DEFINED IN THE ACCOUNTING STANDARD ARE GIVEN BELOW :
Defined Contribution Plans : Contribution to Defined Contribution Plans, recognized as expense for the year is as under: Rs. In Lacs Particulars 2012-13 2011-12Employer’s Contribution to Provident Fund 184.05 170.11Employer’s Contribution to Superannuation Fund 10.16 13.38Employer’s Contribution to Pension Scheme 68.32 62.88
Defined Benefit Plans :I) Reconciliation of opening and closing balances of Defined Benefit Rs. In Lacs Particulars Obligation
Gratuity (Funded) Leave Encashment (Unfunded)2012-13 2011-12 2012-13 2011-12
Defined Benefit obligation at beginning of year 253.56 201.06 354.58 269.97Current Service Cost 41.73 35.05 179.79 188.43Interest Cost 17.13 16.08 25.70 19.94Actuarial (gain) / loss 56.26 30.91 -143.94 -82.37Benefits paid -78.99 -29.54 -66.56 -41.40Defined Benefit obligation at year end 289.69 253.56 349.58 354.58
III) Reconciliation of fair value of assets and obligations Rs. In LacsGratuity (Funded) Leave Encashment (Unfunded)
As at 31st
March 2013
As at 31st
March 2012
As at 31st
March 2013
As at 31st
March 2012Fair value of Plan assets 409.58 253.56 - - Present value of obligation 459.62 280.85 349.58 354.58Amount recognised in Balance Sheet 169.93 27.29 349.58 354.58
IV) Expenses recognized during the year Rs. In LacsGratuity (Funded) Leave Encashment (Unfunded)2012-13 2011-12 2012-13 2011-12
Current Service Cost 41.73 35.05 179.79 188.43Interest Cost 17.12 16.08 25.70 19.94Expected return on Plan assets (38.67) (21.82) - -Actuarial (gain) / loss 56.54 30.91 (143.94) (82.37)Net Cost 76.72 60.22 61.55 126.00
Rs. In LacsGratuity (Funded) Leave Encashment (Unfunded)2012-13 2011-12 2012-13 2011-12
Mortality Table (LIC) 1994-96 1994-96 1994-96 1994-96(Ultimate) (Ultimate) (Ultimate) (Ultimate)
Discount rate (per annum) 8.00% 8.00% 8.00% 8.00%Expected rate of return on plan assets (per annum) 8.00% 8.00% - -Rate of escalation in salary (per annum) 4.00% 4.00% 10.00% 10.00%
II) Reconciliation of opening and closing balances of fair value of Plan Assets Rs. In LacsGratuity (Funded)2012-13 2011-12
Fair value of Plan assets at beginning of year 409.58 222.05Expected return on plan assets 38.63 21.82Actuarial gain / (loss) 22.44 30.91Employer contribution 90.67 66.52Benefits paid -78.99 -29.54Fair value of Plan assets at year end 459.62 280.85Actual return on plan assets 38.36 21.82
34. AS PER ACCOUNTING STANDARD 15 “EMPLOYEE BENEFITS”, THE DISCLOSURES AS DEFINED IN THE ACCOUNTING STANDARD ARE GIVEN BELOW : (contd.)
The estimates of rate of escalation in salary considered in actuarial valuation, take into account inflation, seniority, promotion and
other relevant factors including supply and demand in the employment market. The above information is certified by the actuary.
The expected rate of return on plan assets is determined considering several applicable factors, mainly the composition of Plan
assets held, assessed risks, historical results of return on plan assets and the Company’s policy for plan assets management.
- Eden Garden Builders Pvt.Ltd - - - 2.01 - - - -
- Enjoy Builders Pvt.Ltd - - - 2.56 - - - -
- Lavender Properties Pvt.Ltd - - - 2 - - - -
- Prakalp Properties Pvt.Ltd - - - 1.91 - - - -
- Rang Madir Builders Pvt.Ltd - - - 2.41 - - - -
- Usha Kiran Builders Pvt.Ltd - - - 2 - - - -
- Nitco Paints Pvt. Ltd. - - - 790.00- - - -
Note: Figures in bracket represents previous years amount
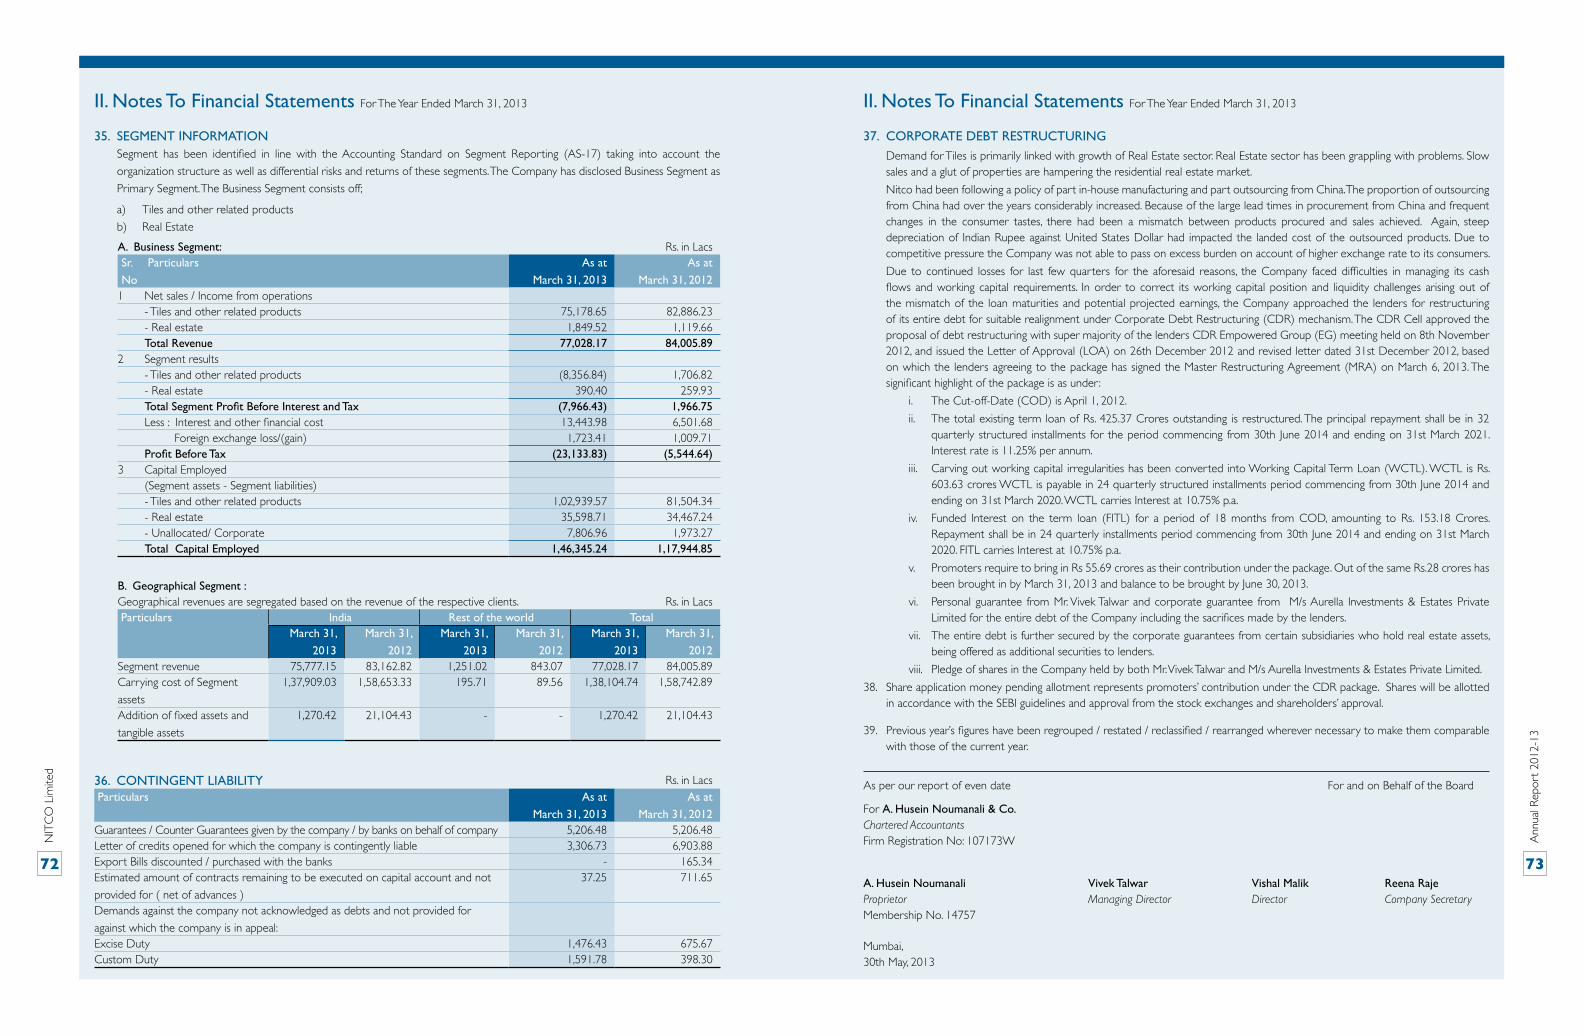
NIT
CO
Lim
ited
Ann
ual R
epor
t 20
12-1
3
72 73
II. Notes To Financial Statements For The Year Ended March 31, 2013 II. Notes To Financial Statements For The Year Ended March 31, 2013
35. SEGMENT INFORMATION Segment has been identified in line with the Accounting Standard on Segment Reporting (AS-17) taking into account the
organization structure as well as differential risks and returns of these segments. The Company has disclosed Business Segment as
Primary Segment. The Business Segment consists off;
a) Tiles and other related products
b) Real Estate
A. Business Segment: Rs. in LacsSr.
No
Particulars As at
March 31, 2013
As at
March 31, 20121 Net sales / Income from operations - Tiles and other related products 75,178.65 82,886.23 - Real estate 1,849.52 1,119.66 Total Revenue 77,028.17 84,005.89 2 Segment results - Tiles and other related products (8,356.84) 1,706.82 - Real estate 390.40 259.93 Total Segment Profit Before Interest and Tax (7,966.43) 1,966.75 Less : Interest and other financial cost 13,443.98 6,501.68 Foreign exchange loss/(gain) 1,723.41 1,009.71 Profit Before Tax (23,133.83) (5,544.64)3 Capital Employed (Segment assets - Segment liabilities) - Tiles and other related products 1,02,939.57 81,504.34 - Real estate 35,598.71 34,467.24 - Unallocated/ Corporate 7,806.96 1,973.27 Total Capital Employed 1,46,345.24 1,17,944.85
B. Geographical Segment :Geographical revenues are segregated based on the revenue of the respective clients. Rs. in Lacs Particulars India Rest of the world Total
March 31,
2013
March 31,
2012
March 31,
2013
March 31,
2012
March 31,
2013
March 31,
2012Segment revenue 75,777.15 83,162.82 1,251.02 843.07 77,028.17 84,005.89 Carrying cost of Segment
assets
1,37,909.03 1,58,653.33 195.71 89.56 1,38,104.74 1,58,742.89
Addition of fixed assets and
tangible assets
1,270.42 21,104.43 - - 1,270.42 21,104.43
36. CONTINGENT LIABILITY Rs. in Lacs Particulars As at
March 31, 2013
As at
March 31, 2012Guarantees / Counter Guarantees given by the company / by banks on behalf of company 5,206.48 5,206.48 Letter of credits opened for which the company is contingently liable 3,306.73 6,903.88 Export Bills discounted / purchased with the banks - 165.34 Estimated amount of contracts remaining to be executed on capital account and not
provided for ( net of advances )
37.25 711.65
Demands against the company not acknowledged as debts and not provided for
against which the company is in appeal:
Excise Duty 1,476.43 675.67 Custom Duty 1,591.78 398.30
37. CORPORATE DEBT RESTRUCTURING
Demand for Tiles is primarily linked with growth of Real Estate sector. Real Estate sector has been grappling with problems. Slow sales and a glut of properties are hampering the residential real estate market.
Nitco had been following a policy of part in-house manufacturing and part outsourcing from China. The proportion of outsourcing from China had over the years considerably increased. Because of the large lead times in procurement from China and frequent changes in the consumer tastes, there had been a mismatch between products procured and sales achieved. Again, steep depreciation of Indian Rupee against United States Dollar had impacted the landed cost of the outsourced products. Due to competitive pressure the Company was not able to pass on excess burden on account of higher exchange rate to its consumers.
Due to continued losses for last few quarters for the aforesaid reasons, the Company faced difficulties in managing its cash flows and working capital requirements. In order to correct its working capital position and liquidity challenges arising out of the mismatch of the loan maturities and potential projected earnings, the Company approached the lenders for restructuring of its entire debt for suitable realignment under Corporate Debt Restructuring (CDR) mechanism. The CDR Cell approved the proposal of debt restructuring with super majority of the lenders CDR Empowered Group (EG) meeting held on 8th November 2012, and issued the Letter of Approval (LOA) on 26th December 2012 and revised letter dated 31st December 2012, based on which the lenders agreeing to the package has signed the Master Restructuring Agreement (MRA) on March 6, 2013. The significant highlight of the package is as under:
i. The Cut-off-Date (COD) is April 1, 2012.
ii. The total existing term loan of Rs. 425.37 Crores outstanding is restructured. The principal repayment shall be in 32 quarterly structured installments for the period commencing from 30th June 2014 and ending on 31st March 2021. Interest rate is 11.25% per annum.
iii. Carving out working capital irregularities has been converted into Working Capital Term Loan (WCTL). WCTL is Rs. 603.63 crores WCTL is payable in 24 quarterly structured installments period commencing from 30th June 2014 and ending on 31st March 2020. WCTL carries Interest at 10.75% p.a.
iv. Funded Interest on the term loan (FITL) for a period of 18 months from COD, amounting to Rs. 153.18 Crores. Repayment shall be in 24 quarterly installments period commencing from 30th June 2014 and ending on 31st March 2020. FITL carries Interest at 10.75% p.a.
v. Promoters require to bring in Rs 55.69 crores as their contribution under the package. Out of the same Rs.28 crores has been brought in by March 31, 2013 and balance to be brought by June 30, 2013.
vi. Personal guarantee from Mr. Vivek Talwar and corporate guarantee from M/s Aurella Investments & Estates Private Limited for the entire debt of the Company including the sacrifices made by the lenders.
vii. The entire debt is further secured by the corporate guarantees from certain subsidiaries who hold real estate assets, being offered as additional securities to lenders.
viii. Pledge of shares in the Company held by both Mr. Vivek Talwar and M/s Aurella Investments & Estates Private Limited.
38. Share application money pending allotment represents promoters’ contribution under the CDR package. Shares will be allotted in accordance with the SEBI guidelines and approval from the stock exchanges and shareholders’ approval.
39. Previous year’s figures have been regrouped / restated / reclassified / rearranged wherever necessary to make them comparable with those of the current year.
As per our report of even date For and on Behalf of the Board
For A. Husein Noumanali & Co.Chartered AccountantsFirm Registration No: 107173W
A. Husein Noumanali Vivek Talwar Vishal Malik Reena Raje Proprietor Managing Director Director Company SecretaryMembership No. 14757
Mumbai, 30th May, 2013

NIT
CO
Lim
ited
Ann
ual R
epor
t 20
12-1
3
74 75
Consolidated Independent Auditors’ ReportS
tate
me
nt
pu
rsu
an
t to
Se
ctio
n 2
12
of t
he
Co
mp
an
ies
Act
, 19
56
, Re
lati
ng
to s
ub
sid
iary
Co
mp
an
ies
To
The Members of Nitco Limited
Report on the Financial Statements
We have audited the accompanying financial statements of NITCO
Limited (“the Company”), and its subsidiaries (collectively referred
to as ‘Nitco group’) which comprise the Consolidated Balance Sheet
as at March 31, 2013, the Consolidated Statement of Profit and Loss
and Consolidated Cash Flow Statement for the year ended and a
summary of significant accounting policies and other explanatory
information.
Management’s Responsibility for the Consolidated Financial
Statements
Management is responsible for the preparation of these consolidated
financial statements that give a true and fair view of the consolidated
financial position, consolidated financial performance and consolidated
cash flows of the Company in accordance with the accounting
principles generally accepted in India. This responsibility includes the
design, implementation and maintenance of internal control relevant
to the preparation and presentation of the consolidated financial
statements that give a true and fair view and are free from material
misstatement, whether due to fraud or error.
Auditors’ Responsibility
Our responsibility is to express an opinion on these consolidated
financial statements based on our audit. We conducted our audit in
accordance with the Standards on Auditing issued by the Institute
of Chartered Accountants of India. Those Standards require that we
comply with ethical requirements and plan and perform the audit
to obtain reasonable assurance about whether the consolidated
financial statements are free from material misstatements.
An audit involves performing procedures to obtain audit evidence
about the amounts and disclosures in the consolidated financial
statements. The procedures selected depend on the auditor’s
judgment, including the assessment of the risks of material
misstatement of the consolidated financial statements, whether
due to fraud or error. In making those risk assessments, the auditor
considers internal control relevant to the Group’s preparation
and fair presentation of the consolidated financial statements and
gives a true and fair view in order to design audit procedures
that are appropriate in the circumstances. An audit also includes
evaluating the appropriateness of accounting policies used and the
reasonableness of the accounting estimates made by management,
as well as evaluating the overall presentation of the consolidated
financial statements.
We believe that the audit evidence we have obtained is sufficient and
appropriate to provide a basis for our audit opinion.
Opinion
The consolidated financial statement have been prepared by the
Company in accordance with the requirement of accounting
standards (AS-21) on consolidated financial statement as prescribed
by the Companies (Accounting Standard) Rules, 2006.
In our opinion and to the best of our information and according to the
explanations given to us, and based on consideration of the reports
of the other auditors on the financial statements of the subsidiaries
and associates as noted below, the consolidated financial statements
give a true and fair view in conformity with the accounting principles
generally accepted in India:
a. In the case of the Consolidated Balance Sheet, of the state of
affairs of the Nitco group as at March 31, 2013;
b. In the case of the Consolidated Statement of Profit and Loss, of
the loss for the year ended on that date; and
c. In the case of the Consolidated Cash Flow Statement, of the
cash flows for the year ended on that date.
Other Matter
7. We have not audited the financial statements / consolidated
financial statements of certain subsidiaries whose financial
statements / consolidated financial statements reflect total
assets of Rs. 35741.71 lacs as at March 31, 2013, and total net
income of Rs. 4063.33 lacs for the year ended on that. These
financial statements / consolidated financial statements have
been audited by other auditors whose reports have been
furnished to us for the purpose of consolidation and our
opinion, in so far as it relates to the amounts included in
respect of the subsidiaries is based solely on the reports of
the other auditors.8. We have relied on the unaudited financial statements of certain
subsidiaries registered in Hong Kong, Turkey and China whose
financial statements reflect total assets of Rs. 462.20 lacs and net
income of Rs. 339.26 lacs as at 31st March 2013. These financial
statements have been furnished to us by the management and
our report in so far as it relates to the amounts included is
respect of the said subsidiaries, is based solely on such unaudited
financial statements. Our opinion is not qualified in respect of
other matters.
For A. Husein Noumanali & Co.
Chartered Accountants
Firm Registration No. 107173W
(A. Husein Noumanali)
Place: Mumbai Proprietor
Date: 6th August, 2013 M.No. 14757
SrN
ame
of S
ubsi
diar
y C
ompa
ny
Nitc
o H
oldi
ngs
HK
Co.
Ltd
.
Fosh
an
Nitc
o Tr
adin
g C
o.
Ltd.
Kes
kink
aya
Mer
mer
-T
urke
y
New
Va
rdhm
an
Vitr
ified
Pvt
. Lt
d.
Nitc
o R
ealti
es P
vt.
Ltd.
Gla
mor
ous
Prop
ertie
s Pv
t. Lt
d.
Ope
ra
Prop
ertie
s Pv
t. Lt
d.
Nitc
o IT
Pa
rks
Pvt.
Ltd.
Feel
Bet
ter
Hou
sing
Pvt
Lt
d
Max
wea
lth
Prop
ertie
s Pv
t Lt
d
Nitc
o A
viat
ion
Pvt
Ltd
Qui
ck
Solu
tion
Prop
ertie
s Pv
t Lt
d
Roa
ring
-Li
on
Prop
ertie
s Pv
t Lt
d
Meg
hdoo
t Pr
oper
ties
Pvt
Ltd
Silv
er S
ky
Rea
l Est
ate
Pvt
Ltd
Fero
city
Pr
oper
ty
Pvt
Ltd
Aile
en
Prop
erty
Pv
t Lt
d
1Fi
nanc
ial y
ear
of t
he s
ubsid
iary
end
ed o
n 31
-Mar
-13
31-M
ar-1
331
-Mar
-13
31-M
ar-1
331
-Mar
-13
31-M
ar-1
331
-Mar
-13
31-M
ar-1
331
-Mar
-13
31-M
ar-1
331
-Mar
-13
31-M
ar-1
331
-Mar
-13
31-M
ar-1
331
-Mar
-13
31-M
ar-1
331
-Mar
-13
2Sh
ares
of t
he s
ubsid
iary
hel
d by
the
Com
pany
di
rect
ly o
r th
roug
h it
subs
idia
ry c
ompa
nies
on
Mar
ch 3
1,20
13
a.N
umbe
r an
d fa
ce v
alue
of E
quity
Sha
res
1000
0 O
rdin
ary
Shar
es o
f H
K$ 1
.00
each
fully
pa
id-u
p
NA
NA
1275
0000
Eq
uity
Sh
ares
of
Rs.1
0/-
each
and
47
8776
3 Pr
efer
ence
Sh
ares
of
Rs.1
0/-
each
fu
lly p
aid-
up
2000
00
Equi
ty
Shar
es o
f Re
.1/-
eac
h fu
lly p
aid-
up
9375
00
Equi
ty
Shar
es o
f Rs
.10/
- ea
ch
fully
pai
d-up
5000
Equ
ity
Shar
es o
f Rs.
100/
- ea
ch
fully
pai
d-up
1000
0 Eq
uity
Sh
ares
of
Rs.1
0/-
each
fu
lly p
aid
up
1000
0 Eq
uity
Sh
ares
of
Rs.1
0/-
each
fu
lly p
aid
up
1000
0 Eq
uity
Sh
ares
of R
s. 10
/- e
ach
fully
pai
d up
1000
00
Equi
ty
Shar
es o
f Rs
.100
/-
each
fully
pa
id u
p
1000
0 Eq
uity
Sh
ares
of
Rs.1
0/-
each
fu
lly p
aid
up
1000
0 Eq
uity
Sh
ares
of
Rs.1
0/-
each
fu
lly p
aid
up
1000
0 Eq
uity
Sh
ares
of
Rs.1
0/-
each
fu
lly p
aid
up
1000
0 Eq
uity
Sh
ares
of
Rs.1
0/-
each
fu
lly p
aid
up
1000
0 Eq
uity
Sh
ares
of
Rs.1
0/-
each
fu
lly p
aid
up
1000
0 Eq
uity
Sh
ares
of
Rs.1
0/-
each
fu
lly p
aid
up
b.Ex
tent
of h
oldi
ng (
%)
100
100
100
5110
075
100
100
100
100
100
100
100
100
100
100
100
3N
et a
ggre
gate
am
ount
of p
rofit
/ (lo
ss)
of
the
subs
idia
ry fo
r th
e fin
anci
al y
ear
of t
he
subs
idia
ry s
o fa
r as
the
y co
ncer
n m
embe
rs o
f th
e C
ompa
ny
a.D
ealt
with
in t
he a
ccou
nts
of t
he C
ompa
ny fo
r th
e ye
ar e
nded
Mar
ch 3
1, 2
013
NIL
NIL
NIL
NIL
NIL
NIL
NIL
NIL
NIL
NIL
NIL
NIL
NIL
NIL
NIL
NIL
NIL
b.N
ot d
ealt
with
in t
he a
ccou
nts
of t
he
Com
pany
for
the
year
end
ed M
arch
31,
201
3(1
.53)
(105
.75)
NIL
(362
.66)
NIL
6.71
NIL
NIL
NIL
NIL
NIL
NIL
NIL
NIL
NIL
NIL
NIL
4N
et a
ggre
gate
am
ount
of p
rofit
s / (
Loss
es)
for
prev
ious
fina
ncia
l yea
rs o
f the
sub
sidia
ry, s
ince
it
beca
me
a su
bsid
iary
so
far
as t
hey
conc
ern
mem
bers
of t
he C
ompa
ny.
a.D
ealt
with
in t
he a
ccou
nts
of t
he C
ompa
ny fo
r th
e ye
ar e
nded
Mar
ch 3
1, 2
013
NIL
NIL
NIL
NIL
NIL
NIL
NIL
NIL
NIL
NIL
NIL
NIL
NIL
NIL
NIL
NIL
NIL
b.N
ot d
ealt
with
in t
he a
ccou
nts
of t
he
Com
pany
for
the
year
end
ed M
arch
31,
201
325
.03
333.
80
NIL
NIL
1.51
(13.
34)
NIL
NIL
NIL
NIL
NIL
NIL
NIL
NIL
NIL
NIL
NIL
Info
rmat
ion
of
Su
bsi
dia
ry C
om
pan
ies
for
the
year
end
ed M
arch
31,
201
3N
ame
of S
ubsi
diar
y C
ompa
ny
Nitc
o H
oldi
ngs
HK
C
o. L
td.
Fosh
an
Nitc
o Tr
adin
g C
o.
Ltd.
Kes
kink
aya
Mer
mer
-T
urke
y
New
Va
rdhm
an
Vitr
ified
Pvt
. Lt
d.
Nitc
o R
ealti
es P
vt.
Ltd.
Gla
mor
ous
Prop
ertie
s Pv
t. Lt
d.
Ope
ra
Prop
ertie
s Pv
t. Lt
d.
Nitc
o IT
Pa
rks
Pvt.
Ltd.
Feel
Bet
ter
Hou
sing
Pvt
Lt
d
Max
wea
lth
Prop
ertie
s Pv
t Lt
d
Nitc
o A
viat
ion
Pvt
Ltd
Qui
ck
Solu
tion
Prop
ertie
s Pv
t Lt
d
Roa
ring
-Lio
n Pr
oper
ties
Pvt
Ltd
Meg
hdoo
t Pr
oper
ties
Pvt
Ltd
Silv
er S
ky
Rea
l Est
ate
Pvt
Ltd
Fero
city
Pr
oper
ty
Pvt
Ltd
Aile
en
Prop
ertie
s Pv
t Lt
d
Paid
up
Cap
ital
0.70
566.
253.
0034
38.7
8 2.
0012
5.00
5.00
1.00
1.00
1.00
100.
001.
001.
001.
001.
001.
001.
00
Rese
rves
31
.77
(571
.40)
0.00
(76.
31)
697.
3025
9.19
(0.2
5)(0
.61)
(0.2
7)(0
.25)
(0.2
0)(0
.25)
(0.2
5)(0
.25)
0.00
(0.0
7)(0
.17)
Tota
l Ass
ets
57.5
992
.90
311.
7016
103.
29
16,0
46.5
0 48
1.25
383.
7150
.46
450.
2633
4.98
103.
3624
3.82
113.
9759
6.17
436.
3139
4.37
3.27
Tota
l Lia
bilit
ies
25.1
398
.05
308.
7012
740.
82
15,3
47.2
0 97
.06
378.
9650
.07
449.
5333
4.23
3.57
243.
0711
3.22
595.
4243
5.31
393.
442.
44
Inve
stm
ents
(ex
cept
inve
stm
ent
in
subs
idia
ry c
ompa
nies
)N
iLN
iLN
iL0.
15
1.00
0.00
0.00
0.00
0.00
0.00
0.00
25.0
00.
0050
3.90
0.00
0.00
0.00
Turn
over
0.
0033
9.26
0.00
3858
.33
Nil
205.
00N
ilN
ilN
ilN
ilN
ilN
ilN
ilN
ilN
ilN
ilN
il
Profi
t be
fore
tax
atio
n (1
.53)
(105
.75)
0.00
12
2.00
N
il11
.00
Nil
Nil
Nil
Nil
Nil
Nil
Nil
Nil
Nil
Nil
Nil
Prov
ision
for
taxa
tion
NiL
NiL
NiL
484.
66
Nil
2.06
Nil
Nil
Nil
Nil
Nil
Nil
Nil
Nil
Nil
Nil
Nil
Profi
t af
ter
taxa
tion
(1.5
3)(1
05.7
5)N
iL(3
62.6
6)N
il8.
94N
ilN
ilN
ilN
ilN
ilN
ilN
ilN
ilN
ilN
ilN
il
Prop
osed
div
iden
dN
iLN
iLN
iLN
iLN
ilN
ilN
ilN
ilN
ilN
ilN
ilN
ilN
ilN
ilN
ilN
ilN
il
Rs. in
Lac
s
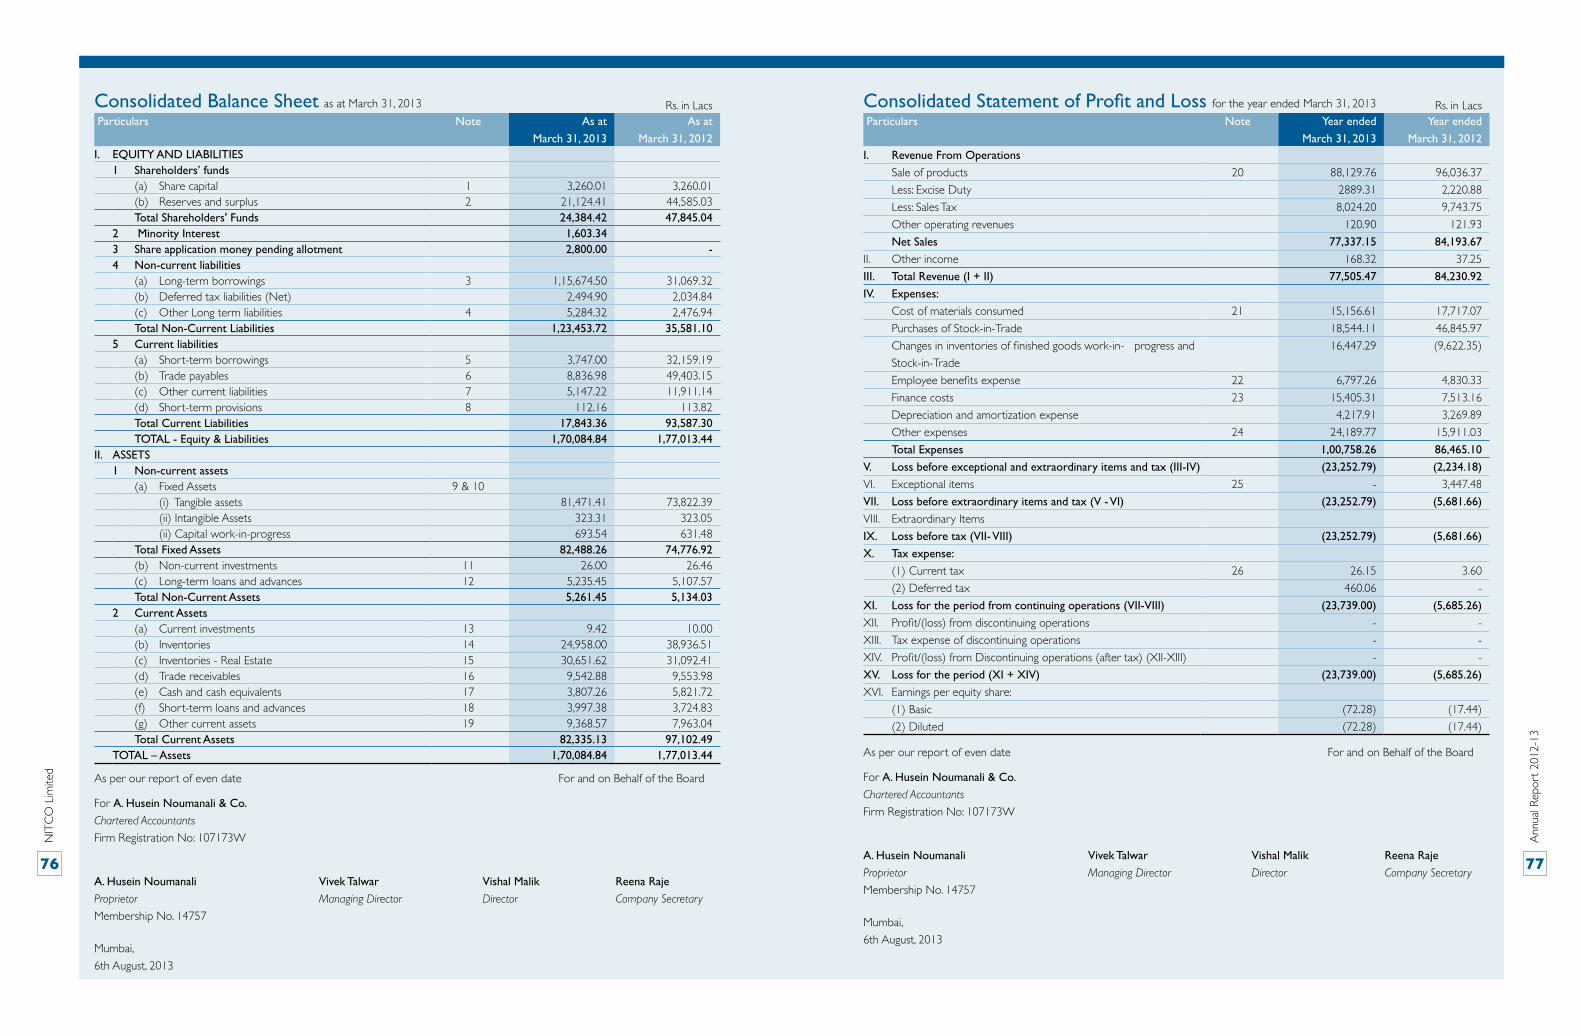
NIT
CO
Lim
ited
Ann
ual R
epor
t 20
12-1
3
76 77
Consolidated Balance Sheet as at March 31, 2013 Consolidated Statement of Profit and Loss for the year ended March 31, 2013 Rs. in Lacs Particulars Note As at
March 31, 2013
As at
March 31, 2012I. EQUITY AND LIABILITIES
1 Shareholders’ funds (a) Share capital 1 3,260.01 3,260.01 (b) Reserves and surplus 2 21,124.41 44,585.03
Total Shareholders' Funds 24,384.42 47,845.04 2 Minority Interest 1,603.343 Share application money pending allotment 2,800.00 - 4 Non-current liabilities
(a) Long-term borrowings 3 1,15,674.50 31,069.32 (b) Deferred tax liabilities (Net) 2,494.90 2,034.84 (c) Other Long term liabilities 4 5,284.32 2,476.94
Total Non-Current Liabilities 1,23,453.72 35,581.105 Current liabilities
(a) Short-term borrowings 5 3,747.00 32,159.19(b) Trade payables 6 8,836.98 49,403.15(c) Other current liabilities 7 5,147.22 11,911.14 (d) Short-term provisions 8 112.16 113.82
Total Current Liabilities 17,843.36 93,587.30 TOTAL - Equity & Liabilities 1,70,084.84 1,77,013.44II. ASSETS 1 Non-current assets
(a) Fixed Assets 9 & 10 (i) Tangible assets 81,471.41 73,822.39
(ii) Intangible Assets 323.31 323.05 (ii) Capital work-in-progress 693.54 631.48 Total Fixed Assets 82,488.26 74,776.92
(b) Non-current investments 11 26.00 26.46(c) Long-term loans and advances 12 5,235.45 5,107.57
Total Non-Current Assets 5,261.45 5,134.032 Current Assets
(a) Current investments 13 9.42 10.00 (b) Inventories 14 24,958.00 38,936.51 (c) Inventories - Real Estate 15 30,651.62 31,092.41(d) Trade receivables 16 9,542.88 9,553.98 (e) Cash and cash equivalents 17 3,807.26 5,821.72 (f) Short-term loans and advances 18 3,997.38 3,724.83 (g) Other current assets 19 9,368.57 7,963.04
Total Current Assets 82,335.13 97,102.49 TOTAL – Assets 1,70,084.84 1,77,013.44
Rs. in Lacs Particulars Note Year ended
March 31, 2013
Year ended
March 31, 2012I. Revenue From Operations
Sale of products 20 88,129.76 96,036.37
Less: Excise Duty 2889.31 2,220.88
Less: Sales Tax 8,024.20 9,743.75
Other operating revenues 120.90 121.93
Net Sales 77,337.15 84,193.67
II. Other income 168.32 37.25
III. Total Revenue (I + II) 77,505.47 84,230.92
IV. Expenses:
Cost of materials consumed 21 15,156.61 17,717.07
Purchases of Stock-in-Trade 18,544.11 46,845.97
Changes in inventories of finished goods work-in- progress and
Stock-in-Trade
16,447.29 (9,622.35)
Employee benefits expense 22 6,797.26 4,830.33
Finance costs 23 15,405.31 7,513.16
Depreciation and amortization expense 4,217.91 3,269.89
Other expenses 24 24,189.77 15,911.03
Total Expenses 1,00,758.26 86,465.10
V. Loss before exceptional and extraordinary items and tax (III-IV) (23,252.79) (2,234.18)
VI. Exceptional items 25 - 3,447.48
VII. Loss before extraordinary items and tax (V - VI) (23,252.79) (5,681.66)
VIII. Extraordinary Items
IX. Loss before tax (VII- VIII) (23,252.79) (5,681.66)
X. Tax expense:
(1) Current tax 26 26.15 3.60
(2) Deferred tax 460.06 -
XI. Loss for the period from continuing operations (VII-VIII) (23,739.00) (5,685.26)
XII. Profit/(loss) from discontinuing operations - -
XIII. Tax expense of discontinuing operations - -
XIV. Profit/(loss) from Discontinuing operations (after tax) (XII-XIII) - -
XV. Loss for the period (XI + XIV) (23,739.00) (5,685.26)
XVI. Earnings per equity share:
(1) Basic (72.28) (17.44)
(2) Diluted (72.28) (17.44)
As per our report of even date For and on Behalf of the Board
For A. Husein Noumanali & Co.
Chartered Accountants
Firm Registration No: 107173W
A. Husein Noumanali Vivek Talwar Vishal Malik Reena Raje
Proprietor Managing Director Director Company Secretary
Membership No. 14757
Mumbai,
6th August, 2013
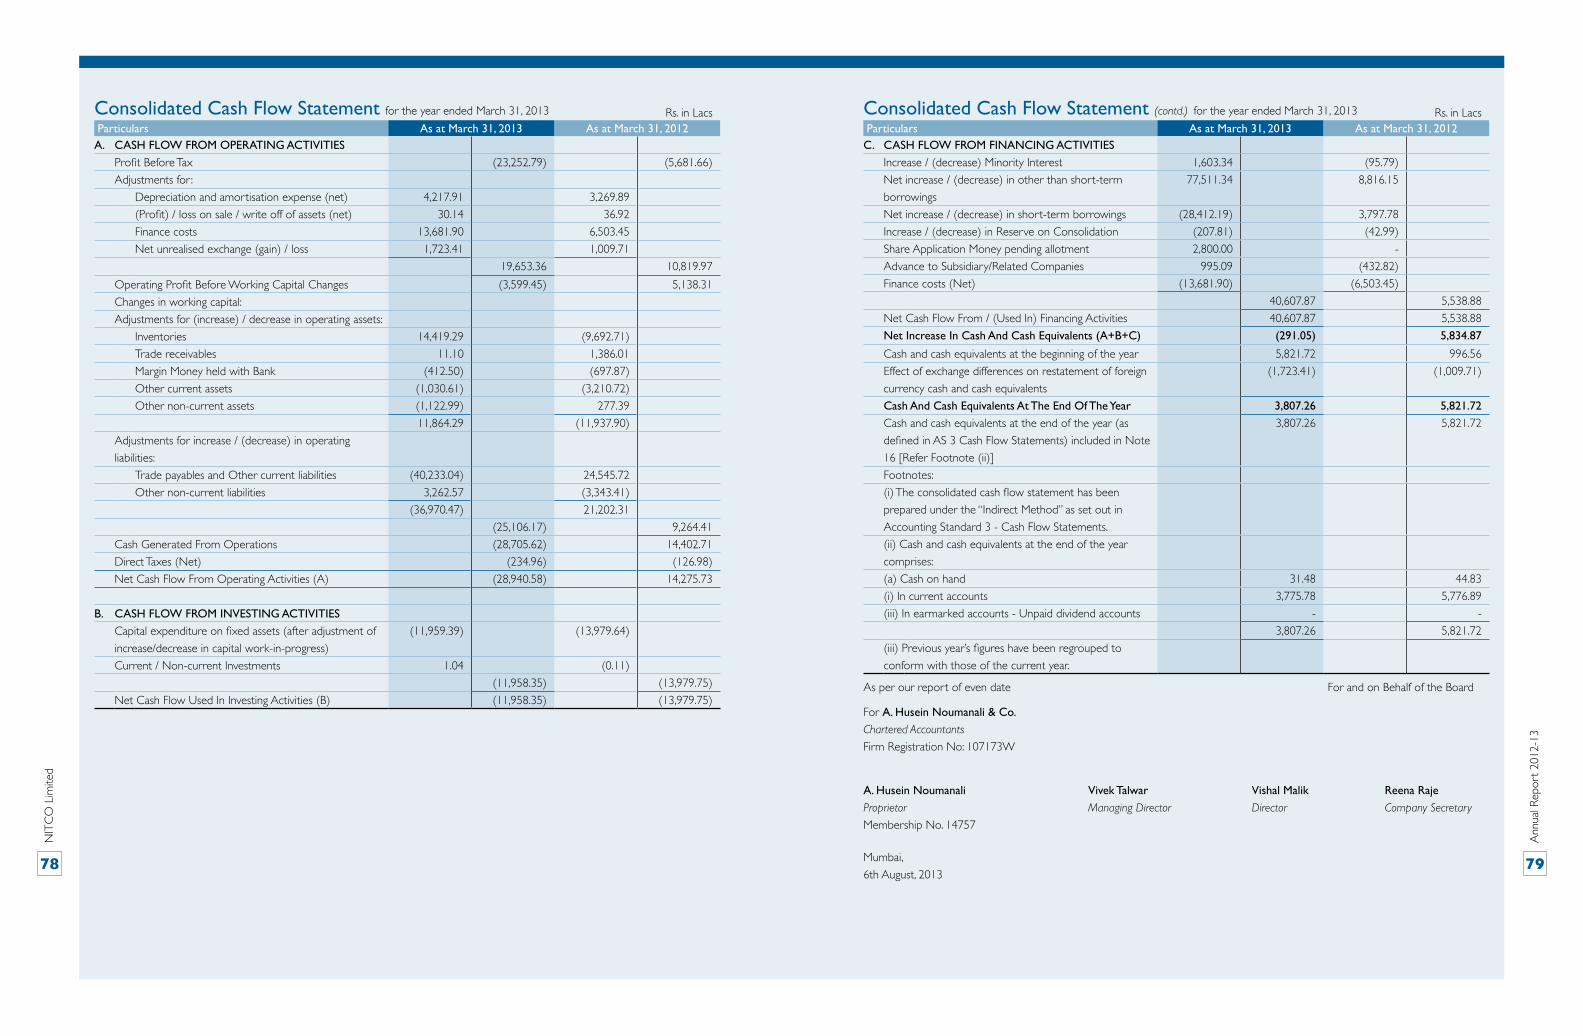
NIT
CO
Lim
ited
Ann
ual R
epor
t 20
12-1
3
78 79
Consolidated Cash Flow Statement for the year ended March 31, 2013 Consolidated Cash Flow Statement (contd.) for the year ended March 31, 2013 Rs. in Lacs Particulars As at March 31, 2013 As at March 31, 2012A. CASH FLOW FROM OPERATING ACTIVITIES
Profit Before Tax (23,252.79) (5,681.66)
Adjustments for :
Depreciation and amortisation expense (net) 4,217.91 3,269.89
(Profit) / loss on sale / write off of assets (net) 30.14 36.92
Finance costs 13,681.90 6,503.45
Net unrealised exchange (gain) / loss 1,723.41 1,009.71
19,653.36 10,819.97
Operating Profit Before Working Capital Changes (3,599.45) 5,138.31
Changes in working capital:
Adjustments for (increase) / decrease in operating assets:
Inventories 14,419.29 (9,692.71)
Trade receivables 11.10 1,386.01
Margin Money held with Bank (412.50) (697.87)
Other current assets (1,030.61) (3,210.72)
Other non-current assets (1,122.99) 277.39
11,864.29 (11,937.90)
Adjustments for increase / (decrease) in operating
liabilities:
Trade payables and Other current liabilities (40,233.04) 24,545.72
Other non-current liabilities 3,262.57 (3,343.41)
(36,970.47) 21,202.31
(25,106.17) 9,264.41
Cash Generated From Operations (28,705.62) 14,402.71
Direct Taxes (Net) (234.96) (126.98)
Net Cash Flow From Operating Activities (A) (28,940.58) 14,275.73
B. CASH FLOW FROM INVESTING ACTIVITIES
Capital expenditure on fixed assets (after adjustment of
increase/decrease in capital work-in-progress)
(11,959.39) (13,979.64)
Current / Non-current Investments 1.04 (0.11)
(11,958.35) (13,979.75)
Net Cash Flow Used In Investing Activities (B) (11,958.35) (13,979.75)
Rs. in Lacs Particulars As at March 31, 2013 As at March 31, 2012C. CASH FLOW FROM FINANCING ACTIVITIES
Increase / (decrease) Minority Interest 1,603.34 (95.79)
Net increase / (decrease) in other than short-term
borrowings
77,511.34 8,816.15
Net increase / (decrease) in short-term borrowings (28,412.19) 3,797.78
Increase / (decrease) in Reserve on Consolidation (207.81) (42.99)
Share Application Money pending allotment 2,800.00 -
Advance to Subsidiary/Related Companies 995.09 (432.82)
Finance costs (Net) (13,681.90) (6,503.45)
40,607.87 5,538.88
Net Cash Flow From / (Used In) Financing Activities 40,607.87 5,538.88
Net Increase In Cash And Cash Equivalents (A+B+C) (291.05) 5,834.87
Cash and cash equivalents at the beginning of the year 5,821.72 996.56
Effect of exchange differences on restatement of foreign
currency cash and cash equivalents
(1,723.41) (1,009.71)
Cash And Cash Equivalents At The End Of The Year 3,807.26 5,821.72
Cash and cash equivalents at the end of the year (as
defined in AS 3 Cash Flow Statements) included in Note
16 [Refer Footnote (ii)]
3,807.26 5,821.72
Footnotes:
(i) The consolidated cash flow statement has been
prepared under the “Indirect Method” as set out in
Accounting Standard 3 - Cash Flow Statements.
(ii) Cash and cash equivalents at the end of the year
comprises:
(a) Cash on hand 31.48 44.83
(i) In current accounts 3,775.78 5,776.89
(iii) In earmarked accounts - Unpaid dividend accounts - -
3,807.26 5,821.72
(iii) Previous year’s figures have been regrouped to
conform with those of the current year.
As per our report of even date For and on Behalf of the Board
For A. Husein Noumanali & Co.
Chartered Accountants
Firm Registration No: 107173W
A. Husein Noumanali Vivek Talwar Vishal Malik Reena Raje
Proprietor Managing Director Director Company Secretary
Membership No. 14757
Mumbai,
6th August, 2013
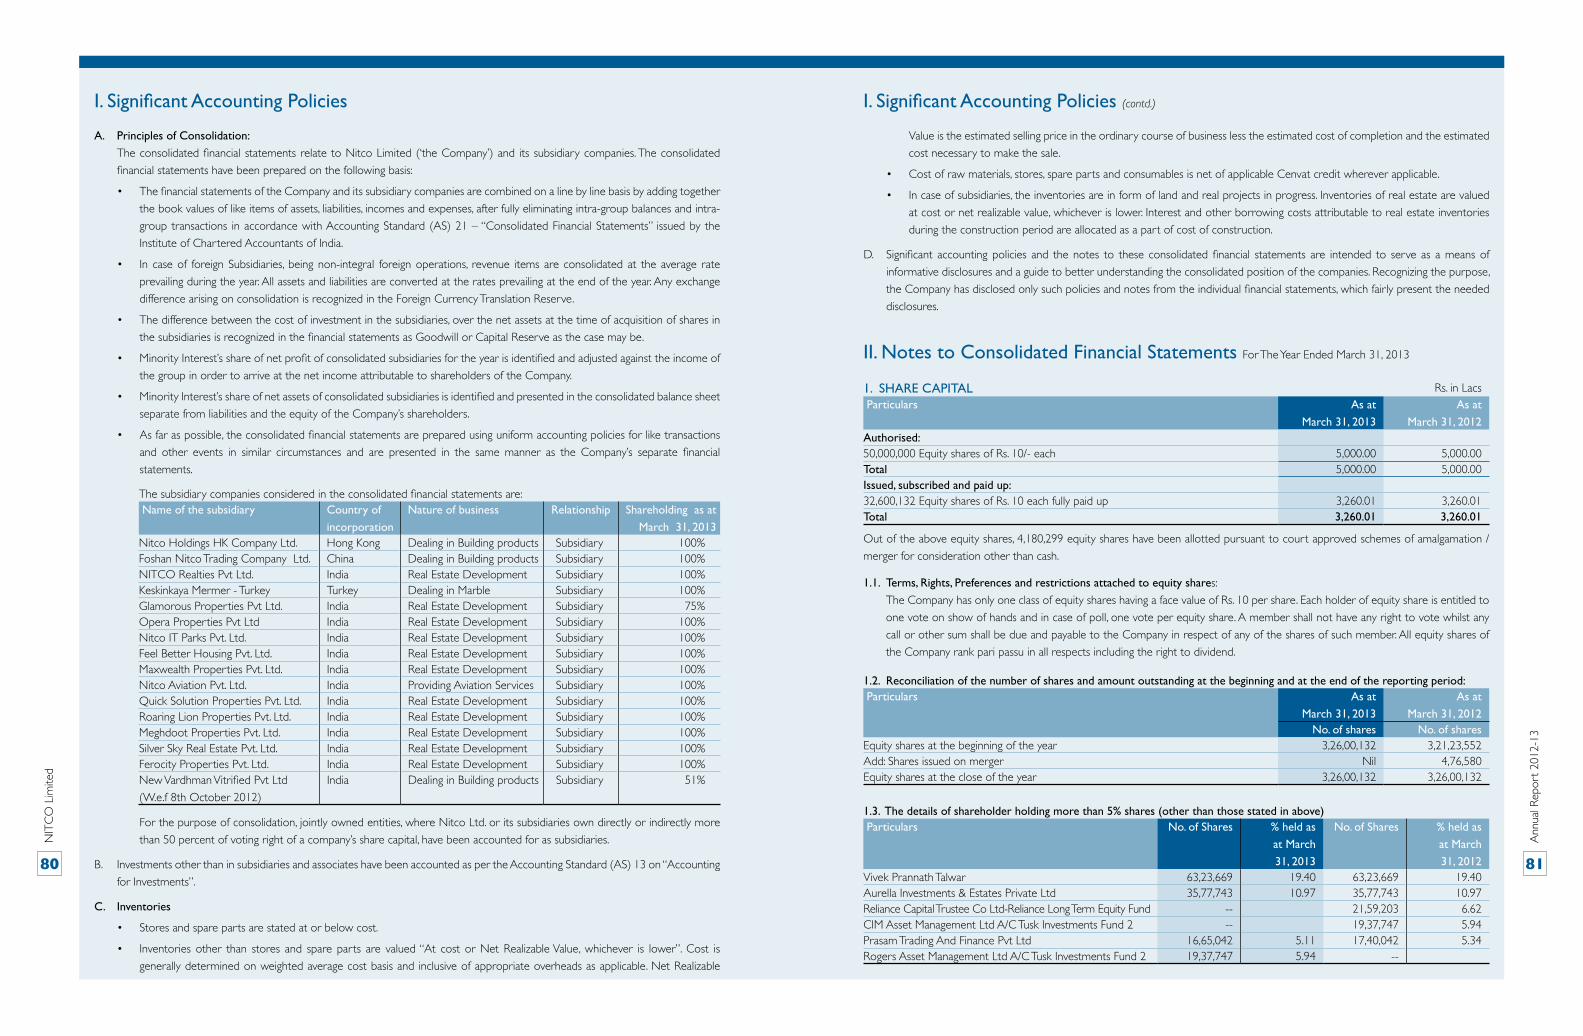
NIT
CO
Lim
ited
Ann
ual R
epor
t 20
12-1
3
80 81
I. Significant Accounting Policies
A. Principles of Consolidation:
The consolidated financial statements relate to Nitco Limited (‘the Company’) and its subsidiary companies. The consolidated
financial statements have been prepared on the following basis:
• The financial statements of the Company and its subsidiary companies are combined on a line by line basis by adding together
the book values of like items of assets, liabilities, incomes and expenses, after fully eliminating intra-group balances and intra-
group transactions in accordance with Accounting Standard (AS) 21 – “Consolidated Financial Statements” issued by the
Institute of Chartered Accountants of India.
• In case of foreign Subsidiaries, being non-integral foreign operations, revenue items are consolidated at the average rate
prevailing during the year. All assets and liabilities are converted at the rates prevailing at the end of the year. Any exchange
difference arising on consolidation is recognized in the Foreign Currency Translation Reserve.
• The difference between the cost of investment in the subsidiaries, over the net assets at the time of acquisition of shares in
the subsidiaries is recognized in the financial statements as Goodwill or Capital Reserve as the case may be.
• Minority Interest’s share of net profit of consolidated subsidiaries for the year is identified and adjusted against the income of
the group in order to arrive at the net income attributable to shareholders of the Company.
• Minority Interest’s share of net assets of consolidated subsidiaries is identified and presented in the consolidated balance sheet
separate from liabilities and the equity of the Company’s shareholders.
• As far as possible, the consolidated financial statements are prepared using uniform accounting policies for like transactions
and other events in similar circumstances and are presented in the same manner as the Company’s separate financial
statements.
For the purpose of consolidation, jointly owned entities, where Nitco Ltd. or its subsidiaries own directly or indirectly more
than 50 percent of voting right of a company’s share capital, have been accounted for as subsidiaries.
B. Investments other than in subsidiaries and associates have been accounted as per the Accounting Standard (AS) 13 on “Accounting
for Investments”.
C. Inventories
• Stores and spare parts are stated at or below cost.
• Inventories other than stores and spare parts are valued “At cost or Net Realizable Value, whichever is lower”. Cost is
generally determined on weighted average cost basis and inclusive of appropriate overheads as applicable. Net Realizable
The subsidiary companies considered in the consolidated financial statements are: Name of the subsidiary Country of
incorporation
Nature of business Relationship Shareholding as at
March 31, 2013Nitco Holdings HK Company Ltd. Hong Kong Dealing in Building products Subsidiary 100%Foshan Nitco Trading Company Ltd. China Dealing in Building products Subsidiary 100%NITCO Realties Pvt Ltd. India Real Estate Development Subsidiary 100%Keskinkaya Mermer - Turkey Turkey Dealing in Marble Subsidiary 100%Glamorous Properties Pvt Ltd. India Real Estate Development Subsidiary 75%Opera Properties Pvt Ltd India Real Estate Development Subsidiary 100%Nitco IT Parks Pvt. Ltd. India Real Estate Development Subsidiary 100%Feel Better Housing Pvt. Ltd. India Real Estate Development Subsidiary 100%Maxwealth Properties Pvt. Ltd. India Real Estate Development Subsidiary 100%Nitco Aviation Pvt. Ltd. India Providing Aviation Services Subsidiary 100%Quick Solution Properties Pvt. Ltd. India Real Estate Development Subsidiary 100%Roaring Lion Properties Pvt. Ltd. India Real Estate Development Subsidiary 100%Meghdoot Properties Pvt. Ltd. India Real Estate Development Subsidiary 100%Silver Sky Real Estate Pvt. Ltd. India Real Estate Development Subsidiary 100%Ferocity Properties Pvt. Ltd. India Real Estate Development Subsidiary 100%New Vardhman Vitrified Pvt Ltd
(W.e.f 8th October 2012)
India Dealing in Building products Subsidiary 51%
Value is the estimated selling price in the ordinary course of business less the estimated cost of completion and the estimated
cost necessary to make the sale.
• Cost of raw materials, stores, spare parts and consumables is net of applicable Cenvat credit wherever applicable.
• In case of subsidiaries, the inventories are in form of land and real projects in progress. Inventories of real estate are valued
at cost or net realizable value, whichever is lower. Interest and other borrowing costs attributable to real estate inventories
during the construction period are allocated as a part of cost of construction.
D. Significant accounting policies and the notes to these consolidated financial statements are intended to serve as a means of
informative disclosures and a guide to better understanding the consolidated position of the companies. Recognizing the purpose,
the Company has disclosed only such policies and notes from the individual financial statements, which fairly present the needed
disclosures.
I. Significant Accounting Policies (contd.)
II. Notes to Consolidated Financial Statements For The Year Ended March 31, 2013
1. SHARE CAPITAL Rs. in Lacs Particulars As at
March 31, 2013
As at
March 31, 2012Authorised: 50,000,000 Equity shares of Rs. 10/- each 5,000.00 5,000.00 Total 5,000.00 5,000.00 Issued, subscribed and paid up: 32,600,132 Equity shares of Rs. 10 each fully paid up 3,260.01 3,260.01 Total 3,260.01 3,260.01
Out of the above equity shares, 4,180,299 equity shares have been allotted pursuant to court approved schemes of amalgamation /
merger for consideration other than cash.
1.2. Reconciliation of the number of shares and amount outstanding at the beginning and at the end of the reporting period: Particulars As at
March 31, 2013
As at
March 31, 2012No. of shares No. of shares
Equity shares at the beginning of the year 3,26,00,132 3,21,23,552Add: Shares issued on merger Nil 4,76,580Equity shares at the close of the year 3,26,00,132 3,26,00,132
1.3. The details of shareholder holding more than 5% shares (other than those stated in above) Particulars No. of Shares % held as
at March
31, 2013
No. of Shares % held as
at March
31, 2012Vivek Prannath Talwar 63,23,669 19.40 63,23,669 19.40Aurella Investments & Estates Private Ltd 35,77,743 10.97 35,77,743 10.97Reliance Capital Trustee Co Ltd-Reliance Long Term Equity Fund -- 21,59,203 6.62CIM Asset Management Ltd A/C Tusk Investments Fund 2 -- 19,37,747 5.94Prasam Trading And Finance Pvt Ltd 16,65,042 5.11 17,40,042 5.34Rogers Asset Management Ltd A/C Tusk Investments Fund 2 19,37,747 5.94 --
1.1. Terms, Rights, Preferences and restrictions attached to equity shares:
The Company has only one class of equity shares having a face value of Rs. 10 per share. Each holder of equity share is entitled to
one vote on show of hands and in case of poll, one vote per equity share. A member shall not have any right to vote whilst any
call or other sum shall be due and payable to the Company in respect of any of the shares of such member. All equity shares of
the Company rank pari passu in all respects including the right to dividend.
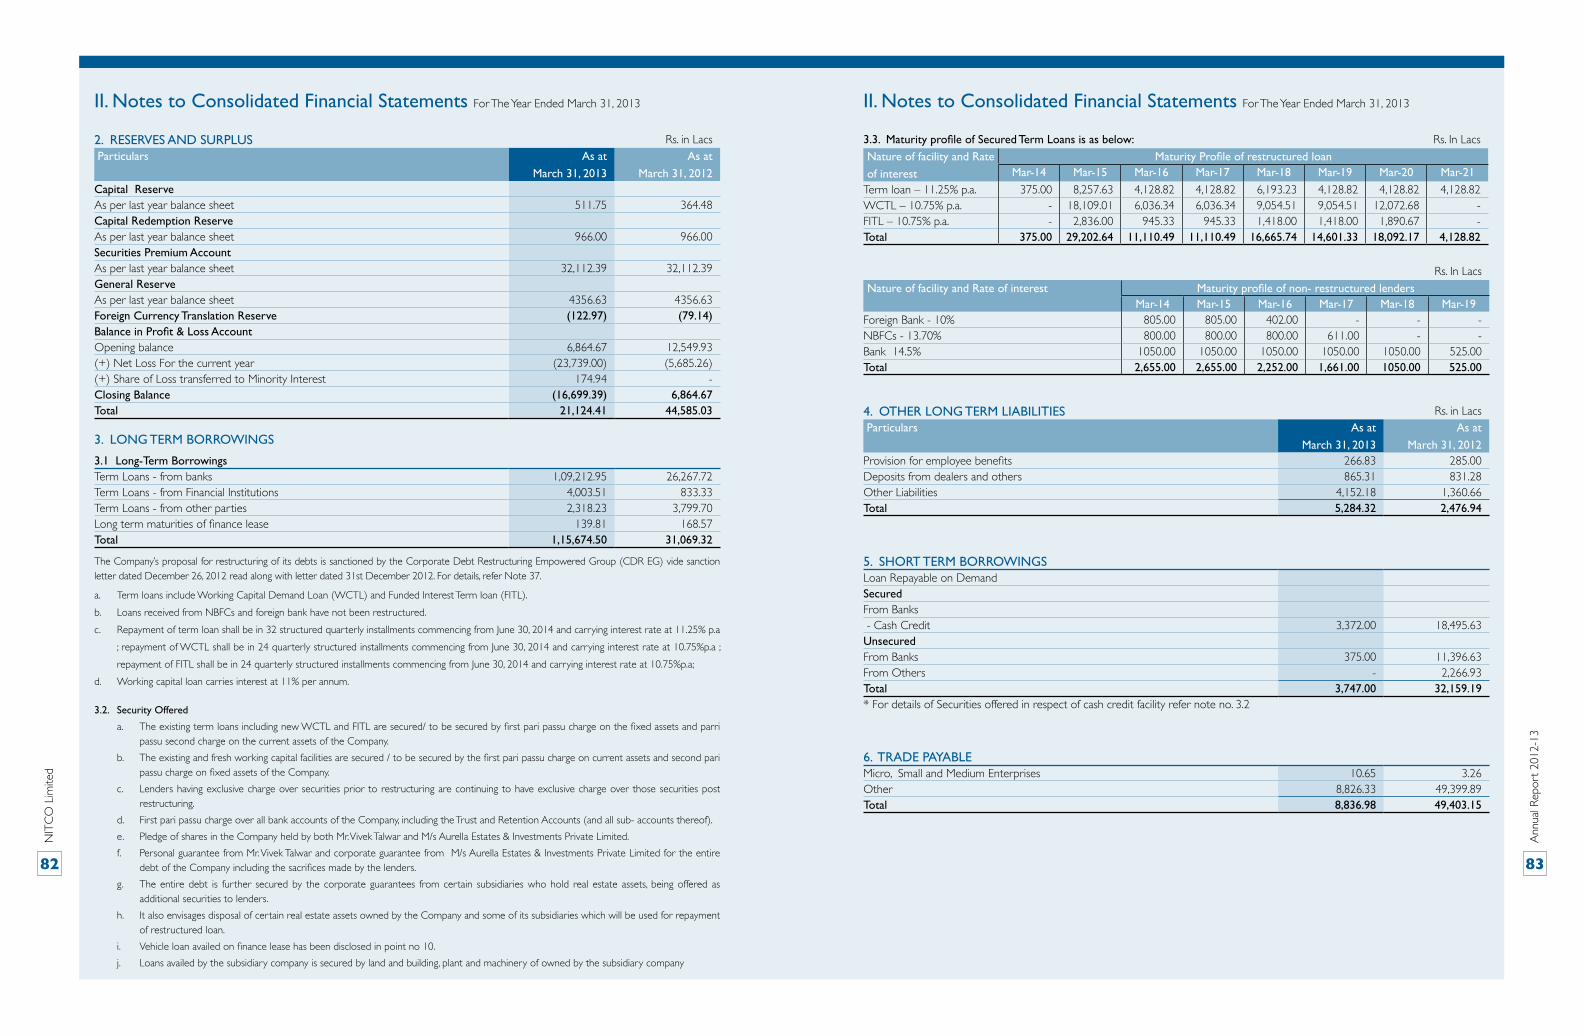
NIT
CO
Lim
ited
Ann
ual R
epor
t 20
12-1
3
82 83
2. RESERVES AND SURPLUS Rs. in Lacs Particulars As at
March 31, 2013
As at
March 31, 2012Capital Reserve As per last year balance sheet 511.75 364.48Capital Redemption Reserve As per last year balance sheet 966.00 966.00Securities Premium Account As per last year balance sheet 32,112.39 32,112.39General Reserve As per last year balance sheet 4356.63 4356.63Foreign Currency Translation Reserve (122.97) (79.14)Balance in Profit & Loss Account Opening balance 6,864.67 12,549.93 (+) Net Loss For the current year (23,739.00) (5,685.26)(+) Share of Loss transferred to Minority Interest 174.94 - Closing Balance (16,699.39) 6,864.67 Total 21,124.41 44,585.03
3. LONG TERM BORROWINGS
3.1 Long-Term BorrowingsTerm Loans - from banks 1,09,212.95 26,267.72Term Loans - from Financial Institutions 4,003.51 833.33Term Loans - from other parties 2,318.23 3,799.70Long term maturities of finance lease 139.81 168.57Total 1,15,674.50 31,069.32
The Company’s proposal for restructuring of its debts is sanctioned by the Corporate Debt Restructuring Empowered Group (CDR EG) vide sanction letter dated December 26, 2012 read along with letter dated 31st December 2012. For details, refer Note 37.
a. Term loans include Working Capital Demand Loan (WCTL) and Funded Interest Term loan (FITL).
b. Loans received from NBFCs and foreign bank have not been restructured.
c. Repayment of term loan shall be in 32 structured quarterly installments commencing from June 30, 2014 and carrying interest rate at 11.25% p.a
; repayment of WCTL shall be in 24 quarterly structured installments commencing from June 30, 2014 and carrying interest rate at 10.75%p.a ;
repayment of FITL shall be in 24 quarterly structured installments commencing from June 30, 2014 and carrying interest rate at 10.75%p.a;
d. Working capital loan carries interest at 11% per annum.
3.2. Security Offered
a. The existing term loans including new WCTL and FITL are secured/ to be secured by first pari passu charge on the fixed assets and parri passu second charge on the current assets of the Company.
b. The existing and fresh working capital facilities are secured / to be secured by the first pari passu charge on current assets and second pari passu charge on fixed assets of the Company.
c. Lenders having exclusive charge over securities prior to restructuring are continuing to have exclusive charge over those securities post restructuring.
d. First pari passu charge over all bank accounts of the Company, including the Trust and Retention Accounts (and all sub- accounts thereof).
e. Pledge of shares in the Company held by both Mr. Vivek Talwar and M/s Aurella Estates & Investments Private Limited.
f. Personal guarantee from Mr. Vivek Talwar and corporate guarantee from M/s Aurella Estates & Investments Private Limited for the entire debt of the Company including the sacrifices made by the lenders.
g. The entire debt is further secured by the corporate guarantees from certain subsidiaries who hold real estate assets, being offered as additional securities to lenders.
h. It also envisages disposal of certain real estate assets owned by the Company and some of its subsidiaries which will be used for repayment of restructured loan.
i. Vehicle loan availed on finance lease has been disclosed in point no 10.
j. Loans availed by the subsidiary company is secured by land and building, plant and machinery of owned by the subsidiary company
3.3. Maturity profile of Secured Term Loans is as below: Rs. In LacsNature of facility and Rate
of interest
Maturity Profile of restructured loanMar-14 Mar-15 Mar-16 Mar-17 Mar-18 Mar-19 Mar-20 Mar-21
Term loan – 11.25% p.a. 375.00 8,257.63 4,128.82 4,128.82 6,193.23 4,128.82 4,128.82 4,128.82WCTL – 10.75% p.a. - 18,109.01 6,036.34 6,036.34 9,054.51 9,054.51 12,072.68 -FITL – 10.75% p.a. - 2,836.00 945.33 945.33 1,418.00 1,418.00 1,890.67 -Total 375.00 29,202.64 11,110.49 11,110.49 16,665.74 14,601.33 18,092.17 4,128.82
Rs. In LacsNature of facility and Rate of interest Maturity profile of non- restructured lenders
Mar-14 Mar-15 Mar-16 Mar-17 Mar-18 Mar-19Foreign Bank - 10% 805.00 805.00 402.00 - - -NBFCs - 13.70% 800.00 800.00 800.00 611.00 - -Bank 14.5% 1050.00 1050.00 1050.00 1050.00 1050.00 525.00Total 2,655.00 2,655.00 2,252.00 1,661.00 1050.00 525.00
4. OTHER LONG TERM LIABILITIES Rs. in Lacs Particulars As at
March 31, 2013
As at
March 31, 2012Provision for employee benefits 266.83 285.00 Deposits from dealers and others 865.31 831.28Other Liabilities 4,152.18 1,360.66 Total 5,284.32 2,476.94
5. SHORT TERM BORROWINGSLoan Repayable on Demand Secured From Banks - Cash Credit 3,372.00 18,495.63 Unsecured From Banks 375.00 11,396.63From Others - 2,266.93 Total 3,747.00 32,159.19 * For details of Securities offered in respect of cash credit facility refer note no. 3.2
6. TRADE PAYABLEMicro, Small and Medium Enterprises 10.65 3.26 Other 8,826.33 49,399.89Total 8,836.98 49,403.15
II. Notes to Consolidated Financial Statements For The Year Ended March 31, 2013 II. Notes to Consolidated Financial Statements For The Year Ended March 31, 2013
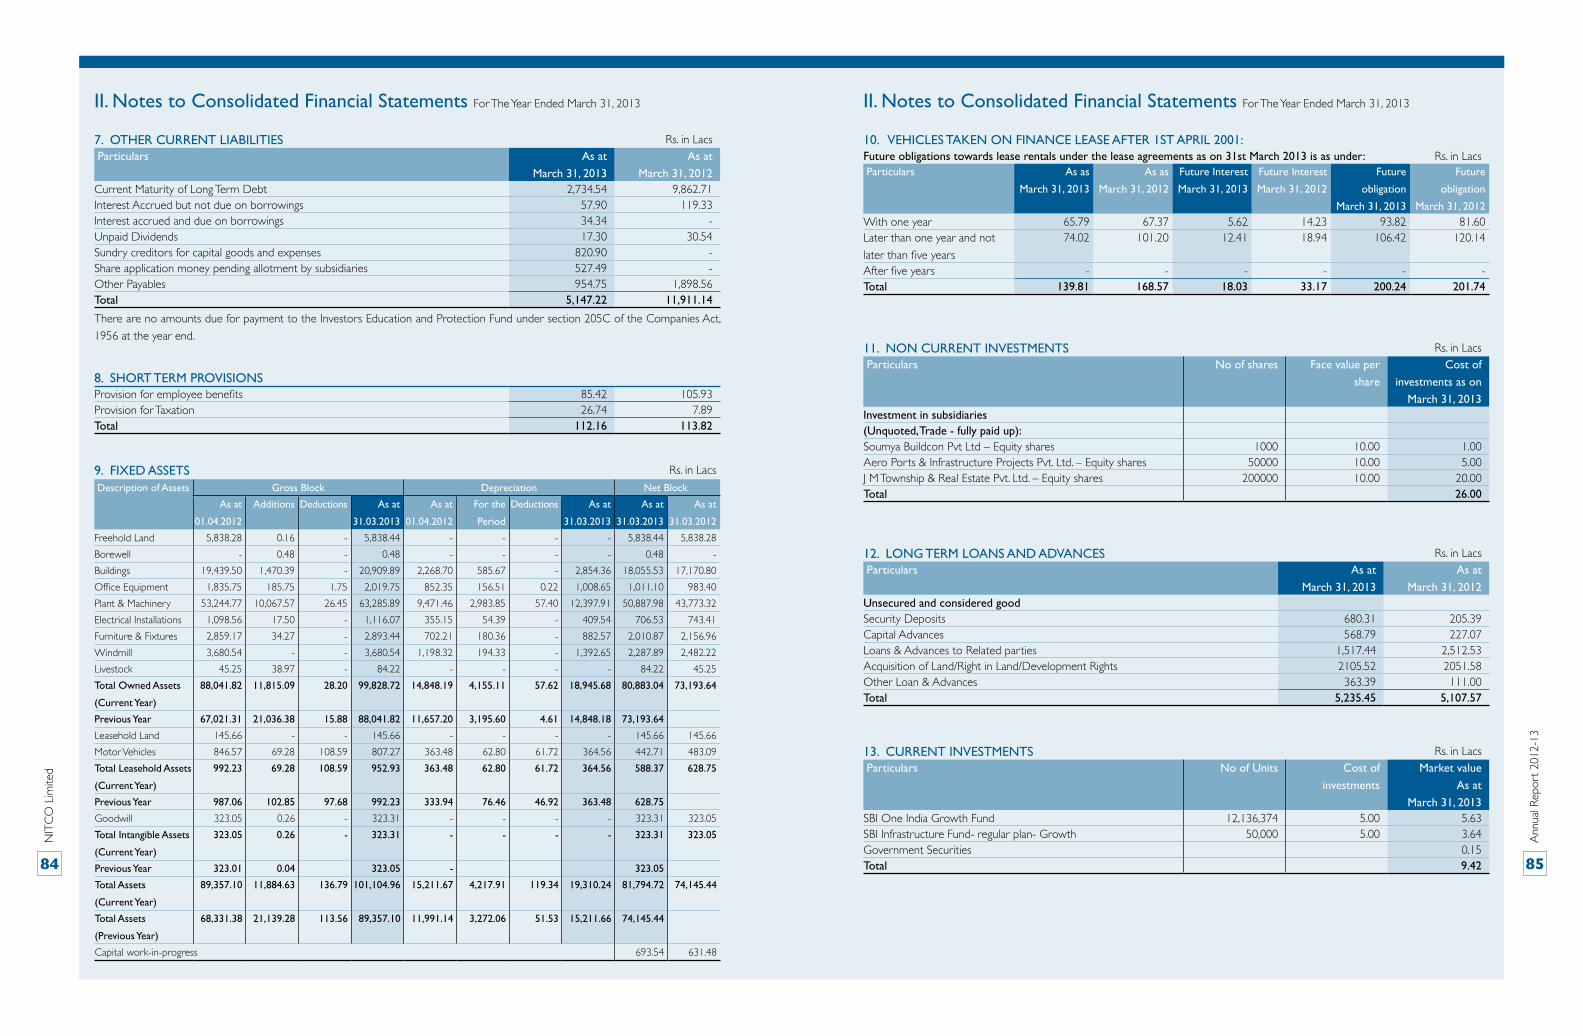
NIT
CO
Lim
ited
Ann
ual R
epor
t 20
12-1
3
84 85
7. OTHER CURRENT LIABILITIES Rs. in Lacs Particulars As at
March 31, 2013
As at
March 31, 2012Current Maturity of Long Term Debt 2,734.54 9,862.71 Interest Accrued but not due on borrowings 57.90 119.33 Interest accrued and due on borrowings 34.34 -Unpaid Dividends 17.30 30.54 Sundry creditors for capital goods and expenses 820.90 -Share application money pending allotment by subsidiaries 527.49 -Other Payables 954.75 1,898.56 Total 5,147.22 11,911.14
There are no amounts due for payment to the Investors Education and Protection Fund under section 205C of the Companies Act,
1956 at the year end.11. NON CURRENT INVESTMENTS Rs. in Lacs Particulars No of shares Face value per
share
Cost of
investments as on
March 31, 2013Investment in subsidiaries(Unquoted, Trade - fully paid up):Soumya Buildcon Pvt Ltd – Equity shares 1000 10.00 1.00Aero Ports & Infrastructure Projects Pvt. Ltd. – Equity shares 50000 10.00 5.00 J M Township & Real Estate Pvt. Ltd. – Equity shares 200000 10.00 20.00 Total 26.00
13. CURRENT INVESTMENTS Rs. in Lacs Particulars No of Units Cost of
investments
Market value
As at
March 31, 2013SBI One India Growth Fund 12,136,374 5.00 5.63SBI Infrastructure Fund- regular plan- Growth 50,000 5.00 3.64Government Securities 0.15Total 9.42
10. VEHICLES TAKEN ON FINANCE LEASE AFTER 1ST APRIL 2001:Future obligations towards lease rentals under the lease agreements as on 31st March 2013 is as under: Rs. in Lacs Particulars As as
March 31, 2013
As as
March 31, 2012
Future Interest
March 31, 2013
Future Interest
March 31, 2012
Future
obligation
March 31, 2013
Future
obligation
March 31, 2012With one year 65.79 67.37 5.62 14.23 93.82 81.60Later than one year and not
later than five years
74.02 101.20 12.41 18.94 106.42 120.14
After five years - - - - - -Total 139.81 168.57 18.03 33.17 200.24 201.74
8. SHORT TERM PROVISIONS Provision for employee benefits 85.42 105.93Provision for Taxation 26.74 7.89Total 112.16 113.82
12. LONG TERM LOANS AND ADVANCES Rs. in Lacs Particulars As at
March 31, 2013
As at
March 31, 2012Unsecured and considered good Security Deposits 680.31 205.39Capital Advances 568.79 227.07Loans & Advances to Related parties 1,517.44 2,512.53Acquisition of Land/Right in Land/Development Rights 2105.52 2051.58Other Loan & Advances 363.39 111.00Total 5,235.45 5,107.57
9. FIXED ASSETS Rs. in Lacs
Description of Assets Gross Block Depreciation Net Block
As at
01.04.2012
Additions Deductions As at
31.03.2013
As at
01.04.2012
For the
Period
Deductions As at
31.03.2013
As at
31.03.2013
As at
31.03.2012
Freehold Land 5,838.28 0.16 - 5,838.44 - - - - 5,838.44 5,838.28
Borewell - 0.48 - 0.48 - - - - 0.48 -
Buildings 19,439.50 1,470.39 - 20,909.89 2,268.70 585.67 - 2,854.36 18,055.53 17,170.80
Office Equipment 1,835.75 185.75 1.75 2,019.75 852.35 156.51 0.22 1,008.65 1,011.10 983.40
Plant & Machinery 53,244.77 10,067.57 26.45 63,285.89 9,471.46 2,983.85 57.40 12,397.91 50,887.98 43,773.32
Electrical Installations 1,098.56 17.50 - 1,116.07 355.15 54.39 - 409.54 706.53 743.41
Furniture & Fixtures 2,859.17 34.27 - 2,893.44 702.21 180.36 - 882.57 2,010.87 2,156.96
Windmill 3,680.54 - - 3,680.54 1,198.32 194.33 - 1,392.65 2,287.89 2,482.22
Livestock 45.25 38.97 - 84.22 - - - - 84.22 45.25
Total Owned Assets
(Current Year)
88,041.82 11,815.09 28.20 99,828.72 14,848.19 4,155.11 57.62 18,945.68 80,883.04 73,193.64
Previous Year 67,021.31 21,036.38 15.88 88,041.82 11,657.20 3,195.60 4.61 14,848.18 73,193.64
Leasehold Land 145.66 - - 145.66 - - - - 145.66 145.66
Motor Vehicles 846.57 69.28 108.59 807.27 363.48 62.80 61.72 364.56 442.71 483.09
Total Leasehold Assets
(Current Year)
992.23 69.28 108.59 952.93 363.48 62.80 61.72 364.56 588.37 628.75
Previous Year 987.06 102.85 97.68 992.23 333.94 76.46 46.92 363.48 628.75
Goodwill 323.05 0.26 - 323.31 - - - - 323.31 323.05
Total Intangible Assets
(Current Year)
323.05 0.26 - 323.31 - - - - 323.31 323.05
Previous Year 323.01 0.04 323.05 - 323.05
Total Assets
(Current Year)
89,357.10 11,884.63 136.79 101,104.96 15,211.67 4,217.91 119.34 19,310.24 81,794.72 74,145.44
Total Assets
(Previous Year)
68,331.38 21,139.28 113.56 89,357.10 11,991.14 3,272.06 51.53 15,211.66 74,145.44
Capital work-in-progress 693.54 631.48
II. Notes to Consolidated Financial Statements For The Year Ended March 31, 2013 II. Notes to Consolidated Financial Statements For The Year Ended March 31, 2013
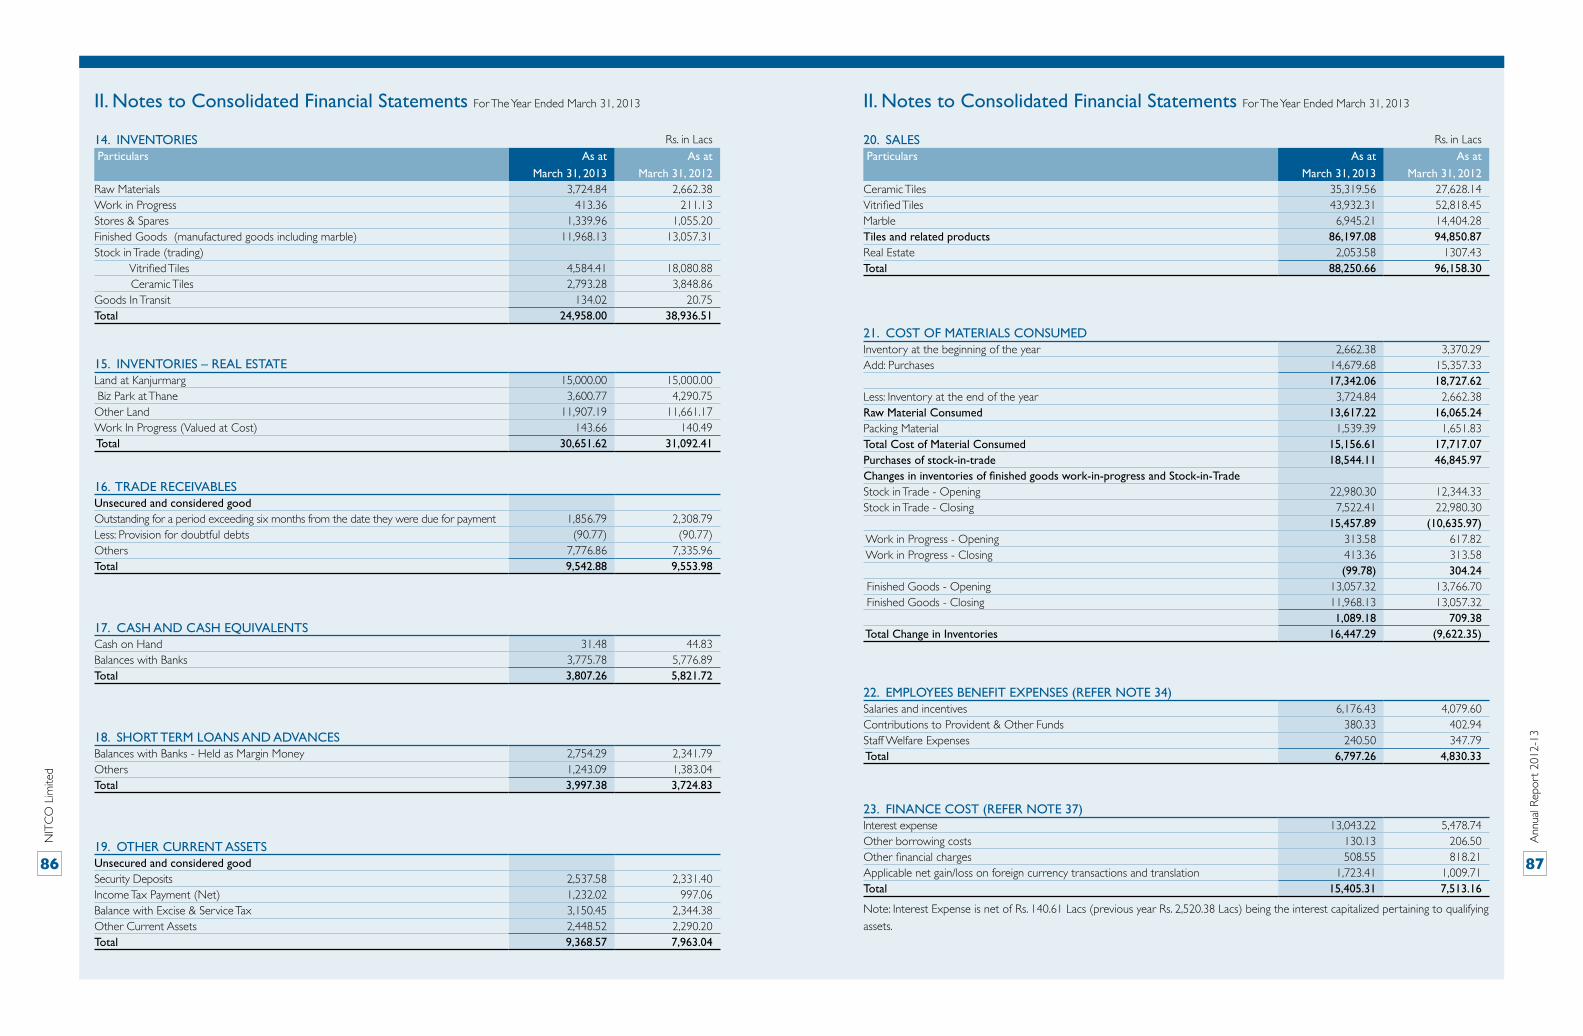
NIT
CO
Lim
ited
Ann
ual R
epor
t 20
12-1
3
86 87
14. INVENTORIES Rs. in Lacs Particulars As at
March 31, 2013
As at
March 31, 2012Raw Materials 3,724.84 2,662.38 Work in Progress 413.36 211.13 Stores & Spares 1,339.96 1,055.20 Finished Goods (manufactured goods including marble) 11,968.13 13,057.31 Stock in Trade (trading) Vitrified Tiles 4,584.41 18,080.88 Ceramic Tiles 2,793.28 3,848.86 Goods In Transit 134.02 20.75 Total 24,958.00 38,936.51
20. SALES Rs. in Lacs Particulars As at
March 31, 2013
As at
March 31, 2012Ceramic Tiles 35,319.56 27,628.14 Vitrified Tiles 43,932.31 52,818.45 Marble 6,945.21 14,404.28 Tiles and related products 86,197.08 94,850.87 Real Estate 2,053.58 1307.43Total 88,250.66 96,158.30
21. COST OF MATERIALS CONSUMED Inventory at the beginning of the year 2,662.38 3,370.29 Add: Purchases 14,679.68 15,357.33 17,342.06 18,727.62 Less: Inventory at the end of the year 3,724.84 2,662.38 Raw Material Consumed 13,617.22 16,065.24 Packing Material 1,539.39 1,651.83 Total Cost of Material Consumed 15,156.61 17,717.07 Purchases of stock-in-trade 18,544.11 46,845.97 Changes in inventories of finished goods work-in-progress and Stock-in-Trade Stock in Trade - Opening 22,980.30 12,344.33 Stock in Trade - Closing 7,522.41 22,980.30 15,457.89 (10,635.97) Work in Progress - Opening 313.58 617.82 Work in Progress - Closing 413.36 313.58 (99.78) 304.24 Finished Goods - Opening 13,057.32 13,766.70 Finished Goods - Closing 11,968.13 13,057.32 1,089.18 709.38 Total Change in Inventories 16,447.29 (9,622.35)
15. INVENTORIES – REAL ESTATELand at Kanjurmarg 15,000.00 15,000.00 Biz Park at Thane 3,600.77 4,290.75 Other Land 11,907.19 11,661.17 Work In Progress (Valued at Cost) 143.66 140.49 Total 30,651.62 31,092.41
17. CASH AND CASH EQUIVALENTSCash on Hand 31.48 44.83 Balances with Banks 3,775.78 5,776.89 Total 3,807.26 5,821.72
18. SHORT TERM LOANS AND ADVANCES Balances with Banks - Held as Margin Money 2,754.29 2,341.79 Others 1,243.09 1,383.04 Total 3,997.38 3,724.83
16. TRADE RECEIVABLES Unsecured and considered goodOutstanding for a period exceeding six months from the date they were due for payment 1,856.79 2,308.79 Less: Provision for doubtful debts (90.77) (90.77)Others 7,776.86 7,335.96 Total 9,542.88 9,553.98
19. OTHER CURRENT ASSETS Unsecured and considered good Security Deposits 2,537.58 2,331.40Income Tax Payment (Net) 1,232.02 997.06Balance with Excise & Service Tax 3,150.45 2,344.38Other Current Assets 2,448.52 2,290.20Total 9,368.57 7,963.04
22. EMPLOYEES BENEFIT EXPENSES (REFER NOTE 34)Salaries and incentives 6,176.43 4,079.60 Contributions to Provident & Other Funds 380.33 402.94 Staff Welfare Expenses 240.50 347.79 Total 6,797.26 4,830.33
23. FINANCE COST (REFER NOTE 37)Interest expense 13,043.22 5,478.74 Other borrowing costs 130.13 206.50Other financial charges 508.55 818.21Applicable net gain/loss on foreign currency transactions and translation 1,723.41 1,009.71 Total 15,405.31 7,513.16
Note: Interest Expense is net of Rs. 140.61 Lacs (previous year Rs. 2,520.38 Lacs) being the interest capitalized pertaining to qualifying
assets.
II. Notes to Consolidated Financial Statements For The Year Ended March 31, 2013 II. Notes to Consolidated Financial Statements For The Year Ended March 31, 2013
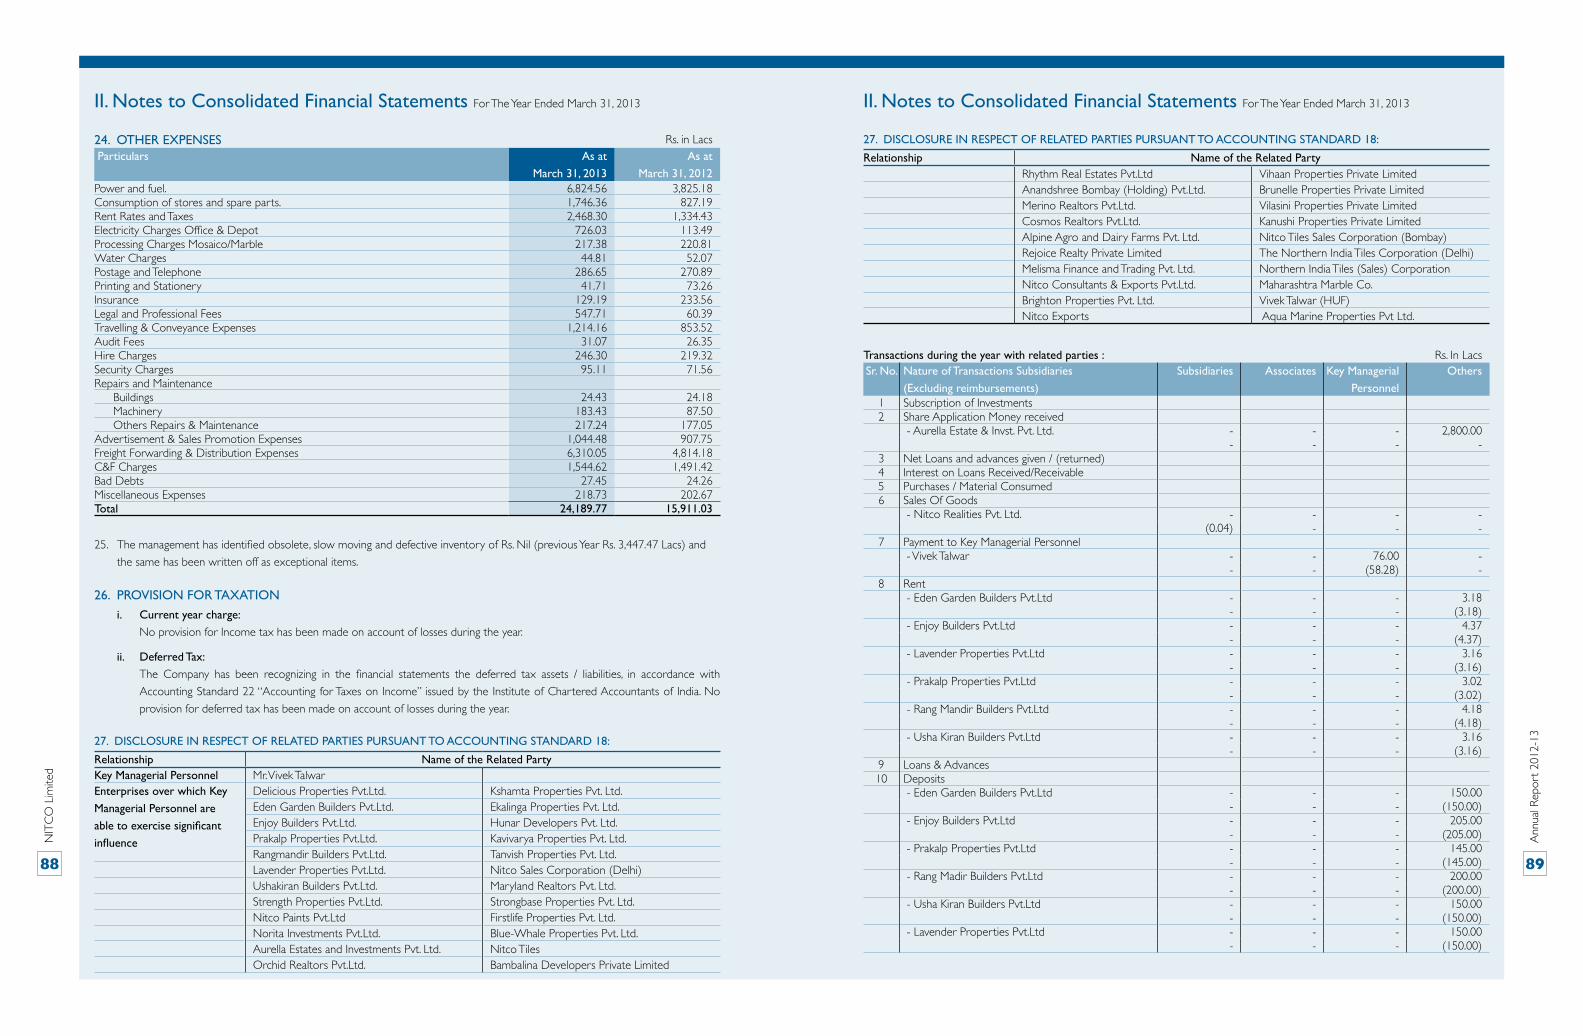
NIT
CO
Lim
ited
Ann
ual R
epor
t 20
12-1
3
88 89
24. OTHER EXPENSES Rs. in Lacs Particulars As at
March 31, 2013
As at
March 31, 2012Power and fuel. 6,824.56 3,825.18 Consumption of stores and spare parts. 1,746.36 827.19 Rent Rates and Taxes 2,468.30 1,334.43 Electricity Charges Office & Depot 726.03 113.49 Processing Charges Mosaico/Marble 217.38 220.81 Water Charges 44.81 52.07 Postage and Telephone 286.65 270.89 Printing and Stationery 41.71 73.26 Insurance 129.19 233.56 Legal and Professional Fees 547.71 60.39 Travelling & Conveyance Expenses 1,214.16 853.52 Audit Fees 31.07 26.35 Hire Charges 246.30 219.32 Security Charges 95.11 71.56 Repairs and Maintenance
Buildings 24.43 24.18 Machinery 183.43 87.50 Others Repairs & Maintenance 217.24 177.05
Advertisement & Sales Promotion Expenses 1,044.48 907.75 Freight Forwarding & Distribution Expenses 6,310.05 4,814.18 C&F Charges 1,544.62 1,491.42 Bad Debts 27.45 24.26 Miscellaneous Expenses 218.73 202.67Total 24,189.77 15,911.03
25. The management has identified obsolete, slow moving and defective inventory of Rs. Nil (previous Year Rs. 3,447.47 Lacs) and
the same has been written off as exceptional items.
26. PROVISION FOR TAXATION
i. Current year charge:
No provision for Income tax has been made on account of losses during the year.
ii. Deferred Tax:
The Company has been recognizing in the financial statements the deferred tax assets / liabilities, in accordance with
Accounting Standard 22 “Accounting for Taxes on Income” issued by the Institute of Chartered Accountants of India. No
provision for deferred tax has been made on account of losses during the year.
27. DISCLOSURE IN RESPECT OF RELATED PARTIES PURSUANT TO ACCOUNTING STANDARD 18:
Relationship Name of the Related PartyKey Managerial Personnel Mr. Vivek TalwarEnterprises over which Key
Managerial Personnel are
able to exercise significant
influence
Delicious Properties Pvt.Ltd. Kshamta Properties Pvt. Ltd.Eden Garden Builders Pvt.Ltd. Ekalinga Properties Pvt. Ltd.Enjoy Builders Pvt.Ltd. Hunar Developers Pvt. Ltd.Prakalp Properties Pvt.Ltd. Kavivarya Properties Pvt. Ltd.Rangmandir Builders Pvt.Ltd. Tanvish Properties Pvt. Ltd.Lavender Properties Pvt.Ltd. Nitco Sales Corporation (Delhi)Ushakiran Builders Pvt.Ltd. Maryland Realtors Pvt. Ltd.Strength Properties Pvt.Ltd. Strongbase Properties Pvt. Ltd.Nitco Paints Pvt.Ltd Firstlife Properties Pvt. Ltd.Norita Investments Pvt.Ltd. Blue-Whale Properties Pvt. Ltd.Aurella Estates and Investments Pvt. Ltd. Nitco TilesOrchid Realtors Pvt.Ltd. Bambalina Developers Private Limited
Transactions during the year with related parties : Rs. In LacsSr. No. Nature of Transactions Subsidiaries
(Excluding reimbursements)
Subsidiaries Associates Key Managerial
Personnel
Others
1 Subscription of Investments2 Share Application Money received
- Aurella Estate & Invst. Pvt. Ltd. - - - 2,800.00 - - - -
3 Net Loans and advances given / (returned)4 Interest on Loans Received/Receivable5 Purchases / Material Consumed6 Sales Of Goods
- Nitco Realities Pvt. Ltd. - - - -(0.04) - - -
7 Payment to Key Managerial Personnel - Vivek Talwar - - 76.00 -
- - (58.28) - 8 Rent
- Eden Garden Builders Pvt.Ltd - - - 3.18 - - - (3.18)
- Enjoy Builders Pvt.Ltd - - - 4.37 - - - (4.37)
- Lavender Properties Pvt.Ltd - - - 3.16 - - - (3.16)
- Prakalp Properties Pvt.Ltd - - - 3.02 - - - (3.02)
- Rang Mandir Builders Pvt.Ltd - - - 4.18 - - - (4.18)
- Usha Kiran Builders Pvt.Ltd - - - 3.16 - - - (3.16)
9 Loans & Advances10 Deposits
- Eden Garden Builders Pvt.Ltd - - - 150.00 - - - (150.00)
- Enjoy Builders Pvt.Ltd - - - 205.00 - - - (205.00)
- Prakalp Properties Pvt.Ltd - - - 145.00 - - - (145.00)
- Rang Madir Builders Pvt.Ltd - - - 200.00 - - - (200.00)
- Usha Kiran Builders Pvt.Ltd - - - 150.00 - - - (150.00)
- Lavender Properties Pvt.Ltd - - - 150.00 - - - (150.00)
II. Notes to Consolidated Financial Statements For The Year Ended March 31, 2013 II. Notes to Consolidated Financial Statements For The Year Ended March 31, 2013
27. DISCLOSURE IN RESPECT OF RELATED PARTIES PURSUANT TO ACCOUNTING STANDARD 18:
Relationship Name of the Related PartyRhythm Real Estates Pvt.Ltd Vihaan Properties Private LimitedAnandshree Bombay (Holding) Pvt.Ltd. Brunelle Properties Private LimitedMerino Realtors Pvt.Ltd. Vilasini Properties Private LimitedCosmos Realtors Pvt.Ltd. Kanushi Properties Private LimitedAlpine Agro and Dairy Farms Pvt. Ltd. Nitco Tiles Sales Corporation (Bombay)Rejoice Realty Private Limited The Northern India Tiles Corporation (Delhi)Melisma Finance and Trading Pvt. Ltd. Northern India Tiles (Sales) CorporationNitco Consultants & Exports Pvt.Ltd. Maharashtra Marble Co.Brighton Properties Pvt. Ltd. Vivek Talwar (HUF)Nitco Exports Aqua Marine Properties Pvt Ltd.
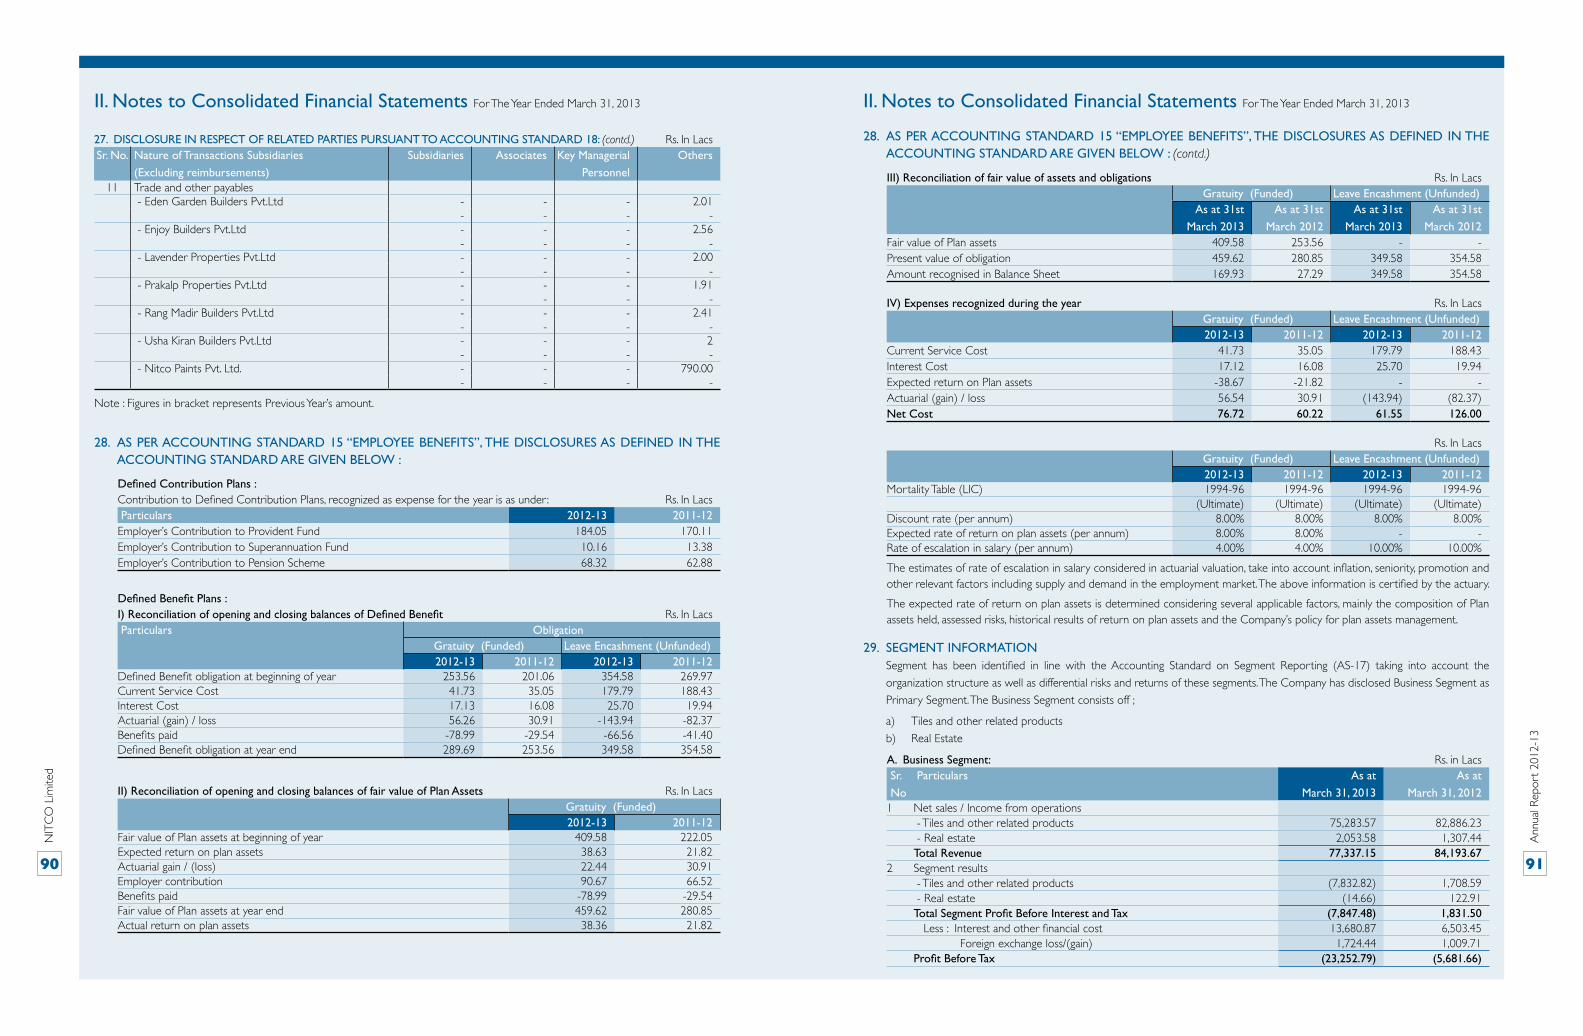
NIT
CO
Lim
ited
Ann
ual R
epor
t 20
12-1
3
90 91
28. AS PER ACCOUNTING STANDARD 15 “EMPLOYEE BENEFITS”, THE DISCLOSURES AS DEFINED IN THE ACCOUNTING STANDARD ARE GIVEN BELOW :
28. AS PER ACCOUNTING STANDARD 15 “EMPLOYEE BENEFITS”, THE DISCLOSURES AS DEFINED IN THE ACCOUNTING STANDARD ARE GIVEN BELOW : (contd.)
Defined Contribution Plans : Contribution to Defined Contribution Plans, recognized as expense for the year is as under: Rs. In Lacs Particulars 2012-13 2011-12Employer’s Contribution to Provident Fund 184.05 170.11Employer’s Contribution to Superannuation Fund 10.16 13.38Employer’s Contribution to Pension Scheme 68.32 62.88
Defined Benefit Plans :I) Reconciliation of opening and closing balances of Defined Benefit Rs. In Lacs Particulars Obligation
Gratuity (Funded) Leave Encashment (Unfunded)2012-13 2011-12 2012-13 2011-12
Defined Benefit obligation at beginning of year 253.56 201.06 354.58 269.97Current Service Cost 41.73 35.05 179.79 188.43Interest Cost 17.13 16.08 25.70 19.94Actuarial (gain) / loss 56.26 30.91 -143.94 -82.37Benefits paid -78.99 -29.54 -66.56 -41.40Defined Benefit obligation at year end 289.69 253.56 349.58 354.58
III) Reconciliation of fair value of assets and obligations Rs. In LacsGratuity (Funded) Leave Encashment (Unfunded)
As at 31st
March 2013
As at 31st
March 2012
As at 31st
March 2013
As at 31st
March 2012Fair value of Plan assets 409.58 253.56 - - Present value of obligation 459.62 280.85 349.58 354.58Amount recognised in Balance Sheet 169.93 27.29 349.58 354.58
IV) Expenses recognized during the year Rs. In LacsGratuity (Funded) Leave Encashment (Unfunded)2012-13 2011-12 2012-13 2011-12
Current Service Cost 41.73 35.05 179.79 188.43Interest Cost 17.12 16.08 25.70 19.94Expected return on Plan assets -38.67 -21.82 - -Actuarial (gain) / loss 56.54 30.91 (143.94) (82.37)Net Cost 76.72 60.22 61.55 126.00
II) Reconciliation of opening and closing balances of fair value of Plan Assets Rs. In LacsGratuity (Funded)2012-13 2011-12
Fair value of Plan assets at beginning of year 409.58 222.05Expected return on plan assets 38.63 21.82Actuarial gain / (loss) 22.44 30.91Employer contribution 90.67 66.52Benefits paid -78.99 -29.54Fair value of Plan assets at year end 459.62 280.85Actual return on plan assets 38.36 21.82
Rs. In LacsGratuity (Funded) Leave Encashment (Unfunded)2012-13 2011-12 2012-13 2011-12
Mortality Table (LIC) 1994-96 1994-96 1994-96 1994-96(Ultimate) (Ultimate) (Ultimate) (Ultimate)
Discount rate (per annum) 8.00% 8.00% 8.00% 8.00%Expected rate of return on plan assets (per annum) 8.00% 8.00% - -Rate of escalation in salary (per annum) 4.00% 4.00% 10.00% 10.00%
The estimates of rate of escalation in salary considered in actuarial valuation, take into account inflation, seniority, promotion and other relevant factors including supply and demand in the employment market. The above information is certified by the actuary.
The expected rate of return on plan assets is determined considering several applicable factors, mainly the composition of Plan assets held, assessed risks, historical results of return on plan assets and the Company’s policy for plan assets management.
II. Notes to Consolidated Financial Statements For The Year Ended March 31, 2013 II. Notes to Consolidated Financial Statements For The Year Ended March 31, 2013
27. DISCLOSURE IN RESPECT OF RELATED PARTIES PURSUANT TO ACCOUNTING STANDARD 18: (contd.) Rs. In LacsSr. No. Nature of Transactions Subsidiaries
(Excluding reimbursements)
Subsidiaries Associates Key Managerial
Personnel
Others
Note : Figures in bracket represents Previous Year’s amount.
11 Trade and other payables - Eden Garden Builders Pvt.Ltd - - - 2.01
- - - - - Enjoy Builders Pvt.Ltd - - - 2.56
- - - - - Lavender Properties Pvt.Ltd - - - 2.00
- - - - - Prakalp Properties Pvt.Ltd - - - 1.91
- - - - - Rang Madir Builders Pvt.Ltd - - - 2.41
- - - - - Usha Kiran Builders Pvt.Ltd - - - 2
- - - - - Nitco Paints Pvt. Ltd. - - - 790.00
- - - -
29. SEGMENT INFORMATION Segment has been identified in line with the Accounting Standard on Segment Reporting (AS-17) taking into account the
organization structure as well as differential risks and returns of these segments. The Company has disclosed Business Segment as
Primary Segment. The Business Segment consists off ;
a) Tiles and other related products
b) Real Estate
A. Business Segment: Rs. in LacsSr.
No
Particulars As at
March 31, 2013
As at
March 31, 20121 Net sales / Income from operations - Tiles and other related products 75,283.57 82,886.23 - Real estate 2,053.58 1,307.44 Total Revenue 77,337.15 84,193.67 2 Segment results - Tiles and other related products (7,832.82) 1,708.59 - Real estate (14.66) 122.91 Total Segment Profit Before Interest and Tax (7,847.48) 1,831.50 Less : Interest and other financial cost 13,680.87 6,503.45 Foreign exchange loss/(gain) 1,724.44 1,009.71 Profit Before Tax (23,252.79) (5,681.66)
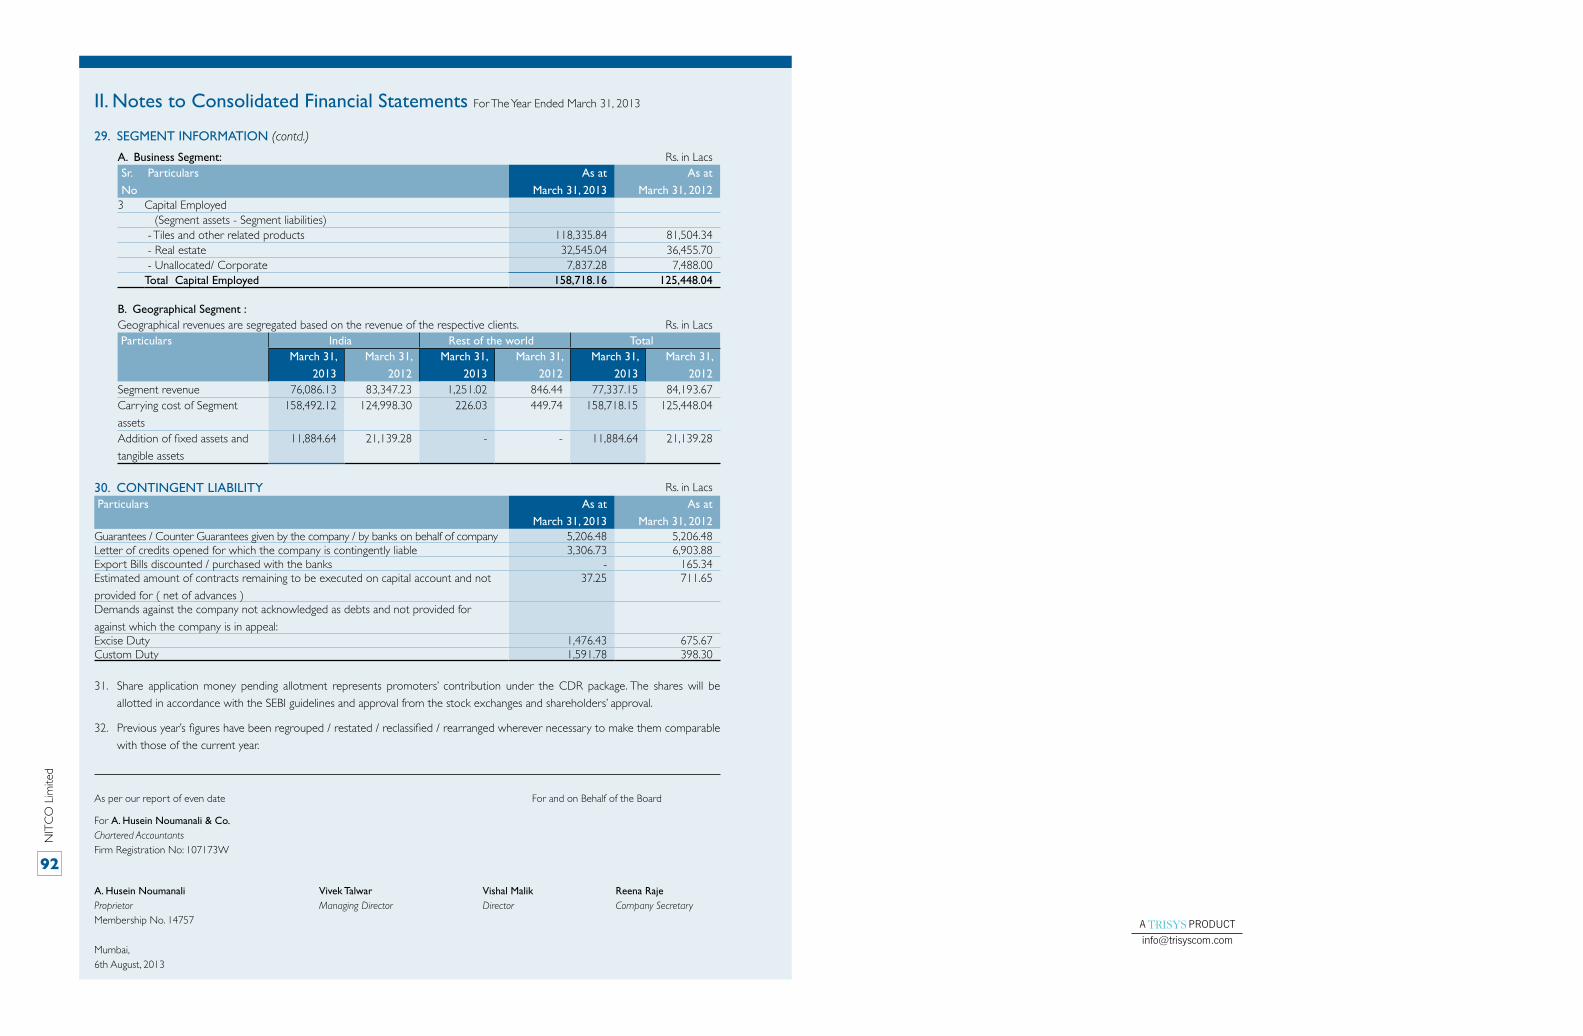
NIT
CO
Lim
ited
92
B. Geographical Segment :Geographical revenues are segregated based on the revenue of the respective clients. Rs. in Lacs Particulars India Rest of the world Total
March 31,
2013
March 31,
2012
March 31,
2013
March 31,
2012
March 31,
2013
March 31,
2012Segment revenue 76,086.13 83,347.23 1,251.02 846.44 77,337.15 84,193.67Carrying cost of Segment
assets
158,492.12 124,998.30 226.03 449.74 158,718.15 125,448.04
Addition of fixed assets and
tangible assets
11,884.64 21,139.28 - - 11,884.64 21,139.28
30. CONTINGENT LIABILITY Rs. in Lacs Particulars As at
March 31, 2013
As at
March 31, 2012Guarantees / Counter Guarantees given by the company / by banks on behalf of company 5,206.48 5,206.48 Letter of credits opened for which the company is contingently liable 3,306.73 6,903.88 Export Bills discounted / purchased with the banks - 165.34 Estimated amount of contracts remaining to be executed on capital account and not
provided for ( net of advances )
37.25 711.65
Demands against the company not acknowledged as debts and not provided for
against which the company is in appeal:
Excise Duty 1,476.43 675.67 Custom Duty 1,591.78 398.30
31. Share application money pending allotment represents promoters’ contribution under the CDR package. The shares will be
allotted in accordance with the SEBI guidelines and approval from the stock exchanges and shareholders’ approval.
32. Previous year’s figures have been regrouped / restated / reclassified / rearranged wherever necessary to make them comparable
with those of the current year.
As per our report of even date For and on Behalf of the Board
For A. Husein Noumanali & Co.Chartered AccountantsFirm Registration No: 107173W
A. Husein Noumanali Vivek Talwar Vishal Malik Reena Raje Proprietor Managing Director Director Company SecretaryMembership No. 14757
Mumbai, 6th August, 2013
II. Notes to Consolidated Financial Statements For The Year Ended March 31, 2013
A. Business Segment: Rs. in LacsSr.
No
Particulars As at
March 31, 2013
As at
March 31, 20123 Capital Employed (Segment assets - Segment liabilities) - Tiles and other related products 118,335.84 81,504.34 - Real estate 32,545.04 36,455.70 - Unallocated/ Corporate 7,837.28 7,488.00 Total Capital Employed 158,718.16 125,448.04
29. SEGMENT INFORMATION (contd.)
A Product
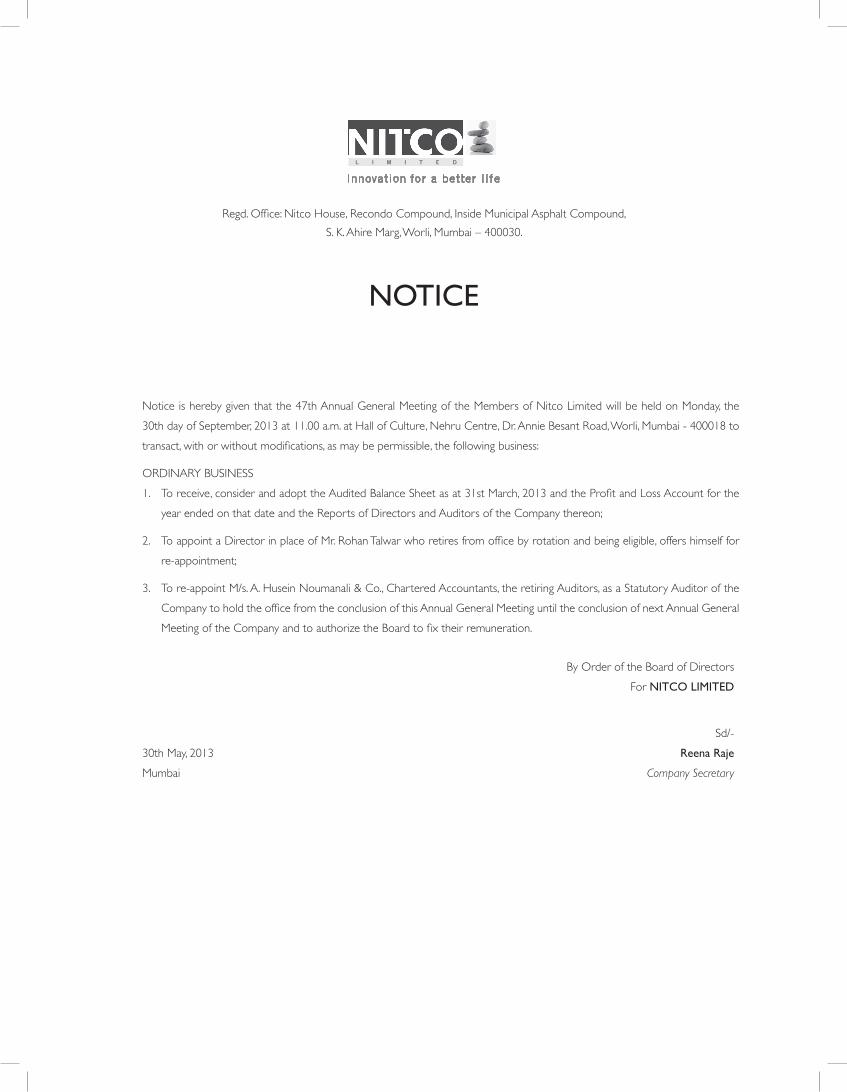
Notice is hereby given that the 47th Annual General Meeting of the Members of Nitco Limited will be held on Monday, the
30th day of September, 2013 at 11.00 a.m. at Hall of Culture, Nehru Centre, Dr. Annie Besant Road, Worli, Mumbai - 400018 to
transact, with or without modifications, as may be permissible, the following business:
ORDINARY BUSINESS
1. To receive, consider and adopt the Audited Balance Sheet as at 31st March, 2013 and the Profit and Loss Account for the
year ended on that date and the Reports of Directors and Auditors of the Company thereon;
2. To appoint a Director in place of Mr. Rohan Talwar who retires from office by rotation and being eligible, offers himself for
re-appointment;
3. To re-appoint M/s. A. Husein Noumanali & Co., Chartered Accountants, the retiring Auditors, as a Statutory Auditor of the
Company to hold the office from the conclusion of this Annual General Meeting until the conclusion of next Annual General
Meeting of the Company and to authorize the Board to fix their remuneration.
By Order of the Board of Directors
For NITCO LIMITED
Sd/-
30th May, 2013 Reena Raje
Mumbai Company Secretary
Regd. Office: Nitco House, Recondo Compound, Inside Municipal Asphalt Compound,
S. K. Ahire Marg, Worli, Mumbai – 400030.
NOTICE

1. A member entitled to attend and vote at the Meeting is entitled to appoint a proxy to attend and vote instead of
himself and the proxy need not be a member of the Company. The instrument appointing proxy should, however,
be deposited at the registered office of the Company not less than 48 hours before the commencement of the
Meeting.
2. The Register of Members and Share Transfer Books of the Company will remain closed from Monday, the 23rd day
of September, 2013 to Monday, the 30th day of September, 2013 (both days inclusive).
3. Members desirous of obtaining any information as regards accounts and operations of the Company are requested
to write to the Company at least one week before the Meeting, so that the information could be made available at
the Meeting.
4. Members are requested to notify any change in their address and bank account details to the Depository Participant
where they maintain their Demat account.
5. Members are advised to get their shares demated by sending Dematerialization Request Form (DRF) alongwith
Share Certificates through their Depository Participant (DP) to Company’s Registrar Link Intime India Private
Limited (Link Intime).
6. Particulars of Director seeking re-appointment: Relevant particulars of Mr. Rohan Talwar are given in the report on
Corporate Governance.
7. Members wishing to claim dividends, which remain unclaimed, are requested to approach the Company Secretary at
its registered office address and/or Link Intime. Members are requested to note that the Dividends not encashed or
claimed within seven years from the date of transfer to the Company’s Unpaid Dividend Account, will, as per section
205A of the Companies Act, 1956, be transferred to the Investor Education and Protection Fund.
8. Corporate Members intending to send their authorised representatives are requested to send a certified copy of
the Board Resolution/Power of Attorney authorizing their representatives to attend and vote on their behalf at the
Meeting.
9. As a measure of economy, members are requested to bring copy of the Annual Report to the Meeting. Member /
proxy holders shall hand over the attendance slips, duly filled in all respect, at the entrance for attending the Meeting.
NOTES NITCO LIMITED
NITCO LIMITED
PROxy FORM
ATTENDANCE SLIP
Regd. Office: Nitco House, Recondo Compound, Inside Municipal Asphalt Compound, S. K. Ahire Marg, Worli, Mumbai – 400030.
Regd. Office: Nitco House, Recondo Compound, Inside Municipal Asphalt Compound, S. K. Ahire Marg, Worli, Mumbai – 400030.
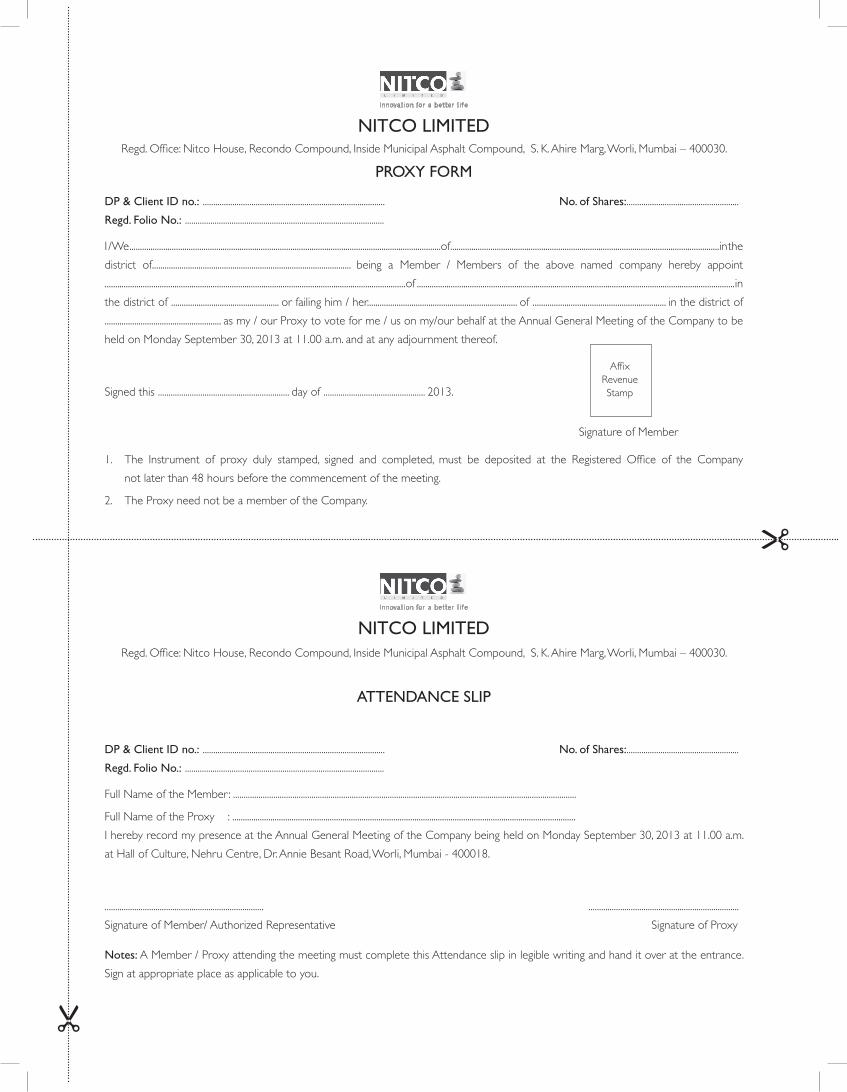
NOTES
DP & Client ID no.: ...................................................................................... No. of Shares:.....................................................
Regd. Folio No.: ..............................................................................................
Full Name of the Member: ..................................................................................................................................................................
Full Name of the Proxy : ..................................................................................................................................................................
I hereby record my presence at the Annual General Meeting of the Company being held on Monday September 30, 2013 at 11.00 a.m.
at Hall of Culture, Nehru Centre, Dr. Annie Besant Road, Worli, Mumbai - 400018.
........................................................................... .......................................................................
Signature of Member/ Authorized Representative Signature of Proxy
Notes: A Member / Proxy attending the meeting must complete this Attendance slip in legible writing and hand it over at the entrance.
Sign at appropriate place as applicable to you.
NITCO LIMITED
NITCO LIMITED
PROxy FORM
ATTENDANCE SLIP
Regd. Office: Nitco House, Recondo Compound, Inside Municipal Asphalt Compound, S. K. Ahire Marg, Worli, Mumbai – 400030.
Regd. Office: Nitco House, Recondo Compound, Inside Municipal Asphalt Compound, S. K. Ahire Marg, Worli, Mumbai – 400030.
DP & Client ID no.: ...................................................................................... No. of Shares:.....................................................
Regd. Folio No.: ..............................................................................................
I / We...................................................................................................................................................of...............................................................................................................................in the
district of.............................................................................................. being a Member / Members of the above named company hereby appoint
.............................................................................................................................................. of ...................................................................................................................................................... in
the district of ................................................... or failing him / her....................................................................... of ............................................................... in the district of
....................................................... as my / our Proxy to vote for me / us on my/our behalf at the Annual General Meeting of the Company to be
held on Monday September 30, 2013 at 11.00 a.m. and at any adjournment thereof.
Signed this .............................................................. day of ................................................ 2013.
1. The Instrument of proxy duly stamped, signed and completed, must be deposited at the Registered Office of the Company
not later than 48 hours before the commencement of the meeting.
2. The Proxy need not be a member of the Company.
Affix RevenueStamp
Signature of Member

www.n i tcot i les .com