Embed Size (px)
Citation preview
i
NITRIC OXIDE PRODUCTION OF MENICAL EXPLANTS
FOLLOWING DYNAMIC COMPRESSION
BY
JEFFREY A. MCHENRY
B.S.M.E., Michigan Technological University, 2005
A THESIS
Submitted in partial fulfillment of the
requirements for the degree of
MASTER OF SCIENCE IN MECHANICAL ENGINEERING
MICHIGAN TECHNOLOGICAL UNIVERSITY
2005
Jeffrey A. McHenry
ii
NITRIC OXIDE PRODUCTION BY MENISCAL EXPLANTS
FOLLOWING DYNAMIC COMPRESSION
Jeffrey A. McHenry
Department of Mechanical Engineering and Engineering Mechanics
Michigan Technological University, 2005
ABSTRACT Meniscal fibrochondrocytes have been suspected of producing nitric oxide in
response to dynamic compression. The relationship of compressive strain and
compressive stress to nitric oxide production in meniscal explants has not yet been
characterized. It may be true that physiological strain and pressure conditions may
decrease nitric oxide production compared to the unloaded state, thus reducing the
harmful affects that nitric oxide has on matrix metabolism in the meniscus. It may also
be true that overloading as well as unloading may produce an up-regulation of nitric
oxide when compared to physiological conditions. The identity of nitric oxide producing
cells in the meniscus is also still unclear. The chondrocytic cells found in the deep zones
of the meniscus have been shown to produce nitric oxide in articular cartilage, while the
fibroblastic cells in the superficial zone have recently been investigated. To further
understand these relationships, the goals of the current project were to 1) validate a
specially designed tissue compression bioreactor capable of a wide range of accurate
displacement and load control; 2) determine the relationship of strain/pressure to nitric
oxide production in both superficial and deep zones of meniscal explants.

iii
ACKNOWLEDGEMENTS
First, I would like to thank my advisor Dr. Tammy Haut Donahue for her support,
direction, and patience through this project. Her help and encouragement have been very
important to me and to the success and completion of this work. I would also like to
thank the Whitaker foundation that has provided funding for this research, allowing the
use of proper equipment and supplies needed for these experiments. My committee
members Dr. Seth Donahue, Dr. Jeff Burl, and Dr. Eric Blough have provided critique of
my work and have directed me in my writing and experimentation, which is much
appreciated. I want to thank them for this advice and also for their patience.
I am also grateful for the assistance of my lab group members Tumul, Basia, and
Jason. They have provided much needed assistance while I was off campus and have
provided a great working environment in the lab. I would also like to thank Jesse
Nordeng for dedication to providing professional quality machining work that was
necessary for the accurate function of the bioreactor used in these experiments.
I want to thank my family for their encouragement of me taking on and
completing this project. Their support had helped push me to finish work that I can be
proud of, and I greatly appreciate it.
iv
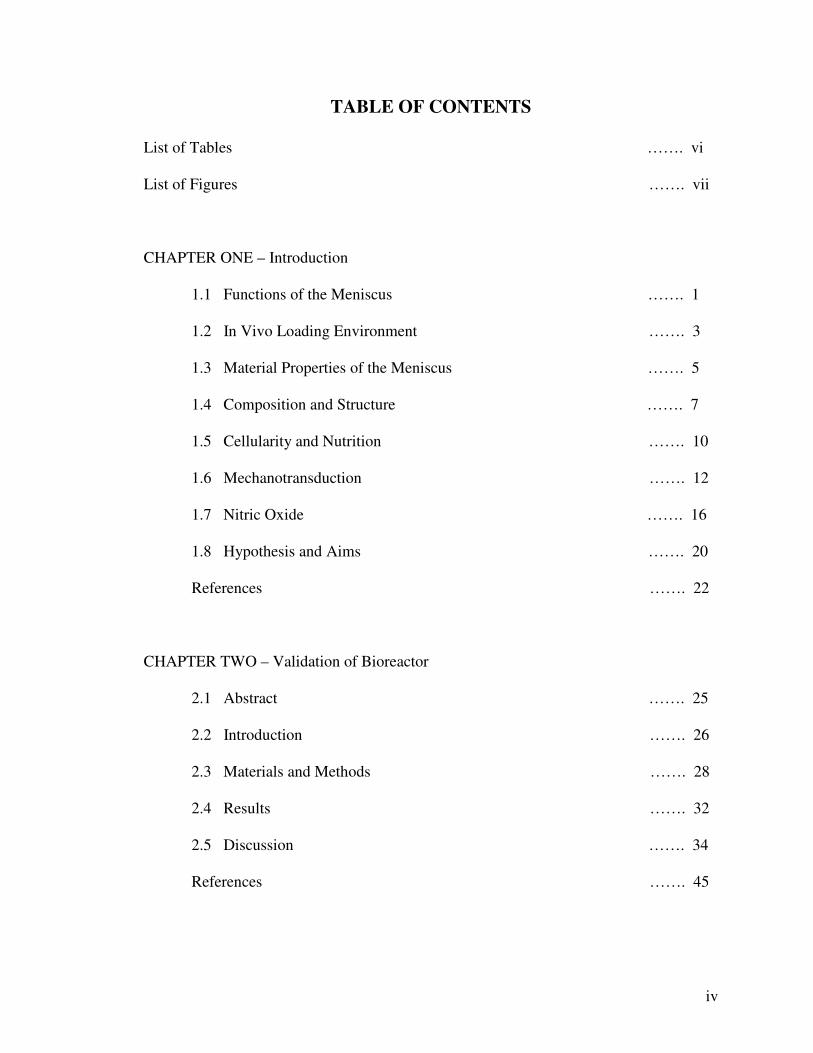
TABLE OF CONTENTS
List of Tables ……. vi
List of Figures ……. vii
CHAPTER ONE – Introduction
1.1 Functions of the Meniscus ……. 1
1.2 In Vivo Loading Environment ……. 3
1.3 Material Properties of the Meniscus ……. 5
1.4 Composition and Structure ……. 7
1.5 Cellularity and Nutrition ……. 10
1.6 Mechanotransduction ……. 12
1.7 Nitric Oxide ……. 16
1.8 Hypothesis and Aims ……. 20
References ……. 22
CHAPTER TWO – Validation of Bioreactor
2.1 Abstract ……. 25
2.2 Introduction ……. 26
2.3 Materials and Methods ……. 28
2.4 Results ……. 32
2.5 Discussion ……. 34
References ……. 45
v
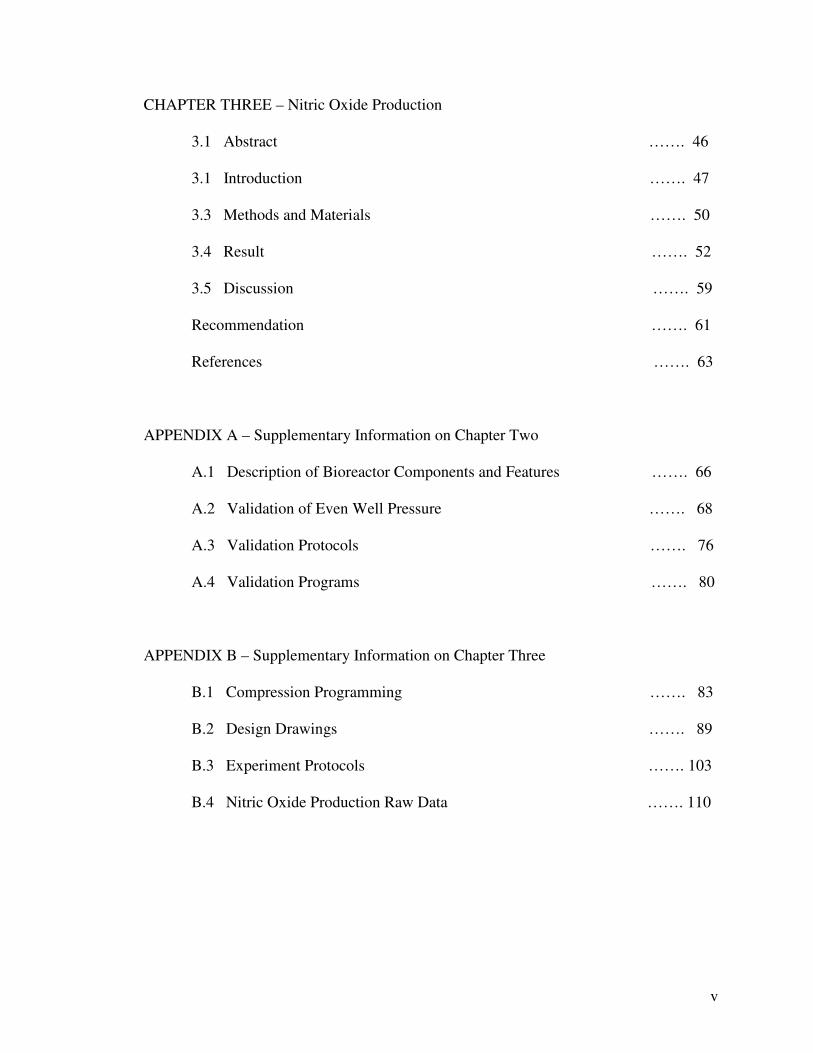
CHAPTER THREE – Nitric Oxide Production
3.1 Abstract ……. 46
3.1 Introduction ……. 47
3.3 Methods and Materials ……. 50
3.4 Result ……. 52
3.5 Discussion ……. 59
Recommendation ……. 61
References ……. 63
APPENDIX A – Supplementary Information on Chapter Two
A.1 Description of Bioreactor Components and Features ……. 66
A.2 Validation of Even Well Pressure ……. 68
A.3 Validation Protocols ……. 76
A.4 Validation Programs ……. 80
APPENDIX B – Supplementary Information on Chapter Three
B.1 Compression Programming ……. 83
B.2 Design Drawings ……. 89
B.3 Experiment Protocols ……. 103
B.4 Nitric Oxide Production Raw Data ……. 110
vi
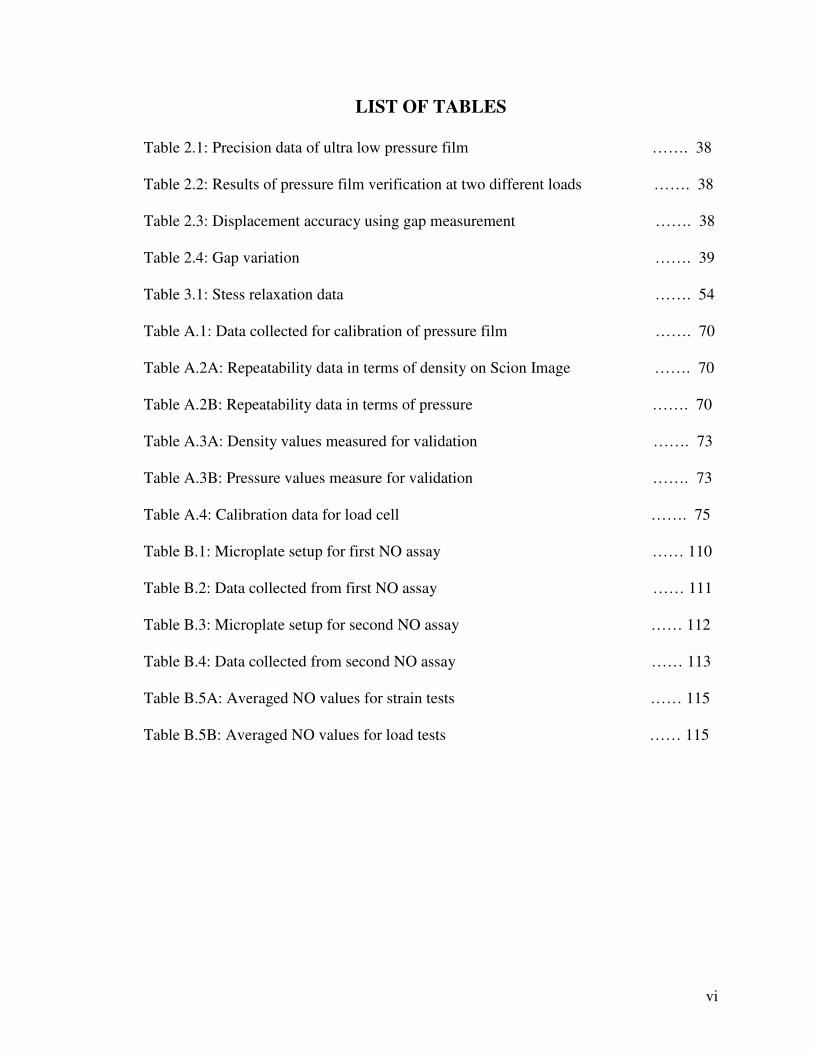
LIST OF TABLES
Table 2.1: Precision data of ultra low pressure film ……. 38
Table 2.2: Results of pressure film verification at two different loads ……. 38
Table 2.3: Displacement accuracy using gap measurement ……. 38
Table 2.4: Gap variation ……. 39
Table 3.1: Stess relaxation data ……. 54
Table A.1: Data collected for calibration of pressure film ……. 70
Table A.2A: Repeatability data in terms of density on Scion Image ……. 70
Table A.2B: Repeatability data in terms of pressure ……. 70
Table A.3A: Density values measured for validation ……. 73
Table A.3B: Pressure values measure for validation ……. 73
Table A.4: Calibration data for load cell ……. 75
Table B.1: Microplate setup for first NO assay …… 110
Table B.2: Data collected from first NO assay …… 111
Table B.3: Microplate setup for second NO assay …… 112
Table B.4: Data collected from second NO assay …… 113
Table B.5A: Averaged NO values for strain tests …… 115
Table B.5B: Averaged NO values for load tests …… 115

vii
LIST OF FIGURES
Figure 1.1: View of meniscus interior ……. 8
Figure 2.1: Plunger/Dish/Cap assembly ……. 40
Figure 2.2: Test Frame ……. 41
Figure 2.3: Pressure film impressions at 0.477 MPa pressure ……. 42
Figure 2.4: Pressure film impressions at 0.564 MPa pressure ……. 43
Figure 2.5: Calibration curve for pressure film ……. 44
Figure 3.1: Pressure vs. Time for displacement control ……. 53
Figure 3.2: Strain vs. Time for load control ……. 54
Figure 3.3: NO produced by superficial during displacement control ……. 56
Fiqure 3.4: NO produced by deep during displacement control ……. 57
Figure 3.5: NO produced by superficial during load control ……. 58
Figure 3.6: NO produced by deep during load control ……. 59
Figure A.1: Image of dish/load cell assembly ……. 67
Figure A.2: Load signal connection to bioreactor ……. 67
Figure A.3: Image of bioreactor setup in incubator ……. 67
Figure A.4: Calibration curve for pressure film ……. 69
Figure A.5: Presure film impression of repeatability test ……. 70
Figure A.6: Repeat impression of 0.477 MPa test ……. 71
Figure A.7: Repeat impression of 0.564 MPa test ……. 72
Figure A.8: Calibration curve relating load applied to encoder count ……. 74
Figure A.9: Calibration curve relating load applied to voltage ……. 75
Figure B.1: Image of setup frame ……. 89

viii
Figure B.2: Calibration curve for first NO assay ……. 112
Figure B.3: Calibration curve for second NO assay ……. 114
1
CHAPTER ONE
INTRODUCTION
1.1 Functions of the Meniscus
The menisci are specialized fibrocartilaginous structures that play a crucial role in
the maintenance of knee stability, load distribution, joint lubrication, and shock
absorption [1-8]. They have a semicircular shape with a wedge-shaped cross-section that
adapts the curvature of the femoral condyles to the flatter tibial plateau. The tibial
surface of the meniscus is flat while the femoral surface is convex. Their shape increases
the tibial plateau contact area, thereby decreasing the contact stresses significantly in the
knee. It has been shown that between 30% and 65% of the total knee joint load is
transmitted through the meniscus, reducing the compressive stress on the articular
cartilage and subchondral bone[3, 9]. During compressive loading of the knee, pressure
is added to the superior surfaces of the menisci that has both a horizontal and vertical
component. The vertical component is balanced by the reaction force of the tibial plateau
[4]. The horizontal force is opposed by the hoop stress that forms in the circumferential
direction of the meniscus [3, 9].
Following partial and full meniscectomy, changes occur in the knee due to a loss in
the weight bearing capacity of the menisci. Narrowing of the joint space, formation of an
osteophytic ridge between the femoral condyles, flattening of the femoral articular

2
surface, and osteoarthritis are symptoms seen in meniscectomized knees [1, 3, 4, 10].
Osteoarthritis (OA), characterized as the loss of articular cartilage, has been investigated
and is thought to be triggered by meniscectomy [1, 11]. OA following meniscectomy is
hypothesized to be a result of the increased contact pressure between the femoral
condyles and the tibial plateau, resulting in overstraining and degeneration of the articular
cartilage. Thus, this demostrates the vital role the meniscus plays in the weight bearing
function of the knee joint.
The meniscus also provides stability between the femur and tibial plateau. The
semicircular shape and the meniscal attachments help keep the femoral chondyles in the
correct location by providing resistance. This aids the other ligaments in the stability of
the joint by reducing motion. The movement of each meniscus is restricted by the
ligamentous anterior and posterior horns connecting the meniscus substance to the tibial
plateau. The circumferential matrix fibers of the meniscus extend to the intercondylar
area to secure the meniscus. The lateral meniscus is radially smaller than the medial and
attaches centrally along the intercondylar eminence [1, 12]. The larger medial meniscus
connects more on the anterior and posterior portion of the intercondylar area. The deep
medial ligament and posterior portion of the superficial medial ligament also fix the
medial meniscus to the femur. The lateral meniscus attachments are less firm allowing
greater posterior displacement of the meniscus as the tibia rotates during flexion [1, 13].
The medial meniscus has been found to move a few millimeters while the lateral
meniscus can move at least a centimeter [4, 12]. These attachments allow the meniscus
to move slightly along the tibial plateau as the knee flexes.
3
The meniscus also serves as a limited shock absorbing medium [1, 8, 14] and aids in
lubrication of the joint [4, 15]. These functions come from the composition of the
meniscus and the ability of the tissue to allow fluid flow through the extra-cellular
matrix. The smooth surface of the meniscus in the presence of the synovial fluid is
nearly frictionless, allowing unrestricted motion in the knee. Permeability of the tissue
allows fluid to leave during compression, reducing the hydrostatic pressure within the
matrix. This mechanism allows the meniscus to be a natural shock absorber. The study
performed by Voloshin, et al. (1980) concluded that removal of the meniscus reduces the
knees shock absorbing capacity by 20%.
1.2 In Vivo Loading Environment
The meniscus experiences a complex loading due to its form and function as a
weight bearing structure and joint stabilizer. Their location between round femoral
condyles and the tibial plateau creates compressive and tensile forces in the tissue matrix.
The loading is further complicated during joint flexion and extension as the tibia rotates
and the knee locks during the “screwed home” process. This occurs when the knee
reaches full extension and is actually in a few degrees of hyperextension, increasing the
load on the anterior portion of the meniscus. However the menisci experience the highest
level of loading during 0˚ flexion [1, 11, 16]. Overall, the meniscus experiences up to
four times body weight (a range of 0-3000 N) of compressive loading during walking
[17].
The applied forces generate both a horizontal and vertical component on the
superior surface as previously described. The vertical components of force on the
4
superior surface are balanced by the vertical components on the inferior surface generated
by the tibial plateau. This balance of vertical forces causes compressive stress in the
meniscus and holds it tightly between the femur and tibia during high levels of joint load.
The horizontal force component is created by the rounded femoral condyle and matching
concave superior surface of the meniscus. This force component acts to displace the
meniscus radially outward. Opposing this force is the circumferential Type I collagen
bundles that continue into the menical attachments and connect to the tibia. These fiber
bundles provide tension that resist stretching and displacement of the tissue. The tibia
provides the anchor point for resisting radial displacement. During joint flexion, the
central portion of the meniscus does displace slightly outward [9]. However, the anterior
and posterior regions move inward to produce a more compressed C-shape meniscus than
during the unloaded state.
The loading conditions on the meniscus also change as the knee moves from full
flexion to full extension [1, 9, 13, 18]. This range of motion is approximately 140° [4,
16]. As the knee moves from 30° of flexion to full extension, 18° of internal rotation of
the femur occurs with respect to the femur [4, 11]. During flexion, the distance between
the femoral condyle increases and the radius of curvature increases. This keeps the
contact area high and pushes the menisci away from the center [9]. As the knee moves to
extension, the radii of the femoral condyles increase and the distance between them
decreases. When load is applied during extension, the menisci deform anteroposteriorly
[9]. During full extension the femoral condyles slide posteriorly as they contact the
anterior horns of the menisci [4, 18, 19]. This motion tightens the anterior cruciate
ligament and stops the extension of the lateral femoral condyle. The medial condyle

5
rotates further forward until the popliteal tendon, tibial and fibular collateral ligaments
are tight [4, 20]. At this point in extension, the meniscal horns add further restriction
since the anterior portions of the menisci are tightly wedged between the femur and tibia.
This is when the knee has “screwed home.” To unlock the knee, the popliteus muscle
contracts and rotates the lateral femoral condyle posteriorly [20]. This is approximately
18° of rotation, which occurs in the first 30° of flexion [4]. As the knee unlocks and
moves in flexion, the menisci move with the femoral condyles keeping a large contact
area [9]. This happens when the meniscofemoral ligaments pull the posterior section of
the lateral meniscus in the medial direction. The popliteus muscle also pulls the posterior
section back over the tibial plateau. The medial meniscus is pulled forward during
flexion by the deep and superficial medial ligaments.
The motion of the meniscus, as the knee flexes, shifts load constantly through the
knee. The menisci shift constantly with the femur to keep contact area high and maintain
their weight bearing function. Constant compressive and tensile forces are present on the
structure making the material properties particularly important for the menisci to function
properly.
1.3 Material Properties of the Meniscus
The complex loading environment shows that the meniscus requires different
compressive and tensile strengths. The circumferential direction must have high tensile
strength to resist the hoop stress generated by the radial force component during joint
load. The meniscus must be strong enough in tension in the radial direction to keep the
6
tissue from tearing under normal loading condition. There also has to be a high
compressive strength to distribute load from the femoral condyles.
The circumferential direction has shown to have the highest tensile strength [2,
21-23]. Tests performed on the meniscus have characterized the elastic modulus of the
anterior, central, and posterior regions for both the lateral and medial meniscus. The
results from Fithian (1989) show the anterior region to have an average elastic modulus
in the circumferential of approximately 160 MPa for both menisci (Lateral: 159.07 ±
47.4; Medial: 159.58 ± 26.2). The central region showed 228.79 ± 51.4 MPa for the
lateral and 93.18 ± 52.14 MPa for the medial. The posterior region showed 294.14 ±
90.4 MPa for the lateral and 110.23 ± 40.7 MPa for the medial. Tissakht (1994)
documented changes through the depth of the tissue; proximal, middle, and distal
circumferential tensile elastic modulus. On average, the middle portion had the lowest
elastic modulus with proximal and distal being close to one another. Their results also
showed the lateral meniscus had a higher elastic modulus than the medial meniscus for all
regions.
The tensile modulus of the meniscus in the radial direction is much smaller than
circumferential. The elastic modulus ranges from 2 MPa to 23 MPa depending on the
region, layer, and location of the tissue [21]. On average the middle layer has the lowest
elastic modulus with the proximal and distal layer being the highest. The posterior region
has the highest modulus at the proximal and distal layers while the anterior seems to have
the lowest at those layers.
The compressive strength of the meniscus depends largely on the strain rate at
which the tissue is tested [3]. Krause (1976) et. al. tested percent energy reduction in
7
compressed canine menisci at 3 different deformation rates, 2.12x10⁻⁵, 4.23x10⁻⁵, and
21.16x10⁻⁵ (m/sec). The resulting percent reduction in energy was 46.8 ± 18.6, 42.3 ±
20.3, and 32.2 ± 1.6 (%), respectively. This data shows that a greater amount of energy is
required to compress the meniscus at higher strain rates. The high water content of the
tissue creates a hydrostatic pressure that provides the compressive strength. As load is
added to the tissue, hydrostatic pressure increases and then decreases as fluid flows out of
the tissue. The compressive strength has also been shown to increase exponentially with
level of strain [14]. At 0.2 strain, the compressive elastic modulus for the
circumferential, radial, and axial direction is 10 MPa, 13 MPa, and 19 MPa, respectively.
At 0.8 strain, the compressive elastic modulus for the same three directions are 288 MPa,
287 MPa, and 299 MPa, respectively. This shows that the meniscus has the greatest
compressive strength in the axial direction, which is expected.
1.4 Composition and Structure
The meniscus is a biphasic material that includes an extra-cellular matrix filled with
interstitial fluid. It is composed of approximately 75% water, 20% collagen, and 5%
non-collagenous substances such and proteoglycans, lipids, and cells [1, 7, 14, 23].
These components contribute to the specialized structure and function of the meniscus.
The fluid within the matrix experiences limited flow through the boundaries [24]. As
load is added to the meniscus, the hydrostatic pressure increases within the meniscus
making it strong in compression [14]. This pressure decreases with time as fluid flows
out of the meniscus, compressing the matrix. When load is removed, the matrix returns
8
and fluid flows back into the meniscus, returning it to equilibrium. This behavior makes
the meniscus a natural load bearing and shock absorbing structure.
The extra-cellular matrix is dominated by collagen, specifically Type I with small
amounts of Type II, III, and IV [1, 6, 23, 25]. Numerous bundles of circumferentially
oriented Type I collagen fibers are dispersed throughout the meniscus giving its highest
tensile strength in that direction (Figure 1) [1, 3, 12, 14, 21, 23, 26, 27]. Some of these
layers extend past the meniscus and form the horn attachments. Other collagen fibers are
oriented radially and woven into the circumferential bundles (Figure 1). There are also
some superficial fibers with random orientation creating a mesh-like matrix on the
femoral articular surface. Type I collagen is a fibrous component that is strong in tension.
This collagen arrangement is ideal when resisting the hoop stress created during normal
loading conditions.
{www.orthoteers.co.uk/Nrujp~ij331m/orthkneemenisc.htm}
Figure 1.1: A cross-section of the meniscus showing the radial and circumferential collagen fiber
orientation. Also shown are blood vessels penetrating the peripheral one-third of the tissue and location of
chondrocytes.
9
Proteoglycans are another important component within the meniscus that add
resilience and strength to the structure during compressive loading [1, 27]. Much of the
noncollagenous portion of the extracellular matix is proteoglycans termed aggrecan,
decorin, and biglycan, with aggrecan being the major type. These are large molecules
with a core protein and a repeating sugar chain that is electronegative. These hydrophilic
molecules can entrain 50 times their weight in free solution. The charge-charge repulsion
force stiffly extends the proteoglycans in the matrix, making them naturally resistant to
compression. Aggrecan is a type of proteoglycan that aggregates to hyaluronic acid to
form a large molecule like those found in articular hyaline cartilage. These “cartilage-
like” proteoglycans are the most abundant form in the adult human meniscus [5, 27, 28].
Proteoglycans that do not aggregate to hyaluronic acid are smaller, contain dermatan
sulfate, and are either decorin or biglycan. Decorin has one dermatan sulfate chain and
biglycan has two. Approxmimately 75% of the dermatan sulfate proteoglycans in the
meniscus are decorin [28]. Proteoglycans are woven into the collagen matrix and
distributed in an inhomogeneous manner allowing fluid flow in the meniscus. Therefore
these molecules contribute in numerous ways to the compressive strength of the
meniscus.
Some other elements present in small amounts in the meniscus are elastin, uronic
acids, hexosamine, and ash [29]. These elements form very small amounts of the extra-
cellular matrix. The cells in the meniscus, which are responsible for proper maintenance
of the matrix, are called fibrochondrocytes.
10
1.5 Cellularity and Nutrition
The meniscus is composed of two distinct species of fibrochondrocytes that are
generally distributed through the extra-cellular matrix in a homogenous manner [30].
The first species resembles fibroblasts and is found toward the superior surface. The
second type resembles chondrocytes and is found closer to the inferior surface of the
meniscus. Each type has a different phenotype, function, and distribution throughout the
extra-cellular matrix. These fibrochondrocytes produce the components needed to
maintain the fibrous tissue structure.
Fibroblasts are a type of connective-tissue cell that secretes extra-cellular matrix
that is rich in Type I collagen. These cells are capable of differentiating into several
different types of more specialized cells [31]. Fibroblasts can convert into chondrocytes,
osteocytes, fat cells, and smooth muscle cells [31]. It appears that the conversion from
fibroblast to chondrocyte is reversible. The differentiation of these cells seems to be
influenced by the extra-cellular matrix through physical and chemical effects. An
example is chondrocytes that are cultured in low density as a monolayer. Under these
conditions, the chondrocytes lose their rounded shape, flatten, and stop producing
collagen matrix [31]. Instead, the cells stop producing Type II collagen, and start
producing Type I collagen, taking on the appearance of fibroblasts [31]. This helps
explain why the cells within the meniscus appear as fibroblasts in some regions and
chondrocytes in others. Since, the superficial region of meniscus has such a large amount
of Type I collagen, the cells take on the fibroblast form and produce Type I collagen.
The cells in the deep regions of the meniscus are surrounded by more proteoglycans and
11
small amounts of Type II collagen. These cells are chondrocytic and function to maintain
the pericellular matrix.
The cells of the meniscus are set in well-defined lacunae and can be individual or
paired [26]. The lacunae in the superficial layer are more compressed and fusiform than
those in the interior layers. These superficial layers have a more homogenous extra-
cellular matrix and appear to be more hyaline-like. This zone is a high-density,
multilayer of fibroblastic cells that is surrounded by a large amount of Type I collagen.
Cells in lower density surrounded by less Type I collagen will appear and behave like
chondrocytes. In the deeper zones and closer to the inferior surface, there is a lower cell
density of round or polygonal shaped chondrocytic cells. This subtype of cells
synthesizes a large amount of sulfated proteoglycans and does not produce Type I
collagen. This is a major component of articular cartilage that provides compressive
strength, which is also found in the meniscus.
The lowest cell density is located in the central region of the meniscus [24, 30]. It is
believed that cell density may be correlated to the supply of nutrition in the meniscus.
The nutrient supply to the meniscal cells depends on two main sources, blood supply and
synovial fluid. Only the peripheral 10 to 30% of the adult meniscus is vascularized,
making the meniscus a relatively avascular structure (Figure 1). Blood is the main source
of nutrients necessary to keep the fibrochondrocytes alive and the tissue healthy. This
blood supply comes from the inferior, superior, and middle genicular arteries that run
together in a capillary plexus on the periphery of the meniscus [1]. Radial branches
penetrate and spread into the peripheral one-third of the structure. The components
necessary for synthesis of the extracellular matrix are provided by the blood and by
12
synovial fluid. There is a larger population of cells near the surface of the meniscus with
a decreasing population of cells towards the interior. The interior region is only
nourished by diffusion of the blood from the periphery and diffusion of synovial fluid
from the exterior. Cells that do not receive blood supply directly depend on fluid flow
within the tissue. The nutrients are believed to diffuse through the tissue if the molecules
are small enough [24]. Fluid is able to move through the articulating surface through
canals 10-200 µm in diameter [1, 32]. These canals may play a role in nourishing the
tissue even though they are not filled by the blood supply. Fluid motion associated with
mechanical loading aids in nutrition by creating a greater flow of nutrition to cells.
The limited nutrient supply to the meniscus is believed to be the reason for its poor
healing characteristics [24]. The inner two thirds of the meniscus heals poorly and is
therefore frequently removed when torn. The vascularized portion is usually repaired
because the vascularization increases the chances of healing. Sutures are often used to
close tears, which occur in the outer one-third of the structure. This region is capable of
cell proliferation and remodeling. The ability of a tissue to remodel depends on the
chemical signaling between cells. These chemical signals require a pathway such as
blood, synovial fluid, and gap junctions to create a healing response from distant cells.
Without this pathway, the tissue is not capable of regeneration.
1.6 Mechanotransduction
Mechanotransduction is the mechanism that presumably leads to remodeling in
several types of tissue. In this process, a mechanical signal creates a change in the
environment of a cell, which produces a biochemical response. These chemical
13
responses are carried throughout the tissue serving as paracrine and autocrine signals to
produce changes in cellular behavior throughout the tissue. This mechanism is
responsible for the maintenance of matrix metabolism and the remodeling of many types
of tissue. The process requires sensor cells, a pathway for signal transduction, and
effector cells to respond to the signaling.
Mechanocoupling is the transduction of mechanical forces to a form that can be
detected by cells [33]. Physical stimuli include factors such as tension, shear, hydrostatic
pressure, fluid flow, and the frequently studied physical condition in the meniscus,
compression. As these physical stimuli are imposed on tissue, the extracellular matrix
deforms, transmitting the mechanical energy to the cells. Sensor cells respond to stimuli
with various chemical signals with mechanisms that are not completely understood.
Theory suggests there are multiple ways a cell can sense physical change. One way the
cell may detect changes is through the activation of mechanosensitive (MS) ion channels
[34]. These are gated channels that are found in the membrane of all types of living cells.
The two basic types are stretch-activated and stretch-inactivated ion channels [34], both
are used for electrical and/or chemical intracellular signaling. Stretch-activated MS
channels are controlled by gates that respond to mechanical forces. The bilayer model
and the tethered model are two theories used to describe gating of these channels [34]. In
the bilayer model, mechanical forces produce tension in the lipid bilayer of the cell
membrane, which directly gates the MS channels [34]. In the tethered model, there are
direct connections between the cytoskeleton and MS channels [34]. Gating occurs when
mechanical forces deform the cell and displace the channel gate relative to the
cytoskeleton.
14
The cytoskeleton potentially plays a larger role in mechanotransduction than
gating. It forms a network connecting the extracellular matrix to the nucleus and other
organelles found within the cytoplasm. Glycoproteins called integrins extend from the
actin of the cytoskeleton through the membrane to the extacellular matrix [33]. This
allows for mechanical signals to be rapidly transmitted from the extracellular matrix to
the nucleus, possibly altering gene expression. Recent studies have shown that
deformation of tissue by compression brings distinct changes in cell and nucleus shape
[35]. Static compression can alter the morphology of other organelles found in the cell,
thereby altering the location and activity of intacellular enzymes. Compression is
frequently studied in both articular cartilage and meniscus and is believed to play a major
role in tissue homeostasis. In articular cartilage, compression alters the morphology and
structure of the gogli apparatus and rough endoplasmic reticulum [35], which is believed
to produce new matrix molecules with altered form and function.
Biochemical coupling is the mechanism of converting the physical stimuli sensed
through mechanoncoupling into a biochemical signal [33]. Though not fully understood,
the theory is that mechanical energy is transmitted to sensor cell through one of the
mechanisms described above. This produces a change in the normal behavior of the cell
leading to altered gene expression, enzyme production, and signaling. These factors
produce autocrine and paracrine signaling that changes the function of the sensor cells
and the effector cells. An effector cell receives the biochemical signal produced by the
sensor cell, which alters the effector cells behavior. This type of signaling, paracrine,
require a pathway such as gap junctions or interstitial fluid. Blood is a major pathway for
biochemical signaling in many tissues. Fluid, either blood or interstitial fluid, carry
15
cytokines to and from cells creating a reaction. The result of such signaling is a response
by cells that acts to regulate matrix metabolism. In the case of the meniscus, that
response may be to increase or decrease the production of collagen, proteoglycans, or
other matrix molecules [22, 32,33,34,39].
The biochemical factors produced by the mechanical stimulation of the meniscus
are not fully understood, nor are the interactions of signaling molecules. Some of the
biochemical factors that have been studied in the meniscus and articular cartilage are
interleukin-1 (IL-1), tumor necrosis factor α (TNFα), Prostaglandin E2 (PGE2), and nitric
oxide (NO)[7, 36-40]. These factors play a role in matrix metabolism and have been
implicated in the onset of osteoarthritis [36, 41]. IL-1 and TNFα are proinflammatory
cytokines that may induce production of the mediators NO and PGE2. These cytokine
have also been associated with up-regulation of genes responsible for possible matrix
degradation and inflammation of cartilage such as inducible nitric oxide synthase (NOS2)
and cyclooxygenase 2 (COX-2). Genes such as NOS2 and COX-2 are most likely
responsible for production of NO and PGE2, respectively. In the meniscus, IL-1β
significantly increases production of NO [36, 41] and PGE2 [36]. IL-17 and TNFα also
increases NO production in the meniscus, although to a lesser extent. These cytokines
also produce increased levels of COX-2 and NOS2 with IL-1 and IL-17 producing the
greatest amount of NOS2 [36]. The highest levels of COX-2 are produced when
meniscal tissue is incubated with IL-1 and the NOS2 inhibitor 1400W [36]. Taken
together, these studies show the effect cytokines and gene expression have on production
of matrix metabolism regulating factors such as PGE2 and NO.
16
Although the signaling pathways in the meniscus are not fully understood,
compression is believe to play a role in maintaining tissue metabolism through
mechanontransduction. Unloading has been shown to decrease aggrecan [27] and
collagen [42] in the meniscus. While conversely, dynamic compression has been shown
to increase proteoglycan release rates from meniscal explants as well as increased NO
and PGE2 production[40]. The amount of proteoglycan release seems to be dependent
on NO production. Also, the amount of NO produced seems to be dependent on the
presence of IL-1 as well as compression. Although complex, understanding these
mechanotransduction pathways is important because signaling molecules such as NO
may play an important role in meniscal health and the onset of osteoarthritis [22, 32-34,
39, 46].
1.7 Nitric Oxide
Nitric Oxide (NO) is a gaseous free radical that acts as an intercellular and
intracellular messenger in several different tissues [39]. It is a free radical that is
synthesized from the conversion of L-arginine to L-citrulline and NO by a family of
enzymes called nitric oxide sythases (NOS). There are three isoforms in this family of
enzymes, NOS1, NOS2, and NOS3. NOS1 and NOS3 are calcium dependent while
NOS2 is expressed after exposure to diverse stimuli such as inflammatory cytokines.
NOS2, or iNOS, is the inducible form of nitric oxide synthase that is responsible for
producing NO in tissues such as the meniscus and articular cartilage [36, 37, 39, 43, 44] .
Nitric oxide is an important molecular messenger in mechanical signal transduction and
has a very short half-life of less than 10 seconds, at which point it breaks down into stable
17
nitrite and nitrate [7, 45]. As a short acting signaling molecule, NO requires a fast acting
signaling pathway in order to produce cellular response. Furthermore, NO should only
act on nearby cells and proteins. How this molecule is produced, and its interaction with
cytokines, cells, and tissue are important in determining the affect it has on articular
cartilage and the meniscus.
NO has been found in high levels in the synovial fluid of patients with
osteoarthritis and rheumatoid arthritis [39, 46]. Osteoarthritic cartilage has been shown
to produce NO spontaneously. Healthy articular cartilage and meniscus have been
studied to determine what loading and biochemical conditions produce an up-regulation
in nitric oxide production by cells [7, 37, 38, 40, 43, 45, 47-49]. These studies in general
have shown that both chondrocytes and fibrochondrocytes spontaneously produce NO.
Also, dynamic compressive strain appears to increase NO production in both articular
cartilage and meniscal explants. It is still unknown what levels of physiological load and
strain produce harmful amounts. Stimulation with IL-1β and lipopolysaccarides (LPS),
an endotoxin that activates iNOS, also increases NO in the meniscus suggesting high
levels in osteoarthritic knees may be due to other factors in addition to mechanical
stimulation.
In the meniscus, cytokines appear to play a major role in the up-regulation of
nitric oxide. Inflammatory mediators IL-1β, IL-17, and TNFα have all shown to increase
NO production in meniscal explants [36, 37, 40, 41]. On the other hand, hyaluronan
(HA) has been shown to suppress NO production in the meniscus [45]. HA is
glycosaminoglycan, which is often injected into the knee to slow osteoarthritic
progression. HA is known to inhibit the release of glycosaminoglycans in articular
18
cartilage, delay degradation, and reduce inflammation. NG-monomethyl-L-arginine (L-
NMA), a commonly used inhibitor of nitric oxide sythase, was also found to strongly
inhibit NO production in meniscal cell cultures [37]. Studies by Cao et. al. (1998)
showed that meniscal explants did not produce nitric oxide in response to cytokine
stimulation if only fibroblastic cells were present. However, enzymatic digestion of fresh
meniscal fragments containing both fibroblastic and chondrocytic cells produced large
quantities of NO in response to cytokine stimulation. This suggests that perhaps
chondrocytes are a large source of nitric oxide in the meniscus. Since both articular
caritlage and meniscus contain chondrocytic cells, NO studies performed on articular
cartilage can be useful in understanding NO production in the meniscus.
Nitric oxide may decrease the synthesis of extracellular matrix, increase
degradation of the matrix, and lead to cell apoptosis. Cao et. al. (1998) found that in the
meniscus, NO inhibits collagen and proteoglycan [48] synthesis, yet protects
proteoglycans from the catabolic effects of IL-1 [40]. Nitric oxide is also believed to
cause extracellular matrix degradation due to its high concentrations in osteoarthritic
joints. NO acts to break down collagen and proteoglycans through metalloproteases [39].
Matrix degradation may also be a result of fibrochondrocyte apoptosis. Hashimoto et. al.
(1999) reported a high occurrence of apoptotic cell death associated with high levels of
NO in the osteoarthritic knee. This suggest that NO may play a part in apoptosis which
would result in the calcification and loss of the cells pericellular matrix [41].
Nitric oxide is suspected in playing a major role in the matrix metabolism of both
the menisci and articular cartilage. The high concentration of NO in the osteoarthritic
knee implys that it plays a role in tissue inflammation and matrix degradation. Whether
19
this cellular messenger is up-regulated primarily by other cytokines or mechanical stress
is yet to be determined. The amount of NO present in the meniscus during healthy
loading is also unknown. In order to better understand how nitric oxide mediates matrix
metabolism in the meniscus, NO production should be measured during normal
physiological loading and strain conditions, as well as pathophysiological conditions.
20
1.8 Hypotheses and Specific Aims
Osteoarthritis is a condition characterized by the degradation of articular cartilage
and is positively associated with the presence of knee meniscectomy. The pathogenesis
of osteoarthritis is not well understood, however it is well accepted that the removal of
meniscal tissue associated with the mensicetomy procedure serves to increases the forces
experienced by the remaining meniscal tissue. This increase in meniscal loading
produced by the menisectomy has been postulated to underlie the etiology of this
disorder. Elevations in nitric oxide production have been positively correlated to joint
inflammation, matrix degradation and osteoarthritis progression [37, 39-41, 44, 46, 48,
50]. Evidence exists suggesting that mechanical compression up-regulates NO
production in meniscal explants [7, 40], however neither the relationship between
physiological loading conditions and meniscal nitric oxide production nor the identity of
nitric oxide producing cells, if present, has been established. The objective therefore, of
this study is to determine how loading influences meniscal nitric oxide production. The
working hypothesis for this study is that increased mensical loading will be associated
with an augmented nitric oxide production. To test this hypothesis and accomplish the
objective of this study we will pursue the following two specific aims:
I. To establish the relationship between meniscal strain and meniscal nitric oxide
production. Explants (n=6) will undergo unconfined compression to 0%, 5%, 10%,
15%, and 20% strain at a frequency of 1 Hz. for 2 hrs. Meniscal load will be
calculated and correlated to meniscal nitric oxide production.
21
Hypothesis 1:
The meniscus produces low levels of nitric oxide without additional stimulation
from cytokines or compression. This suggests that low levels of nitric oxide are
present in the meniscus without unhealthy effects. We hypothesize that both
overloading and underloading the meniscus results in increased NO production
compared to the physiological levels of loading.
II. To determine the identity of nitric oxide producing cells. Following mechanical
compression, explants will be cut into superficial and deep zones with each zone
representing a different cell phenotype. Nitric oxide production from each zone
quantified to establish the relationship between cell phenotype and NO production.
Hypothesis 2:
The meniscus contains fibroblastic cells that are prominent in the superior zone
and chondrocytic cells that reside in the deep zone. Since chondrocytes have been
shown to produce high levels of NO in articular cartilage following compression,
we hypothesize that cells from the deep zones will produce more NO in response
to mechanical stimulation compared to superficial zones.
22
REFERENCES
1. Aagaard, H. and R. Verdonk, Function of the normal meniscus and consequences
of meniscal resection. Scand J Med Sci Sports, 1999. 9(3): p. 134-40. 2. Fithian, D.C., et al., Human meniscus tensile properties:Regional variation and
biochemical correlation. Trans. ORS, 1989. 35: p. 205. 3. Krause, W.R., et al., Mechanical changes in the knee after meniscectomy. J Bone
Joint Surg [Am], 1976. 58(5): p. 599-604. 4. McBride, I.D. and J.G. Reid, Biomechanical considerations of the menisci of the
knee. Can J Sport Sci, 1988. 13(4): p. 175-87. 5. Roughley, P.J., et al., The presence of a cartilage-like proteoglycan in the adult
human meniscus. Biochem J, 1981. 197(1): p. 77-83. 6. Tanaka, T., K. Fujii, and Y. Kumagae, Comparison of biochemical characteristics
of cultured fibrochondrocytes isolated from the inner and outer regions of human
meniscus. Knee Surg Sports Traumatol Arthrosc, 1999. 7(2): p. 75-80. 7. Fink, C., et al., The effect of dynamic mechanical compression on nitric oxide
production in the meniscus. Osteoarthritis and Cartilage, 2001: p. 1-8. 8. Voloshin, A.S. and J. Wosk, Shock absorption of meniscectomized and painful
knees: a comparative in vivo study. J Biomed Eng, 1983. 5(2): p. 157-61. 9. Shrive, N.G., O.C. JJ, and J.W. Goodfellow, Load-bearing in the knee joint.
Clinical Orthopedics, 1978. 131: p. 279-87. 10. Kenny, C., Radial displacement of the medial meniscus and Fairbank's signs.
Clin Orthop, 1997(339): p. 163-73. 11. Ahmed, A.M. and D.L. Burke, In-vitro measurement of static pressure
distribution in synovial joints--Part I: Tibial surface of the knee. Journal of Biomechanical Engineering, 1983. 105(3): p. 216-225.
12. Collier, S. and P. Ghosh, Effects of transforming growth factor beta on
proteoglycan synthesis by cell and explant cultures derived from the knee joint
meniscus. Osteoarthritis Cartilage, 1995. 3(2): p. 127-38. 13. Bylski-Austrow, D.I., et al., Displacements of the menisci under joint load: An in
vitro study in human knees. Journal of Biomechanics, 1994. 27(4): p. 421-431. 14. Leslie, B.W., et al., Anisotropic response of the human knee joint meniscus to
unconfined compression. Proc Inst Mech Eng [H], 2000. 214(6): p. 631-5. 15. Grana, W.A., S. Connor, and S. Hollingsworth, Partial arthroscopic
meniscectomy: a preliminary report. Clin Orthop Relat Res, 1982(164): p. 78-83. 16. Maquet, P.G., A.J. Van de Berg, and J.C. Simonet, Femorotibial weight-bearing
areas. Experimental determination. J Bone Joint Surg Am, 1975. 57(6): p. 766-71.
17. Kurosawa, H., T. Fukubayashi, and H. Nakajima, Load-bearing mode of the knee
joint; physical behavior of the knee with or without menisci. Clinical Orthopaedics and Related Research, 1980. 149: p. 283-290.
18. Walker, P.S. and M.J. Erkman, The role of the menisci in force transmission
across the knee. Clinical Orthopedics, 1975. 109: p. 184-92. 19. Seedhom, B.B. and D.J. Hargreaves, Transmission of the load in the knee joint
with special reference to the role of the menisci. Engineering in Medicine, 1979. 8: p. 220-228.
23
20. Welsh, R.P., Knee joint structure and function. Clin Orthop Relat Res, 1980(147): p. 7-14.
21. Tissakht, M. and A.M. Ahmed, Tensile stress-strain characteristics of the human
meniscal material. Journal of Biomechanics, 1995. 28(4): p. 411-422. 22. Fithian, D.C., et al., Exponential law representation of tensile properties of
human menisci. IMechE, 1989: p. 85-90. 23. Proctor, C.S., Schmidt, M.B., Whipple, R.R., Kelly, M.A., Mow, V.C., Material
Properties of the normal medial bovine meniscus. Journal of Orthopaedic Research, 1989. 7(6): p. 771-782.
24. Gershuni, D.H., A.R. Hargens, and L.A. Danzig, Regional nutrition and
cellularity of the meniscus. Implications for tear and repair. Sports Med, 1988. 5(5): p. 322-7.
25. Upton, M.L., et al., Differential effects of static and dynamic compression on
meniscal cell gene expression. J Orthop Res, 2003. 21(6): p. 963-9. 26. Ahluwalia, S., et al., Distribution of smooth muscle actin-containing cells in the
human meniscus. J Orthop Res, 2001. 19(4): p. 659-64. 27. Djurasovic, M., et al., Knee joint immobilization decreases aggrecan gene
expression in the meniscus. Am J Sports Med, 1998. 26(3): p. 460-6. 28. Roughley, P.J. and R.J. White, The dermatan sulfate proteoglycans of the adult
human meniscus. J Orthop Res, 1992. 10(5): p. 631-7. 29. Peters, T.J. and I.S. Smillie, Studies on the chemical composition of the menisci of
the knee joint with special reference to the horizontal cleavage lesion. Clin Orthop, 1972. 86: p. 245-52.
30. Ghadially, F.N., J.M. Lalonde, and J.H. Wedge, Ultrastructure of normal and
torn menisci of the human knee joint. J Anat, 1983. 136 (Pt 4): p. 773-91. 31. Alberts, B., et al., Molecular Biology of the Cell. Third ed, ed. M. Robertson.
1994: Garland Publishing, Inc. 1291. 32. Bird, M.D. and M.B. Sweet, Canals in the semilunar meniscus: brief report. J
Bone Joint Surg Br, 1988. 70(5): p. 839. 33. Duncan, R.L. and C.H. Turner, Mechanotransduction and the functional response
of bone to mechanical strain. Calcif Tissue Int, 1995. 57(5): p. 344-58. 34. Martinac, B., Mechanosensitive ion channels: molecules of mechanotransduction.
J Cell Sci, 2004. 117(Pt 12): p. 2449-60. 35. Grodzinsky, A.J., et al., Cartilage tissue remodeling in response to mechanical
forces. Annu Rev Biomed Eng, 2000. 2: p. 691-713. 36. LeGrand, A., et al., Interleukin-1, tumor necrosis factor alpha, and interleukin-17
synergistically up-regulate nitric oxide and prostaglandin E2 production in
explants of human osteoarthritic knee menisci. Arthritis Rheum, 2001. 44(9): p. 2078-83.
37. Cao, M., et al., Generation of nitric oxide by lapine meniscal cells and its effect
on matrix metabolism: stimulation of collagen production by arginine. J Orthop Res, 1998. 16(1): p. 104-11.
38. Maneiro, E., et al., Aceclofenac increases the synthesis of interleukin 1 receptor
antagonist and decreases the production of nitric oxide in human articular
chondrocytes. J Rheumatol, 2001. 28(12): p. 2692-9.
24
39. Murrell, G.A., et al., Nitric oxide: an important articular free radical. J Bone Joint Surg Am, 1996. 78(2): p. 265-74.
40. Shin, S.J., et al., Regulation of matrix turnover in meniscal explants: role of
mechanical stress, interleukin-1, and nitric oxide. J Appl Physiol, 2003. 95(1): p. 308-13.
41. Hashimoto, S., et al., Nitric oxide production and apoptosis in cells of the
meniscus during experimental osteoarthritis. Arthritis Rheum, 1999. 42(10): p. 2123-31.
42. Dowdy, P.A., et al., The effect of cast immobilization on meniscal healing. An
experimental study in the dog. Am J Sports Med, 1995. 23(6): p. 721-8. 43. Hayashi, T., et al., Nitric oxide production by superficial and deep articular
chondrocytes. Arthritis Rheum, 1997. 40(2): p. 261-9. 44. Kobayashi, K., et al., Chondrocyte apoptosis and regional differential expression
of nitric oxide in the medial meniscus following partial meniscectomy. Journal of Orthopaedic Research, 2001. 19: p. 802-808.
45. Takahashi, K., et al., Hyaluronan suppressed nitric oxide production in the
meniscus and synovium of rabbit osteoarthritis model. J Orthop Res, 2001. 19(3): p. 500-3.
46. Farrell, A.J., et al., Increased concentrations of nitrite in synovial fluid and serum
samples suggest increased nitric oxide synthesis in rheumatic diseases. Ann Rheum Dis, 1992. 51(11): p. 1219-22.
47. Sah, R.L., et al., Biosynthetic response of cartilage explants to dynamic
compression. Journal of Orthopaedic Research, 1989. 7: p. 619-636. 48. Taskiran, D., et al., Nitric oxide mediates suppression of cartilage proteoglycan
synthesis by interleukin-1. Biochem Biophys Res Commun, 1994. 200(1): p. 142-8.
49. Wiseman, M., et al., Dynamic compressive strain inhibits nitric oxide synthesis by
equine chondrocytes isolated from different areas of the cartilage surface. Equine Vet J, 2003. 35(5): p. 451-6.
50. Stefanovic-Racic, M., et al., Nitric oxide and proteoglycan turnover in rabbit
articular cartilage. J Orthop Res, 1997. 15(3): p. 442-9.
25
CHAPTER TWO
VALIDATION OF BIOREACTOR
A Tissue Engineering Bioreactor for Dynamically Compressing Meniscal Explants
with Load or Displacement Control Capabilities
Jeffrey A. McHenry and Tammy L. Haut Donahue
2.1 Abstract
Motivated by our interest in examining meniscal mechanotransduction processes,
we report on the validation of a new tissue engineering bioreactor. This paper describes
the design and performance capabilities of a tissue engineering bioreactor for cyclic
compression of meniscal explants. We showed that the system maintains a cell culture
environment equivalent to that provided by conventional incubators and that its strain
output was uniform and reproducible. The system incorporates a linear actuator and load
cell aligned together in a frame that is contained within an incubator. The actuator has
bi-directional repeatability of +/-.00762 mm and a uni-directional repeatability of +/-
.00254 mm. The actuator can thrust to 2225 N with speed up to 50 cm/sec. The load cell
has a 8895 N capacity with a sensitivity of 2.225 N. Explants (~5mm in height; 6 mm in
diameter) are contained in a six well aluminum dish that is attached to the load cell. A
plunger with six Teflon-filled Delrin compression rods is attached to the actuator, which
is rigidly suspended above the load cell. System performance analysis showed that the

26
greatest difference in displacement between the wells was 0.0889 mm. Out of five tests,
the maximum difference between each well ranged from 0.0813mm to 0.0889 mm with
the same wells producing the greatest difference each time. Since this error is consistent,
adjustments can be made to normalize meniscal explant test results. We conclude that
this device will be useful in determining the biochemical response of tissue culture
explants to dynamic compression.
2.2 Introduction
Mechanical loading of the meniscus plays a crucial role in the metabolic activity
of fibrochondrocytes [1-5]. It is not fully understood how biomechanical and
biochemical events interact to produce changes in the extracellular matrix. Recreating
the physiological forces in vitro using tissue explants while measuring the biological
response provides one method for observing the effect of mechanical stress on the
meniscus [4, 6], however the majority of commercially available bioreactors may not be
suitable for application to meniscal loading studies. Tissue explant culture studies allow
control of loading and biochemical conditions. For these studies to be an accurate in vivo
representation, the conditions within the body must be reproduced within the testing
system.
A meniscal explant compression bioreactor must meet the following criteria to
ensure successful experimentation. Explants must remain sterile throughout the entire
procedure, thus all testing equipment and tools must be able to be sterilized by autoclave
or alcohol before coming in contact with the tissue. Culture media and incubation (5%
CO2, 37°C) used with fresh tissue is necessary for the biological response to resemble the
27
in vivo response. To best create an in vivo response, mechanically loading explants
requires the tissue to experience pressures that the meniscus would experience in the
knee. Pressures up to 10 MPa and strains ranging from 2% to 20% are seen in the
meniscus in vivo [7-9]. The anterior, central, and posterior regions experience different
strain levels, making it necessary to test explants from all three regions. Testing 6
explants at once makes it possible to test how tissue from each region responds to the
same level of loading or strain. If order to create repeatable results, and to show
significance in data, all six explants must experience the same compression. Explants
should receive the same strain within 5% error of each other throughout each test. For a
5mm explant, the displacement range has to be at least 0.1mm ± 2.5µm to 1.0 mm ±
2.5µm to achieve accurate displacement for strain levels ranging from 2% strain to 20%,
respectively. Strains are relatively low in the normal healthy meniscus, but these strain
levels increase with a partial menisectomy [9]. We hypothesized that higher strains
would lead to degeneration of the meniscus by increased levels of nitric oxide.
Current systems for meniscal explant compression apply pressure near or below 1
MPa. The Biopress system (Flexcell International, Hillsborough, NC) uses air pressure
applied to a flexible bottom under each well. It has been used to apply pressures of 0.1
MPa in previous studies done on meniscal explants [1, 3, 4], noting stain levels of
approximately 10% due to the state of unconfined compression. Another biaxial tissue-
loading device, previously used to compress articular cartilage explants, is able to create
a maximum 400 N axial force on as many as 12 explants at once [10]. This device also
has the ability to create rotational motion with a resolution of .0005°, and can only apply
a sine wave with amplitudes as low as 10 µm and as large as 100 µm. Thus, this system

28
is not feasible for larger scale testing on 5mm meniscal explants which require
displacements of 0.5mm for 10% strain.
The goal of this study was to design a tissue engineering bioreactor that cyclically
compresses meniscal explants to physiological stresses and strains. The system had to
meet the following criteria: 1) apply and measure compressive load up to 350 N per
explants 2) create a cyclic compression test using load or displacement control accurate
to within 1% and 3) maintain explants in a physiological environment. The subsequent
sections describe the design of the system, accuracy evaluation, and application of the
system to explant testing.
2.3 Materials and Methods
2.3.1 Design of Bioreactor
To create physiological loads, the system was based on a belt-driven linear
actuator made by Ultramotion and Animatics. The Smartmotor 1720 (Ultramotion,
Mattituck, NY) is an actuator that is part of the Bug series of actuators by Ultramotion,
and utilizes a control package by Animatics. The actuator has a maximum stroke length
of 5 cm and can thrust to 2225 N. It also has a maximum speed of 50 cm/sec with bi-
directional repeatability of +/-.00762 mm and a unidirectional repeatability of +/-.00254
mm. Motor control was achieved by using the SmartMotor Interface (SMI), programs
written with SMI programming language. This allows the motion of the actuator to be
controlled by the signal generated by the load cell or by the displacement of the actuator.
Displacement resolution for the actuator is .4 µm because a 2500 count on the encoder is
equal to 1 mm.
29
Two dimensionally identical strain gage load cells (Interface, Scottsdale, AZ)
with two different load capacities were used. This allows for a more flexible range of
testing, combining higher accuracy at low range testing and greater capacity for high load
applications. The first had a 1334 N capacity and the second has an 8896 N capacity.
Tests that require loads near or above 1334 N will use the higher capacity load cell to
reduce defection and therefore error. Tests run with the lower capacity load cell will
have the advantage of a sensitivity of ~1.30 N and a more accurate signal. The sensitivity
of the higher capacity load cell is ~2.17 N. A 2100 series signal conditioner (Vishay
Intruments, Raleigh, NC) was used to amplify the load cell signal to produce a 5-volt
signal (maximum allowable input voltage to the SmartMotor Interface) at the maximum
load. The choice of load cell is critical because the movement of the actuator during
testing needs to represent the displacement of the meniscal explant. Excess deflection of
the load cell will lead to inaccurate displacement reading through the motor.
The load cell is centered on a 2.54 cm thick aluminum plate that is the base of the
system frame (Fig. 2.1). A stud with a shoulder turned onto it is threaded into the load
cell. This stud connects to the aluminum dish via a quick disconnect pin. The dish has
six 10 mm deep wells equally spaced in a circular orientation. Teflon-filled Delrin
compression rods (diameter= 8mm) for each well are press fit into a plunger which
attaches to the actuator via a quick disconnect pin. The plunger also features two press-
fit aluminum pins that slide into matching holes in the dish. This keeps the compression
rods centered in each well and only allows for one plunger/dish orientation. To enclose
the plunger and dish, an aluminum cap rests on the shoulder of the dish and houses a
linear bearing that is press fit into the cap. Along the resting edge of the cap, four
30
shallow grooves were machined to allow carbon dioxide supply to the explants during
testing. The linear bearing allows the plunger to move up and down within the cap and
restricts the plunger to vertical motion.
The frame is the most critical component to maintaining equal well pressure in all
6 wells. An even well pressure will ensure all six explants experience the same
mechanical stimulation. The frame is rigid to maintain alignment during handling or
assembly. The frame is built out of two one-inch thick parallel aluminum plates
separated by one-inch diameter aluminum support rods (Figure 2.2). Centered on the
bottom plate is the load cell with the six well dish attached. The cylinder of the actuator
is recessed into the top plate, and a collar holds the actuator tight and perpendicular to the
plate.
2.3.2 Accuracy Evaluation of the System
Frame alignment and machining of the parts determined how accurately the
system produced even pressure on all six wells. The length of each compression rod was
measured using a micrometer with 2.54 µm resolution. Measurements of all of the wells
were taken to ensure that they were all the same depth using a dial indicator with a
resolution of 25.4 µm. The top surface of the dish was also measured using a dial
indicator to prove that the top surface would be perpendicular to the axis of the load cell
and actuator. Once these measurements were taken to prove the geometry was correct,
ultra-low pressure film (Sensor Products Inc., East Hanover, NJ) was used to measure
well pressure during compression.
Pressure film analysis was done using Scion Image (National Institute of
Standards and Technology, Gaithersburg, MD) to measure the density of the pressure
31
film samples. When using the pressure film, repeatability tests were performed to
determine the precision of the pressure film. The repeatability of the film was
determined by loading the film in a materials testing machine (Instron Corp., Canton,
MA) to 70 ± .2 N target load. This was repeated seven times. The film was placed on
top of a 13.66 mm diameter by 3 mm thick piece of rubber, which was resting on the
lower platen. The upper platen (2 cm square) was lowered to the surface of the film and
compressed to the target load of 70 N corresponding to a pressure of 0.477 MPa. Once
the target load was reached, the upper platen was immediately raised from the surface of
the pressure film. Calibration of the pressure film was also done using the Instron and
included loading pieces of pressure film ranging from 0.2 MPa to 1.64 MPa. All film
samples were scanned and analyzed using Scion Image with the density scale for this
program set at a range of 0-255 with 255 being completely saturated. Film was
compressed between the platens and a piece of rubber similar to the rubber used for
testing well pressure.
To determine well pressure in the bioreactor, a machined plate was set on top of
the dish with a 3 mm thick piece of uniform rubber. Pressure film was placed on top of
the rubber and the plunger was lowered near the surface of the film. Two different load
settings of 24 N and 28 N on an area of 50.27 mm2 corresponding to pressures of
approximately 0.477 MPa and 0.564 MPa were tested with five tests per load. The 24 N
and 28 N loads were the loads on each compression rod and each rod had a radius of 4
mm. These loads covered the upper end of the spectrum for the pressure film. The film
from the bioreactor was analyzed and density measured to determine the difference
32
between each compression rod. The difference in film density and the maximum
percentage error was determined to demonstrate the accuracy of the system.
2.3.3 Determination of Displacement Accuracy
A second technique for determining the accuracy of the system involved
measuring the gap between the bottom of the compression rods and the bottom of the
wells while the system was assembled into the bioreactor. This was done using auto
body filler and a cream hardener that when mixed together, harden to form a rigid body.
The actuator was used to compress the body filler until the gap between the bottom of the
compression rod and well bottom was filled. The actuator remained at this position until
the body filler hardened completely. The plunger was then removed along with the
pieces of body filler. A micrometer (2.54 µm resolution) was then used to measure the
thickness of the body filler. This process was repeated 5 times with the same plunger and
dish orientation.
2.4 Results
2.4.1 Accuracy Evaluation of the System
The greatest difference in length between any of the compression rods was .0381
mm. All of the well depths were within 0.0254 mm of each other when measured with a
dial indicator. The well depths were measured from the top surface of the aluminum
dish, which was flat to within 0.0254 mm.
33
The densities produced for all the pressure film were compared to the calibration
of the pressure film to determine the pressure. The results of the repeatability test
showed there was an average of 0.4773 MPa with a standard deviation of 0.0003 MPa
(Table 2.1). The pressure film from both the 0.477 MPa and 0.564 MPa tests appear to
show equal pressure in each well for each load (Figures 2.3 and 2.4). There was 0.0912
to 0.1986 and 4.83 to 15.24 percent error for 0.477 MPa and 0.564 MPa respectively
(Table 2.2). At higher loads there was an average difference in pressure of approximately
8.2% percent but at lower loads this error showed an average difference in pressure of
approximately 0.18%. Due to the variability of the pressure film at higher pressures,
these results alone were inconclusive in determining the accuracy of the system.
2.4.2 Determination of Displacement Accuracy
The micrometer measurements from the first samples of body filler showed that
the greatest difference between any of the wells was .0813 mm with well 5 having the
smallest gap. The second and fifth tests gave the same results as the first test. Test three
showed .0864mm and test four showed .0889mm with both showing well 5 to have the
smallest gap. All five tests were run with the same plunger/dish orientation and all tests
showed compression rod 5 to produce a smaller gap. The percent error can be calculated
from the amount of displacement that will be run during each test. If a test is run with a
maximum displacement of 0.5 mm then there is approximately 16.76% difference in
compression on average. For a 0.5 mm target compression, all the explants would be
compressed between 0.4581 mm and 0.5419mm. A 1 mm displacement test would only
see an 8.38% difference in compression on average. For a target of 1mm compression,
34
all explants would be compressed between 0.9581mm and 1.0419 mm. With this data,
the results from testing of explants can be normalized for the difference in wells.
The results from the above gap testing can be seen in Table 2.3. For each test, the
micrometer measurement is displayed for each well, along with the maximum difference,
and average. Tests 3, 4, and 5 have higher values because the target displacement of the
actuator was changed. This was done to show that the difference in the wells would stay
the same regardless of the target displacement. The average maximum gap difference
value is displayed below Table 2.3.
2.5 Discussion
The explant compression system meets the criteria necessary to obtain a realistic
representation of physiological forces present in the knee joint. This system is able to
apply known pressures to six explants at once, which is important when trying to gather
data for hypothesis testing. It is capable of applying physiological levels of load and
displacement, and has the ability to test in load or displacement control. SMI
programming allows for flexibility in frequency, duration, amplitude, and waveform.
The system is small enough to fit in a standard incubator and is made of materials that
can endure autoclaving and alcohol. An important feature to this system is the ability to
keep the explants and media sterile from the culture hood to the incubator. The plunger,
dish, and cap form an enclosure that allow easy transport without allowing open air and
bacteria to infect the sample. Since the cap incorporates a linear bearing it does not need
to be removed for testing. Bacteria can kill cells and alter the chemical response, leading
35
to inaccurate data. Utilizing the system features and designing the correct protocol will
help maintain a sterile environment.
This bioreactor is capable of creating higher loads and greater displacements than
previous systems used for compressing explants[1, 3, 4, 10]. The Biopress system
(Flexcell International, Hillsborough, NC) is not capable of pressures higher than 0.1
MPa since the pressure is applied by air into a flexible bottom. Since our system applies
load using a linear actuator, loads up to 2225 N can be added. In Frank, et. al., 2000, a
biaxial tissue-loading device can load 12 explants in shear and compression [10]. An
advantage our system has is that it can create displacements over 10 mm with a resolution
of 0.4 µm. The Frank, et. al., 2000 creates displacements up to 100µm. Our actuator also
has a bi-directional repeatability of ±7.62µm compared to the ±25µm used in Sah, et al.,
2003. In addition, the present system is capable of 1 Hz cyclic compression in a
sinusoidal type wave using displacement or load control. The flexibility of the
Smartmotor Interface will allow various alterations of test programs. Frequency,
amplitude, and number of cycles can be easily changed. The bioreactor can be used to
compress any tissue that fit under an 8mm compression rod and in a 10 mm deep well.
All surfaces are machined to a smooth, frictionless finish, to ensure the sample is exposed
to pure unconfined compression.
A verification test has been performed to prove that the system remains accurate
in the incubator environment. A 2 hour, 1 Hz displacement controlled test was run with
the incubator at 37˚C. The displacement accuracy did not change at any point during the
testing in the incubator. Additional tests were performed to prove that the plunger, dish,
and cap assembly could maintain a sterile environment from the culture hood to the
36
incubator and back. A practice run of the test protocol using only culture medium
showed no sign of bacteria after four days of culture. This is evidence that the system
can remain sterile through the testing procedure of explants.
The bioreactor has some limitations that need to be compensated for. This system
can only perform unconfined compression. As the sample is compressed, the top and
bottom surfaces of the sample can expand. To keep explants from slipping to one side of
the compression rods, the top and bottom surface of the explant needs to be trimmed to
be parallel. The design is ideal for an explant that is approximately 6 mm in diameter.
This is because the compression rod is 8 mm in diameter so the smaller explant will stay
under the compression rod as long as it is centered. The placement of each sample in the
well has to be exact to ensure the sample stays under the compression rod. Once the cap
is put on and the test starts running, the samples cannot be viewed to determine if they are
being compressed correctly. The only indication of this is the orientation of the explants
when the test is completed and when they are removed.
Another limitation is the machining of each component within the system. The
most accurate machining procedures used can create a part within 0.0254mm. This is
accurate enough for most applications but requires extra compensation for the bioreactor.
Since the displacements in this system are so small, the machine error has to be measured
and accounted for. The gap measurement using the body filler provides a method for
compensation. The results show that well 5 has the smallest gap and should therefore
produce different results than the other wells.
Despite, the limitation described above the explant compression system has
features that are advantageous to tissue compression experimentation. The system
37
maintains a sterile environment throughout the assembly and testing procedures. The
components in direct contact with the tissue sample are made of material that can be
autoclaved or rinsed with alcohol. Six tissue explants are exposed to uniaxial unconfined
compression simultaneously. The system can compress these samples using load or
displacement control settings. Waveforms can be manually programmed into the linear
actuator using the interface software to customize each test. During the test,
displacement and load are recorded at 2 Hz. (min. and max. of each cycle), with a
resolution of 0.4µm and 1.30 N respectively. This system can be utilized to produce
useful test data about tissue response to physiological loading.
ACKNOWLEDGMENT
The authors are grateful to the Whitaker Foundation for their financial support.
38
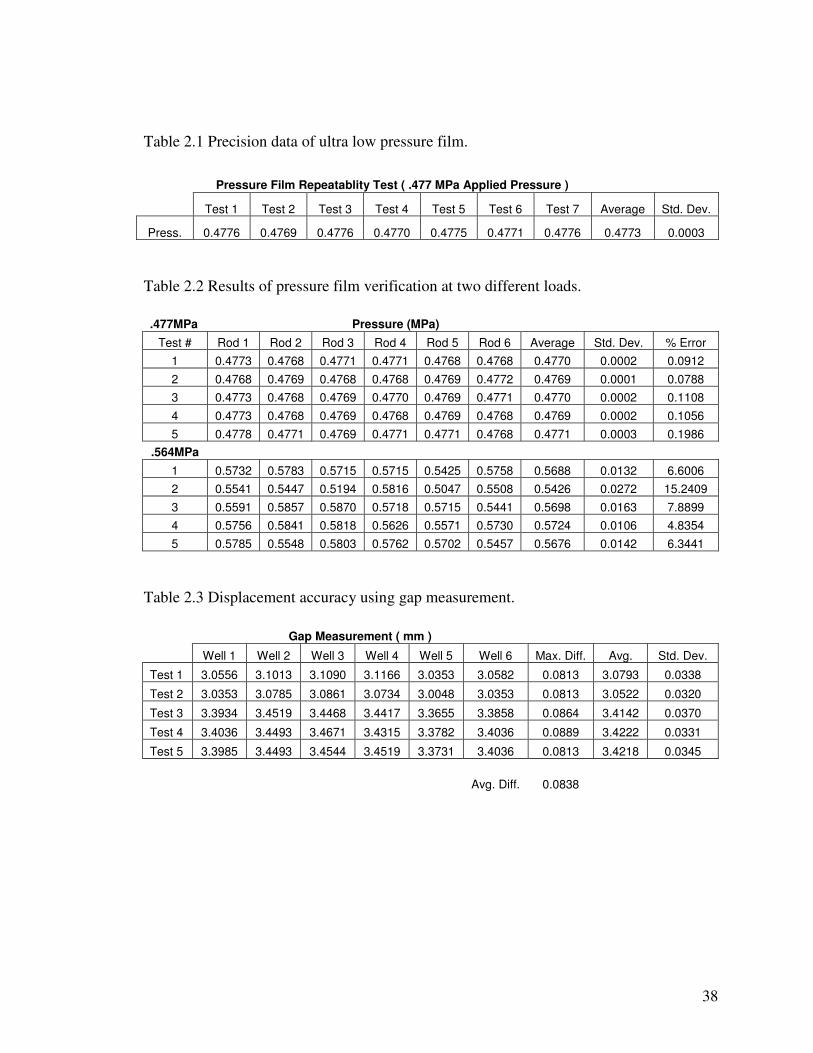
Table 2.1 Precision data of ultra low pressure film.
Pressure Film Repeatablity Test ( .477 MPa Applied Pressure )
Test 1 Test 2 Test 3 Test 4 Test 5 Test 6 Test 7 Average Std. Dev.
Press. 0.4776 0.4769 0.4776 0.4770 0.4775 0.4771 0.4776 0.4773 0.0003
Table 2.2 Results of pressure film verification at two different loads.
.477MPa Pressure (MPa)
Test # Rod 1 Rod 2 Rod 3 Rod 4 Rod 5 Rod 6 Average Std. Dev. % Error
1 0.4773 0.4768 0.4771 0.4771 0.4768 0.4768 0.4770 0.0002 0.0912
2 0.4768 0.4769 0.4768 0.4768 0.4769 0.4772 0.4769 0.0001 0.0788
3 0.4773 0.4768 0.4769 0.4770 0.4769 0.4771 0.4770 0.0002 0.1108
4 0.4773 0.4768 0.4769 0.4768 0.4769 0.4768 0.4769 0.0002 0.1056
5 0.4778 0.4771 0.4769 0.4771 0.4771 0.4768 0.4771 0.0003 0.1986
.564MPa
1 0.5732 0.5783 0.5715 0.5715 0.5425 0.5758 0.5688 0.0132 6.6006
2 0.5541 0.5447 0.5194 0.5816 0.5047 0.5508 0.5426 0.0272 15.2409
3 0.5591 0.5857 0.5870 0.5718 0.5715 0.5441 0.5698 0.0163 7.8899
4 0.5756 0.5841 0.5818 0.5626 0.5571 0.5730 0.5724 0.0106 4.8354
5 0.5785 0.5548 0.5803 0.5762 0.5702 0.5457 0.5676 0.0142 6.3441
Table 2.3 Displacement accuracy using gap measurement.
Gap Measurement ( mm )
Well 1 Well 2 Well 3 Well 4 Well 5 Well 6 Max. Diff. Avg. Std. Dev.
Test 1 3.0556 3.1013 3.1090 3.1166 3.0353 3.0582 0.0813 3.0793 0.0338
Test 2 3.0353 3.0785 3.0861 3.0734 3.0048 3.0353 0.0813 3.0522 0.0320
Test 3 3.3934 3.4519 3.4468 3.4417 3.3655 3.3858 0.0864 3.4142 0.0370
Test 4 3.4036 3.4493 3.4671 3.4315 3.3782 3.4036 0.0889 3.4222 0.0331
Test 5 3.3985 3.4493 3.4544 3.4519 3.3731 3.4036 0.0813 3.4218 0.0345
Avg. Diff. 0.0838
39
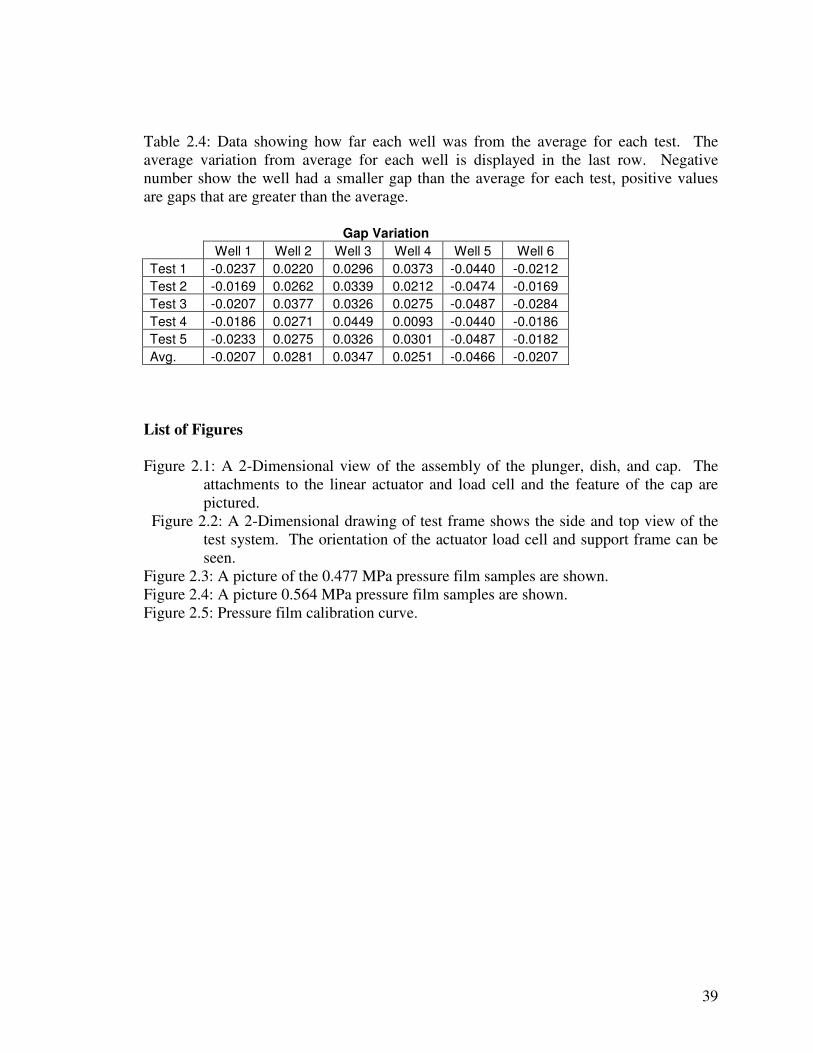
Table 2.4: Data showing how far each well was from the average for each test. The average variation from average for each well is displayed in the last row. Negative number show the well had a smaller gap than the average for each test, positive values are gaps that are greater than the average.
Gap Variation
Well 1 Well 2 Well 3 Well 4 Well 5 Well 6
Test 1 -0.0237 0.0220 0.0296 0.0373 -0.0440 -0.0212
Test 2 -0.0169 0.0262 0.0339 0.0212 -0.0474 -0.0169
Test 3 -0.0207 0.0377 0.0326 0.0275 -0.0487 -0.0284
Test 4 -0.0186 0.0271 0.0449 0.0093 -0.0440 -0.0186
Test 5 -0.0233 0.0275 0.0326 0.0301 -0.0487 -0.0182
Avg. -0.0207 0.0281 0.0347 0.0251 -0.0466 -0.0207
List of Figures
Figure 2.1: A 2-Dimensional view of the assembly of the plunger, dish, and cap. The attachments to the linear actuator and load cell and the feature of the cap are pictured.
Figure 2.2: A 2-Dimensional drawing of test frame shows the side and top view of the test system. The orientation of the actuator load cell and support frame can be seen.
Figure 2.3: A picture of the 0.477 MPa pressure film samples are shown. Figure 2.4: A picture 0.564 MPa pressure film samples are shown. Figure 2.5: Pressure film calibration curve.

40
Figure 2.1: Plunger/Dish/Cap assembly: The linear actuator is attached to the plunger using
a quick-disconnect pin. The dish is attached to the load cell in the same manner. The cap improves alignment of the plunger by utilizing a linear bearing.
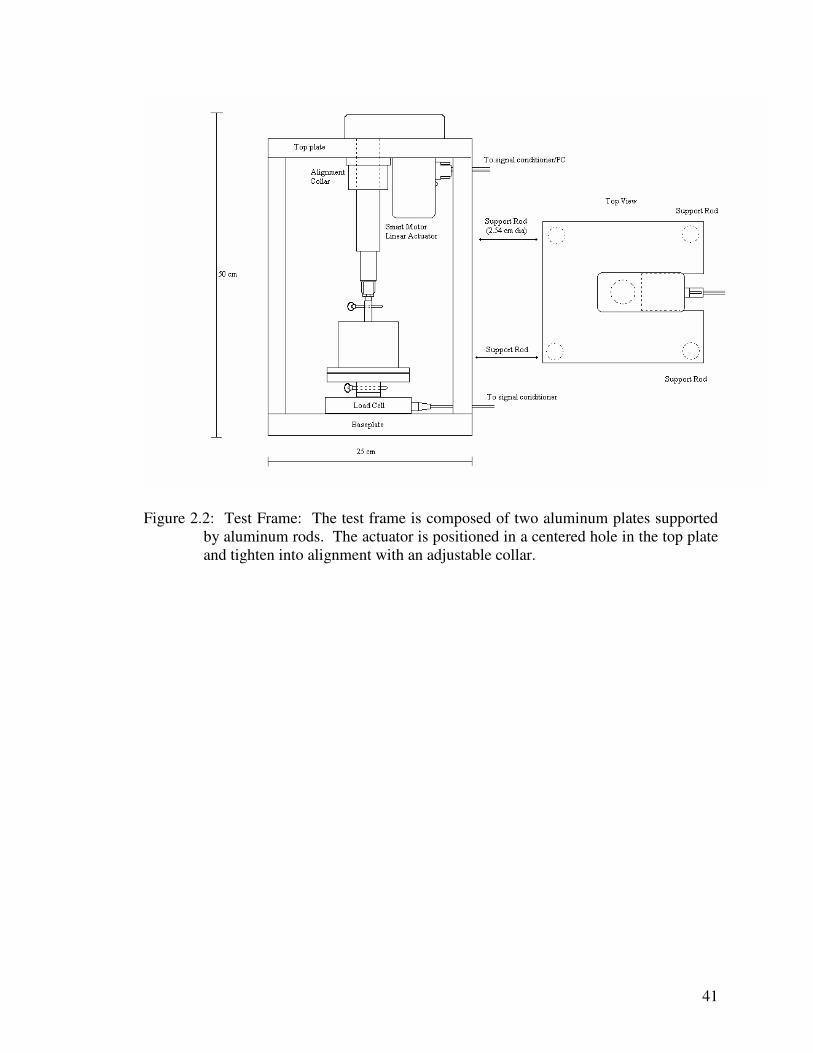
41
Figure 2.2: Test Frame: The test frame is composed of two aluminum plates supported
by aluminum rods. The actuator is positioned in a centered hole in the top plate and tighten into alignment with an adjustable collar.
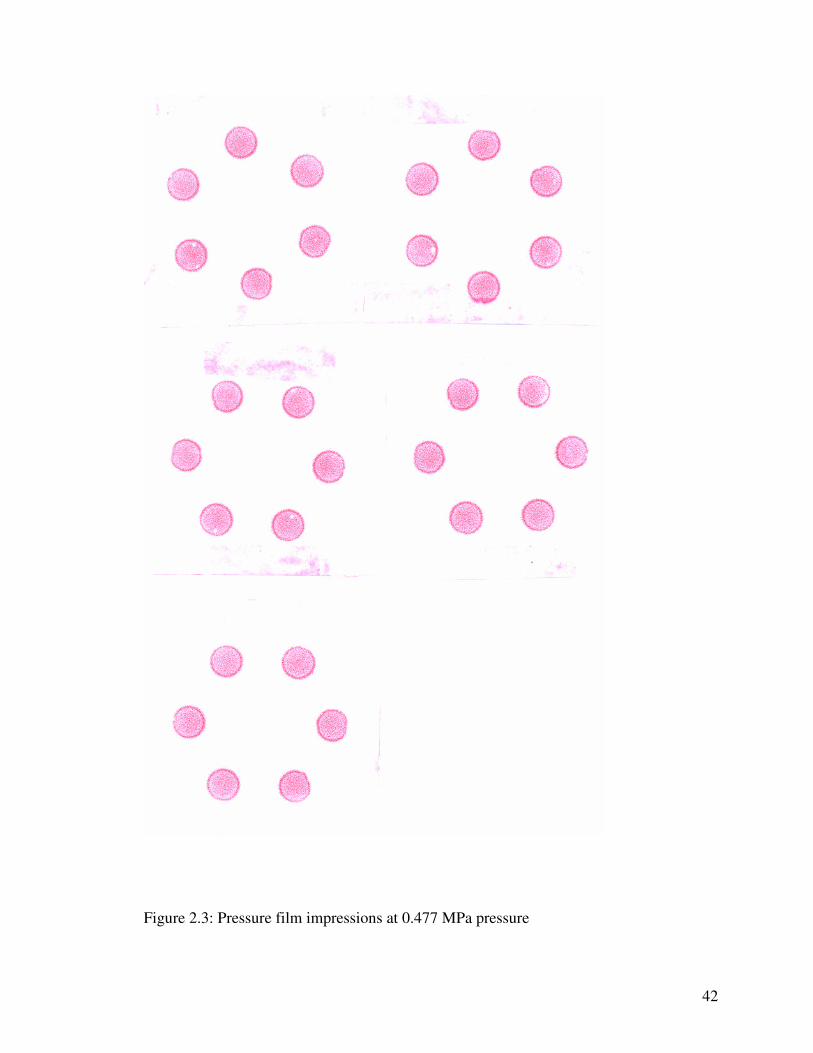
42
Figure 2.3: Pressure film impressions at 0.477 MPa pressure
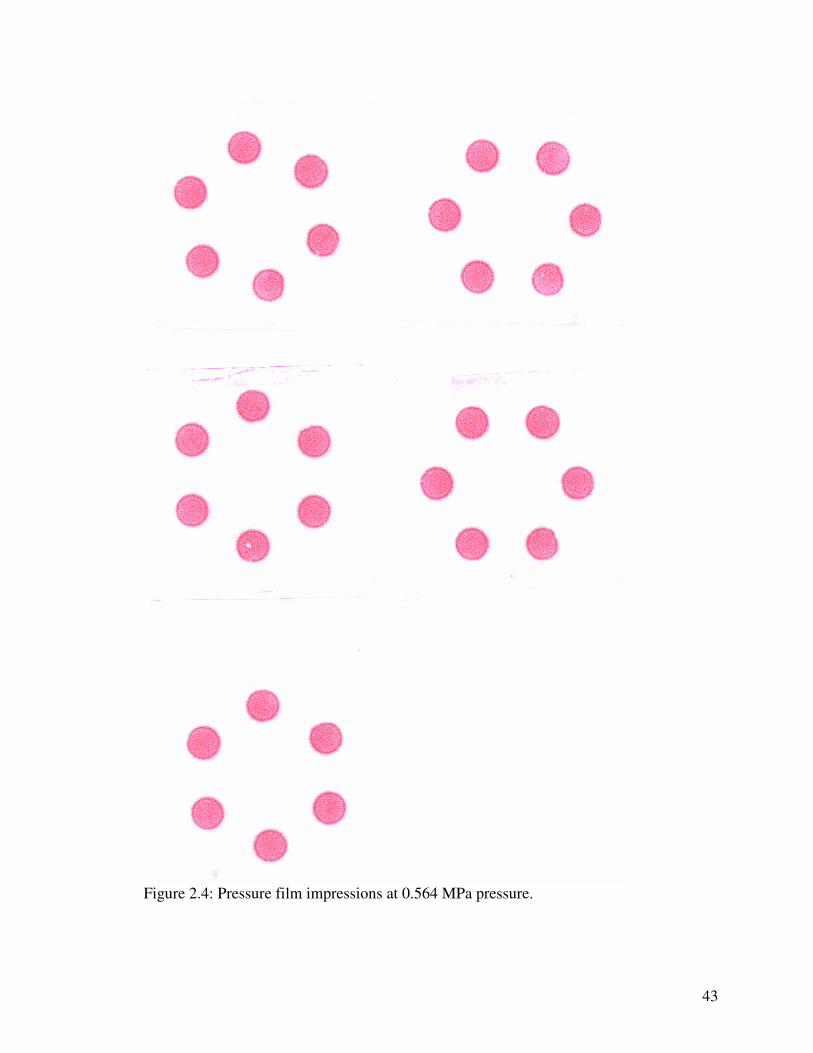
43
Figure 2.4: Pressure film impressions at 0.564 MPa pressure.
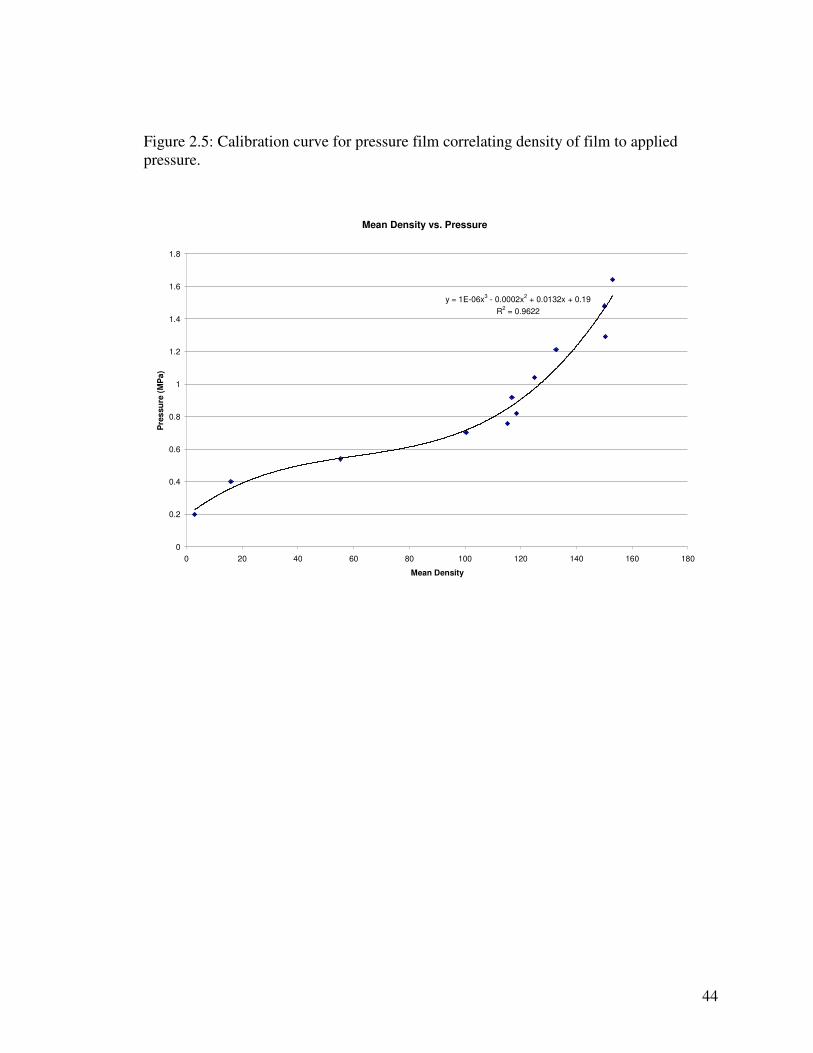
44
Figure 2.5: Calibration curve for pressure film correlating density of film to applied pressure.
Mean Density vs. Pressure
y = 1E-06x3 - 0.0002x
2 + 0.0132x + 0.19
R2 = 0.9622
0
0.2
0.4
0.6
0.8
1
1.2
1.4
1.6
1.8
0 20 40 60 80 100 120 140 160 180
Mean Density
Pre
ssu
re (
MP
a)
45
REFERENCES
1. Fink, C., et al., The effect of dynamic mechanical compression on nitric oxide
production in the meniscus. Osteoarthritis and Cartilage, 2001: p. 1-8. 2. Sah, R.L., et al., Biosynthetic response of cartilage explants to dynamic
compression. Journal of Orthopaedic Research, 1989. 7: p. 619-636. 3. Shin, S.J., et al., Regulation of matrix turnover in meniscal explants: role of
mechanical stress, interleukin-1, and nitric oxide. J Appl Physiol, 2003. 95(1): p. 308-13.
4. Upton, M.L., et al., Differential effects of static and dynamic compression on
meniscal cell gene expression. J Orthop Res, 2003. 21(6): p. 963-9. 5. van Griensven, M., et al., Cyclic mechanical strain induces NO production in
human patellar tendon fibroblasts--a possible role for remodelling and
pathological transformation. Exp Toxicol Pathol, 2003. 54(4): p. 335-8. 6. Grodzinsky, A.J., et al., Cartilage tissue remodeling in response to mechanical
forces. Annu Rev Biomed Eng, 2000. 2: p. 691-713. 7. Spilker, R.L., Donzelli, P.S., A biphasic finite element model of the meniscus for
stress-strain analysis, in Knee Meniscus;Basic and Clinical Foundations, V.C. Mow, Arnoczky, S.P., Jackson, D.W., Editor. 1992, Raven Press: New York.
8. Spilker, R.L., P.S. Donzelli, and V.C. Mow, A transversely isotropic biphasic
finite element model of the meniscus. Journal of Biomechanics, 1992. 25(9): p. 1027-45.
9. Zielinska, 3D Finite Element Model of Medial Meniscus Meniscectomy; Changes
in Contact Behavior. Journal of Biomechanical Engineering, 2005. 10. Frank, E.H., et al., A versatile shear and compression apparatus for mechanical
stimulation of tissue culture explants. J Biomech, 2000. 33(11): p. 1523-7.
46
CHAPTER THREE
NITRIC OXIDE PRODUCTION
Nitric Oxide Production by Menical Explants Following Dynamic Compression
Jeffrey A. McHenry and Tammy L. Haut Donahue
3.1 Abstract
This paper describes the dynamic compression of porcine meniscal explants using
a custom-built tissue compression bioreactor capable of various displacement and load
control testing. The goal was to better understand the relationship of mechanical stress to
nitric oxide production in the meniscus during physiological conditions and determine the
identity of nitric oxide producing cells. Cyclic compression testing was conducted on
6mm diameter explants, 5mm in height, at a frequency of 1 Hz. for two hours.
Compression magnitudes included 5%, 10%, 15%, 20% strain as well as 0.05 MPa and
0.1 MPa tests compared to a 0%strain/0MPa control representing an unloaded state.
These magnitudes were chosen to cover the range of stress and strain experienced in the
normal meniscus and to investigate how unloading and overload affects nitric oxide
production. Result from testing showed 5% and 10% strain produced less nitric oxide
than control samples in both the surface and deep zones of the explants. The 15 % strain
testing showed comparable results to control while the 20% strain testing produced the
greatest amount of nitric oxide in both zones. Statistical analysis showed a significant

47
quadratic relationship (p=0.000) for both zones and no significant difference between
means of surface and deep. Results from load control provided inconclusive data. These
findings suggest a complicated relationship between mechanical stress and nitric oxide
production. Physiological strain levels and durations may reduce nitric oxide produced
by meniscal fibrochondocytes.
3.2 Introduction
The menisci are specialized structures that are vital to normal function of the
knee. In addition to distributing load from the femoral condyles to the tibial plateau, the
meniscal attachments aid in maintaining knee joint stability and congruency. Meniscal
tissue is approximately 75% water. Fibrochondocytes maintain an extra-cellular matrix
containing proteoglycans and Type I collagen [1-11]. Mechanical stimuli are believed
to contribute to maintaining meniscal matrix metabolism, however it is yet unclear how
these signals are propagated [3, 10, 12-17, 19, 21, 22]. A better understanding of the
relationship between mechanical loading and biochemical response could aid in
understanding the poor healing characteristics of the meniscus and it role in the onset of
osteoarthritis (OA).
The meniscus has been shown to be a mechanically sensitive tissue with specific
loading conditions resulting in various biosynthetic responses. Unloading the meniscus
has been shown to result in a decrease in production of matrix molecules such as
aggrecan and collagen [12, 13]. Conversly, extended periods of dynamic compressive
stress (0.1 MPa, 0.5 Hz., 24hr) increase gene expression of cyclooxygenase (COX-2), and
48
inducible nitric oxide synthase (iNOS), causing an increase in mediators prostaglandin E2
(PGE2) and nitric oxide (NO), respectively[14-19].
NO is a gaseous free radical that acts as a messenger and is believed to regulate
matrix metabolism by inducing the release of proteoglycans from the matrix, decreasing
collagen production by fibrochondrocytes, and possibly causing cell apoptosis [16, 18,
20-22]. Since meniscal tissue produces NO spontaneously, baseline levels may be
responsible for balancing the remodeling process of fibrochondrocytes.
Previous studies employing 24 hours of cyclic compression at a load resulting in
10% strain have shown that increasing compressive strain in the meniscus leads to an up-
regulation of NO [14, 19]. In vivo, partial mensicectomy results in elevated strain levels
in the meniscus [23, 24], and has been shown to lead to osteoarthritis (OA). Portions of
the inner two thirds of the tissue is often removed, leaving the remaining tissue to carry
increased load. Strain increases from approximately 10% for an intact meniscus to up to
30% strain for a partial meniscectomy where 60% of the inside tissue is removed. This
increased strain may be partially responsible for the high level of NO found in the
osteoarthritic knee. Indeed, in vivo experimental osteoarthritis models, including partial
meniscectomy and ACL transection have been shown to result in increased NO liberation
in the meniscus [25, 21]. In addition, Kobayashi et al., 2001, showed that following a
partial medial meniscectomy in rabbits, there was a spatial variation in NO production
with the tissue adjacent to the location of the meniscectomy producing significantly more
NO than the peripheral meniscal tissue [25]. Similar spatial trends were seen with iNOS
expression [25].
49
The source of NO in the meniscus is fibrochondrocytes. However, these cells are
represented by two distinct populations separated by layer. The superficial layer is
composed of cells that appear and behave more like fibroblasts while the deep zones are
composed of cells that are more like chondrocytes. Fink, et al., 2001 showed that
following mechanical stimulation, the surface zone of the meniscus produced higher
levels of NO when compared to the deep zone. Recently, these same research group
added IL-1, a proinflammatory cytokine secreted by cells, to the media during
compression and found a synergistic increase in NO compared to compression alone [19].
However, in each of these studies, only one level of pressure was investigated.
Interestingly, in contrast to mechanical stimulation data, direct stimulation with a
chemical signal (IL-1), in the absence of mechanical loading, demonstrated increase NO
production in deep zone cells, compared to little or no production from the surface zone
[16].
Currently there is a lack of data relating short periods of physiological strain that
may result from walking or exercise to NO production. It is our goal to determine how
NO production changes through a range of compressive strain that covers physiological
levels seen in the intact meniscus and following meniscectomy for periods of normal
activity. Comparing these results to results with 0% strain will determine how activity
compares to inactivity in terms of NO production and therefore meniscal health. Another
goal is to show how strain relates to load during unconfined compression of meniscal
explants. Investigating meniscal compression using load and displacement control will
accomplish these goals as well as demonstrate the creep properties of meniscal explants.
50
These goals will be evaluated for the superior and deep zones to determine how each
unique population of fibrochodrocyte responds to compression.
3.3 Methods and Materials
Meniscus Samples
Meniscal samples were obtained from porcine knees typically harvested from 4-
month-old female pigs within 24 hours of death. Left and right knees from 12 animals
were dissected aseptically to retrieve the medial and lateral menisci. Six explants were
removed from each meniscus using a 6 mm diameter biopsy punch (FRAY Products
Corp, Buffalo, NY). Samples were cut parallel to the superior surface to maximize the
amount of superior tissue saved. The explants were then transferred to a microtome and
trimmed to achieve parallel top and bottom surfaces at a height of 5mm. To allow for full
recovery of the tissue, samples were then incubated for 48 hours in culture medium
(44.5% Dulbecco’s modified Eagle’s medium, 44.5% Ham’s F-12, 10% Fetal Bovine
Serium, and 1% penicillin/streptomycin) at 37°C with 5% CO2 and 95% air. The media
was changed after the first 24 hours of this 48-hour incubation.
Meniscal Compression
Explants were compressed for 2 hrs at 1 Hz to simulate physiological conditions
equivalent to two hours of walking. Tests were performed in a custom designed
bioreactor previously described [27]. Briefly, the system is capable of both load and
displacement control and utilizes a linear actuator (Ultramotion, Mattituck, NY) to
compress 6 explants simultaneously in unconfined compression. The system is contained
within a CO2 incubator at 37°C. Explants were centered in each well and covered with
51
400 µl of test medium (48.5% Dulbecco’s modified Eagle’s medium, 48.5% Ham’s F-12,
2% Fetal Bovine Serum, 1 % penicillin/streptomycin). The explants were transferred to
the bioreactor and preloaded using the weight (132.05 grams) of the plunger containing
the compression rod.
Displacement tests were run at 0% (n=8), 5% (n=6), 10% (n=6), 15% (n=6), and
20% (n=4) strain calculated from the original height of the meniscal explants. These
explants were taken from both the anterior portion of the medial and lateral menisci of
both the left and right knees. The range of strains was chosen to encompass strains above
and below physiological conditions experienced by an intact menicus. The tests ran at 1
Hz in a sinusoidal fashion, with time, position, and load recorded throughout the test
using system software (SmartMotor Interface).
Load control tests were run in a similar way, to 0.00 MPa (n=8), 0.05 MPa (n=3),
and 0.1 MPa (n=4) load levels. Higher loads levels were investigated on two sets of
samples (0.5 and 1.0 MPa), however tissue integrity was compromised at the end of the
two hour loading regime. Again, the weight of the plunger (132.05 grams) was used as
the preload and starting position. Samples were loaded at 1 Hz for two hours while time,
load, and position were recorded.
Upon completion, samples were removed from the dish and cut into superior and
deep zones. The wet weight of each half of the explant was determined prior to
incubation for 24 hrs in test media (48.5% Dulbecco’s modified Eagles medium, 48.5%
Ham’s F-12, 2% Fetal Bovine Serum, 1% penicillin/streptomycin). A preliminary study
that tested NO production following 15% strain with post incubation times of 24, 48, and
52
72 hours showed maximal expression at 24 hours. Following post-incubation the media
was immediately stored at -80°C until NO quantification.
NO Quantification
Nitric oxide was measured from each explant by using a total NO assay as
detailed by the manufacturer (Cayman Chemical, Ann Arbor, MI). The assay measured
the stable form of NO, nitrite and nitrate, by converting all nitrate to nitrite using the
Greiss reaction. The reaction produces a colored azo dye that absorbs light at 540 nm,
which can be read in a microplate reader. The resulting absorptivity was converted to
concentration using a standard curve created from known concentrations of nitrite. The
resulting concentrations were then normalized by the weight (grams) of each tissue
sample.
Statistical Analysis
Regression analysis was used to determine the relationship between strain level
and nitric oxide production. Data points with quadratic regression lines and 95%
confidence intervals were plotted. R-squared and P-values were used to determine the fit
of the regression. P<0.05 was considered significant. NO production from the
superficial and deep zones was compared, for a given load or strain level, using paired t-
tests.
3.4 Results
Meniscal Compression
Data collected from each test confirmed the bioreactor reached target compressive
displacement (± 0.001 mm) or load (± 0.01 MPa) during each cycle. Displacement
controlled tests showed a rapid drop in load within the first 1000 cycles with little change
53
following 4000 cycles (Figure 1). For displacement tests below 15 % strain, load settled
at or below 0.05 MPa while the 20% strain test remained above 0.1 MPa throughout the
duration of the test. The difference of load measured from start to finish can be seen in
Table 1A. Load controlled tests (Figure 2) showed a rapid increase in compressive
displacement within the first 1000 cycles. The 0.05 MPa load level reached maximum
displacement near 3000 cycles and remained at that level to the end of the tests. The 0.1
MPa tests reached 18% strain near 3000 cycles but steadily increased to 20.7% strain by
the final cycle. These differences in strain from start to finish of these tests can be seen
in Table 1B.
Pressure vs Time for Displacement Control Tests
y = 2.5527x-0.3505
R2 = 0.9018
y = 0.1784x-0.1927
R2 = 0.5113
0
0.1
0.2
0.3
0.4
0.5
0.6
0.7
0.8
0.9
1
0 1000 2000 3000 4000 5000 6000 7000 8000
Time (sec)
Pre
ssu
re (
MP
a) 15%
20%
10%
5%
Power (20%)
Power (5%)
Figure 3.1: Representative data of Pressure vs. Time displays the stress relaxation characteristics of
meniscal explants. Regression equations with R2 values are displayed for the 5% and 20% strain test. The
data shows significant relaxation within the first 1000 cycles of the 7200 cycle test. The test frequency was
1 Hz. for a duration of 2 hrs.
54
Percent Strain vs. Time For Load Control
(Animal 12)
y = 3.2441Ln(x) - 7.9143
R2 = 0.9781
y = 1.1771Ln(x) + 2.0485
R2 = 0.8419
0
5
10
15
20
25
30
0 1000 2000 3000 4000 5000 6000 7000 8000
Time (sec)
Str
ain
(%
) 0.1 Mpa
0.05 Mpa
Log. (0.1 Mpa)
Log. (0.05 Mpa)
Figure 3.2: Representative plot of load control tests displayed creep characteristics with the plot of
compressive Strain vs. Time. Regression equations and R2 values are displayed next to each data set.
These results show large increases in compressive displacement within the first 1000 cycles. At the end of
the test, the 0.1 MPa test required 0.4 mm more compression than the 0.05 MPa test.
Pressure (MPa)
Strain Start End
5% 0.166 ± 0.108 0.038 ± 0.010
10% 1.141 ± 0.103 0.046 ± 0.010
15% 2.185 ± 0.827 0.035 ± 0.026
20% 3.548 ± 0.429 0.128 ± 0.020 A B
Table 3.1: A: Average and standard deviation pressure at start and end of displacement control test at all
tested strain levels. B: Average of displacements at the start and end of load control test for both tested
load levels.
Strain (%)
Press. (MPa) Start End
0.05 2.6 ± 0.53 11.6 ± 1.36
0.10 3.0 ± 0.12 20.1 ± 1.45

55
Nitric Oxide Production
Nitric oxide (NO) production was not significantly influenced by location within
the explant. There was no significant difference between NO production of the superficial
and deep zones of the explants (0% p = 0.898, 5% p = 0.443, 10% p = 0.176, 15% p=
0.978, 20 % p = 0.351) using a paired t-test. However, a distinct trend did appear with
both displacement and load controlled tests. For displacement control, the 20% strain
level produced the greatest amount of NO with 15% being lower and comparable to the
0% strain (control) samples. The 5% strain produced the next lowest amount of NO
while the 10% strain level produced the least amount of NO out of all strain levels. The
relationship of NO production to strain level fits the quadratic model NO
Production=225.5 –30.66*Strain Level +1.972*Strain Level2 for the superficial zone
with R2=0.435(Figure 3). The quadratic term was significant (p = 0.000) as well as the
constant (p = 0.001), while the linear term was not found to be significant (p = 0.100).
The deep zone showed a similar trend with 10% strain producing the least NO. The
quadratic NO=234.6 –19.4*Strain Level+1.158*Strain Level2 fit the data with R2=.213
(Figure 4). The quadratic term was statistically significant (p = 0.016) as well as the
constant (p = 0.000), while the linear term was not significant (p = 0.459).
56
Strain Level (%)
NO Production (uM/g)
20151050
800
700
600
500
400
300
200
100
0
Regression
95% CI
NO Production by Superficial zone with Displacement ControlNO Production = 225.5 - 30.66 Strain Level
+ 1.972 Strain Level**2
P = 0.000
R-Sq = 43.5%
Figure 3.3: Displacement control graph showing quadratic fit to NO produced by superficial zone of
explants with 95% confidence interval displayed. R2=0.435. For 0%: n=8; 5%: n=6; 10%: n=6; 15%: n=6;
20%: n=4.
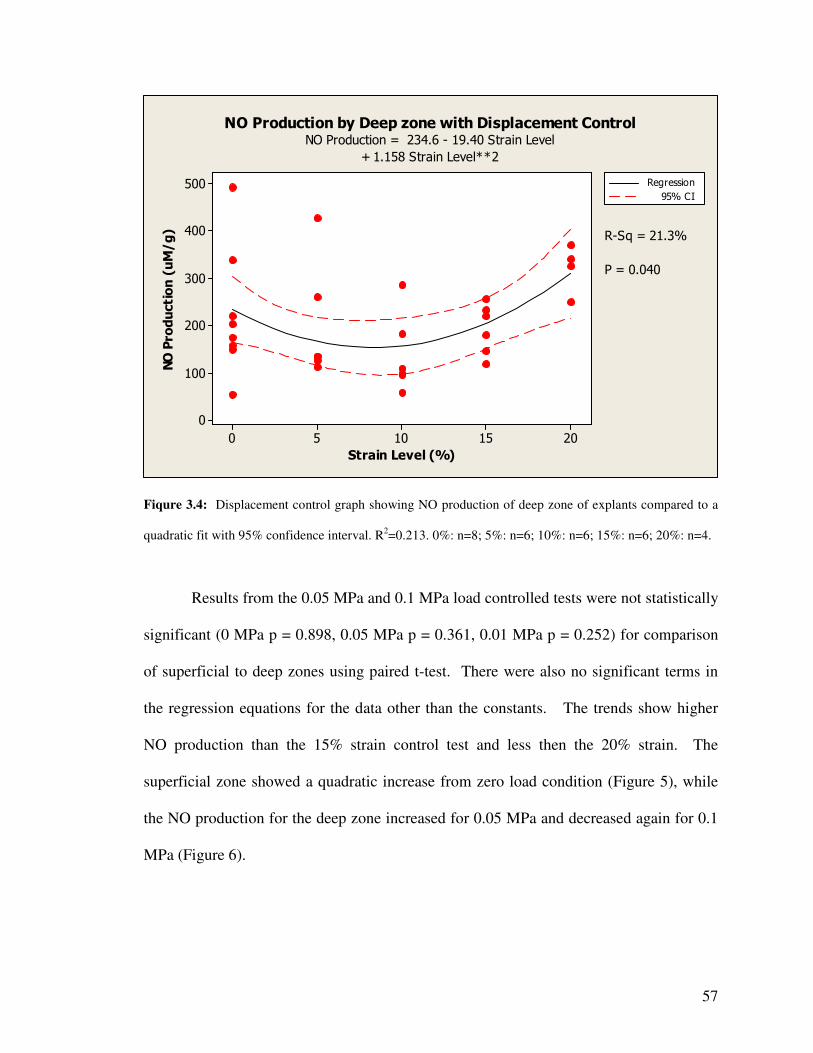
57
Strain Level (%)
NO Production (uM/g)
20151050
500
400
300
200
100
0
Regression
95% CI
NO Production by Deep zone with Displacement ControlNO Production = 234.6 - 19.40 Strain Level
+ 1.158 Strain Level**2
P = 0.040
R-Sq = 21.3%
Fiqure 3.4: Displacement control graph showing NO production of deep zone of explants compared to a
quadratic fit with 95% confidence interval. R2=0.213. 0%: n=8; 5%: n=6; 10%: n=6; 15%: n=6; 20%: n=4.
Results from the 0.05 MPa and 0.1 MPa load controlled tests were not statistically
significant (0 MPa p = 0.898, 0.05 MPa p = 0.361, 0.01 MPa p = 0.252) for comparison
of superficial to deep zones using paired t-test. There were also no significant terms in
the regression equations for the data other than the constants. The trends show higher
NO production than the 15% strain control test and less then the 20% strain. The
superficial zone showed a quadratic increase from zero load condition (Figure 5), while
the NO production for the deep zone increased for 0.05 MPa and decreased again for 0.1
MPa (Figure 6).
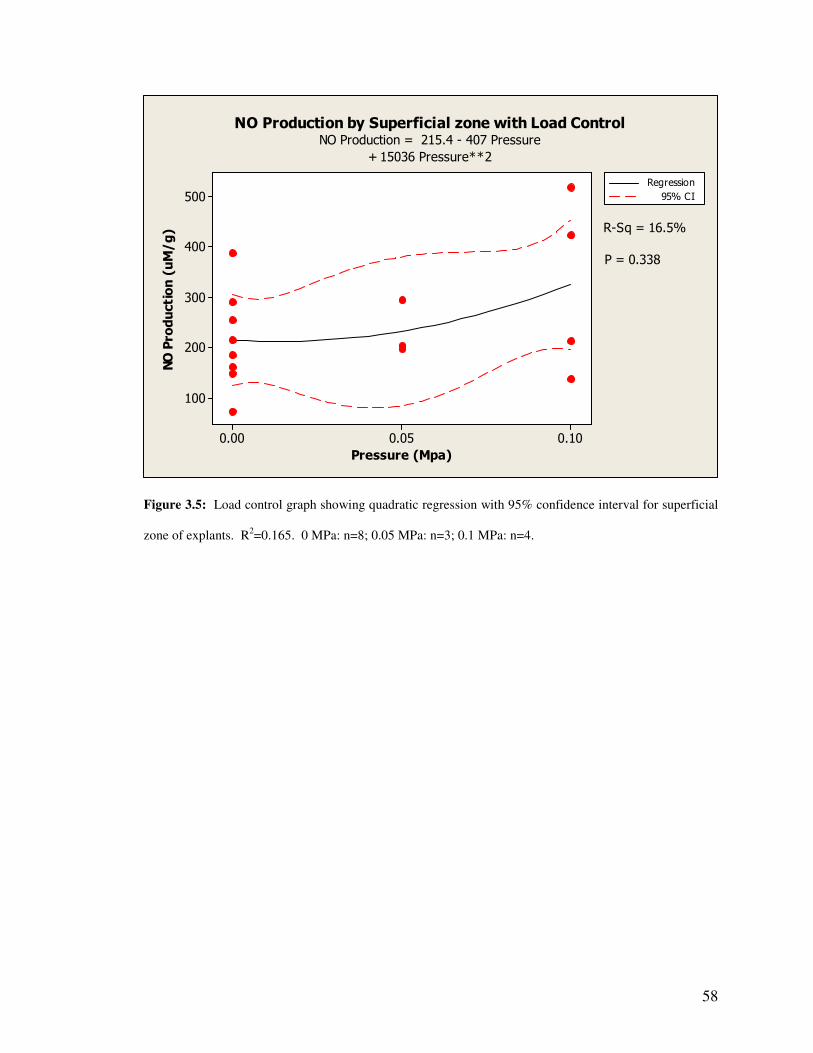
58
Pressure (Mpa)
NO Production (uM/g)
0.100.050.00
500
400
300
200
100
Regression
95% CI
NO Production by Superficial zone with Load ControlNO Production = 215.4 - 407 Pressure
+ 15036 Pressure**2
R-Sq = 16.5%
P = 0.338
Figure 3.5: Load control graph showing quadratic regression with 95% confidence interval for superficial
zone of explants. R2=0.165. 0 MPa: n=8; 0.05 MPa: n=3; 0.1 MPa: n=4.
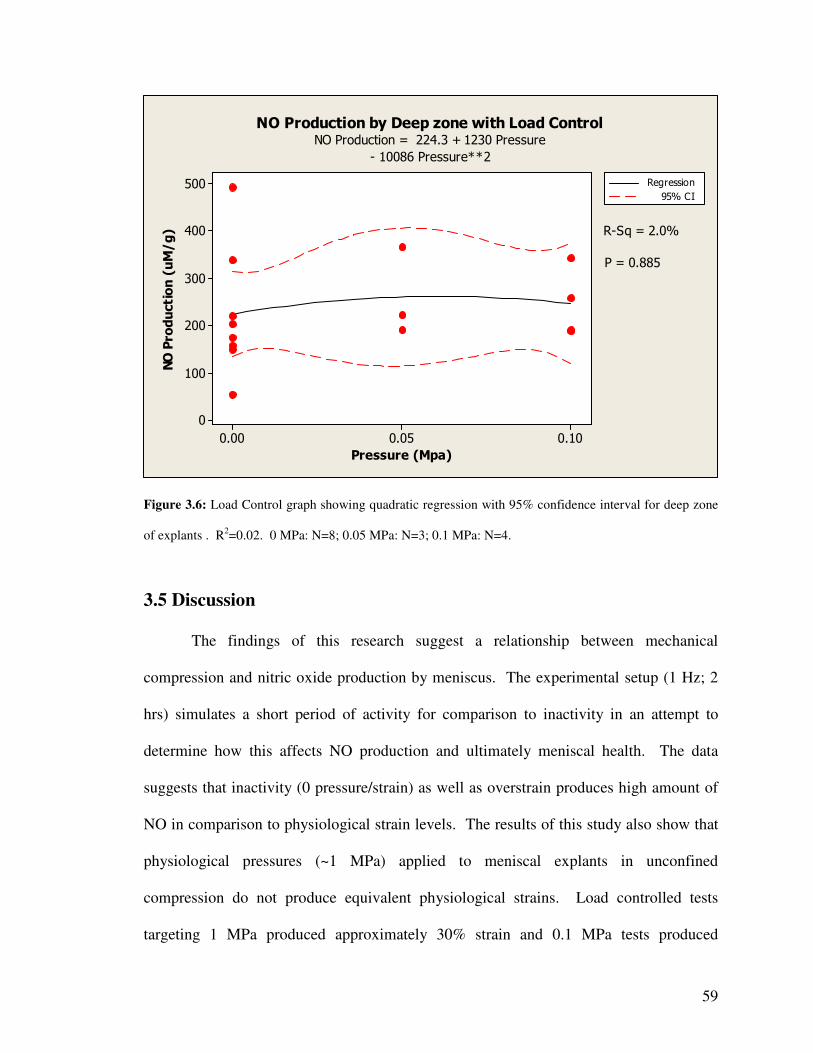
59
Pressure (Mpa)
NO Production (uM/g)
0.100.050.00
500
400
300
200
100
0
Regression
95% CI
NO Production by Deep zone with Load ControlNO Production = 224.3 + 1230 Pressure
- 10086 Pressure**2
R-Sq = 2.0%
P = 0.885
Figure 3.6: Load Control graph showing quadratic regression with 95% confidence interval for deep zone
of explants . R2=0.02. 0 MPa: N=8; 0.05 MPa: N=3; 0.1 MPa: N=4.
3.5 Discussion
The findings of this research suggest a relationship between mechanical
compression and nitric oxide production by meniscus. The experimental setup (1 Hz; 2
hrs) simulates a short period of activity for comparison to inactivity in an attempt to
determine how this affects NO production and ultimately meniscal health. The data
suggests that inactivity (0 pressure/strain) as well as overstrain produces high amount of
NO in comparison to physiological strain levels. The results of this study also show that
physiological pressures (~1 MPa) applied to meniscal explants in unconfined
compression do not produce equivalent physiological strains. Load controlled tests
targeting 1 MPa produced approximately 30% strain and 0.1 MPa tests produced
60
approximately 20 % strain. It requires much lower pressure (<0.05 MPa) to achieve
physiological strain (5-10%) during unconfined compression. The data also suggests that
NO production is not dependent on location within each explant. Nitric oxide is linked to
inflammation and tissue degradation in articular cartilage and meniscus and is believed to
be a direct result of compression [14, 19]. Previous studies have reported that dynamic
compression of meniscal explants results in an up-regulation of NO [14, 19]. However,
these experiments were performed for an extended period of time and at only one strain
level, which would not be considered normal activity. Some studies have also reported
that meniscal explants produce NO spontaneously without compression [14, 16, 19, 21,
25, 26]. The results from our study also show that NO is produced spontaneously but do
not support the simple relationship that compression up-regulates NO production in the
meniscus. Our data suggest that physiological strain levels for short periods of time that
could be considered normal activity actually decreases NO production in the meniscus.
The data also shows that overstrain, as experienced by meniscectomized tissue, up-
regulates NO above both the zero load/strain condition and physiological levels of strain.
These findings challenge the conclusion of others that dynamic compression
increases NO production [14, 19]. The 5% and 10% strain levels are physiological and
appear to reduce NO production by meniscal explants compared to 0% strain. If this is in
fact the case for the meniscus, moderate levels of NO may be required for maintenance of
normal, healthy tissue. NO is typically linked to tissue degradation, but its role in matrix
metabolism is not completely understood. It is possible that NO modulates matrix
resorbtion to allow for the addition of newly remodeled matrix constituents by

61
fibrochondrocytes. If this were the case, excessive NO production would lead to an
unbalance of matrix metabolism in favor of resorbtion and result in tissue degradation.
Differences in response of superficial and deep zone to compression were not
demonstrated in this study. Previous studies showed that fibroblastic cells produced
higher NO levels than the deep chondrocytic cells [14, 19]. In this study, the trends
produced by both regions were similar. Further investigation is required to reconcile
differences between this investigation and previous.
There were several limitations to this study that prevent further defining the
relationship between compression and NO production. These tests were performed using
unconfined compression, which may not be physiological. The results show that
physiological strain produces sub-physiological stresses experienced in the meniscus
throughout the test. This may be caused by excessive fluid flow out of the explant due to
its unconfined treatment. To date, only 6 animals have been used for each level of strain
(n=8 for control, 0% and n=4 for 20%) and only 3 animals for load levels.
Recommedations
Meniscal location (lateral or medial) and explant location from anterior to
posterior are other factors that may respond differently to compression. Other
compressions studies using confined compression would be beneficial in determining
how compression affects NO production. However, to completely understand the
mechanism of NO production and its role in matrix metabolism, chemical factors must be
investigated along with mechanical factors. One chemical factor of particular interest is
interleukin-1 (IL-1) for its apparent link to NO. IL-1 is a proinflammatory cytokine that
is believed to induce NO production. Blocking this cytokine during compression may
62
reduce NO production during physiological strain for normal activity periods. Such a
result could change treatment of meniscal lesions and improve tissue healing. In order to
create the best healing response by the meniscus, chemical as well as mechanical
treatment may be required. Understanding this mechanism is crucial to improving
medical treatment to common meniscal injury.
Acknowledgement
The authors are grateful to the Whitaker foundation for their financial support.
63
REFERENCES
1. Aagaard, H. and R. Verdonk, Function of the normal meniscus and consequences
of meniscal resection. Scand J Med Sci Sports, 1999. 9(3): p. 134-40. 2. Ahluwalia, S., et al., Distribution of smooth muscle actin-containing cells in the
human meniscus. J Orthop Res, 2001. 19(4): p. 659-64. 3. Collier, S. and P. Ghosh, Effects of transforming growth factor beta on
proteoglycan synthesis by cell and explant cultures derived from the knee joint
meniscus. Osteoarthritis Cartilage, 1995. 3(2): p. 127-38. 4. Gershuni, D.H., A.R. Hargens, and L.A. Danzig, Regional nutrition and
cellularity of the meniscus. Implications for tear and repair. Sports Med, 1988. 5(5): p. 322-7.
5. Ghadially, F.N., J.M. Lalonde, and J.H. Wedge, Ultrastructure of normal and
torn menisci of the human knee joint. J Anat, 1983. 136 (Pt 4): p. 773-91. 6. Peters, T.J. and I.S. Smillie, Studies on the chemical composition of the menisci of
the knee joint with special reference to the horizontal cleavage lesion. Clin Orthop, 1972. 86: p. 245-52.
7. Roughley, P.J., et al., The presence of a cartilage-like proteoglycan in the adult
human meniscus. Biochem J, 1981. 197(1): p. 77-83. 8. Roughley, P.J. and R.J. White, The dermatan sulfate proteoglycans of the adult
human meniscus. J Orthop Res, 1992. 10(5): p. 631-7. 9. Tanaka, T., K. Fujii, and Y. Kumagae, Comparison of biochemical characteristics
of cultured fibrochondrocytes isolated from the inner and outer regions of human
meniscus. Knee Surg Sports Traumatol Arthrosc, 1999. 7(2): p. 75-80. 10. Leslie, B.W., et al., Anisotropic response of the human knee joint meniscus to
unconfined compression. Proc Inst Mech Eng [H], 2000. 214(6): p. 631-5. 11. Proctor, C.S., Schmidt, M.B., Whipple, R.R., Kelly, M.A., Mow, V.C., Material
Properties of the normal medial bovine meniscus. Journal of Orthopaedic Research, 1989. 7(6): p. 771-782.
12. Djurasovic, M., et al., Knee joint immobilization decreases aggrecan gene
expression in the meniscus. Am J Sports Med, 1998. 26(3): p. 460-6. 13. Dowdy, P.A., et al., The effect of cast immobilization on meniscal healing. An
experimental study in the dog. Am J Sports Med, 1995. 23(6): p. 721-8. 14. Fink, C., et al., The effect of dynamic mechanical compression on nitric oxide
production in the meniscus. Osteoarthritis and Cartilage, 2001: p. 1-8. 15. LeGrand, A., et al., Interleukin-1, tumor necrosis factor alpha, and interleukin-17
synergistically up-regulate nitric oxide and prostaglandin E2 production in
explants of human osteoarthritic knee menisci. Arthritis Rheum, 2001. 44(9): p. 2078-83.
16. Cao, M., et al., Generation of nitric oxide by lapine meniscal cells and its effect
on matrix metabolism: stimulation of collagen production by arginine. J Orthop Res, 1998. 16(1): p. 104-11.
17. Maneiro, E., et al., Aceclofenac increases the synthesis of interleukin 1 receptor
antagonist and decreases the production of nitric oxide in human articular
chondrocytes. J Rheumatol, 2001. 28(12): p. 2692-9.

64
18. Murrell, G.A., et al., Nitric oxide: an important articular free radical. J Bone Joint Surg Am, 1996. 78(2): p. 265-74.
19. Shin, S.J., et al., Regulation of matrix turnover in meniscal explants: role of
mechanical stress, interleukin-1, and nitric oxide. J Appl Physiol, 2003. 95(1): p. 308-13.
20. Taskiran, D., et al., Nitric oxide mediates suppression of cartilage proteoglycan
synthesis by interleukin-1. Biochem Biophys Res Commun, 1994. 200(1): p. 142-8.
21. Hashimoto, S., et al., Nitric oxide production and apoptosis in cells of the
meniscus during experimental osteoarthritis. Arthritis Rheum, 1999. 42(10): p. 2123-31.
22. Upton, M.L., et al., Differential effects of static and dynamic compression on
meniscal cell gene expression. J Orthop Res, 2003. 21(6): p. 963-9. 23. Zielinska, 3D Finite Element Model of Medial Meniscus Meniscectomy; Changes
in Contact Behavior. Journal of Biomechanical Engineering, 2005. 24. Spilker, R.L., Donzelli, P.S., A biphasic finite element model of the meniscus for
stress-strain analysis, in Knee Meniscus;Basic and Clinical Foundations, V.C. Mow, Arnoczky, S.P., Jackson, D.W., Editor. 1992, Raven Press: New York.
25. Kobayashi, K., et al., Chondrocyte apoptosis and regional differential expression
of nitric oxide in the medial meniscus following partial meniscectomy. Journal of Orthopaedic Research, 2001. 19: p. 802-808.
26. Kobayashi, K., et al., The suppressive effect of hyaluronan on nitric oxide
production and cell apoptosis in the central region of meniscus following partial
meniscectomy. Iowa Orthop J, 2002. 22: p. 39-41. 27. McHenry, J., et al., Nitric Oxide Production of Meniscal Explants Following
Dynamic Compression. Thesis 2005: Ch. 2, p. 25-45.

65
APPENDIX A
SUPPLEMENTARY INFORMATION ON CHAPTER 2 (VALIDATION OF BIOREACTOR)
66
A.1 Description of Bioreactor Components and Features
The bioreactor used in these experiments is a specially design unit with a unique
combination of components. The system is set in a dimensionally critical frame that able
to fit in an incubator. The device utilizes a Smartmotor 1720. This is a belt driven linear
actuator made by Ultramotion. It is capable of thrusting to 500 lbs with bidirectional
repeatability of 0.0003 in and a unidirectional repeatability of 0.0001 in. at a maximum
speed of 20 in/sec. Attached to the actuator are the compression surfaces contained by an
aluminum cap with a linear bearing. The plunger is attached to the actuator while an
aluminum dish is attached to a load cell from interface (Figure A.1). The load cell used
was a 300 lb capacity load cell to increase accuracy and resolution above a previously
used 2000lb capacity load cell with similar dimensions. The signal from the force
transducer connects directly to a 2100 series signal condition and amplifier (Vishay).
This unit allow for easy adjustment of signal balancing and amplification. That
conditioned signal connects directly to the actuator to provide a continuous load reading
(Figure A.2). The connection supplies a voltage to the input pins, which is read through
the Smartmotor as an analog signal that is converted to an encoder count. The actuator is
then connected to the PC which uses an Animatics control system and Smartmotor (SMI)
interface.

67
Figure A.1: The dish and load cell assembly Figure A.2: The amplified load cell signal connection to
of the bioreactor. the SmartMotor actuator (white cable) to input pins.
The system stands 50 cm tall and 25 cm in length and width allowing it to be
contained in an incubator (Figure A.3). The 1-inch thick aluminum plates (Al 6061) at
the top and bottom of the bioreactor are supported by 1-inch aluminum rods. The plunger
is also made of aluminum and has six Teflon-filled Delrin compression rods 8mm in
diameter. The dish is also machined out of aluminum allowing the compression surface
assembly (plunger and dish) to be sterilized by alcohol or autoclave.
Figure A.3: The bioreactor frame allows the system to fit in an incubator and contains many components
that can be sterilized.

68
A.2 Validation of Even Well Pressure
Validation of the bioreactor required collecting evidence that the system
compressed all six explants to the same pressures and strains. The first method involved
placing pressure film between the surfaces used for compression. To do this, the pressure
film was calibrated in the Instron materials testing machine to pressures from below to
above the pressure range of the film (Figure A.4, Table A.1). Also several samples were
loaded to the same pressure to determine the repeatability of the film (Figure A.5, Table
A.2). Next, the dish was measured using micrometers to make sure the top surface, the
bottom of the well, and the compression rod surfaces were all parallel. A 3/8 in thick
uniform machined circular piece of steel was added onto the top of the dish. At this point
a uniform piece of rubber was placed on top of that followed by the pressure film. The
plunger was then pressed into the pressure film to a specific displacement. That was
repeated five times at two different displacements. These were then compared to the
calibration done on the Instron using Scion image to determine the pressure differences
between wells.
A second technique was used to collect a physical measurement of the gap
between the bottom of each compression rod and the bottom of each well. To do this,
each well was filled with auto body filler and the plunger was quickly lowered into the
aluminum dish until body filler surrounded each compression rod. The actuator remained
at this position until the body filler hardened to a rigid body. The assembly was removed,
at which point the body filler was measured using a micrometer; this was repeated five
times. It was also necessary to verify the load program was reading accurately the load it
was recording on the computer. This was done first by calibration of the load cell by
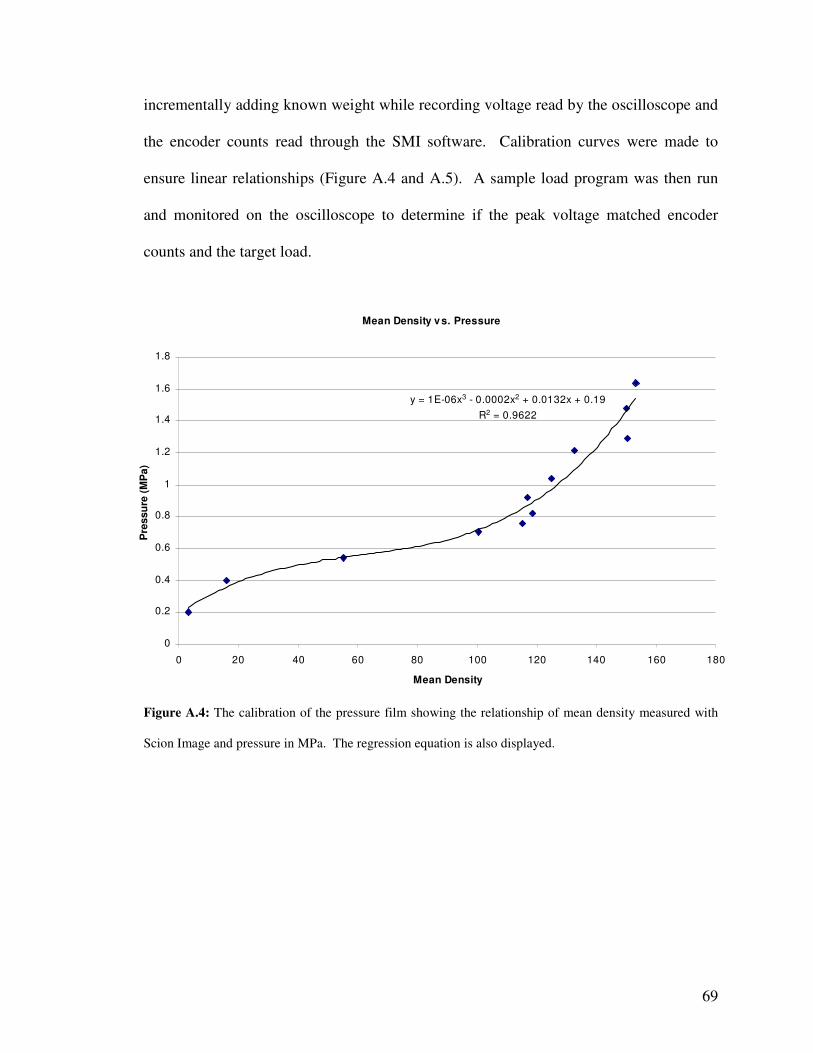
69
incrementally adding known weight while recording voltage read by the oscilloscope and
the encoder counts read through the SMI software. Calibration curves were made to
ensure linear relationships (Figure A.4 and A.5). A sample load program was then run
and monitored on the oscilloscope to determine if the peak voltage matched encoder
counts and the target load.
Figure A.4: The calibration of the pressure film showing the relationship of mean density measured with
Scion Image and pressure in MPa. The regression equation is also displayed.
Mean Density vs. Pressure
y = 1E-06x3 - 0.0002x2 + 0.0132x + 0.19
R2 = 0.9622
0
0.2
0.4
0.6
0.8
1
1.2
1.4
1.6
1.8
0 20 40 60 80 100 120 140 160 180
Mean Density
Pre
ssu
re (
MP
a)
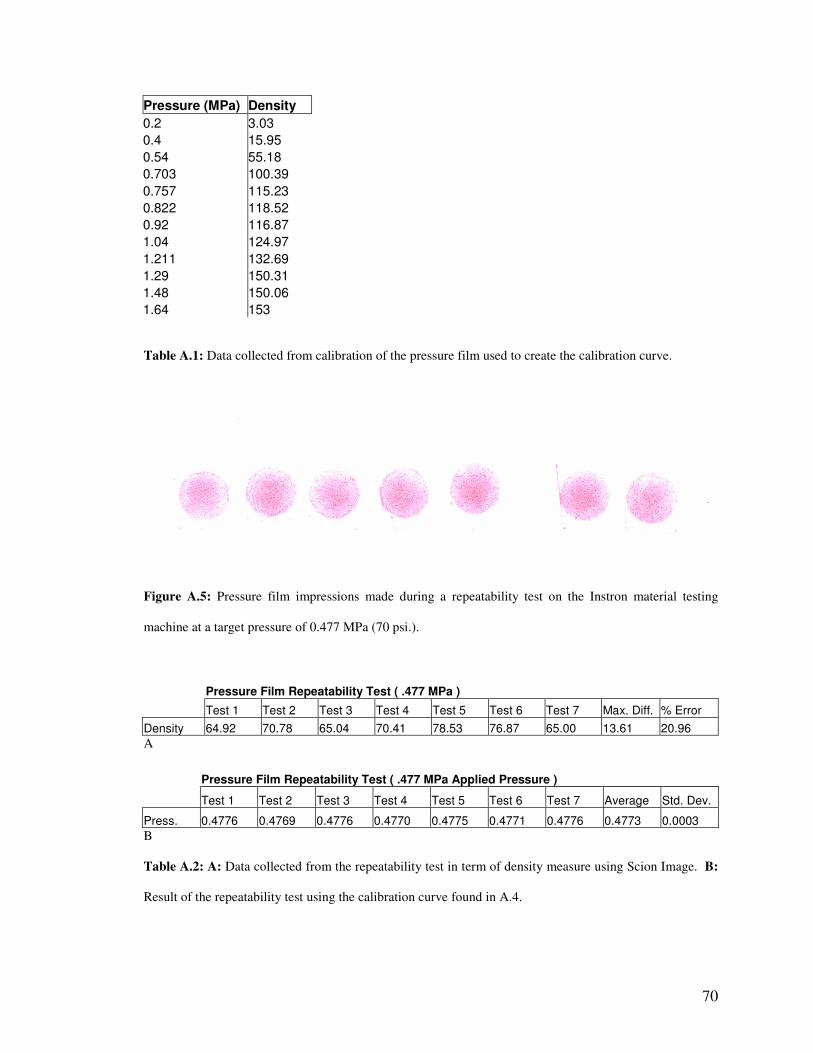
70
Pressure (MPa) Density
0.2 3.03
0.4 15.95
0.54 55.18
0.703 100.39
0.757 115.23
0.822 118.52
0.92 116.87
1.04 124.97
1.211 132.69
1.29 150.31
1.48 150.06
1.64 153
Table A.1: Data collected from calibration of the pressure film used to create the calibration curve.
Figure A.5: Pressure film impressions made during a repeatability test on the Instron material testing
machine at a target pressure of 0.477 MPa (70 psi.).
Pressure Film Repeatability Test ( .477 MPa )
Test 1 Test 2 Test 3 Test 4 Test 5 Test 6 Test 7 Max. Diff. % Error
Density 64.92 70.78 65.04 70.41 78.53 76.87 65.00 13.61 20.96
A
Pressure Film Repeatability Test ( .477 MPa Applied Pressure )
Test 1 Test 2 Test 3 Test 4 Test 5 Test 6 Test 7 Average Std. Dev.
Press. 0.4776 0.4769 0.4776 0.4770 0.4775 0.4771 0.4776 0.4773 0.0003
B
Table A.2: A: Data collected from the repeatability test in term of density measure using Scion Image. B:
Result of the repeatability test using the calibration curve found in A.4.
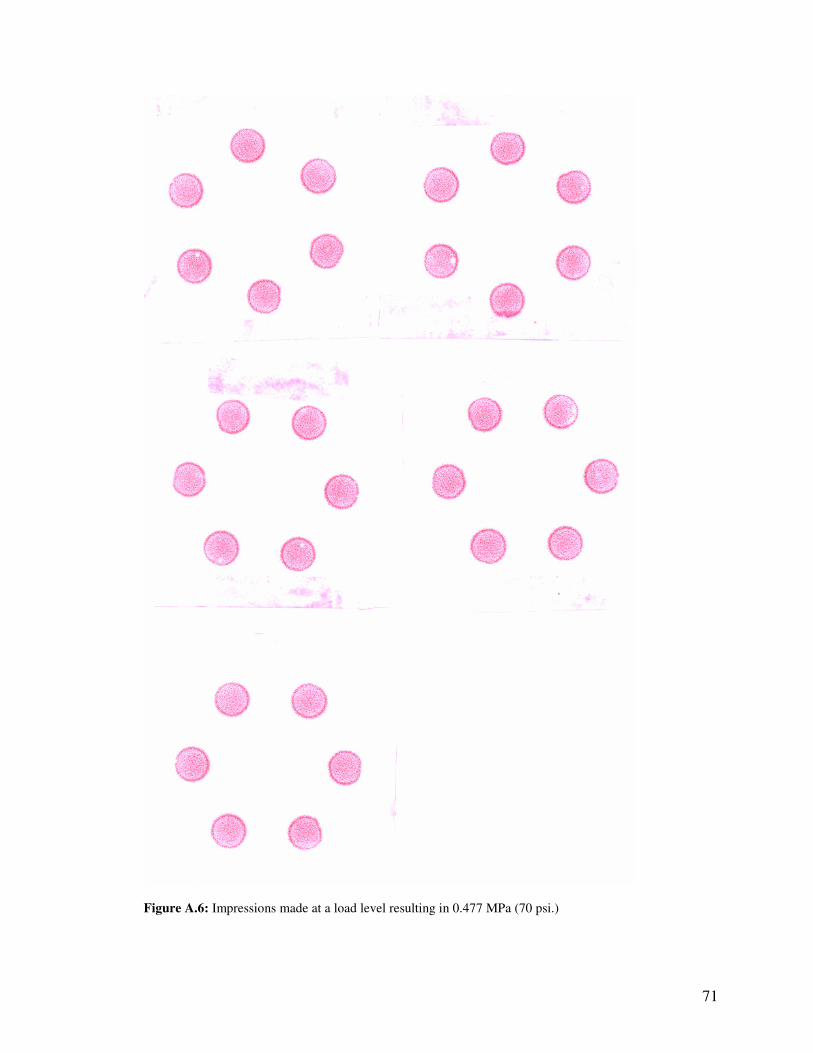
71
Figure A.6: Impressions made at a load level resulting in 0.477 MPa (70 psi.)
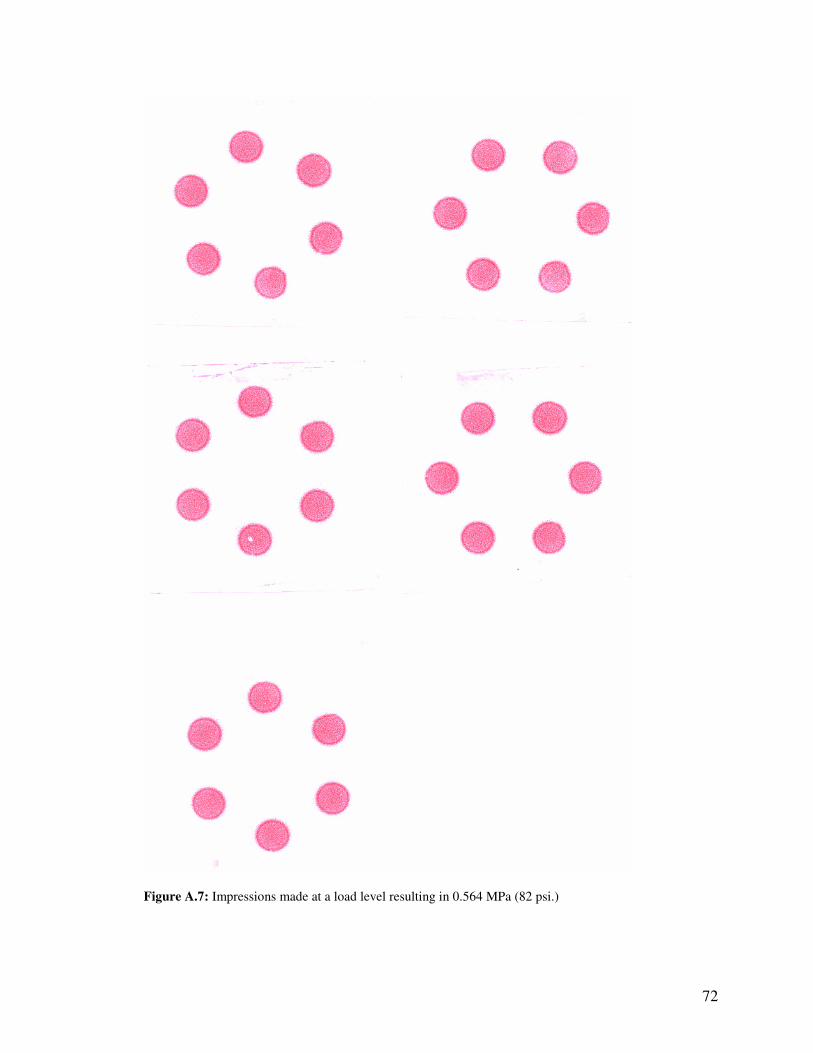
72
Figure A.7: Impressions made at a load level resulting in 0.564 MPa (82 psi.)
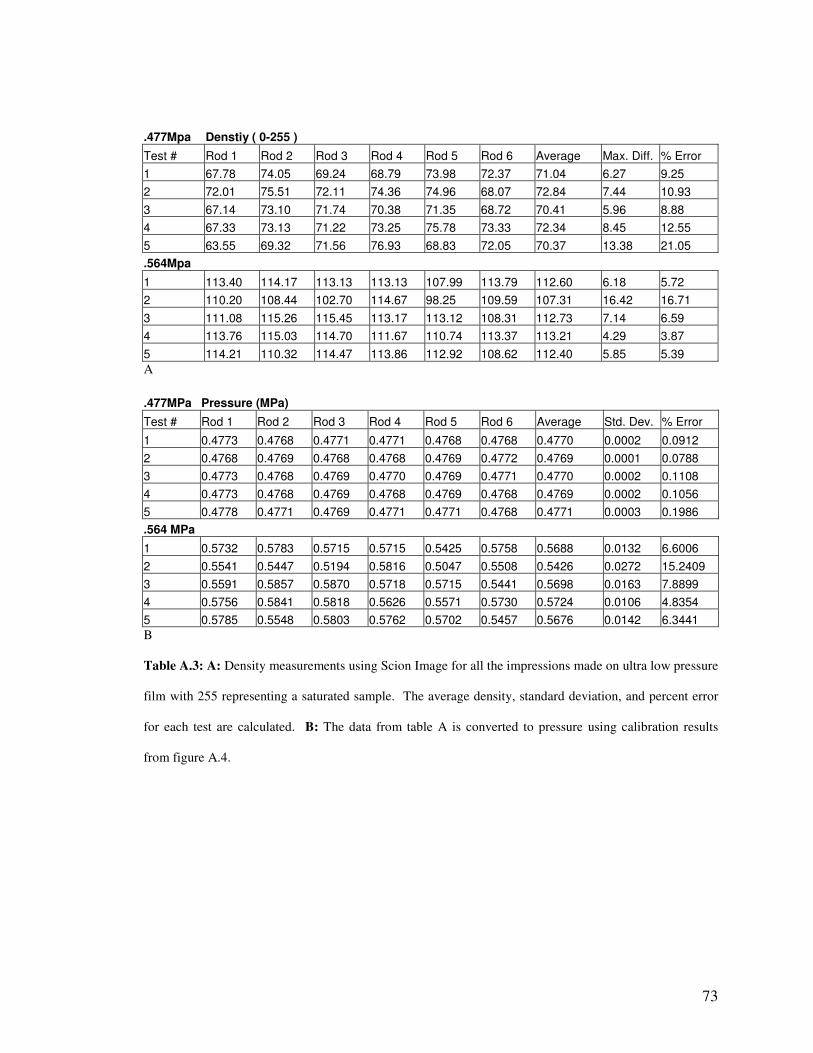
73
.477Mpa Denstiy ( 0-255 )
Test # Rod 1 Rod 2 Rod 3 Rod 4 Rod 5 Rod 6 Average Max. Diff. % Error
1 67.78 74.05 69.24 68.79 73.98 72.37 71.04 6.27 9.25
2 72.01 75.51 72.11 74.36 74.96 68.07 72.84 7.44 10.93
3 67.14 73.10 71.74 70.38 71.35 68.72 70.41 5.96 8.88
4 67.33 73.13 71.22 73.25 75.78 73.33 72.34 8.45 12.55
5 63.55 69.32 71.56 76.93 68.83 72.05 70.37 13.38 21.05
.564Mpa
1 113.40 114.17 113.13 113.13 107.99 113.79 112.60 6.18 5.72
2 110.20 108.44 102.70 114.67 98.25 109.59 107.31 16.42 16.71
3 111.08 115.26 115.45 113.17 113.12 108.31 112.73 7.14 6.59
4 113.76 115.03 114.70 111.67 110.74 113.37 113.21 4.29 3.87
5 114.21 110.32 114.47 113.86 112.92 108.62 112.40 5.85 5.39
A
.477MPa Pressure (MPa)
Test # Rod 1 Rod 2 Rod 3 Rod 4 Rod 5 Rod 6 Average Std. Dev. % Error
1 0.4773 0.4768 0.4771 0.4771 0.4768 0.4768 0.4770 0.0002 0.0912
2 0.4768 0.4769 0.4768 0.4768 0.4769 0.4772 0.4769 0.0001 0.0788
3 0.4773 0.4768 0.4769 0.4770 0.4769 0.4771 0.4770 0.0002 0.1108
4 0.4773 0.4768 0.4769 0.4768 0.4769 0.4768 0.4769 0.0002 0.1056
5 0.4778 0.4771 0.4769 0.4771 0.4771 0.4768 0.4771 0.0003 0.1986
.564 MPa
1 0.5732 0.5783 0.5715 0.5715 0.5425 0.5758 0.5688 0.0132 6.6006
2 0.5541 0.5447 0.5194 0.5816 0.5047 0.5508 0.5426 0.0272 15.2409
3 0.5591 0.5857 0.5870 0.5718 0.5715 0.5441 0.5698 0.0163 7.8899
4 0.5756 0.5841 0.5818 0.5626 0.5571 0.5730 0.5724 0.0106 4.8354
5 0.5785 0.5548 0.5803 0.5762 0.5702 0.5457 0.5676 0.0142 6.3441
B
Table A.3: A: Density measurements using Scion Image for all the impressions made on ultra low pressure
film with 255 representing a saturated sample. The average density, standard deviation, and percent error
for each test are calculated. B: The data from table A is converted to pressure using calibration results
from figure A.4.
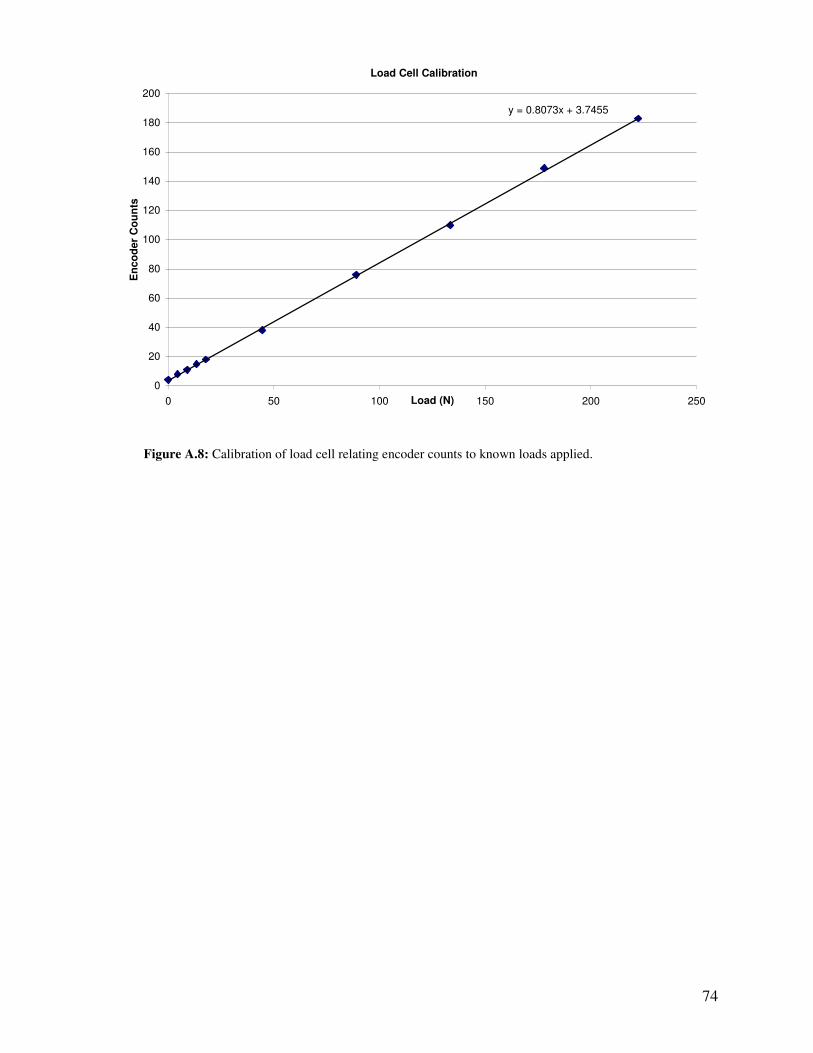
74
Figure A.8: Calibration of load cell relating encoder counts to known loads applied.
Load Cell Calibration
y = 0.8073x + 3.7455
0
20
40
60
80
100
120
140
160
180
200
0 50 100 150 200 250Load (N)
En
co
der
Co
un
ts
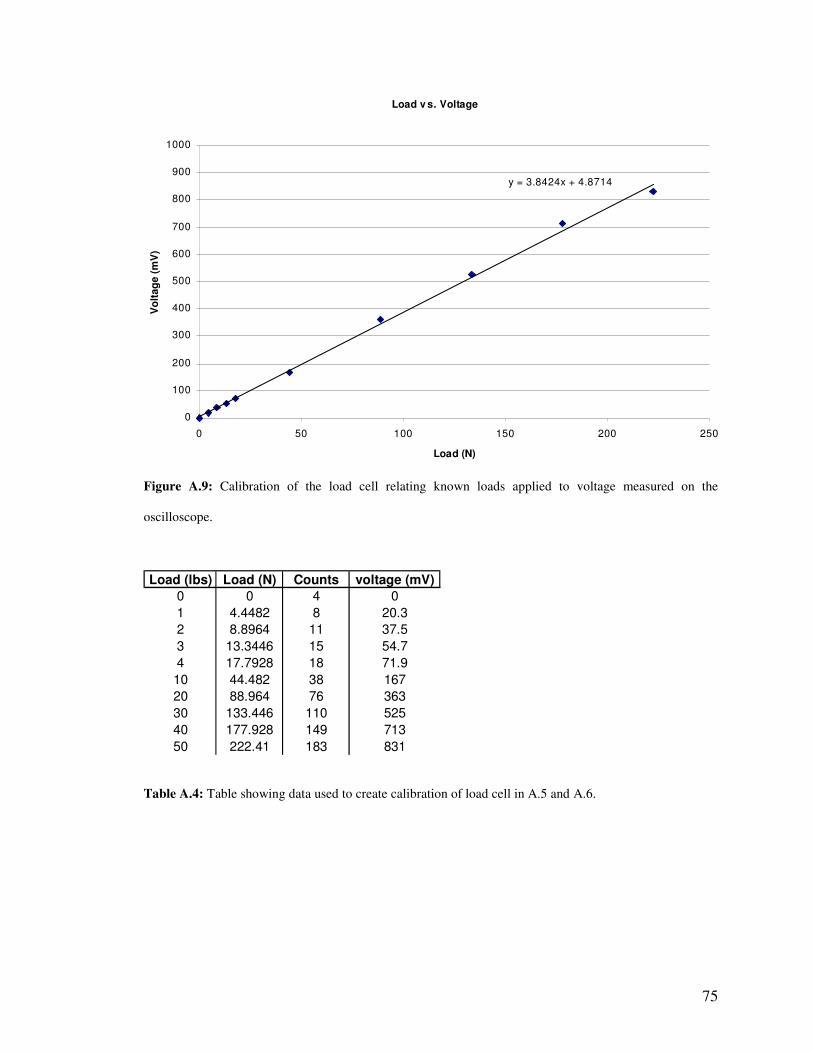
75
Figure A.9: Calibration of the load cell relating known loads applied to voltage measured on the
oscilloscope.
Table A.4: Table showing data used to create calibration of load cell in A.5 and A.6.
Load v s. Voltage
y = 3.8424x + 4.8714
0
100
200
300
400
500
600
700
800
900
1000
0 50 100 150 200 250
Load (N)
Vo
ltag
e (
mV
)
Load (lbs) Load (N) Counts voltage (mV)
0 0 4 0
1 4.4482 8 20.3
2 8.8964 11 37.5
3 13.3446 15 54.7
4 17.7928 18 71.9
10 44.482 38 167
20 88.964 76 363
30 133.446 110 525
40 177.928 149 713
50 222.41 183 831
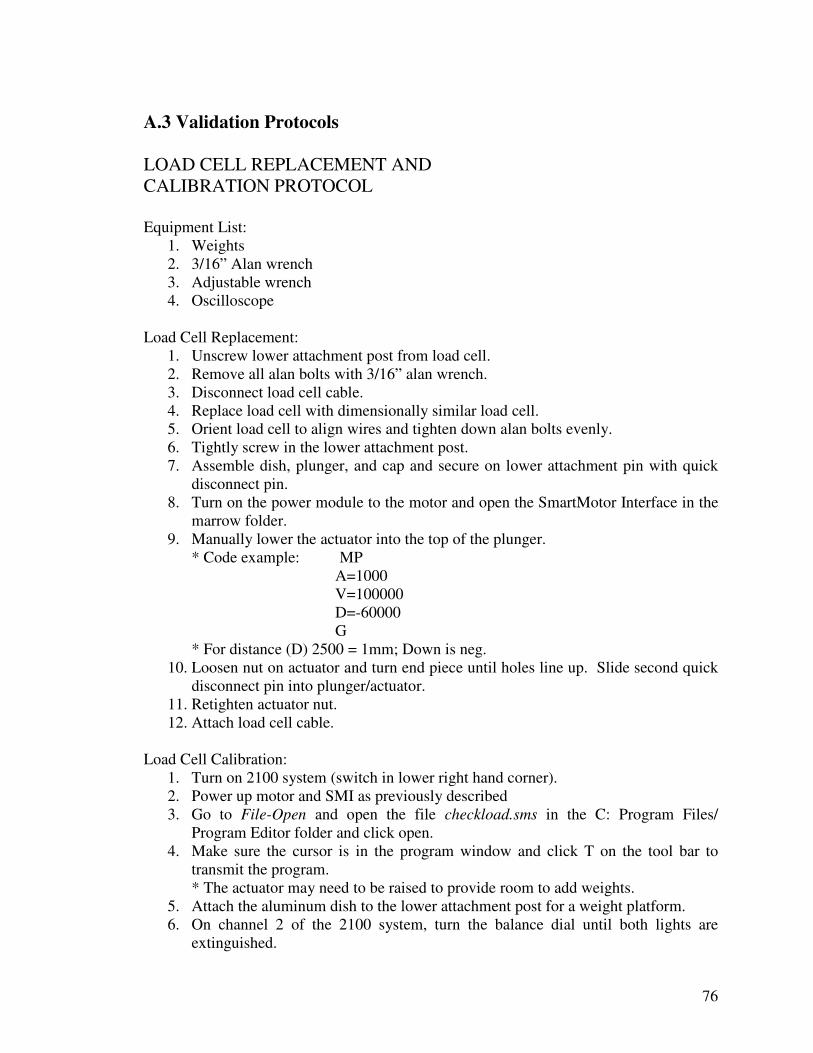
76
A.3 Validation Protocols
LOAD CELL REPLACEMENT AND CALIBRATION PROTOCOL
Equipment List:
1. Weights 2. 3/16” Alan wrench 3. Adjustable wrench 4. Oscilloscope
Load Cell Replacement:
1. Unscrew lower attachment post from load cell. 2. Remove all alan bolts with 3/16” alan wrench. 3. Disconnect load cell cable. 4. Replace load cell with dimensionally similar load cell. 5. Orient load cell to align wires and tighten down alan bolts evenly. 6. Tightly screw in the lower attachment post. 7. Assemble dish, plunger, and cap and secure on lower attachment pin with quick
disconnect pin. 8. Turn on the power module to the motor and open the SmartMotor Interface in the
marrow folder. 9. Manually lower the actuator into the top of the plunger.
* Code example: MP A=1000 V=100000 D=-60000 G
* For distance (D) 2500 = 1mm; Down is neg. 10. Loosen nut on actuator and turn end piece until holes line up. Slide second quick
disconnect pin into plunger/actuator. 11. Retighten actuator nut. 12. Attach load cell cable.
Load Cell Calibration:
1. Turn on 2100 system (switch in lower right hand corner). 2. Power up motor and SMI as previously described 3. Go to File-Open and open the file checkload.sms in the C: Program Files/
Program Editor folder and click open. 4. Make sure the cursor is in the program window and click T on the tool bar to
transmit the program. * The actuator may need to be raised to provide room to add weights.
5. Attach the aluminum dish to the lower attachment post for a weight platform. 6. On channel 2 of the 2100 system, turn the balance dial until both lights are
extinguished.
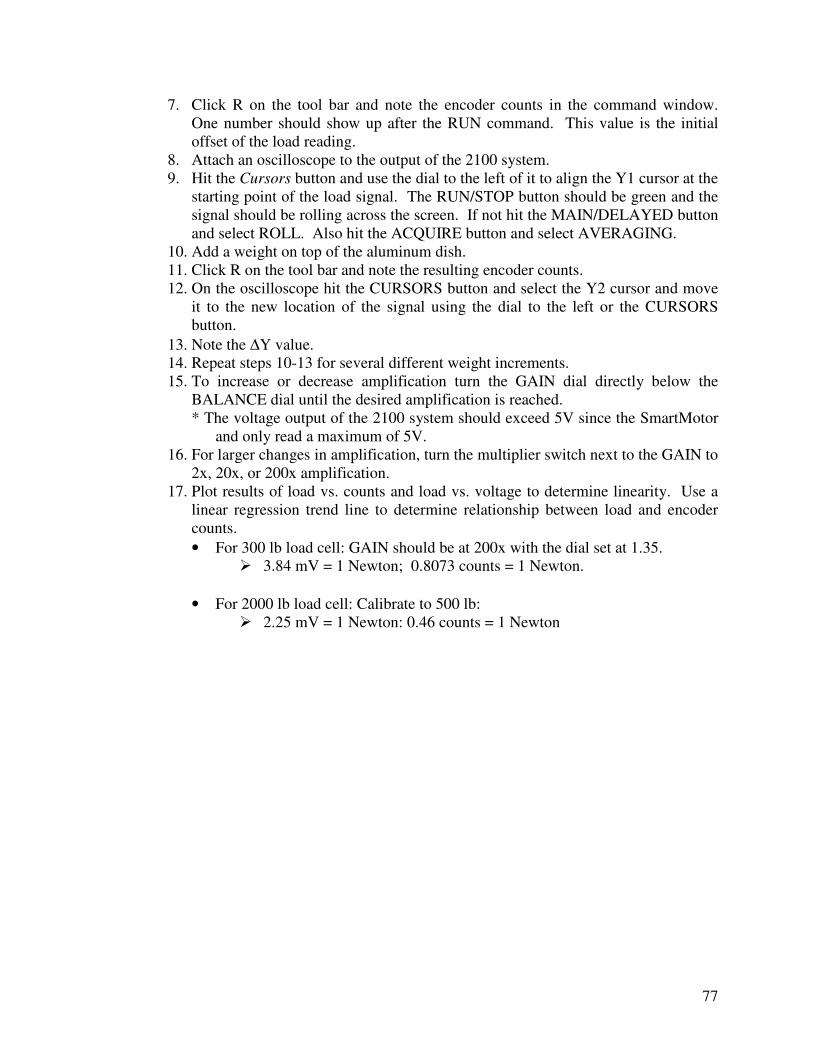
77
7. Click R on the tool bar and note the encoder counts in the command window. One number should show up after the RUN command. This value is the initial offset of the load reading.
8. Attach an oscilloscope to the output of the 2100 system. 9. Hit the Cursors button and use the dial to the left of it to align the Y1 cursor at the
starting point of the load signal. The RUN/STOP button should be green and the signal should be rolling across the screen. If not hit the MAIN/DELAYED button and select ROLL. Also hit the ACQUIRE button and select AVERAGING.
10. Add a weight on top of the aluminum dish. 11. Click R on the tool bar and note the resulting encoder counts. 12. On the oscilloscope hit the CURSORS button and select the Y2 cursor and move
it to the new location of the signal using the dial to the left or the CURSORS button.
13. Note the ∆Y value. 14. Repeat steps 10-13 for several different weight increments. 15. To increase or decrease amplification turn the GAIN dial directly below the
BALANCE dial until the desired amplification is reached. * The voltage output of the 2100 system should exceed 5V since the SmartMotor
and only read a maximum of 5V. 16. For larger changes in amplification, turn the multiplier switch next to the GAIN to
2x, 20x, or 200x amplification. 17. Plot results of load vs. counts and load vs. voltage to determine linearity. Use a
linear regression trend line to determine relationship between load and encoder counts.
• For 300 lb load cell: GAIN should be at 200x with the dial set at 1.35. � 3.84 mV = 1 Newton; 0.8073 counts = 1 Newton.
• For 2000 lb load cell: Calibrate to 500 lb: � 2.25 mV = 1 Newton: 0.46 counts = 1 Newton
78
VALIDATION PROTOCOL FOR EVEN WELL PRESSURE
Objective:
To determine the greatest difference in pressure between all six well of the
bioreactor. This will be done using Ultra Low pressure film, which will be placed
between each compression rod and each sample to be compressed. The film will be
analyzed using Scion Image to check the density. The density values will be related to
pressure using calibration and the results will determine the accuracy of even well
pressure.
Pressure Film Calibration
• Using a punch, cut six identical cylindrical pieces of sample material (rubber) of
constant thickness. Measure dimensions of samples.
• Cut matching samples of Pressurex Ultra Low pressure film (28 psi – 85 psi).
• Place the sample material on the lower platen of the Instron 8872 tensile testing
hydraulic press and place the pressure film on top of the sample. The dull sides of
each layer of film have to be in contact.
• Change the display of the Instron to read load measured in Newtons. Using the
fine adjustment, manually lower the upper platen and compress to a known load
within the pressure range of the pressure film. Immediately unload.
• Remove and discard translucent sheet of pressure film
• Perform 12 compressions using different loads each time. Load at increments of
5 psi, going from 30 to 85 psi.
• Using Scion Image, measure the mean density of each pressure film compression.
Use the results to create a calibration curve of density vs. pressure.

79
Testing Well Pressure
• Place sample material (rubber) in the bottom of each well. Make sure each rubber
sample is sitting flat in the bottom of each well with some clearance around the
edges. Place pressure film on top of each sample.
• Assemble the well plate, plunger, and lid, and connect to load cell and actuator.
The load cell is connected first, and then the actuator is lowered to meet the
connection with the plunger. Pick a target load within the range of the pressure
film to compress the samples.
• To move the actuator, refer to the commands in chapter’s 2 &3 of the SmartMotor
user’s manual.
• Double Click the Marrow folder on the desktop and open Smartmotor Interface
shortcut.
• Open the file titled target load.sms.
• Change the voltage value for load to the desire amount. To change pressure to
voltage, determine the number of Newton’s on each sample, multiply by 6
(number of wells), and then multiply by .46. This value goes into the “f = “ for
the user input for force.
• Click the T (transmit) button.
• When the program is finished transmitting, click R (run) to start the program.
• When the program is finished, raise the actuator back up and take out the dish and
film cutouts.
• Perform a total of 15 tests at three different loads.
• Scan results and measure density of each well for each test.
• Using calibration results, find pressure by using density for each sample and each
test.
• Calculate differences in pressure between each well and determine percent error.
Compare target pressure with pressure found from film, and using load from load cell.
80
A.4 Validation Programs
The following are programs written in SmartMotor programming language, which
were used in various ways during validation of the bioreactor.
checkload.sms: This program is a simple code used to check the current load measured
by the load cell.
findload.sms: This program is used to check the load after a set displacement before
returning to the starting location. This program was used during validation due to the
high repeatability of the displacement of the actuator. I was also used when determining
the resistance of samples to different displacements.
81
target load.sms: This program is used to compress as sample to a desired load and then return to the starting location. This program was used during validation to apply repeated load to multiple pressure film samples.
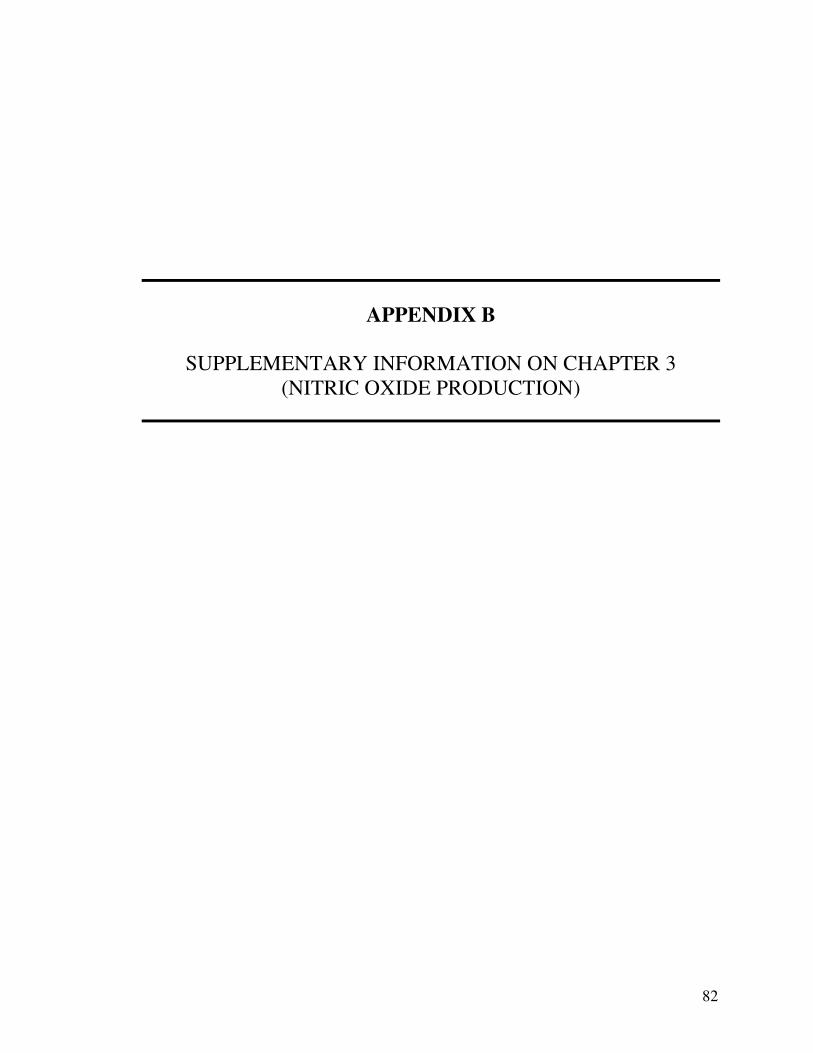
82
APPENDIX B
SUPPLEMENTARY INFORMATION ON CHAPTER 3 (NITRIC OXIDE PRODUCTION)
83
B.1 Compression Programming
Load and displacement control programs were written in SmartMotor
programming language. The displacement programs compresses to a target displacement
and then returns to the starting location. The velocity and acceleration are adjusted to
achieve 1 Hz motion. At the peak and valley of each cycle, the SmartMotor Interface
(SMI) software on the PC records load, position, and time. This repeats for a desired
number of cycles at which point the actuator returns to the starting position. Load control
works by displacing a distance determine by the size of the error signal of the difference
from the current load to the target load. The larger this error signal is, the greater the
displacement. Following each movement, the program checks the load signal and moves
again, a smaller distance for a smaller error signal. This loop continues until the target
load is reached and then returns to the starting location of the test. This program also
records the load, position, and time at the peak and valley of each cycle. An example of
these programs can be seen below.
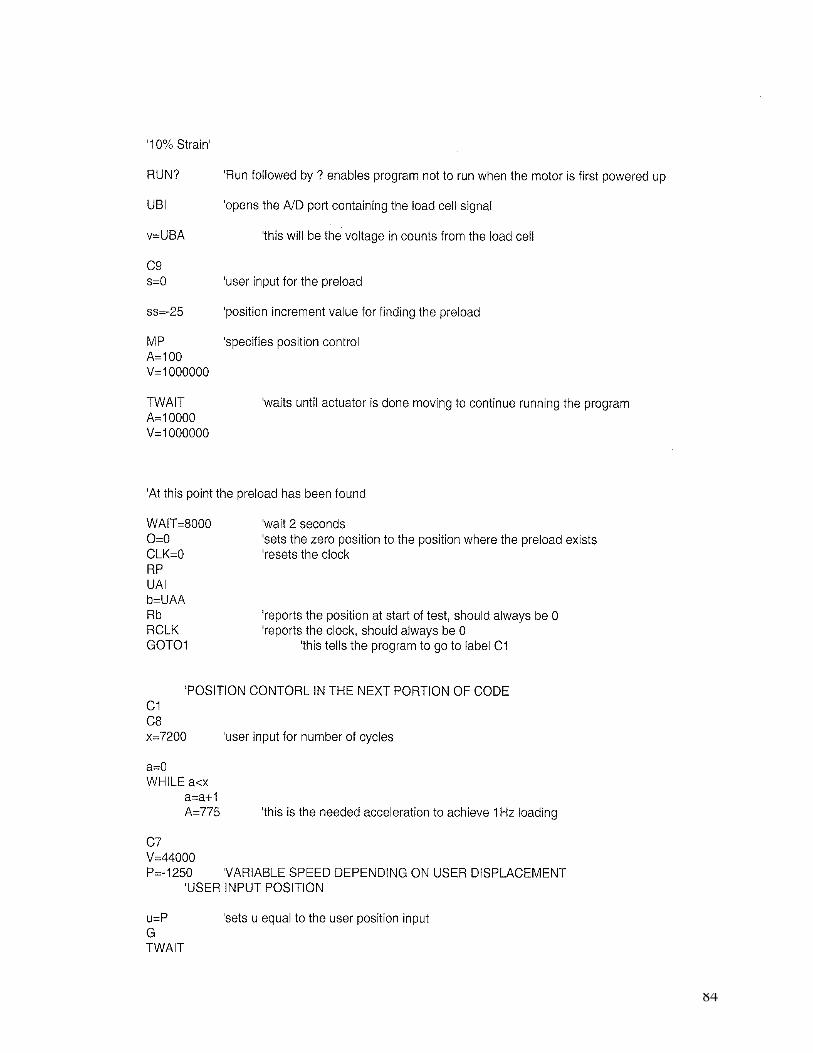
84
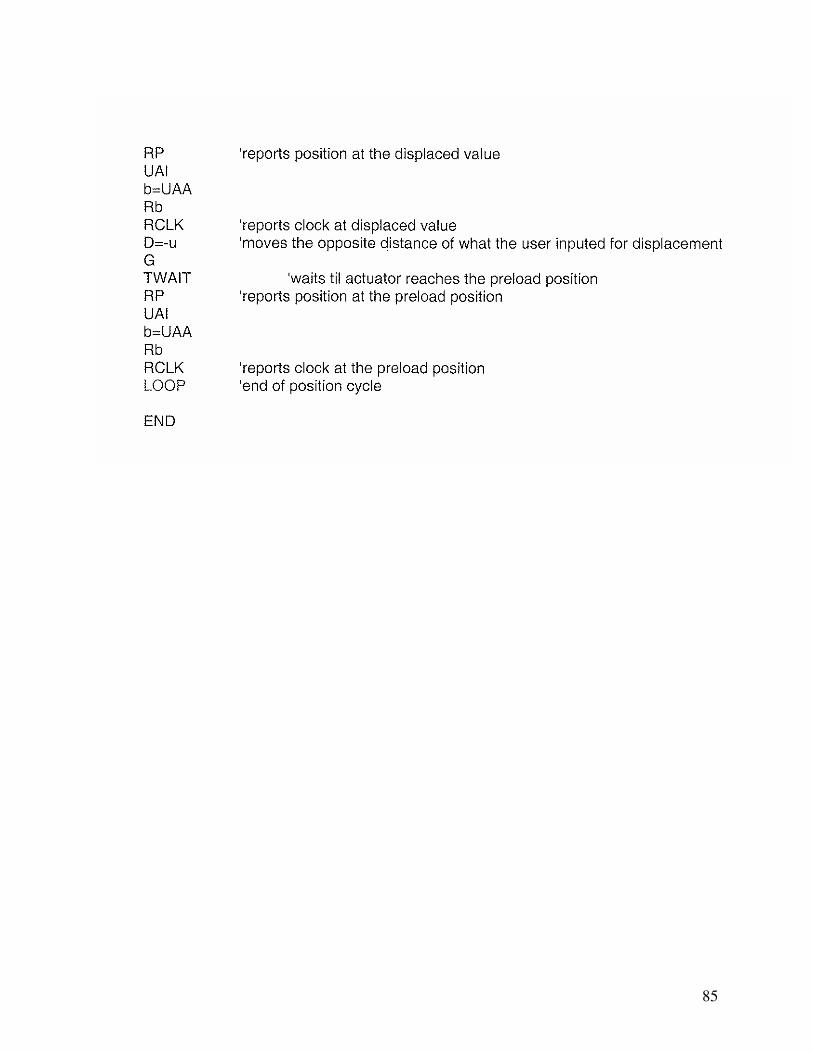
85
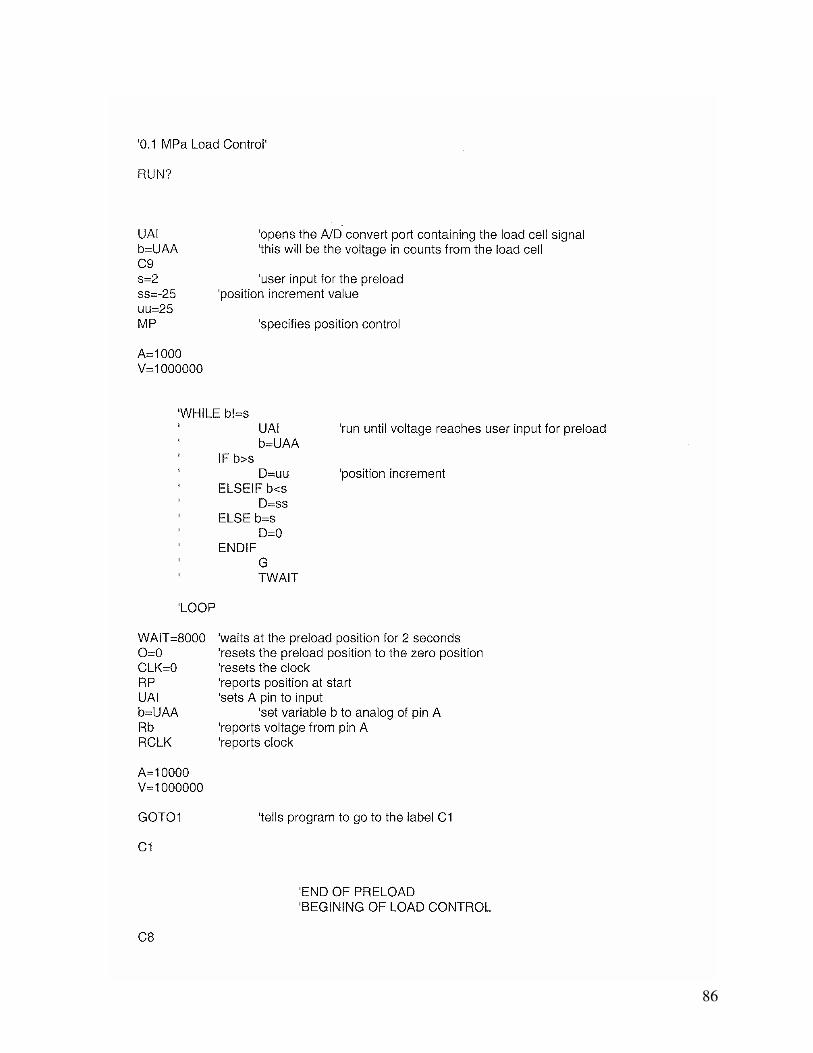
86
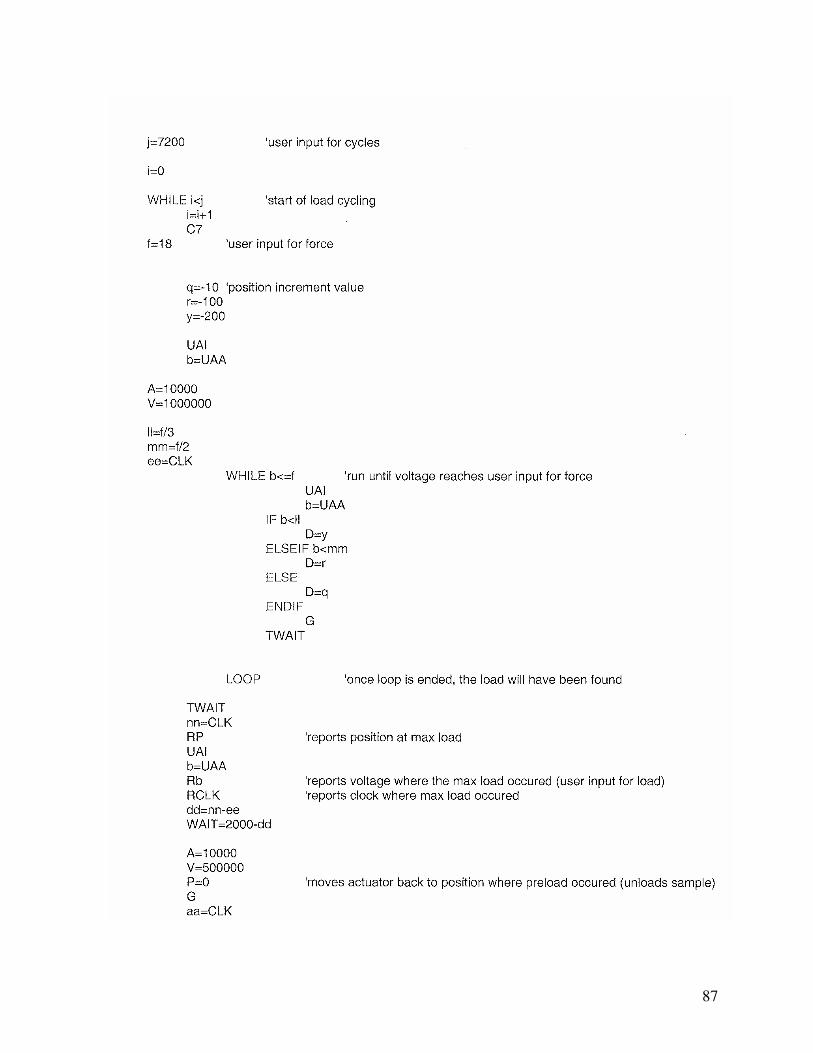
87

88
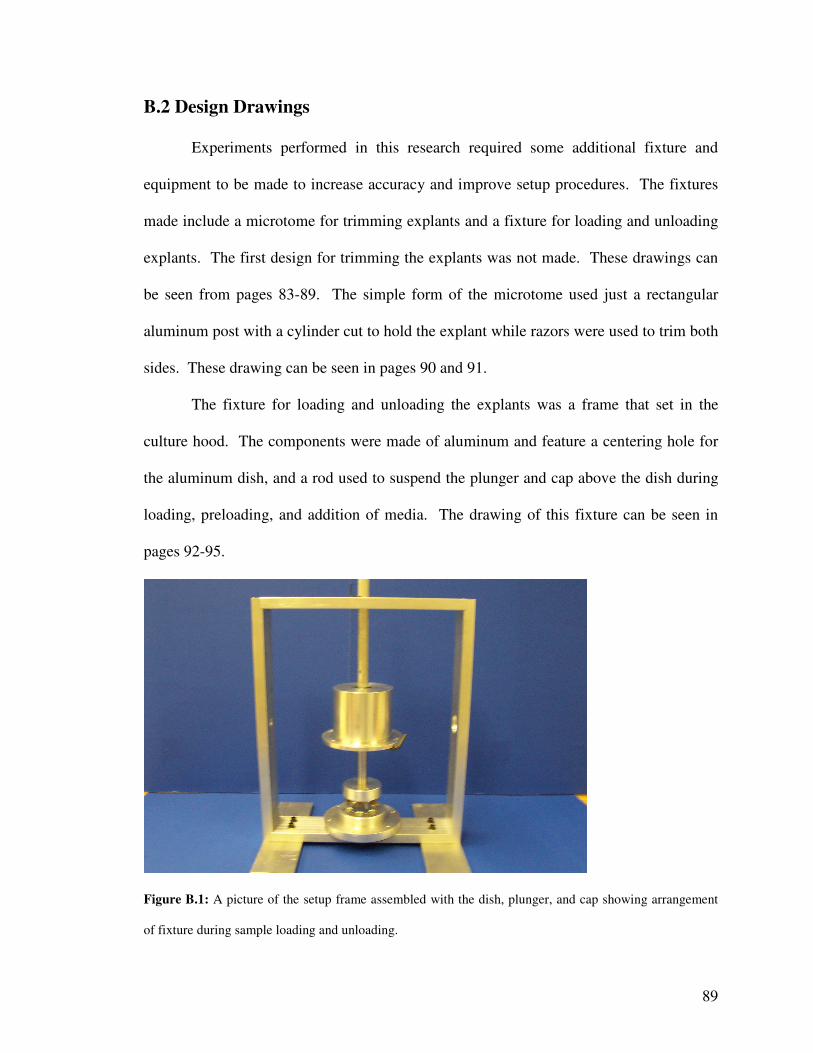
89
B.2 Design Drawings
Experiments performed in this research required some additional fixture and
equipment to be made to increase accuracy and improve setup procedures. The fixtures
made include a microtome for trimming explants and a fixture for loading and unloading
explants. The first design for trimming the explants was not made. These drawings can
be seen from pages 83-89. The simple form of the microtome used just a rectangular
aluminum post with a cylinder cut to hold the explant while razors were used to trim both
sides. These drawing can be seen in pages 90 and 91.
The fixture for loading and unloading the explants was a frame that set in the
culture hood. The components were made of aluminum and feature a centering hole for
the aluminum dish, and a rod used to suspend the plunger and cap above the dish during
loading, preloading, and addition of media. The drawing of this fixture can be seen in
pages 92-95.
Figure B.1: A picture of the setup frame assembled with the dish, plunger, and cap showing arrangement
of fixture during sample loading and unloading.
90

91
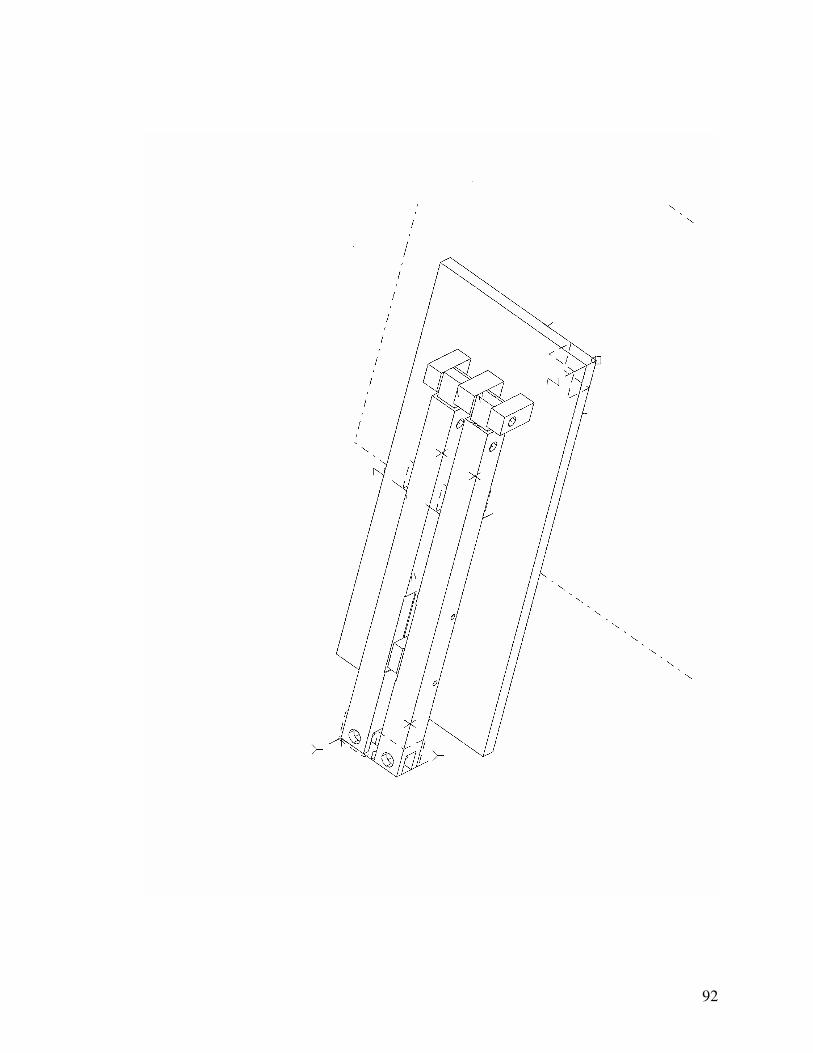
92
93
94
95
96
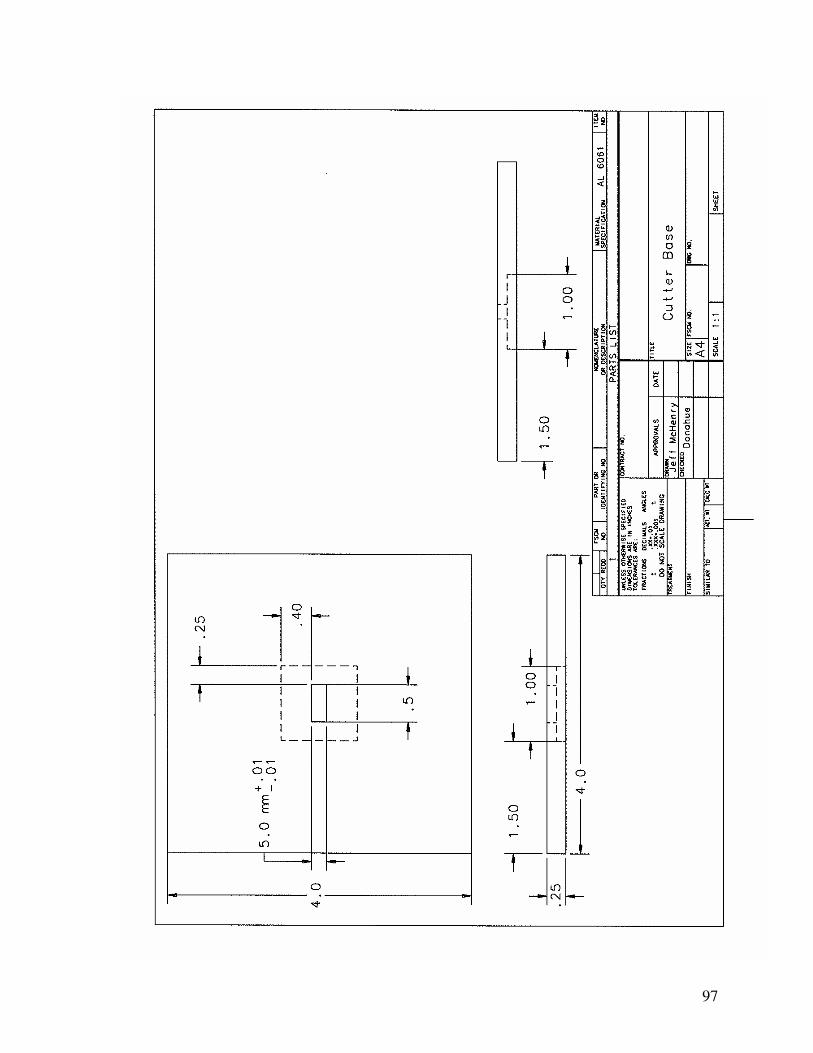
97
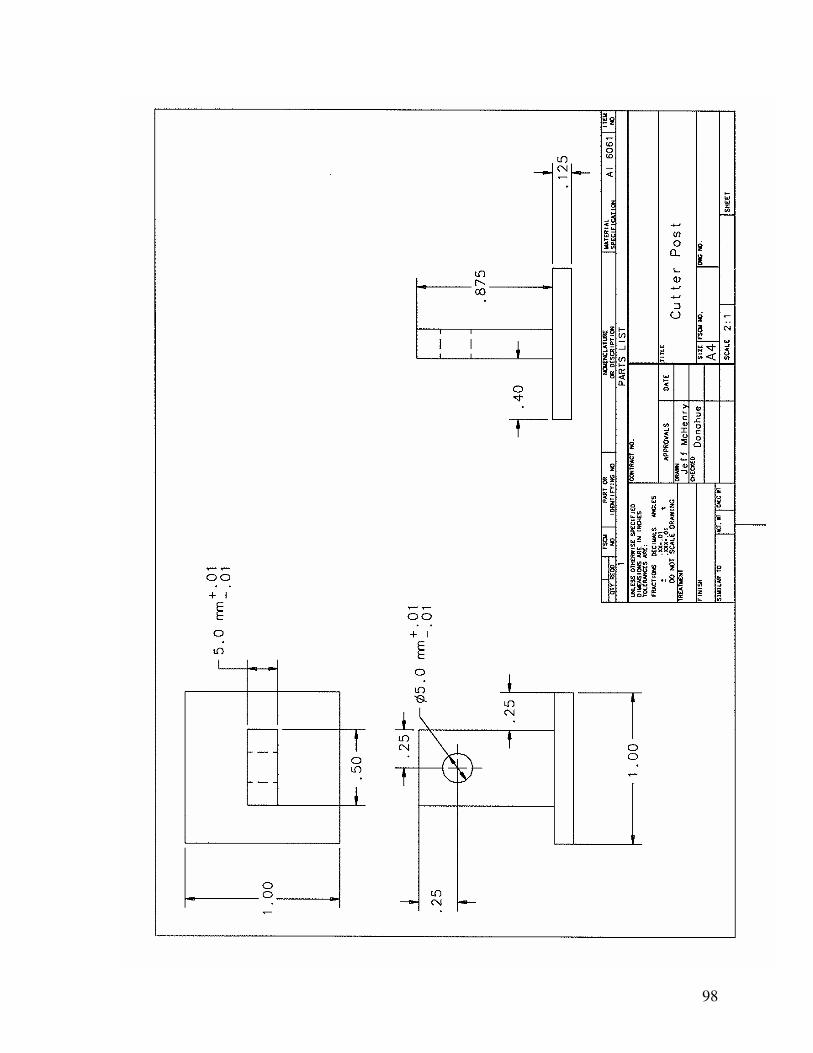
98
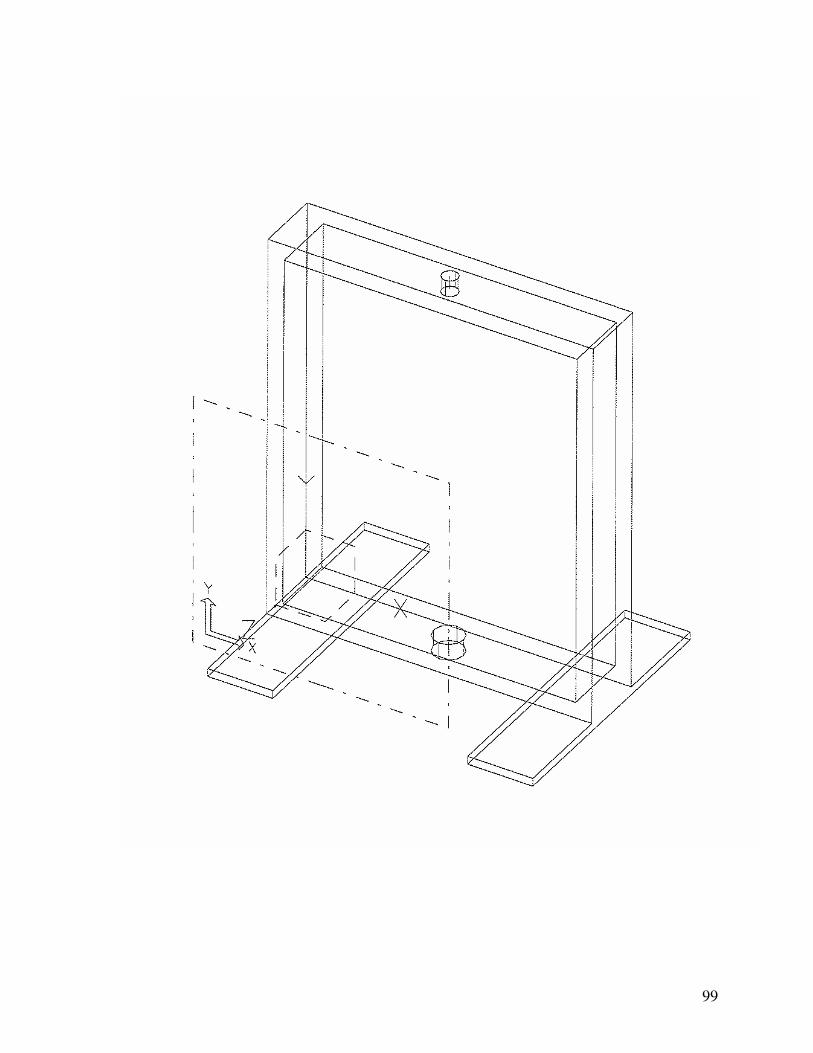
99

100
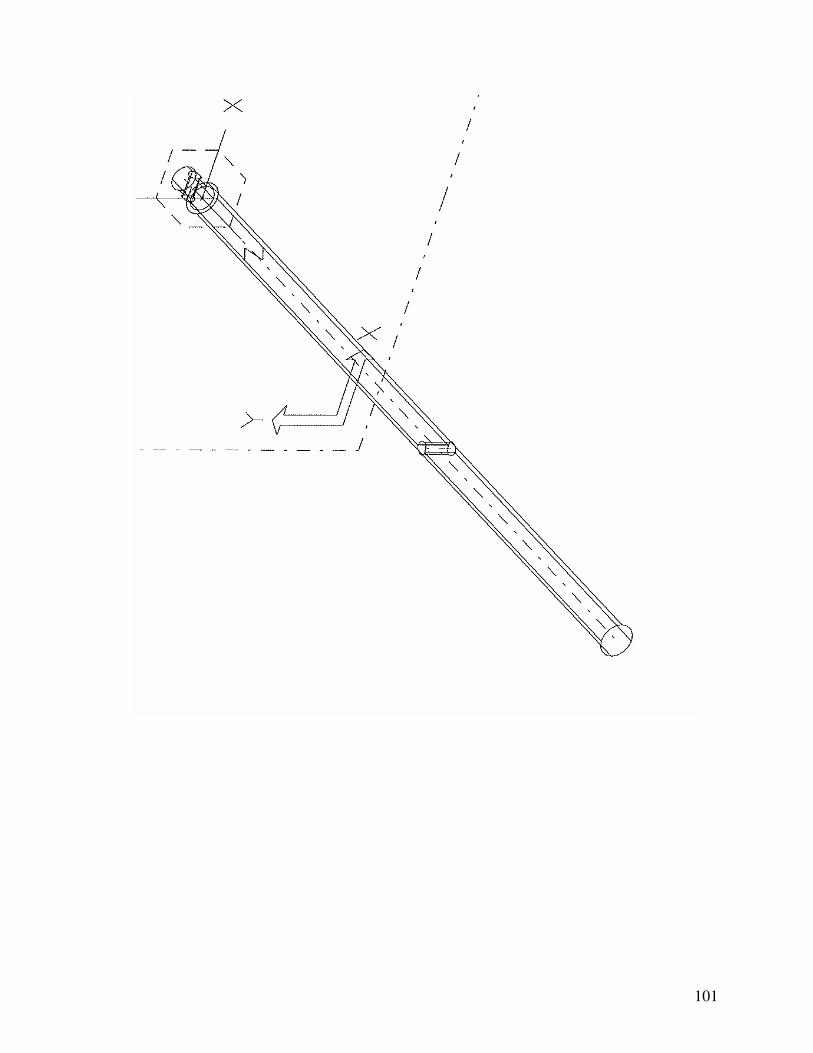
101
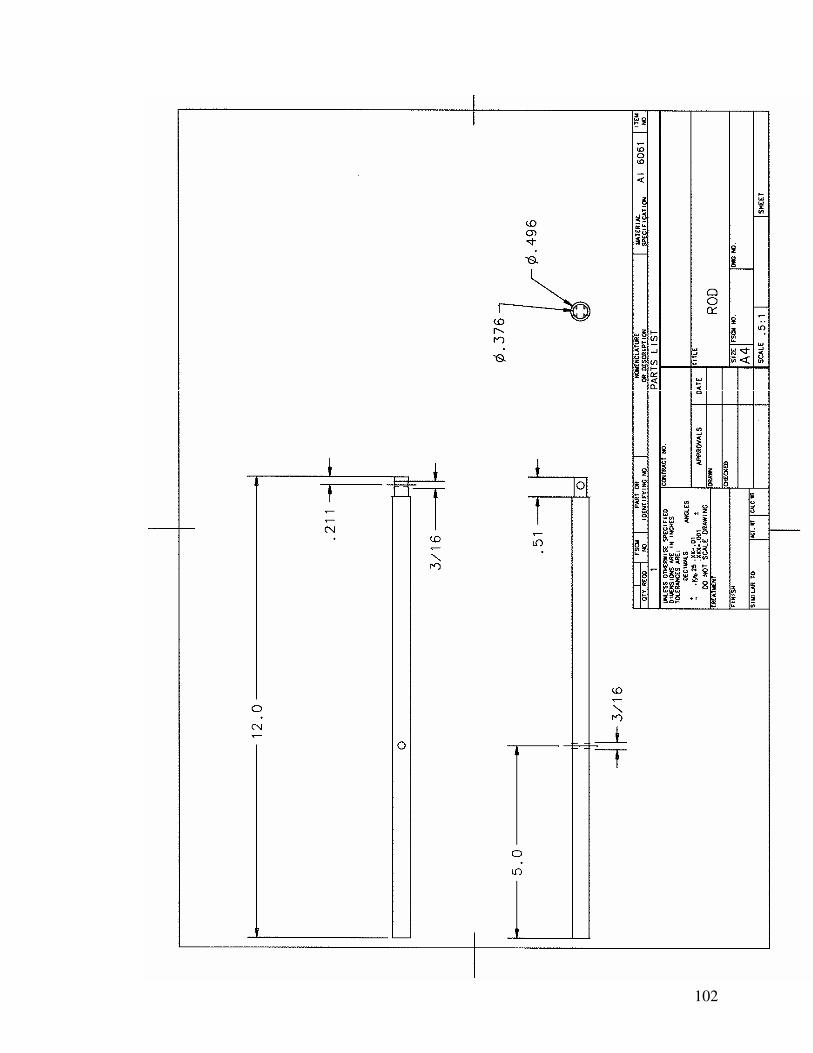
102
103
B.3 Experiment Protocols
EXPLANT COMPRESSION EXPERIMENT
Time Period- Setup (Day 1) 3 hrs Run Time (Day 2) 2.5 hrs/test (4 tests) Clean Up 0.5hrs _____________________________________ Total 13.5 hrs
Equipment List:
Day 1:
1. Media: 2 80ml bottles, DMEM, Ham’s F-12, FBS, Penn/Strep, 100-1000 µl pipette and tips,
2. Dissection Tools(sterile): Scalpel w/ 2 extra blades, tweezers, hemostat, drop cloth, PBS, culture dish
3. Explant tools: Dermal punches (3), Plexiglas plate, Alan wrench, microtome, razor, tweezers, microplate, media, pipette/tips, scalpel w/ blade, 96-well plate
Day 2: 4. Compression Setup: Frame w/ rod, 2 Alan wrenches, 6-well dish, plunger, cap,
100-1000 µL pipette and tips, media, tweezers, paper clip, culture dish, scale Day 3:
5. Post compression: 24-well microplate, tweezers scalpel, frame, post- compression media, 100-1000 µl pipette and tips
A. Autoclave/Sterilize
1. Autoclave as much of the equipment as possible following the autoclave protocol. 2. Sterilize inside of culture hood using spray bottle of 75% isopropanol and wipe
down. 3. Sterilize the remaining equipment by spraying with alcohol and placing in the
culture hood.
B. Make Growth and Flow Media
Growth Media: 44.5% DMEM/F-12, 10% FBS, 1% Penn/Strep Post Comp. Media: 48.5 % DMEM/F-12, 2% FBS, 1% Penn/Strep
1. Place all ingredients into 37˚C water bath for ~15 min. 2. Mix media in culture hood:
• 20 ml growth media per animal
• 40 ml post comp. media per animal 3. Make sure media is 37˚C before use with any tissue.
104
C. Dissection and Explant Removal
1. Dissect fresh porcine knee in culture hood using sterilized tools only. 2. Using cleans scalpel and tweezers remove medial and lateral meniscus and place
in dish containing sterile Phosphate Buffered Saline 1X (PBS) 3. For explant removal place meniscus on clean surface (Plexiglas) 4. Remove 6 outer and 6 inner explants from each meniscus:
• Place sharp dermal punch flat against top surface of meniscus and cut using turning motion.
• Push tissue from punch into microtome using Alan wrench.
• Using razor and sawing motion, trim explants removing as little top surface as possible.
• Remove from microtome using tweezers. 5. Place in 96-well microplate keeping top surface up. 6. Fill wells with ~300 µl of growth media. 7. Label plates and place in incubator for 48 hours 8. After 24 hrs. remove old media with pipette and refill with fresh growth media.
D. Compression Testing
Compression Program:
1. On PC, open marrow folder on desktop and double click on SmartMotor Interface Icon.
2. Go to File→Open and select compression program out of C: Program File/ Program Editor
3. The following displacement control files are available for use: 5% disp.sms ; 10% disp.sms ; 15% disp. Sms ; 20 % disp.sms
4. The load control programs are: .1 Mpa.sms ; .5 Mpa.sms; 1 Mpa.sms 5. Make sure j equals the number of cycles desired and u equals the displacement
desired.
• 2500 counts = 1mm; ( - ) is the downward direction.
• For load (300 lb load cell): f is the load variable and 0.8073 counts = 1 Newton
6. Turn the motor on (the switch on the power unit on top of the PC) and transmit the program by clicking the T button on the tool bar.
7. Turn on the 2100 System power by the switch on the lower right (below the channel dial):
• Gain should be set to 200x with the dial at 1.35
• Channel selector should be on channel 2.
• Excit switch on channel 2 should be on.
• Bridge volts on meter should read 10 volts.
• For help use 2100 system manual. 8. The test is now ready to run after samples are loaded.
Loading Samples:
9. Make sure post comp. media is at 37°C
105
10. Place frame, dish, plunger, cap, and tools in the culture hood and sterilize. 11. Assemble the components into the frame (as shown in Figure 1) and place the
explant in the center of each well top side up. 12. Maintain order of explants in each well. Well 1 is the well with alignment holes
on each side. 13. Lower the plunger into contact with the explants keeping the cap suspended above
with Alan wrench.
14. Fill each well with 400 µl of flow media using pipette. 15. Lower cap, remove from frame, and bring to bioreactor keeping it level and
steady to prevent spilling from wells. 16. Attach the bottom pin first and then manually lower the actuator to match the top
hole and attach top pin. 17. Turn the balance knob on channel 2 of the 2100 system until both light (at the top
of channel 2) are extinguished. 18. Click the R button on the tool bar to run the test. 19. When test is complete, remove top pin, raise actuator (D=70000), and remove
lower pin before bringing back to the culture hood. 20. Remove samples and media as desired and place in 24-well plates with post
comp. media (2% FBS).
• Explants need to be cut into superficial and deep zones using tweezers and scalpel.
• Weight each explant half (with scale placed in incubator) and put in separate wells in 24 well plate.
• Add 1 ml of flow media into each well.
• Place into incubator with CO2 supply. 21. Incubate 24 hours. 22. After incubation time, immediately separate media and tissue samples into clean,
labeled 1.5 ml centrifuge tubes and immediately put on ice.
• Use parafilm on centrifuge tubes containing media samples. 23. Immediately bring samples to -80˚C freezer. Place media sample directly into
freezer. Tissue sample must be frozen in liquid Nitrogen tank for 24 hrs prior to being placed into freezer.
Testing Data:
24. Place the cursor at the bottom of the data sting in the smart motor command window. Highlight the data by moving to the top of the data string and pressing SHIFT + Left Mouse Button.
25. Go to Edit-Copy and then paste in Excel spreadsheet. 26. Go to File-Open go to local C, open Excel Macro folder and open Macrotest to
open the Excel spreadsheet that contains the macro to separate the data into columns. Minimize that window.
27. Highlight the first cell of the data string. 28. Go to Tools-Macro-Macros…, highlight dispwload and click Run. This will
separate the data into time, load, and displacement columns. 29. Divide the time column by 4000 (=A1/4000) to get time in seconds; Divide the
displacement by 2500 to convert to millimeters.
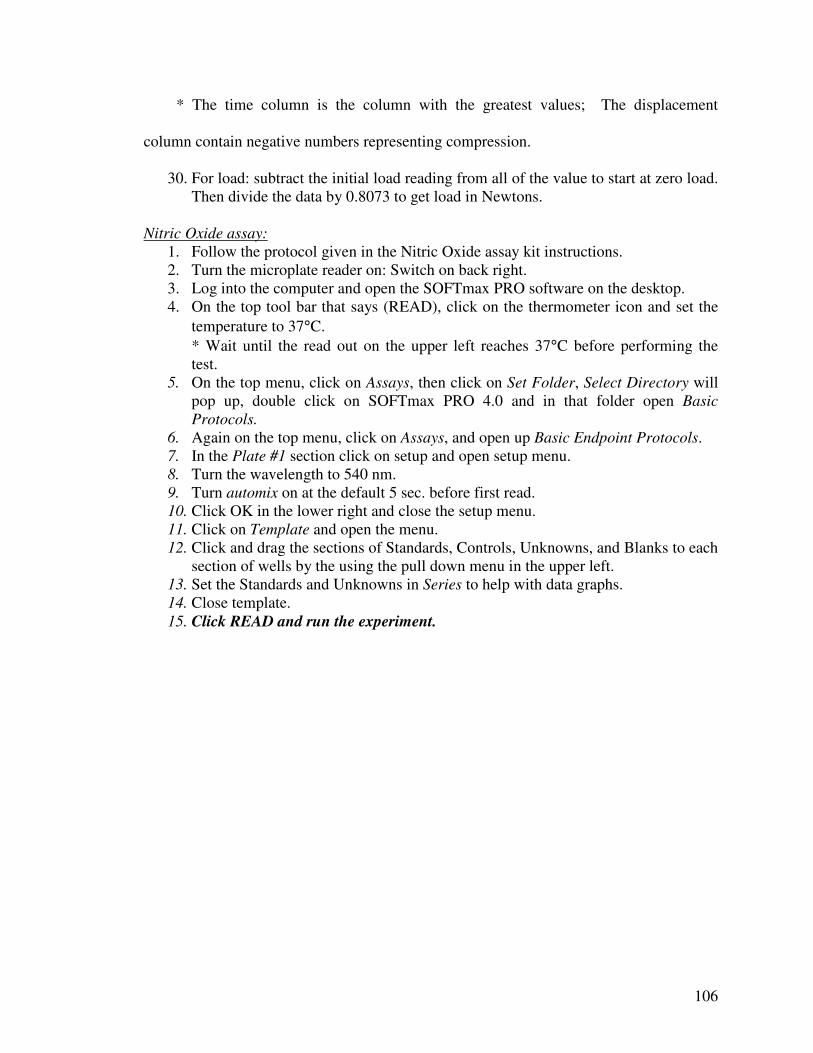
106
* The time column is the column with the greatest values; The displacement
column contain negative numbers representing compression.
30. For load: subtract the initial load reading from all of the value to start at zero load. Then divide the data by 0.8073 to get load in Newtons.
Nitric Oxide assay:
1. Follow the protocol given in the Nitric Oxide assay kit instructions. 2. Turn the microplate reader on: Switch on back right. 3. Log into the computer and open the SOFTmax PRO software on the desktop. 4. On the top tool bar that says (READ), click on the thermometer icon and set the
temperature to 37°C.
* Wait until the read out on the upper left reaches 37°C before performing the test.
5. On the top menu, click on Assays, then click on Set Folder, Select Directory will pop up, double click on SOFTmax PRO 4.0 and in that folder open Basic
Protocols.
6. Again on the top menu, click on Assays, and open up Basic Endpoint Protocols. 7. In the Plate #1 section click on setup and open setup menu. 8. Turn the wavelength to 540 nm. 9. Turn automix on at the default 5 sec. before first read. 10. Click OK in the lower right and close the setup menu. 11. Click on Template and open the menu. 12. Click and drag the sections of Standards, Controls, Unknowns, and Blanks to each
section of wells by the using the pull down menu in the upper left. 13. Set the Standards and Unknowns in Series to help with data graphs. 14. Close template.
15. Click READ and run the experiment.
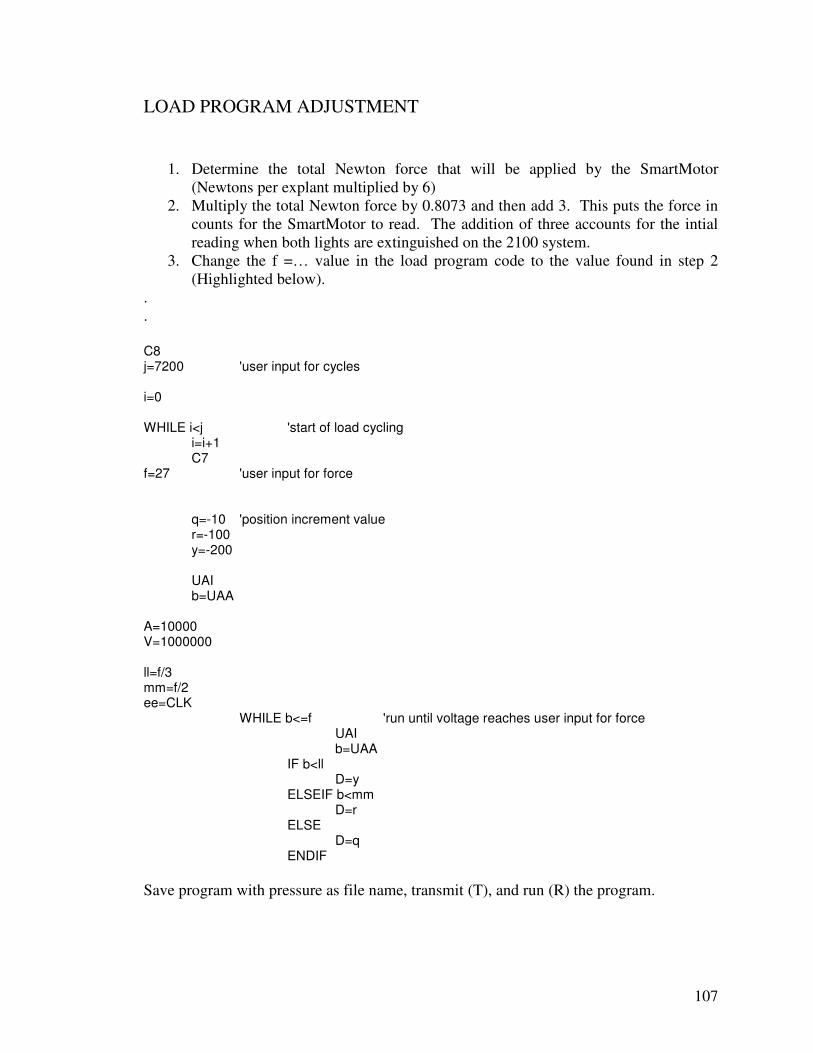
107
LOAD PROGRAM ADJUSTMENT
1. Determine the total Newton force that will be applied by the SmartMotor
(Newtons per explant multiplied by 6) 2. Multiply the total Newton force by 0.8073 and then add 3. This puts the force in
counts for the SmartMotor to read. The addition of three accounts for the intial reading when both lights are extinguished on the 2100 system.
3. Change the f =… value in the load program code to the value found in step 2 (Highlighted below).
.
. C8 j=7200 'user input for cycles i=0 WHILE i<j 'start of load cycling i=i+1 C7 f=27 'user input for force q=-10 'position increment value r=-100 y=-200 UAI b=UAA A=10000 V=1000000 ll=f/3 mm=f/2 ee=CLK WHILE b<=f 'run until voltage reaches user input for force UAI b=UAA IF b<ll D=y ELSEIF b<mm D=r ELSE D=q ENDIF
Save program with pressure as file name, transmit (T), and run (R) the program.
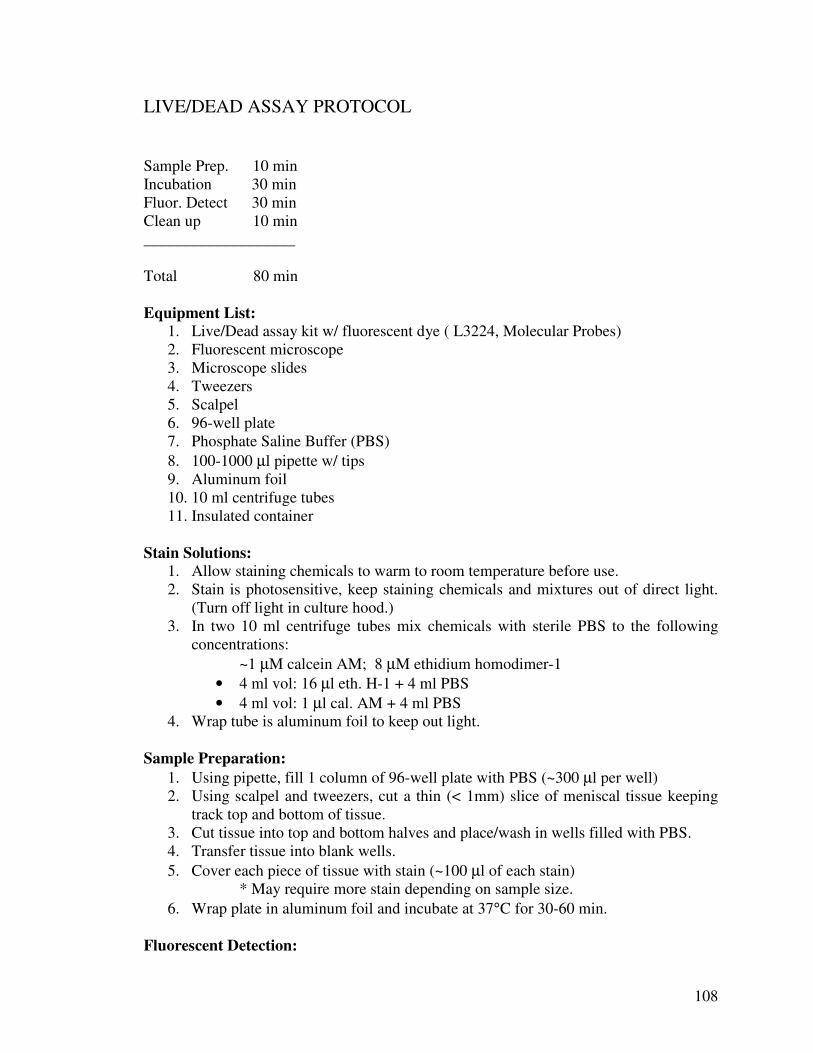
108
LIVE/DEAD ASSAY PROTOCOL
Sample Prep. 10 min Incubation 30 min Fluor. Detect 30 min Clean up 10 min ___________________ Total 80 min
Equipment List:
1. Live/Dead assay kit w/ fluorescent dye ( L3224, Molecular Probes) 2. Fluorescent microscope 3. Microscope slides 4. Tweezers 5. Scalpel 6. 96-well plate 7. Phosphate Saline Buffer (PBS)
8. 100-1000 µl pipette w/ tips 9. Aluminum foil 10. 10 ml centrifuge tubes 11. Insulated container
Stain Solutions:
1. Allow staining chemicals to warm to room temperature before use. 2. Stain is photosensitive, keep staining chemicals and mixtures out of direct light.
(Turn off light in culture hood.) 3. In two 10 ml centrifuge tubes mix chemicals with sterile PBS to the following
concentrations:
~1 µM calcein AM; 8 µM ethidium homodimer-1
• 4 ml vol: 16 µl eth. H-1 + 4 ml PBS
• 4 ml vol: 1 µl cal. AM + 4 ml PBS 4. Wrap tube is aluminum foil to keep out light.
Sample Preparation:
1. Using pipette, fill 1 column of 96-well plate with PBS (~300 µl per well) 2. Using scalpel and tweezers, cut a thin (< 1mm) slice of meniscal tissue keeping
track top and bottom of tissue. 3. Cut tissue into top and bottom halves and place/wash in wells filled with PBS. 4. Transfer tissue into blank wells.
5. Cover each piece of tissue with stain (~100 µl of each stain) * May require more stain depending on sample size.
6. Wrap plate in aluminum foil and incubate at 37°C for 30-60 min.
Fluorescent Detection:
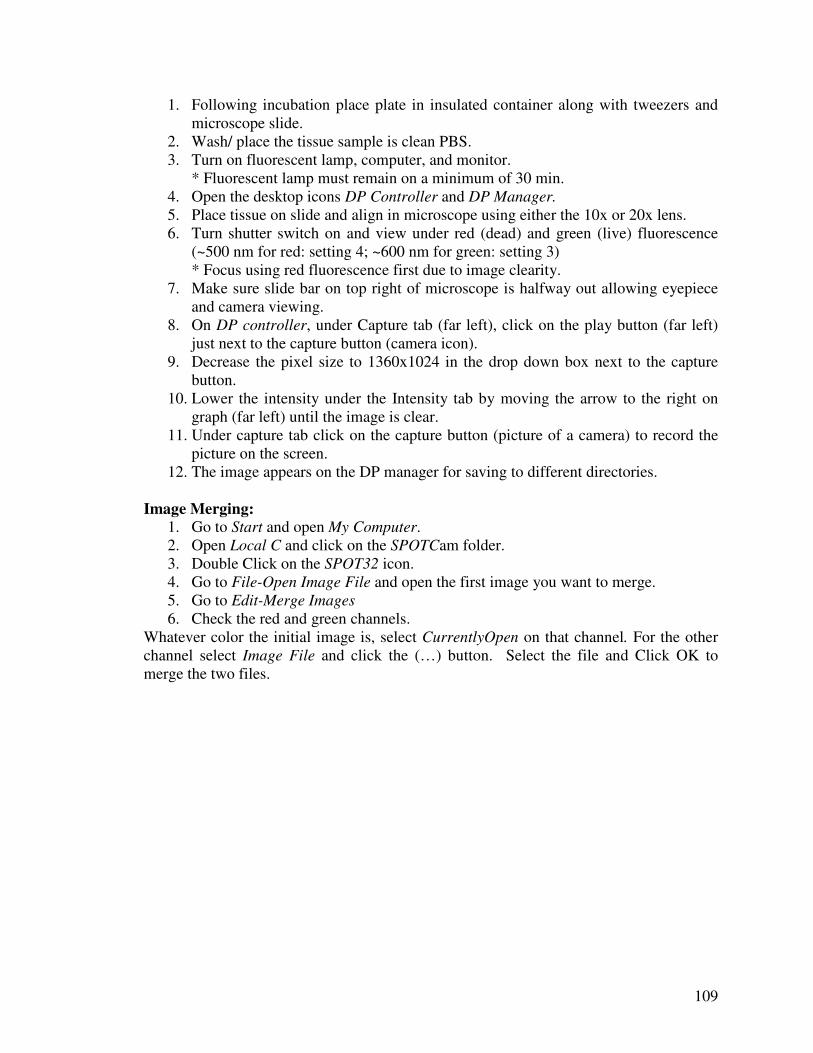
109
1. Following incubation place plate in insulated container along with tweezers and microscope slide.
2. Wash/ place the tissue sample is clean PBS. 3. Turn on fluorescent lamp, computer, and monitor.
* Fluorescent lamp must remain on a minimum of 30 min. 4. Open the desktop icons DP Controller and DP Manager. 5. Place tissue on slide and align in microscope using either the 10x or 20x lens. 6. Turn shutter switch on and view under red (dead) and green (live) fluorescence
(~500 nm for red: setting 4; ~600 nm for green: setting 3) * Focus using red fluorescence first due to image clearity.
7. Make sure slide bar on top right of microscope is halfway out allowing eyepiece and camera viewing.
8. On DP controller, under Capture tab (far left), click on the play button (far left) just next to the capture button (camera icon).
9. Decrease the pixel size to 1360x1024 in the drop down box next to the capture button.
10. Lower the intensity under the Intensity tab by moving the arrow to the right on graph (far left) until the image is clear.
11. Under capture tab click on the capture button (picture of a camera) to record the picture on the screen.
12. The image appears on the DP manager for saving to different directories.
Image Merging:
1. Go to Start and open My Computer. 2. Open Local C and click on the SPOTCam folder. 3. Double Click on the SPOT32 icon. 4. Go to File-Open Image File and open the first image you want to merge. 5. Go to Edit-Merge Images 6. Check the red and green channels.
Whatever color the initial image is, select CurrentlyOpen on that channel. For the other channel select Image File and click the (…) button. Select the file and Click OK to merge the two files.
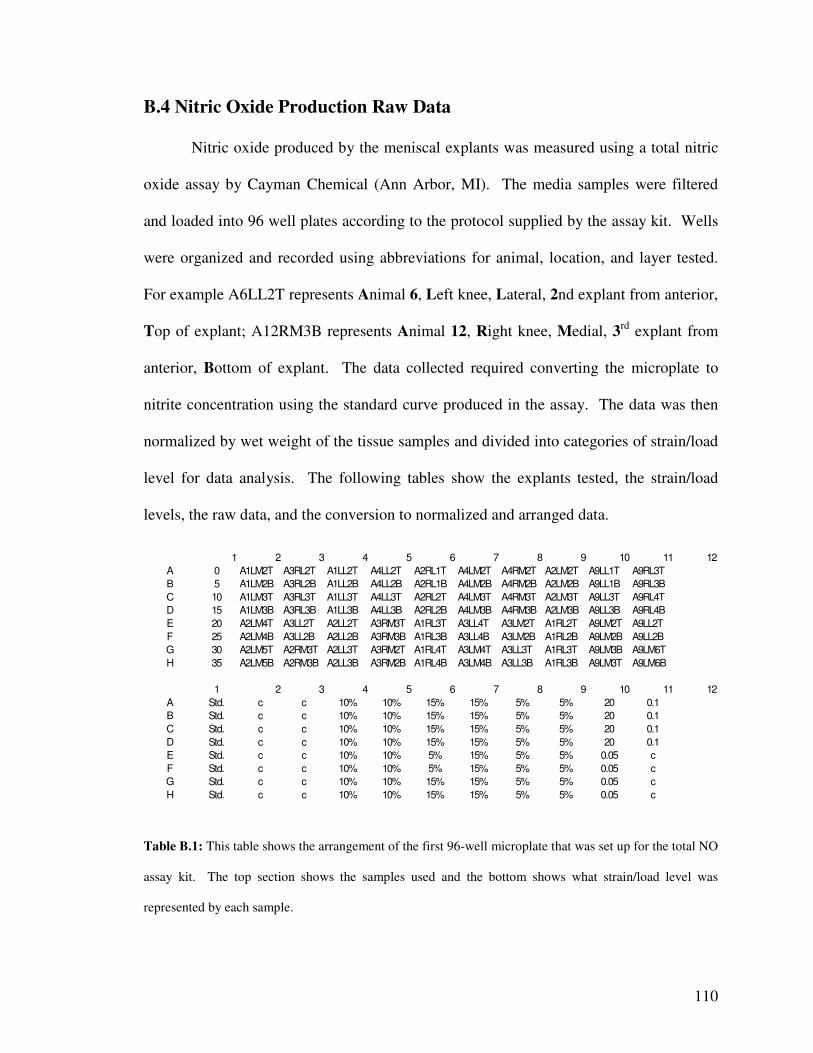
110
B.4 Nitric Oxide Production Raw Data
Nitric oxide produced by the meniscal explants was measured using a total nitric
oxide assay by Cayman Chemical (Ann Arbor, MI). The media samples were filtered
and loaded into 96 well plates according to the protocol supplied by the assay kit. Wells
were organized and recorded using abbreviations for animal, location, and layer tested.
For example A6LL2T represents Animal 6, Left knee, Lateral, 2nd explant from anterior,
Top of explant; A12RM3B represents Animal 12, Right knee, Medial, 3rd explant from
anterior, Bottom of explant. The data collected required converting the microplate to
nitrite concentration using the standard curve produced in the assay. The data was then
normalized by wet weight of the tissue samples and divided into categories of strain/load
level for data analysis. The following tables show the explants tested, the strain/load
levels, the raw data, and the conversion to normalized and arranged data.
Table B.1: This table shows the arrangement of the first 96-well microplate that was set up for the total NO
assay kit. The top section shows the samples used and the bottom shows what strain/load level was
represented by each sample.
1 2 3 4 5 6 7 8 9 10 11 12
A 0 A1LM2T A3RL2T A1LL2T A4LL2T A2RL1T A4LM2T A4RM2T A2LM2T A9LL1T A9RL3T
B 5 A1LM2B A3RL2B A1LL2B A4LL2B A2RL1B A4LM2B A4RM2B A2LM2B A9LL1B A9RL3B
C 10 A1LM3T A3RL3T A1LL3T A4LL3T A2RL2T A4LM3T A4RM3T A2LM3T A9LL3T A9RL4T
D 15 A1LM3B A3RL3B A1LL3B A4LL3B A2RL2B A4LM3B A4RM3B A2LM3B A9LL3B A9RL4B
E 20 A2LM4T A3LL2T A2LL2T A3RM3T A1RL3T A3LL4T A3LM2T A1RL2T A9LM2T A9LL2T
F 25 A2LM4B A3LL2B A2LL2B A3RM3B A1RL3B A3LL4B A3LM2B A1RL2B A9LM2B A9LL2B
G 30 A2LM5T A2RM3T A2LL3T A3RM2T A1RL4T A3LM4T A3LL3T A1RL3T A9LM3B A9LM6T
H 35 A2LM5B A2RM3B A2LL3B A3RM2B A1RL4B A3LM4B A3LL3B A1RL3B A9LM3T A9LM6B
1 2 3 4 5 6 7 8 9 10 11 12
A Std. c c 10% 10% 15% 15% 5% 5% 20 0.1
B Std. c c 10% 10% 15% 15% 5% 5% 20 0.1
C Std. c c 10% 10% 15% 15% 5% 5% 20 0.1
D Std. c c 10% 10% 15% 15% 5% 5% 20 0.1
E Std. c c 10% 10% 5% 15% 5% 5% 0.05 c
F Std. c c 10% 10% 5% 15% 5% 5% 0.05 c
G Std. c c 10% 10% 15% 15% 5% 5% 0.05 c
H Std. c c 10% 10% 15% 15% 5% 5% 0.05 c
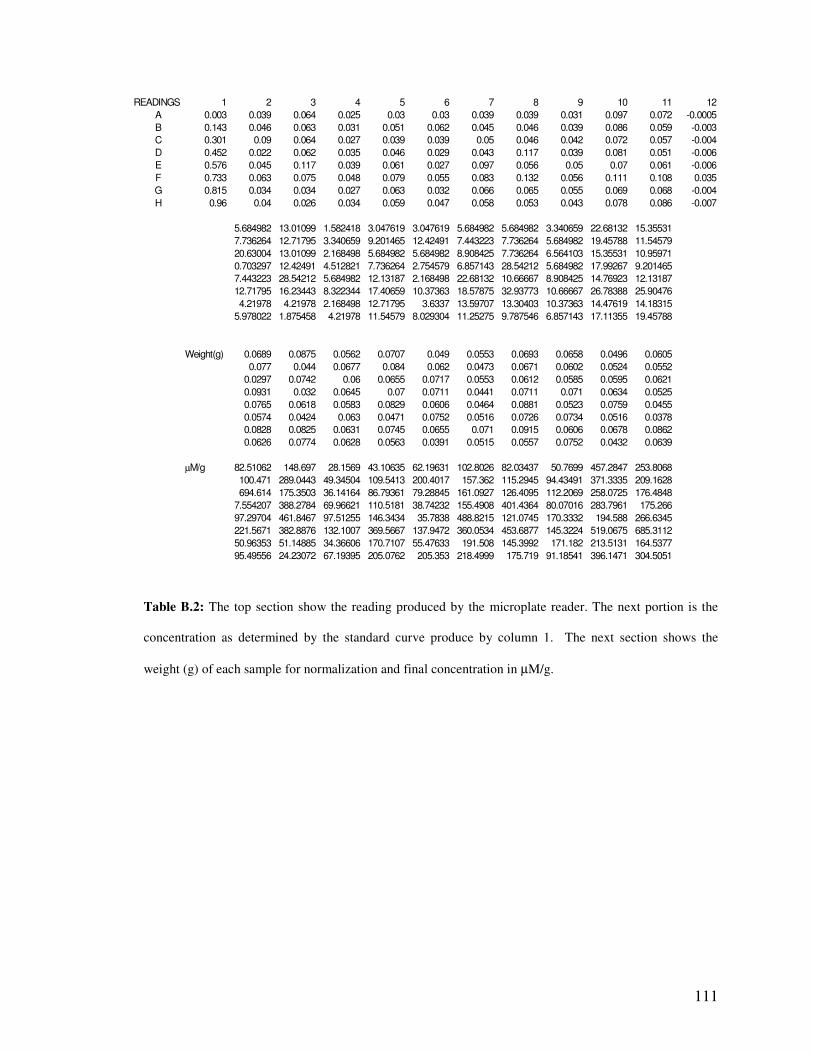
111
Table B.2: The top section show the reading produced by the microplate reader. The next portion is the
concentration as determined by the standard curve produce by column 1. The next section shows the
weight (g) of each sample for normalization and final concentration in µM/g.
READINGS 1 2 3 4 5 6 7 8 9 10 11 12
A 0.003 0.039 0.064 0.025 0.03 0.03 0.039 0.039 0.031 0.097 0.072 -0.0005
B 0.143 0.046 0.063 0.031 0.051 0.062 0.045 0.046 0.039 0.086 0.059 -0.003
C 0.301 0.09 0.064 0.027 0.039 0.039 0.05 0.046 0.042 0.072 0.057 -0.004
D 0.452 0.022 0.062 0.035 0.046 0.029 0.043 0.117 0.039 0.081 0.051 -0.006
E 0.576 0.045 0.117 0.039 0.061 0.027 0.097 0.056 0.05 0.07 0.061 -0.006
F 0.733 0.063 0.075 0.048 0.079 0.055 0.083 0.132 0.056 0.111 0.108 0.035
G 0.815 0.034 0.034 0.027 0.063 0.032 0.066 0.065 0.055 0.069 0.068 -0.004
H 0.96 0.04 0.026 0.034 0.059 0.047 0.058 0.053 0.043 0.078 0.086 -0.007
5.684982 13.01099 1.582418 3.047619 3.047619 5.684982 5.684982 3.340659 22.68132 15.35531
7.736264 12.71795 3.340659 9.201465 12.42491 7.443223 7.736264 5.684982 19.45788 11.54579
20.63004 13.01099 2.168498 5.684982 5.684982 8.908425 7.736264 6.564103 15.35531 10.95971
0.703297 12.42491 4.512821 7.736264 2.754579 6.857143 28.54212 5.684982 17.99267 9.201465
7.443223 28.54212 5.684982 12.13187 2.168498 22.68132 10.66667 8.908425 14.76923 12.13187
12.71795 16.23443 8.322344 17.40659 10.37363 18.57875 32.93773 10.66667 26.78388 25.90476
4.21978 4.21978 2.168498 12.71795 3.6337 13.59707 13.30403 10.37363 14.47619 14.18315
5.978022 1.875458 4.21978 11.54579 8.029304 11.25275 9.787546 6.857143 17.11355 19.45788
Weight(g) 0.0689 0.0875 0.0562 0.0707 0.049 0.0553 0.0693 0.0658 0.0496 0.0605
0.077 0.044 0.0677 0.084 0.062 0.0473 0.0671 0.0602 0.0524 0.0552
0.0297 0.0742 0.06 0.0655 0.0717 0.0553 0.0612 0.0585 0.0595 0.0621
0.0931 0.032 0.0645 0.07 0.0711 0.0441 0.0711 0.071 0.0634 0.0525
0.0765 0.0618 0.0583 0.0829 0.0606 0.0464 0.0881 0.0523 0.0759 0.0455
0.0574 0.0424 0.063 0.0471 0.0752 0.0516 0.0726 0.0734 0.0516 0.0378
0.0828 0.0825 0.0631 0.0745 0.0655 0.071 0.0915 0.0606 0.0678 0.0862
0.0626 0.0774 0.0628 0.0563 0.0391 0.0515 0.0557 0.0752 0.0432 0.0639
µM/g 82.51062 148.697 28.1569 43.10635 62.19631 102.8026 82.03437 50.7699 457.2847 253.8068
100.471 289.0443 49.34504 109.5413 200.4017 157.362 115.2945 94.43491 371.3335 209.1628
694.614 175.3503 36.14164 86.79361 79.28845 161.0927 126.4095 112.2069 258.0725 176.4848
7.554207 388.2784 69.96621 110.5181 38.74232 155.4908 401.4364 80.07016 283.7961 175.266
97.29704 461.8467 97.51255 146.3434 35.7838 488.8215 121.0745 170.3332 194.588 266.6345
221.5671 382.8876 132.1007 369.5667 137.9472 360.0534 453.6877 145.3224 519.0675 685.3112
50.96353 51.14885 34.36606 170.7107 55.47633 191.508 145.3992 171.182 213.5131 164.5377
95.49556 24.23072 67.19395 205.0762 205.353 218.4999 175.719 91.18541 396.1471 304.5051

112
Figure B.2: The calibration curve used for the first NO assay to convert microplate reading to
concentration of nitrite.
Table B.3: This table shows the arrangement on the microplate and strain/load levels of the samples used
for the second total NO assay.
Calibration Curve
y = 0.0273x + 0.0196
0
0.2
0.4
0.6
0.8
1
1.2
0 5 10 15 20 25 30 35 40
Concentration µµµµM
Mic
rop
late
read
ing
1 2 3 4 5 6 7 8 9 10 11 12
A 0 A8LL1T A7LL1T A5LL1T A6RL1T A7RM1T A9RM3T A11RL1T A11LL3T A12RL1T A12LM2T
B 5 A8LL1B A7LL1B A5LL1B A6RL1B A7RM1B A9RM3B A11RL1B A11LL3B A12RL1B A12LM2B
C 10 A8LL2T A7LL2T A5LL2T A6RM2T A7RM2T A9RM4T A11RL2T A11LL5T A12RL2T A12LM3T
D 15 A8LL2B A7LL2B A5LL2B A6RM2B A7RM2B A9RM4B A11RL2B A11LL5B A12RL2B A12LM3B
E 20 A8LM1T A7LM1T A6LL3T A6LM3T A7RL1T A11LL1T A11RM1T A12LL1T A12RM1T
F 25 A8LM1B A7LM1B A6LL3B A6LM3B A7RL1B A11LL1B A11RM1B A12LL1B A12RM1B
G 30 A8LM2T A7LM2T A6LL4T A6LM4T A7RL2T A11LL2T A11RM2T A12LL2T A12RM4T
H 35 A8LM2B A7LM2B A6LL4B A6LM4B A7RL2B A11LL2B A11RM2B A12LL2B A12RM4B
20% 5 15 15 LPS C .05 C .05 C
20% 5 15 15 LPS C .05 C .05 C
20% 5 15 15 LPS C .05 C .05 C
20% 5 15 15 LPS C .05 C .05 C
.1 10 5 10 15 20 .1 20 .1
.1 10 5 10 15 20 .1 20 .1
.1 10 5 10 15 20 .1 20 .1
.1 10 5 10 15 20 .1 20 .1
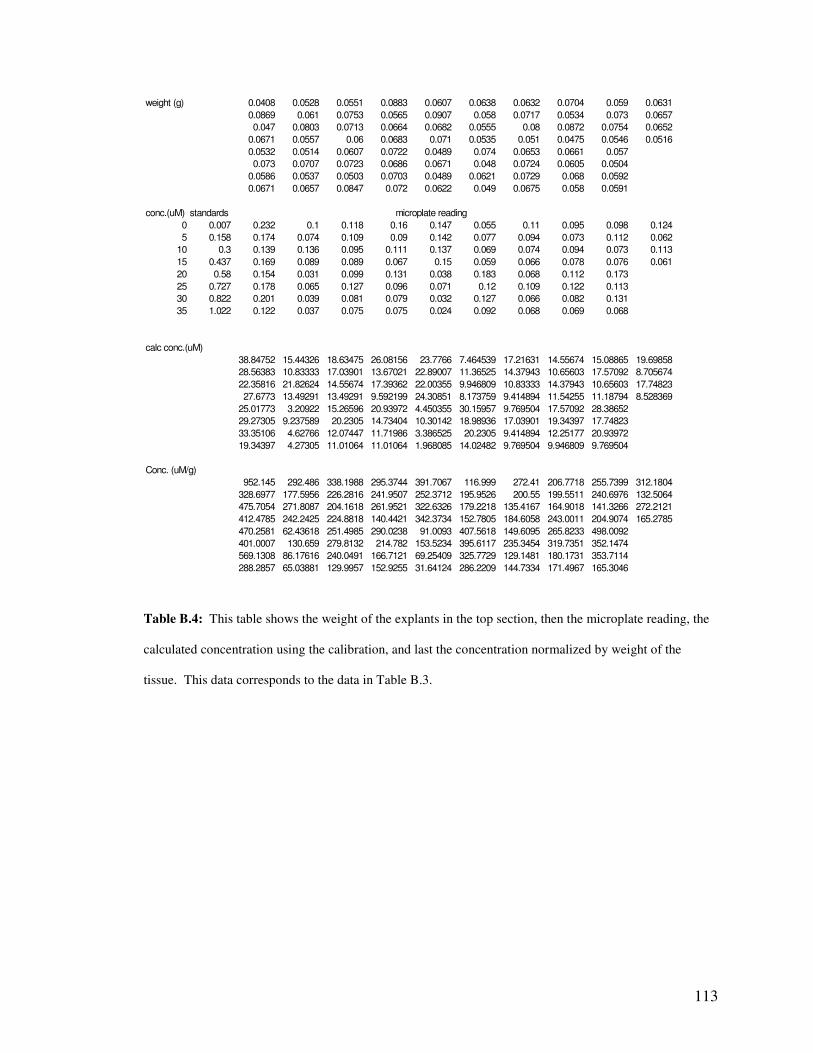
113
Table B.4: This table shows the weight of the explants in the top section, then the microplate reading, the
calculated concentration using the calibration, and last the concentration normalized by weight of the
tissue. This data corresponds to the data in Table B.3.
weight (g) 0.0408 0.0528 0.0551 0.0883 0.0607 0.0638 0.0632 0.0704 0.059 0.0631
0.0869 0.061 0.0753 0.0565 0.0907 0.058 0.0717 0.0534 0.073 0.0657
0.047 0.0803 0.0713 0.0664 0.0682 0.0555 0.08 0.0872 0.0754 0.0652
0.0671 0.0557 0.06 0.0683 0.071 0.0535 0.051 0.0475 0.0546 0.0516
0.0532 0.0514 0.0607 0.0722 0.0489 0.074 0.0653 0.0661 0.057
0.073 0.0707 0.0723 0.0686 0.0671 0.048 0.0724 0.0605 0.0504
0.0586 0.0537 0.0503 0.0703 0.0489 0.0621 0.0729 0.068 0.0592
0.0671 0.0657 0.0847 0.072 0.0622 0.049 0.0675 0.058 0.0591
conc.(uM) standards
0 0.007 0.232 0.1 0.118 0.16 0.147 0.055 0.11 0.095 0.098 0.124
5 0.158 0.174 0.074 0.109 0.09 0.142 0.077 0.094 0.073 0.112 0.062
10 0.3 0.139 0.136 0.095 0.111 0.137 0.069 0.074 0.094 0.073 0.113
15 0.437 0.169 0.089 0.089 0.067 0.15 0.059 0.066 0.078 0.076 0.061
20 0.58 0.154 0.031 0.099 0.131 0.038 0.183 0.068 0.112 0.173
25 0.727 0.178 0.065 0.127 0.096 0.071 0.12 0.109 0.122 0.113
30 0.822 0.201 0.039 0.081 0.079 0.032 0.127 0.066 0.082 0.131
35 1.022 0.122 0.037 0.075 0.075 0.024 0.092 0.068 0.069 0.068
calc conc.(uM)
38.84752 15.44326 18.63475 26.08156 23.7766 7.464539 17.21631 14.55674 15.08865 19.69858
28.56383 10.83333 17.03901 13.67021 22.89007 11.36525 14.37943 10.65603 17.57092 8.705674
22.35816 21.82624 14.55674 17.39362 22.00355 9.946809 10.83333 14.37943 10.65603 17.74823
27.6773 13.49291 13.49291 9.592199 24.30851 8.173759 9.414894 11.54255 11.18794 8.528369
25.01773 3.20922 15.26596 20.93972 4.450355 30.15957 9.769504 17.57092 28.38652
29.27305 9.237589 20.2305 14.73404 10.30142 18.98936 17.03901 19.34397 17.74823
33.35106 4.62766 12.07447 11.71986 3.386525 20.2305 9.414894 12.25177 20.93972
19.34397 4.27305 11.01064 11.01064 1.968085 14.02482 9.769504 9.946809 9.769504
Conc. (uM/g)
952.145 292.486 338.1988 295.3744 391.7067 116.999 272.41 206.7718 255.7399 312.1804
328.6977 177.5956 226.2816 241.9507 252.3712 195.9526 200.55 199.5511 240.6976 132.5064
475.7054 271.8087 204.1618 261.9521 322.6326 179.2218 135.4167 164.9018 141.3266 272.2121
412.4785 242.2425 224.8818 140.4421 342.3734 152.7805 184.6058 243.0011 204.9074 165.2785
470.2581 62.43618 251.4985 290.0238 91.0093 407.5618 149.6095 265.8233 498.0092
401.0007 130.659 279.8132 214.782 153.5234 395.6117 235.3454 319.7351 352.1474
569.1308 86.17616 240.0491 166.7121 69.25409 325.7729 129.1481 180.1731 353.7114
288.2857 65.03881 129.9957 152.9255 31.64124 286.2209 144.7334 171.4967 165.3046
microplate reading
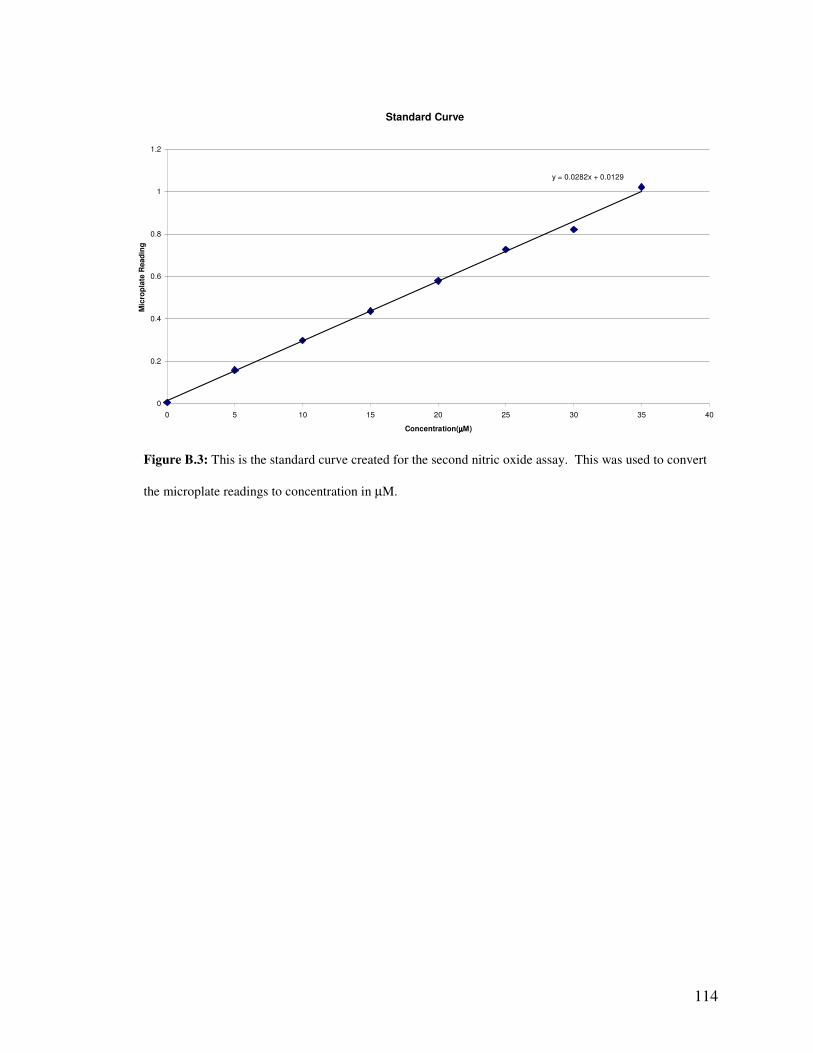
114
Figure B.3: This is the standard curve created for the second nitric oxide assay. This was used to convert
the microplate readings to concentration in µM.
Standard Curve
y = 0.0282x + 0.0129
0
0.2
0.4
0.6
0.8
1
1.2
0 5 10 15 20 25 30 35 40
Concentration(µµµµM)
Mic
rop
late
Read
ing
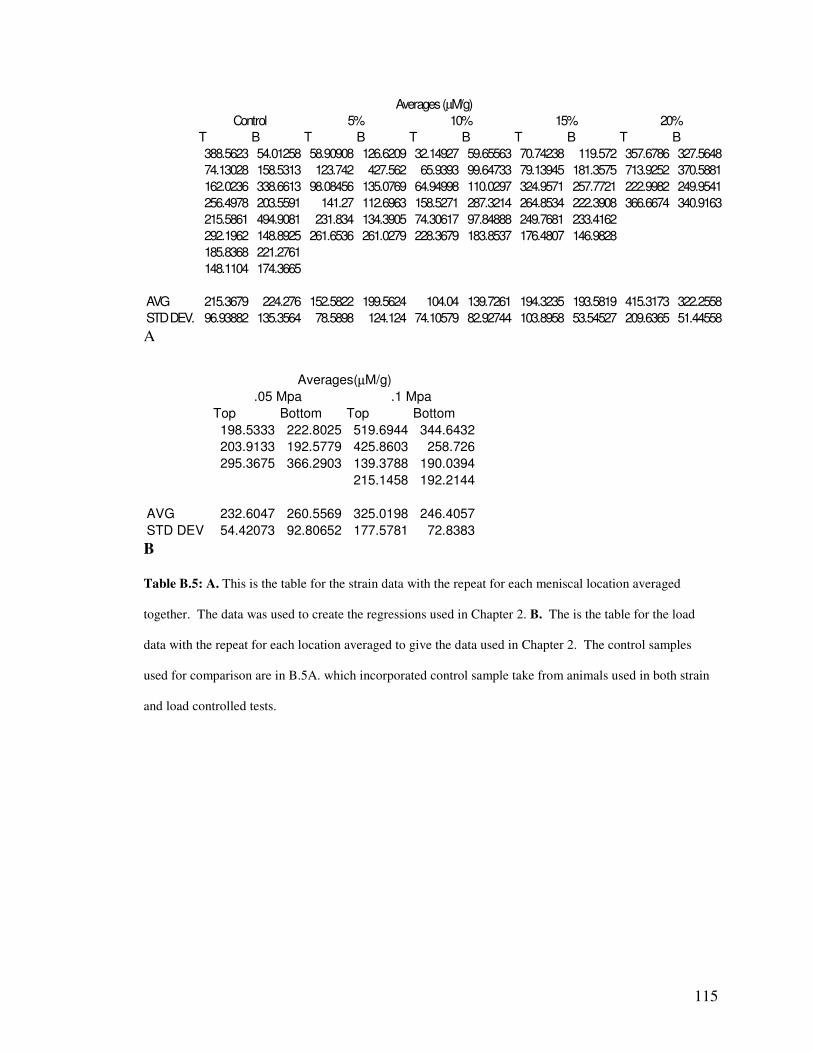
115
A
B
Table B.5: A. This is the table for the strain data with the repeat for each meniscal location averaged
together. The data was used to create the regressions used in Chapter 2. B. The is the table for the load
data with the repeat for each location averaged to give the data used in Chapter 2. The control samples
used for comparison are in B.5A. which incorporated control sample take from animals used in both strain
and load controlled tests.
T B T B T B T B T B
388.5623 54.01258 58.90908 126.6209 32.14927 59.65563 70.74238 119.572 357.6786 327.5648
74.13028 158.5313 123.742 427.562 65.9393 99.64733 79.13945 181.3575 713.9252 370.5881
162.0236 338.6613 98.08456 135.0769 64.94998 110.0297 324.9571 257.7721 222.9982 249.9541
256.4978 203.5591 141.27 112.6963 158.5271 287.3214 264.8534 222.3908 366.6674 340.9163
215.5861 494.9081 231.834 134.3905 74.30617 97.84888 249.7681 233.4162
292.1962 148.8925 261.6536 261.0279 228.3679 183.8537 176.4807 146.9828
185.8368 221.2761
148.1104 174.3665
AVG 215.3679 224.276 152.5822 199.5624 104.04 139.7261 194.3235 193.5819 415.3173 322.2558
STD DEV. 96.93882 135.3564 78.5898 124.124 74.10579 82.92744 103.8958 53.54527 209.6365 51.44558
Averages (µM/g)
20%Control 5% 10% 15%
Top Bottom Top Bottom
198.5333 222.8025 519.6944 344.6432
203.9133 192.5779 425.8603 258.726
295.3675 366.2903 139.3788 190.0394
215.1458 192.2144
AVG 232.6047 260.5569 325.0198 246.4057
STD DEV 54.42073 92.80652 177.5781 72.8383
Averages(µM/g)
.1 Mpa.05 Mpa