Embed Size (px)
Citation preview

Acta hydrochim. hydrobiol. 2006, 34, 305–324 T. Petzoldt et al. 305
Review
Nitrogen emissions into freshwater ecosystems: is there aneed for nitrate elimination in all wastewater treatment plants?
Thomas Petzoldta, Dietrich Uhlmannb
a Technische Universit!t Dresden, Institut f"r Hydrobiologie, Dresdenb Technische Universit!t Dresden und S!chsische Akademie der Wissenschaften zu Leipzig, Dresden
Excessive inputs of phosphorus and nitrogen are the main reasons of eutrophication of inlandwaters and coastal areas. Large efforts have been made to control phosphorus, but the measuresto reduce nitrogen emissions failed at least partly. While it was possible to reduce nitrogen emis-sions from industry and municipal wastewater treatment plants, diffuse sources are showingonly very minor decline. Examples of limnetic, marine and coastal systems are given to reviewthe current knowledge about nitrogen transformation and the effects of nitrate in the environ-ment. When N is the limiting nutrient in a particular water body, this does not necessarilymean that phytoplankton is controllable by NO3
– removal. In systems with problems due to ahigh redox-sensitive internal phosphorus load and under certain constraints, nitrate may beused as an ecotechnological measure to prevent anaerobic phosphorus release from sediments.Model simulations are used to demonstrate this. A schematic model of redox-mediated temporalphosphorus storage in riverine lake sediments with short retention time is proposed. We con-clude that while anthropogenic nitrogen emissions are a global problem, no fast and simple sin-gle solution exists. Additional nitrogen removal in wastewater treatment will have no effect, aslong as diffuse sources and nitrate concentrations in groundwater remain at a high level. Emis-sion reductions should be achieved in an integrated way, taking direct and indirect effects intoaccount. In this sense, case by case decisions and a new definition of “sensitive areas” are re-quired.
Keywords: Nitrogen / diffuse source / drinking water reservoir / ecotechnology / eutrophication control / model simula-tion /
Received: May 26, 2005; accepted: March 1, 2006
DOI 10.1002/aheh.200500638
1 Introduction
Excessive inputs of phosphorus and nitrogen areregarded as the main causes of eutrophication of inlandwaters and coastal areas [1–4] and nitrate can be seen asan important contaminant of drinking water resources(groundwater and surface water reservoirs). After anintensive period of research during the 1960s and 1970s,the OECD study of Vollenweider and Kerekes [1] about“Eutrophication of Waters” identified phosphorus as the
main limiting nutrient of phytoplankton growth ininland waters. After that, the use of phosphorus in deter-gents was limited by law inmost European countries andin North America, numerous industries moved to cleanerprocesses and the larger wastewater treatment plantswere upgraded with a tertiary treatment step with che-mical or biological phosphorus elimination. As a resultof this, phosphorus emissions were reduced substan-tially, e.g. in Germany from 93 540 t a–1 (in 1983–1987)down to 37 250 t a–1 (in 1993–1997) [5] and in the coun-tries of the European Union the phosphorus concentra-tions in rivers generally declined by 30…40% during the1990s, especially in the countries with high average Pconcentrations at the beginning of the 1990s [6].
Correspondence: Thomas Petzoldt, Technische Universit!t Dresden, In-stitut f"r Hydrobiologie, Helmholtzstr. 10, 01069 Dresden, GermanyE-mail: [email protected]: +49 351 46337108
i 2006WILEY-VCH Verlag GmbH &Co. KGaA,Weinheim

306 T. Petzoldt et al. Acta hydrochim. hydrobiol. 2006, 34, 305–324
In contrast to this, themeasures failed at least partly incontrollingnitrogen emissions. Nitrogen emissions to theGerman catchments declined from 1 084 580 to 818 630t a–1, that is by only 32% compared with the reduction ofphosphorus (60% reduction). We argue that there is a dis-crepancy between nutrient reduction and progress ineutrophication control and therefore want to discuss,using examples of limnetic, coastal and marine systems,whether the nitrogen reduction has fulfilled its objec-tives. Instead of focussing on load reduction and the emis-sion principle, this overview focuses on the nitrogen loadof water bodies, its effects and transformation mecha-nisms. The measures undertaken are discussed withrespect to the goal of eutrophication control, to whichextent they proved effective in reaching it, what the per-spectives are andwhat canbedone inparticular cases.
2 Sources of nitrate
Molecular nitrogen (N2) is a relatively inert gas, but itsreduced (NH3, NH4
+) or oxidised inorganic compounds(NO3
–, NO2–, N2O, NOx) are highly reactive. In general, the
conversion from the molecular to the reactive forms iseither an energy consuming reductive process (biologicalnitrogen fixation, industrial fertilizer production) oroccurs as by-product of oxidation processes, e.g. micro-bial mineralisation of organic matter, burning of fossilbiomass (fuel, coal), combustion processes at high tem-peratures (in car engines and industry), lightning fromthunderstorms, volcanic activity or comet impacts [7].In addition to the natural nitrogen cycle (background
loading), nitrogen is released to the environment due tohuman activity from point and nonpoint sources, wherelarge direct wastewater discharges from industry andurban areas, municipal and industrial treatment plants,storm sewer outfalls from larger cities (>100 000 inhabi-tants) and runoff and leachate from waste disposal sitesand from animal feedlots are usually regarded as pointsources. In contrast, agricultural runoff, erosion, soilleaching, tile drainage, subsurface flow, atmosphericdeposition and organic matter decomposition areregarded as nonpoint sources. However, the nomencla-ture is less stringent with regard to small tributaries,urban runoff from sewered areas with less than 100 000inhabitants and small wastewater treatment plants [5, 8].According to Behrendt et al. [5] all municipal wastewatertreatment plants and direct industrial discharges areclassified as point sources. Small tributaries, tile drai-nage, groundwater exfiltration, surface runoff, erosionof agricultural areas and atmospheric deposition thoughshould be regarded as diffuse sources.
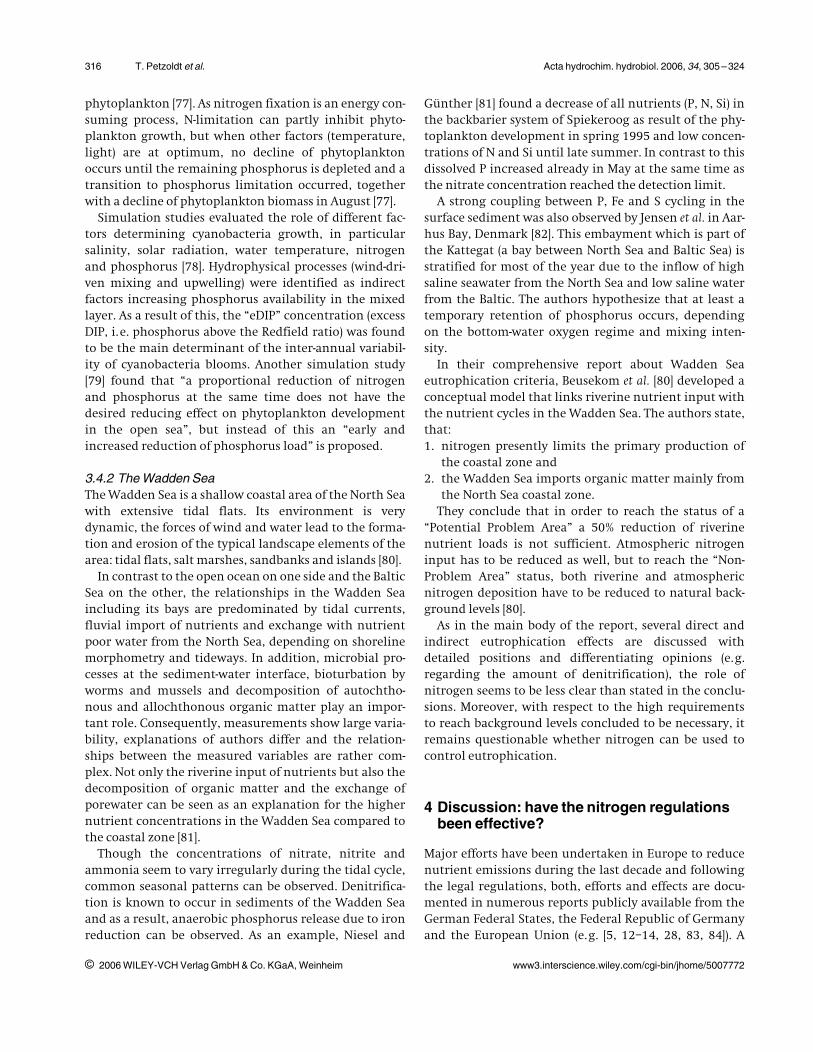
2.1 The role of diffuse sourcesNumerous governmental studies exist all over the world,which quantify point and diffuse loads on a regionalbasis ([9–14], and many others), or try to estimate thedifferent pathways, for example the Lotic Intersite Pro-ject (LINX, http://www.biol.vt.edu/faculty/webster/linx/)which is part of the US Long Term Ecological ResearchNetwork, (LTER, [8]) or the German study by Behrendt etal. [5]. In the latter study the authors estimated nutrientemissions into 300 German river basins using availablehydrological and water quality data and the GIS basedmodel system MONERIS (MOdelling Nutrient Emissionsinto RIver Systems). Two periods, 1983–1987 and 1993–1997, were compared. The authors found that whilephosphorus emissions were reduced substantially (60%),nitrogen was reduced only by 25%, which means that themeasures taken failed to meet the goal of a 50% reduc-tion. Distinguishing the nitrogen input by sourcesrevealed that 50% of the point emissions but only 10% ofthe diffuse entries could be reduced. The main reduc-tions were attributed to direct industrial discharge (79%reduction), municipal wastewater treatment plants (33%reduction) and tile drainage (28% reduction) but theinfluence of contaminated groundwater remained at ahigh level of about 50% of the total nitrogen load (Fig. 1).All point sources together amounted to about 30%.The situation is quite similar in other areas, for exam-
ple in the nine countries of the Baltic Sea catchment,where the point sources are estimated to contribute only10% to the total load, diffuse sources to 60% and back-ground load to 30% of the total nitrogen load [15].Similarly, in the United States nonpoint sources are
the major source of water pollution and they are certainto increase in the future if current practices continue [8].It is assumed that even if point inputs were reduced tozero, 72% of the U.S. American eutrophic lakes wouldrequire control of nonpoint phosphorus inputs to meetwater quality standards [16]. In contrast to the opinionoccasionally expressed during the last years, Carpenter etal. [8] note that eutrophication is still the most wide-spread water quality problem in the U.S. and many othercountries. While large efforts have been made to controlpoint sources, nonpoint inputs are often overlooked. Onthe global scale, human activity has approximatelydoubled the rate of nitrogen input into the terrestrialnitrogen cycle [17]. Most of the anthropogenic enhance-ment of N2 fixation is related to food production and theother major source is fossil fuel combustion which isexpected to increase markedly during the next decades,especially in the developing world [17, 18]. According tothe estimates of Galloway et al. [18], anthropogenic crea-tion of reactive nitrogen globally increased from about
i 2006WILEY-VCH Verlag GmbH &Co. KGaA,Weinheim www3.interscience.wiley.com/cgi-bin/jhome/5007772

Acta hydrochim. hydrobiol. 2006, 34, 305–324 Nitrogen emissions and nitrate elimination 307
15 Mio t a–1 (1860) to approximately 156 Mio t a–1 in theearly 1990s and may increase up to 270 Mio t a–1 N in2050. The authors concluded that the atmospheric emis-sions were twice as high as the riverine N discharge tothe coastal zones in 1995 and that atmospheric emissionswill increase much faster in the future.Boyer et al. [19] examined N inputs and losses for 16
catchments in the northeastern USA (New England) andfound the atmospheric deposition to be the largestsource (60%) in the forested catchments. Over the com-bined total area of all examined catchments, net atmos-pheric deposition was also the largest nitrogen source(31%), followed by net imports of N in food and feed(25%), microbial fixation in agricultural lands (24%), ferti-lizer use (15%), and microbial fixation in forests (5%). Thecombined effect of fertilizer use, agricultural fixationand animal feed imports made agriculture the largestoverall source of N. Riverine export of N is well correlatedwith N inputs, but it accounts for a comparatively smallfraction (25%) of the total N input.Regarding the nitrogen fertilization efficiency of agri-
culture, Isermann and Isermann [20] found an efficiencyof plant production of between 60% and 70% in the coun-tries of Western Europe, but for the overall budget thisrelatively high utilization value is of little relevancebecause 85% of the total plant production is utilized inanimal production, which has an efficiency of only 13%.Thus, the overall N efficiency of EU agriculture amountsto only 20 to 30%.
2.2 Legal regulationsEuropean and national regulations exist to control nitro-gen pollution in drinking water, in the environment (in
agriculture and in groundwater) and in municipal waste-water treatment plants. The European Water FrameworkDirective (2000/60/EG) [21] references to the NitratesDirective (1991/676/EWG) [22], the Urban Waste WaterDirective (1991/271/EWG) [23] and the directive for Inte-grated Pollution Prevention and Control (IPPC directive,European Union 1996) [24], where “nitrates and phos-phates” are listed in annex III together with toxic andoxygen consuming substances as main polluting sub-stances of water.The Drinking Water Directive of the European Union
(98/83/EC) sets amaximum allowable concentration of 50mg L–1 for nitrate, 0.5 mg L–1 for nitrite and 0.5 mg L–1 forammonium [25]. In addition the Nitrates Directive of theEuropean Union (91/676/EEC) requests 14 member statesto identify groundwaters that contain more than 50 mgL–1nitrate or could contain more than 50mg L–1 nitrate ifpreventive measures are not taken [22]. For agriculture,this directive sets a limit for the amount of livestockman-ure applied to land each year at 170 kg N per hectareincluding themanure of the animals themselves [22].The urban wastewater directive (91/271/EWG) states
that whereas in some “less sensitive areas” primary treat-ment could be considered appropriate, a more stringenttreatment is required in “sensitive areas” [23]. Sensitiveareas are defined as natural freshwater lakes, other fresh-water bodies, estuaries and coastal waters which arefound to be eutrophic or which in the near future maybecome eutrophic if protective action is not taken. Thedirective defines permissible limits for all wastewatertreatment plants for BOD, COD and suspended solids.Additional nitrogen and phosphorus removal is requiredfor discharges from urban wastewater treatment plants
i 2006WILEY-VCH Verlag GmbH &Co. KGaA,Weinheim www3.interscience.wiley.com/cgi-bin/jhome/5007772
Figure 1. Sources of nitrogen in German catchment areas. Data source: Umweltbundesamt [5].

308 T. Petzoldt et al. Acta hydrochim. hydrobiol. 2006, 34, 305–324
to those sensitive areas which are subject to eutrophica-tion. For agglomerations with more than 10 000 popula-tion equivalents (p.e.) discharging to sensitive areas con-crete permissible limits are given, where one or both ofthe limit values for phosphorus and nitrogen may beapplied depending on the local situation and the valuesfor concentration or for the percentage of reduction shallapply. The limit values are 2 mg L–1 P and 15 mg L–1 N foragglomerations with 10 000 to 100 000 p.e. and 1 mg L–1
P and 10 mg L–1 N for agglomerations with more than100 000 p.e. or 80% reduction for phosphorus and70…80% for nitrogen.The removal of phosphorus should be included in the
wastewater treatment process in particular in areas withlakes, reservoirs and closed bays which are found to havea low water exchange and where accumulation may takeplace, unless it can be demonstrated that the removalwill have no effect on the level of eutrophication.For nitrogen it is stated, that “where discharges from
large agglomerations are made, the removal of nitrogenmay also be considered”. Furthermore, and this is manda-tory, nitrate has to be removed where surface freshwatersor groundwater resources are intended for the abstrac-tion of drinking water and if a considerable risk toexceed the allowed concentration of nitrate exists.All European Directives mentioned so far have corre-
sponding regulations in Germany, e.g. the DrinkingWater Ordinance [26] or the Wastewater TreatmentOrdinance [27]. Since 2001 the entirety of Germany hasbeen designated as a sensitive area, with the onlyexemption being the Danube catchment [28]. Germany,similar to neighbouring countries like Luxembourg andthe Netherlands, did not assess wastewater treatmentfor each agglomeration concerned (with populationequivalents of more than 10 000 discharging to a sensi-tive area), but achieved 90% of phosphorus and 74% ofnitrogen reduction in 1999, which is for phosphorusmore than and for nitrogen close to the requested 75%load reduction.According to the EEA (European Environment Agency)
[6] there has been considerable progress over the last twodecades in reducing discharges from point sources, suchas wastewater treatment plants and industrial sites. How-ever, there has been far less success in controlling dis-charges from diffuse sources, in particular agriculture.The implementation of the Nitrates Directive is thereforeregarded to be “unsatisfactory in most member statesand further changes are required in agricultural prac-tices to reduce nutrient pollution”. It is stated that theproper and full implementation of the Urban WasteWater and of the Nitrates Directives is considered animportant positive factor in reducing eutrophication.
3 Effects of nitrate in aquatic environments
3.1 General mechanismsNitrogen is an essential macro nutrient for all plants andconstitutes about 1…10% of plant dry mass. Several path-ways of biochemical conversion exist in the nitrogencycle, namely assimilation by plants, ammonificationduring biomass decay, the conversion of nitrate toammonia by nitrate ammonification and the auto-trophic conversion of ammonia to nitrate (nitrification).Moreover, and in contrast to the phosphorus cycle, nitro-gen can be fixed from atmospheric molecular nitrogenby specialized bacteria and cyanobacteria via an energy(ATP) consuming process and in the opposite direction,nitrate can be used as the terminal electron acceptorinstead of oxygen in the electron transport chain ofmany heterotrophic bacteria. The reaction, which goesover multiple steps with nitrite (NO2
–), nitric and nitrousoxide (NO, N2O) as intermediates and molecular nitrogenas the final product, results in a substantial loss of bio-available nitrogen under low-oxygen conditions. In com-mon, molecular nitrogen (N2) and nitrate (NO3
–) are thestable and non-toxic end products, but two intermediatesof the nitrogen cycle, ammonia (NH3), formed fromammonium at high pH and nitrite (NO2
–) are known to betoxic to water organisms, cattle and humans. Due to thefact that nitrite formation can occur also in the stomachof humans, high nitrate concentrations in drinkingwater should be avoided, in particular for infants lessthen about six months old, who are most susceptible. Astheir stomach content is less acidic and fetal haemoglo-bin has a higher affinity to nitrite, increased nitrate con-centrations may cause methemoglobinemia, althoughrecent assessments of the available evidence indicatethat inmost known cases of this illness, gastrointenstinalinfections exacerbated the conversion from nitrate tonitrite [29]. A carcinogenic effect of nitrite due to the for-mation of nitrosamines in the stomach was discussedtoo, but a larger fraction of nitrite exposure results fromfood, and WHO assesses the weight of evidence stronglyagainst any association between nitrate and nitrite expo-sure in humans and the risk of cancer [29].As the nitrite consuming steps of denitrification
usually dominate nitrite production due to the higherenergy gain, nitrite in waters is commonly observed onlyin very low concentrations, although under special cir-cumstances (incompletedenitrificationdue towater exfil-tration from anaerobic river sediments to the aeratedflowing water), occurrences of elevated nitrite concentra-tions in the toxic rangehavebeen reported [30–32].While there is consensus on the objective of preventing
high nitrogen concentrations from occurring in drink-
i 2006WILEY-VCH Verlag GmbH &Co. KGaA,Weinheim www3.interscience.wiley.com/cgi-bin/jhome/5007772

Acta hydrochim. hydrobiol. 2006, 34, 305–324 Nitrogen emissions and nitrate elimination 309
ing water resources (groundwater, drinking water reser-voirs and lakes), the consequences for eutrophication aresubject to controversial discussions. Whereas nitrogenitself is a macronutrient, nitrate is also an oxidizingagent stabilizing the oxidised state of lake and river sedi-ments and therefore acts as an antagonist to the releaseof immobilized (i.e. physico-chemically bound) phos-phorus. A second important argument is the open char-acter of the nitrogen cycle, where denitrification on oneside and nitrogen fixation on the other may result in aself-regulation of nitrogen concentrations of waters andtherefore undermine efforts of nitrate management andcontrol.As a contribution to assessing potential benefits from
nitrate emissions versus their potential harm, in the fol-lowing we first look at the two extremes, highly dis-turbed freshwater systems on one side and the openocean less influenced by human nitrogen import on theother. In a second step, we use the example of the BalticSea and the Wadden See to discuss whether measures toreduce the anthropogenic nitrogen load are likely tosolve the eutrophication problems in coastal areas.
3.2 Freshwater systemsFreshwater ecosystems receive their nitrogen loaddirectly from the different natural and anthropogenicsources (see section 2). The N:P ratio of most of the fresh-
water ecosystems is well above 16:1 due to the higheravailability and mobility of N in comparison to P. It iswidely accepted among limnologists that for the major-ity of lakes, rivers and reservoirs in temperate Europeanregions P is the limiting factor and N limitation poten-tially occurs only in few specific situations, in particularin highly eutrophic systems during summer, as a resultof high denitrification. Where N limitation prevails for asufficient time span, this may lead to the dominance ofN2-fixing cyanobacteria which can overcome this limita-tion. For these reasons, in most of Europe eutrophicationcontrol for freshwaters has focused on intensifying P-elimination and it is regarded impractical to control phy-toplankton development via N limitation.Eutrophic systems exhibit a high denitrifying poten-
tial. As an example, Mengis et al. [33] estimated that Swisslakes eliminated 10000 to 15000 t a–1 N, that is 10 to 15%of the N export from Switzerland via the main rivers andan amount comparable to the total amount of nitrogeneliminated by Swiss wastewater treatment plants (20%).In the Berlin area, an urban agglomeration draining intoa network of slow-flowing rivers (Dahme, Spree, Havel),channels and riverine lakes, approximately 36% of thetotal N load of 7.670 t a–1 is eliminated via denitrification(data from 1995–1997) [34].In other systems an even higher N elimination poten-
tial can be found. As an example, we estimated a denitri-
i 2006WILEY-VCH Verlag GmbH &Co. KGaA,Weinheim www3.interscience.wiley.com/cgi-bin/jhome/5007772
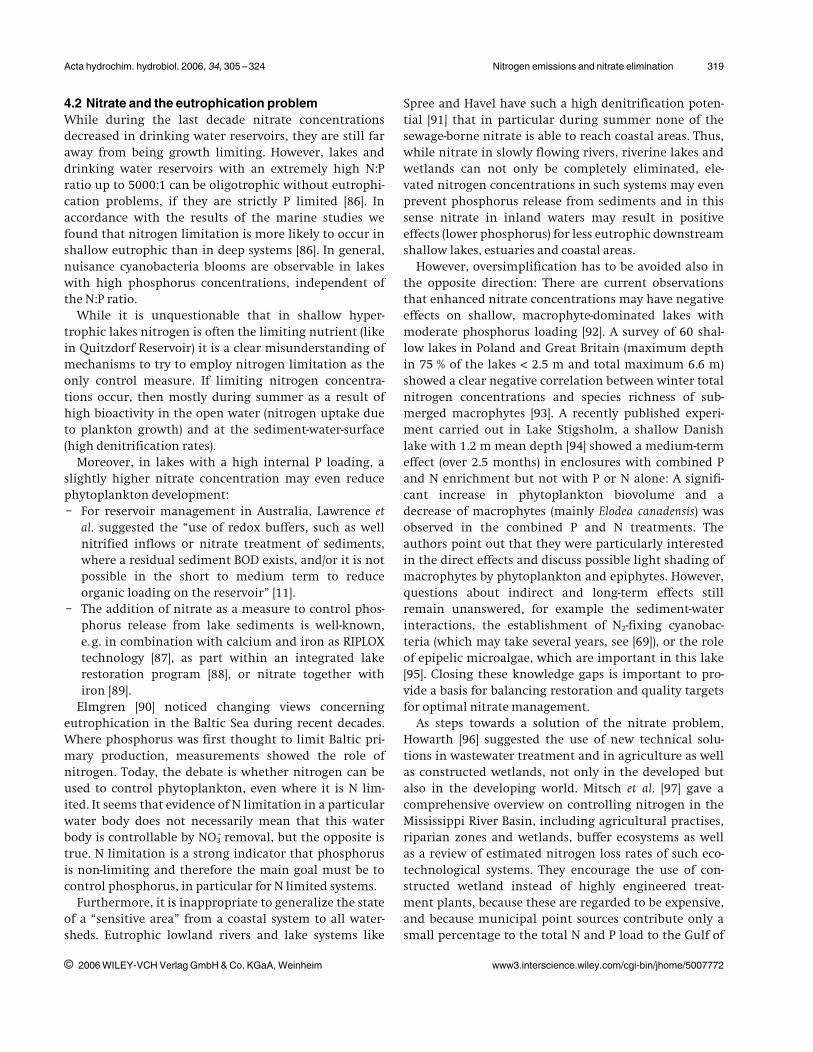
Figure 2. Location of the study site Quitzdorf Reservoir within the Spree watershed. Left: The lowland areas northeast to the riverElbe differ from the other areas due to a higher number of lakes and rivers with low discharge. GIS data: USGS [39].

310 T. Petzoldt et al. Acta hydrochim. hydrobiol. 2006, 34, 305–324
fication potential of about 50% for the hypertrophic Baut-zen Reservoir (own data and data of LTV Sachsen, loca-tion, see Fig. 2) and Campbell et al. [35] found a meanvalue of nitrogen elimination in 24 forested watershedsin the USA of about 70% (range between 24% and almost100%).
3.2.1 Simulation of the nitrogen budget of a shallowreservoir
The data presented so far are all based on hydrologicaldischarge and mass-balance models, e.g. MONERIS [5],which already contain basic transformation processeslike nitrogen uptake by plants, nitrification of ammoniaor denitrification of nitrate in the soil, and release ofnitrogen (N2) and nitrous oxide (N2O) to the atmosphere.Ecological simulation models of rivers and lakes extendthis mass balance approach by other transformation pro-cesses like nutrient uptake and phytoplankton growth,sedimentation, sediment related processes and, mostimportant, indirect relationships between the state vari-ables involved, e.g. food web relationships or redox con-ditions at the sediment-water interface. Despite the factthat all models and in particular ecological models arestrong simplifications of reality and that it is not yet pos-sible to rely on their forecasts without further discussionand interpretation, there is no better means to take thedirect and indirect effects and transformations intoaccount. In particular varying environmental conditions(boundary conditions, e.g. weather) and the dynamicsgenerated in the system itself (e.g. stratification or phyto-plankton growth) would be neglected otherwise.As an example for how the availability or lack of
nitrate may be able to control the water quality (espe-cially phytoplankton biomass), selected scenarios for ashallow reservoir are presented.
3.2.1.1 ThemodelThemodel SALMO [36, 37] is a food web andmass-balancemodel for lakes and reservoirs. It can be used to simulatethe effects of external sources of nutrients and organicmatter as well as internal measures under varying hydro-logical and meteorological conditions. SALMO is anordinary differential equation model with the state vari-ables dissolved inorganic phosphorus (DIP), dissolvedinorganic nitrogen (DIN), phytoplankton (two or threefunctional groups), zooplankton (one group), allochtho-nous suspended organic matter and dissolved oxygen.Input variables are lake water level, water inflow, importof DIP and DIN, solar radiation, water temperatures andstratification conditions. A vertically resolved, hydrody-namic-ecological coupled 1D version was recently devel-oped (GETAS) [38], but in the box-version applied here,
the model consists of one or two horizontally averagedlayers.The complex interactions are determined by a set of
algebraic functions and parameters which are derivedmostly from laboratory experiments. In contrast to thesmall number of differential equations, the number ofconstant parameters (more than 100) is relatively largeand one of the main reasons why the model can beapplied to lakes and reservoirs with different morpho-metric and trophic characteristics. In general, a lake spe-cific calibration is not performed, which obviouslyresults in visual deviations between simulations andmeasurements, but in most cases good agreement withseasonal patterns is reached.
3.2.1.2 Quitzdorf Reservoir: input data and assumptionsQuitzdorf Reservoir is a shallow and strongly wind-exposed man made lake in the south-eastern part of Ger-many, within the watershed of the river Spree (Fig. 2[39]). The reservoir has an area of 750 ha, a water volumeof 22.5 Mio m3 and a mean residence time of approxi-mately 193 days. Its mean depth is approximately 2.5 mand its maximum depth approximately 7 m. The reser-voir is used for low flow augmentation of the Spree sys-tem and for recreational purposes, but due to the hyper-trophic state, water quality problems, especially bloomsof cyanobacteria (blue-green algae) are frequentlyobserved. Substantial efforts have been made to reducethe external load of phosphorus and nitrogen since1990, but after an initial decrease of phytoplankton bio-volume until the mid-nineties, cyanobacteria bloomsstill remain a problem. In particular peak biovoluminaappear to increase and the start of the mass developmentof cyanobacteria is accelerated from late summer in themid nineties to early summer currently (LTV Sachsen,unpublished data).The simulations are based on hydrological and water
quality data provided by the Saxonian reservoir author-ity (Landestalsperrenverwaltung Sachsen, LTV), namelywater level, water inflow and outflow, concentrations ofDIP, DIN and particulate organic matter (POM) in themain tributaries and lake water temperature as inputdata and concentrations of DIP, DIN, oxygen, phyto- andzooplankton as validation data. Meteorological data (glo-bal radiation) was supplied by Germany’s nationalmeteorological service (Deutscher Wetterdienst). More-over additional insight was taken from research pro-grams in 1999 and 2001–2003 [40] and the results ofMaaßen [41].The year 1997 was selected as an example out of a
longer time series, because this year follows after thetransient phase of nutrient reduction after 1990 and is
i 2006WILEY-VCH Verlag GmbH &Co. KGaA,Weinheim www3.interscience.wiley.com/cgi-bin/jhome/5007772

Acta hydrochim. hydrobiol. 2006, 34, 305–324 Nitrogen emissions and nitrate elimination 311
prior to the following application of a new managementschedule with increased water level fluctuation.
3.2.1.3 ScenariosFirst, according to the application philosophy of SALMOa so called “na!ve scenario” (with only standard parame-terisation) was conducted and then a qualified scenario(scenario 1) with system specific processes for shallowlakes was performed, namely an increased denitrifica-tion at the sediment water interface. It is assumed thatorganic substances are sufficiently available in hyper-trophic lake sediments and that instable stratificationand wind-induced turbulence [40] should provide an ade-quate replenishment of nitrate from the water columnto the upper sediment layers. As additional constant agross phosphorus sedimentation rate of 0.05 d–1was usedto account for phosphorus adsorption of the oxidisedsediment surface in particular during winter and surplusphosphorus uptake of bacteria communities occurringas a result of alternating redox conditions [42].An additional problem arose from the polymictic stra-
tification regime of Quitzdorf reservoir, which is highlydynamic and complicated the coupling of the sedimentrelated processes to the oxygen regime of the water col-umn. One solution would be the application of a high-resolution coupled hydrodynamic-ecological model, butthis was not yet available. In addition, such models dorequire more effort, for example hourly wind data.Instead and due to the instable stratification we appliedthe completely mixed one box version of SALMO andused the nitrogen (nitrate) concentration instead of oxy-gen in the water column as an indicator variable of lowredox conditions in the upper sediment layers (scenario2).The justification for this approach is derived from
repeated observations of low oxygen concentrations indeep water layers (open circles in Fig. 3 a) and an almostconstant decrease of DIN (mainly nitrate) from March toAugust. Where oxygen is highly dynamic due to atmos-pheric exchange, photosynthesis and respiration, theturnover of nitrate is much slower because the mainsources of nitrogen are the tributaries (mean residencetime of water in the reservoir is 0.5 years) and the mainsinks are denitrification and uptake by phytoplankton.In reality, the mechanisms surely are more compli-
cated and related to sediment biochemistry, bindingforms of phosphorus and hydrodynamics, but the tradi-tional approach which assumes that anaerobic P releaserequires both, oxygen and nitrate depletion, should holdas a first approximation (upper diagram in Fig. 6). Ana-erobic P release can occur only if the relatively conserva-tive nitrate concentration is at minimum and it should
occur under these conditions, because temporary stratifi-cation events during summer lead to low oxygen condi-tions at the sediment-water interface.With these assumptions, it was possible to link the
empirical P release equation of SALMO to the nitrateinstead of the dissolved oxygen concentration and torecalculate the constants using only stoichiometric rela-tionships and Nernst’s equation (redox potential: Eh
(NO3–/N2) = 1.24 V and Eh (O2/H2O) = 1.13 V). Furthermore, it
could be shown by similar studies that the nitrate linkfor P release was applicable to another shallow reservoiras well [43]. The other sediment related modifications ofthe model – denitrification and P sedimentation – couldbe applied to two other reservoirs (among them the insta-bly stratified Bautzen Reservoir) with identical para-meter sets.In a third scenario we used an alternative functional
phytoplankton group of nitrogen-fixing cyanobacteriawith almost identical parameters as those used for theconventional non N2-fixing cyanobacteria group (Plankto-thrix type), but with the ability to grow without theuptake of nitrate or ammonia with the trade-off of anassumed additional energy cost due to N2 fixation thatreduces the growth rate by 24%.Using these conditions, 4 cumulative scenarios were
defined:Scenario 1: Standard scenario with modifications for
shallow lakes and shallow reservoirs (sedi-ment related denitrification, increased Psedimentation),
Scenario 2: Scenario 1 plus nitrogen dependent phos-phorus release (nitrate-phosphate link),
Scenario 3: Scenario 2 plus cyanobacteria with the abil-ity of N2 fixation,
Scenario 4: Scenario 2 plus 20% increase of the externalnitrate load.
3.2.1.4 Simulation resultsA comparison of the simulation results with measureddata exhibited good agreement between simulated andmeasured oxygen concentrations (scenario 1 in Fig. 3a,closed circles) in the water column and good agreementbetween simulated and measured concentrations of DIN.Due to the one-box approach it was, of course, not possi-ble to simulate the low oxygen concentrations near thebottom, but they are accounted for indirectly via thenitrate-phosphorus link in scenarios 2, 3 and 4. A strongdisagreement between measurements and simulation isvisible for DIP and phytoplankton in scenario 1, butwhen the nitrate-phosphate link is switched on (scenar-ios 2 and 3, Fig. 4), agreement is substantially improved.Under nitrate limiting conditions (Fig. 3b) P release is
i 2006WILEY-VCH Verlag GmbH &Co. KGaA,Weinheim www3.interscience.wiley.com/cgi-bin/jhome/5007772

312 T. Petzoldt et al. Acta hydrochim. hydrobiol. 2006, 34, 305–324
triggered (Fig. 3c) and in parallel to this a phytoplanktonmass development can be observed. There is, however,some delay between the measured and the simulatedphytoplankton development and some fluctuation in themeasured data. It is not clear whether the ability of N2
fixation is needed to explain this behaviour. While N2
fixation in scenario 3 is switched on immediately whenDIN approaches the minimum, cyanobacterial commu-nities in reality need some time for adaptation and selec-tion. Furthermore, there are possible sources of measure-ment errors in the quantitative sampling of phytoplank-ton and in particular of cyanobacteria, because theygrow in large colonies and are known to be affected bypassive horizontal and vertical transportation and activebuoyancy regulation. Despite these uncertainties, thescenarios show very clearly that the maximum of DIPoccurs in coincidence with low DIN concentrations and
that the cyanobacteria bloom is unexplainable withoutan internal source of phosphorus. In addition, scenario 4(Fig. 5) gives evidence that a small increase of externalnitrate import may be sufficient to control P-release inQuitzdorf Reservoir.
3.2.2 Sediment as redox-mediated temporal storage ofphosphorus
The findings of the model simulations are in agreementwith empirical observations by Maaßen [41], who esti-mated anaerobic P-release in Quitzdorf Reservoir usingdialysis samplers [44] and found results supporting thereaction chain of denitrification, phosphorus release andphytoplankton development. There are many otherobservations supporting this mechanism. As an example,in Lake M"ggelsee – a further hypertrophic lake of theRiver Spree System near Berlin – Kleeberg and Dudelobserved an almost identical behaviour with temporaryoxygen depletion at the sediment surface in summeraccompanied by low nitrate and high phosphate concen-trations [45]. Having analysed mass balances and pore-water samples, the authors concluded that P release fromsediments rich in degradable organic substances is asso-ciated with microbial activity, either directly throughmineralisation or indirectly through a decrease of redoxconditions and that nitrate plays an essential role sup-pressing P release in this lake. After the German reunifi-cation, phosphorus and nitrate emissions were dramati-cally reduced, due to the introduction of phosphate freedetergents, upgrading of wastewater treatment plantsand a decrease of fertilizer use in agriculture. However,Kleeberg and Kozerski found that P release increasedafter the external load reduction as a result of a reducedsupply of nitrate to the lake and internal P loading coun-teracted the decreasing external P load [46].
i 2006WILEY-VCH Verlag GmbH &Co. KGaA,Weinheim www3.interscience.wiley.com/cgi-bin/jhome/5007772
Figure 3. Model scenario 1: standard scenario without nitrate-phosphate link. Lines: simulation results; closed circles: meas-urements in the mixed water column; open circles: oxygen nearthe sediment. Data: LTV Sachsen.
Figure 4. Model scenarios 2 and 3: scenarios with nitrate-phos-phate link. Solid lines: scenario 2 without N2-fixing cyanobac-teria; dashed lines: scenario 3 with N2 fixation; closed circles:measurements in the mixed water column; open circles: oxygennear the sediment. Data: LTV Sachsen.
Figure 5. Model scenario 4: scenario with nitrate-phosphate linkand 20% increase of external nitrate load. Symbols see Figure3. Data: LTV Sachsen.

Acta hydrochim. hydrobiol. 2006, 34, 305–324 Nitrogen emissions and nitrate elimination 313
During summer, when the redox conditions (tempor-ary oxygen deficit and low nitrate concentrations) at thesediment-water interface and in the upper sedimentlayers decrease, iron is reduced, and as next step sulfateis reduced to S2–, which replaces phosphorus as bindingpartner of Fe2+. As a result P is released first to the pore-water and from there it diffuses into the water column.Depending on the sediment conditions and lake charac-teristics other processes may contribute to the P releasetoo, in particular aerobic P release in lakes with a lowFe:P ratio [47] or enhanced mineralization of accumu-lated organic matter [48], which may occur after a tem-porary nitrate addition.In lakes which have enough iron in their sediments,
two different situations regarding the internal phos-phorus loading can be distinguished:1. Pronounced internal loading after a successful con-
trol of external P. The phosphorus buried in the pre-restoration period is released and after an exponen-tial decrease of P release over several years, depend-ing on the amount of P, the retention time, the redoxconditions and the sediment characteristics, a newstable equilibrium is reached.
2. A temporary storage mechanism (see Fig. 6) in lakeswhose external P loading is still too high. In this case,particulate phosphorus sedimentation occurs anddissolved phosphorus which is imported during win-ter is immobilized due to adsorption and chemicalbinding at the sediment, which is in an oxidised state(trivalent Fe as binding partner for phosphate and Sas sulfate).
Quitzdorf Reservoir belongs to case 2, which meansthat there is no hope that the internal P loading willdecrease in the future without a substantial externalload reduction.The loading that appears to be internal is in reality a
delayed external loading, which is accumulated duringseveral months in winter and released only a fewmonthslater. Under stratified or temporarily stratified condi-tions and low oxygen and low nitrate concentrations insummer, a large part of this phosphorus enters the pro-ductive zone within only a few weeks, exactly at the timewhen all other growth conditions (temperature, light,high pH value, low nitrogen) favour cyanobacteriablooms.
i 2006WILEY-VCH Verlag GmbH &Co. KGaA,Weinheim www3.interscience.wiley.com/cgi-bin/jhome/5007772
Figure 6. Diagrammatic representation of temporary phosphorus storage in the sediment of shallow lakes. Upper panel: Seasonalchanges in the availability of molecular oxygen and of nitrate at the sediment-water interface. Oxygen is depleted during stagnantperiods and introduced again in intermittent overturn periods. Nitrate is supplied during winter and spring and then gradually con-sumed by denitrification in the warm season. Lower panel: Processes relevant to the immobilization or release, respectively, of phos-phate. OM: organic material. As long as an electron acceptor (O2, NO3
–) is available, phosphate is immobilized. Under reducing con-ditions and with availability of sulfide, iron is immobilized and phosphate released.

314 T. Petzoldt et al. Acta hydrochim. hydrobiol. 2006, 34, 305–324
3.3 Marine systemsIn his classical work, Alfred Redfield [49] noted already in1934, that the molar N:P ratio in Atlantic seawater wasobviously very similar to the elemental composition oforganisms with (on average) 16:1. Though based on rela-tively few observations at the time, this ratio was con-firmed by thousands of independent measurements upto now, e.g. the GEOSECS data set [50]. This large data set,which is publicly available, contains data from expedi-tions in the Atlantic, the Pacific and the Indian Ocean. Inthis data set, the mean elemental ratio is almost constantaround 14.5 (Fig. 7 left, slope of linear regression throughorigin, coefficient of variation = 0.1), with a larger varia-tion of the N:P ratio observed in depths of less than250 m and in the Mediterranean Sea (Fig. 7 right).The Mediterranean Sea is the only one with an anoma-
lously high N:P ratio, which is a result of the restrictedwater exchange with the Atlantic and regarded as a com-bined result of nitrogen fixation and atmospheric deposi-tion of nutrients [51].The N:P relationship of the GEOSECS data set exhibits
several other important characteristics in the oceans[52]:– In general, the N:P ratio in the water lies below the
16:1 ratio of average biomass.– Nitrate runs out slightly before phosphate when
nutrients become depleted in the surface waters.– Nutrient depleted (oligotrophic) waters usually con-
tain a small residue of phosphate, while nitrate isundetectable.Tyrrell’s [52] interpretation of these findings, com-
pared to the results of bottle and enclosure experimentswas, that while for hours or days nitrogen is in fact thelimiting nutrient in the sense of Liebig's law (proximatelimiting nutrient, PLN), phosphorus is the ultimate limit-ing nutrient (ULN), whose supply rate forces total systemproductivity over long timescales. Where the PLN relatesto experiments at the level of cultures and communitycultures, the ULN relates to the results of experiments atthe level of oceans, but also of bays, rivers and lakes. Thismeans that the PLN (phosphorus) defines the maximumlevel of productivity, where nitrogen is under homeo-static control.Using a simulation model with nitrogen and phos-
phorus as nutrients and nitrogen-fixing and non-fixingphytoplankton (with a plausible model parameterisa-tion), he was able to demonstrate that even a doubling ofthe riverine nitrogen import (in contrast to a doubling ofphosphorus import) has no effect on the overall produc-tivity of the ocean, even at geological time scales [52]. Thereason for this phosphorus-controlled equilibrium is theloss of nitrogen by denitrification on one hand and nitro-
gen fixation on the other. Due to the fact that N2 fixationis an energy consuming process, N2-fixing phytoplanktonis outcompeted if the N:P ratio is near the optimum, butat low N:P ratios the contribution of N2 fixers increases,restoring the equilibrium again. Although the debateabout the role of N2 fixers in the open ocean is ongoing,in principle the existence of N2-fixing cyanobacteria inthe ocean was already known for years. As a prominentexample the role of the genus Trichodesmium as a poten-tial nitrogen fixer is under discussion since the 1960s(see review of Capone et al. [53]), but there is recently anincreasing interest due to the ongoing research aboutglobal warming, the nitrogen cycle and the role of nitro-gen fixation in relation to the biological pump in seques-tering atmospheric CO2 [54]. In accordance with histori-cal observations, Tyrrell [55] observed Trichodesmium atseveral locations in the northern tropical Atlantic, wherethe highest abundances were found in regions with ashallow mixed layer and high estimated iron depositionto the surface ocean, preferentially in the region betweenthe equator and approx. 158 N, a region influenced byiron-laden dust from North Africa. N2 fixation rates areestimated at about 0.2mmolm–2d–1 (as N).Although the role of iron stimulating oceanic phyto-
plankton development was demonstrated by several spec-tacular fertilization experiments [56, 57 and others],there is still some controversy as to whether the ultimatefactor limiting nitrification in the ocean is iron [58] orphosphorus and light [59]. On the other hand, when dis-cussing the role of nitrogen, this controversy is lessimportant as iron limitation can cause only a reduction,not full removal of the proximate nitrogen limitation[60]. Both, P and Fe, may act as ultimate limiting factors,but their import pathways (mainly inputs from riversand atmospheric deposition of dust) are correlated in
i 2006WILEY-VCH Verlag GmbH &Co. KGaA,Weinheim www3.interscience.wiley.com/cgi-bin/jhome/5007772
Figure 7. Nitrogen and phosphorus in the ocean from the GEO-SECS data set. Left: N versus P; dashed line: Redfield ratio;solid line: fitted ratio (figure extended and redrawn from originalGEOSECS data [50] according to Tyrrell [51]). Right: N:P ratioversus depth. Surface values show a high variance due to exter-nal import of P and N and biological transformation processes.
Acta hydrochim. hydrobiol. 2006, 34, 305–324 Nitrogen emissions and nitrate elimination 315
most cases. Mills et al. [61] were able to demonstrate co-limitation of nitrogen fixation by P and Fe.Regarding loss processes of nitrogen, not only denitrifi-
cation (mostly in coastal areas but also in other oxygenminimum zones) is important, but also anaerobic ammo-nia oxidation (ANNAMOX), that was first discovered inwastewater treatment plants [62, 63]:
NH4+ + NO2
– fi N2 + 2 H2O
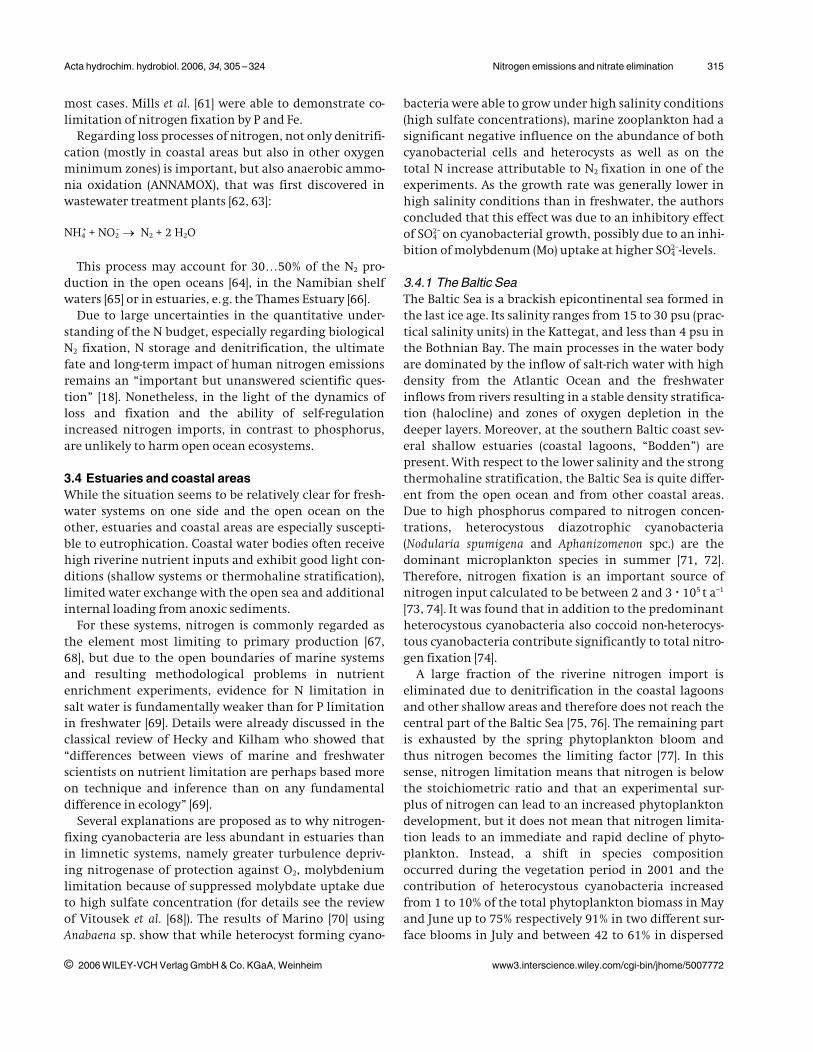
This process may account for 30…50% of the N2 pro-duction in the open oceans [64], in the Namibian shelfwaters [65] or in estuaries, e.g. the Thames Estuary [66].Due to large uncertainties in the quantitative under-
standing of the N budget, especially regarding biologicalN2 fixation, N storage and denitrification, the ultimatefate and long-term impact of human nitrogen emissionsremains an “important but unanswered scientific ques-tion” [18]. Nonetheless, in the light of the dynamics ofloss and fixation and the ability of self-regulationincreased nitrogen imports, in contrast to phosphorus,are unlikely to harm open ocean ecosystems.
3.4 Estuaries and coastal areasWhile the situation seems to be relatively clear for fresh-water systems on one side and the open ocean on theother, estuaries and coastal areas are especially suscepti-ble to eutrophication. Coastal water bodies often receivehigh riverine nutrient inputs and exhibit good light con-ditions (shallow systems or thermohaline stratification),limited water exchange with the open sea and additionalinternal loading from anoxic sediments.For these systems, nitrogen is commonly regarded as
the element most limiting to primary production [67,68], but due to the open boundaries of marine systemsand resulting methodological problems in nutrientenrichment experiments, evidence for N limitation insalt water is fundamentally weaker than for P limitationin freshwater [69]. Details were already discussed in theclassical review of Hecky and Kilham who showed that“differences between views of marine and freshwaterscientists on nutrient limitation are perhaps based moreon technique and inference than on any fundamentaldifference in ecology” [69].Several explanations are proposed as to why nitrogen-
fixing cyanobacteria are less abundant in estuaries thanin limnetic systems, namely greater turbulence depriv-ing nitrogenase of protection against O2, molybdeniumlimitation because of suppressed molybdate uptake dueto high sulfate concentration (for details see the reviewof Vitousek et al. [68]). The results of Marino [70] usingAnabaena sp. show that while heterocyst forming cyano-
bacteria were able to grow under high salinity conditions(high sulfate concentrations), marine zooplankton had asignificant negative influence on the abundance of bothcyanobacterial cells and heterocysts as well as on thetotal N increase attributable to N2 fixation in one of theexperiments. As the growth rate was generally lower inhigh salinity conditions than in freshwater, the authorsconcluded that this effect was due to an inhibitory effectof SO4
2– on cyanobacterial growth, possibly due to an inhi-bition of molybdenum (Mo) uptake at higher SO4
2–-levels.
3.4.1 The Baltic SeaThe Baltic Sea is a brackish epicontinental sea formed inthe last ice age. Its salinity ranges from 15 to 30 psu (prac-tical salinity units) in the Kattegat, and less than 4 psu inthe Bothnian Bay. The main processes in the water bodyare dominated by the inflow of salt-rich water with highdensity from the Atlantic Ocean and the freshwaterinflows from rivers resulting in a stable density stratifica-tion (halocline) and zones of oxygen depletion in thedeeper layers. Moreover, at the southern Baltic coast sev-eral shallow estuaries (coastal lagoons, “Bodden”) arepresent. With respect to the lower salinity and the strongthermohaline stratification, the Baltic Sea is quite differ-ent from the open ocean and from other coastal areas.Due to high phosphorus compared to nitrogen concen-trations, heterocystous diazotrophic cyanobacteria(Nodularia spumigena and Aphanizomenon spc.) are thedominant microplankton species in summer [71, 72].Therefore, nitrogen fixation is an important source ofnitrogen input calculated to be between 2 and 3 N 105 t a–1
[73, 74]. It was found that in addition to the predominantheterocystous cyanobacteria also coccoid non-heterocys-tous cyanobacteria contribute significantly to total nitro-gen fixation [74].A large fraction of the riverine nitrogen import is
eliminated due to denitrification in the coastal lagoonsand other shallow areas and therefore does not reach thecentral part of the Baltic Sea [75, 76]. The remaining partis exhausted by the spring phytoplankton bloom andthus nitrogen becomes the limiting factor [77]. In thissense, nitrogen limitation means that nitrogen is belowthe stoichiometric ratio and that an experimental sur-plus of nitrogen can lead to an increased phytoplanktondevelopment, but it does not mean that nitrogen limita-tion leads to an immediate and rapid decline of phyto-plankton. Instead, a shift in species compositionoccurred during the vegetation period in 2001 and thecontribution of heterocystous cyanobacteria increasedfrom 1 to 10% of the total phytoplankton biomass in Mayand June up to 75% respectively 91% in two different sur-face blooms in July and between 42 to 61% in dispersed
i 2006WILEY-VCH Verlag GmbH &Co. KGaA,Weinheim www3.interscience.wiley.com/cgi-bin/jhome/5007772
316 T. Petzoldt et al. Acta hydrochim. hydrobiol. 2006, 34, 305–324
phytoplankton [77]. As nitrogen fixation is an energy con-suming process, N-limitation can partly inhibit phyto-plankton growth, but when other factors (temperature,light) are at optimum, no decline of phytoplanktonoccurs until the remaining phosphorus is depleted and atransition to phosphorus limitation occurred, togetherwith a decline of phytoplankton biomass in August [77].Simulation studies evaluated the role of different fac-
tors determining cyanobacteria growth, in particularsalinity, solar radiation, water temperature, nitrogenand phosphorus [78]. Hydrophysical processes (wind-dri-ven mixing and upwelling) were identified as indirectfactors increasing phosphorus availability in the mixedlayer. As a result of this, the “eDIP” concentration (excessDIP, i. e. phosphorus above the Redfield ratio) was foundto be the main determinant of the inter-annual variabil-ity of cyanobacteria blooms. Another simulation study[79] found that “a proportional reduction of nitrogenand phosphorus at the same time does not have thedesired reducing effect on phytoplankton developmentin the open sea”, but instead of this an “early andincreased reduction of phosphorus load” is proposed.
3.4.2 TheWadden SeaTheWadden Sea is a shallow coastal area of the North Seawith extensive tidal flats. Its environment is verydynamic, the forces of wind and water lead to the forma-tion and erosion of the typical landscape elements of thearea: tidal flats, salt marshes, sandbanks and islands [80].In contrast to the open ocean on one side and the Baltic
Sea on the other, the relationships in the Wadden Seaincluding its bays are predominated by tidal currents,fluvial import of nutrients and exchange with nutrientpoor water from the North Sea, depending on shorelinemorphometry and tideways. In addition, microbial pro-cesses at the sediment-water interface, bioturbation byworms and mussels and decomposition of autochtho-nous and allochthonous organic matter play an impor-tant role. Consequently, measurements show large varia-bility, explanations of authors differ and the relation-ships between the measured variables are rather com-plex. Not only the riverine input of nutrients but also thedecomposition of organic matter and the exchange ofporewater can be seen as an explanation for the highernutrient concentrations in the Wadden Sea compared tothe coastal zone [81].Though the concentrations of nitrate, nitrite and
ammonia seem to vary irregularly during the tidal cycle,common seasonal patterns can be observed. Denitrifica-tion is known to occur in sediments of the Wadden Seaand as a result, anaerobic phosphorus release due to ironreduction can be observed. As an example, Niesel and
G"nther [81] found a decrease of all nutrients (P, N, Si) inthe backbarier system of Spiekeroog as result of the phy-toplankton development in spring 1995 and low concen-trations of N and Si until late summer. In contrast to thisdissolved P increased already in May at the same time asthe nitrate concentration reached the detection limit.A strong coupling between P, Fe and S cycling in the
surface sediment was also observed by Jensen et al. in Aar-hus Bay, Denmark [82]. This embayment which is part ofthe Kattegat (a bay between North Sea and Baltic Sea) isstratified for most of the year due to the inflow of highsaline seawater from the North Sea and low saline waterfrom the Baltic. The authors hypothesize that at least atemporary retention of phosphorus occurs, dependingon the bottom-water oxygen regime and mixing inten-sity.In their comprehensive report about Wadden Sea
eutrophication criteria, Beusekom et al. [80] developed aconceptual model that links riverine nutrient input withthe nutrient cycles in the Wadden Sea. The authors state,that:1. nitrogen presently limits the primary production of
the coastal zone and2. the Wadden Sea imports organic matter mainly from
the North Sea coastal zone.They conclude that in order to reach the status of a
“Potential Problem Area” a 50% reduction of riverinenutrient loads is not sufficient. Atmospheric nitrogeninput has to be reduced as well, but to reach the “Non-Problem Area” status, both riverine and atmosphericnitrogen deposition have to be reduced to natural back-ground levels [80].As in the main body of the report, several direct and
indirect eutrophication effects are discussed withdetailed positions and differentiating opinions (e.g.regarding the amount of denitrification), the role ofnitrogen seems to be less clear than stated in the conclu-sions. Moreover, with respect to the high requirementsto reach background levels concluded to be necessary, itremains questionable whether nitrogen can be used tocontrol eutrophication.
4 Discussion: have the nitrogen regulationsbeen effective?
Major efforts have been undertaken in Europe to reducenutrient emissions during the last decade and followingthe legal regulations, both, efforts and effects are docu-mented in numerous reports publicly available from theGerman Federal States, the Federal Republic of Germanyand the European Union (e.g. [5, 12–14, 28, 83, 84]). A
i 2006WILEY-VCH Verlag GmbH &Co. KGaA,Weinheim www3.interscience.wiley.com/cgi-bin/jhome/5007772

Acta hydrochim. hydrobiol. 2006, 34, 305–324 Nitrogen emissions and nitrate elimination 317
huge amount of raw data, model estimations and ratingsare given and the situation appearsmosaic like, when dis-played in detail. Nevertheless, it is possible to draw somegeneral conclusions. These conclusions may be simplify-ing and should not be applied to individual cases, but inour opinion it is necessary to avoid both, oversimplifica-tion based on general conclusions on one side and gener-alization of single extreme examples on the other.
4.1 Nitrate in drinkingwater resourcesWith respect to drinking water resources, the regulationshave been quite effective in Germany, in particular insurface waters of the lowmountain range, where the resi-dence time of groundwater is low. During the period of1999 to 2002 the quality goal of the nitrate directive ofmaintaining levels below 50 mg L–1 NO3
– was met in allsurface measurement points, measured as annual arith-metic mean [84]. Compared to the situation of 1991 to1994, at 83% of the sampling sites concentrations ofnitrogen have decreased, while an increase between5…25% N is found in 8% of the observations.As an example, the nitrate concentration in reservoirs
of Saxony decreased from 1990 to 2000 with a slope of 0.7mg L–1 a–1 (annual mean value of all reservoirs, [12]). Aftera linear increase of the nitrate concentration in the 1970
and 1980 years, large efforts were undertaken to reducenitrogen emissions and nitrogen applications in forestedand agricultural catchment areas. This was achieved pri-marily by a strict declaration of protection zones, theapplication of adequate agricultural practices and com-pensatory payments to the farmers. As a result, nitrateconcentrations decreased significantly in all drinkingwater reservoirs (Fig. 8). Not only the annual means, butalso the maximum values were below the permitted lim-its of 50 mg L–1 NO3
– and in most cases even below themore strict guidance level of 25mg L–1 [12].In groundwater resources in particular the number of
very high values (>50 mg L–1) decreased during the lastyears, but the number of high values (>25 mg L–1)remained almost constant. In contrast to surface watersno drastic reduction of nitrogen in groundwater of agri-cultural areas could be observed and there are even areaswhere the nitrogen concentration is still increasing. Inapproximately 17% of the examined 799 near-surfacegroundwater sampling sites in Germany, the NO3
– con-centration exceeded the drinking water threshold con-centration [84].In contrast to reservoirs in the low mountain range
(Fig. 8) with strict agricultural regulations respecting thepriority of water use as drinking water resource and pre-
i 2006WILEY-VCH Verlag GmbH &Co. KGaA,Weinheim www3.interscience.wiley.com/cgi-bin/jhome/5007772
Figure 8. Nitrate concentration of drinking water reservoirs in Saxony (Germany), reservoirs with forested (triangles), mixed (opencircles) and agricultural watersheds (closed circles). b: slope of trend from 1990–2004. Data source: LTV Sachsen, Nitrate Report2002 [12] and unpublished original data.

318 T. Petzoldt et al. Acta hydrochim. hydrobiol. 2006, 34, 305–324
dominance of surface runoff, the decline of nitrate con-centrations in rivers of large watersheds is much slower,not only in Germany but also in other OECD countries(Fig. 9, [85]). The reason for this difference is not only thefailure of the measures to reduce the application of ferti-lizer and manure in agriculture but also, compared tosurface waters, the much longer residence time ofgroundwater aquifers [13].However, there are also differences between ground-
water resources. In Bavaria, where 93% of the drinkingwater is withdrawn from ground and spring water, lessthan 3% of the rawwater withdrawn (and only about 1.4%of the delivered drinkingwater) exceeds thewater qualitythreshold of 50mg L–1NO3
–andmore than 80% is below 25mg L–1 NO3
– [13]. In other regions, e.g. in Northrhine-West-
falia [14], no significant changes in groundwater nitrateconcentrationswere found in1997–2001 compared to theperiod 1993–1997. At 367 out of 2362 sampling sites(groundwater and raw water for drinking water supply)nitrate concentrations were above 50mg L–1 and in singlecases even above 200 mg L–1. In face of regions with suchdramatic situations the demand for almost completenitrogen removal fromwastewater effluents seemsunder-standable. From a limnological viewpoint however, thisgeneralization is at least questionable. First, the targethere is the chemical quality of groundwater and not pri-marily to control eutrophication and second, the reasonfor suchhigh concentrations are notwastewater effluentsto surface waters but agricultural practices and long resi-dence times of groundwater aquifers.
i 2006WILEY-VCH Verlag GmbH &Co. KGaA,Weinheim www3.interscience.wiley.com/cgi-bin/jhome/5007772
Figure 9. Nitrogen concentration (given as nitrate) in selected main rivers draining large watersheds of the OECD countries. Themeasurement locations are at the mouths or downstream frontiers of the rivers. Since measurement methods vary by country, oneshould compare trends (slope b) rather than absolute values. Data source: OECD [85].
Acta hydrochim. hydrobiol. 2006, 34, 305–324 Nitrogen emissions and nitrate elimination 319
4.2 Nitrate and the eutrophication problemWhile during the last decade nitrate concentrationsdecreased in drinking water reservoirs, they are still faraway from being growth limiting. However, lakes anddrinking water reservoirs with an extremely high N:Pratio up to 5000:1 can be oligotrophic without eutrophi-cation problems, if they are strictly P limited [86]. Inaccordance with the results of the marine studies wefound that nitrogen limitation is more likely to occur inshallow eutrophic than in deep systems [86]. In general,nuisance cyanobacteria blooms are observable in lakeswith high phosphorus concentrations, independent ofthe N:P ratio.While it is unquestionable that in shallow hyper-
trophic lakes nitrogen is often the limiting nutrient (likein Quitzdorf Reservoir) it is a clear misunderstanding ofmechanisms to try to employ nitrogen limitation as theonly control measure. If limiting nitrogen concentra-tions occur, then mostly during summer as a result ofhigh bioactivity in the open water (nitrogen uptake dueto plankton growth) and at the sediment-water-surface(high denitrification rates).Moreover, in lakes with a high internal P loading, a
slightly higher nitrate concentration may even reducephytoplankton development:– For reservoir management in Australia, Lawrence et
al. suggested the “use of redox buffers, such as wellnitrified inflows or nitrate treatment of sediments,where a residual sediment BOD exists, and/or it is notpossible in the short to medium term to reduceorganic loading on the reservoir” [11].
– The addition of nitrate as a measure to control phos-phorus release from lake sediments is well-known,e.g. in combination with calcium and iron as RIPLOXtechnology [87], as part within an integrated lakerestoration program [88], or nitrate together withiron [89].Elmgren [90] noticed changing views concerning
eutrophication in the Baltic Sea during recent decades.Where phosphorus was first thought to limit Baltic pri-mary production, measurements showed the role ofnitrogen. Today, the debate is whether nitrogen can beused to control phytoplankton, even where it is N lim-ited. It seems that evidence of N limitation in a particularwater body does not necessarily mean that this waterbody is controllable by NO3
– removal, but the opposite istrue. N limitation is a strong indicator that phosphorusis non-limiting and therefore the main goal must be tocontrol phosphorus, in particular for N limited systems.Furthermore, it is inappropriate to generalize the state
of a “sensitive area” from a coastal system to all water-sheds. Eutrophic lowland rivers and lake systems like
Spree and Havel have such a high denitrification poten-tial [91] that in particular during summer none of thesewage-borne nitrate is able to reach coastal areas. Thus,while nitrate in slowly flowing rivers, riverine lakes andwetlands can not only be completely eliminated, ele-vated nitrogen concentrations in such systems may evenprevent phosphorus release from sediments and in thissense nitrate in inland waters may result in positiveeffects (lower phosphorus) for less eutrophic downstreamshallow lakes, estuaries and coastal areas.However, oversimplification has to be avoided also in
the opposite direction: There are current observationsthat enhanced nitrate concentrations may have negativeeffects on shallow, macrophyte-dominated lakes withmoderate phosphorus loading [92]. A survey of 60 shal-low lakes in Poland and Great Britain (maximum depthin 75 % of the lakes a 2.5 m and total maximum 6.6 m)showed a clear negative correlation between winter totalnitrogen concentrations and species richness of sub-merged macrophytes [93]. A recently published experi-ment carried out in Lake Stigsholm, a shallow Danishlake with 1.2 m mean depth [94] showed a medium-termeffect (over 2.5 months) in enclosures with combined Pand N enrichment but not with P or N alone: A signifi-cant increase in phytoplankton biovolume and adecrease of macrophytes (mainly Elodea canadensis) wasobserved in the combined P and N treatments. Theauthors point out that they were particularly interestedin the direct effects and discuss possible light shading ofmacrophytes by phytoplankton and epiphytes. However,questions about indirect and long-term effects stillremain unanswered, for example the sediment-waterinteractions, the establishment of N2-fixing cyanobac-teria (which may take several years, see [69]), or the roleof epipelic microalgae, which are important in this lake[95]. Closing these knowledge gaps is important to pro-vide a basis for balancing restoration and quality targetsfor optimal nitratemanagement.As steps towards a solution of the nitrate problem,
Howarth [96] suggested the use of new technical solu-tions in wastewater treatment and in agriculture as wellas constructed wetlands, not only in the developed butalso in the developing world. Mitsch et al. [97] gave acomprehensive overview on controlling nitrogen in theMississippi River Basin, including agricultural practises,riparian zones and wetlands, buffer ecosystems as wellas a review of estimated nitrogen loss rates of such eco-technological systems. They encourage the use of con-structed wetland instead of highly engineered treat-ment plants, because these are regarded to be expensive,and because municipal point sources contribute only asmall percentage to the total N and P load to the Gulf of
i 2006WILEY-VCH Verlag GmbH &Co. KGaA,Weinheim www3.interscience.wiley.com/cgi-bin/jhome/5007772

320 T. Petzoldt et al. Acta hydrochim. hydrobiol. 2006, 34, 305–324
Mexico. Gren [98] concluded from empirical results forGotland (Sweden), an area with high concentration ofnitrate in groundwater “that the value of investment inwetlands could significantly exceed that of sewageplants.” This optimisation of the internal functioning ofecosystems, ecotechnology [99, 43, 97], should be animportant part of the solution to complement loadreduction.According to Carpenter [8], the technical knowledge
needed to decrease nonpoint pollution to levels whichcorrespond to water quality standards exists, but themost important barriers appear to be social, political andinstitutional. Iserman and Isermann [20] stated that withrespect to the “agricultural / human nutrition / wasteand wastewater complex” the European and, in particu-lar, German environmental and agricultural legislationwas “environmentally counterproductive”, because theselaws and regulations are based only on emission concen-trations and not on the corresponding critical loads tonear-nature ecosystems. R#ske et al. [100] suggested tomodify the European wastewater directive [23] to makealternative wastewater treatment technologies moreattractive in practice, depending on the functioning ofthe affected ecosystems. As an example, biofilm reactorswith nitrification only are less energy consuming thanthe usual activated sludge processes with combined nitri-fication and denitrification.
5 Conclusions
Anthropogenic nitrogen emissions are a global environ-mental problem. Its causes follow from the way humanslive, from the size of the human population, the demandfor food, which is solved by soil fertilization, the amountof energy used for traffic and industrial production.Whereas high agricultural productivity in the industrialcountries led to over-production, over-nutrition andhealth problems, irrigation and soil fertilization are veryimportantmeasures against hunger in the less developedregions of the world.No fast and simple single solution exists, but instead,
the reduction of emissions is best achieved by integratedapproaches, taking all the direct and indirect effects ofincreased nitrogen concentrations into account and set-ting priorities so that measures are most effective. In gen-eral, nitrogen should be eliminated from wastewater,but not in a manner ignoring negative side effects andfeedback mechanisms like energy demand (for both ferti-lizer production and wastewater treatment), ineffectiveuse or even waste of public funds and interactions withother environmental burdens like anthropogenic phos-
phorus load, which is, despite all present achievements,still too high.Nitrogen elimination in wastewater treatment plants
is easy, technically and politically. However, nitrogenelimination in wastewater treatment is less importantthan the control of other sources and pathways. Further-more, in circumstances where nitrification but not deni-trification is required, less energy consuming technolo-gies, e.g. biofilm reactors instead of the commonly usedactive sludge process can be applied, improving overallenvironmental efficiency.In cases where nitrate reduction is regarded as neces-
sary, themajor effort must concentrate on themore diffi-cult but also quantitatively more important ways toreduce diffuse emissions. This is in general the imple-mentation of a sustainable life style and life-cycle man-agement [20] and, in particular, the use of agriculturalpractices with higher nitrogen efficiency [20, 97], sustain-able technologies of energy conversion and the use ofrenewable resources. This conclusion is in full agreementwith the requirements to reduce greenhouse gases. Both,fuel combustion processes and industrial nitrogen-fixa-tion which is also an energy consuming process (Haber-Bosch process), result in an emission of CO2, and currentagricultural practises lead to an enormous emission ofthe greenhouse gas N2O [20].Moreover, as the goal of environmental policy is the
“good ecological status” of environmental systems [21] itfollows that the emission principle has to be complemen-ted by a modern critical load concept [101] (sometimesalso termed “immission principle”), respecting ecosys-tem functions. While clear definitions and strict limitvalues are important for most applications, there are cir-cumstances were pollutants like nitrate can help to con-trol other pollutants like phosphorus. In such circum-stances, case by case decisions are necessary to takeadvantages of internal mechanisms of ecological sys-tems. In this sense, while nitrogen emissions are indeed atremendous environmental problem, nitrate can be usedas an ecotechnological measure to optimise the internalfunctioning of ecological systems.
The authors wish to thank the Saxonian Reservoir authority(Landestalsperrenverwaltung des Freistaates Sachsen, LTV) forproviding original data, G!nther Nausch (IOW Warnem!nde)for important hints and comprehensive material regarding thesituation in the Baltic Sea, Michael Hupfer for helpful discus-sions about sediment related issues and Robert Radke andSusanne Rolinski for comments to the manuscript. The authorsare grateful to two anonymous reviewers for their constructiveremarks and to Ingrid Chorus and J!rgen Benndorf for theirencouragement.
i 2006WILEY-VCH Verlag GmbH &Co. KGaA,Weinheim www3.interscience.wiley.com/cgi-bin/jhome/5007772

Acta hydrochim. hydrobiol. 2006, 34, 305–324 Nitrogen emissions and nitrate elimination 321
References
[1] Vollenweider, R. A., Kerekes, J.: OECD Cooperative Pro-gramme for Monitoring of Inland Waters (Eutrophica-tion Control). Synthesis Report, Paris, 1980.
[2] Loz"n, J. L., Lenz, W., Rachor, E., Watermann, B., Westernha-gen, H. v.: Warnsignale aus der Nordsee. Parey, Berlin,1990.
[3] Loz"n, J. L., Rachor, E., Reise, K., Westernhagen, H. v., Lenz,W.: Warnsignale aus dem Wattenmeer. Blackwell-Wiss.-Verlag, Berlin, 1994.
[4] Loz"n, J. L., Lampe, R., Matth#us, W., Rachor, E., Rumohr, H.,Westernhagen, H. v.: Warnsignale aus der Ostsee. Parey,Berlin, 1996.
[5] Behrendt, H., Huber, P., Kornmilch, P., Opitz, D., Schmoll, O.,Scholz, G., Uebe, R.: N$hrstoffbilanzierung der FlußgebieteDeutschlands. Umweltforschungsplan des Bundesminis-ters f"r Umwelt, Naturschutz und Reaktorsicherheit,Forschungsvorhaben Wasser, Forschungsbericht296 25 515, Institut f"r Gew$sser#kologie und Binnen-fischerei und Umweltbundesamt Berlin, Berlin, 1999.
[6] European Environment Agency: Environmental Signals2002, Benchmarking the Millennium. EnvironmentalAssessment Report 9, European Environment Agency,2002, URL http://reports.eea.eu.int/environmental_assess-ment_report_2002_9/en.
[7] Owen, T.: The origin of inner planet atmospheres. Philos.Trans. R. Soc. Lond. A 349, 209–211 (1994).
[8] Carpenter, S. R., Caraco, N. F., Correll, D. L., Howarth, R. W.,Sharpley, A. N., Smith, V. H.: Nonpoint pollution of surfacewaters with phosphorus and nitrogen. Ecol. Applic. 8 (3),559–568 (1998).
[9] Pickaver, A.: Integrated Coastal Zone Management in theBaltic States. State of the Art Report. Background forCoastal Planning and Management in the Baltic SeaRegion, as Part of the Second HELCOM-HABITAT Meeting.2002. http://www.eucc.nl.
[10] Hassink, U.: 30 Years of Protecting the Baltic Sea. HELCOM1974-2004. 2004. http://www.helcom.fi.
[11] Lawrence, I., Bormans, M., Oliver, R., Ransom, G., Sherman, B.,Ford, P., Schofield, N.: Factors Controlling Algal Growthand Composition in Reservoirs: Report of Reservoir Man-agers' Workshops, 2004.
[12] P!tz, K., Reichelt, P., Sudbrack, R., Friemel, M.: Bericht derLandestalsperrenverwaltung des Freistaates Sachsen zurBelastung der s$chsischen Talsperren mit Nitrat bis zumJahre 2002. 2002.
[13] Friedmann, L., Rosenwirth, W., Meier, D.: NitratberichtBayern (Berichtsjahre 1996 bis 1999). Nitrat in der #ffent-lichen Wasserversorgung Bayerns. 2001.
[14] Friedrich, H., Odenkirchen, G., Lerho, A., Leuchs, W., Neu-mann, P.: Die Nitratbelastung des Grundwassers in Nord-rhein-Westfalen. 2003.
[15] Herata, H., Apsite, E., Jarosinski, W., Kotilainen, P., Leisk, U.,Loigu, E., Makarova, L., M#kinen, I., R#ike, A., Sakalauskiene,G., Svendsen, L. M., Widell, A., Forsius, K., Lepp#nen, J.-M.,Tofferi-Bishai, S.: Executive Summary of the Fourth BalticSea Pollution Load Compilation (PLC-4), 2003.
[16] Gakstatter, J. H., Bartsch, A. F., Callahan, C. A.: The impactof broadly applied effluent phosphorus standards oneutrophication control. Water Resour. Res. 14, 1155–1158 (1978).
[17] Vitousek, P., Aber, J., Howarth, R., Likens, G., Matson, P.,Schindler, D., Schlesinger, W., Tilman, D.: Human alterationof the global nitrogen cycle: sources and consequences.Ecol. Applic. 7, 737–750 (1997).
[18] Galloway, J., Dentener, F., Capone, D., Boyer, E., Howarth, R.,Seitzinger, S., Asner, G., Cleveland, C., Green, P., Holland, E.,Karl, D., Michaels, A., Porter, J., Townsend, A., V$r$smarty, C.:Nitrogen cycles: past, present, and future. Biogeochemis-try 70, 153–226 (2004).
[19] Boyer, E. W., Goodale, C. L., Jaworski, N. A., Howarth, R. W.:Anthropogenic nitrogen sources and relationships to riv-erine nitrogen export in the northeastern U.S.A. Biogeo-chemistry 57/58, 137–169 (2002).
[20] Isermann, K., Isermann, R.: Food production and consump-tion in Germany: N flows and N emissions. NutrientCycling Agroecosystems 52, 289–301 (1998).
[21] The European Parliament and the Council of the Euro-pean Union: Directive 2000/60/EC of the European Parlia-ment and of the Council of 23 October 2000 establishinga framework for Community action in the field of waterpolicy. Official Journal L 327, 22/12/2000, 1–73 (2000).
[22] The Council of the European Communities: CouncilDirective 91/676/EEC of 12 December 1991 concerningthe protection of waters against pollution caused bynitrates from agricultural sources. Official Journal L 375,31/12/1991, 1–8 (1991).
[23] The Council of the European Communities: CouncilDirective 91/271/EEC of 21 May 1991 concerning urbanwaste-water treatment. Official Journal L 135, 30/05/1991, 40–52 (1991).
[24] The Council of the European Union: Council Directive96/61/EC of 24 September 1996 concerning integratedpollution prevention and control. Official Journal L 257,10/10/1996, 26–40 (1996).
[25] The Council of the European Union: Council Directive98/83/EC of 3 November 1998 on the quality of waterintended for human consumption. Official Journal L330, 05/12/1998, 32–54 (1998).
[26] Verordnung "ber die Qualit$t von Wasser f"r denmenschlichen Gebrauch TrinkwV 2001 – Trinkwasser-verordnung. BGBl. I Nr. 24 vom 28.5.2001 S. 959;25.11.2003, S. 2304 (2001).
[27] Bundesministerium f"r Umwelt, Naturschutz und Reak-torsicherheit: Verordnung "ber Anforderungen an dasEinleiten von Abwasser in Gew$sser AbwV – Abwasser-verordnung vom 17. Juni 2004. BGBl. I Nr. 28 vom22.6.2004 S. 1108, ber. 2004 S. 2625 (2004).
i 2006WILEY-VCH Verlag GmbH &Co. KGaA,Weinheim www3.interscience.wiley.com/cgi-bin/jhome/5007772

322 T. Petzoldt et al. Acta hydrochim. hydrobiol. 2006, 34, 305–324
[28] Commission of the European Communities: Report fromthe Commission to the Council, the European Parlia-ment, the European Economic and Social Committeeand the Committee of the Regions. Implementation ofCouncil Directive 91/271/EEC of 21 May 1991 concerningurban waste water treatment, as amended by Commis-sion Directive 98/15/EC of 27 February 1998. 2002.
[29] World Health Organisation: Guidelines for Drinking-water Quality. 3rd Edition, Volume 1 : Recommenda-tions. WHO Geneva, 2004.
[30] Smith, R. V., Foy, R. H., Lennox, S. D., Jordan, L. C., Burns, C.,Cooper, J. E., Stevens, R. J.: Occurrence of nitrite in theLough-Neagh river system. J. Environ. Qual. 24, 952–959(1995).
[31] Smith, R. V., Burns, L. C., Doyle, R. M., Lennox, S. D., Kelso, B.H. L., Foy, R. H., Stevens, R. J.: Free ammonia inhibition ofnitrification in river sediments leading to nitrite accu-mulation. J. Environ. Qual. 26, 1049–1055 (1997).
[32] von der Wiesche, M., Wetzel, A.: Temporal and spatialdynamics of nitrite accumulation in the River Lahn.Water Res. 32, 1653–1661 (1998).
[33] Mengis, M., G#chter, R., Wehrli, B.: Stickstoff-Elimination inSchweizer Seen. GWA – Gas Wasser Abwasser 77 (3),174–180 (1997).
[34] Behrendt, H., Opitz, D.: Die eutrophierten Berliner Gew$s-ser. Ein neuer Ansatz zur Bewertung und M#glichkeitenzur Reduzierung von Algenmassenentwicklungen. In:Zukunft Wasser, Dokumentation zum Symposium zurNachhaltigkeit im Wasserwesen in der Mitte Europas,37–45, Berlin, 1998.
[35] Campbell, J. L., Hornbeck, J. W., Mitchell, M. J., Adams, M. B.,Castr, M. S., Driscoll, C. T., Kahl, J. S., Kochenderfer, J. N.,Likens, G. E., Lynch, J. A., Murdoch, P. S., Nelson, S. J., Shanley,J. B.: Input-output budgets of inorganic nitrogen for 24forest watersheds in the northeastern United States: areview. Water, Air, Soil Pollut. 151, 373–396 (2004).
[36] Benndorf, J., Recknagel, F.: Problems of application of theecological model SALMO to lakes and reservoirs havingvarious trophic states. Ecol. Model. 17, 129–145 (1982).
[37] Petzoldt, T., Rolinski, S., Rinke, K., K$nig, M., Baumert, H. Z.,Benndorf, J.: SALMO: Die #kologische Komponente desgekoppelten Modells. Wasserwirtschaft 95, 28–33 (2005).
[38] Rolinski, S., Petzoldt, T., Baumert, H. Z., Bigalke, K., Horn, H.,Benndorf, J.: Das physikalisch-#kologisch gekoppelte Tal-sperrenmodell. Wasserwirtschaft 95, 34–38 (2005).
[39] U.S. Geological Survey (USGS), EROS Data Center:HYDRO1k Database. Water Consumption and Resources,1997. http://edcdaac.usgs.gov/gtopo30/hydro/index.html.
[40] Ihle, T., J#hnichen, S., Benndorf, J.: Wax and wane of Micro-cystis and microcystins in lake sediments: a case study inQuitzdorf Reservoir (Germany). J. Phycol. 41, 479–488(2005).
[41] Maaßen, S., R$ske, I., Uhlmann, D.: Chemical and microbialcomposition of sediments in reservoirs with differenttrophic state. Int. Rev. Hydrobiol. 88, 508–518 (2003).
[42] R$ske, I., Uhlmann, D.: Die N$hrstoffelimination h$usli-cher Abw$sser aus der Sicht der Wasserbeschaffenheit.In: Wagner, R. (Ed.): Wasser-Kalender 2000. Jahrbuch f"rdas gesamte Wasserfach, Bd. 34. Erich Schmidt Verlag,2000, pp. 72–100.
[43] Benndorf, J.: %kotechnologie: Die zweite S$ule eines mo-dernen Gew$ssermanagements. Wasser Abfall 4/5, 8–13(2002).
[44] Hesslein, R. H.: An in situ sampler for close interval porewater studies. Limnol. Oceanogr. 21, 912–914 (1976).
[45] Kleeberg, A., Dudel, G. E.: Changes in extent of phosphorusrelease in a shallow lake (Lake Großer M"ggelsee; Ger-many, Berlin) due to climatic factors and load. Mar. Geol.139 (1-4), 61–75 (1997).
[46] Kleeberg, A., Kozerski, H.-P.: Phosphorus release in LakeGroßer M"ggelsee and its implications for lake restora-tion. Hydrobiologia 342/343, 9–26 (1997).
[47] Schauser, I., Chorus, I., Lewandowski, J.: Effects of nitrate onphosphorus release: comparison of two Berlin lakes. ActaHydrochim. Hydrobiol. 34, 325–332 (2006).
[48] Schauser, I., Hupfer, M., Br!ggemann, R.: Sensitivity ana-lysis with a phosphorus diagenesis model (SPIEL). Ecol.Mod. 190, 87–98 (2006).
[49] Redfield, A. C.: On the proportions of organic derivativesin sea water and their relation to the composition ofplankton. In: Daniel, R. J. (Ed.): James Johnstone MemorialVolume. Liverpool University Press, 1934.
[50] GEOSECS: Geochemical Ocean Sections Study, a GlobalSurvey of the Three-dimensional Distribution of Chemi-cal, Isotopic, and Radiochemical Tracers in the Ocean.1996., http://ingrid.ldeo.columbia.edu/SOURCES/.GEO-SECS/.
[51] Tyrrell, T.: The relative influences of nitrogen and phos-phorus on oceanographic primary production. Nature400, 525–531 (1999).
[52] Ridame, C., Moutin, T., Guieu, C.: Does phosphate adsorp-tion onto Saharan dust explain the unusual N/P ratio inthe Mediterranean Sea? Oceanologica Acta 26, 629–634(2003).
[53] Capone, D. G., Zehr, J. P., Paerl, H. W., Bergman, B., Carpenter,E. J.: Trichodesmium, a globally significant marine cyano-bacterium. Science 276, 1221–1229 (1997).
[54] Falkowski, P. G.: Evolution of the nitrogen cycle and itsinfluence on the biological sequestration of CO2 in theocean. Nature 387, 272–275 (1997).
[55] Tyrrell, T., Mara%&n, E., Poulton, A. J., Bowie, A. R., Harbour,D. S., Woodward, E. M. S.: Large-scale latitudinal distribu-tion of Trichodesmium spp. in the Atlantic Ocean. J. Plank-ton Res. 25, 405–416 (2003).
[56] Martin, J. H., Coale, K. H., Johnson, K., Fitzwater, S., Gordon,R. M., Tanner, S. J., Hunter, C. N., Elrod, V. A., Nowicki, J. L.,Coley, T. L., Barber, R. T., Lindley, S., Watson, A. J., Scoy, K. V.,Law, C. S., Liddicoat, M. I., Ling, R., Stanton, T., Stockel, J.,Collins, C., Anderson, A., Bidgare, R., Ondrusek, M., Latasa,M., Millero, F. J., Lee, K., Yao, W., Zhang, J. Z., Friederich, G.,Sakamoto, C., Chavez, F., Buck, K., Kolber, Z., Greene, R., Falk-
i 2006WILEY-VCH Verlag GmbH &Co. KGaA,Weinheim www3.interscience.wiley.com/cgi-bin/jhome/5007772

Acta hydrochim. hydrobiol. 2006, 34, 305–324 Nitrogen emissions and nitrate elimination 323
owski, P., Chisholm, S. W., Hoge, F., Swift, R., Yungel, J.,Turner, S., Nightingale, P., Hatton, A., Liss, P., Tindale, N. W.:Testing the iron hypothesis in ecosystems of the equator-ial Pacific Ocean. Nature 371, 123–129 (1994).
[57] Coale, K.H., Johnson, K., Fitzwater, S., Gordon, R., Tanner, S.,Chavez, F., Ferioli, L., Sakamoto, C., Rogers, P., Millero, F.,Steinberg, P., Nightingale, P., Cooper, D., Cochlan, W., Landry,M., Constantinou, J., Rollwagen, G., Trasvina, A., Kudela, R.: Amassive phytoplankton bloom induced by an ecosystem-scale iron fertilization experiment in the equatorial Paci-fic Ocean. Nature 383, 459–501 (1996).
[58] Cullen, J. J.: Iron, nitrogen and phosphorus in the ocean(comment to Tyrrell). Nature 402, 372 (1999).
[59] Sa%udo-Wilhelmy, S. A., Kustka, A. B., Gobler, C. J., Hutchins,D. A., Yang, M., Lwiza, K., Burns, J., Capone, D. G., Ravenk, J.A., Carpenter, E. J.: Phosphorus limitation of nitrogen fixa-tion by Trichodesmium in the central Atlantic Ocean. Na-ture 411, 66–69 (2001).
[60] Tyrrell, T.: Reply to Cullen: Iron, nitrogen and phos-phorus in the ocean. Nature 402, 372 (1999).
[61] Mills, M. M., Ridame, C., Davey, M., Roche, J. L., Geider, R. J.:Iron and phosphorus co-limit nitrogen fixation in theeastern tropical North Atlantic. Nature 429, 292–294(2004).
[62] van de Graaf, A. A., Mulder, A., de Bruijn, P., Jetten, M. S. M.,Robertson, L. A., Kuenen, J. G.: Anaerobic oxidation ofammonium is a biologically mediated process. Appl.Environ. Microbiol. 61, 1246–1251 (1995).
[63] Strous, M., Kuenen, J. G., Jetten, M. S. M.: Key physiology ofanaerobic ammonium oxidation. Appl. Environ. Micro-biol. 65, 3248–3250 (1999).
[64] Devol, A. H.: Nitrogen cycle. Solution to a marine mystery.Nature 422, 575–576 (2003).
[65] Kuypers, M. M. M., Lavik, G., Woebken, D., Schmid, M., Fuchs,B. M., Amann, R., Jørgensen, B. B., Jetten, M. S. M.: Massivenitrogen loss from the Benguela upwelling systemthrough anaerobic ammonium oxidation. PNAS 102,6478–6483 (2005).
[66] Trimmer, M., Nicholls, J. C., Deflandre, B.: Anaerobic ammo-nium oxidation measured in sediments along theThames Estuary, United Kingdom. Appl. Environ. Micro-biol. 69, 6447–6454 (2003).
[67] Howarth, R. W.: Nutrient limitation of net primary pro-duction in marine ecosystems. Ann. Rev. Ecol. Syst. 19,89–110 (1988).
[68] Vitousek, P. M., Cassman, K., Cleveland, C., Crews, T., Field, C.B., Grimm, N. B., Howarth, R. W., Marino, R., Martinelli, L.,Rastetter, E. B., Sprent, J. I.: Towards an ecological under-standing of biological nitrogen fixation. Biogeochemis-try 57/58, 1–45 (2002).
[69] Hecky, R., Kilham, P.: Nutrient limitation of phytoplank-ton in freshwater and marine environments: A review ofrecent evidence on the effects of enrichment. Limnol.Oceanogr. 33 (4, part 2), 796–822 (1988).
[70] Marino, R., Chan, F., Howarth, R. W., Pace, M., Likens, G. E.:Ecological and biogeochemical interactions constrainplanktonic nitrogen fixation in estuaries. Ecosystems 5,719–725 (2002).
[71] Kononen, K., Kuparinen, J., Makela, K., Laanemets, J., Pavelson,J., Nommann, S.: Initiation of cyanobacterial blooms in afrontal region at the entrance to the Gulf of Finland, Bal-tic Sea. Limnol. Oceanogr. 41, 98–112 (1996).
[72] Wasmund, N.: Occurrence of cyanobacterial blooms inthe Baltic Sea in relation to environmental conditions.Int. Rev. Ges. Hydrobiol. 82, 169–184 (1997).
[73] Elmgren, R., Larsson, U.: Nitrogen and the Baltic Sea:managing nitrogen in relation to phosphorus. The Scien-tific World 1 (S2), 371–377 (2001).
[74] Wasmund, N., Voss, M., Lochte, K.: Evidence of nitrogenfixation by non-heterocystous cyanobacteria in the BalticSea and recalculation of a budget of nitrogen fixation.Mar. Ecol. Prog. Ser. 214, 1–14 (2001).
[75] Petzoldt, H.: Stickstofftransformation an der Sediment/Wasser-Kontaktzone eutropher Flachgew$sser unterbesonderer Ber"cksichtigung der Denitrifikation. Disser-tation, Universit$t Rostock, 1986.
[76] Nausch, G., Schlungbaum, G.: N$hrstoffdynamik in einemflachen Brackwassersystem (Darß-Zingster Boddengew$s-ser) unter dem Einfluss variierender meteorologischerund hydrographischer Bedingungen. Bodden 2, 153–163(1995).
[77] Nausch, M., Nausch, G., Wasmund, N.: Phosphorusdynamics during the transition from nitrogen to phos-phate limitation in the central Baltic Sea. Mar. Ecol.Prog. Ser. 266, 15–25 (2004).
[78] Janssen, F., Neumann, T., Schmidt, M.: Inter-annual variabil-ity in cyanobacteria blooms in the Baltic Sea controlledby wintertime hydrographic conditions. Mar. Ecol. Progr.Ser. 275, 59–68 (2004).
[79] Neumann, T., Schernewski, G.: An ecological model evalua-tion of two nutrient abatement strategies for the BalticSea. J. Mar. Syst. 56, 195–206 (2005).
[80] van Beusekom, J. E. E., Fock, H., de Jong, F., Diel-Christiansen,S., Christiansen, B.: Wadden Sea Specific EutrophicationCriteria. Wadden Sea Ecosystem 14, Common WaddenSea Secretariat, Wilhelmshaven, 2001.
[81] Niesel, V., G!nther, C.-P.: Spatial and temporal distributionpatterns and their underlying causes. In: Dittmann, S.(Ed.): The Wadden Sea Ecosystem. Stability Propertiesand Mechanisms. Springer, Berlin, 1999, pp. 77–94.
[82] Jensen, H. S.: Phosphorus cycling in coastal marine sedi-ment. Limnol. Oceanogr. 40, 908–917 (1995).
[83] Umweltbundesamt: Umweltdaten Deutschland 2002.2002. http://www.umweltbundesamt.de/udd/udd2002.pdf.
[84] Regierung der Bundesrepublik Deutschland: Mitteilungder Regierung der Bundesrepublik Deutschland vomAugust 2004. 3. Bericht gem$ß Artikel 10 der Richtlinie
i 2006WILEY-VCH Verlag GmbH &Co. KGaA,Weinheim www3.interscience.wiley.com/cgi-bin/jhome/5007772

324 T. Petzoldt et al. Acta hydrochim. hydrobiol. 2006, 34, 305–324
91/676/EWG des Rates vom 12. Dezember 1991 zumSchutz der Gew$sser vor Verunreinigungen durch Nitrataus landwirtschaftlichen Quellen. 2004.
[85] Organisation for Economic Co-operation and Develop-ment: OECD Environmental Data Compendium 2002.Part I. The State of the Environment, Section 3. InlandWaters. OECD Environment Directorate, Working Groupon Environmental Information and Outlooks. 2002.http://www.oecd.org.
[86] Uhlmann, D., Paul, L.: Causes and consequences of “nitratesaturation” in phosphate-deficient water bodies. WaterSci. Technol. 30 (10), 281–288 (1994).
[87] Ripl, W.: Biochemical oxidation of polluted lake sedi-ment with nitrate. A new restoration method. Ambio 5,112–135 (1976).
[88] Donabaum, K., Schagerl, M., Dokulil, M. T.: Integrated man-agement to restore macrophyte domination. Hydrobiolo-gia 395/396, 87–97 (1999).
[89] Wauer, G., Gonsiorczyk, T., Casper, P., Koschel, R.: P-immobi-lisation and phosphatase activities in lake sediment fol-lowing treatment with nitrate and iron. Limnologica 35,102–108 (2005).
[90] Elmgren, L.: Understanding human impact on the balticecosystem: changing views in recent decades. Ambio 30(4–5), 222–231 (2001).
[91] Gelbrecht, J., Exner, H.-J., Conradt, S., Rehfeld-Klein, M., Sensel,F.: Wasserchemismus. In: K$hler, J., Gelbrecht, J., Pusch, M.(Eds.): Die Spree. Zustand, Probleme, Entwicklungsm#g-lichkeiten. Kapitel 4.2. Limnologie Aktuell Bd. 10.Schweizerbart, Stuttgart, 2002, pp. 74–95.
[92] Jeppesen, E., Sondergaard, M., Jensen, J. P., Havens, K. E.,Anneville, O., Carvalho, L., Coveney, M. F., Deneke, R., Dokulil,M. T., Foy, B., Gerdeaux, D., Hampton, S. E., Hilt, S., Kangur,K., Kohler, J., Lammens, E. H., Lauridsen, T. L., Manca, M.,Miracle, M. R., Moss, B., Noges, P., Persson, G., Phillips, G.,
Portielje, R., Romo, S., Schelske, C. L., Straile, D., Tatrai, I.,Willen, E., Winder, M.: Lake responses to reduced nutrientloading – an analysis of contemporary long-term datafrom 35 case studies. Freshwater Biol. 50, 1747–1771(2005).
[93] James, C., Fisher, J., Russell, V., Collings, S., Moss, B.: Nitrateavailability and hydrophyte species richness in shallowlakes. Freshwater Biol. 50, 1049–1063 (2005).
[94] Gonz"lez Sagrario, M. A., Jeppesen, E., Gom', J., Søndergaard,M., Jensen, J. P., Lauridsen, T., Landkildehus, F.: Does highnitrogen loading prevent clear-water conditions in shal-low lakes at moderately high phosphorus concentra-tions? Freshwater Biol. 50, 27–41 (2005).
[95] Liboriussen, L., Jeppesen, E.: Temporal dynamics in epipelic,pelagic and epiphytic algal production in a clear and aturbid shallow lake. Freshwater Biol. 48, 418–431 (2003).
[96] Howarth, R. W.: Human acceleration of the nitrogencycle: drivers, consequences, and steps toward solutions.Water Sci. Technol. 49 (5–6), 7–13 (2004).
[97] Mitsch, W. J., Day, J. W. J., Gilliam, J. W., Groffman, P. M.,Hey, D. L., Randall, G. W., Wang, N.: Reducing nitrogenloading to the Gulf of Mexico from the Mississippi Riverbasin: Strategies to counter a persistent ecological prob-lem. BioScience 51 (5), 373–388 (2001).
[98] Gren, I. M.: The value of investing in wetlands for nitro-gen abatement. Eur. Rev. Agric. Econ. 22 (2), 157–172(1995).
[99] Uhlmann, D.: Entwicklungstendenzen der %kotechnolo-gie. Wissenschaftliche Zeitschrift der TU Dresden 32 (6),109–116 (1983).
[100] R$ske, I., Uhlmann, D., Kermer, K.: Anforderungen an kom-munale Kl$ranlagen unter dem Gesichtspunkt der Gew$s-serbeschaffenheit. Korresp. Abwasser 3, 356–363 (1995).
[101] Laane, R. W. P. M.: Applying the critical load concept to thenitrogen load of the river Rhine to the Dutch coastal zone.Estuar. Coast. Shelf Sci. 62, 487–493 (2005).
i 2006WILEY-VCH Verlag GmbH &Co. KGaA,Weinheim www3.interscience.wiley.com/cgi-bin/jhome/5007772


![GRI [305-1/305-2] DIRECT AND INDIRECT GHG EMISSIONS OF CEMENT … · 2020. 2. 25. · In cement plants, direct CO 2 emissions are generated by the following sources: 1. Calcination](https://img.pdfslide.net/doc/110x75/612188b8acc55251063483dc/gri-305-1305-2-direct-and-indirect-ghg-emissions-of-cement-2020-2-25-in.jpg)