Embed Size (px)
Citation preview
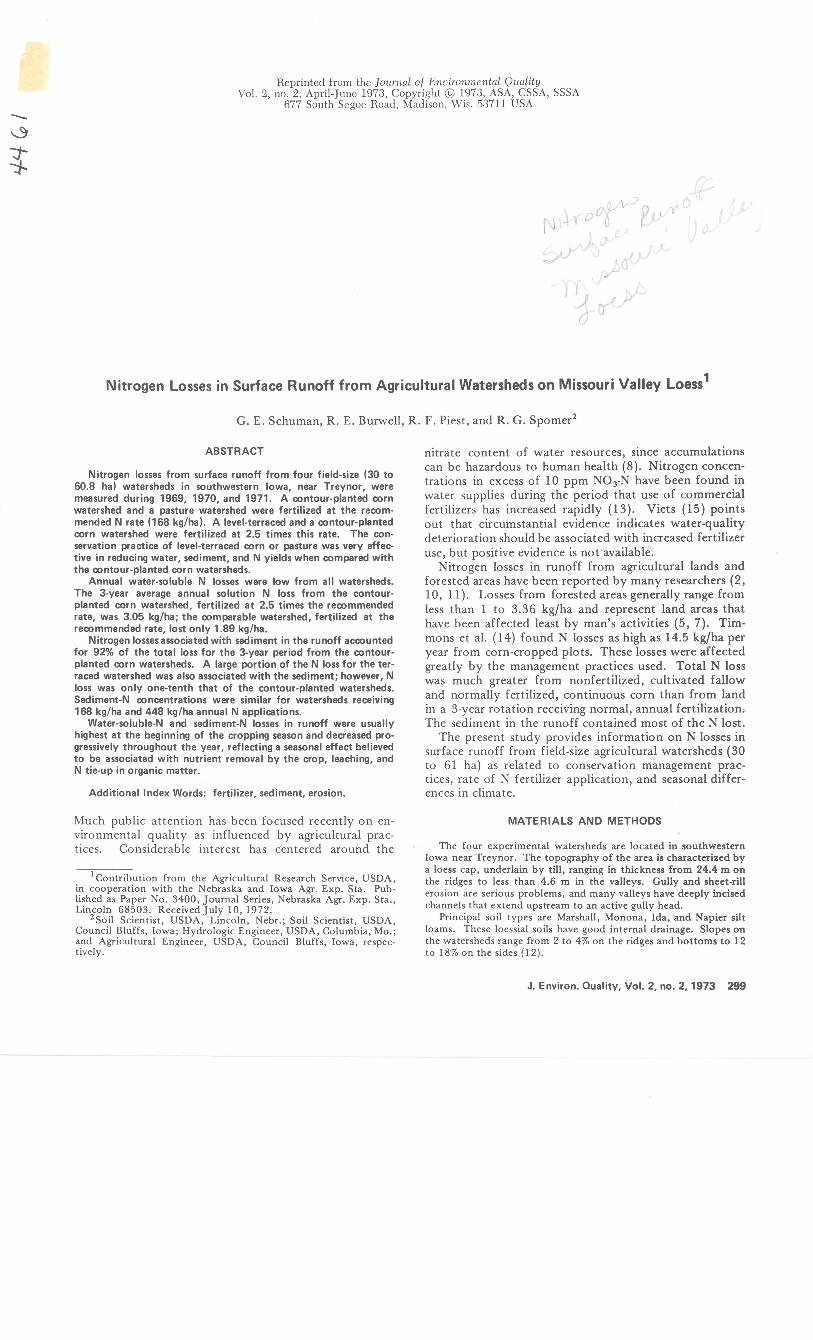
Reprinted from the Journal of Enuironrncntal Quality Vol. 2, no. 2, April-June 1973, Copyright @ 1973, ASA, CSSA, SSSA
677 South Segoe Road, Madison, Wis. 53711 USA
Nitrogen Losses in Surface Runoff from Agricultural Watersheds on Missouri Valley ~oess'
G. E. Schuman, R. E. Burwell, R. F. Piest, and R. G. SpomerZ
ABSTRACT
Nitrogen losses from surface runoff from four field-size (30 to 60.8 ha) watersheds in southwestern Iowa, near Treynor, were measured during 1969, 1970, and 1971. A contour-planted corn watershed and a pasture watershed were fertilized at the recom- mended N rate (168 kglha). A level-terraced and a contour-planted corn watershed were fertilized at 2.5 times this rate. The con- servation practice of level-terraced corn or pasture was very effec- tive in reducing water, sediment, and N yields when compared with the contour-planted corn watersheds.
Annual water-soluble N losses were low from all watersheds. The Byear average annual solution N loss from the contour- planted corn watershed, fertilized at 2.5 times the recommended rate, was 3.05 kglha; the comparable watershed, fertilized at the recommended rate, lost only 1.89 kglha.
Nitrogen losses associated with sediment in the runoff accounted for 92% of the total loss for the Byear period from the contour- planted corn watersheds. A large portion of the N loss for the ter- raced watershed was also associated with the sediment; however, N loss was only one-tenth that of the contour-planted watersheds. Sediment-N concentrations were similar for watersheds receiving 168 kglha and 448 kglha annual N applications.
Water-soluble-N and sediment-N losses in runoff were usually highest at the beginning of the cropping season and decreased pro- gressively throughout the year, reflecting a seasonal effect believed to be associated with nutrient removal by the crop, leaching, and N tie-up in organic matter.
Additional Index Words: fertilizer, sediment, erosion.
nitrate content of water resources, since accumulations can be hazardous to human health (8). Nitrogen concen- trations in excess of 10 ppm NO3-N have been found in water supplies during the period that use of commercial fertilizers has increased rapidly (1 3). Viets (15) points out that circumstantial evidence indicates waterquality deterioration should be associated with increased fertilizer use, but positive evidence is not available.
Nitrogen losses in runoff from agricultural lands and forested areas have been reported by many researchers (2, 10, 11). Losses from forested areas generally range from less than 1 to 3.36 kg/ha and represent land areas that have been affected least by man's activities (5, 7). Tim- mons et al. (14) found N losses as high as 14.5 kg/ha per year from corn-cropped plots. These losses were affected greatly by the management practices used. Total N loss was much greater from nonfertilized, cultivated fallow and normally fertilized, continuous corn than from land in a 3-year rotation receiving normal, annual fertilization.- The sediment in the runoff contained most of the N lost.
The present study provides information on N losses in surface runoff from field-size agricultural watersheds (30 to 61 ha) as related to conservation management prac- tices, rate of N fertilizer application, and seasonal differ- ences in climate.
Much public attention has been focused recently on en- MATERIALS AND METHODS vironmental quality as influenced by agricultural prac- tices. considerable interest has centered around the The four experimental watersheds are located in southwestern
Iowa near Treynor. The topography of the area is characterized by - - . a loess cap, underlain by till, ranging in thickness from 24.4 m on
'contribution from the Agricultural Research Service, USDA, the ridges to less than 4.6 m in the valleys. Gully and sheetdl in with the Nebraska and Iowa Agr. Exp. Pub- erosion are serious problems, and many valleys have deeply incised lished as Paper No. 3400, Journal Series, Nebraska Agr. EXP. Sta., channels that extend upstream to an active gully head, Linzcoln 68503. Received July 10, 1972.
Soil Scientist, USDA, Lincoln, Nebr.; Soil Scientist, USDA, Principal soil types are Marshall, Monona. Ida, and Napicr silt council ~ l ~ f f ~ , lows; ~ ~ d ~ ~ l ~ ~ i ~ Engineer, USDA, Columbia, MO.; loams. These loessial soils have good internal drainage. Slopes on and Agricultural Engineer, USDA, Council Bluffs, Iowa, respec- the watersheds range from 2 to 4% on the ridges and bottoms to 12 tively. to 18% on the sides (1 2).
J. Environ. Quality, Vol. 2, no. 2,1973 299
The four watersheds were instrumented in 1964 to measure precipitation and streamflow. Precipitation measurements were ob- tained from recording raingages strategically located on each water- shed. Streamflow discharge was measured by waterstage recorders used with calibrated broad-crested, V-notch weirs. Watershed size, crop, conservation practice, and fertilizer application are shown in Table 1.
Watersheds 2 and 3 received the normal, recommended fertilizer applicationrates of 168 kg N/ha and 39 kg Plha in 1969, 1970, and 1971. Anhydrous ammonia was'knifed in to a depth of 25 to 35 cm on 100-cm row spacings, and P was broadcast and plowed down on Watershed 2. All fertilizer (NH4N03 and superphosphate) was broadcast on the sod surface of the bromegrass pasture on Water- shed 3. Watersheds 1 and 4 received a high fertilizer application rate of 448 kg N/ha annually. A high rate of 97 kg P/ha was ap- plied to these watersheds in 1969 and 1970, but the P fertilizer ap- plication rate was reduced to 39 kg P/ha in 1971. For these high- fertility watersheds, anhydrous ammonia was knifed in to a 25- to 30-cm depth on 50-cm shank spacings a t the rate of 389 kg Nlha in 1969 and 1971. An additional 59 kg N/ha as NH4N03 was broad- cast and plowed down as a part of the preplant tillage operations on these watersheds. In 1970, only 60% of the N was applied as anhydrous ammonia, whereas 91% was applied as anhydrous am- monia in 1969 and 1971. The additional N was broadcast as NH4N03. Potassium was applied at the rate of 28 kg K/haannually on all watersheds. All fertilizer was applied in the spring before preplant tillage operations.
All corn watersheds were harvested for grain and the stalks left on the watershed. The corn watershed yields ranged from 6780 to 8537 kglha. The pasture watershed also had considerable residues and animal wastes remaining in the fall after grazing by cattle dur- ing the summer. Animal numbers on pasture varied from 75 to 130 and grazed the pasture from May to November. Therefore, residue was present on all watersheds during the winter and precropping period.
Approximately 500 ml of the soil-water runoff mixture was col- lected manually a t time intervals during each surface runoff event to determine the concentrations of sediment, NO3-N, NH4-N, and sediment N. Samples were usually collected a t the gully headcut site on Watersheds 1 and 2 and at the weir site on Watersheds 3 and 4. Gully headcut samples represent sheet-rill erosion from the crop- land area, and weir samples represent sheet-rill plus gully erosion. The gullies on Watersheds 3 and 4 have been inactive, and samples collected at the weir represent cropland area discharges. Samples were collected during the rise, peak, and recession of streamflow for most surface runoff events. A minimum of four samples was collected for each sampled event. Samples were stored at 4C to minimize chemical and microbiological conversions.
The liquid and solid phases were separated by Whatman No. 423 filter p a p a and checked by centrifugation to insure that the liquid was free of colloidal material. Ammonia-N and nitrate-N were de- termined on the clarified solution by steam distillation with MgO and Devarda's alloy into boric acid and titration with dilute H2S04 (3). A Technicon ~ u t o ~ n a l ~ z e r ~ was obtained in July 1970 w ~ t h which NH4-N and NO3-N were then determined, using continuous- flow colorimetric procedures (1,9).
The sediment content of each sample was determined gravi- metrically, the sediment dried at 60C for 24 hours, then ground to
3 ~ a m e of product is listed for benefit of the reader only and does not imply endorsement or preferential treatment by the USDA.
Table I -Watershed description, crop, conservation practice, and fertilizer application rates for 1969, 1970, and 1971,
Treynor, lowa
Wpler- Conaervatlon Fertllher
shed Size C ~ P prnctlce N P
ha - kg/ha- I 30.0 Corn Contour 448 97' 2 33.6 Corn Contour 168 39 3 43.0 Bromegrass Rotation grazlog 168 39 4 60.8 Corn Terraced 448 97 Phosphorus fertlllzer was applld at the rate of 39 Wha on all watersheds In 1971.
pass a 2-mm sieve. Total-N was determined on the sediment using micro-Kjeldahl procedures as described by Bremner (4).
Nitrogen losses were calculated by converting the NH4-N, NO3-N, and total-N concentrations to a loss rate (glmin) on the basis of flow rate and sediment load. These calculations were based on the following equation:
QN =concentration ( ~ p m ) X runoff (cfs) X K
where Q ~ J is N loss rate (glmin) and K is the conversion factor for ppm and cfs. The constant for calculating solution N loss rates (Ksoln) is 1.698 and for sediment N loss rates (Ksed) is 1.698 X 10% times the sediment concentration.
Ammonia-N and NO3-N in solution will be referred to as solu- tion N, and total N of the sediment will be referred to as sediment N throughout the paper.
It was necessary to estimate losses of N for unsampled and partially sampled runoff periods to obtain quantities lost on a year- ly basis. Frere (6) reported that soluble-N concentrations during each peak water flow were constant within the limits expected from the sampling variation and that the amount of the constituent transported could be estimated adequately as the product of the mean concentration from representative samples at each high water flow and the volume of water transported during that flow. Un- published data from the experiment reported herein agree with Frere's findings that similar quantities of soluble N are obtained by the concentration-mean and integrated-computation methods. In addition, these unpublished data show that quantities of sediment N can be estimated adequately as the product of the concentration mean and sediment volume. Therefore, in periods when soluble and sediment N were unsarnpled, quantities were determined as the product of the concentration mean and the concurrent volumes of water or sediment. To determine quantities of N lost during com- pletely unsampled surface runoff events, a concentration-mean value was selected from the nearest sampled surface runoff event. Usually, the time lapse between sampled and unsampled events was only a few days. Estimated quantities represented about 10% of the total annual quantities lost.
Nitrogen losses presented in this paper deal only with the surface runoff and do not include base flow which will be covered in a later paper. Soluble-N losses by base flow appear to be more im- portant than surface losses.
RESULTS AND DISCUSSION
Precipitation, Runoff, and Sediment Yield
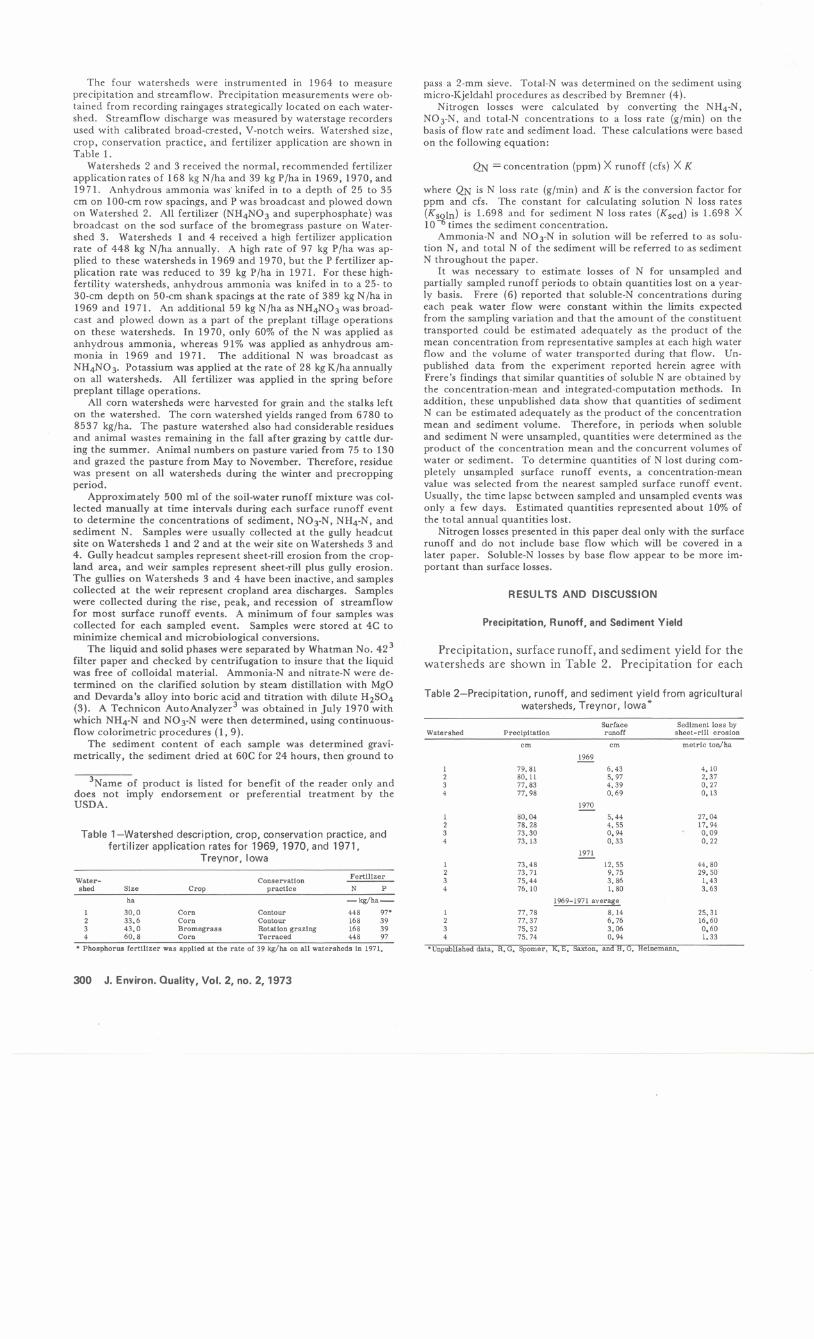
Precipitation, surface runoff, and sediment yield for the watersheds are shown in Table 2. Precipitation for each
Table 2-Precipitation, runoff, and sediment yield from agricultural watersheds, Treynor, lowa*
Surface Sedlment loss by Watershed PreclpIraUon runoff sheet-rill eroslon
cm cm metrlc todha 1969 -
'Unpublished data. R.G. Spomer, K.E. Saxton. and H.G. Helnemaon.
300 J. Environ. Quality, Vol. 2, no. 2,1973
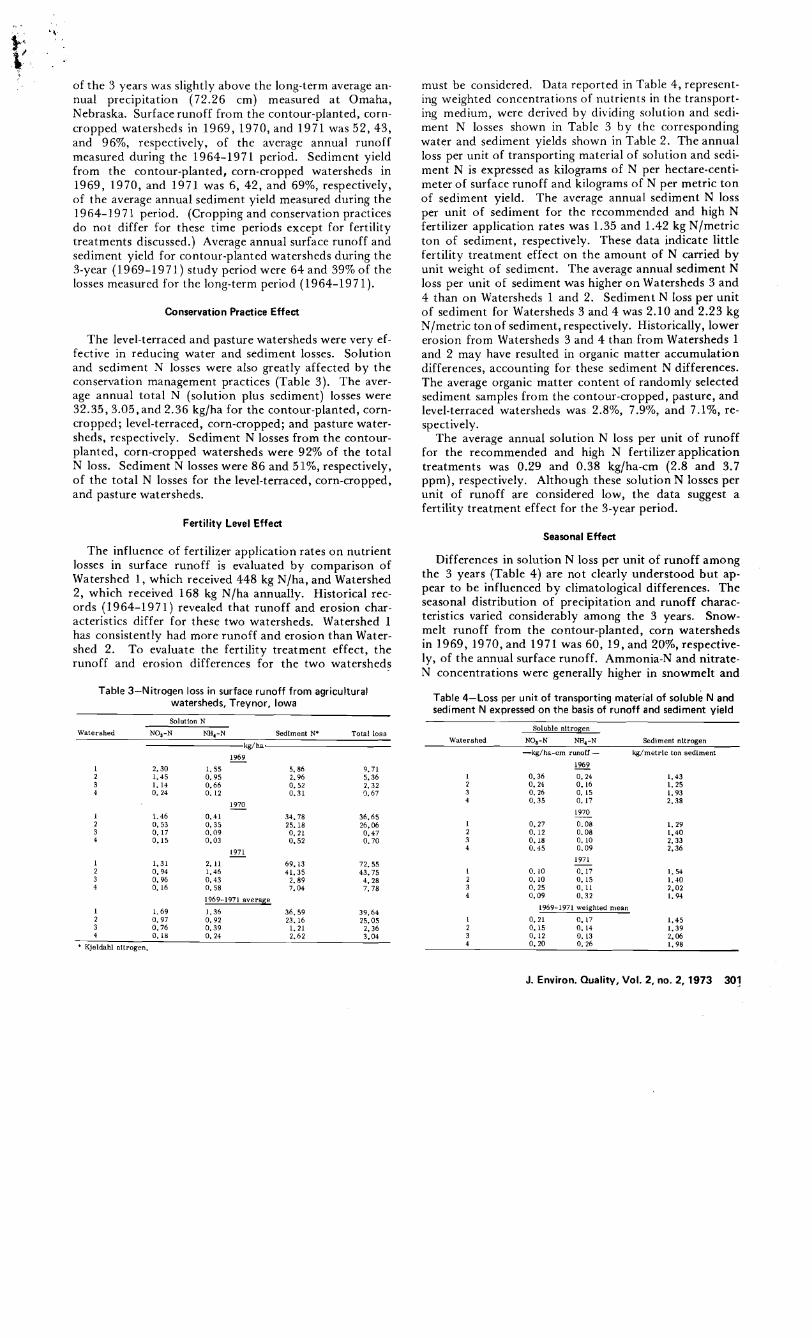
of the 3 years was slightly above the long-term average an- nual precipitation (72.26 cm) measured at Omaha, ~ e b r a s k a . surface runoff from the contour-planted, corn- cropped watersheds in 1969, 1970, and 1971 was 52, 43, and 96%, respectively, of the average annual runoff measured during the 1964-1971 period. Sediment yield from the contour-planted, corn-cropped watersheds in 1969, 1970, and 1971 was 6, 42, and 69%, respectively, of the average annual sediment yield measured during the 1964-19 7 1 period. (Cropping and conservation practices do not differ for these time periods except for fertility treatments discussed.) ~ v e r a ~ e annual surface runoff and sediment yield for contour-planted watersheds during the 3-year (1969-1971) study period were 64 and 39% of the losses measured for the long-term period (1964-197 1).
Conservation Practice Effect
The level-terraced and pasture watersheds were very ef- fective in reducing water and sediment losses. Solution and sediment N losses were also greatly affected by the conservation management practices (Table 3). The aver- age annual total N (solution plus sediment) losses were 32.35,3.05, and 2.36 kg/ha for the contour-planted, corn- cropped; level-terraced, corn-cropped; and pasture water- sheds, respectively. Sediment N losses from the contour- planted, corn-cropped watersheds were 92% of the total N loss. Sediment N losses were 86 and 51%, respectively, of the total N losses for the level-terraced, corn-cropped, and pasture watersheds.
Fertility Level Effect
The influence of fertilizer application rates on nutrient losses in surface runoff is evaluated by comparison of Watershed 1, which received 448 kg N/ha, and Watershed 2, which received 168 kg N/ha annually. Historical rec- ords (1964-1971) revealed that runoff and erosion char- acteristics differ for these two watersheds. Watershed 1 has consistently had more runoff and erosion than Water- shed 2. To evaluate the fertility treatment effect, the runoff and erosion differences for the two watersheds
Table 3-Nitrogen loss in surface runoff from agricultural watersheds, Treynor, Iowa
Solution N
Watershed NO3-N NH,-N Sedlment N* Total loss
1971 - I 1.31 2. 11 69.13 72.55 2 0.94 1.46 41.35 43.75 3 0.96 0 . 4 3 2.89 4 .28 4 0. 16 0 .58 7.04 7 .78
1969-1971 average
I I. 69 1.36 36.59 39.64 2 0 . 9 7 0 .92 23.16 25.05 3 0.76 0 .39 1.21 2.36 4 0. I8 0. 24 2.62 3.04
Kjeldahl ollrogen.
must be considered. Data reported in Table 4, represent- ing weighted concentrations of nutrients in the transport- ing medium, were derived by dividing solution and sedi- ment N losses shown in Table 3 by the corresponding water and sediment yields shown in Table 2. The annual loss per unit of transporting material of solution and sedi- ment N is expressed as kilograms of N per hectare-centi- meter of surface runoff and kilograms of N per metric ton of sediment yield. The average annual sediment N loss per unit of sediment for the recommended and high N fertilizer application rates was 1.35 and 1.42 kg N/metric ton of sediment, respectively. These data indicate little fertility treatment effect on the amount of N carried by unit weight of sediment. The average annual sediment N loss per unit of sediment was higher on Watersheds 3 and 4 than on Watersheds 1 and 2. Sediment N loss per unit of sediment for Watersheds 3 and 4 was 2.10 and 2.23 kg N/metric ton of sediment, respectively. Historically, lower erosion from Watersheds 3 and 4 than from Watersheds 1 and 2 may have resulted in organic matter accumulation differences, accounting for these sediment N differences. The average organic matter content of randomly selected sediment samples from the contour-cropped, pasture, and level-terraced watersheds was 2.8%, 7.9%, and 7.1%, re- spectively.
The average annual solution N loss per unit of runoff for the recommended and high N fertilizer application treatments was 0.29 and 0.38 kg/ha-cm (2.8 and 3.7 ppm), respectively. Although these solution N losses per unit of runoff are considered low, the data suggest a fertility treatment effect for the 3-year period.
Seasonal Effect
Differences in solution N loss per unit of runoff among the 3 years (Table 4) are not clearly understood but ap- pear to be influenced by climatological differences. The seasonal distribution of precipitation and runoff charac- teristics varied considerably among the 3 years. Snow- melt runoff from the contour-planted, corn watersheds in 1969, 1970, and 197 1 was 60, 19, and 20%, respective- ly, of the annual surface runoff. Ammonia-N and nitrate- N concentrations were generally higher in snowmelt and
Table 4-Loss per unit of transporting material of soluble N and sediment N expressed on the basis of runoff and sediment yield
Soluble nltragen
Watershed NO3-N NH,-N Sediment nltrogen
-@/ha-cm runoff - kg/metrlc ton sedlment
1969 -
1971 - 1 0. 10 0.17 1. 54 2 0. 10 0 .15 1.40 3 0 .25 0 . I1 2.02 4 0 .09 0 . 3 2 1.94
1969-1971 weighted mean
J. Environ. Quality, Vol. 2, no. 2, 1973 301
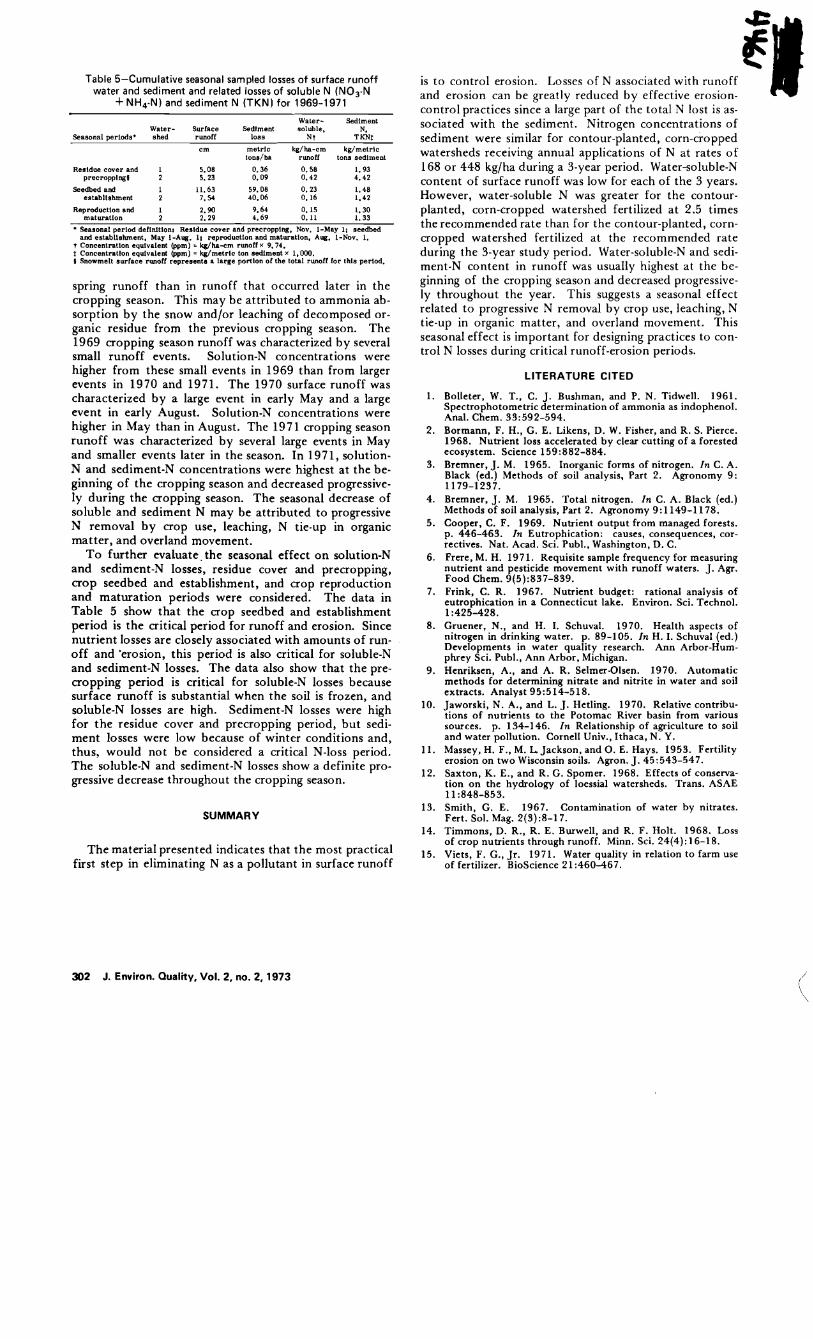
Table 5-Cumulative seasonal sampled losses of surface runoff water and sediment and related losses of soluble N (NOs-N
+ NH,N) and sediment N (TKN) for 1969-1971
Water- Sedlment Water- Surface Sedlment soluble. N.
Seasonal perlods* shed runoff Loss N t T KN!
cm metrlc kg/ha-cm kdmetr lc tons/ha runoff tons sedlment
Realdue cover and I 5.08 0.36 0 .58 1.93 precroppIng0 2 5. 23 0 .09 0 .42 4 .42
Seedbed and 1 11.63 59.08 0 .23 1.48 establlshment 2 7.54 40.06 0. 16 1.42
Reproduction and 1 2.90 9.64 0. 15 1.30 maturation 2 2.29 4 .69 0. I1 1.33
-
Seasonal perlod deflnitlont Residue cover and precropplng. Nov. I-May 1; seedbed and establlahment. May I-Aug. 11 r e p d u c t l o n and maturatlon. Aug. I-Nov. I.
t Concentratlon equlvalent @pm) = kg/hasm runoff x 9.74. t Concentrntlon equlvalent @pm) = kg/metrlc ton sedlment x 1.000. D Snowmelt surface runoff represents a large portlon of the total runoff for thls perlod.
spring runoff than in runoff that occurred later in the cropping season. This may be attributed to ammonia ab- sorption by the snow and/or leaching of decomposed or- ganic residue from the previous cropping season. The 1969 cropping season runoff was characterized by several small runoff events. Solution-N concentrations were higher from these small events in 1969 than from larger events in 1970 and 1971. The 1970 surface runoff was characterized by a large event in early May and a large event in early August. Solution-N concentrations were higher in May than in August. The 1971 cropping season runoff was characterized by several large events in May and smaller events later in the season. In 1971, solution- N and sediment-N concentrations were highest at the be- ginning of the cropping season and decreased progressive- ly during the cropping season. The seasonal decrease of soluble and sediment N may be attributed to progressive N removal by crop use, leaching, N tie-up in organic matter, and overland movement.
T o further evaluate, the seasonal effect on solution-N and sediment-N losses, residue cover and precropping, crop seedbed and establishment, and crop reproduction and maturation periods were considered. The data in Table 5 show that the crop seedbed and establishment period is the critical ~ e r i o d for runoff and erosion. Since nutrient losses are closely associated with amounts of run- off and 'erosion, this period is also critical for soluble-N and sediment-N losses. The data also show that the pre- cropping period is critical for soluble-N losses because surface runoff is substantial when the soil is frozen, and soluble-N losses are high. Sediment-N losses were high for the residue cover and precropping period, but sedi- ment losses were low because of winter conditions and, thus, would not be considered a critical N-loss period. The soluble-N and sediment-N losses show a definite pro- gressive decrease throughout the cropping season.
SUMMARY
The material presented indicates that the most practical first step in eliminating N as a pollutant in surface runoff
is t o control erosion. Losses of N associated with runoff and erosion can be greatly reduced by effective erosion-
$# control practices since a large part of the total N lost is as- sociated with the sediment. Nitrogen concentrations of sediment were similar for contour-planted, corn-cropped watersheds receiving annual applications of N at rates of 168 or 448 kg/ha during a 3-year period. Watersoluble-N content of surface runoff was low for each of the 3 years. However, water-soluble N was greater for the contour- planted, corn-cropped watershed fertilized at 2.5 times the recommended rate than for the contour-planted, corn- cropped watershed fertilized at the recommended rate during the 3-year study period. Water-soluble-N and sedi- ment-N content in runoff was usually highest at the be- ginning of the cropping season and decreased progressive- ly throughout the year. This suggests a seasonal effect related to progressive N removal by crop use, leaching, N tie-up in organic matter, and overland movement. This seasonal effect is important for designing practices to con- trol N losses during critical runoff-erosion periods.
LITERATURE CITED
Bolleter, W. T., C. J. Bushman, and P. N. Tidwell. 1961. Spectrophotometric determination of ammonia as indophenol. Anal. Chem. 33:592-594. Bormann, F. H., G. E. Likens, D. W. Fisher, and R. S. Pierce. 1968. Nutrient loss accelerated by clear cutting of a forested ecosystem. Science 159:882-884. Bremner, J. M. 1965. Inorganic forms of nitrogen. In C. A. Black (ed.) Methods of soil analysis. Part 2. Agronomy 9: 1179-1237. Bremner, J. M. 1965. Total nitrogen. In C. A. Black (ed.) Methods of soil analysis, Part 2. Agronomy 9: 1149-1 178. Cooper, C. F. 1969. Nutrient output from managed forests. p. 446-463. In Eutrophication: causes, consequences, cor- rectives. Nat. Acad. Sci. Publ., Washington, D. C. Frere, M. H. 1971. Requisite sample frequency for measuring nutrient and pesticide movement with runoff waters. J. Agr. Food Chem. 9(5):837-839. Frink, C. R. 1967. Nutrient budget: rational analysis of eutrophication in a Connecticut lake. Environ. Sci. Technol. 1 :425-428. Gruener, N., and H. I. Schuval. 1970. Health aspects of nitrogen in drinking water. p. 89-105. In H. I. Schuval (ed.) Developments in water quality research. Ann Arbor-Hum- phrey Sci. Publ., Ann Arbor, Michigan. Henriksen, A., and A. R. Selmer-Olsen. 1970. Automatic methods for determining nitrate and nitrite in water and soil extracts. Analyst 95:514-518. Jaworski, N. A., and L. J. Hetling. 1970. Relative contribu- tions of nutrients to the Potomac River basin from various sources. p. 134-146. In Relationship of agriculture to soil and water pollution. Cornell Univ., Ithaca, N. Y. Massey, H. F., M. L Jackson, and 0. E. Hays. 1953. Fertility erosion on two Wisconsin soils. Agron. J. 45:543-547. Saxton, K. E., and R. G. Spomer. 1968. Effects of conserva- tion on the hydrology of loessial watersheds. Trans. ASAE 11:848-853. Smith, G. E. 1967. Contamination of water by nitrates. Fert. Sol. Mag. 2(3):8-17. Timmons, D. R., R. E. Burwell, and R. F. Holt. 1968. Loss of crop nutrients through runoff. Minn. Sci. 24(4): 16-1 8. Viets, F. G., Jr. 1971. Water quality in relation to farm use of fertilizer. BioScience 21:460-467.
302 J. Environ. Quality, Vol. 2, no. 2, 1973