Embed Size (px)
Citation preview

NIWBQR on RF Coverage and Quality March 2017
The National Independent Wireless Broadband Quality Report (NIWBQR) provides independent
national broadband quality of experience in mobile wireless communication services in Nigeria.
Using its proprietary methods to rank service providers according to the quality of wireless
broadband service experienced in their networks.
The current report shows a ranking of quality based on RF coverage (RSRP) and quality (SNR)
only for Lagos Island cluster. The data was collected on 22nd of January, 2017 comparing the
services of five major LTE service providers in the same area in Lagos Island. The companies
included in the report are:
❖ Globalcom
❖ MTN
❖ E-stream
❖ Ntel
❖ Smile.
Test period: About 01:27 PM to 7:41 PM on 22/1/201
Ranking
Rank Company Comments
1st Globalcom
2nd E-stream
3rd Ntel Areas of very poor SNR
4th MTN WCDMA in some areas
5th Smile Areas of very poor SNR

Key Performance Indicator
KPI Globacom Mtn Ntel Smile Estream
RSRP (dBm) Min -102.99 -123.636 -129.346 -118.468 -129.08
Max -53.615 -59.134 -51.678 -65.799 -67.58
Mean -71.971 -80.79 -75.17 -80.211 -83.554
SNR (dB) Min -13.664 -13.487 -18.573 -10.927 -9.794
Max 30 30 30 30 30
Mean 17.729 19.904 15.851 18.93 19.969
-84
-82
-80
-78
-76
-74
-72
-70
-68
-66
-71.971
-75.17
-80.211-80.79
-83.554
Mean RSRP (dBm)
Glo ntel Smile Mtn Estream

Globacom
RSRP Plot
SNR Plot
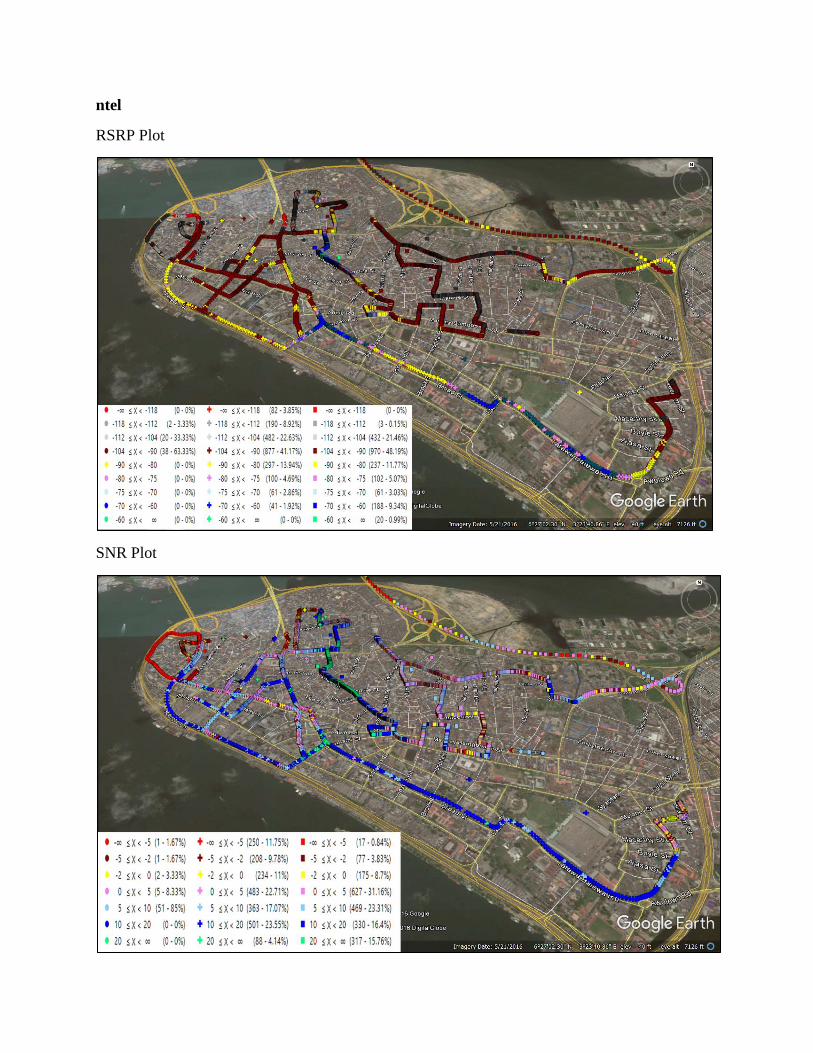
ntel
RSRP Plot
SNR Plot

MTN
RSRP Plot
SNR Plot

Smile
RSRP Plot
SNR Plot
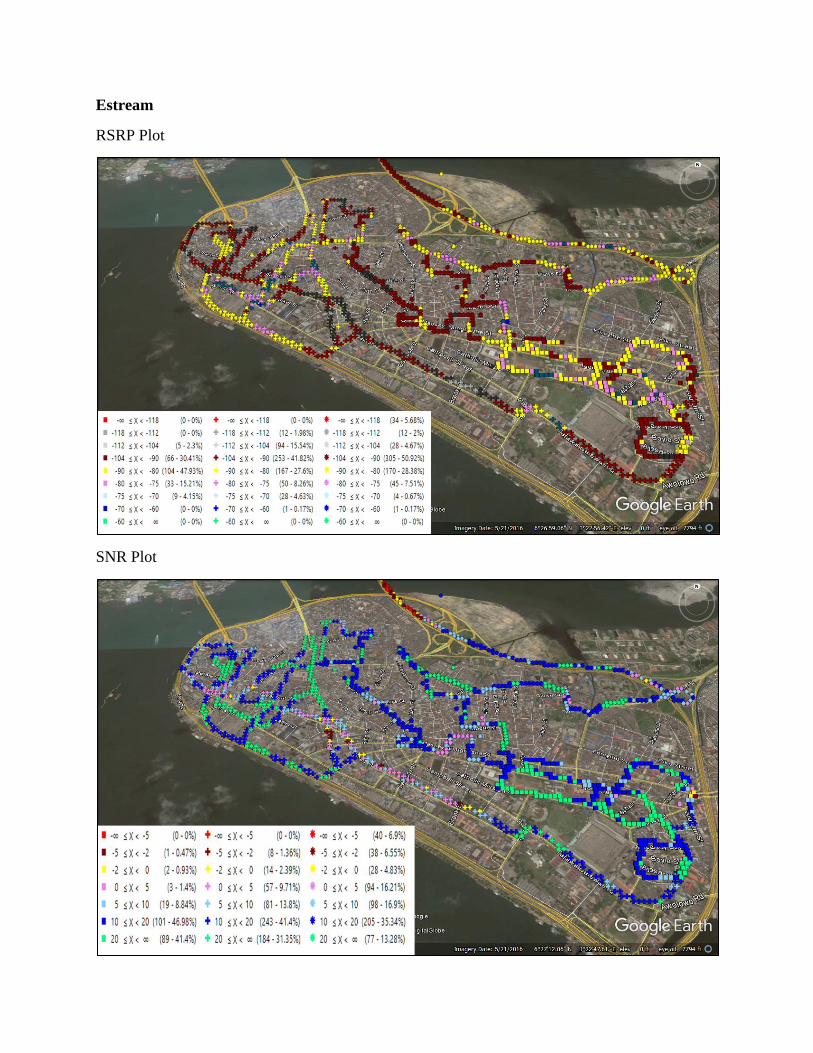
Estream
RSRP Plot
SNR Plot