Embed Size (px)
Citation preview
Copyright © 2014 Labor Relations Institute, Inc.
NLRB Elections ReviewFirst Quarter 2014
Table of Contents
................................................................Summary of the NLRB Elections Review! page 1
...................................Links to Online Maps and How the Information is Gathered! page 2
...............................................................Representation (RC) Elections Summary ! page 3
.................................................................Decertification (RD) Elections Summary! page 4
......................................................Most Active Unions in Representation Elections! page 5
.......................................................Most Active Unions in Decertification Elections! page 6
............................................................Representation Elections per NLRB Region! page 7
.............................................................Decertification Elections per NLRB Region! page 8
.........................................................................Representation Elections per State! page 9
.........................................................................Decertification Elections per State! page 10
....................................Representation and Decertification Elections per Industry ! page 11
..................................Representation and Decertification Elections per Unit Size! page 12
...........................................................................................Map of NLRB Regions! page 13
Copyright © 2014 Labor Relations Institute, Inc.
LRI RightNow NLRB Elections Review
Page 1
Most Active Unions (details pages 5 and 6)The Teamsters union was the most active, having been involved in a total of 54 representation elections certified through First Quarter 2014.
Elections per NLRB Region (details pages 7 and 8)Region 4 had the most activity through First Quarter 2014 with 23 elections held. In regions with at least 6* RC elections, Region 31 had the highest union success rate, with unions winning 100% of RC elections in that region, while Region 28 had the lowest union success rate at 17%.* This qualification is based on regions having at least 1/4 as many elections as the region with the highest number elections.
Elections per State (details pages 9 and 10)The state with the higest number of RC elections resolved through First Quarter 2014 was California, with 38 elections. In states with at least 2 RC elections, Virginia had the highest union success rate with unions winning 100% of RC elections, while Nevada had the lowest union success rate at 0%.
Elections per Industry (details page 11)Unions had the most success in the Health Care and Social Assistance industry, winning 82% of RC elections through First Quarter 2014. Unions found the least success in the Wholesale industry, winning 35% of those RC elections.
Elections per Unit Size (details page 12)Voters in a unit size between 1 and 10 were the most likely to vote in favor of the union in RC elections through First Quarter 2014, with unions winning 77% of those elections, while voters in a unit size between 26 and 50 were the most likely to vote against the union in decertification elections (0% union win rate).
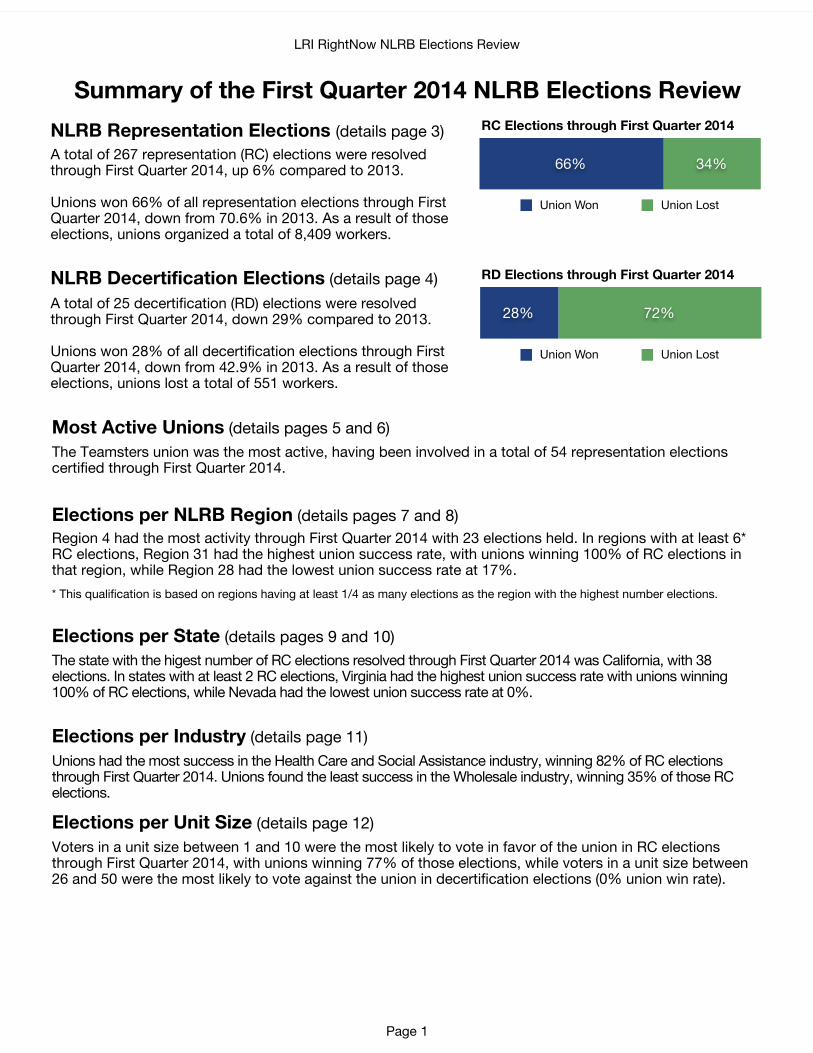
34%66%
Union Won Union Lost
72%28%
Union Won Union Lost
RC Elections through First Quarter 2014
RD Elections through First Quarter 2014
NLRB Representation Elections (details page 3)A total of 267 representation (RC) elections were resolved through First Quarter 2014, up 6% compared to 2013.
Unions won 66% of all representation elections through First Quarter 2014, down from 70.6% in 2013. As a result of those elections, unions organized a total of 8,409 workers.
NLRB Decertification Elections (details page 4)A total of 25 decertification (RD) elections were resolved through First Quarter 2014, down 29% compared to 2013.
Unions won 28% of all decertification elections through First Quarter 2014, down from 42.9% in 2013. As a result of those elections, unions lost a total of 551 workers.
Summary of the First Quarter 2014 NLRB Elections Review
LRI RightNow NLRB Elections Review
Page 2
How the Information is GatheredLRI RightNow has collected NLRB Elections and Petitions information for more than 20 years directly from the National Labor Relations Board and its regional offices. Election tallies and certification notices are gathered and added to our databases monthly.
The elections information contained in these pages is based on elections that were certified during the period covered. Elections not certified due to challenges or objections that have yet to be resolved at the time of publication are not included. Because of this, there may be subtle changes in statistics from year to year as elections previously under review become certified.
LRI RightNow is a database service that provides up-to-the-minute, accurate union information directly to your desk. Our online databases contain hundreds of thousands of records that can be used to help formulate union-sensitive actions and policies. Call 1-800-888-9115 or browse to search.lrionline.com for information on how to subscribe to LRI RightNow.
Up-to-the-minute, accurate union information directly to your desk1-800-888-9115
www.LRIrightnow.com
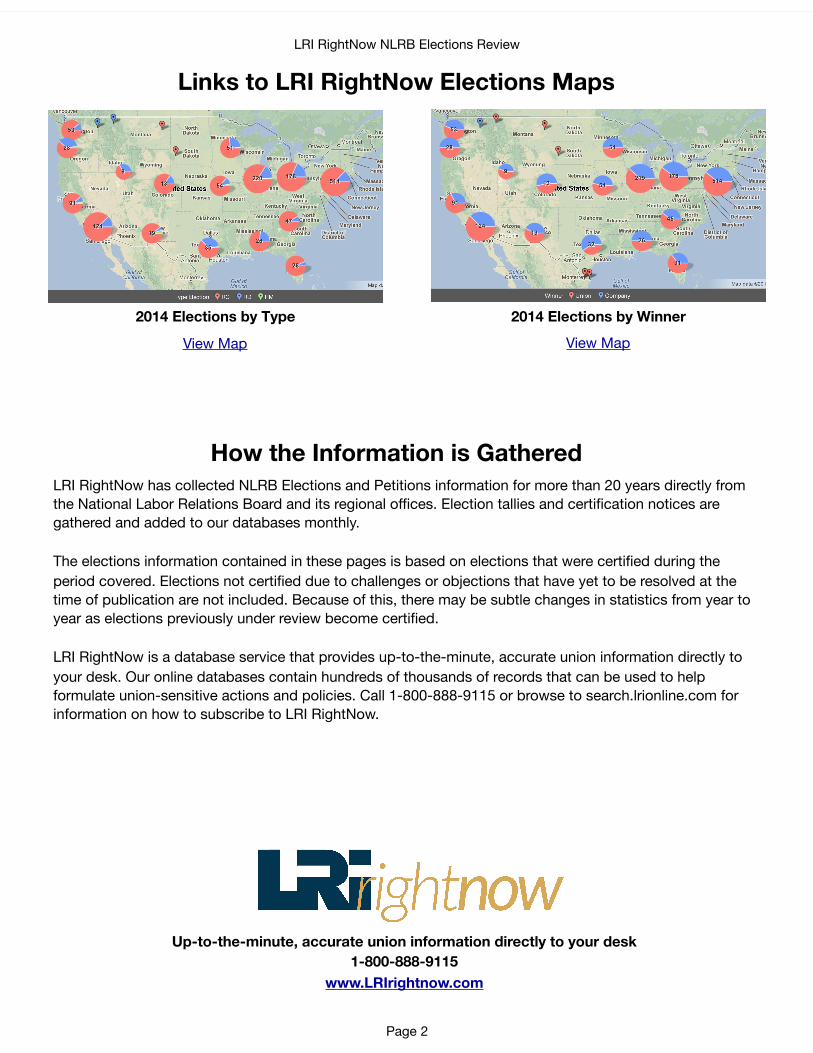
Links to LRI RightNow Elections Maps
View Map
2014 Elections by TypeView Map
2014 Elections by Winner

LRI RightNow NLRB Elections Review
Page 4
Month 2013 2014 ChangeJan 9 7 -22%Feb 9 8 -11%Mar 17 10 -41%Apr 0 0May 0 0Jun 0 0Jul 0 0Aug 0 0Sep 0 0Oct 0 0Nov 0 0Dec 0 0
Total 35 25 -29%
0
5
10
15
20
Jan Feb Mar Apr May Jun Jul Aug Sep Oct Nov Dec2013 2014
Decertification (RD) Elections Summary
2014 Total Elections
Union Won
Union Lost
Union Pct Won
Jan 7 0 7 0%Feb 8 3 5 38%Mar 10 4 6 40%Apr 0 0 0May 0 0 0Jun 0 0 0Jul 0 0 0Aug 0 0 0Sep 0 0 0Oct 0 0 0Nov 0 0 0Dec 0 0 0
Total 25 7 18 28%
0
3
5
8
10
Jan Feb Mar Apr May Jun Jul Aug Sep Oct Nov DecUnion Won Union Lost
Workers Involved in Decertification Elections through First Quarter 2013 2014 % Chg
Total number of workers eligible to vote in decertification elections 1,915 995 -48%Total number of workers lost by unions as a result of decertification elections 654 551 -16%
Total Decertification Elections through First Quarter 2014 (Compared to 2013)The number of decertification elections for all unions was down 29% through First Quarter 2014 compared to 2013. The following chart shows a month-by-month total of decertification elections for both years and the percentage change year-over-year (based on elections certified).
Won/Lost Totals Decertification Elections (RD) through First Quarter 2014Unions won 28% of all decertification elections through First Quarter 2014, down from 42.9% in 2013. The following chart shows the month-by-month union won/lost totals in decertification elections in 2014.
LRI RightNow NLRB Elections Review
Page 12
Representation (RC) ElectionsTotal
ElectionsUnion Won
Union Lost
Union Pct Won
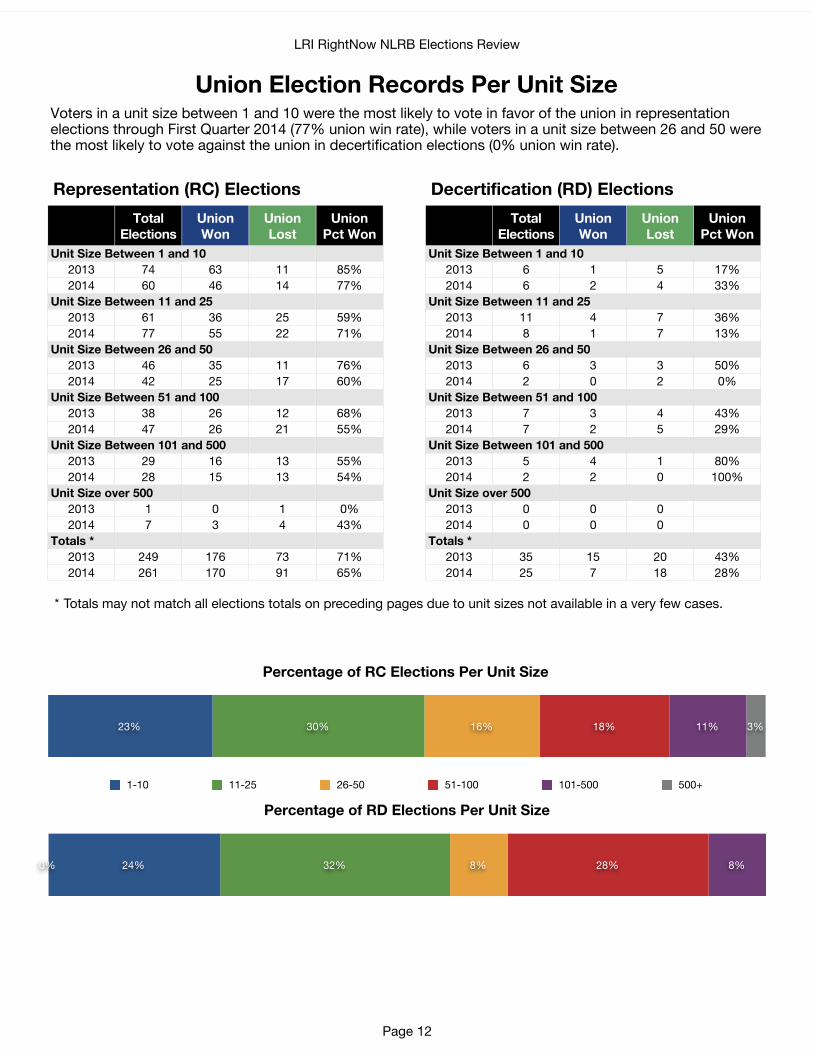
Unit Size Between 1 and 10Unit Size Between 1 and 10Unit Size Between 1 and 102013 74 63 11 85%2014 60 46 14 77%
Unit Size Between 11 and 25Unit Size Between 11 and 25Unit Size Between 11 and 252013 61 36 25 59%2014 77 55 22 71%
Unit Size Between 26 and 50Unit Size Between 26 and 50Unit Size Between 26 and 502013 46 35 11 76%2014 42 25 17 60%
Unit Size Between 51 and 100Unit Size Between 51 and 100Unit Size Between 51 and 1002013 38 26 12 68%2014 47 26 21 55%
Unit Size Between 101 and 500Unit Size Between 101 and 500Unit Size Between 101 and 5002013 29 16 13 55%2014 28 15 13 54%
Unit Size over 500Unit Size over 5002013 1 0 1 0%2014 7 3 4 43%
Totals *2013 249 176 73 71%2014 261 170 91 65%
Decertification (RD) ElectionsTotal
ElectionsUnion Won
Union Lost
Union Pct Won
Unit Size Between 1 and 10Unit Size Between 1 and 10Unit Size Between 1 and 102013 6 1 5 17%2014 6 2 4 33%
Unit Size Between 11 and 25Unit Size Between 11 and 25Unit Size Between 11 and 252013 11 4 7 36%2014 8 1 7 13%
Unit Size Between 26 and 50Unit Size Between 26 and 50Unit Size Between 26 and 502013 6 3 3 50%2014 2 0 2 0%
Unit Size Between 51 and 100Unit Size Between 51 and 100Unit Size Between 51 and 1002013 7 3 4 43%2014 7 2 5 29%
Unit Size Between 101 and 500Unit Size Between 101 and 500Unit Size Between 101 and 5002013 5 4 1 80%2014 2 2 0 100%
Unit Size over 500Unit Size over 5002013 0 0 02014 0 0 0
Totals *2013 35 15 20 43%2014 25 7 18 28%
* Totals may not match all elections totals on preceding pages due to unit sizes not available in a very few cases.
Union Election Records Per Unit SizeVoters in a unit size between 1 and 10 were the most likely to vote in favor of the union in representation elections through First Quarter 2014 (77% union win rate), while voters in a unit size between 26 and 50 were the most likely to vote against the union in decertification elections (0% union win rate).
Percentage of RC Elections Per Unit Size
3%11%18%16%30%23%
1-10 11-25 26-50 51-100 101-500 500+
Percentage of RD Elections Per Unit Size
0% 8%28%8%32%24%
Did You Find This Information Helpful? We Though You Would… If you found this information helpful, there is so much more great information in our annual elections review with easy to understand, relevant information right at your fingertips. We take what can often seem like rocket science and distill it into a format that you can use to communicate directly with the CEO of the company to emphasize why you need support for union avoidance within your company. You will receive both a written summary and multiple graphical summaries of the latest union organizing information in the:
LRI RightNow First Quarter 2014 Elections Review What’s Inside? You’ll receive: • The 2014 First Quarter Summary of the NLRB Elections Review • Links to Online Maps and How the Information is Gathered • NLRB Representation (RC) Elections Summary • NLRB Decertification (RD) Elections Summary • Most Active Unions in Representative Elections • Most Active Unions in Decertification Elections • Representation Elections per NLRB Region • Decertification Elections per NLRB Region • Representation Elections per State • Decertification Elections per State • Representation & Decertification Elections per Industry • Representation & Decertification Elections per Unit Size • Map of NLRB Regions
We want to help you make the best decisions possible on behalf of your organization.
Click here (http://lrionline.com/elections-review-report) To learn more about the expanded, complete version of this report today. If you already know you are ready to order now, you can pick up your copy by clicking the link below. We appreciate everything you do to ensure a union-free workplace. LRI Online Team [email protected] http://search.lrionline.com Toll Free: 800.888.9115