Embed Size (px)
Citation preview

NMR Analysis in Food Science
Dr. Dave Russell
NMR Applications Scientist
Agilent Technologies

“I know what I like… and I like what I know.” Dr. J. Josephs, Sr.
Courtesy: Lydia Park

NMR as a Structure Elucidation Tool
Empirical Formula C27H35N9O5S2
Aildenafil core
It started with a phone call from Flora Labs…

NMR as a Structure Elucidation Tool
MS/MS
Proton and Carbon
HSQC
COSY
HMBC
NOESY
15N CIGAR
It started with a phone call from Flora Labs…

NMR as a Structure Elucidation Tool It started with a phone call from Flora Labs…
MS/MS
Proton and Carbon
HSQC
COSY
HMBC
NOESY
15N CIGAR

qNMR – Accuracy and Precision, made simple
R² = 0.9996
0.050
0.500
5.000
50.000
0.050 0.500 5.000 50.000
Actu
al
Co
ncen
trati
on
, m
M
Experimental Concentration, mM
Accuracy 98.47%
%SD 0.74%
No reference standards required. (Complete unknowns are just fine, thanks.)

Overview - CRAFT analysis of NMR data
• Introduction to the problems of frequency-based
analyses in Food Science
• Comparison of CRAFT to standard techniques
• Real-world applications Soy bean supplements – quality control
Tea – authenticity
Smelt – origin

Quantitation in frequency domain This is easy when the spectra are simple

100x
Zinfandel Wine
Real data are never “simple” Complex overlapped spectra are the rule for food science samples

The “Standard” NMR Analysis Workflow
Manual processing. Manual data reduction. Manual everything!
FT & phase correct
The NMR workflow for data analysis
is primarily based on manual
processing and interpretation of each
individual spectrum.
This is a slow, tedious, and error-
prone process.

Time vs. Frequency domain: the good and the bad
x y presentation of frequency vs. “intensity”
• peak height = f(amplitude, linewidth, phase)
• integral = f(amplitude, linewidth, phase)
Baseline issues • A few corrupted data points in the fid
translate to several corrupted data points in
frequency axis
• Broad features obscure the true baseline

Time vs. Frequency domain: the good and the bad
Sum of multiple sinusoids
Each sinusoid represented by independent
NMR properties • Frequency
• Amplitude
• Decay rate
• Phase
x y presentation of frequency vs. “intensity”
• peak height = f(amplitude, linewidth, phase)
• integral = f(amplitude, linewidth, phase)
Baseline issues • A few corrupted data points in the fid
translate to several corrupted data points in
frequency axis
• Broad features obscure the true baseline
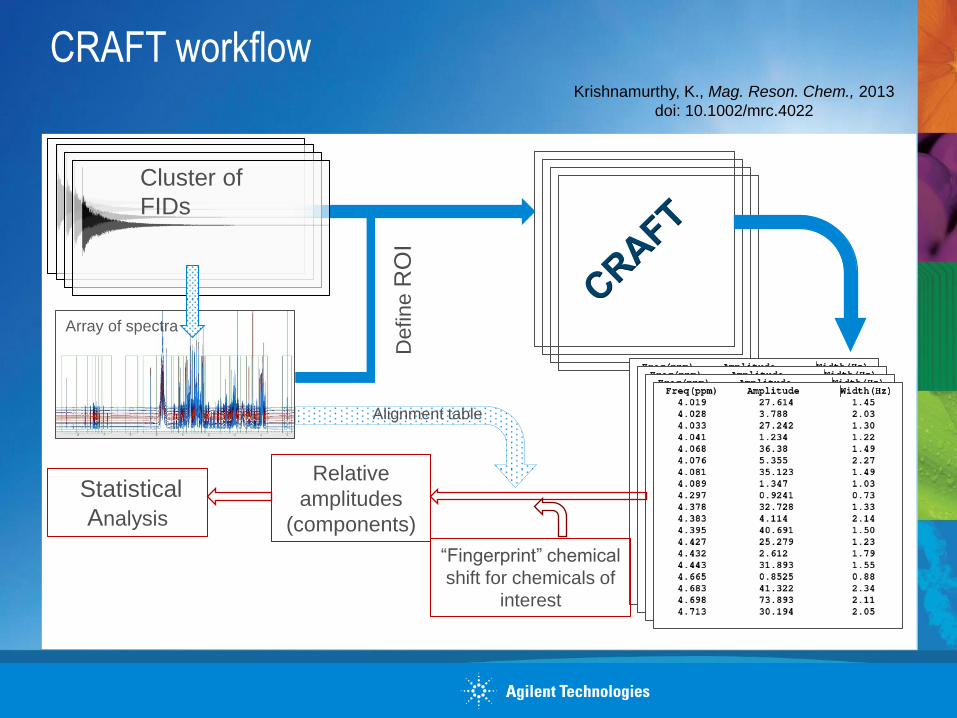
CRAFT workflow
Define R
OI
“Fingerprint” chemical
shift for chemicals of
interest
Relative
amplitudes
(components)
Statistical
Analysis
Cluster of
FIDs
Array of spectra
Alignment table
Krishnamurthy, K., Mag. Reson. Chem., 2013
doi: 10.1002/mrc.4022

Overview - CRAFT analysis of NMR data
• Introduction to the problems of frequency-based
analyses in Food Science
• Comparison of CRAFT to standard techniques
• Real-world applications Soy bean supplements – quality control
Tea – authenticity
Smelt – origin

CRAFT Analysis of Fermentation Broth SA Bradley, TA Smitka, DJ Russell and K Krishnamurthy. Current Metabolomics, submitted
1H NMR Spectrum of
Fermentation Broth

CRAFT Results – Comfort Zone Total CRAFT’ing time: 3.5 minutes
Models
Residual
Reconstructed
Experimental

Fingerprints for component extraction
SA Bradley, TA Smitka, DJ Russell and K Krishnamurthy. Current Metabolomics, submitted

CRAFT Results: Comparison

CRAFT Results: Comparison

Overview - CRAFT analysis of NMR data
• Introduction to the problems of frequency-based
analyses in Food Science
• Comparison of CRAFT to standard techniques
• Real-world applications Soy bean supplements – quality control
Tea – authenticity
Smelt – origin

CRAFT applications Food sciences – soy dietary supplement analysis
Over-the-counter soy dietary
supplements
3 different soy supplements
15 (replicate) capsules from
each group
Extracted, filtered, 1H NMR
collected

Soy Extract - Aromatics Isoflavone peaks of interest

Soy Extract - Aromatics Isoflavone peaks of interest

Soy Extract – Analyte Table Isoflavone peaks of interest

CRAFT example Soy extract analysis
3 groups; 15 samples/each; ~2 min/spectrum CRAFT’ing time

CRAFT example Soy extract analysis
3 groups; 15 samples/each; ~2 min/spectrum CRAFT’ing time

CRAFT example Soy extract analysis
3 groups; 10 samples/each; 30 sec/spectrum CRAFT’ing time

Overview - CRAFT analysis of NMR data
• Introduction to the problems of frequency-based
analyses in Food Science
• Comparison of CRAFT to standard techniques
• Real-world applications Soy bean supplements – quality control
Tea – authenticity
Smelt – origin

Analysis of Tea - Method
Which country did this tea come from?
Eleven teas of known origin
• 1 g samples
• boiled for 5 minutes in 5 mL D2O
• centrifuged
• transferred to NMR tubes
5 replicates of each type of tea
• 55 samples, total

Tea Analysis Stack plot – D2O samples
Spectra
recorded for
one set of 5
replicates; tea
extracted with
hot D2O.

-0.25
-0.15
-0.05
0.05
0.15
0.25
0.35
0.06 0.07 0.08 0.09 0.1 0.11 0.12 0.13 0.14 0.15 0.16
China (black)
Everything else…
Tea Analysis PCA plot – D2O samples

Analysis of Tea - Method
Reset, rethink, and try again.
Eleven teas of known origin
• 1 g samples
• extracted w/ 5 mL solvent
• centrifuged
• transferred to NMR tubes
DMSO extraction, 3 replicates of each type
• 33 samples, total, then duplicate spectra

Tea Analysis Stack plot – DMSO samples – CRAFT reconstructions
Example of
CRAFT
results for
DSMO
extracts
Residual
CRAFT
Experimental

Tea Analysis Stack plot – DMSO samples – CRAFT reconstructions
Spectra
recorded for
DSMO
extracts;
3x samples
per variety of
tea, 2x
spectra per
sample tube,
CRAFTed

What is a Fingerprint?
• Often generated
from a standard
sample
• Can be extracted
from a CRAFTed
mixture
• Really, it’s just a
line list and
segment width
• Need not contain
every resonance in
a molecule!

0
0.2
0.4
0.6
0.8
1
1.2
1.4
1 6 11 16 21 26 31 36 41 46 51 56 61
0
0.1
0.2
0.3
0.4
0.5
0.6
1 6 11 16 21 26 31 36 41 46 51 56 61
0
1
2
3
4
5
6
1 5 9 13172125293337414549535761
0
0.2
0.4
0.6
0.8
1
1.2
1.4
1.6
1 6 11 16 21 26 31 36 41 46 51 56 61
0
1
2
3
4
5
6
7
8
9
1 5 9 13172125293337414549535761
Tea Analysis DMSO samples – CRAFTed concentrations
Epigallocatechin Gallate Theobromine
Glucose Caffeine
0
0.5
1
1.5
2
2.5
1 6 11 16 21 26 31 36 41 46 51 56 61
Epicatechin
Gallocatechin

Tea Analysis Caffeine reproducibility study
PCA plot – DMSO samples - Targeted
-2.3
-1.8
-1.3
-0.8
-0.3
0.2
0.7
1.2
1.7
1.5 2.5 3.5 4.5 5.5 6.5 7.5 8.5 9.5
China (black)
Rwanda
(black)
India (black)
Maybe better
than the hot
D2O extractions,
but still not
suitable for
sample class
prediction.

Tea Analysis Caffeine reproducibility study
PCA plot – DMSO samples - Targeted
-2.3
-1.8
-1.3
-0.8
-0.3
0.2
0.7
1.2
1.7
1.5 2.5 3.5 4.5 5.5 6.5 7.5 8.5 9.5
China (black)
Rwanda
(black)
India (black)
Green Teas
Maybe better
than the hot
D2O extractions,
but still not
suitable for
sample class
prediction.

Tea Analysis Caffeine reproducibility study
Selecting untargeted resonances

-8
-6
-4
-2
0
2
4
-9 -4 1 6 11
India
Rwanda
Japan China (black)
Tea Analysis Untargeted PCA – 56 peaks
“blended”
China (green)
PCA 1
PCA 3
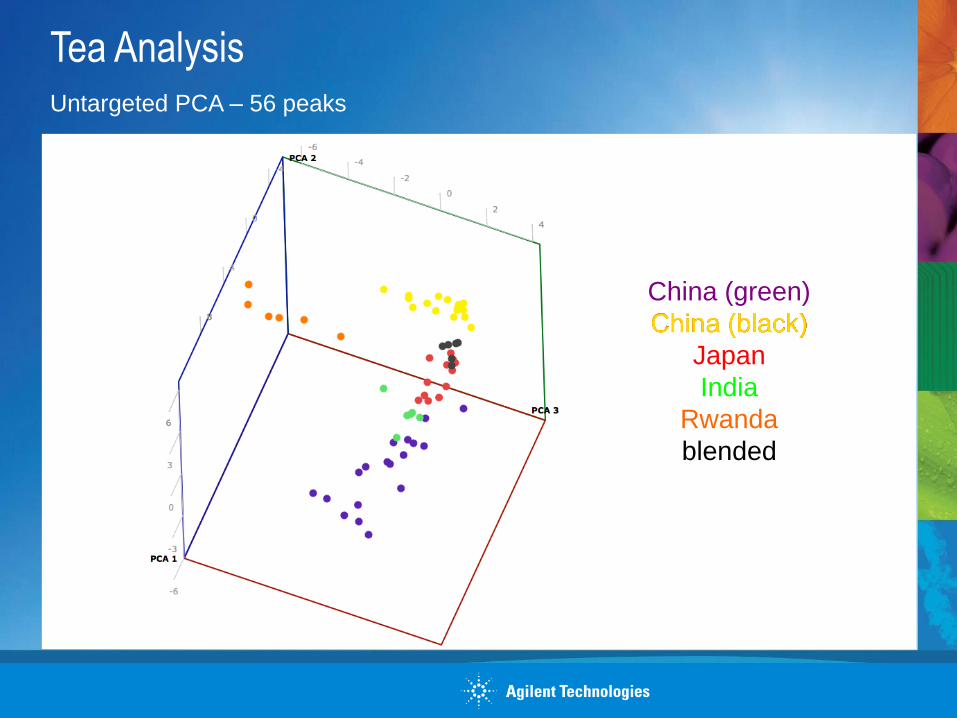
Tea Analysis Untargeted PCA – 56 peaks
China (green)
China (black)
Japan
India
Rwanda
blended

-0.25
-0.2
-0.15
-0.1
-0.05
0
0.05
0.1
0.15
0.2
-0.15 -0.1 -0.05 0 0.05 0.1 0.15 0.2 0.25 0.3
China (black)
India (black)
Rwanda (black)
Japan (green)
China
(blended)
Tea Analysis Untargeted PCA – every point
China (green)
PCA 1
PCA 2

Overview - CRAFT analysis of NMR data
• Introduction to the problems of frequency-based
analyses in Food Science
• Comparison of CRAFT to standard techniques
• Real-world applications Soy bean supplements – quality control
Tea – authenticity
Smelt – origin

CRAFT Fish (Agentina Sphyraena) perchloric acid extraction
Dr. Flaminia Cesare Marincola, U. Cagliari, IT

CRAFT Fish (Agentina Sphyraena) – 49 samples
Dr. Flaminia Cesare Marincola, U. Cagliari, IT
Spring
Winter
Fall – Different depth
Fall

CRAFT Fish (Agentina Sphyraena) – 32 ROIs
Sample courtesy of Dr. Flaminia Cesare Marincola, U. Cagliari, IT
Spring
Winter
Fall – Different depth
Fall

CRAFT Fish (Agentina Sphyraena) – PCA with 89 segments
Sample courtesy of Dr. Flaminia Cesare Marincola, U. Cagliari, IT
Spring
Winter
Fall – Different depth
Fall

NMR is Food Science Conclusions
• Time-domain analysis rapidly yields accurate and precise
results on even the most complex spectra.
• NMR analysis can be used to build high-fidelity sample class
prediction models for complex samples such as dietary
supplements and food science studies.
• You still can’t cheat physics.

Acknowledgements
Scott Bradley (Eli Lilly)
Andreas Kaerner (Eli Lilly)
Jonus Buser (Eli Lilly)
Allen Kline (ex Eli Lilly)
Ross Johnson (Eli Lilly)
Juel DeHoniesto (Eli Lilly)
Scott Baggett (Acorn)
Joe Ackerman (WashU, St. Louis)
Larry Bretthorst (WashU, St. Louis)
Krish Krishnamurthy
Frank Delaglio
Dan Iverson
He Liu
Mauro Cremonini
Dimitris Argyropoulos
Heiko Schill
Ron Crouch
Agilent