Embed Size (px)
Citation preview
October 2019
Monthly Report
Financial and Operations
Report
NNPC
2 NNPC | Monthly Financial and Operations Report October 2019 www.nnpcgroup.com | www.facebook.com/NNPCgroup | www.twitter.com/NNPCgroup
Disclaimer
This publication presents information on the Nigerian oil and gas
industry. Its content reflects individual as well as general analysis and
trend of activities that characterized the industry within the country.
Although NNPC endeavors to ensure accuracy of information in this
unaudited report, it cannot guarantee 100% accuracy, nor can it be held
liable for errors that may be contained therein. Users are to note that use
of any information herein is purely at their own discretion.
3 NNPC | Monthly Financial and Operations Report October 2019 www.nnpcgroup.com | www.facebook.com/NNPCgroup | www.twitter.com/NNPCgroup
Outline
1.0 Introduction
2.0 National Crude Oil & Natural Gas Production, Lifting and Utilization
3.0 Refinery Operations
4.0 Petroleum Product Supply & Distribution
5.0 Budget Performance Report
6.0 Federation Crude Oil & Gas Revenue
7.0 Key Determinants For Change
8.0 Glossary
4 NNPC | Monthly Financial and Operations Report October 2019 www.nnpcgroup.com | www.facebook.com/NNPCgroup | www.twitter.com/NNPCgroup
1.0 Introduction
In October 2019, the average crude oil price dwindled by $2.76 or 4.56% m-o-m to average
$57.86/b. Likewise, ICE Brent fell by $2.65 or 4.3% m-o-m, at $59.63/b while NYMEX WTI
dropped by $2.96 or 5.2% m-o-m to stand at $54.01/b. Year-to-date (y-t-d), ICE Brent was
lower by $9.37, or 12.7% y-o-y, averaging $64.21/b while NYMEX WTI diminished by $10.46,
or 15.6%, to $56.76/b.
The OPEC Oil Market Report maintained forecast for 2019 at 3.0% but slightly revised 2020
global economic growth down to 3.0% from 3.1%. As reported in previous month, there is
ongoing US-China trade dispute, mounting sovereign debt concerns in Argentina, and
continuous sluggish growth in the US as well as uncertainties surrounding the Euro-zone. For
2020, US economic growth was reduced to 1.9% while Euro-zone growth remains at 1.1%.
Likewise, GDP growth in Japan is stable at 0.3% with growth forecast in China and India
unchanged at 5.9% and 6.7% respectively. Brazil’s economic growth for 2020 is equally
upheld at 1.4% and so is Russia’s GDP growth forecast at 1.2%.
As reported by the National Bureau of Statistics, the Nigerian real Gross Domestic Product
(GDP) grew by 2.28% (quarter-on-quarter) in the third quarter of 2019; an increase of 0.17%
points from the 2.12% recorded in Q2 2019. Compared to growth rate of 1.81% in Q3 2018,
real GDP increased by 0.47% points (year-on-year). However, on a quarter-on-quarter basis,
real GDP grew by 9.23%. The growth rate in Q3 2019 represents the second highest since
2016. For the oil sector, real growth stood at 6.49% (year-on-year) in Q3 2019 indicating
9.40% points increase in comparison to the rate documented in the equivalent quarter of
2018. Also, it shows a decrease of 0.68% points relative to revised Q2 2019. Quarter-on-
Quarter, the oil sector Q3 2019 growth rate is 18.88%. Contribution of the oil sector to total
real GDP in Q3 2019 stood at 9.77%, an increase from position recorded in the corresponding
period of 2018 which recorded 9.38% as well as the 8.98% posted in the previous quarter of
the year.
As publicized in the OPEC Oil Market Report, global oil demand growth is sustained at 0.98
mb/d, to reach 99.80 mb/d; unchanged from last month’s projection. Also in 2020, Global oil
demand is retained at average of 100.88 mb/d; growing at 1.08 mb/d as estimated last
month. As a result, OECD countries are expected to contribute 0.07 mb/d while non-OECD
countries being the largest contributor are to add an estimated 1.01 mb/d. Demand for OPEC
crude in 2019 was preserved at 30.7 mb/d, around 0.9 mb/d lower than the 2018 level.
Likewise, demand for OPEC crude in 2020 remained unaffected at 29.6 mb/d, this is about
1.1 mb/d lower than the 2019 level.
For supply, the non-OPEC oil supply growth in 2019 remains at 0.16 mb/d to average 1.82
mb/d. This is due to the dominating downward review to the US supply forecast as well as
that of Indonesia. In 2020, non-OPEC oil supply is expected to drop by 36 tb/d from last
month’s evaluation and currently to grow by 2.17 mb/d, owing largely to downward revision
of the US growth forecast. In October 2019, OPEC crude oil production improved by 943 tb/d
to average 29.65 mb/d.
5 NNPC | Monthly Financial and Operations Report October 2019 www.nnpcgroup.com | www.facebook.com/NNPCgroup | www.twitter.com/NNPCgroup
In September 2019, total crude oil production in Nigeria further waned by 2.54 mb or 3.93%
to average 62.10 mb with daily average of 2.07 mb/d. Production was disrupted by shutdown
of the TFP at Forcados for repairs while Bonny NCTL was shut down due to leaks on ROW
near Boro / Awoba as well as at the Krakama axis. Production was also interrupted at Agbami,
Akpo, Egina, Escravos, Usan, Amenam, Ima and Qua Iboe due to lube oil loss, pump issues,
loss of power, riser protector replacement, pipeline repairs and flare management.
National Gas production in October increased minimally by 0.49% at 236.27BCF compared
to output in September 2019; translating to an average daily production of 7,622.00mmscfd.
However, the daily average natural gas supply to gas power plants decreased by 6.97% to
553mmscfd, equivalent to power generation of 2,050MW.
To ensure continuous increased PMS supply and effective distribution across the country, a
total of 1.16bn litres of PMS translating to 37.30mn liters/day were supplied for the month;
in the downstream sector. The Corporation has continued to diligently monitor the daily
stock of Premium Motor Spirit (PMS) to achieve smooth distribution of petroleum products
and zero fuel queue across the Nation.
In October 2019, a total of 35 pipeline points were vandalized representing a creditable
decrease of 81% from the 186 points vandalized in September 2019. Out of the vandalized
points, 8 failed to be welded while only 1 pipeline was ruptured. Ibadan-Ilorin axis accounted
for 34% of the breaks while ATC-Mosimi and other routes accounted for 23% and 43%
respectively. NNPC in collaboration with the local communities and other stakeholders
continuously strive to reduce and eventually eliminate this menace.
This 51st edition of the Report indicates an additional increased trading surplus of
₦13.23Billion compared to the ₦8.59Billion surplus posted in September 2019. The increase
of 54% in the month is majorly the result of improved trading surplus posted by NPDC which
dominated the deficit in performances of other SBUs particularly in the downstream sector
as well as the refineries and the corporate headquarters.
This report highlights NNPC’s activities for the period of October 2018 to October 2019. In
line with the Corporation’s commitment to becoming more accountable, responsive and
transparent and a FACTI based Organization; the Corporation has continued to sustain
effective communication with stakeholders through this report via publications on its
website and in national dailies. NNPC in return demands continued support from Nigerians
especially in areas of security to achieve zero vandalism of the Nation’s oil & gas
infrastructure.
Activity update
Eliminating Gas Flare Remains Priority
WRPC Achieves Feat in Maintenance of FCC Unit, Saves Cost
World Environment Day: PHRC Takes Anti-Air Pollution Campaign to Schools
223 Companies Bid for NNPC Natural Gas Liquids in Bid to Expand LPG Market
6 NNPC | Monthly Financial and Operations Report October 2019 www.nnpcgroup.com | www.facebook.com/NNPCgroup | www.twitter.com/NNPCgroup
2 National Crude Oil & Natural Gas Production, Lifting and Utilization
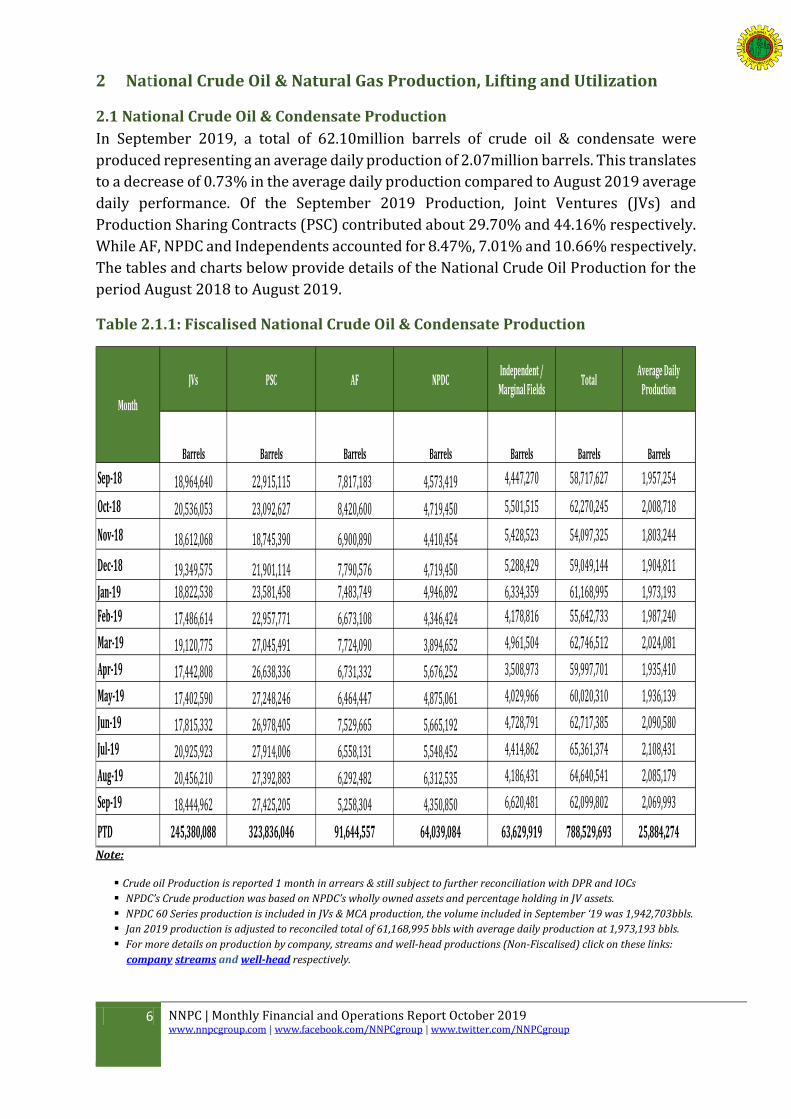
2.1 National Crude Oil & Condensate Production
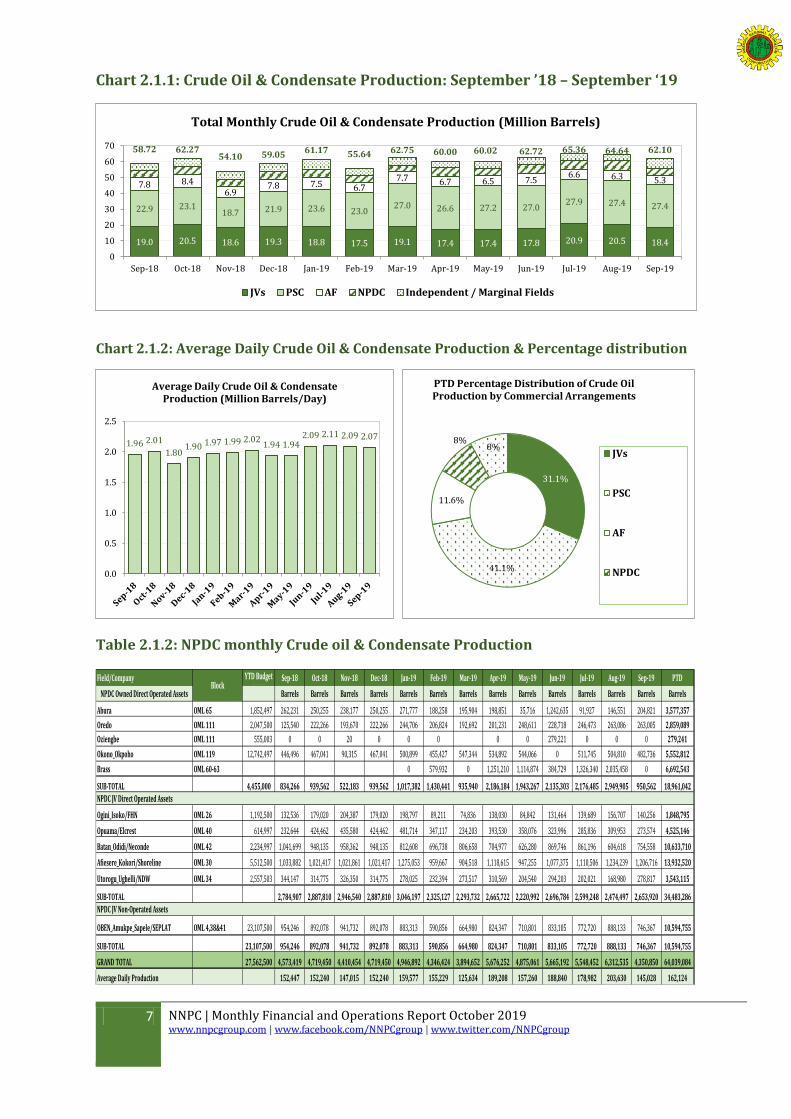
In September 2019, a total of 62.10million barrels of crude oil & condensate were
produced representing an average daily production of 2.07million barrels. This translates
to a decrease of 0.73% in the average daily production compared to August 2019 average
daily performance. Of the September 2019 Production, Joint Ventures (JVs) and
Production Sharing Contracts (PSC) contributed about 29.70% and 44.16% respectively.
While AF, NPDC and Independents accounted for 8.47%, 7.01% and 10.66% respectively.
The tables and charts below provide details of the National Crude Oil Production for the
period August 2018 to August 2019.
Table 2.1.1: Fiscalised National Crude Oil & Condensate Production
JVs PSC AF NPDCIndependent /
Marginal FieldsTotal
Average Daily Production
Barrels Barrels Barrels Barrels Barrels Barrels Barrels
Sep-18 18,964,640 22,915,115 7,817,183 4,573,419 4,447,270 58,717,627 1,957,254
Oct-18 20,536,053 23,092,627 8,420,600 4,719,450 5,501,515 62,270,245 2,008,718
Nov-18 18,612,068 18,745,390 6,900,890 4,410,454 5,428,523 54,097,325 1,803,244
Dec-18 19,349,575 21,901,114 7,790,576 4,719,450 5,288,429 59,049,144 1,904,811
Jan-19 18,822,538 23,581,458 7,483,749 4,946,892 6,334,359 61,168,995 1,973,193
Feb-19 17,486,614 22,957,771 6,673,108 4,346,424 4,178,816 55,642,733 1,987,240
Mar-19 19,120,775 27,045,491 7,724,090 3,894,652 4,961,504 62,746,512 2,024,081
Apr-19 17,442,808 26,638,336 6,731,332 5,676,252 3,508,973 59,997,701 1,935,410
May-19 17,402,590 27,248,246 6,464,447 4,875,061 4,029,966 60,020,310 1,936,139
Jun-19 17,815,332 26,978,405 7,529,665 5,665,192 4,728,791 62,717,385 2,090,580
Jul-19 20,925,923 27,914,006 6,558,131 5,548,452 4,414,862 65,361,374 2,108,431
Aug-19 20,456,210 27,392,883 6,292,482 6,312,535 4,186,431 64,640,541 2,085,179
Sep-19 18,444,962 27,425,205 5,258,304 4,350,850 6,620,481 62,099,802 2,069,993
PTD 245,380,088 323,836,046 91,644,557 64,039,084 63,629,919 788,529,693 25,884,274
Month
Note:
Crude oil Production is reported 1 month in arrears & still subject to further reconciliation with DPR and IOCs NPDC’s Crude production was based on NPDC’s wholly owned assets and percentage holding in JV assets.
NPDC 60 Series production is included in JVs & MCA production, the volume included in September ‘19 was 1,942,703bbls.
Jan 2019 production is adjusted to reconciled total of 61,168,995 bbls with average daily production at 1,973,193 bbls.
For more details on production by company, streams and well-head productions (Non-Fiscalised) click on these links:
company streams and well-head respectively.
7 NNPC | Monthly Financial and Operations Report October 2019 www.nnpcgroup.com | www.facebook.com/NNPCgroup | www.twitter.com/NNPCgroup
Chart 2.1.1: Crude Oil & Condensate Production: September ’18 – September ‘19
Chart 2.1.2: Average Daily Crude Oil & Condensate Production & Percentage distribution
Table 2.1.2: NPDC monthly Crude oil & Condensate Production
Field/Company YTD Budget
(bbls)Sep-18 Oct-18 Nov-18 Dec-18 Jan-19 Feb-19 Mar-19 Apr-19 May-19 Jun-19 Jul-19 Aug-19 Sep-19 PTD
NPDC Owned Direct Operated Assets Barrels Barrels Barrels Barrels Barrels Barrels Barrels Barrels Barrels Barrels Barrels Barrels Barrels Barrels
Abura OML 65 1,852,497 262,231 250,255 238,177 250,255 271,777 188,258 195,904 198,851 35,716 1,242,635 91,927 146,551 204,821 3,577,357
Oredo OML 111 2,047,500 125,540 222,266 193,670 222,266 244,706 206,824 192,692 201,231 248,611 228,718 246,473 263,086 263,005 2,859,089
Oziengbe OML 111 555,003 0 0 20 0 0 0 0 0 279,221 0 0 0 279,241
Okono_Okpoho OML 119 12,742,497 446,496 467,041 90,315 467,041 500,899 455,427 547,344 534,892 544,066 0 511,745 504,810 482,736 5,552,812
Brass OML 60-63 0 579,932 0 1,251,210 1,114,874 384,729 1,326,340 2,035,458 0 6,692,543
SUB-TOTAL 4,455,000 834,266 939,562 522,183 939,562 1,017,382 1,430,441 935,940 2,186,184 1,943,267 2,135,303 2,176,485 2,949,905 950,562 18,961,042
Ogini_Isoko/FHN OML 26 1,192,500 132,536 179,020 204,387 179,020 198,797 89,211 74,836 138,030 84,842 131,464 139,689 156,707 140,256 1,848,795
Opuama/Elcrest OML 40 614,997 232,644 424,462 435,580 424,462 481,714 347,117 234,203 393,530 358,076 323,996 285,836 309,953 273,574 4,525,146
Batan_Odidi/Neconde OML 42 2,234,997 1,041,699 948,135 958,362 948,135 812,608 696,738 806,658 704,977 626,280 869,746 861,196 604,618 754,558 10,633,710
Afiesere_Kokori/Shoreline OML 30 5,512,500 1,033,882 1,021,417 1,021,861 1,021,417 1,275,053 959,667 904,518 1,118,615 947,255 1,077,375 1,110,506 1,234,239 1,206,716 13,932,520
Utorogu_Ughelli/NDW OML 34 2,557,503 344,147 314,775 326,350 314,775 278,025 232,394 273,517 310,569 204,540 294,203 202,021 168,980 278,817 3,543,115
SUB-TOTAL 2,784,907 2,887,810 2,946,540 2,887,810 3,046,197 2,325,127 2,293,732 2,665,722 2,220,992 2,696,784 2,599,248 2,474,497 2,653,920 34,483,286
OBEN_Amukpe_Sapele/SEPLAT OML 4,38&41 23,107,500 954,246 892,078 941,732 892,078 883,313 590,856 664,980 824,347 710,801 833,105 772,720 888,133 746,367 10,594,755
SUB-TOTAL 23,107,500 954,246 892,078 941,732 892,078 883,313 590,856 664,980 824,347 710,801 833,105 772,720 888,133 746,367 10,594,755
GRAND TOTAL 27,562,500 4,573,419 4,719,450 4,410,454 4,719,450 4,946,892 4,346,424 3,894,652 5,676,252 4,875,061 5,665,192 5,548,452 6,312,535 4,350,850 64,039,084
Average Daily Production 152,447 152,240 147,015 152,240 159,577 155,229 125,634 189,208 157,260 188,840 178,982 203,630 145,028 162,124
NPDC JV Non-Operated Assets
NPDC JV Direct Operated Assets
Block
19.0 20.5 18.6 19.3 18.8 17.5 19.1 17.4 17.4 17.8 20.9 20.5 18.4
22.9 23.118.7 21.9 23.6 23.0
27.0 26.6 27.2 27.027.9 27.4 27.4
7.8 8.46.9
7.8 7.5 6.77.7 6.7 6.5 7.5
6.6 6.3 5.3
58.72 62.2754.10 59.05 61.17 55.64 62.75 60.00 60.02 62.72 65.36 64.64 62.10
0
10
20
30
40
50
60
70
Sep-18 Oct-18 Nov-18 Dec-18 Jan-19 Feb-19 Mar-19 Apr-19 May-19 Jun-19 Jul-19 Aug-19 Sep-19
Total Monthly Crude Oil & Condensate Production (Million Barrels)
JVs PSC AF NPDC Independent / Marginal Fields
1.96 2.01
1.801.90 1.97 1.99 2.02
1.94 1.942.09 2.11 2.09 2.07
0.0
0.5
1.0
1.5
2.0
2.5
Average Daily Crude Oil & Condensate Production (Million Barrels/Day)
31.1%
41.1%
11.6%
8%8%
PTD Percentage Distribution of Crude Oil Production by Commercial Arrangements
JVs
PSC
AF
NPDC
8 NNPC | Monthly Financial and Operations Report October 2019 www.nnpcgroup.com | www.facebook.com/NNPCgroup | www.twitter.com/NNPCgroup
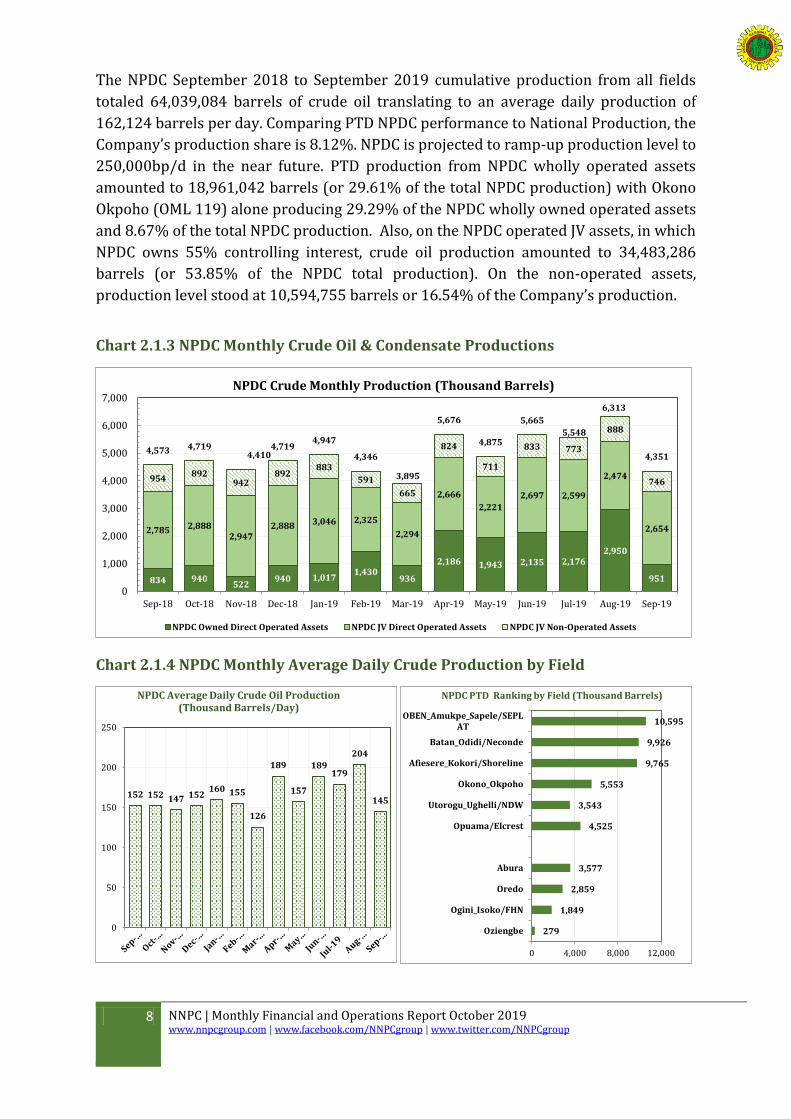
The NPDC September 2018 to September 2019 cumulative production from all fields
totaled 64,039,084 barrels of crude oil translating to an average daily production of
162,124 barrels per day. Comparing PTD NPDC performance to National Production, the
Company’s production share is 8.12%. NPDC is projected to ramp-up production level to
250,000bp/d in the near future. PTD production from NPDC wholly operated assets
amounted to 18,961,042 barrels (or 29.61% of the total NPDC production) with Okono
Okpoho (OML 119) alone producing 29.29% of the NPDC wholly owned operated assets
and 8.67% of the total NPDC production. Also, on the NPDC operated JV assets, in which
NPDC owns 55% controlling interest, crude oil production amounted to 34,483,286
barrels (or 53.85% of the NPDC total production). On the non-operated assets,
production level stood at 10,594,755 barrels or 16.54% of the Company’s production.
Chart 2.1.3 NPDC Monthly Crude Oil & Condensate Productions
Chart 2.1.4 NPDC Monthly Average Daily Crude Production by Field
834 940522
940 1,0171,430
936
2,186 1,943 2,135 2,1762,950
951
2,785 2,8882,947
2,888 3,046 2,325
2,294
2,666
2,221
2,697 2,599
2,474
2,654
954892
942892
883
591
665
824
711
833 773
888
746
4,573 4,7194,410
4,7194,947
4,346
3,895
5,676
4,875
5,665
5,548
6,313
4,351
0
1,000
2,000
3,000
4,000
5,000
6,000
7,000
Sep-18 Oct-18 Nov-18 Dec-18 Jan-19 Feb-19 Mar-19 Apr-19 May-19 Jun-19 Jul-19 Aug-19 Sep-19
NPDC Crude Monthly Production (Thousand Barrels)
NPDC Owned Direct Operated Assets NPDC JV Direct Operated Assets NPDC JV Non-Operated Assets
152 152 147 152160 155
126
189
157
189179
204
145
0
50
100
150
200
250
NPDC Average Daily Crude Oil Production(Thousand Barrels/Day)
279
1,849
2,859
3,577
4,525
3,543
5,553
9,765
9,926
10,595
0 4,000 8,000 12,000
Oziengbe
Ogini_Isoko/FHN
Oredo
Abura
Opuama/Elcrest
Utorogu_Ughelli/NDW
Okono_Okpoho
Afiesere_Kokori/Shoreline
Batan_Odidi/Neconde
OBEN_Amukpe_Sapele/SEPLAT
NPDC PTD Ranking by Field (Thousand Barrels)
9 NNPC | Monthly Financial and Operations Report October 2019 www.nnpcgroup.com | www.facebook.com/NNPCgroup | www.twitter.com/NNPCgroup
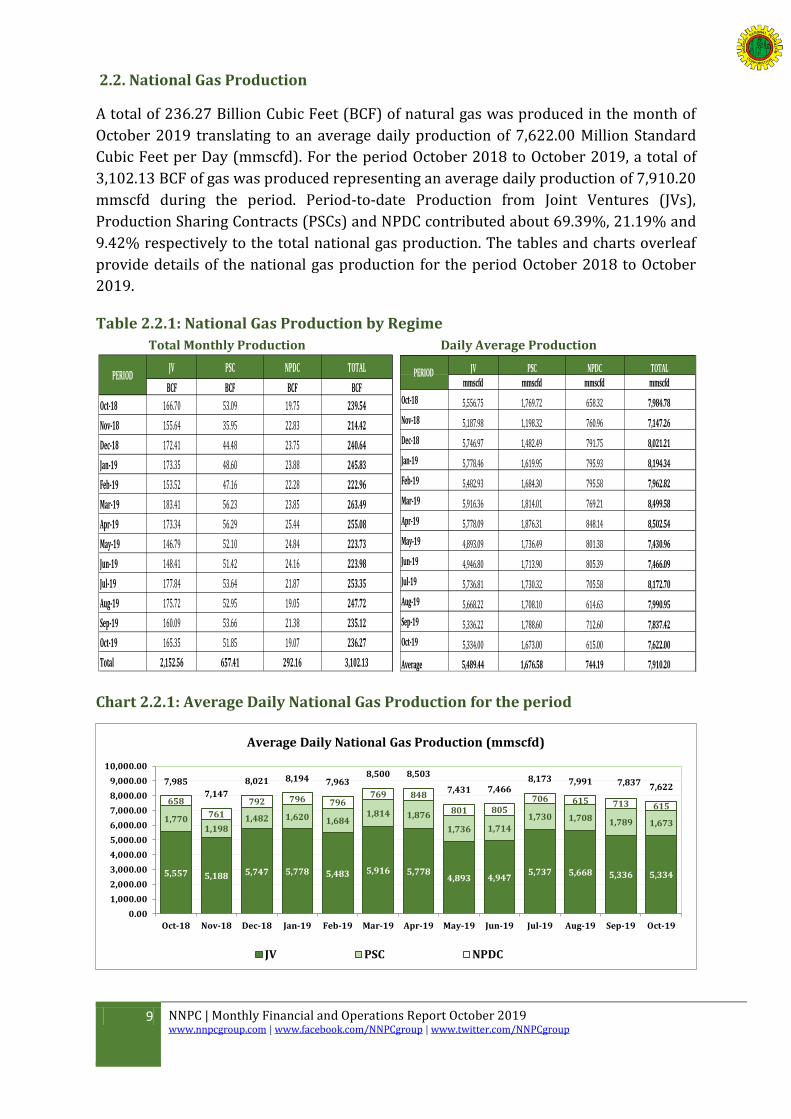
2.2. National Gas Production
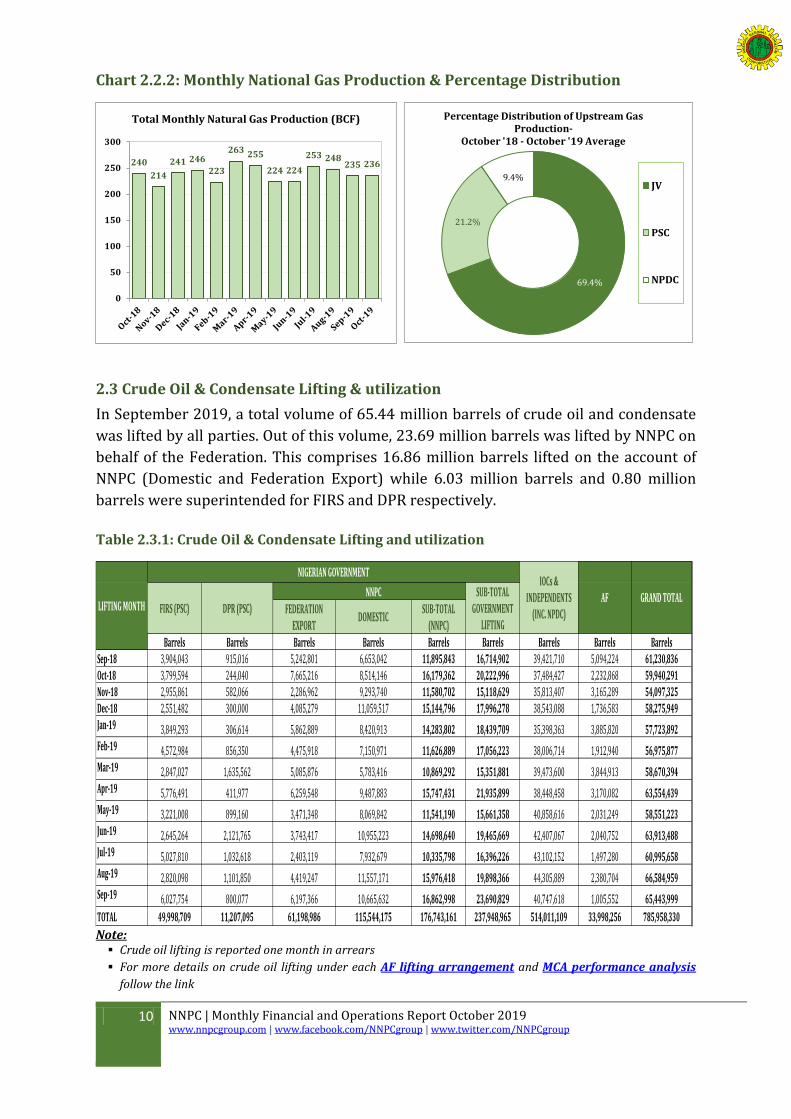
A total of 236.27 Billion Cubic Feet (BCF) of natural gas was produced in the month of
October 2019 translating to an average daily production of 7,622.00 Million Standard
Cubic Feet per Day (mmscfd). For the period October 2018 to October 2019, a total of
3,102.13 BCF of gas was produced representing an average daily production of 7,910.20
mmscfd during the period. Period-to-date Production from Joint Ventures (JVs),
Production Sharing Contracts (PSCs) and NPDC contributed about 69.39%, 21.19% and
9.42% respectively to the total national gas production. The tables and charts overleaf
provide details of the national gas production for the period October 2018 to October
2019.
Table 2.2.1: National Gas Production by Regime
Total Monthly Production Daily Average Production
JV PSC NPDC TOTAL
BCF BCF BCF BCF
Oct-18 166.70 53.09 19.75 239.54
Nov-18 155.64 35.95 22.83 214.42
Dec-18 172.41 44.48 23.75 240.64
Jan-19 173.35 48.60 23.88 245.83
Feb-19 153.52 47.16 22.28 222.96
Mar-19 183.41 56.23 23.85 263.49
Apr-19 173.34 56.29 25.44 255.08
May-19 146.79 52.10 24.84 223.73
Jun-19 148.41 51.42 24.16 223.98
Jul-19 177.84 53.64 21.87 253.35
Aug-19 175.72 52.95 19.05 247.72
Sep-19 160.09 53.66 21.38 235.12
Oct-19 165.35 51.85 19.07 236.27
Total 2,152.56 657.41 292.16 3,102.13
PERIOD
JV PSC NPDC TOTALmmscfd mmscfd mmscfd mmscfd
Oct-18 5,556.75 1,769.72 658.32 7,984.78
Nov-18 5,187.98 1,198.32 760.96 7,147.26
Dec-18 5,746.97 1,482.49 791.75 8,021.21
Jan-19 5,778.46 1,619.95 795.93 8,194.34
Feb-19 5,482.93 1,684.30 795.58 7,962.82
Mar-19 5,916.36 1,814.01 769.21 8,499.58
Apr-19 5,778.09 1,876.31 848.14 8,502.54
May-19 4,893.09 1,736.49 801.38 7,430.96
Jun-19 4,946.80 1,713.90 805.39 7,466.09
Jul-19 5,736.81 1,730.32 705.58 8,172.70
Aug-19 5,668.22 1,708.10 614.63 7,990.95
Sep-19 5,336.22 1,788.60 712.60 7,837.42
Oct-19 5,334.00 1,673.00 615.00 7,622.00
Average 5,489.44 1,676.58 744.19 7,910.20
PERIOD
Chart 2.2.1: Average Daily National Gas Production for the period
5,557 5,188 5,747 5,778 5,483 5,916 5,7784,893 4,947
5,737 5,668 5,336 5,334
1,7701,198
1,482 1,620 1,6841,814 1,876
1,736 1,714
1,730 1,708 1,789 1,673
658
761
792 796 796769 848
801 805706 615 713 615
7,985
7,147
8,021 8,194 7,9638,500 8,503
7,431 7,4668,173 7,991 7,837 7,622
0.00
1,000.00
2,000.00
3,000.00
4,000.00
5,000.00
6,000.00
7,000.00
8,000.00
9,000.00
10,000.00
Oct-18 Nov-18 Dec-18 Jan-19 Feb-19 Mar-19 Apr-19 May-19 Jun-19 Jul-19 Aug-19 Sep-19 Oct-19
Average Daily National Gas Production (mmscfd)
JV PSC NPDC
10 NNPC | Monthly Financial and Operations Report October 2019 www.nnpcgroup.com | www.facebook.com/NNPCgroup | www.twitter.com/NNPCgroup
Chart 2.2.2: Monthly National Gas Production & Percentage Distribution
2.3 Crude Oil & Condensate Lifting & utilization
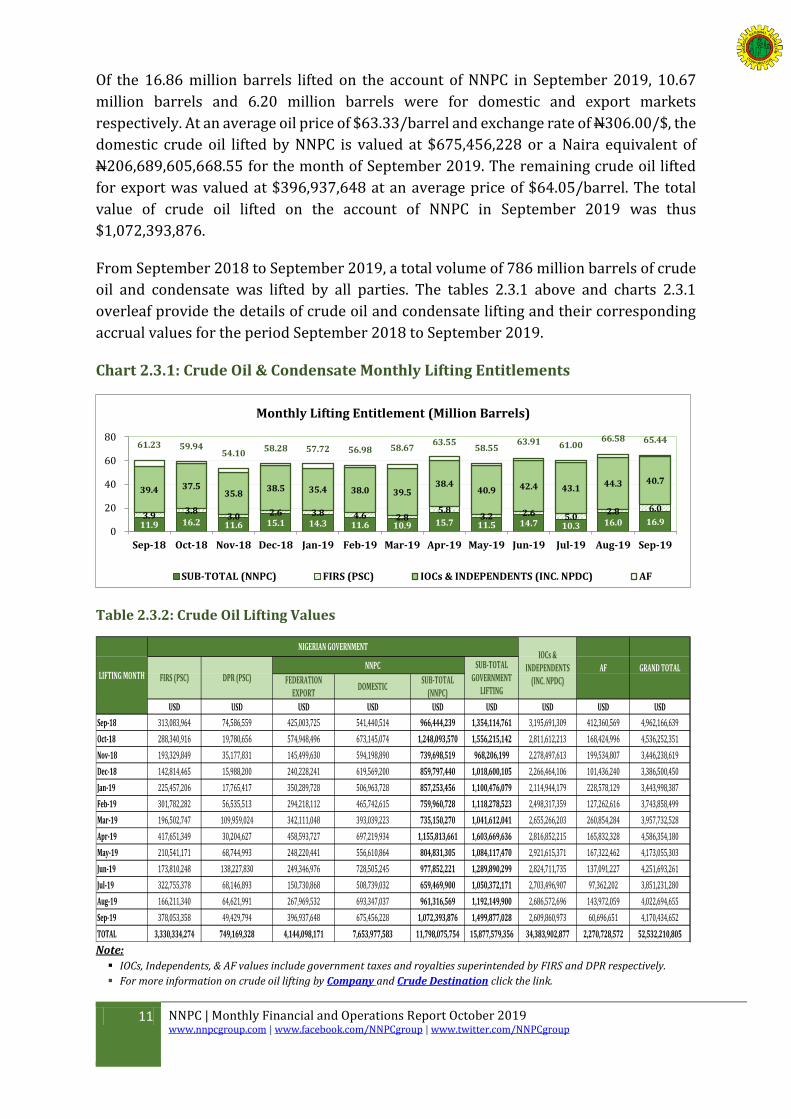
In September 2019, a total volume of 65.44 million barrels of crude oil and condensate
was lifted by all parties. Out of this volume, 23.69 million barrels was lifted by NNPC on
behalf of the Federation. This comprises 16.86 million barrels lifted on the account of
NNPC (Domestic and Federation Export) while 6.03 million barrels and 0.80 million
barrels were superintended for FIRS and DPR respectively.
Table 2.3.1: Crude Oil & Condensate Lifting and utilization
NNPC
Barrels Barrels Barrels Barrels Barrels Barrels Barrels Barrels BarrelsSep-18 3,904,043 915,016 5,242,801 6,653,042 11,895,843 16,714,902 39,421,710 5,094,224 61,230,836Oct-18 3,799,594 244,040 7,665,216 8,514,146 16,179,362 20,222,996 37,484,427 2,232,868 59,940,291Nov-18 2,955,861 582,066 2,286,962 9,293,740 11,580,702 15,118,629 35,813,407 3,165,289 54,097,325Dec-18 2,551,482 300,000 4,085,279 11,059,517 15,144,796 17,996,278 38,543,088 1,736,583 58,275,949Jan-19 3,849,293 306,614 5,862,889 8,420,913 14,283,802 18,439,709 35,398,363 3,885,820 57,723,892Feb-19 4,572,984 856,350 4,475,918 7,150,971 11,626,889 17,056,223 38,006,714 1,912,940 56,975,877Mar-19 2,847,027 1,635,562 5,085,876 5,783,416 10,869,292 15,351,881 39,473,600 3,844,913 58,670,394Apr-19 5,776,491 411,977 6,259,548 9,487,883 15,747,431 21,935,899 38,448,458 3,170,082 63,554,439May-19 3,221,008 899,160 3,471,348 8,069,842 11,541,190 15,661,358 40,858,616 2,031,249 58,551,223Jun-19 2,645,264 2,121,765 3,743,417 10,955,223 14,698,640 19,465,669 42,407,067 2,040,752 63,913,488Jul-19 5,027,810 1,032,618 2,403,119 7,932,679 10,335,798 16,396,226 43,102,152 1,497,280 60,995,658Aug-19 2,820,098 1,101,850 4,419,247 11,557,171 15,976,418 19,898,366 44,305,889 2,380,704 66,584,959Sep-19 6,027,754 800,077 6,197,366 10,665,632 16,862,998 23,690,829 40,747,618 1,005,552 65,443,999
TOTAL 49,998,709 11,207,095 61,198,986 115,544,175 176,743,161 237,948,965 514,011,109 33,998,256 785,958,330
AF GRAND TOTALDPR (PSC)
SUB-TOTAL GOVERNMENT
LIFTINGFEDERATION
EXPORTSUB-TOTAL
(NNPC)
IOCs & INDEPENDENTS
(INC. NPDC)DOMESTIC LIFTING MONTH
NIGERIAN GOVERNMENT
FIRS (PSC)
Note: Crude oil lifting is reported one month in arrears
For more details on crude oil lifting under each AF lifting arrangement and MCA performance analysis
follow the link
240
214
241 246
223
263 255
224 224
253 248235 236
0
50
100
150
200
250
300
Total Monthly Natural Gas Production (BCF)
69.4%
21.2%
9.4%
Percentage Distribution of Upstream Gas Production-
October '18 - October '19 Average
JV
PSC
NPDC
11 NNPC | Monthly Financial and Operations Report October 2019 www.nnpcgroup.com | www.facebook.com/NNPCgroup | www.twitter.com/NNPCgroup
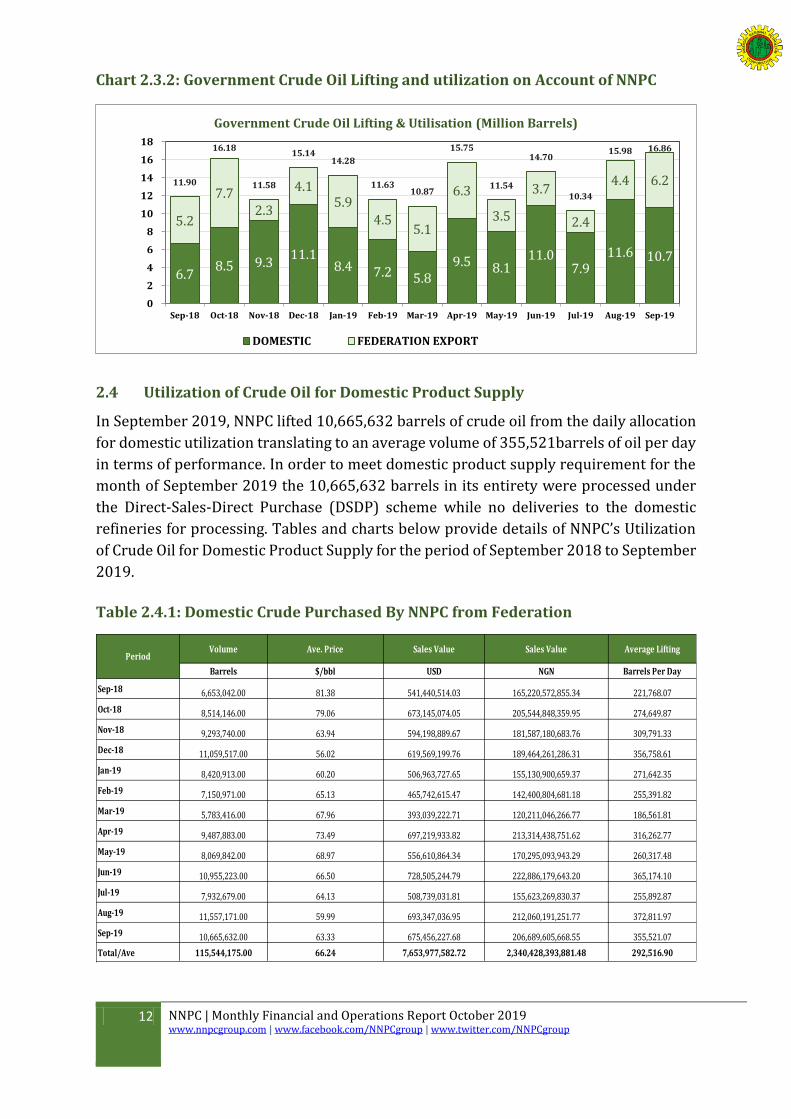
Of the 16.86 million barrels lifted on the account of NNPC in September 2019, 10.67
million barrels and 6.20 million barrels were for domestic and export markets
respectively. At an average oil price of $63.33/barrel and exchange rate of N306.00/$, the
domestic crude oil lifted by NNPC is valued at $675,456,228 or a Naira equivalent of
N206,689,605,668.55 for the month of September 2019. The remaining crude oil lifted
for export was valued at $396,937,648 at an average price of $64.05/barrel. The total
value of crude oil lifted on the account of NNPC in September 2019 was thus
$1,072,393,876.
From September 2018 to September 2019, a total volume of 786 million barrels of crude
oil and condensate was lifted by all parties. The tables 2.3.1 above and charts 2.3.1
overleaf provide the details of crude oil and condensate lifting and their corresponding
accrual values for the period September 2018 to September 2019.
Chart 2.3.1: Crude Oil & Condensate Monthly Lifting Entitlements
Table 2.3.2: Crude Oil Lifting Values
NNPC
USD USD USD USD USD USD USD USD USD
Sep-18 313,083,964 74,586,559 425,003,725 541,440,514 966,444,239 1,354,114,761 3,195,691,309 412,360,569 4,962,166,639
Oct-18 288,340,916 19,780,656 574,948,496 673,145,074 1,248,093,570 1,556,215,142 2,811,612,213 168,424,996 4,536,252,351
Nov-18 193,329,849 35,177,831 145,499,630 594,198,890 739,698,519 968,206,199 2,278,497,613 199,534,807 3,446,238,619
Dec-18 142,814,465 15,988,200 240,228,241 619,569,200 859,797,440 1,018,600,105 2,266,464,106 101,436,240 3,386,500,450
Jan-19 225,457,206 17,765,417 350,289,728 506,963,728 857,253,456 1,100,476,079 2,114,944,179 228,578,129 3,443,998,387
Feb-19 301,782,282 56,535,513 294,218,112 465,742,615 759,960,728 1,118,278,523 2,498,317,359 127,262,616 3,743,858,499
Mar-19 196,502,747 109,959,024 342,111,048 393,039,223 735,150,270 1,041,612,041 2,655,266,203 260,854,284 3,957,732,528
Apr-19 417,651,349 30,204,627 458,593,727 697,219,934 1,155,813,661 1,603,669,636 2,816,852,215 165,832,328 4,586,354,180
May-19 210,541,171 68,744,993 248,220,441 556,610,864 804,831,305 1,084,117,470 2,921,615,371 167,322,462 4,173,055,303
Jun-19 173,810,248 138,227,830 249,346,976 728,505,245 977,852,221 1,289,890,299 2,824,711,735 137,091,227 4,251,693,261
Jul-19 322,755,378 68,146,893 150,730,868 508,739,032 659,469,900 1,050,372,171 2,703,496,907 97,362,202 3,851,231,280
Aug-19 166,211,340 64,621,991 267,969,532 693,347,037 961,316,569 1,192,149,900 2,686,572,696 143,972,059 4,022,694,655
Sep-19 378,053,358 49,429,794 396,937,648 675,456,228 1,072,393,876 1,499,877,028 2,609,860,973 60,696,651 4,170,434,652
TOTAL 3,330,334,274 749,169,328 4,144,098,171 7,653,977,583 11,798,075,754 15,877,579,356 34,383,902,877 2,270,728,572 52,532,210,805
AF GRAND TOTALFIRS (PSC) DPR (PSC)LIFTING MONTH
IOCs & INDEPENDENTS
(INC. NPDC)
NIGERIAN GOVERNMENT
SUB-TOTAL (NNPC)
DOMESTIC
SUB-TOTAL GOVERNMENT
LIFTINGFEDERATION
EXPORT
Note:
IOCs, Independents, & AF values include government taxes and royalties superintended by FIRS and DPR respectively.
For more information on crude oil lifting by Company and Crude Destination click the link.
11.9 16.2 11.6 15.1 14.3 11.6 10.9 15.7 11.5 14.7 10.3 16.0 16.93.9
3.83.0 2.6 3.8 4.6 2.8
5.83.2 2.6 5.0
2.8 6.0
39.4 37.535.8
38.5 35.4 38.0 39.538.4
40.9 42.4 43.144.3 40.7
61.23 59.9454.10
58.28 57.72 56.98 58.6763.55
58.5563.91 61.00
66.58 65.44
0
20
40
60
80
Sep-18 Oct-18 Nov-18 Dec-18 Jan-19 Feb-19 Mar-19 Apr-19 May-19 Jun-19 Jul-19 Aug-19 Sep-19
Monthly Lifting Entitlement (Million Barrels)
SUB-TOTAL (NNPC) FIRS (PSC) IOCs & INDEPENDENTS (INC. NPDC) AF
12 NNPC | Monthly Financial and Operations Report October 2019 www.nnpcgroup.com | www.facebook.com/NNPCgroup | www.twitter.com/NNPCgroup
Chart 2.3.2: Government Crude Oil Lifting and utilization on Account of NNPC
2.4 Utilization of Crude Oil for Domestic Product Supply
In September 2019, NNPC lifted 10,665,632 barrels of crude oil from the daily allocation
for domestic utilization translating to an average volume of 355,521barrels of oil per day
in terms of performance. In order to meet domestic product supply requirement for the
month of September 2019 the 10,665,632 barrels in its entirety were processed under
the Direct-Sales-Direct Purchase (DSDP) scheme while no deliveries to the domestic
refineries for processing. Tables and charts below provide details of NNPC’s Utilization
of Crude Oil for Domestic Product Supply for the period of September 2018 to September
2019.
Table 2.4.1: Domestic Crude Purchased By NNPC from Federation
Volume Ave. Price Sales Value Sales Value Average Lifting
Barrels $/bbl USD NGN Barrels Per Day
Sep-18 6,653,042.00 81.38 541,440,514.03 165,220,572,855.34 221,768.07
Oct-18 8,514,146.00 79.06 673,145,074.05 205,544,848,359.95 274,649.87
Nov-18 9,293,740.00 63.94 594,198,889.67 181,587,180,683.76 309,791.33
Dec-18 11,059,517.00 56.02 619,569,199.76 189,464,261,286.31 356,758.61
Jan-19 8,420,913.00 60.20 506,963,727.65 155,130,900,659.37 271,642.35
Feb-19 7,150,971.00 65.13 465,742,615.47 142,400,804,681.18 255,391.82
Mar-19 5,783,416.00 67.96 393,039,222.71 120,211,046,266.77 186,561.81
Apr-19 9,487,883.00 73.49 697,219,933.82 213,314,438,751.62 316,262.77
May-19 8,069,842.00 68.97 556,610,864.34 170,295,093,943.29 260,317.48
Jun-19 10,955,223.00 66.50 728,505,244.79 222,886,179,643.20 365,174.10
Jul-19 7,932,679.00 64.13 508,739,031.81 155,623,269,830.37 255,892.87
Aug-19 11,557,171.00 59.99 693,347,036.95 212,060,191,251.77 372,811.97
Sep-19 10,665,632.00 63.33 675,456,227.68 206,689,605,668.55 355,521.07
Total/Ave 115,544,175.00 66.24 7,653,977,582.72 2,340,428,393,881.48 292,516.90
Period
6.78.5 9.3
11.18.4 7.2 5.8
9.5 8.111.0
7.911.6 10.7
5.2
7.72.3
4.15.9
4.55.1
6.3
3.5
3.7
2.4
4.4 6.211.90
16.18
11.58
15.1414.28
11.6310.87
15.75
11.54
14.70
10.34
15.98 16.86
0
2
4
6
8
10
12
14
16
18
Sep-18 Oct-18 Nov-18 Dec-18 Jan-19 Feb-19 Mar-19 Apr-19 May-19 Jun-19 Jul-19 Aug-19 Sep-19
Government Crude Oil Lifting & Utilisation (Million Barrels)
DOMESTIC FEDERATION EXPORT
13 NNPC | Monthly Financial and Operations Report October 2019 www.nnpcgroup.com | www.facebook.com/NNPCgroup | www.twitter.com/NNPCgroup
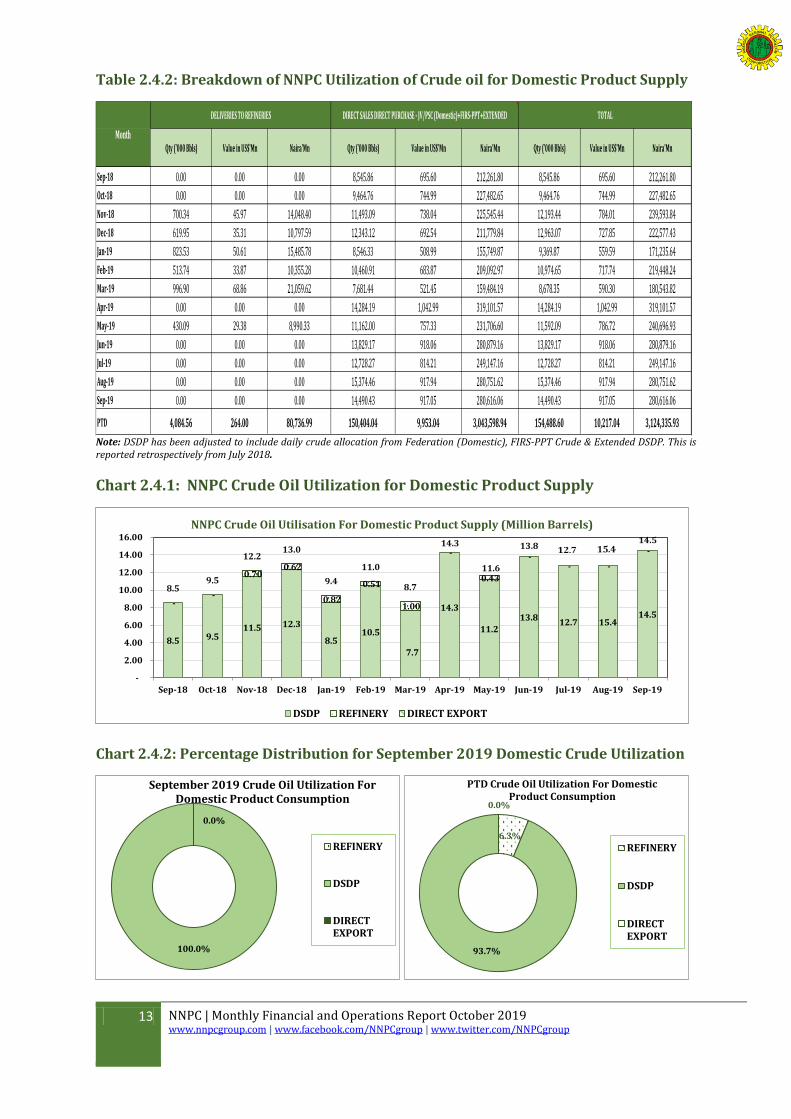
Table 2.4.2: Breakdown of NNPC Utilization of Crude oil for Domestic Product Supply
Qty ('000 Bbls) Value in US$'Mn Naira'Mn Qty ('000 Bbls) Value in US$'Mn Naira'Mn Qty ('000 Bbls) Value in US$'Mn Naira'Mn
Sep-18 0.00 0.00 0.00 8,545.86 695.60 212,261.80 8,545.86 695.60 212,261.80
Oct-18 0.00 0.00 0.00 9,464.76 744.99 227,482.65 9,464.76 744.99 227,482.65
Nov-18 700.34 45.97 14,048.40 11,493.09 738.04 225,545.44 12,193.44 784.01 239,593.84
Dec-18 619.95 35.31 10,797.59 12,343.12 692.54 211,779.84 12,963.07 727.85 222,577.43
Jan-19 823.53 50.61 15,485.78 8,546.33 508.99 155,749.87 9,369.87 559.59 171,235.64
Feb-19 513.74 33.87 10,355.28 10,460.91 683.87 209,092.97 10,974.65 717.74 219,448.24
Mar-19 996.90 68.86 21,059.62 7,681.44 521.45 159,484.19 8,678.35 590.30 180,543.82
Apr-19 0.00 0.00 0.00 14,284.19 1,042.99 319,101.57 14,284.19 1,042.99 319,101.57
May-19 430.09 29.38 8,990.33 11,162.00 757.33 231,706.60 11,592.09 786.72 240,696.93
Jun-19 0.00 0.00 0.00 13,829.17 918.06 280,879.16 13,829.17 918.06 280,879.16
Jul-19 0.00 0.00 0.00 12,728.27 814.21 249,147.16 12,728.27 814.21 249,147.16
Aug-19 0.00 0.00 0.00 15,374.46 917.94 280,751.62 15,374.46 917.94 280,751.62
Sep-19 0.00 0.00 0.00 14,490.43 917.05 280,616.06 14,490.43 917.05 280,616.06
PTD 4,084.56 264.00 80,736.99 150,404.04 9,953.04 3,043,598.94 154,488.60 10,217.04 3,124,335.93
Month
TOTAL DELIVERIES TO REFINERIES DIRECT SALES DIRECT PURCHASE - JV/PSC (Domestic)+FIRS-PPT+EXTENDED
Note: DSDP has been adjusted to include daily crude allocation from Federation (Domestic), FIRS-PPT Crude & Extended DSDP. This is reported retrospectively from July 2018.
Chart 2.4.1: NNPC Crude Oil Utilization for Domestic Product Supply
Chart 2.4.2: Percentage Distribution for September 2019 Domestic Crude Utilization
8.5 9.511.5 12.3
8.510.5
7.7
14.3
11.2
13.812.7 15.4
14.5-
-
0.70 0.62
0.82
0.51
1.00
-
0.43
-- -
-
8.59.5
12.213.0
9.4
11.0
8.7
14.3
11.6
13.814.5
-
2.00
4.00
6.00
8.00
10.00
12.00
14.00
16.00
Sep-18 Oct-18 Nov-18 Dec-18 Jan-19 Feb-19 Mar-19 Apr-19 May-19 Jun-19 Jul-19 Aug-19 Sep-19
NNPC Crude Oil Utilisation For Domestic Product Supply (Million Barrels)
DSDP REFINERY DIRECT EXPORT
100.0%
September 2019 Crude Oil Utilization For Domestic Product Consumption
REFINERY
DSDP
DIRECTEXPORT
0.0%
6.3%
93.7%
0.0%
PTD Crude Oil Utilization For Domestic Product Consumption
REFINERY
DSDP
DIRECTEXPORT
14 NNPC | Monthly Financial and Operations Report October 2019 www.nnpcgroup.com | www.facebook.com/NNPCgroup | www.twitter.com/NNPCgroup
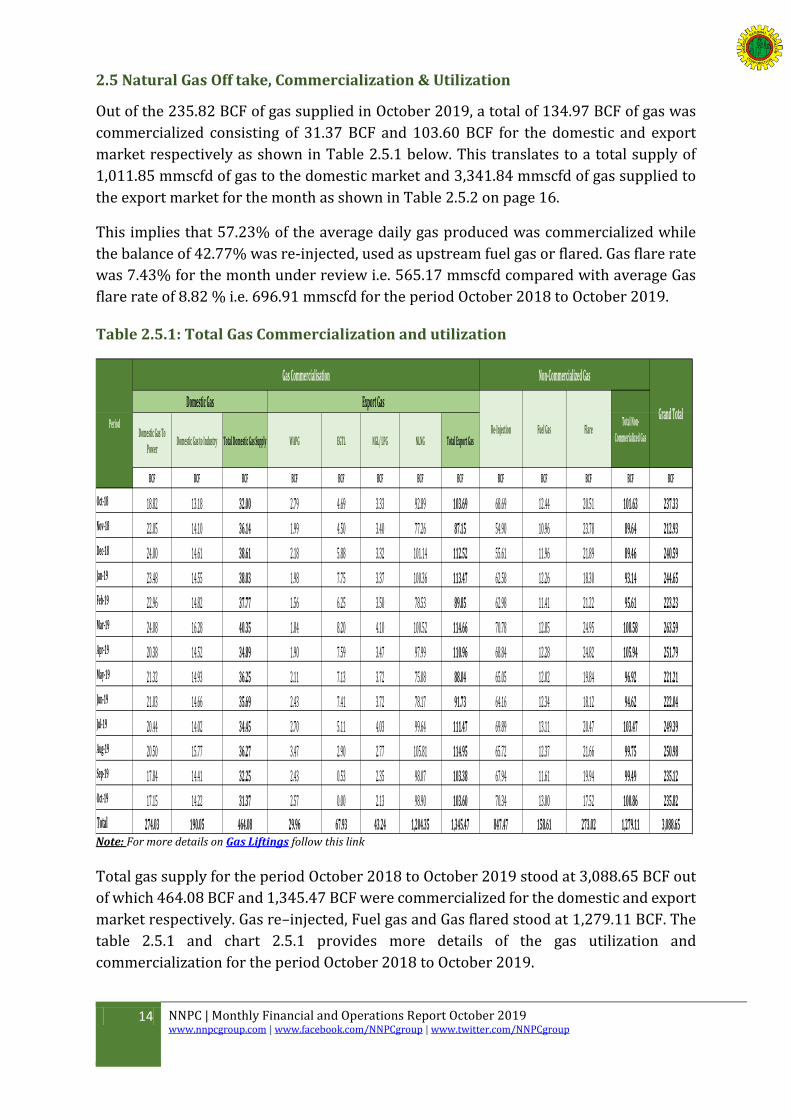
2.5 Natural Gas Off take, Commercialization & Utilization
Out of the 235.82 BCF of gas supplied in October 2019, a total of 134.97 BCF of gas was
commercialized consisting of 31.37 BCF and 103.60 BCF for the domestic and export
market respectively as shown in Table 2.5.1 below. This translates to a total supply of
1,011.85 mmscfd of gas to the domestic market and 3,341.84 mmscfd of gas supplied to
the export market for the month as shown in Table 2.5.2 on page 16.
This implies that 57.23% of the average daily gas produced was commercialized while
the balance of 42.77% was re-injected, used as upstream fuel gas or flared. Gas flare rate
was 7.43% for the month under review i.e. 565.17 mmscfd compared with average Gas
flare rate of 8.82 % i.e. 696.91 mmscfd for the period October 2018 to October 2019.
Table 2.5.1: Total Gas Commercialization and utilization
Domestic Gas To
PowerDomestic Gas to Industry Total Domestic Gas Supply WAPG EGTL NGL/ LPG NLNG Total Export Gas
BCF BCF BCF BCF BCF BCF BCF BCF BCF BCF BCF BCF BCF
Oct-18 18.82 13.18 32.00 2.79 4.69 3.33 92.89 103.69 68.69 12.44 20.51 101.63 237.33
Nov-18 22.05 14.10 36.14 1.99 4.50 3.40 77.26 87.15 54.90 10.96 23.78 89.64 212.93
Dec-18 24.00 14.61 38.61 2.18 5.88 3.32 101.14 112.52 55.61 11.96 21.89 89.46 240.59
Jan-19 23.48 14.55 38.03 1.98 7.75 3.37 100.36 113.47 62.58 12.26 18.30 93.14 244.65
Feb-19 22.96 14.82 37.77 1.56 6.25 3.50 78.53 89.85 62.98 11.41 21.22 95.61 223.23
Mar-19 24.08 16.28 40.35 1.84 8.20 4.10 100.52 114.66 70.78 12.85 24.95 108.58 263.59
Apr-19 20.38 14.52 34.89 1.90 7.59 3.47 97.99 110.96 68.84 12.28 24.82 105.94 251.79
May-19 21.32 14.93 36.25 2.11 7.13 3.72 75.08 88.04 65.05 12.02 19.84 96.92 221.21
Jun-19 21.03 14.66 35.69 2.43 7.41 3.72 78.17 91.73 64.16 12.34 18.12 94.62 222.04
Jul-19 20.44 14.02 34.45 2.70 5.11 4.03 99.64 111.47 69.89 13.11 20.47 103.47 249.39
Aug-19 20.50 15.77 36.27 3.47 2.90 2.77 105.81 114.95 65.72 12.37 21.66 99.75 250.98
Sep-19 17.84 14.41 32.25 2.43 0.53 2.35 98.07 103.38 67.94 11.61 19.94 99.49 235.12
Oct-19 17.15 14.22 31.37 2.57 0.00 2.13 98.90 103.60 70.34 13.00 17.52 100.86 235.82
Total 274.03 190.05 464.08 29.96 67.93 43.24 1,204.35 1,345.47 847.47 158.61 273.02 1,279.11 3,088.65
Domestic Gas Export Gas
Gas Commercialisation
Grand TotalPeriod
Non-Commercialized Gas
Re-Injection Fuel Gas FlareTotal Non-
Commerialized Gas
Note: For more details on Gas Liftings follow this link
Total gas supply for the period October 2018 to October 2019 stood at 3,088.65 BCF out
of which 464.08 BCF and 1,345.47 BCF were commercialized for the domestic and export
market respectively. Gas re–injected, Fuel gas and Gas flared stood at 1,279.11 BCF. The
table 2.5.1 and chart 2.5.1 provides more details of the gas utilization and
commercialization for the period October 2018 to October 2019.
15 NNPC | Monthly Financial and Operations Report October 2019 www.nnpcgroup.com | www.facebook.com/NNPCgroup | www.twitter.com/NNPCgroup
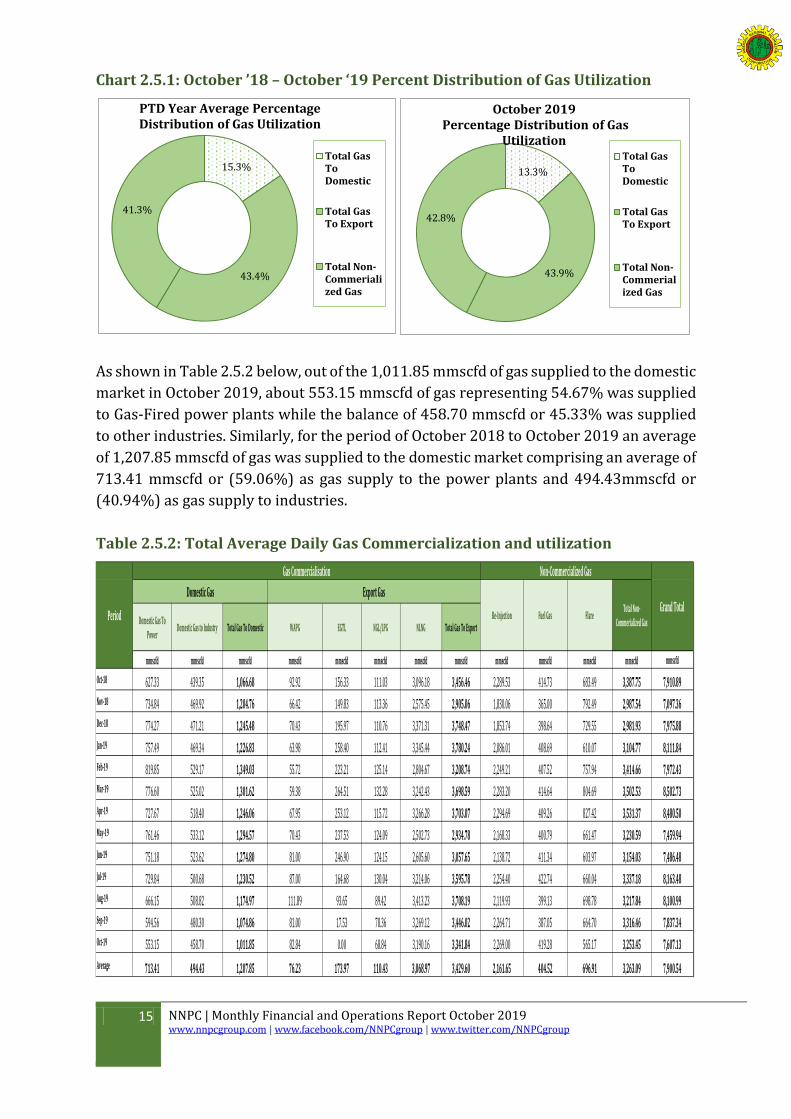
Chart 2.5.1: October ’18 – October ‘19 Percent Distribution of Gas Utilization
As shown in Table 2.5.2 below, out of the 1,011.85 mmscfd of gas supplied to the domestic
market in October 2019, about 553.15 mmscfd of gas representing 54.67% was supplied
to Gas-Fired power plants while the balance of 458.70 mmscfd or 45.33% was supplied
to other industries. Similarly, for the period of October 2018 to October 2019 an average
of 1,207.85 mmscfd of gas was supplied to the domestic market comprising an average of
713.41 mmscfd or (59.06%) as gas supply to the power plants and 494.43mmscfd or
(40.94%) as gas supply to industries.
Table 2.5.2: Total Average Daily Gas Commercialization and utilization
Domestic Gas To
PowerDomestic Gas to Industry Total Gas To Domestic WAPG EGTL NGL/LPG NLNG Total Gas To Export
mmscfd mmscfd mmscfd mmscfd mmscfd mmscfd mmscfd mmscfd mmscfd mmscfd mmscfd mmscfd mmscfd
Oct-18 627.33 439.35 1,066.68 92.92 156.33 111.03 3,096.18 3,456.46 2,289.53 414.73 683.49 3,387.75 7,910.89
Nov-18 734.84 469.92 1,204.76 66.42 149.83 113.36 2,575.45 2,905.06 1,830.06 365.00 792.49 2,987.54 7,097.36
Dec-18 774.27 471.21 1,245.48 70.43 195.97 110.76 3,371.31 3,748.47 1,853.74 398.64 729.55 2,981.93 7,975.88
Jan-19 757.49 469.34 1,226.83 63.98 258.40 112.41 3,345.44 3,780.24 2,086.01 408.69 610.07 3,104.77 8,111.84
Feb-19 819.85 529.17 1,349.03 55.72 223.21 125.14 2,804.67 3,208.74 2,249.21 407.52 757.94 3,414.66 7,972.43
Mar-19 776.60 525.02 1,301.62 59.38 264.51 132.28 3,242.43 3,698.59 2,283.20 414.64 804.69 3,502.53 8,502.73
Apr-19 727.67 518.40 1,246.06 67.95 253.12 115.72 3,266.28 3,703.07 2,294.69 409.26 827.42 3,531.37 8,480.50
May-19 761.46 533.12 1,294.57 70.43 237.53 124.09 2,502.73 2,934.78 2,168.33 400.79 661.47 3,230.59 7,459.94
Jun-19 751.18 523.62 1,274.80 81.00 246.90 124.15 2,605.60 3,057.65 2,138.72 411.34 603.97 3,154.03 7,486.48
Jul-19 729.84 500.68 1,230.52 87.00 164.68 130.04 3,214.06 3,595.78 2,254.40 422.74 660.04 3,337.18 8,163.48
Aug-19 666.15 508.82 1,174.97 111.89 93.65 89.42 3,413.23 3,708.19 2,119.93 399.13 698.78 3,217.84 8,100.99
Sep-19 594.56 480.30 1,074.86 81.00 17.53 78.36 3,269.12 3,446.02 2,264.71 387.05 664.70 3,316.46 7,837.34
Oct-19 553.15 458.70 1,011.85 82.84 0.00 68.84 3,190.16 3,341.84 2,269.00 419.28 565.17 3,253.45 7,607.13
Average 713.41 494.43 1,207.85 76.23 173.97 110.43 3,068.97 3,429.60 2,161.65 404.52 696.91 3,263.09 7,900.54
Gas Commercialisation
Export GasDomestic GasGrand Total
Non-Commercialized Gas
Re-Injection Fuel Gas FlarePeriodTotal Non-
Commerialized Gas
15.3%
43.4%
41.3%
PTD Year Average Percentage Distribution of Gas Utilization
Total GasToDomestic
Total GasTo Export
Total Non-Commerialized Gas
13.3%
43.9%
42.8%
October 2019Percentage Distribution of Gas
Utilization Total GasToDomestic
Total GasTo Export
Total Non-Commerialized Gas
16 NNPC | Monthly Financial and Operations Report October 2019 www.nnpcgroup.com | www.facebook.com/NNPCgroup | www.twitter.com/NNPCgroup
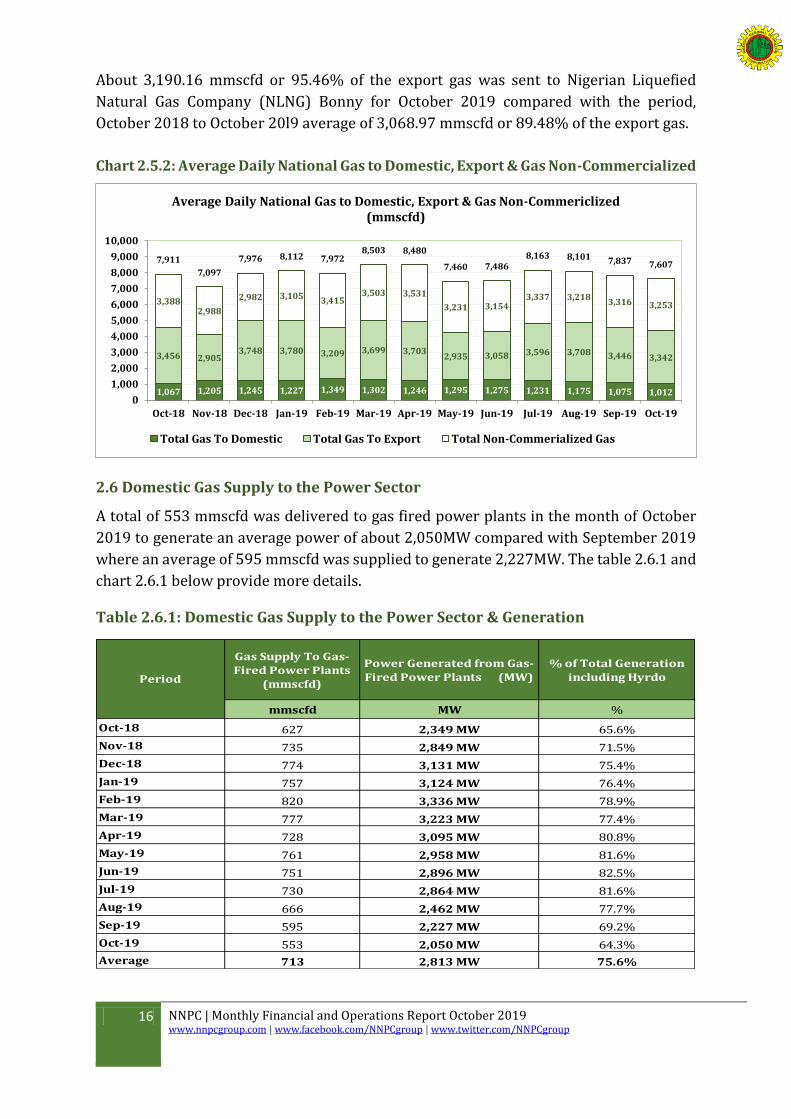
About 3,190.16 mmscfd or 95.46% of the export gas was sent to Nigerian Liquefied
Natural Gas Company (NLNG) Bonny for October 2019 compared with the period,
October 2018 to October 20l9 average of 3,068.97 mmscfd or 89.48% of the export gas.
Chart 2.5.2: Average Daily National Gas to Domestic, Export & Gas Non-Commercialized
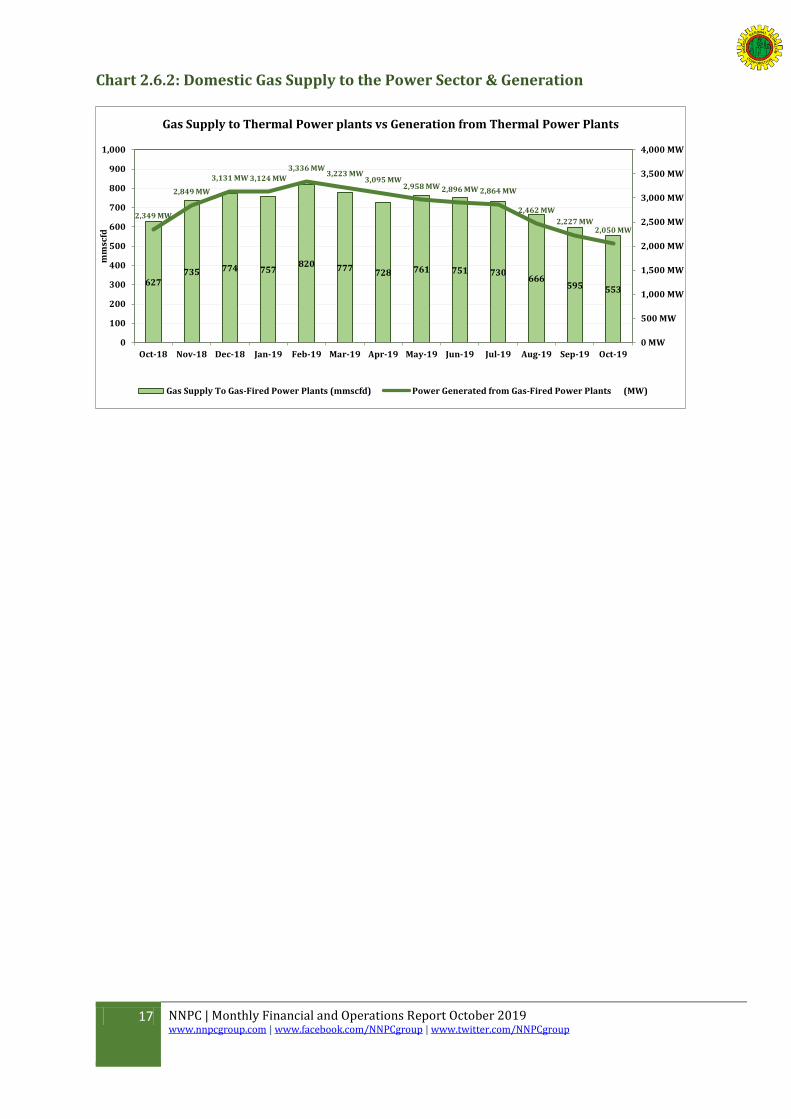
2.6 Domestic Gas Supply to the Power Sector
A total of 553 mmscfd was delivered to gas fired power plants in the month of October
2019 to generate an average power of about 2,050MW compared with September 2019
where an average of 595 mmscfd was supplied to generate 2,227MW. The table 2.6.1 and
chart 2.6.1 below provide more details.
Table 2.6.1: Domestic Gas Supply to the Power Sector & Generation
Gas Supply To Gas-Fired Power Plants
(mmscfd)
Power Generated from Gas-Fired Power Plants (MW)
% of Total Generation including Hyrdo
mmscfd MW %
Oct-18 627 2,349 MW 65.6%
Nov-18 735 2,849 MW 71.5%
Dec-18 774 3,131 MW 75.4%
Jan-19 757 3,124 MW 76.4%
Feb-19 820 3,336 MW 78.9%
Mar-19 777 3,223 MW 77.4%
Apr-19 728 3,095 MW 80.8%
May-19 761 2,958 MW 81.6%
Jun-19 751 2,896 MW 82.5%
Jul-19 730 2,864 MW 81.6%
Aug-19 666 2,462 MW 77.7%
Sep-19 595 2,227 MW 69.2%
Oct-19 553 2,050 MW 64.3%
Average 713 2,813 MW 75.6%
Period
1,067 1,205 1,245 1,227 1,349 1,302 1,246 1,295 1,275 1,231 1,175 1,075 1,012
3,456 2,9053,748 3,780 3,209 3,699 3,703
2,935 3,058 3,596 3,708 3,446 3,342
3,3882,988
2,982 3,1053,415
3,503 3,531
3,231 3,1543,337 3,218
3,316 3,253
7,911
7,097
7,976 8,112 7,9728,503 8,480
7,460 7,4868,163 8,101 7,837 7,607
0
1,000
2,000
3,000
4,000
5,000
6,000
7,000
8,000
9,000
10,000
Oct-18 Nov-18 Dec-18 Jan-19 Feb-19 Mar-19 Apr-19 May-19 Jun-19 Jul-19 Aug-19 Sep-19 Oct-19
Average Daily National Gas to Domestic, Export & Gas Non-Commericlized (mmscfd)
Total Gas To Domestic Total Gas To Export Total Non-Commerialized Gas
17 NNPC | Monthly Financial and Operations Report October 2019 www.nnpcgroup.com | www.facebook.com/NNPCgroup | www.twitter.com/NNPCgroup
Chart 2.6.2: Domestic Gas Supply to the Power Sector & Generation
627735 774 757
820 777728 761 751 730
666595 553
2,349 MW
2,849 MW
3,131 MW 3,124 MW
3,336 MW3,223 MW
3,095 MW2,958 MW 2,896 MW 2,864 MW
2,462 MW
2,227 MW2,050 MW
0 MW
500 MW
1,000 MW
1,500 MW
2,000 MW
2,500 MW
3,000 MW
3,500 MW
4,000 MW
0
100
200
300
400
500
600
700
800
900
1,000
Oct-18 Nov-18 Dec-18 Jan-19 Feb-19 Mar-19 Apr-19 May-19 Jun-19 Jul-19 Aug-19 Sep-19 Oct-19
mm
scfd
Gas Supply to Thermal Power plants vs Generation from Thermal Power Plants
Gas Supply To Gas-Fired Power Plants (mmscfd) Power Generated from Gas-Fired Power Plants (MW)
18 NNPC | Monthly Financial and Operations Report October 2019 www.nnpcgroup.com | www.facebook.com/NNPCgroup | www.twitter.com/NNPCgroup
3 Refinery Operations
3.1 Capacity Utilization
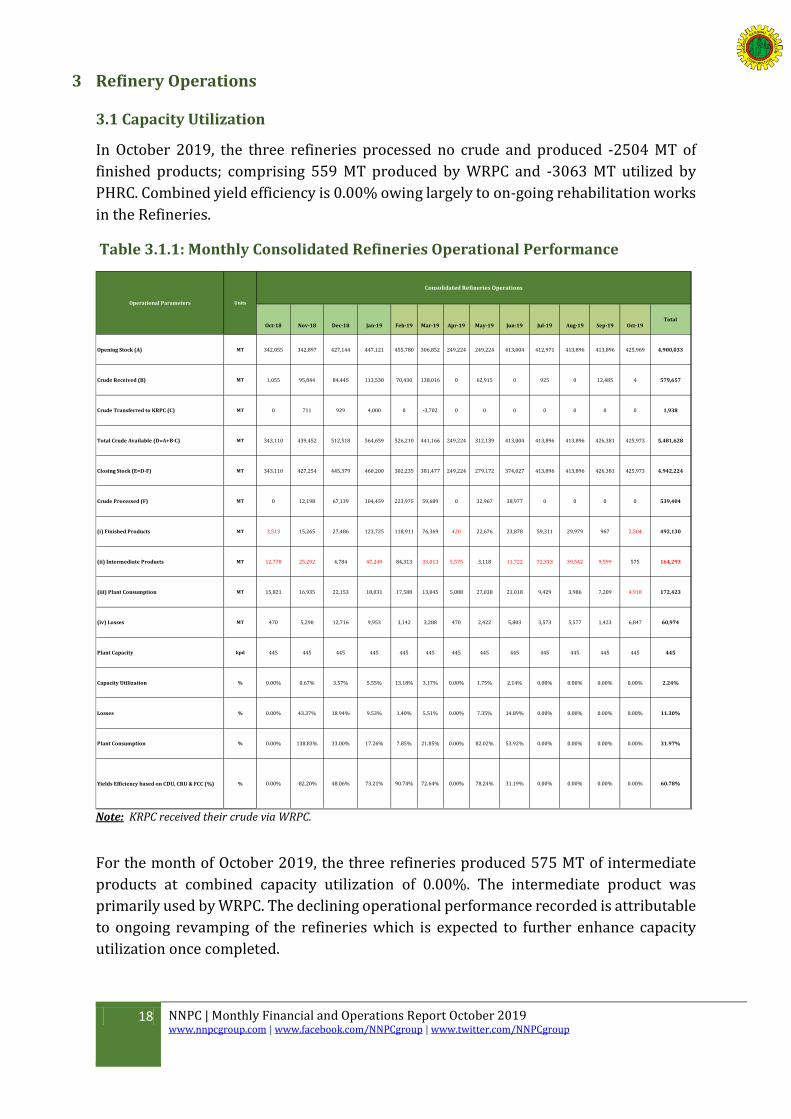
In October 2019, the three refineries processed no crude and produced -2504 MT of
finished products; comprising 559 MT produced by WRPC and -3063 MT utilized by
PHRC. Combined yield efficiency is 0.00% owing largely to on-going rehabilitation works
in the Refineries.
Table 3.1.1: Monthly Consolidated Refineries Operational Performance
Oct-18 Nov-18 Dec-18 Jan-19 Feb-19 Mar-19 Apr-19 May-19 Jun-19 Jul-19 Aug-19 Sep-19 Oct-19Total
Opening Stock (A) MT 342,055 342,897 427,144 447,121 455,780 306,852 249,224 249,224 413,004 412,971 413,896 413,896 425,969 4,900,033
Crude Received (B) MT 1,055 95,844 84,445 113,538 70,430 138,016 0 62,915 0 925 0 12,485 4 579,657
Crude Transferred to KRPC (C) MT 0 711 929 4,000 0 -3,702 0 0 0 0 0 0 0 1,938
Total Crude Available (D=A+B-C) MT 343,110 439,452 512,518 564,659 526,210 441,166 249,224 312,139 413,004 413,896 413,896 426,381 425,973 5,481,628
Closing Stock (E=D-F) MT 343,110 427,254 445,379 460,200 302,235 381,477 249,224 279,172 374,027 413,896 413,896 426,381 425,973 4,942,224
Crude Processed (F) MT 0 12,198 67,139 104,459 223,975 59,689 0 32,967 38,977 0 0 0 0 539,404
(i) Finished Products MT 3,513 15,265 27,486 123,725 118,911 76,369 420 22,676 23,878 59,311 29,979 967 2,504 492,130
(ii) Intermediate Products MT 12,778 25,292 4,784 47,249 84,313 33,013 5,575 3,118 11,722 72,313 39,542 9,599 575 164,293
(iii) Plant Consumption MT 15,821 16,935 22,153 18,031 17,588 13,045 5,088 27,038 21,018 9,429 3,986 7,209 4,918 172,423
(iv) Losses MT 470 5,290 12,716 9,953 3,142 3,288 470 2,422 5,803 3,573 5,577 1,423 6,847 60,974
Plant Capacity kpd 445 445 445 445 445 445 445 445 445 445 445 445 445 445
Capacity Utilization % 0.00% 0.67% 3.57% 5.55% 13.18% 3.17% 0.00% 1.75% 2.14% 0.00% 0.00% 0.00% 0.00% 2.24%
Losses % 0.00% 43.37% 18.94% 9.53% 1.40% 5.51% 0.00% 7.35% 14.89% 0.00% 0.00% 0.00% 0.00% 11.30%
Plant Consumption % 0.00% 138.83% 33.00% 17.26% 7.85% 21.85% 0.00% 82.02% 53.92% 0.00% 0.00% 0.00% 0.00% 31.97%
Yields Efficiency based on CDU, CRU & FCC (%) % 0.00% -82.20% 48.06% 73.21% 90.74% 72.64% 0.00% 78.24% 31.19% 0.00% 0.00% 0.00% 0.00% 60.78%
Operational Parameters Units
Consolidated Refineries Operations
Note: KRPC received their crude via WRPC.
For the month of October 2019, the three refineries produced 575 MT of intermediate
products at combined capacity utilization of 0.00%. The intermediate product was
primarily used by WRPC. The declining operational performance recorded is attributable
to ongoing revamping of the refineries which is expected to further enhance capacity
utilization once completed.
19 NNPC | Monthly Financial and Operations Report October 2019 www.nnpcgroup.com | www.facebook.com/NNPCgroup | www.twitter.com/NNPCgroup
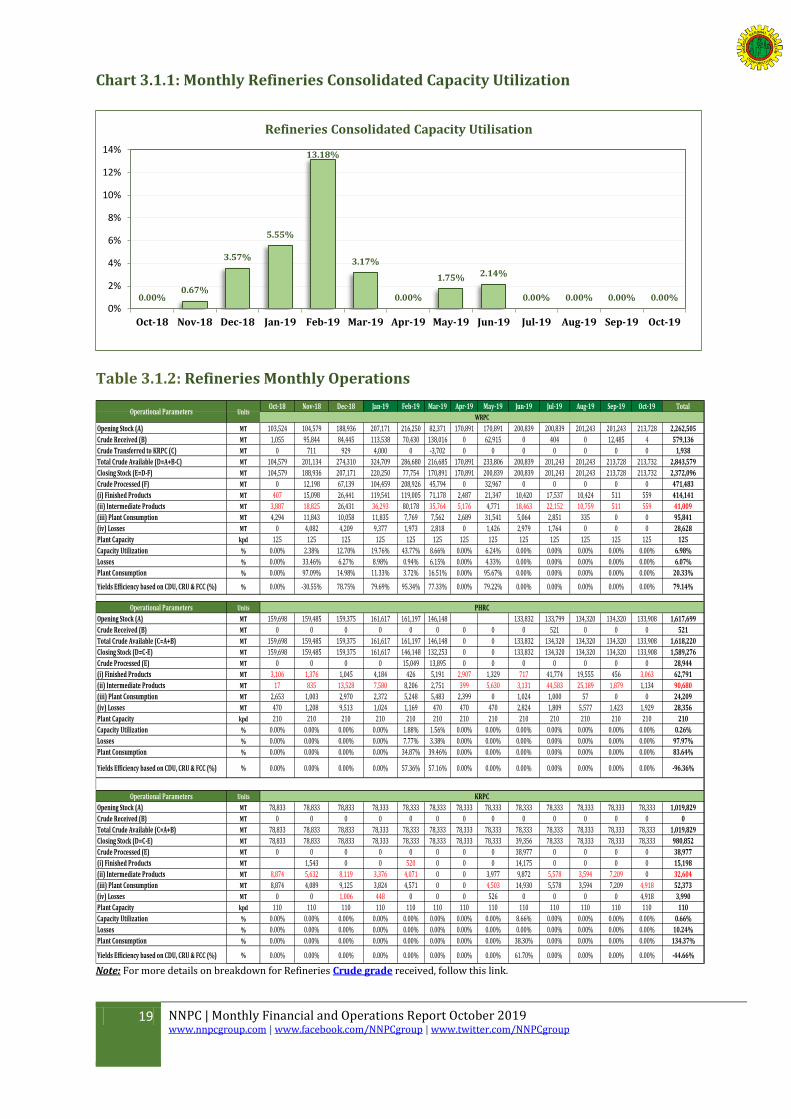
Chart 3.1.1: Monthly Refineries Consolidated Capacity Utilization
Table 3.1.2: Refineries Monthly Operations
Oct-18 Nov-18 Dec-18 Jan-19 Feb-19 Mar-19 Apr-19 May-19 Jun-19 Jul-19 Aug-19 Sep-19 Oct-19 Total
Opening Stock (A) MT 103,524 104,579 188,936 207,171 216,250 82,371 170,891 170,891 200,839 200,839 201,243 201,243 213,728 2,262,505
Crude Received (B) MT 1,055 95,844 84,445 113,538 70,430 138,016 0 62,915 0 404 0 12,485 4 579,136
Crude Transferred to KRPC (C) MT 0 711 929 4,000 0 -3,702 0 0 0 0 0 0 0 1,938
Total Crude Available (D=A+B-C) MT 104,579 201,134 274,310 324,709 286,680 216,685 170,891 233,806 200,839 201,243 201,243 213,728 213,732 2,843,579
Closing Stock (E=D-F) MT 104,579 188,936 207,171 220,250 77,754 170,891 170,891 200,839 200,839 201,243 201,243 213,728 213,732 2,372,096
Crude Processed (F) MT 0 12,198 67,139 104,459 208,926 45,794 0 32,967 0 0 0 0 0 471,483
(i) Finished Products MT 407 15,098 26,441 119,541 119,005 71,178 2,487 21,347 10,420 17,537 10,424 511 559 414,141
(ii) Intermediate Products MT 3,887 18,825 26,431 36,293 80,178 35,764 5,176 4,771 18,463 22,152 10,759 511 559 41,009
(iii) Plant Consumption MT 4,294 11,843 10,058 11,835 7,769 7,562 2,689 31,541 5,064 2,851 335 0 0 95,841
(iv) Losses MT 0 4,082 4,209 9,377 1,973 2,818 0 1,426 2,979 1,764 0 0 0 28,628
Plant Capacity kpd 125 125 125 125 125 125 125 125 125 125 125 125 125 125
Capacity Utilization % 0.00% 2.38% 12.70% 19.76% 43.77% 8.66% 0.00% 6.24% 0.00% 0.00% 0.00% 0.00% 0.00% 6.98%
Losses % 0.00% 33.46% 6.27% 8.98% 0.94% 6.15% 0.00% 4.33% 0.00% 0.00% 0.00% 0.00% 0.00% 6.07%
Plant Consumption % 0.00% 97.09% 14.98% 11.33% 3.72% 16.51% 0.00% 95.67% 0.00% 0.00% 0.00% 0.00% 0.00% 20.33%
Yields Efficiency based on CDU, CRU & FCC (%) % 0.00% -30.55% 78.75% 79.69% 95.34% 77.33% 0.00% 79.22% 0.00% 0.00% 0.00% 0.00% 0.00% 79.14%
Operational Parameters Units
Opening Stock (A) MT 159,698 159,485 159,375 161,617 161,197 146,148 133,832 133,799 134,320 134,320 133,908 1,617,699
Crude Received (B) MT 0 0 0 0 0 0 0 0 0 521 0 0 0 521
Total Crude Available (C=A+B) MT 159,698 159,485 159,375 161,617 161,197 146,148 0 0 133,832 134,320 134,320 134,320 133,908 1,618,220
Closing Stock (D=C-E) MT 159,698 159,485 159,375 161,617 146,148 132,253 0 0 133,832 134,320 134,320 134,320 133,908 1,589,276
Crude Processed (E) MT 0 0 0 0 15,049 13,895 0 0 0 0 0 0 0 28,944
(i) Finished Products MT 3,106 1,376 1,045 4,184 426 5,191 2,907 1,329 717 41,774 19,555 456 3,063 62,791
(ii) Intermediate Products MT 17 835 13,528 7,580 8,206 2,751 399 5,630 3,131 44,583 25,189 1,879 1,134 90,680
(iii) Plant Consumption MT 2,653 1,003 2,970 2,372 5,248 5,483 2,399 0 1,024 1,000 57 0 0 24,209
(iv) Losses MT 470 1,208 9,513 1,024 1,169 470 470 470 2,824 1,809 5,577 1,423 1,929 28,356
Plant Capacity kpd 210 210 210 210 210 210 210 210 210 210 210 210 210 210
Capacity Utilization % 0.00% 0.00% 0.00% 0.00% 1.88% 1.56% 0.00% 0.00% 0.00% 0.00% 0.00% 0.00% 0.00% 0.26%
Losses % 0.00% 0.00% 0.00% 0.00% 7.77% 3.38% 0.00% 0.00% 0.00% 0.00% 0.00% 0.00% 0.00% 97.97%
Plant Consumption % 0.00% 0.00% 0.00% 0.00% 34.87% 39.46% 0.00% 0.00% 0.00% 0.00% 0.00% 0.00% 0.00% 83.64%
Yields Efficiency based on CDU, CRU & FCC (%) % 0.00% 0.00% 0.00% 0.00% 57.36% 57.16% 0.00% 0.00% 0.00% 0.00% 0.00% 0.00% 0.00% -96.36%
Operational Parameters Units
Opening Stock (A) MT 78,833 78,833 78,833 78,333 78,333 78,333 78,333 78,333 78,333 78,333 78,333 78,333 78,333 1,019,829
Crude Received (B) MT 0 0 0 0 0 0 0 0 0 0 0 0 0 0
Total Crude Available (C=A+B) MT 78,833 78,833 78,833 78,333 78,333 78,333 78,333 78,333 78,333 78,333 78,333 78,333 78,333 1,019,829
Closing Stock (D=C-E) MT 78,833 78,833 78,833 78,333 78,333 78,333 78,333 78,333 39,356 78,333 78,333 78,333 78,333 980,852
Crude Processed (E) MT 0 0 0 0 0 0 0 0 38,977 0 0 0 0 38,977
(i) Finished Products MT 1,543 0 0 520 0 0 0 14,175 0 0 0 0 15,198
(ii) Intermediate Products MT 8,874 5,632 8,119 3,376 4,071 0 0 3,977 9,872 5,578 3,594 7,209 0 32,604
(iii) Plant Consumption MT 8,874 4,089 9,125 3,824 4,571 0 0 4,503 14,930 5,578 3,594 7,209 4,918 52,373
(iv) Losses MT 0 0 1,006 448 0 0 0 526 0 0 0 0 4,918 3,990
Plant Capacity kpd 110 110 110 110 110 110 110 110 110 110 110 110 110 110
Capacity Utilization % 0.00% 0.00% 0.00% 0.00% 0.00% 0.00% 0.00% 0.00% 8.66% 0.00% 0.00% 0.00% 0.00% 0.66%
Losses % 0.00% 0.00% 0.00% 0.00% 0.00% 0.00% 0.00% 0.00% 0.00% 0.00% 0.00% 0.00% 0.00% 10.24%
Plant Consumption % 0.00% 0.00% 0.00% 0.00% 0.00% 0.00% 0.00% 0.00% 38.30% 0.00% 0.00% 0.00% 0.00% 134.37%
Yields Efficiency based on CDU, CRU & FCC (%) % 0.00% 0.00% 0.00% 0.00% 0.00% 0.00% 0.00% 0.00% 61.70% 0.00% 0.00% 0.00% 0.00% -44.66%
Operational Parameters Units
PHRC
KRPC
WRPC
Note: For more details on breakdown for Refineries Crude grade received, follow this link.
0.00%0.67%
3.57%
5.55%
13.18%
3.17%
0.00%
1.75% 2.14%
0.00% 0.00% 0.00% 0.00%0%
2%
4%
6%
8%
10%
12%
14%
Oct-18 Nov-18 Dec-18 Jan-19 Feb-19 Mar-19 Apr-19 May-19 Jun-19 Jul-19 Aug-19 Sep-19 Oct-19
Refineries Consolidated Capacity Utilisation
20 NNPC | Monthly Financial and Operations Report October 2019 www.nnpcgroup.com | www.facebook.com/NNPCgroup | www.twitter.com/NNPCgroup
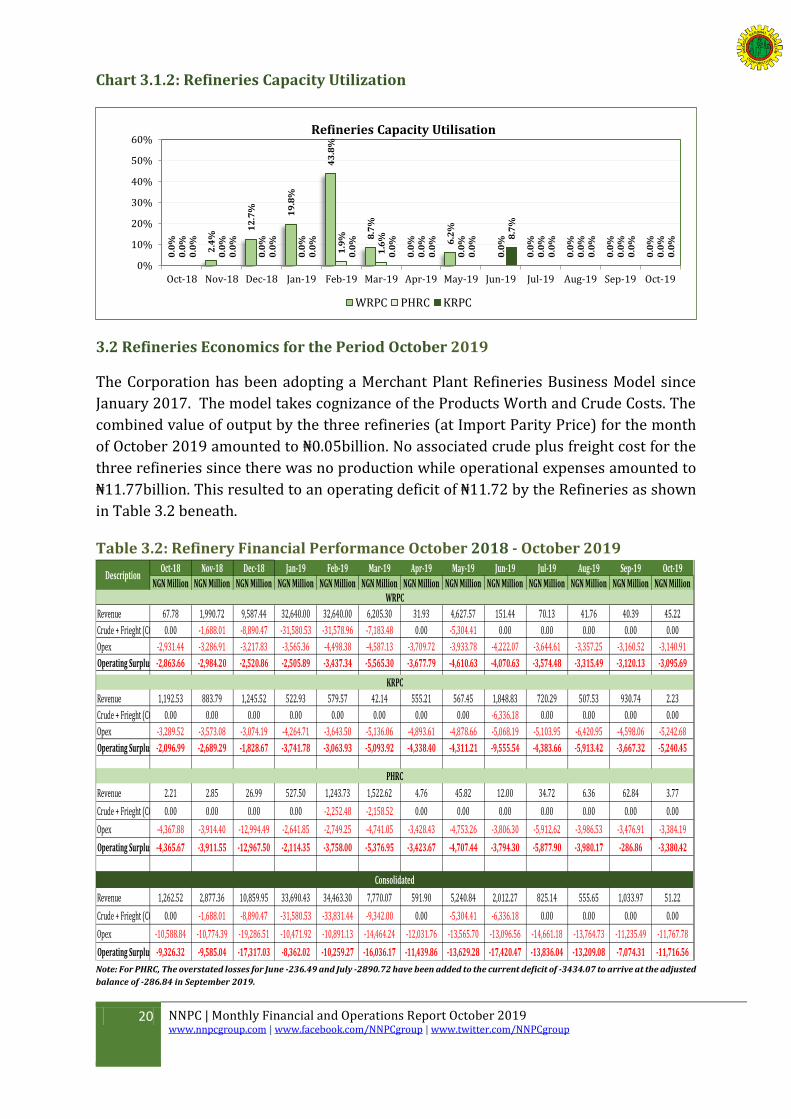
Chart 3.1.2: Refineries Capacity Utilization
3.2 Refineries Economics for the Period October 2019
The Corporation has been adopting a Merchant Plant Refineries Business Model since
January 2017. The model takes cognizance of the Products Worth and Crude Costs. The
combined value of output by the three refineries (at Import Parity Price) for the month
of October 2019 amounted to ₦0.05billion. No associated crude plus freight cost for the
three refineries since there was no production while operational expenses amounted to
₦11.77billion. This resulted to an operating deficit of ₦11.72 by the Refineries as shown
in Table 3.2 beneath.
Table 3.2: Refinery Financial Performance October 2018 - October 2019 Oct-18 Nov-18 Dec-18 Jan-19 Feb-19 Mar-19 Apr-19 May-19 Jun-19 Jul-19 Aug-19 Sep-19 Oct-19
NGN Million NGN Million NGN Million NGN Million NGN Million NGN Million NGN Million NGN Million NGN Million NGN Million NGN Million NGN Million NGN Million
Revenue 67.78 1,990.72 9,587.44 32,640.00 32,640.00 6,205.30 31.93 4,627.57 151.44 70.13 41.76 40.39 45.22
Crude + Frieght (COGS) 0.00 -1,688.01 -8,890.47 -31,580.53 -31,578.96 -7,183.48 0.00 -5,304.41 0.00 0.00 0.00 0.00 0.00
Opex -2,931.44 -3,286.91 -3,217.83 -3,565.36 -4,498.38 -4,587.13 -3,709.72 -3,933.78 -4,222.07 -3,644.61 -3,357.25 -3,160.52 -3,140.91
Operating Surplus/Deficit-2,863.66 -2,984.20 -2,520.86 -2,505.89 -3,437.34 -5,565.30 -3,677.79 -4,610.63 -4,070.63 -3,574.48 -3,315.49 -3,120.13 -3,095.69
Revenue 1,192.53 883.79 1,245.52 522.93 579.57 42.14 555.21 567.45 1,848.83 720.29 507.53 930.74 2.23
Crude + Frieght (COGS) 0.00 0.00 0.00 0.00 0.00 0.00 0.00 0.00 -6,336.18 0.00 0.00 0.00 0.00
Opex -3,289.52 -3,573.08 -3,074.19 -4,264.71 -3,643.50 -5,136.06 -4,893.61 -4,878.66 -5,068.19 -5,103.95 -6,420.95 -4,598.06 -5,242.68
Operating Surplus/Deficit-2,096.99 -2,689.29 -1,828.67 -3,741.78 -3,063.93 -5,093.92 -4,338.40 -4,311.21 -9,555.54 -4,383.66 -5,913.42 -3,667.32 -5,240.45
Revenue 2.21 2.85 26.99 527.50 1,243.73 1,522.62 4.76 45.82 12.00 34.72 6.36 62.84 3.77
Crude + Frieght (COGS) 0.00 0.00 0.00 0.00 -2,252.48 -2,158.52 0.00 0.00 0.00 0.00 0.00 0.00 0.00
Opex -4,367.88 -3,914.40 -12,994.49 -2,641.85 -2,749.25 -4,741.05 -3,428.43 -4,753.26 -3,806.30 -5,912.62 -3,986.53 -3,476.91 -3,384.19
Operating Surplus/Deficit-4,365.67 -3,911.55 -12,967.50 -2,114.35 -3,758.00 -5,376.95 -3,423.67 -4,707.44 -3,794.30 -5,877.90 -3,980.17 -286.86 -3,380.42
Revenue 1,262.52 2,877.36 10,859.95 33,690.43 34,463.30 7,770.07 591.90 5,240.84 2,012.27 825.14 555.65 1,033.97 51.22
Crude + Frieght (COGS) 0.00 -1,688.01 -8,890.47 -31,580.53 -33,831.44 -9,342.00 0.00 -5,304.41 -6,336.18 0.00 0.00 0.00 0.00
Opex -10,588.84 -10,774.39 -19,286.51 -10,471.92 -10,891.13 -14,464.24 -12,031.76 -13,565.70 -13,096.56 -14,661.18 -13,764.73 -11,235.49 -11,767.78
Operating Surplus/Deficit-9,326.32 -9,585.04 -17,317.03 -8,362.02 -10,259.27 -16,036.17 -11,439.86 -13,629.28 -17,420.47 -13,836.04 -13,209.08 -7,074.31 -11,716.56
KRPC
PHRC
Consolidated
WRPC
Description
Note: For PHRC, The overstated losses for June -236.49 and July -2890.72 have been added to the current deficit of -3434.07 to arrive at the adjusted
balance of -286.84 in September 2019.
0.0
%
2.4
%
12
.7% 19
.8%
43
.8%
8.7
%
0.0
% 6.2
%
0.0
%
0.0
%
0.0
%
0.0
%
0.0
%
0.0
%
0.0
%
0.0
%
1.9
%
1.6
%
0.0
%
0.0
%
0.0
%
0.0
%
0.0
%
0.0
%
0.0
%
0.0
%
0.0
%
0.0
%
0.0
%
0.0
%
0.0
%
0.0
%
0.0
%
8.7
%
0.0
%
0.0
%
0.0
%
0.0
%
0%
10%
20%
30%
40%
50%
60%
Oct-18 Nov-18 Dec-18 Jan-19 Feb-19 Mar-19 Apr-19 May-19 Jun-19 Jul-19 Aug-19 Sep-19 Oct-19
Refineries Capacity Utilisation
WRPC PHRC KRPC
21 NNPC | Monthly Financial and Operations Report October 2019 www.nnpcgroup.com | www.facebook.com/NNPCgroup | www.twitter.com/NNPCgroup
4 Petroleum Product Supply & Distribution
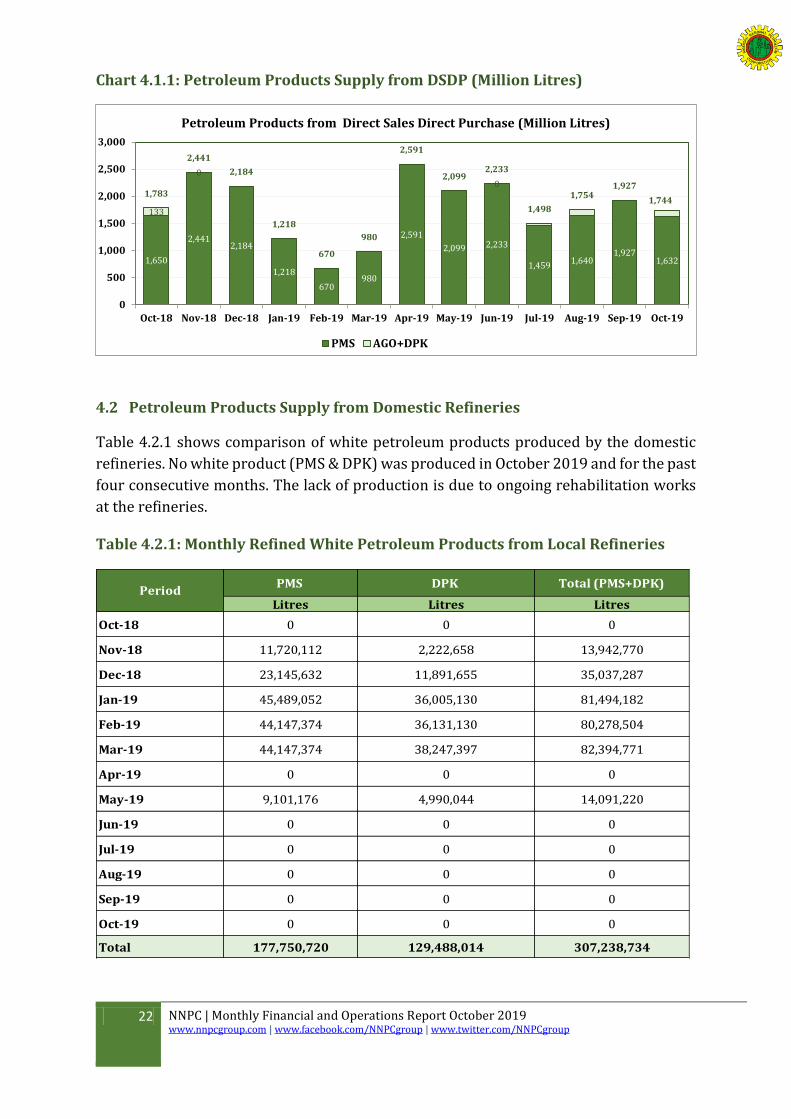
4.1 Petroleum Product Supply from Direct sales Direct Purchase (DSDP)
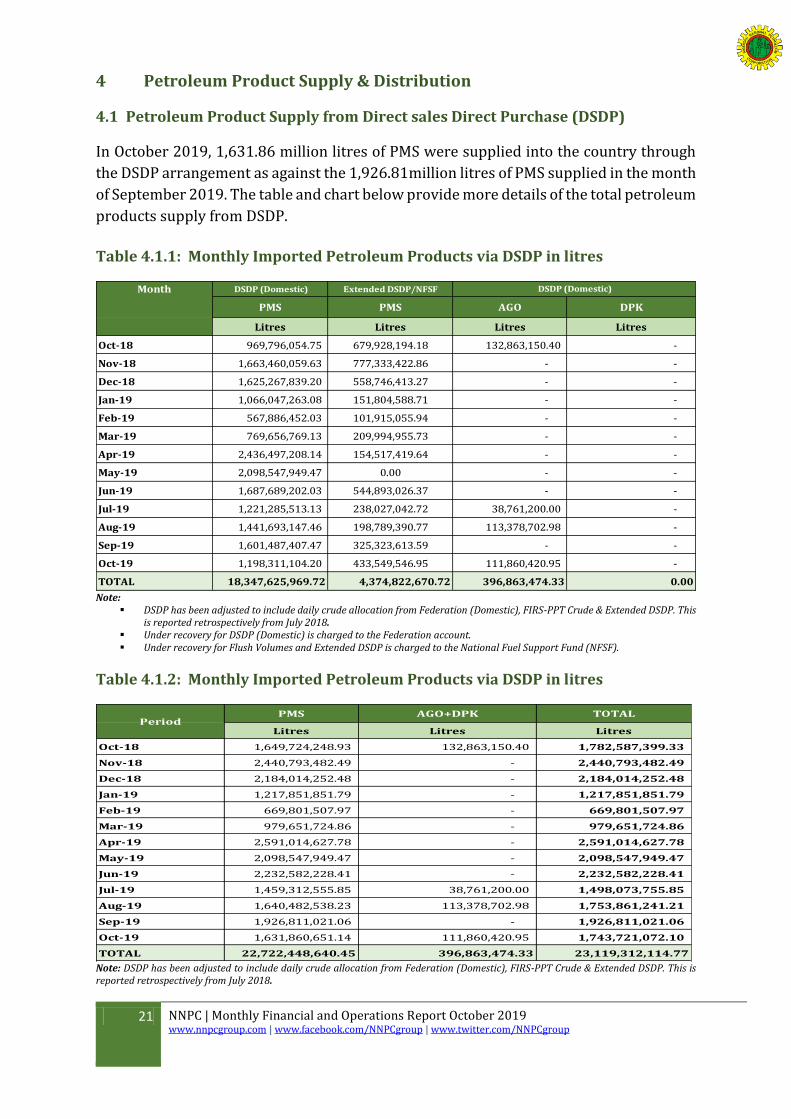
In October 2019, 1,631.86 million litres of PMS were supplied into the country through
the DSDP arrangement as against the 1,926.81million litres of PMS supplied in the month
of September 2019. The table and chart below provide more details of the total petroleum
products supply from DSDP.
Table 4.1.1: Monthly Imported Petroleum Products via DSDP in litres
Month DSDP (Domestic) Extended DSDP/NFSF
PMS PMS AGO DPK
Litres Litres Litres Litres
Oct-18 969,796,054.75 679,928,194.18 132,863,150.40 -
Nov-18 1,663,460,059.63 777,333,422.86 - -
Dec-18 1,625,267,839.20 558,746,413.27 - -
Jan-19 1,066,047,263.08 151,804,588.71 - -
Feb-19 567,886,452.03 101,915,055.94 - -
Mar-19 769,656,769.13 209,994,955.73 - -
Apr-19 2,436,497,208.14 154,517,419.64 - -
May-19 2,098,547,949.47 0.00 - -
Jun-19 1,687,689,202.03 544,893,026.37 - -
Jul-19 1,221,285,513.13 238,027,042.72 38,761,200.00 -
Aug-19 1,441,693,147.46 198,789,390.77 113,378,702.98 -
Sep-19 1,601,487,407.47 325,323,613.59 - -
Oct-19 1,198,311,104.20 433,549,546.95 111,860,420.95 -
TOTAL 18,347,625,969.72 4,374,822,670.72 396,863,474.33 0.00
DSDP (Domestic)
Note: DSDP has been adjusted to include daily crude allocation from Federation (Domestic), FIRS-PPT Crude & Extended DSDP. This
is reported retrospectively from July 2018. Under recovery for DSDP (Domestic) is charged to the Federation account. Under recovery for Flush Volumes and Extended DSDP is charged to the National Fuel Support Fund (NFSF).
Table 4.1.2: Monthly Imported Petroleum Products via DSDP in litres
PMS AGO+DPK TOTAL
Litres Litres Litres
Oct-18 1,649,724,248.93 132,863,150.40 1,782,587,399.33
Nov-18 2,440,793,482.49 - 2,440,793,482.49
Dec-18 2,184,014,252.48 - 2,184,014,252.48
Jan-19 1,217,851,851.79 - 1,217,851,851.79
Feb-19 669,801,507.97 - 669,801,507.97
Mar-19 979,651,724.86 - 979,651,724.86
Apr-19 2,591,014,627.78 - 2,591,014,627.78
May-19 2,098,547,949.47 - 2,098,547,949.47
Jun-19 2,232,582,228.41 - 2,232,582,228.41
Jul-19 1,459,312,555.85 38,761,200.00 1,498,073,755.85
Aug-19 1,640,482,538.23 113,378,702.98 1,753,861,241.21
Sep-19 1,926,811,021.06 - 1,926,811,021.06
Oct-19 1,631,860,651.14 111,860,420.95 1,743,721,072.10
TOTAL 22,722,448,640.45 396,863,474.33 23,119,312,114.77
Period
Note: DSDP has been adjusted to include daily crude allocation from Federation (Domestic), FIRS-PPT Crude & Extended DSDP. This is reported retrospectively from July 2018.
22 NNPC | Monthly Financial and Operations Report October 2019 www.nnpcgroup.com | www.facebook.com/NNPCgroup | www.twitter.com/NNPCgroup
Chart 4.1.1: Petroleum Products Supply from DSDP (Million Litres)
4.2 Petroleum Products Supply from Domestic Refineries
Table 4.2.1 shows comparison of white petroleum products produced by the domestic
refineries. No white product (PMS & DPK) was produced in October 2019 and for the past
four consecutive months. The lack of production is due to ongoing rehabilitation works
at the refineries.
Table 4.2.1: Monthly Refined White Petroleum Products from Local Refineries
PMS DPK Total (PMS+DPK)
Litres Litres Litres
Oct-18 0 0 0
Nov-18 11,720,112 2,222,658 13,942,770
Dec-18 23,145,632 11,891,655 35,037,287
Jan-19 45,489,052 36,005,130 81,494,182
Feb-19 44,147,374 36,131,130 80,278,504
Mar-19 44,147,374 38,247,397 82,394,771
Apr-19 0 0 0
May-19 9,101,176 4,990,044 14,091,220
Jun-19 0 0 0
Jul-19 0 0 0
Aug-19 0 0 0
Sep-19 0 0 0
Oct-19 0 0 0
Total 177,750,720 129,488,014 307,238,734
Period
1,650
2,4412,184
1,218
670980
2,591
2,099 2,233
1,4591,640
1,9271,632
133
00
1,783
2,441
2,184
1,218
670
980
2,591
2,0992,233
1,498
1,7541,927
1,744
0
500
1,000
1,500
2,000
2,500
3,000
Oct-18 Nov-18 Dec-18 Jan-19 Feb-19 Mar-19 Apr-19 May-19 Jun-19 Jul-19 Aug-19 Sep-19 Oct-19
Petroleum Products from Direct Sales Direct Purchase (Million Litres)
PMS AGO+DPK
23 NNPC | Monthly Financial and Operations Report October 2019 www.nnpcgroup.com | www.facebook.com/NNPCgroup | www.twitter.com/NNPCgroup
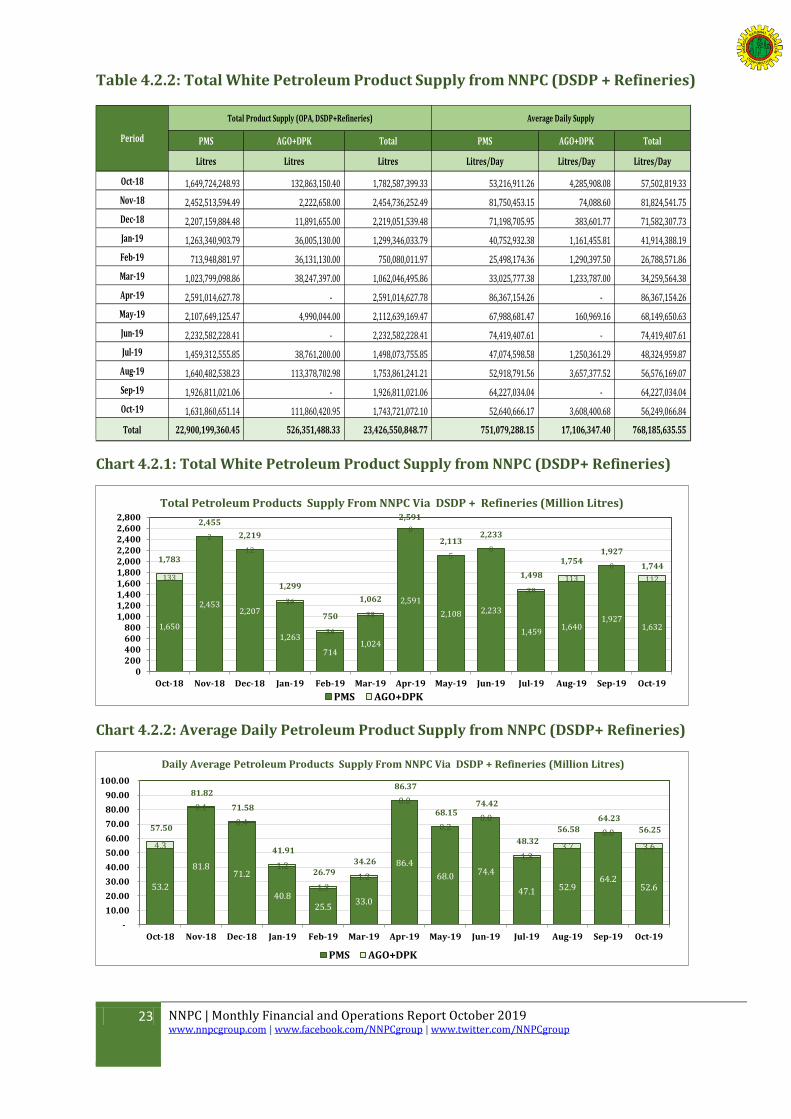
Table 4.2.2: Total White Petroleum Product Supply from NNPC (DSDP + Refineries)
PMS AGO+DPK Total PMS AGO+DPK Total
Litres Litres Litres Litres/Day Litres/Day Litres/Day
Oct-18 1,649,724,248.93 132,863,150.40 1,782,587,399.33 53,216,911.26 4,285,908.08 57,502,819.33
Nov-18 2,452,513,594.49 2,222,658.00 2,454,736,252.49 81,750,453.15 74,088.60 81,824,541.75
Dec-18 2,207,159,884.48 11,891,655.00 2,219,051,539.48 71,198,705.95 383,601.77 71,582,307.73
Jan-19 1,263,340,903.79 36,005,130.00 1,299,346,033.79 40,752,932.38 1,161,455.81 41,914,388.19
Feb-19 713,948,881.97 36,131,130.00 750,080,011.97 25,498,174.36 1,290,397.50 26,788,571.86
Mar-19 1,023,799,098.86 38,247,397.00 1,062,046,495.86 33,025,777.38 1,233,787.00 34,259,564.38
Apr-19 2,591,014,627.78 - 2,591,014,627.78 86,367,154.26 - 86,367,154.26
May-19 2,107,649,125.47 4,990,044.00 2,112,639,169.47 67,988,681.47 160,969.16 68,149,650.63
Jun-19 2,232,582,228.41 - 2,232,582,228.41 74,419,407.61 - 74,419,407.61
Jul-19 1,459,312,555.85 38,761,200.00 1,498,073,755.85 47,074,598.58 1,250,361.29 48,324,959.87
Aug-19 1,640,482,538.23 113,378,702.98 1,753,861,241.21 52,918,791.56 3,657,377.52 56,576,169.07
Sep-19 1,926,811,021.06 - 1,926,811,021.06 64,227,034.04 - 64,227,034.04
Oct-19 1,631,860,651.14 111,860,420.95 1,743,721,072.10 52,640,666.17 3,608,400.68 56,249,066.84
Total 22,900,199,360.45 526,351,488.33 23,426,550,848.77 751,079,288.15 17,106,347.40 768,185,635.55
Total Product Supply (OPA, DSDP+Refineries)
Period
Average Daily Supply
Chart 4.2.1: Total White Petroleum Product Supply from NNPC (DSDP+ Refineries)
Chart 4.2.2: Average Daily Petroleum Product Supply from NNPC (DSDP+ Refineries)
1,650
2,4532,207
1,263
7141,024
2,591
2,108 2,233
1,4591,640
1,9271,632
133
2
12
36
36
38
0
50
39
113
0
112
1,783
2,455
2,219
1,299
750
1,062
2,591
2,1132,233
1,498
1,7541,927
1,744
0200400600800
1,0001,2001,4001,6001,8002,0002,2002,4002,6002,800
Oct-18 Nov-18 Dec-18 Jan-19 Feb-19 Mar-19 Apr-19 May-19 Jun-19 Jul-19 Aug-19 Sep-19 Oct-19
Total Petroleum Products Supply From NNPC Via DSDP + Refineries (Million Litres)
PMS AGO+DPK
53.2
81.871.2
40.825.5
33.0
86.4
68.0 74.4
47.1 52.964.2
52.6
4.3
0.1
0.4
1.2
1.31.2
0.0
0.20.0
1.33.7
0.0
3.6
57.50
81.82
71.58
41.91
26.79
34.26
86.37
68.15 74.42
48.32
56.58
64.23
56.25
-
10.00
20.00
30.00
40.00
50.00
60.00
70.00
80.00
90.00
100.00
Oct-18 Nov-18 Dec-18 Jan-19 Feb-19 Mar-19 Apr-19 May-19 Jun-19 Jul-19 Aug-19 Sep-19 Oct-19
Daily Average Petroleum Products Supply From NNPC Via DSDP + Refineries (Million Litres)
PMS AGO+DPK

24 NNPC | Monthly Financial and Operations Report October 2019 www.nnpcgroup.com | www.facebook.com/NNPCgroup | www.twitter.com/NNPCgroup
4.3 Downstream Petroleum Product Distributions
A total of 1.156billion litres of white products were sold and distributed by PPMC in the
month of October 2019 compared with 1.018billion litres in the month of September
2019. This comprised 1.156billion litres of PMS, 0.00026billion litres of AGO and
0.00002billion litres of DPK. Total sale of white products for the period October 2018 to
October 2019 stood at 21.186 billion litres and PMS accounted for 20.676billion litres or
97.6%. The tables and charts below provide more details of white products sold by
NNPC/PPMC for the period October 2018 to October 2019. There was sale of special
product of 0.00003billion litres of LPFO in the month.
Table 4.3.1: Downstream Petroleum Product Sales by PPMC
PMS AGO DPK Total White Products LPFO Other Special
Products Total Special Products
Litres Litres Litres Litres Litres Litres Litres
Oct-18 1,771,106,814 77,968,886 384,001 1,849,459,701 15,880,762 300,000 16,180,762
Nov-18 992,090,457 98,734,115 588,000 1,091,412,572 0 0 0
Dec-18 1,937,233,569 6,978,910 14,226,922 1,958,439,401 8,213,782 150,000 8,363,782
Jan-19 1,690,738,286 51,046,470 17,961,107 1,759,745,863 13,463,819 0 13,463,819
Feb-19 1,274,823,499 45,676,227 10,207,009 1,330,706,735 1,752,000 300,000 2,052,000
Mar-19 1,294,610,496 47,341,709 22,502,046 1,364,454,251 6,437,387 0 6,437,387
Apr-19 2,080,538,397 12,440,922 19,322,583 2,112,301,902 1,254,000 0 1,254,000
May-19 2,061,148,901 26,154,932 19,511,492 2,106,815,325 9,628,756 0 9,628,756
Jun-19 1,759,615,504 8,661,566 9,293,903 1,777,570,973 30,987,463 0 30,987,463
Jul-19 1,727,960,801 16,313,314 33,000 1,744,307,115 4,818,000 0 4,818,000
Aug-19 1,916,624,803 299,404 0 1,916,924,207 0 0 0
Sep-19 1,013,064,625 1,250,832 3,375,055 1,017,690,512 0 0 0
Oct-19 1,156,217,879 262,648 15,000 1,156,495,527 33,000 0 33,000
Total 20,675,774,030 393,129,935 117,420,118 21,186,324,083 92,468,969 750,000 93,218,969
Period
Chart 4.3.1: Monthly White Product sales by PPMC
1,771
992
1,9371,691
1,275 1,295
2,081 2,0611,760 1,728
1,917
1,0131,156
0
1
14
18
10 23
19 20
9 0
0
30
78
99
7
51
46 47
12 26
9 16
0
10
1,849.46
1,091.41
1,958.44
1,759.75
1,330.71 1,364.45
2,112.30 2,106.82
1,777.57 1,744.31
1,916.92
1,017.691,156.50
0
500
1,000
1,500
2,000
2,500
Oct-18 Nov-18 Dec-18 Jan-19 Feb-19 Mar-19 Apr-19 May-19 Jun-19 Jul-19 Aug-19 Sep-19 Oct-19
Total Montly PPMC Product Distribution Sales Volume (Million Litres)
PMS DPK AGO
25 NNPC | Monthly Financial and Operations Report October 2019 www.nnpcgroup.com | www.facebook.com/NNPCgroup | www.twitter.com/NNPCgroup
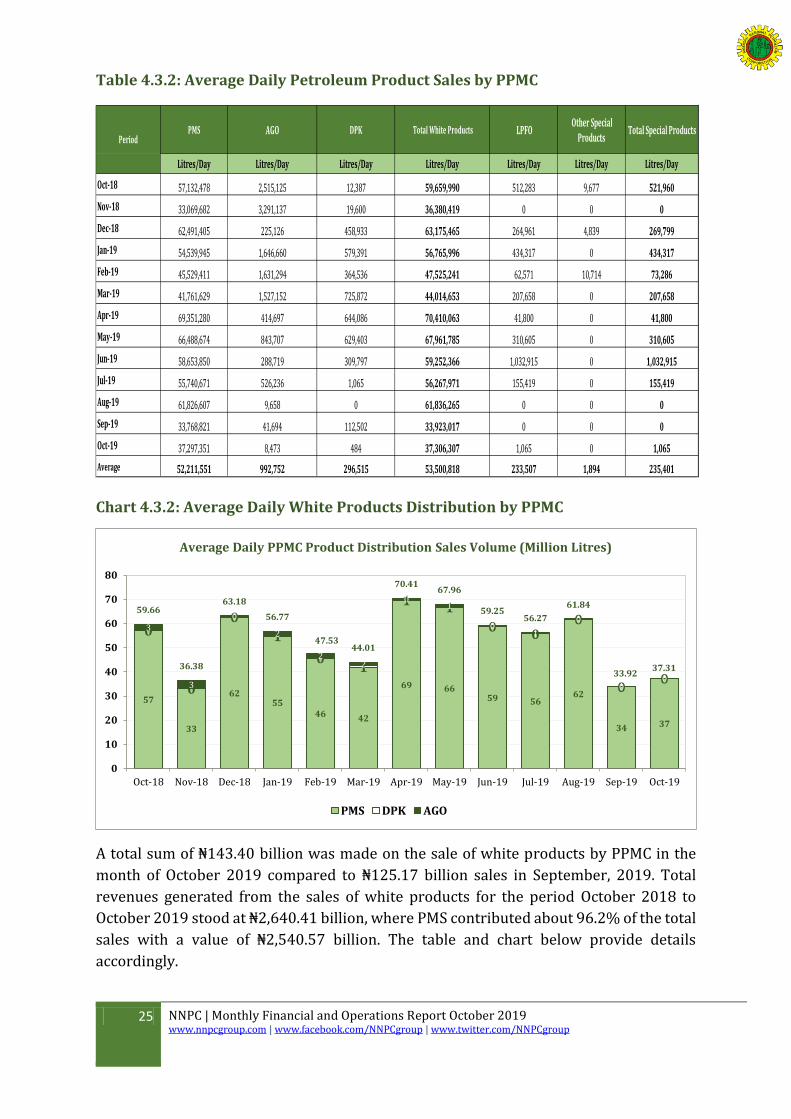
Table 4.3.2: Average Daily Petroleum Product Sales by PPMC
PMS AGO DPK Total White Products LPFO Other Special
Products Total Special Products
Litres/Day Litres/Day Litres/Day Litres/Day Litres/Day Litres/Day Litres/Day
Oct-18 57,132,478 2,515,125 12,387 59,659,990 512,283 9,677 521,960
Nov-18 33,069,682 3,291,137 19,600 36,380,419 0 0 0
Dec-18 62,491,405 225,126 458,933 63,175,465 264,961 4,839 269,799
Jan-19 54,539,945 1,646,660 579,391 56,765,996 434,317 0 434,317
Feb-19 45,529,411 1,631,294 364,536 47,525,241 62,571 10,714 73,286
Mar-19 41,761,629 1,527,152 725,872 44,014,653 207,658 0 207,658
Apr-19 69,351,280 414,697 644,086 70,410,063 41,800 0 41,800
May-19 66,488,674 843,707 629,403 67,961,785 310,605 0 310,605
Jun-19 58,653,850 288,719 309,797 59,252,366 1,032,915 0 1,032,915
Jul-19 55,740,671 526,236 1,065 56,267,971 155,419 0 155,419
Aug-19 61,826,607 9,658 0 61,836,265 0 0 0
Sep-19 33,768,821 41,694 112,502 33,923,017 0 0 0
Oct-19 37,297,351 8,473 484 37,306,307 1,065 0 1,065
Average 52,211,551 992,752 296,515 53,500,818 233,507 1,894 235,401
Period
Chart 4.3.2: Average Daily White Products Distribution by PPMC
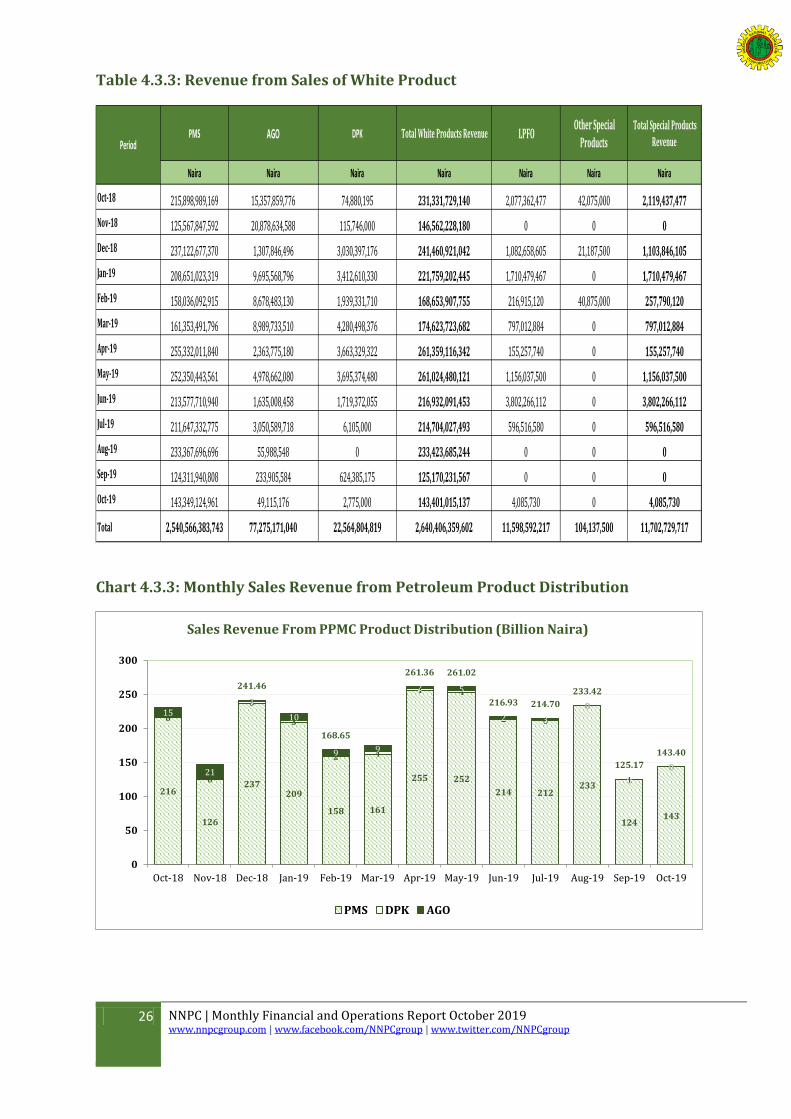
A total sum of ₦143.40 billion was made on the sale of white products by PPMC in the
month of October 2019 compared to ₦125.17 billion sales in September, 2019. Total
revenues generated from the sales of white products for the period October 2018 to
October 2019 stood at ₦2,640.41 billion, where PMS contributed about 96.2% of the total
sales with a value of ₦2,540.57 billion. The table and chart below provide details
accordingly.
57
33
6255
46 42
69 6659 56
62
34 37
0
0
0
1
01
1 1
00
0
00
3
3
0
2
22
01
01
0
00
59.66
36.38
63.18
56.77
47.5344.01
70.4167.96
59.2556.27
61.84
33.9237.31
0
10
20
30
40
50
60
70
80
Oct-18 Nov-18 Dec-18 Jan-19 Feb-19 Mar-19 Apr-19 May-19 Jun-19 Jul-19 Aug-19 Sep-19 Oct-19
Average Daily PPMC Product Distribution Sales Volume (Million Litres)
PMS DPK AGO
26 NNPC | Monthly Financial and Operations Report October 2019 www.nnpcgroup.com | www.facebook.com/NNPCgroup | www.twitter.com/NNPCgroup
Table 4.3.3: Revenue from Sales of White Product
PMS AGO DPK Total White Products Revenue LPFO Other Special
Products Total Special Products
Revenue
Naira Naira Naira Naira Naira Naira Naira
Oct-18 215,898,989,169 15,357,859,776 74,880,195 231,331,729,140 2,077,362,477 42,075,000 2,119,437,477
Nov-18 125,567,847,592 20,878,634,588 115,746,000 146,562,228,180 0 0 0
Dec-18 237,122,677,370 1,307,846,496 3,030,397,176 241,460,921,042 1,082,658,605 21,187,500 1,103,846,105
Jan-19 208,651,023,319 9,695,568,796 3,412,610,330 221,759,202,445 1,710,479,467 0 1,710,479,467
Feb-19 158,036,092,915 8,678,483,130 1,939,331,710 168,653,907,755 216,915,120 40,875,000 257,790,120
Mar-19 161,353,491,796 8,989,733,510 4,280,498,376 174,623,723,682 797,012,884 0 797,012,884
Apr-19 255,332,011,840 2,363,775,180 3,663,329,322 261,359,116,342 155,257,740 0 155,257,740
May-19 252,350,443,561 4,978,662,080 3,695,374,480 261,024,480,121 1,156,037,500 0 1,156,037,500
Jun-19 213,577,710,940 1,635,008,458 1,719,372,055 216,932,091,453 3,802,266,112 0 3,802,266,112
Jul-19 211,647,332,775 3,050,589,718 6,105,000 214,704,027,493 596,516,580 0 596,516,580
Aug-19 233,367,696,696 55,988,548 0 233,423,685,244 0 0 0
Sep-19 124,311,940,808 233,905,584 624,385,175 125,170,231,567 0 0 0
Oct-19 143,349,124,961 49,115,176 2,775,000 143,401,015,137 4,085,730 0 4,085,730
Total 2,540,566,383,743 77,275,171,040 22,564,804,819 2,640,406,359,602 11,598,592,217 104,137,500 11,702,729,717
Period
Chart 4.3.3: Monthly Sales Revenue from Petroleum Product Distribution
216
126
237209
158 161
255 252
214 212233
124143
0
0
3
3
2 4
4 4
2 0
0
1
0
15
21
1
10
9 9
2 5
2 3
0
0
0
241.46
168.65
261.36 261.02
216.93 214.70
233.42
125.17
143.40
0
50
100
150
200
250
300
Oct-18 Nov-18 Dec-18 Jan-19 Feb-19 Mar-19 Apr-19 May-19 Jun-19 Jul-19 Aug-19 Sep-19 Oct-19
Sales Revenue From PPMC Product Distribution (Billion Naira)
PMS DPK AGO
27 NNPC | Monthly Financial and Operations Report October 2019 www.nnpcgroup.com | www.facebook.com/NNPCgroup | www.twitter.com/NNPCgroup
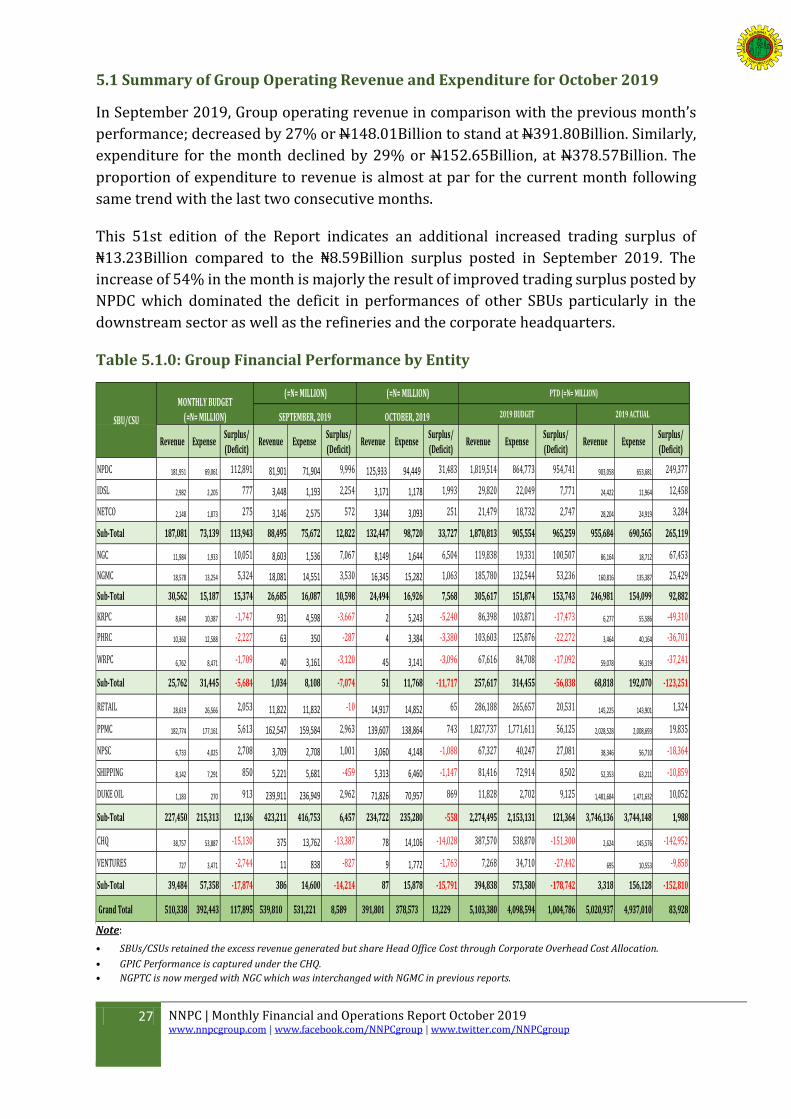
5.1 Summary of Group Operating Revenue and Expenditure for October 2019
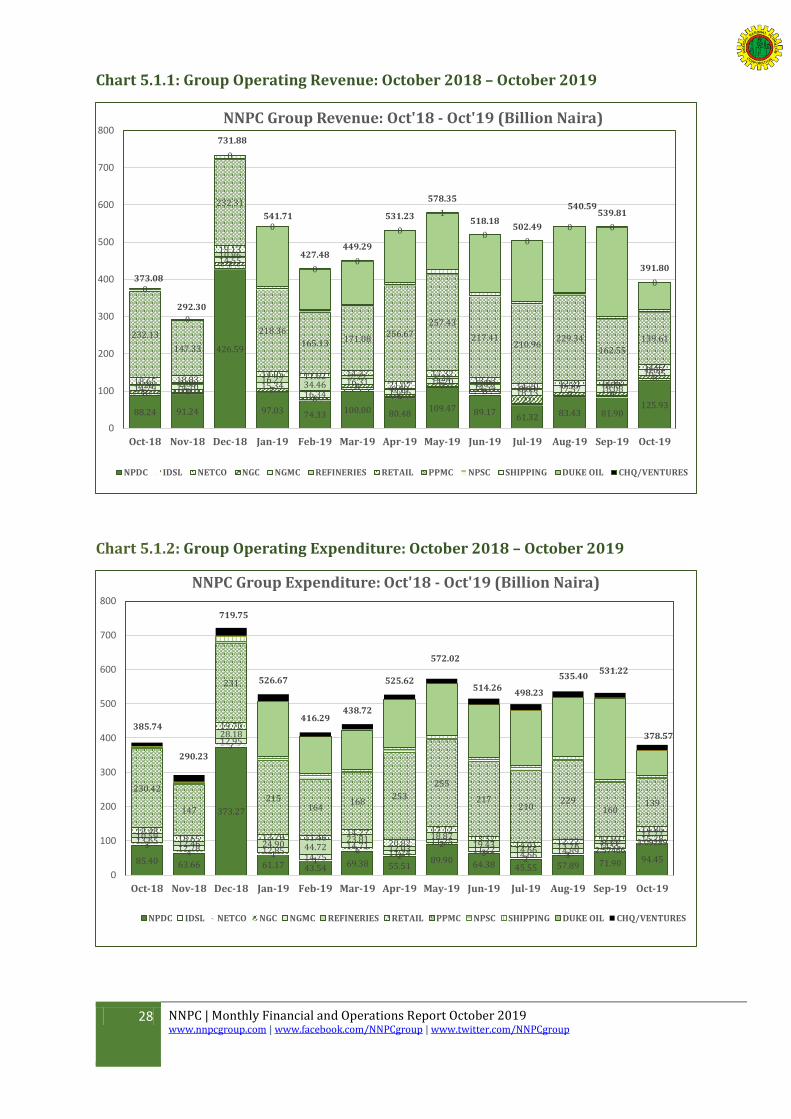
In September 2019, Group operating revenue in comparison with the previous month’s
performance; decreased by 27% or N148.01Billion to stand at N391.80Billion. Similarly,
expenditure for the month declined by 29% or N152.65Billion, at N378.57Billion. The
proportion of expenditure to revenue is almost at par for the current month following
same trend with the last two consecutive months.
This 51st edition of the Report indicates an additional increased trading surplus of
₦13.23Billion compared to the ₦8.59Billion surplus posted in September 2019. The
increase of 54% in the month is majorly the result of improved trading surplus posted by
NPDC which dominated the deficit in performances of other SBUs particularly in the
downstream sector as well as the refineries and the corporate headquarters.
Table 5.1.0: Group Financial Performance by Entity
Revenue ExpenseSurplus/
(Deficit)Revenue Expense
Surplus/
(Deficit)Revenue Expense
Surplus/
(Deficit)Revenue Expense
Surplus/
(Deficit)Revenue Expense
Surplus/
(Deficit)
NPDC 181,951 69,061 112,891 81,901 71,904 9,996 125,933 94,449 31,483 1,819,514 864,773 954,741 903,058 653,681 249,377
IDSL 2,982 2,205 777 3,448 1,193 2,254 3,171 1,178 1,993 29,820 22,049 7,771 24,422 11,964 12,458
NETCO 2,148 1,873 275 3,146 2,575 572 3,344 3,093 251 21,479 18,732 2,747 28,204 24,919 3,284
Sub-Total 187,081 73,139 113,943 88,495 75,672 12,822 132,447 98,720 33,727 1,870,813 905,554 965,259 955,684 690,565 265,119
NGC 11,984 1,933 10,051 8,603 1,536 7,067 8,149 1,644 6,504 119,838 19,331 100,507 86,164 18,712 67,453
NGMC 18,578 13,254 5,324 18,081 14,551 3,530 16,345 15,282 1,063 185,780 132,544 53,236 160,816 135,387 25,429
Sub-Total 30,562 15,187 15,374 26,685 16,087 10,598 24,494 16,926 7,568 305,617 151,874 153,743 246,981 154,099 92,882
KRPC 8,640 10,387 -1,747 931 4,598 -3,667 2 5,243 -5,240 86,398 103,871 -17,473 6,277 55,586 -49,310
PHRC 10,360 12,588 -2,227 63 350 -287 4 3,384 -3,380 103,603 125,876 -22,272 3,464 40,164 -36,701
WRPC 6,762 8,471 -1,709 40 3,161 -3,120 45 3,141 -3,096 67,616 84,708 -17,092 59,078 96,319 -37,241
Sub-Total 25,762 31,445 -5,684 1,034 8,108 -7,074 51 11,768 -11,717 257,617 314,455 -56,838 68,818 192,070 -123,251
RETAIL 28,619 26,566 2,053 11,822 11,832 -10 14,917 14,852 65 286,188 265,657 20,531 145,225 143,901 1,324
PPMC 182,774 177,161 5,613 162,547 159,584 2,963 139,607 138,864 743 1,827,737 1,771,611 56,125 2,028,528 2,008,693 19,835
NPSC 6,733 4,025 2,708 3,709 2,708 1,001 3,060 4,148 -1,088 67,327 40,247 27,081 38,346 56,710 -18,364
SHIPPING 8,142 7,291 850 5,221 5,681 -459 5,313 6,460 -1,147 81,416 72,914 8,502 52,353 63,211 -10,859
DUKE OIL 1,183 270 913 239,911 236,949 2,962 71,826 70,957 869 11,828 2,702 9,125 1,481,684 1,471,632 10,052
Sub-Total 227,450 215,313 12,136 423,211 416,753 6,457 234,722 235,280 -558 2,274,495 2,153,131 121,364 3,746,136 3,744,148 1,988
CHQ 38,757 53,887 -15,130 375 13,762 -13,387 78 14,106 -14,028 387,570 538,870 -151,300 2,624 145,576 -142,952
VENTURES 727 3,471 -2,744 11 838 -827 9 1,772 -1,763 7,268 34,710 -27,442 695 10,553 -9,858
Sub-Total 39,484 57,358 -17,874 386 14,600 -14,214 87 15,878 -15,791 394,838 573,580 -178,742 3,318 156,128 -152,810
Grand Total 510,338 392,443 117,895 539,810 531,221 8,589 391,801 378,573 13,229 5,103,380 4,098,594 1,004,786 5,020,937 4,937,010 83,928
2019 ACTUALOCTOBER, 2019SBU/CSU
MONTHLY BUDGET
(=N= MILLION)
PTD (=N= MILLION) (=N= MILLION)
2019 BUDGET
(=N= MILLION)
SEPTEMBER, 2019
Note:
• SBUs/CSUs retained the excess revenue generated but share Head Office Cost through Corporate Overhead Cost Allocation.
• GPIC Performance is captured under the CHQ.
• NGPTC is now merged with NGC which was interchanged with NGMC in previous reports.
28 NNPC | Monthly Financial and Operations Report October 2019 www.nnpcgroup.com | www.facebook.com/NNPCgroup | www.twitter.com/NNPCgroup
Chart 5.1.1: Group Operating Revenue: October 2018 – October 2019
Chart 5.1.2: Group Operating Expenditure: October 2018 – October 2019
88.24 91.24
426.59
97.03 74.33100.00 80.48
109.47 89.1761.32 83.43 81.90
125.93
8 8
7
76
86
76
219 9
814.79 14.10
14.55
15.3416.34
16.3113.96
14.2014.54
18.13 17.57 18.08
16.35
1.26 2.88
10.86
16.2734.46
7.77
0.595.24
2.010.83 0.56 1.03
0.0518.65 18.83
19.13
14.05 11.62 14.37
21.07
17.3213.63
14.20 12.21 11.82
14.92
232.13
147.33
232.31
218.36
165.13 171.08256.67
257.43
217.41210.96
229.34
162.55
139.61
0
0
0
0
0 0
0
1
0 0
0 0
0 373.08
292.30
731.88
541.71
427.48449.29
531.23
578.35
518.18502.49
540.59539.81
391.80
0
100
200
300
400
500
600
700
800
Oct-18 Nov-18 Dec-18 Jan-19 Feb-19 Mar-19 Apr-19 May-19 Jun-19 Jul-19 Aug-19 Sep-19 Oct-19
NNPC Group Revenue: Oct'18 - Oct'19 (Billion Naira)
NPDC IDSL NETCO NGC NGMC REFINERIES RETAIL PPMC NPSC SHIPPING DUKE OIL CHQ/VENTURES
85.40 63.66
373.27
61.17 43.54 69.38 55.5189.90 64.38 45.55 57.89 71.90 94.45
3 4
7
1 1
6 2
2 3
2 3 2.57466
3.0928913.6512.78
12.95
12.8514.75
14.7111.24
11.2511.22
14.66 14.89 14.5515.2810.59
12.46
28.18
24.90 44.7223.81
12.03
18.8719.43
14.66 13.76 8.1111.7718.48
18.65
19.70
13.79 11.4614.27
20.82
17.1213.52
14.01 12.22 11.8314.85
230.42
147
231
215 164
168 253
255
217 210
229 160
139
385.74
290.23
719.75
526.67
416.29438.72
525.62
572.02
514.26498.23
535.40531.22
378.57
0
100
200
300
400
500
600
700
800
Oct-18 Nov-18 Dec-18 Jan-19 Feb-19 Mar-19 Apr-19 May-19 Jun-19 Jul-19 Aug-19 Sep-19 Oct-19
NNPC Group Expenditure: Oct'18 - Oct'19 (Billion Naira)
NPDC IDSL NETCO NGC NGMC REFINERIES RETAIL PPMC NPSC SHIPPING DUKE OIL CHQ/VENTURES
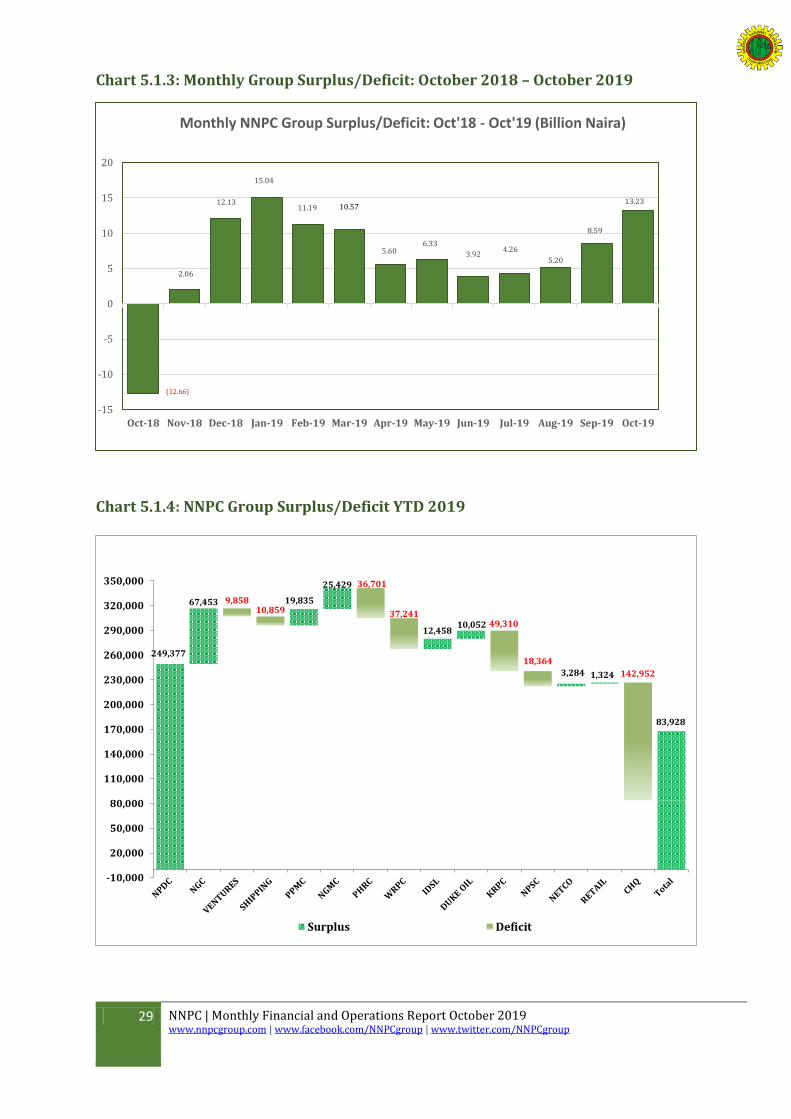
29 NNPC | Monthly Financial and Operations Report October 2019 www.nnpcgroup.com | www.facebook.com/NNPCgroup | www.twitter.com/NNPCgroup
Chart 5.1.3: Monthly Group Surplus/Deficit: October 2018 – October 2019
Chart 5.1.4: NNPC Group Surplus/Deficit YTD 2019
11.19
15.04
12.13
5.60
10.57
2.06
(12.66)
6.33
3.924.26
5.20
8.59
13.23
-15
-10
-5
0
5
10
15
20
Oct-18 Nov-18 Dec-18 Jan-19 Feb-19 Mar-19 Apr-19 May-19 Jun-19 Jul-19 Aug-19 Sep-19 Oct-19
Monthly NNPC Group Surplus/Deficit: Oct'18 - Oct'19 (Billion Naira)
9,85810,859
36,701
37,24149,310
18,364
142,952
249,377
67,453 19,835
25,429
12,45810,052
3,284 1,324
83,928
-10,000
20,000
50,000
80,000
110,000
140,000
170,000
200,000
230,000
260,000
290,000
320,000
350,000
Surplus Deficit
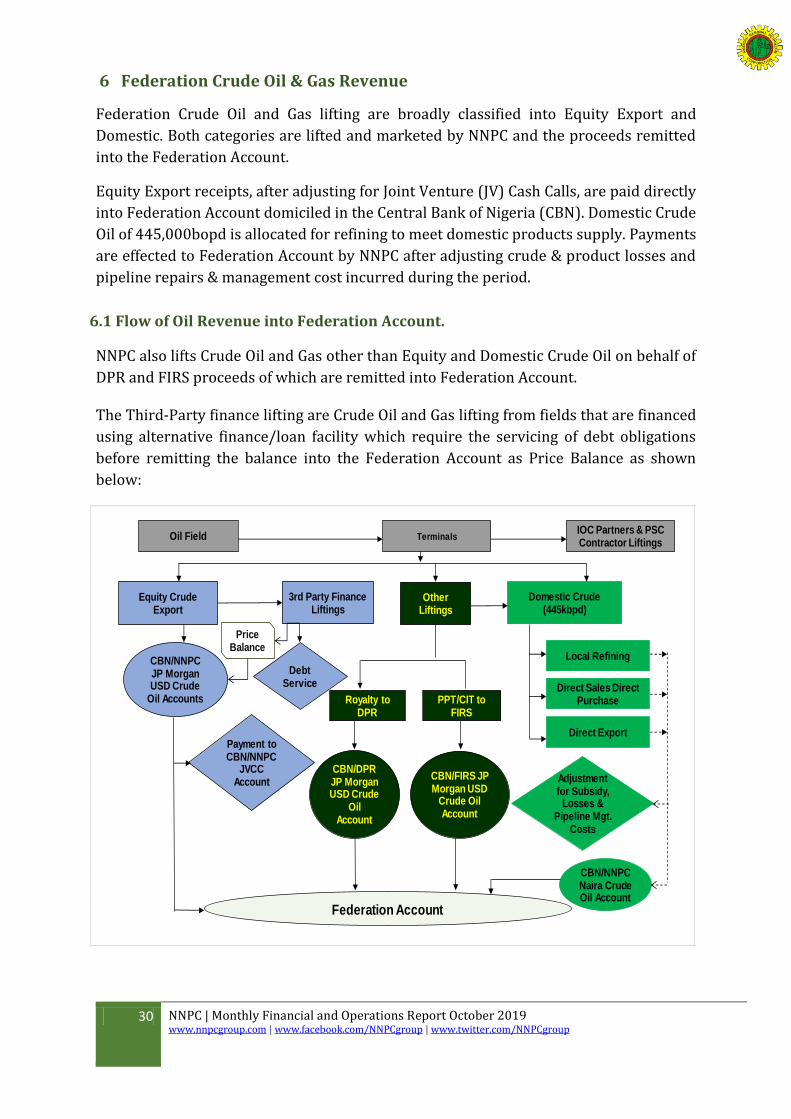
30 NNPC | Monthly Financial and Operations Report October 2019 www.nnpcgroup.com | www.facebook.com/NNPCgroup | www.twitter.com/NNPCgroup
6 Federation Crude Oil & Gas Revenue
Federation Crude Oil and Gas lifting are broadly classified into Equity Export and
Domestic. Both categories are lifted and marketed by NNPC and the proceeds remitted
into the Federation Account.
Equity Export receipts, after adjusting for Joint Venture (JV) Cash Calls, are paid directly
into Federation Account domiciled in the Central Bank of Nigeria (CBN). Domestic Crude
Oil of 445,000bopd is allocated for refining to meet domestic products supply. Payments
are effected to Federation Account by NNPC after adjusting crude & product losses and
pipeline repairs & management cost incurred during the period.
6.1 Flow of Oil Revenue into Federation Account.
NNPC also lifts Crude Oil and Gas other than Equity and Domestic Crude Oil on behalf of
DPR and FIRS proceeds of which are remitted into Federation Account.
The Third-Party finance lifting are Crude Oil and Gas lifting from fields that are financed
using alternative finance/loan facility which require the servicing of debt obligations
before remitting the balance into the Federation Account as Price Balance as shown
below:
Oil Field Terminals
Equity Crude Export
3rd Party Finance Liftings
Other Liftings
Domestic Crude (445kbpd)
CBN/NNPC JP Morgan USD Crude
Oil Accounts
Debt Service
Payment to CBN/NNPC
JVCC Account
CBN/DPR JP Morgan USD Crude
Oil Account
CBN/FIRS JP Morgan USD
Crude Oil Account
Local Refining
Direct Export
Adjustment for Subsidy,
Losses & Pipeline Mgt.
Costs
Royalty to DPR
PPT/CIT to FIRS
Federation Account
CBN/NNPC Naira Crude Oil Account
Price Balance
IOC Partners & PSC Contractor Liftings
Direct Sales Direct Purchase
17,229 22,539
11,923
10,141
22,539 21,793 28,684 19,695 20,540
10,606
17,550
8,358
92,444 107,766
118,070
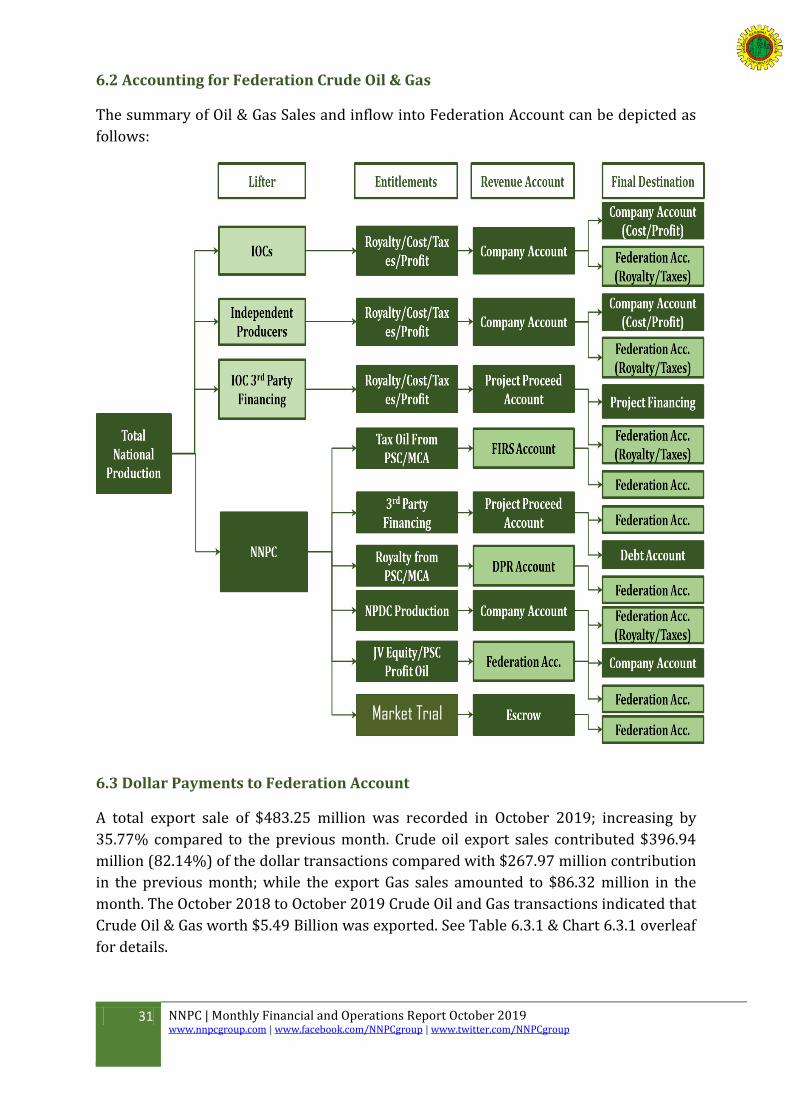
31 NNPC | Monthly Financial and Operations Report October 2019 www.nnpcgroup.com | www.facebook.com/NNPCgroup | www.twitter.com/NNPCgroup
6.2 Accounting for Federation Crude Oil & Gas
The summary of Oil & Gas Sales and inflow into Federation Account can be depicted as
follows:
6.3 Dollar Payments to Federation Account
A total export sale of $483.25 million was recorded in October 2019; increasing by
35.77% compared to the previous month. Crude oil export sales contributed $396.94
million (82.14%) of the dollar transactions compared with $267.97 million contribution
in the previous month; while the export Gas sales amounted to $86.32 million in the
month. The October 2018 to October 2019 Crude Oil and Gas transactions indicated that
Crude Oil & Gas worth $5.49 Billion was exported. See Table 6.3.1 & Chart 6.3.1 overleaf
for details.
Market Trial
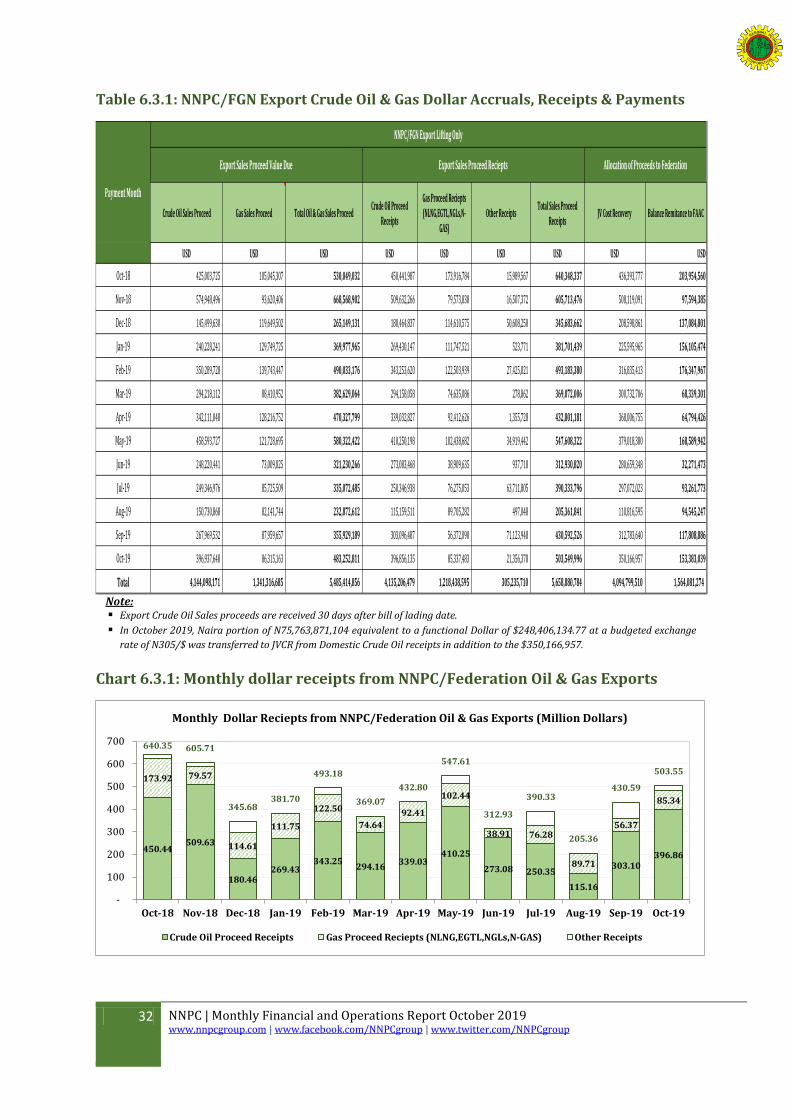
32 NNPC | Monthly Financial and Operations Report October 2019 www.nnpcgroup.com | www.facebook.com/NNPCgroup | www.twitter.com/NNPCgroup
Table 6.3.1: NNPC/FGN Export Crude Oil & Gas Dollar Accruals, Receipts & Payments
Crude Oil Sales Proceed Gas Sales Proceed Total Oil & Gas Sales ProceedCrude Oil Proceed
Receipts
Gas Proceed Reciepts
(NLNG,EGTL,NGLs,N-
GAS)
Other ReceiptsTotal Sales Proceed
ReceiptsJV Cost Recovery Balance Remitance to FAAC
USD USD USD USD USD USD USD USD USD
Oct-18 425,003,725 105,045,307 530,049,032 450,441,987 173,916,784 15,989,567 640,348,337 436,393,777 203,954,560
Nov-18 574,948,496 93,620,406 668,568,902 509,632,266 79,573,838 16,507,372 605,713,476 508,119,091 97,594,385
Dec-18 145,499,630 119,649,502 265,149,131 180,464,837 114,610,575 50,608,250 345,683,662 208,598,861 137,084,801
Jan-19 240,228,241 129,749,725 369,977,965 269,430,147 111,747,521 523,771 381,701,439 225,595,965 156,105,474
Feb-19 350,289,728 139,743,447 490,033,176 343,253,620 122,503,939 27,425,821 493,183,380 316,835,413 176,347,967
Mar-19 294,218,112 88,410,952 382,629,064 294,158,058 74,635,086 278,862 369,072,006 300,732,706 68,339,301
Apr-19 342,111,048 128,216,752 470,327,799 339,032,827 92,412,626 1,355,728 432,801,181 368,006,755 64,794,426
May-19 458,593,727 121,728,695 580,322,422 410,250,198 102,438,682 34,919,442 547,608,322 379,018,380 168,589,942
Jun-19 248,220,441 73,009,825 321,230,266 273,083,468 38,909,635 937,718 312,930,820 280,659,348 32,271,473
Jul-19 249,346,976 85,725,509 335,072,485 250,346,938 76,275,053 63,711,805 390,333,796 297,072,023 93,261,773
Aug-19 150,730,868 82,141,744 232,872,612 115,159,511 89,705,282 497,048 205,361,841 110,816,595 94,545,247
Sep-19 267,969,532 87,959,657 355,929,189 303,096,487 56,372,090 71,123,948 430,592,526 312,783,640 117,808,886
Oct-19 396,937,648 86,315,163 483,252,811 396,856,135 85,337,483 21,356,378 503,549,996 350,166,957 153,383,039
Total 4,144,098,171 1,341,316,685 5,485,414,856 4,135,206,479 1,218,438,595 305,235,710 5,658,880,784 4,094,799,510 1,564,081,274
Payment Month
Export Sales Proceed Value Due
NNPC/FGN Export Lifting Only
Allocation of Proceeds to FederationExport Sales Proceed Reciepts
Note: Export Crude Oil Sales proceeds are received 30 days after bill of lading date.
In October 2019, Naira portion of N75,763,871,104 equivalent to a functional Dollar of $248,406,134.77 at a budgeted exchange
rate of N305/$ was transferred to JVCR from Domestic Crude Oil receipts in addition to the $350,166,957.
Chart 6.3.1: Monthly dollar receipts from NNPC/Federation Oil & Gas Exports
450.44509.63
180.46269.43
343.25294.16
339.03410.25
273.08 250.35
115.16
303.10396.86
173.92 79.57
114.61
111.75
122.50
74.64
92.41
102.44
38.91 76.28
89.71
56.37
85.34
640.35 605.71
345.68381.70
493.18
369.07
432.80
547.61
312.93
390.33
205.36
430.59
503.55
-
100
200
300
400
500
600
700
Oct-18 Nov-18 Dec-18 Jan-19 Feb-19 Mar-19 Apr-19 May-19 Jun-19 Jul-19 Aug-19 Sep-19 Oct-19
Monthly Dollar Reciepts from NNPC/Federation Oil & Gas Exports (Million Dollars)
Crude Oil Proceed Receipts Gas Proceed Reciepts (NLNG,EGTL,NGLs,N-GAS) Other Receipts
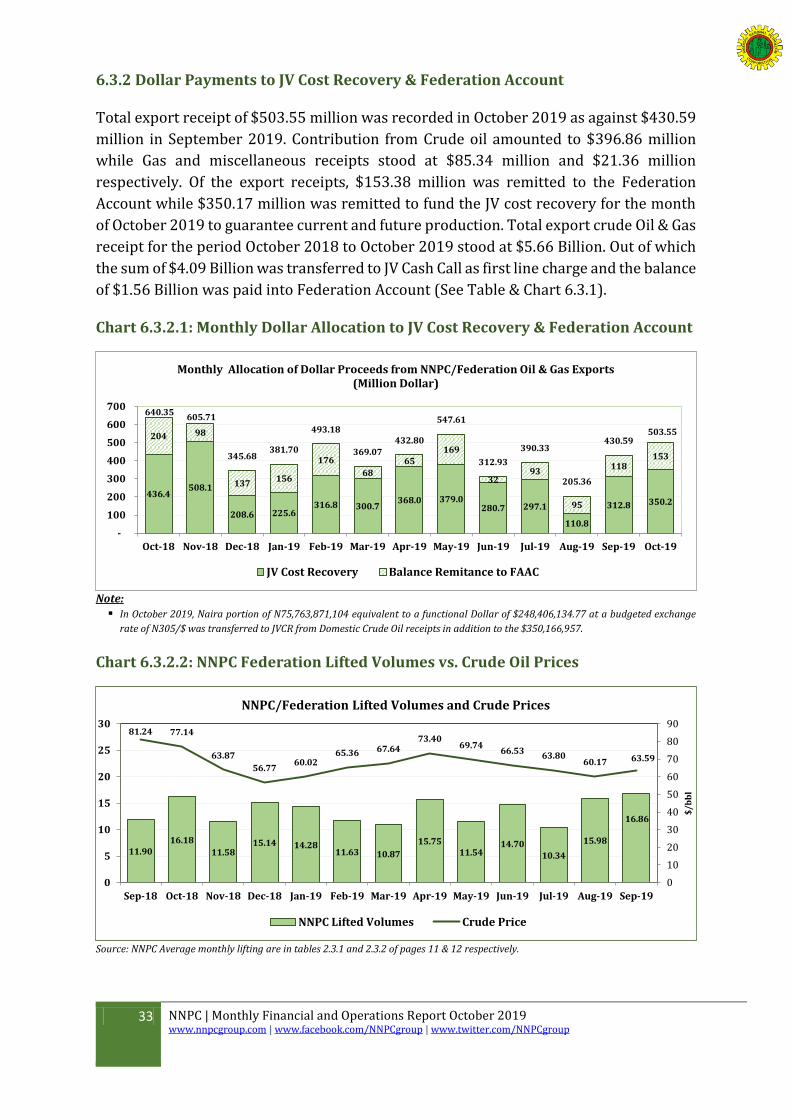
33 NNPC | Monthly Financial and Operations Report October 2019 www.nnpcgroup.com | www.facebook.com/NNPCgroup | www.twitter.com/NNPCgroup
6.3.2 Dollar Payments to JV Cost Recovery & Federation Account
Total export receipt of $503.55 million was recorded in October 2019 as against $430.59
million in September 2019. Contribution from Crude oil amounted to $396.86 million
while Gas and miscellaneous receipts stood at $85.34 million and $21.36 million
respectively. Of the export receipts, $153.38 million was remitted to the Federation
Account while $350.17 million was remitted to fund the JV cost recovery for the month
of October 2019 to guarantee current and future production. Total export crude Oil & Gas
receipt for the period October 2018 to October 2019 stood at $5.66 Billion. Out of which
the sum of $4.09 Billion was transferred to JV Cash Call as first line charge and the balance
of $1.56 Billion was paid into Federation Account (See Table & Chart 6.3.1).
Chart 6.3.2.1: Monthly Dollar Allocation to JV Cost Recovery & Federation Account
Note:
In October 2019, Naira portion of N75,763,871,104 equivalent to a functional Dollar of $248,406,134.77 at a budgeted exchange
rate of N305/$ was transferred to JVCR from Domestic Crude Oil receipts in addition to the $350,166,957.
Chart 6.3.2.2: NNPC Federation Lifted Volumes vs. Crude Oil Prices
Source: NNPC Average monthly lifting are in tables 2.3.1 and 2.3.2 of pages 11 & 12 respectively.
436.4508.1
208.6 225.6316.8 300.7
368.0 379.0280.7 297.1
110.8
312.8 350.2
204 98
137 156
176
68
65 169
32 93
95
118 153
640.35605.71
345.68381.70
493.18
369.07432.80
547.61
312.93
390.33
205.36
430.59503.55
-
100
200
300
400
500
600
700
Oct-18 Nov-18 Dec-18 Jan-19 Feb-19 Mar-19 Apr-19 May-19 Jun-19 Jul-19 Aug-19 Sep-19 Oct-19
Monthly Allocation of Dollar Proceeds from NNPC/Federation Oil & Gas Exports (Million Dollar)
JV Cost Recovery Balance Remitance to FAAC
11.9016.18
11.5815.14 14.28
11.63 10.87
15.7511.54
14.7010.34
15.98
16.86
81.24 77.14
63.87
56.7760.02
65.36 67.6473.40
69.7466.53
63.8060.17 63.59
0
10
20
30
40
50
60
70
80
90
0
5
10
15
20
25
30
Sep-18 Oct-18 Nov-18 Dec-18 Jan-19 Feb-19 Mar-19 Apr-19 May-19 Jun-19 Jul-19 Aug-19 Sep-19
$/b
bl
Mil
lio
ns
Ba
rre
ls
NNPC/Federation Lifted Volumes and Crude Prices
NNPC Lifted Volumes Crude Price
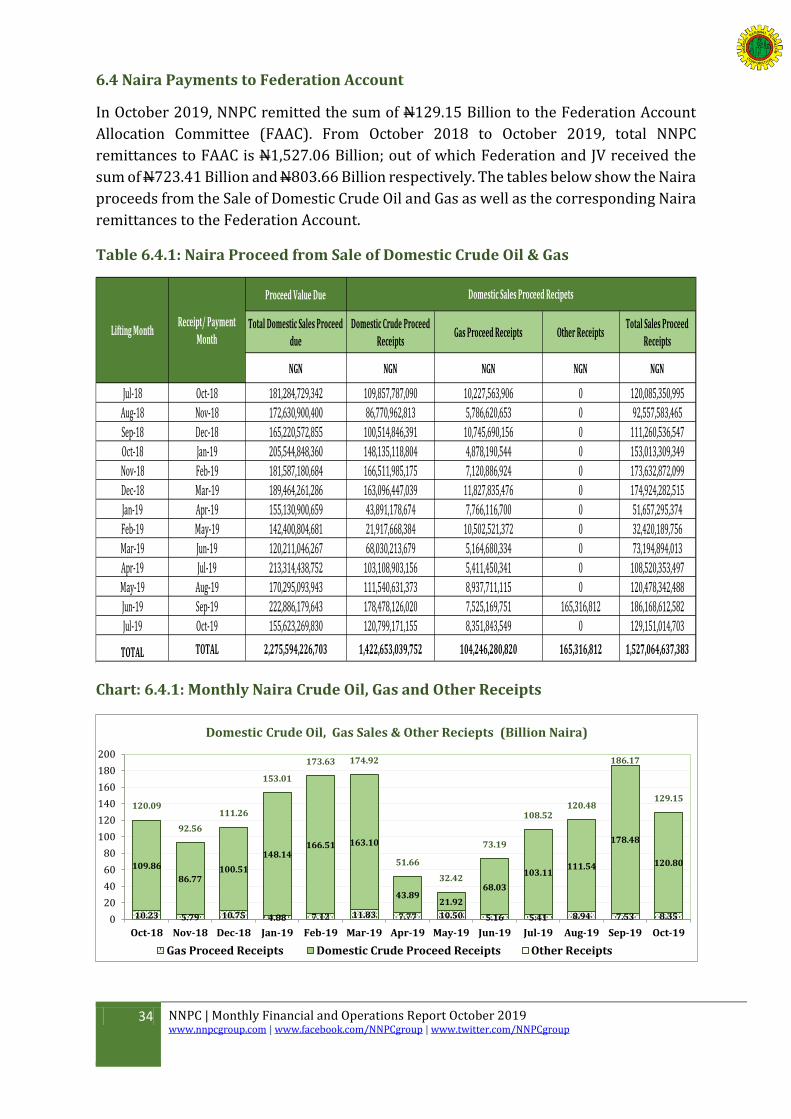
34 NNPC | Monthly Financial and Operations Report October 2019 www.nnpcgroup.com | www.facebook.com/NNPCgroup | www.twitter.com/NNPCgroup
6.4 Naira Payments to Federation Account
In October 2019, NNPC remitted the sum of N129.15 Billion to the Federation Account
Allocation Committee (FAAC). From October 2018 to October 2019, total NNPC
remittances to FAAC is N1,527.06 Billion; out of which Federation and JV received the
sum of N723.41 Billion and N803.66 Billion respectively. The tables below show the Naira
proceeds from the Sale of Domestic Crude Oil and Gas as well as the corresponding Naira
remittances to the Federation Account.
Table 6.4.1: Naira Proceed from Sale of Domestic Crude Oil & Gas
Proceed Value Due
Total Domestic Sales Proceed
due
Domestic Crude Proceed
ReceiptsGas Proceed Receipts Other Receipts
Total Sales Proceed
Receipts
NGN NGN NGN NGN NGN
Jul-18 Oct-18 181,284,729,342 109,857,787,090 10,227,563,906 0 120,085,350,995
Aug-18 Nov-18 172,630,900,400 86,770,962,813 5,786,620,653 0 92,557,583,465
Sep-18 Dec-18 165,220,572,855 100,514,846,391 10,745,690,156 0 111,260,536,547
Oct-18 Jan-19 205,544,848,360 148,135,118,804 4,878,190,544 0 153,013,309,349
Nov-18 Feb-19 181,587,180,684 166,511,985,175 7,120,886,924 0 173,632,872,099
Dec-18 Mar-19 189,464,261,286 163,096,447,039 11,827,835,476 0 174,924,282,515
Jan-19 Apr-19 155,130,900,659 43,891,178,674 7,766,116,700 0 51,657,295,374
Feb-19 May-19 142,400,804,681 21,917,668,384 10,502,521,372 0 32,420,189,756
Mar-19 Jun-19 120,211,046,267 68,030,213,679 5,164,680,334 0 73,194,894,013
Apr-19 Jul-19 213,314,438,752 103,108,903,156 5,411,450,341 0 108,520,353,497
May-19 Aug-19 170,295,093,943 111,540,631,373 8,937,711,115 0 120,478,342,488
Jun-19 Sep-19 222,886,179,643 178,478,126,020 7,525,169,751 165,316,812 186,168,612,582
Jul-19 Oct-19 155,623,269,830 120,799,171,155 8,351,843,549 0 129,151,014,703
TOTAL TOTAL 2,275,594,226,703 1,422,653,039,752 104,246,280,820 165,316,812 1,527,064,637,383
Domestic Sales Proceed Recipets
Receipt/ Payment
MonthLifting Month
Chart: 6.4.1: Monthly Naira Crude Oil, Gas and Other Receipts
10.23 5.79 10.75 4.88 7.12 11.83 7.77 10.50 5.16 5.41 8.94 7.53 8.35
109.86
86.77100.51
148.14166.51 163.10
43.8921.92
68.03
103.11111.54
178.48
120.80
120.09
92.56
111.26
153.01
173.63 174.92
51.66
32.42
73.19
108.52120.48
186.17
129.15
0
20
40
60
80
100
120
140
160
180
200
Oct-18 Nov-18 Dec-18 Jan-19 Feb-19 Mar-19 Apr-19 May-19 Jun-19 Jul-19 Aug-19 Sep-19 Oct-19
Domestic Crude Oil, Gas Sales & Other Reciepts (Billion Naira)
Gas Proceed Receipts Domestic Crude Proceed Receipts Other Receipts
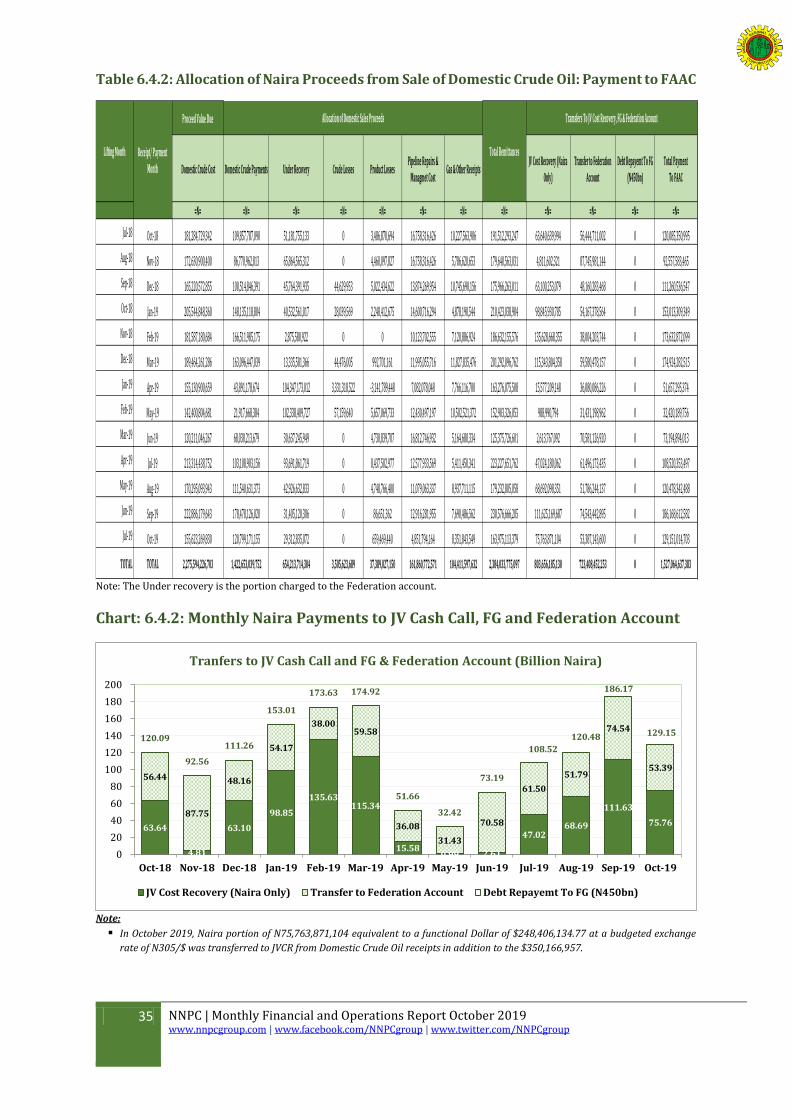
35 NNPC | Monthly Financial and Operations Report October 2019 www.nnpcgroup.com | www.facebook.com/NNPCgroup | www.twitter.com/NNPCgroup
Table 6.4.2: Allocation of Naira Proceeds from Sale of Domestic Crude Oil: Payment to FAAC
Proceed Value Due
Domestic Crude Cost Domestic Crude Payments Under Recovery Crude Losses Product LossesPipeline Repairs &
Managmet CostGas & Other Receipts
JV Cost Recovery (Naira
Only)
Transfer to Federation
Account
Debt Repayemt To FG
(N450bn)
Total Payment
To FAAC
=N= =N= =N= =N= =N= =N= =N= =N= =N= =N= =N= =N=
Jul-18 Oct-18 181,284,729,342 109,857,787,090 51,181,755,133 0 3,486,870,694 16,758,316,426 10,227,563,906 191,512,293,247 63,640,639,994 56,444,711,002 0 120,085,350,995
Aug-18 Nov-18 172,630,900,400 86,770,962,813 65,864,565,312 0 4,460,097,827 16,758,316,426 5,786,620,653 179,640,563,031 4,811,602,321 87,745,981,144 0 92,557,583,465
Sep-18 Dec-18 165,220,572,855 100,514,846,391 45,764,391,935 44,629,953 5,022,434,622 13,874,269,954 10,745,690,156 175,966,263,011 63,100,253,079 48,160,283,468 0 111,260,536,547
Oct-18 Jan-19 205,544,848,360 148,135,118,804 40,532,561,017 28,039,569 2,248,412,675 14,600,716,294 4,878,190,544 210,423,038,904 98,845,930,785 54,167,378,564 0 153,013,309,349
Nov-18 Feb-19 181,587,180,684 166,511,985,175 2,875,580,922 0 0 10,123,702,555 7,120,886,924 186,632,155,576 135,628,668,355 38,004,203,744 0 173,632,872,099
Dec-18 Mar-19 189,464,261,286 163,096,447,039 13,335,581,366 44,476,005 992,701,161 11,995,055,716 11,827,835,476 201,292,096,762 115,343,804,358 59,580,478,157 0 174,924,282,515
Jan-19 Apr-19 155,130,900,659 43,891,178,674 104,347,173,012 3,331,318,522 -3,141,789,448 7,082,078,048 7,766,116,700 163,276,075,508 15,577,209,148 36,080,086,226 0 51,657,295,374
Feb-19 May-19 142,400,804,681 21,917,668,384 102,338,409,727 57,159,640 5,657,069,733 12,430,497,197 10,502,521,372 152,903,326,053 988,990,794 31,431,198,962 0 32,420,189,756
Mar-19 Jun-19 120,211,046,267 68,030,213,679 30,637,245,949 0 4,730,839,707 16,812,746,932 5,164,680,334 125,375,726,601 2,613,767,092 70,581,126,920 0 73,194,894,013
Apr-19 Jul-19 213,314,438,752 103,108,903,156 93,691,861,719 0 8,437,502,977 12,577,933,569 5,411,450,341 223,227,651,762 47,024,180,062 61,496,173,435 0 108,520,353,497
May-19 Aug-19 170,295,093,943 111,540,631,373 42,926,632,833 0 4,748,766,400 11,079,063,337 8,937,711,115 179,232,805,058 68,692,098,351 51,786,244,137 0 120,478,342,488
Jun-19 Sep-19 222,886,179,643 178,478,126,020 31,405,120,306 0 86,651,362 12,916,281,955 7,690,486,562 230,576,666,205 111,625,169,687 74,543,442,895 0 186,168,612,582
Jul-19 Oct-19 155,623,269,830 120,799,171,155 29,312,835,072 0 659,469,440 4,851,794,164 8,351,843,549 163,975,113,379 75,763,871,104 53,387,143,600 0 129,151,014,703
TOTAL TOTAL 2,275,594,226,703 1,422,653,039,752 654,213,714,304 3,505,623,689 37,389,027,150 161,860,772,571 104,411,597,632 2,384,033,775,097 803,656,185,130 723,408,452,253 0 1,527,064,637,383
Allocation of Domestic Sales Proceeds
Receipt/ Payment
Month
Lifting Month
Tramsfers To JV Cost Recovery, FG & Federation Account
Total Remittances
Note: The Under recovery is the portion charged to the Federation account.
Chart: 6.4.2: Monthly Naira Payments to JV Cash Call, FG and Federation Account
Note:
In October 2019, Naira portion of N75,763,871,104 equivalent to a functional Dollar of $248,406,134.77 at a budgeted exchange
rate of N305/$ was transferred to JVCR from Domestic Crude Oil receipts in addition to the $350,166,957.
63.64
4.81
63.10
98.85
135.63115.34
15.580.99 2.61
47.0268.69
111.63
75.76
56.44
87.75
48.16
54.17
38.0059.58
36.08
31.43
70.58
61.50
51.79
74.54
53.39
120.09
92.56
111.26
153.01
173.63 174.92
51.66
32.42
73.19
108.52
120.48
186.17
129.15
0
20
40
60
80
100
120
140
160
180
200
Oct-18 Nov-18 Dec-18 Jan-19 Feb-19 Mar-19 Apr-19 May-19 Jun-19 Jul-19 Aug-19 Sep-19 Oct-19
Tranfers to JV Cash Call and FG & Federation Account (Billion Naira)
JV Cost Recovery (Naira Only) Transfer to Federation Account Debt Repayemt To FG (N450bn)
36 NNPC | Monthly Financial and Operations Report October 2019 www.nnpcgroup.com | www.facebook.com/NNPCgroup | www.twitter.com/NNPCgroup
7.0 Key Determinants for Change
7.1 Key events and activities during the period
Eliminating Gas Flare Remains Priority
Eliminating gas flare with a view to bequeathing a pollution-free environment to future
generations of Nigerians remains a priority of the NNPC. The Corporation made this
commitment at an event held at the NNPC Towers to mark the World Environment Day.
Speaking at the theme of this year’s World Environment Day, “Air Pollution”, at the event,
the Group Managing Director of NNPC, Dr. Maikanti Baru, urged members of staff to
maintain the Corporation’s business culture of “working not to harm the people or the
environment’’.
WRPC Achieves Feat in Maintenance of FCC Unit, Saves Cost
Engineers of the Maintenance Department of the Warri Refinery and Petrochemical
Company (WRPC) Ltd have saved the Company huge cost by carrying out the repairs of
the plant’s Fluid Catalytic Cracking Unit (FCCU) which had come down as a result of a
faulty plug valve (PV-1). The feat was achieved through extensive works which involved
the complete dismantling and reassembling of the faulty plug valve within the refinery
complex, the first of its kind in the history of the refinery.
World Environment Day (WED): PHRC Takes Anti-Air Pollution Campaign to Schools
In a bid to raise the consciousness of the youth on environmental issues, the Port
Harcourt Refining Company (PHRC) has taken the campaign against air pollution to
secondary schools in its host communities of Eleme and Okrika. At an event organised to
mark the WED, students from 10 secondary schools were invited to join staff of the
refinery and were treated to presentations on the theme for this year’s celebration, “Air
Pollution” and a quiz competition during which they won prizes.
223 Companies Bid for NNPC Natural Gas Liquids in Bid to Expand LPG Market
The NNPC has commenced the process of expanding the Nation’s Liquefied Petroleum
Gas (LPG) market through the selection of reputable companies to off-take Natural Gas
Liquids (NGLs) for domestic and international markets. The exercise which took place
recently at the NNPC towers, Abuja, saw 223 companies bid for the 2019-2021 sale and
purchase of NGLs. Speaking at the public opening of the bids in keeping with the
Corporation’s commitment to transparency, the GMD of the Corporation, Dr. Baru, said
the exercise was part of the strategic focus to expand the Nation’s domestic LPG supply
and encourage investments in storage, marketing and distribution infrastructure.
37 NNPC | Monthly Financial and Operations Report October 2019 www.nnpcgroup.com | www.facebook.com/NNPCgroup | www.twitter.com/NNPCgroup
7.2 Key challenges
The following are some key setbacks that affected production in the month:
i. BONGA TERMINAL
Production shut-down due to framo pump issues with cumulative loss of
226,000 bpd.
ii. OGU OCHA TERMINAL
Production shut down due to the occupation of our flow station by Host
communities. Asset Management Team of OML 42 declared Force Majeure
on Jones Creek blend. Production cut was 42,000 bpd for 8days.
iii. ERHA TERMINAL
Production shut-in for 2days due to maintenance activity and flare
management with total loss of 304,490 barrels.
iv. BONNY TERMINAL
TNP was shut down for just a day due leaks from 29/07/19 - 08/08/19
(8days in August) with shut-in of 20kbd.
v. QUA IBOE TERMINAL There was production shut -in at Usari from 25/05/19 -06/06/19 (6 days
in June) following equipment failure. Likewise, production was shut-in for
another 6days at Asabo due to maintenance. Cumulative loss of production
within the period was 235,000 barrels.
vi. AMENAM TERMINAL
Full field shutdown for 3days for the replacement of corroded actuator with
total loss of 221,200 barrels.
vii. SEA EAGLE TERMINAL
Production shutdown due to issues with the bearing terminal mooring
system from 09/07/19 - 31/08/19 with production cut of 22,000 bpd for a
period of 30days.
viii. EGINA TERMINAL
Oil production was shut-in due to loss of level in cooling water expansion
drum, reduction of interface level in both wash tanks and riser protector
replacement. Cumulative loss of production was 442,700 barrels over a
period of 9days.
ix. AKPO TERMINAL
Production shut-in due to emergency shutdown caused by loss of power.
Production cut was 47,000 bpd in 2days.
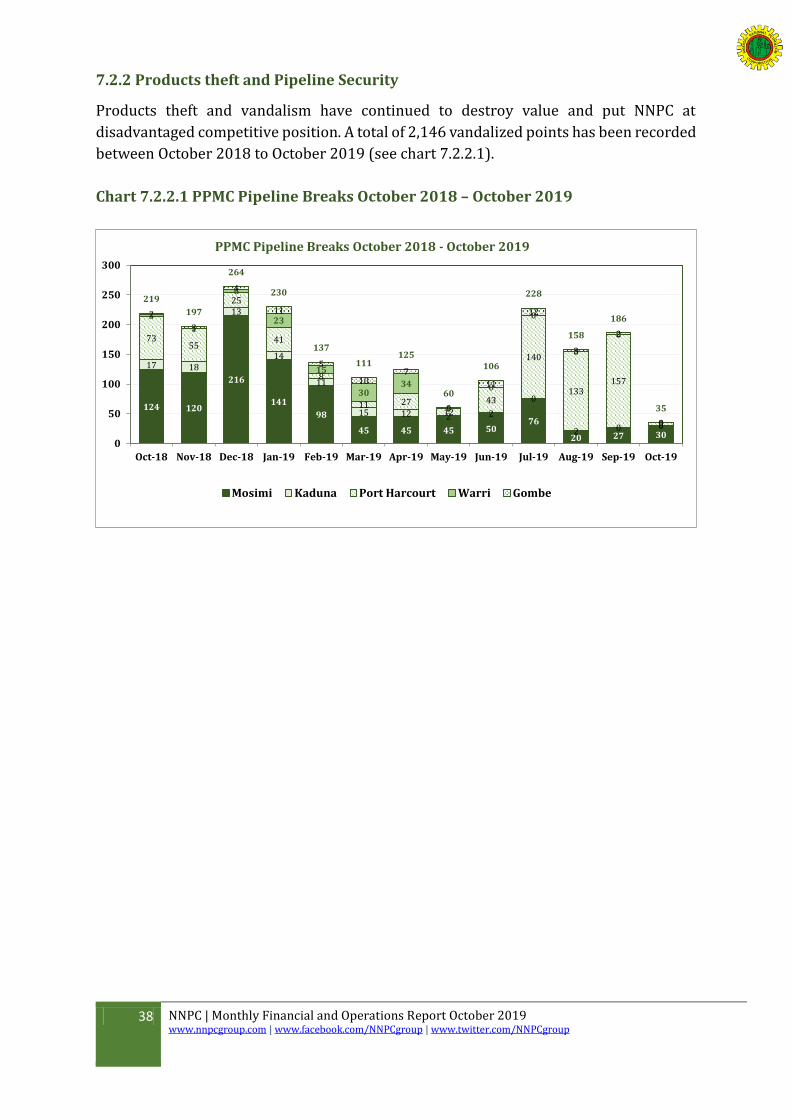
38 NNPC | Monthly Financial and Operations Report October 2019 www.nnpcgroup.com | www.facebook.com/NNPCgroup | www.twitter.com/NNPCgroup
7.2.2 Products theft and Pipeline Security
Products theft and vandalism have continued to destroy value and put NNPC at
disadvantaged competitive position. A total of 2,146 vandalized points has been recorded
between October 2018 to October 2019 (see chart 7.2.2.1).
Chart 7.2.2.1 PPMC Pipeline Breaks October 2018 – October 2019
124 120
216
141
98
45 45 45 5076
20 27 30
17 18
13
14
11
15 12 2 2
0
2 0 0
7355
25
41
8
11 2712
43
140
133157
5
3
1
6
23
15
3034
1
0
0
0
0
0
2
3
4
11
5
107
0
11
12
3
2
0
219
197
264
230
137
111125
60
106
228
158
186
35
0
50
100
150
200
250
300
Oct-18 Nov-18 Dec-18 Jan-19 Feb-19 Mar-19 Apr-19 May-19 Jun-19 Jul-19 Aug-19 Sep-19 Oct-19
PPMC Pipeline Breaks October 2018 - October 2019
Mosimi Kaduna Port Harcourt Warri Gombe
39 NNPC | Monthly Financial and Operations Report October 2019 www.nnpcgroup.com | www.facebook.com/NNPCgroup | www.twitter.com/NNPCgroup
8 Glossary and Definition of Terms
AF Alternative Funding (Financing)
AGO Automotive Gas Oil
B/L Bill of Lading
BBLS Barrels
CA Carry Agreement
CBN Central Bank of Nigeria
DPK Dual Purpose Kerosene
DPR Department of Petroleum Resources
DSDP Direct Sales Direct Purchase
EGTL Escravos Gas to Liquid
FCCU Fluid Catalytic Cracking Unit
FX Foreign Exchange
FAAC Federation Account Allocation Committee
FACTI Focused, Accountable, Competitive & Transparent with Integrity
FGN Federal Government of Nigeria
FIRS Federal Inland Revenue Service
IOCs International Oil Companies
JV(s) Joint Ventures
JVCC Joint Venture Cash Call
LPG Liquefied Petroleum Gas
MCA Modified Carry Agreement
MMBTU Million British Thermal Unit
M-O-M Month-on-Month
MT Metric Tons
NGL Natural Gas Liquid
NLNG Nigerian Liquefied Natural Gas
NNPC Nigerian National Petroleum Corporation
NPDC Nigerian Petroleum Development Company
OECD Organization for Economic Co-operation and Development
OPA Offshore Processing Agreement
PMS Premium Motor Spirit
PPMC Pipelines and Products Marketing Company
PPPRA Petroleum Products Pricing Regulatory Agency
PPT Petroleum Profit Tax
PSC Production Sharing Contract
PTD Period to Date
QIT Qua Iboe Terminal
QTY Quantity
RDP Reserve Development Project
SC Service Contract
SOF Satellite Oil Field Project
TM Trial Marketing
TMP Trial Marketing Period WTI West Texas Intermediate Y-O-Y Year-on-Year YTD Year-to-Date
40 NNPC | Monthly Financial and Operations Report October 2019 www.nnpcgroup.com | www.facebook.com/NNPCgroup | www.twitter.com/NNPCgroup
Explanatory Notes `
Federation Equity Crude Oil & Gas Export Sales
Export sales proceeds are receivable 30 days after B/L date.
About 61% of the NGL sales are dedicated for servicing the NGL II Project debt’s
obligations. The balance is transferred into the Federation Account as price
balance.
NLNG feedstock: Gas supplied by NNPC/JV partners to NLNG.
Domestic Crude Oil Costs
445,000 barrels/day of crude oil is allocated to NNPC for the purpose of supplying
refined products for domestic consumption.
NNPC purchases its allocated crude oil from the Federation at the prevailing
International market price per barrel and payment is due 90 days after the B/L
date.
NNPC obligations are paid in Naira based on CBN determined exchange rate in the
month of lifting.
Remittances To FAAC
Domestic Gas: Revenues received from NNPC Joint Ventures for Gas sales in
Domestic market e.g. - Gas sales to Indorama, IPPs, and NGC etc.
Miscellaneous Income consists of the following:
(a) Assets disposal income
(b) Ullage fees
(c) Osubi air strip
(d) JP Morgan Bank Account interest
(e) Price balance from Third Party financing e.g. RDP, SOF, NGLII
(f) Revenue from Afam-Power
(g) Insurance Claims settlement etc.
FIRS PPT And DPR Royalty Remittances
Receipts from PPT and Royalty crude lifting are paid directly into FIRS/CBN JP
Morgan Accounts and DPR/CBN JP Morgan Accounts respectively without
involvement of NNPC in the collection process.
8