1
US 113 North / South Study US 113 North / South Study 113 CURRENT TRAVEL PATTERNS AND FUTURE TRAVEL FORECASTING CURRENT TRAVEL PATTERNS AND FUTURE TRAVEL FORECASTING CURRENT TRAVEL PATTERNS AND FUTURE TRAVEL FORECASTING Station 12 Origins and Destinations Pennsylvania Maryland Maryland New Jersey Virginia Virginia Wilmington 95 50 50 50 50 50 301 301 13 202 95 295 495 Delaware 13 13 113 113 9 9 13 1 14 16 404 1 24 24 26 20 54 24 54 8 300 404 300 392 90 Newark Dover Milford Lewes Georgetown Chesapeake Bay Delaware Bay Atlantic Ocean I-295 US 13 SR 491/Ridge Rd I-95 SR 3/SR 261/Ebright Rd US 202 I-95 US 1 US 1 US 222 Rehoboth Beach Bethany Beach Fenwick Island Ocean City Toll Ferry (US 9) US 13 Bay Bridge SR 545/SR 272 Yeatmans Mill Rd/SR 896/SR 213 SR 41 SR 52/Old Kennett Rd/SR 82 301 12 40 40 113 Percent of Trips - Station 12 US 113 North/South Study Origin-Destination Survey Figure 25 Percent of Origins 0.1% - 1.0% 1.1% - 2.0% 2.1% - 4.0% 4.1% - 9.0% 9.1% - 16.7% Study Area Entry/Exit Location Highway Legend: Station 12 Direction Surveyed Percent of Destinations 0.1% - 2.0% 2.1% - 5.0% 5.1% - 9.0% 9.1% - 22.0% 22.1% - 26.7% V irginia Milford Lewes Fenwick Island Ocean City Georgetown SR 3/SR 261/Ebright Rd US 202 US 13 V irginia Chesapeake Bay 9 Pennsylvania Maryland New Jersey Wilmington Newark Dover Delaware Bay AtlanticOcean I-295 US 13 SR 491/Ridge Rd I-95 I-95 US 1 US 1 US 222 Rehoboth Beach Bethany Beach Toll Ferry (US 9) Bay Bridge SR 545/SR 272 Yeatmans Mill Rd/SR 896/SR 213 SR 41 SR 52/Old Kennett Rd/SR 82 Maryland Delaware O-D Desire Lines US 113 North/South Study Origin-Destination Survey Station 9 Highway Desire Line 5% Percent of Traffic Between Origin and Destination Note: only O-D pairs with greater than 2% displayed Legend: Station 9 5% Highway Delaware Milford Delaware Bay Rehoboth Beach Bethany Beach Fenwick Island Toll Ferry (US 9) 1 Legend: Stations 2 3 4 5 Direction Surveyed Georgetown 6 7 8 9 10 11 12 13 14 15 16 17 2 4 Lewes 50 Maryland 13 9 13 13 9 113 113 2 4 24 2 6 1 1 4 0 4 4 0 4 20 54 54 54 16 14 1 Survey Locations US 113 North/South Study Origin-Destination Survey Study Area Survey Location Area Study Area Entry/Exit Location Delmar Selbyville Laurel Dagsboro Millsboro Seaford Bridgeville YOUR TRIP TODAY 1. Where did your trip begin? Number Street Name (or nearest cross street/intersection/landmark) City/Town State Zip 1a. Is the location you listed above… Home Work Other (specify) 2. Where will the trip end? Number Street Name (or nearest cross street/intersection/landmark) City/Town State Zip 2a. Is the location you listed above… Home Work Other (specify) 3. Will you make any other stops on this trip? Home Work Other (specify) 4. What was the primary purpose of this trip? Work Recreation/Vacation Social Company Business School (students only) Shopping Other (Specify) 5. Number of people in the vehicle, including the driver? 1 2 3 4 5 or more 6. How often do you make this trip? Daily Weekly Monthly Yearly First-time Other 7. Type of vehicle? Passenger Vehicle/Motorcycle Other (Specify) Truck (2+ axles, more than four tires) 8. Comments about the roadways in Sussex County , Delaware: Please indicate your travel route for today's trip on this map. For example, using a highlighter or pen trace your route or place an x on the roadways that you used. Travel Survey XXXXXXX Atlantic Ocean Delaware Bay Chesapeake Bay Maryland Maryland Delaware New Jersey Pennsylvania Virginia Wilmington Wilmington Newark Newark Dover Dover Milford Milford Georgetown Georgetown Rehoboth Beach Rehoboth Beach Lewes Lewes Bethany Beach Bethany Beach Fenwick Island Fenwick Island Ocean City Ocean City 95 95 40 202 495 301 13 50 50 13 113 13 113 50 Peninsula Travel Demand Model Study Area Roadway Links State Boundaries Transportation Analysis Zone (TAZ) Boundary 0 10 20 5 Miles Origin State Number Percentage Connecticut 1 0.4% Washington DC 1 0.4% Delaware 77 32.0% Florida 1 0.4% Massachusetts 1 0.4% Maryland 38 15.8% North Carolina 1 0.4% New Hampshire 1 0.4% New Jersey 14 5.8% New York 11 4.6% Pennsylvania 87 36.1% Rhode Island 1 0.4% Virginia 5 2.1% West Virginia 1 0.4% Unknown* 1 0.4% Grand Total 241 100% Destination State Number Percentage Delaware 129 53.5% Maryland 94 39.0% New Jersey 1 0.4% New York 1 0.4% Pennsylvania 2 0.8% Virginia 11 4.6% Unknown* 3 1.3% Grand Total 241 100% Home to Work Trip SHOP SHOP TAZ: TrafficAnalysis Zone WORK SHOP HOME Home to Work to Home Trip Pattern (w/ intermediate shopping stops) TAZ 5 TAZ 4 TAZ 3 TAZ 2 TAZ 1 Destination of Journey Origin of Journey Return Trip Work and non-home JTW Journey to Work Neither end at home or work NHBNW Non-Home-Based Non-Work Home and any location not listed above (includes school trips) HBO Home-Based Other Home and Regional Shopping Centers HBRSH Home-Based Regional Shopping Home and store or restaurant HBSH Home-Based Shopping Home and recreational/social destination HBR Home-Based Recreation Home and work HBW Home-Based Work Description Code Trip Type Percentage of Trips Trip Purpose Previous Survey Latest Survey Work 8.2% 6.5% Shopping 7.1% 15.4% Recreation/Social 81.6% 68.3% Other 3.0% 9.8% Total 100% 100% 10 10 Last summer, on three Saturdays in July and August, DelDOT conducted the US 113 Origin-Destination Survey at 17 intersections in Sussex and Southern Kent Counties. A mail-back survey form was used to collect information on current travel patterns. The survey included a map so that travelers could indicate exactly where their trip began and ended. Travel Forecasting Origins and Destination by State Key Survey Findings Transportation Network and Analysis Zones Socioeconomic Information Trip Purpose Origins and Destinations Survey Locations Desire Lines Travel Patterns Origin-Destination Study Overall, 21,070 surveys were distributed and 2,161 responses were received - a 10% response rate. Station 12 had the highest number of surveys given out (over 2,600) and Station 14 had highest return rate (15%). The survey information was entered into a computer database that allowed DelDOT's planners to match drivers' origins and destinations and to analyze common travel patterns. The following two panels contain examples of the types of information obtained from the survey responses. The percentage of shopping trips have doubled between 1987 and 2003, reflecting the growth in shopping destinations in the US 113 Corridor and the effect the Rehoboth Outlets has had on regional travel patterns. A map like this was developed for each of the survey stations. It shows how the trip origins and destinations were spread around the state and outside the state, with the darker shading being the higher percentage origins and destinations. This map shows the percentages of origins and destinations that formed a connected trip for each survey station. Notice, for example, that 35% of the travelers surveyed at Station 9, on SR 20 near Millsboro, started their trip in Bethany Beach and ended it beyond the Bay Bridge. This was, by far, the highest recorded trip. Once all the information is properly entered, the model is then 'run' for present conditions and adjusted until it reasonably predicts current traffic patterns, including those from the Origin-Destination survey. An old modeling adage is that "you need to be able to accurately predict the present before you can reasonably predict the future." When the planners are convinced the model is ready, it will be run for a variety of conditions, predicting the amount of traffic that will use the transportation network as far as twenty years into the future. Trying to predict the future is a risky proposition for anyone, but DelDOT's planners have to do just that to assess when and what type of improvements will be required to address the US 113 corridor's future transportation needs. Fortunately, with the aid of computer modeling, the job becomes a little easier and more scientific. Right now, DelDOT's planners are working on a new model that will allow them to predict the travel patterns that occur throughout the year and during the peak summer travel season. It's called the Peninsula Model because it covers the entire state of Delaware and Maryland's eastern shore, two thirds of the Delmarva Peninsula. The model has several key components: At Station 12, 59% of the 241 survey respondents had either an origin or destination in Delaware; the remaining 41% was through traffic (neither trip end in Delaware). 27% of those responding at Station 12 had both trip ends in Delaware. At Station 8, on northbound US 113 near Selbyville, 38% of the 140 survey respondents had either an origin or destination in Delaware, the remaining 62% was through traffic (neither trip end in Delaware). Coming from the west, about an equal number of drivers destined for Rehoboth (approx. 2,000 per day) use Route 16 and Route 404/18. At Station 4, on eastbound Route 404 west of Bridgeville, about twice as many drivers use Route 404 to reach Bethany as they do to reach Rehoboth. At Station 15, on Route 1 south of Milford, about 30% of traffic is destined for Bethany Beach or points farther south. Source: Station 12 on Southbound US 113 Near Georgetown June 7, 2004

No 10 REV - Travel Patterns-F - Delaware Department of Transportation

  • Upload
    others

  • View
    0

  • Download
    0

Embed Size (px)

Citation preview

US 113 North / South StudyUS 113 North / South Study113

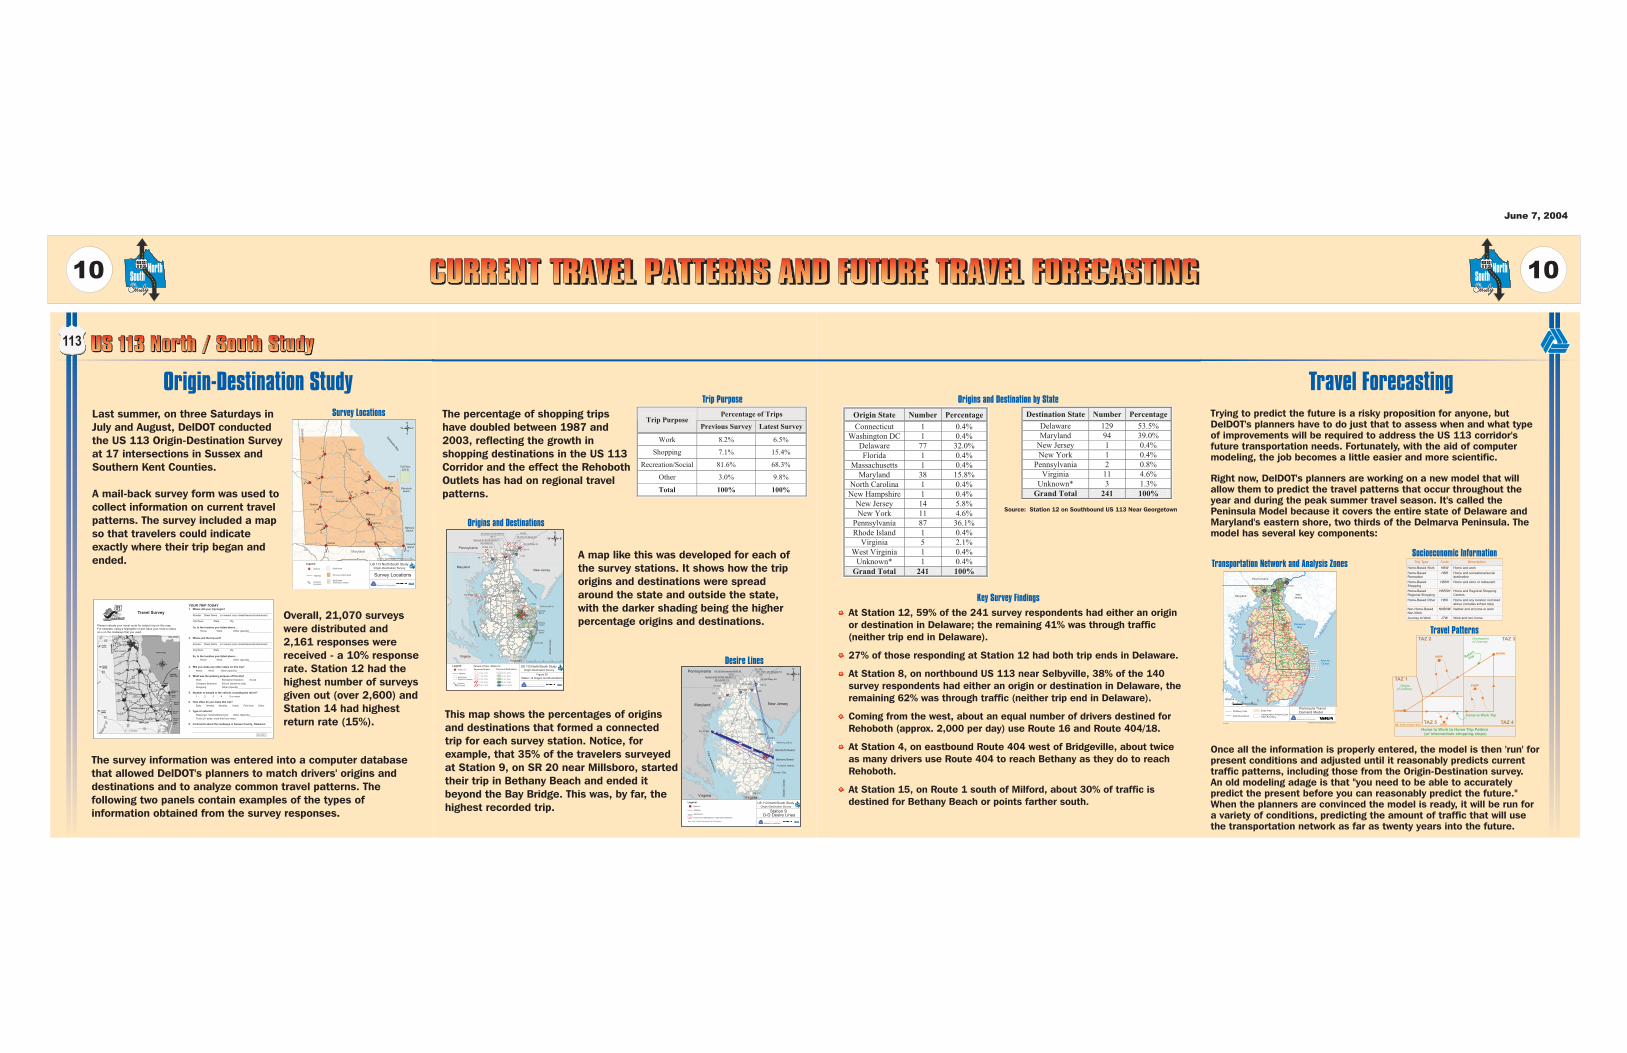
CURRENT TRAVEL PATTERNS AND FUTURE TRAVEL FORECASTINGCURRENT TRAVEL PATTERNS AND FUTURE TRAVEL FORECASTINGCURRENT TRAVEL PATTERNS AND FUTURE TRAVEL FORECASTING

Station 12 Origins and Destinations

0 10 20 30 405

Miles

Pennsylvania

Maryland

Maryland

New Jersey

Virginia

Virginia

Wilmington

95

50

50

50

50

50 301

301

13

202

95

295

495

Delaware

13

13 113

113

9

9

13

1

14

16

404

124

2426

20

54

24

54

8

300

404

300

392

90

Newark

Dover

Milford

Lewes

Georgetown

Chesa

peake

Bay

Delaw

areBay

Atlantic

Ocean

I-295

US 13

SR 491/Ridge Rd

I-95

SR 3/SR 261/Ebright Rd

US 202

I-95

US 1

US 1US 222

RehobothBeach

BethanyBeach

FenwickIsland

Ocean City

Toll Ferry (US 9)

US 13

Bay Bridge

SR 545/SR 272

Yeatmans Mill Rd/SR 896/SR 213

SR 41

SR 52/Old Kennett Rd/SR 82

301

12

40

40

113

Percent of Trips - Station 12 US 113 North/South StudyOrigin-Destination Survey

Figure 25

Percent of Origins

0.1% - 1.0%

1.1% - 2.0%

2.1% - 4.0%

4.1% - 9.0%

9.1% - 16.7%

Study AreaEntry/Exit Location

Highway

Legend:

Station 12

DirectionSurveyed

Percent of Destinations

0.1% - 2.0%

2.1% - 5.0%

5.1% - 9.0%

9.1% - 22.0%

22.1% - 26.7%

V irginia

Milford

Lewes

Fenwick Island

Ocean City

Georgetown

13

20 2

30 1

13

30 0

8

1

14

16

40 4

2424

54 54

20

26

24

1

11 3

11 3

9

9

50

50

50

50

11 3

13

13

S R 3/S R 261/Ebright Rd

US 202

US 13

V irginia

Ch

esa

pe

ake

Ba

y

99

95

95

295

495

Pennsylvania

Maryland New Jersey

Wilmington

50

50

50

50

50301

301

13

202

13

13

113

113

9

9

13

1

14

16

404

1

24

2426

20

54

24

54

8

300

404

300

90

Newark

Dover Delaw

areBay

Atla

ntic

Oce

an

I-295

US 13

SR 491/Ridge Rd

I-95

I-95

US 1

US 1

US 222

Rehoboth Beach

Bethany Beach

Toll Ferry (US 9)

Bay Bridge

SR 545/SR 272

Yeatmans Mill Rd/SR 896/SR 213

SR 41

SR 52/Old Kennett Rd/SR 82

301

4040

113

MarylandDelaware

O-D Desire Lines

392

US 113 North/South StudyOrigin-Destination Survey

Station 9Highway

Desire Line

5% Percent of Traffic Between Origin and Destination

Note: only O-D pairs with greater than 2% displayed

Legend:

Station 9

2%8%3%

5%

2%

3%

35%

Highway

Dela

ware

Milford

Delaw

areBay

RehobothBeach

BethanyBeach

FenwickIsland

Toll Ferry(US 9)

1

Legend:

Stations

2

3

4

5

DirectionSurveyed

Georgetown

6

7

8

9

10

1112 13

14

15

16

17

24

Lewes

50

Maryland

13

9

13

13

9

113

113

24

24

26

1

1

404

404

20

54

54

54

16

14

1

Survey Locations

US 113 North/South StudyOrigin-Destination Survey

0 3 6 9 121.5

Miles

Study Area

Survey Location Area

Study AreaEntry/Exit Location

DelmarSelbyville

Laurel Dagsboro

Millsboro

Seaford

Bridgeville

YOUR TRIP TODAY

1. Where did your trip begin?

Number Street Name (or nearest cross street/intersection/landmark)

City/Town State Zip

1a. Is the location you listed above…

Home Work Other (specify)

2. Where will the trip end?

Number Street Name (or nearest cross street/intersection/landmark)

City/Town State Zip

2a. Is the location you listed above…

Home Work Other (specify)

3. Will you make any other stops on this trip?

Home Work Other (specify)

4. What was the primary purpose of this trip?

Work Recreation/Vacation Social

Company Business School (students only)

Shopping Other (Specify)

5. Number of people in the vehicle, including the driver?

1 2 3 4 5 or more

6. How often do you make this trip?

Daily Weekly Monthly Yearly First-time Other

7. Type of vehicle?

Passenger Vehicle/Motorcycle Other (Specify)

Truck (2+ axles, more than four tires)

8. Comments about the roadways in Sussex County, Delaware:

Please indicate your travel route for today's trip on this map.

For example, using a highlighter or pen trace your route or place

an x on the roadways that you used.

Travel Survey

XXXXXXX

AtlanticOcean

DelawareBay

ChesapeakeBay

Maryland

Maryland

Delaware

NewJersey

Pennsylvania

Virginia

WilmingtonWilmington

NewarkNewark

DoverDover

MilfordMilford

GeorgetownGeorgetown

RehobothBeach

RehobothBeach

LewesLewes

BethanyBeach

BethanyBeach

FenwickIsland

FenwickIsland

OceanCity

OceanCity

95 95

40

202

495

301

13

50

50

13

113

13 113

50

Peninsula TravelDemand Model

Study AreaRoadway Links

State Boundaries

05-18-04H:\30000\31514-01\GIS\Mapfiles\Travel_Demand_Model.mxd

Transportation Analysis Zone(TAZ) Boundary

0 10 205Miles

Origin State Number Percentage

Connecticut 1 0.4%

Washington DC 1 0.4%

Delaware 77 32.0%

Florida 1 0.4%

Massachusetts 1 0.4%

Maryland 38 15.8%

North Carolina 1 0.4%

New Hampshire 1 0.4%

New Jersey 14 5.8%

New York 11 4.6%

Pennsylvania 87 36.1%

Rhode Island 1 0.4%

Virginia 5 2.1%

West Virginia 1 0.4%

Unknown* 1 0.4%

Grand Total 241 100%

Destination State Number Percentage

Delaware 129 53.5%

Maryland 94 39.0%

New Jersey 1 0.4%

New York 1 0.4%

Pennsylvania 2 0.8%

Virginia 11 4.6%

Unknown* 3 1.3%

Grand Total 241 100%

Home to Work Trip

SHOP

SHOPTAZ: Traffic Analysis Zone

WORKSHOP

HOME

Home to Work to Home Trip Pattern(w/ intermediate shopping stops)

TAZ 5 TAZ 4

TAZ 3TAZ 2

TAZ 1

Destinationof Journey

Originof Journey

Return

Trip

Work and non-homeJTWJourney to Work

Neither end at home or workNHBNWNon-Home-Based

Non-Work

Home and any location not listed

above (includes school trips)

HBOHome-Based Other

Home and Regional Shopping

Centers

HBRSHHome-Based

Regional Shopping

Home and store or restaurantHBSHHome-Based

Shopping

Home and recreational/socialdestination

HBRHome-BasedRecreation

Home and workHBWHome-Based Work

DescriptionCodeTrip Type

Percentage of TripsTrip Purpose

Previous Survey Latest Survey

Work 8.2% 6.5%

Shopping 7.1% 15.4%

Recreation/Social 81.6% 68.3%

Other 3.0% 9.8%

Total 100% 100%

1010

Last summer, on three Saturdays in

July and August, DelDOT conducted

the US 113 Origin-Destination Survey

at 17 intersections in Sussex and

Southern Kent Counties.

A mail-back survey form was used to

collect information on current travel

patterns. The survey included a map

so that travelers could indicate

exactly where their trip began and

ended.

Travel ForecastingOrigins and Destination by State

Key Survey Findings

Transportation Network and Analysis ZonesSocioeconomic Information

Trip Purpose

Origins and Destinations

Survey Locations

Desire Lines

Travel Patterns

Origin-Destination Study

Overall, 21,070 surveys

were distributed and

2,161 responses were

received - a 10% response

rate. Station 12 had the

highest number of surveys

given out (over 2,600) and

Station 14 had highest

return rate (15%).

The survey information was entered into a computer database

that allowed DelDOT's planners to match drivers' origins and

destinations and to analyze common travel patterns. The

following two panels contain examples of the types of

information obtained from the survey responses.

The percentage of shopping trips

have doubled between 1987 and

2003, reflecting the growth in

shopping destinations in the US 113

Corridor and the effect the Rehoboth

Outlets has had on regional travel

patterns.

A map like this was developed for each of

the survey stations. It shows how the trip

origins and destinations were spread

around the state and outside the state,

with the darker shading being the higher

percentage origins and destinations.

This map shows the percentages of origins

and destinations that formed a connected

trip for each survey station. Notice, for

example, that 35% of the travelers surveyed

at Station 9, on SR 20 near Millsboro, started

their trip in Bethany Beach and ended it

beyond the Bay Bridge. This was, by far, the

highest recorded trip.

Once all the information is properly entered, the model is then 'run' forpresent conditions and adjusted until it reasonably predicts currenttraffic patterns, including those from the Origin-Destination survey.An old modeling adage is that "you need to be able to accuratelypredict the present before you can reasonably predict the future."When the planners are convinced the model is ready, it will be run fora variety of conditions, predicting the amount of traffic that will usethe transportation network as far as twenty years into the future.

Trying to predict the future is a risky proposition for anyone, butDelDOT's planners have to do just that to assess when and what typeof improvements will be required to address the US 113 corridor'sfuture transportation needs. Fortunately, with the aid of computermodeling, the job becomes a little easier and more scientific.

Right now, DelDOT's planners are working on a new model that willallow them to predict the travel patterns that occur throughout theyear and during the peak summer travel season. It's called thePeninsula Model because it covers the entire state of Delaware andMaryland's eastern shore, two thirds of the Delmarva Peninsula. Themodel has several key components:

At Station 12, 59% of the 241 survey respondents had either an origin

or destination in Delaware; the remaining 41% was through traffic

(neither trip end in Delaware).

27% of those responding at Station 12 had both trip ends in Delaware.

At Station 8, on northbound US 113 near Selbyville, 38% of the 140

survey respondents had either an origin or destination in Delaware, the

remaining 62% was through traffic (neither trip end in Delaware).

Coming from the west, about an equal number of drivers destined for

Rehoboth (approx. 2,000 per day) use Route 16 and Route 404/18.

At Station 4, on eastbound Route 404 west of Bridgeville, about twice

as many drivers use Route 404 to reach Bethany as they do to reach

Rehoboth.

At Station 15, on Route 1 south of Milford, about 30% of traffic is

destined for Bethany Beach or points farther south.

Source: Station 12 on Southbound US 113 Near Georgetown

June 7, 2004