Embed Size (px)
Citation preview
Working Paper Series on the Transition Countries No. 2
EDUCATION IN EASTERN EUROPE AND EURASIA
Robyn Melzig Matt Petric
and Ron Sprout
October 2005
Program Office Bureau for Europe & Eurasia
U.S. Agency for International Development
1
Education in Eastern Europe and Eurasia
Robyn Melzig U.S. Agency for International Development, Washington DC
Email: [email protected]
Matt Petric U.S. Agency for International Development, Washington DC
Email: [email protected]
Ron Sprout U.S. Agency for International Development, Washington DC
Email: [email protected]
Abstract: Conventional wisdom has been that educational aspects of human capital in the former Communist countries were largely an asset going into the transition. However, it has also been widely perceived that the type of education in the Communist countries (with emphases on memorization at the expense of analytical and critical thinking, and perhaps premature specialization if not over-specialization) may be ill-suited for the needs of a market economy. This study analyzes trends in four cross-country surveys of education performance: the Trends in International Mathematics and Sciences Study (TIMSS); the International Adult Literacy Survey (IALS); the Progress in International Reading Literacy Study (PIRLS); and the Program for International Student Assessment (PISA). Salient “quantity” of education indicators (enrollment and expenditure trends) are also assessed and compared with the “quality” of education indicators from results of the cross-national performance surveys.
Finally, drawing from both sets of indicators, transition countries were rated and ranked according to overall (measurable) educational deficiencies or education gaps. From a limited sample of sixteen transition countries (for which data existed for a majority of the twelve indicators used to rate the deficiencies), four countries stand out as the most vulnerable: Albania; Armenia; Macedonia; and Romania.
2
USAID/E&E/PO Working Paper Series on the Transition Countries September 2006 No.1 Demography and Health (June 2005) No.2 Education (October 2005) No.3 Economic Reforms, Democracy, and Growth (November 2005) No.4 Monitoring Country Progress in 2006 (September 2006) No.5 Domestic Disparities (forthcoming) No.6 Labor Markets (forthcoming) No.7 Global Economic Integration (forthcoming) The findings, interpretations, and conclusions expressed in these working papers are entirely those of the authors. They do not necessarily represent the view of USAID. The papers are available online at http://www.usaid.gov/locations/europe_eurasia.
3
Summary attempts to synthesize and interpret the findings from a handful of cross-country
s
tion)
e analyzed trends in four cross-country surveys of education performance: the Trends in rvey
IMSS. Overall, the students sampled in fourteen transition countries included in this survey
dge in
IMSS trends over time (from 1995 to 2003) are limited to nine transition countries. Good
st
LS. Only four Northern Tier CEE countries are included in the IALS assessments of r CEE
ion
ned in
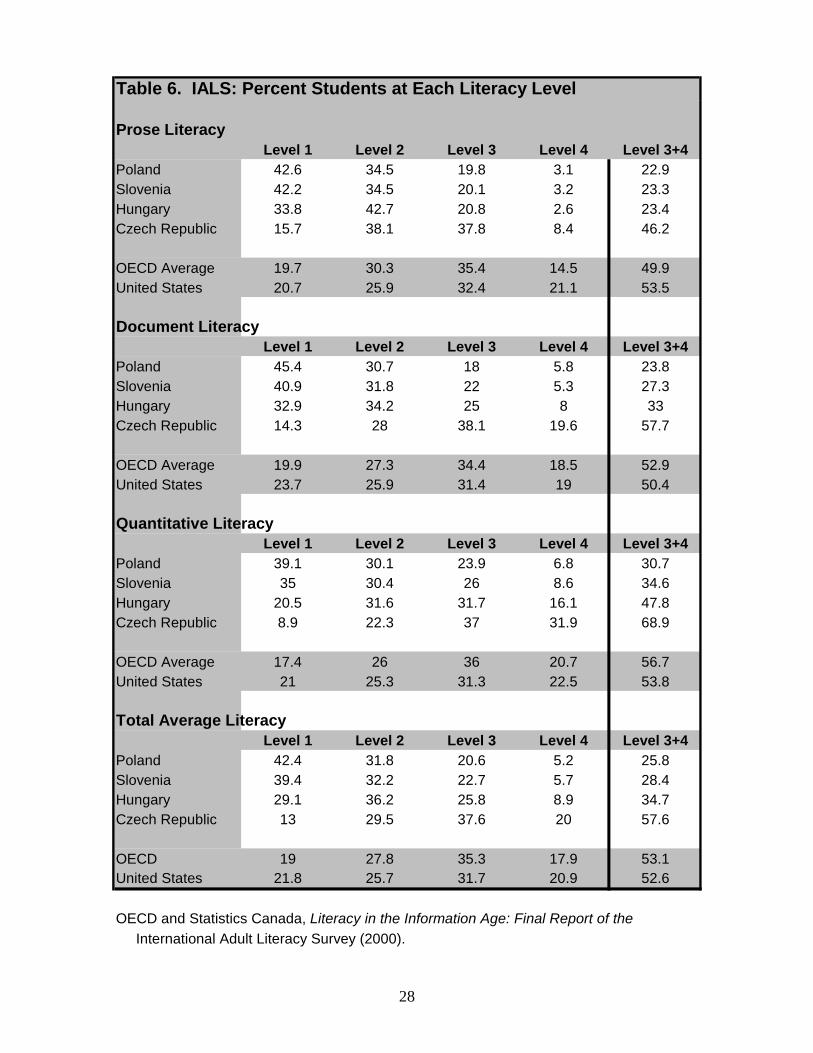
This paper assessments of the quality of education in the transition region. The conventional wisdom habeen that educational aspects of human capital in the former Communist countries were largelyan asset going into the transition. However, it has also been widely perceived that the type of education in the Communist countries (with emphases on memorization at the expense of analytical and critical thinking, and perhaps premature specialization if not over-specializamay be ill-suited for the needs of a market economy. WInternational Mathematics and Sciences Study (TIMSS); the International Adult Literacy Su(IALS); the Progress in International Reading Literacy Study (PIRLS); and the Program for International Student Assessment (PISA). Participation in the surveys among students in thetransition countries remains limited. Hence, part of this analysis is also to revisit the salient enrollment and expenditure trends in the region and to compare them with the results of the cross-national performance surveys. To what extent can some of the quantity of education indicators be used as proxies for the quality of education? Tperformed very well in 2003 by international standards. Eighth grade students in the Northern Tier CEE countries as well as in Russia performed roughly at OECD standards in math and science, and above the intermediate benchmark defined as the minimum acceptable level (“where students can recognize, apply and communicate basic math and scientific knowlestraightforward situations.”). All the other transition countries included in the surveys except Macedonia performed at or near the intermediate benchmark. This includes Bulgaria, Serbia &Montenegro, and Romania in the Southern Tier CEE, and Armenia and Moldova in Eurasia. Macedonia is the only transition country of the fourteen that lags notably behind the minimumthreshold; its students performed closest to students in Iran, and not much better than students inIndonesia and Lebanon. Tprogress has been made in performance scores in Lithuania and Latvia from 1995 to 2003. However, notable backsliding has occurred in four countries. Bulgaria has showed the biggeslide (it was the best performer of the fourteen countries in 1995). Macedonia, Russia, and Slovakia also witnessed backtracking during this time period as well. IA“functional literacy” which took place from 1994-1998. In three of the four Northern Tiecountries (Poland, Slovenia and Hungary), only 26-36% of the adult population sampled scored at least the minimum level of “3”, and hence by IALS definition were able to at least minimally cope with the demands of advanced society. Adults in the Czech Republic, in contrast, had scored slightly above the OECD average. Of the three subject areas, adults in all four transitcountries scored much lower on prose (or the knowledge and skills needed to understand and useinformation from texts, including editorials, news stories, poems, and fiction), higher on document literacy (the knowledge and skills required to locate and use information contaivarious formats, including job applications, payroll forms, transport schedules, maps, tables, and
4
graphics), and highest on quantitative literacy (the knowledge and skills required to apply arithmetic operations, either alone or sequentially, to numbers in printed materials). Adultsthe OECD countries scored much more balanced results across the three subject areas, at least oaverage.
in n
IRLS. Most of the fourth grade students of the eleven transition countries included in PIRLS
n
ISA. There are roughly three levels of outcomes in the transition sample of eleven countries in
ell
general, students aged fifteen years across the transition performed best in science, worst in
arger communities have generally outperformed smaller communities in most of the transition
lose to 20% of the students polled in the OECD countries claimed to be hindered either our
re
oor
he data show that a lack of instruction materials pose a considerably larger constraint than poor
Pscored on par with OECD standards in 2001 according to PIRLS measures of reading literacy (which included “literary” and “informative”). In fact, only students in Macedonia lagged considerably behind the OECD threshold, and performed not much better than students in Colombia and Iran. In contrast to the mixed gender results in the TIMSS, girls consistentlyoutperformed boys across all the eleven transition countries. This gender gap also held true ithe OECD. Pthe PISA tests in 2003: (1) the five Northern Tier CEE countries are all OECD standard; (2) Russia followed by Bulgaria, Romania and Serbia & Montenegro perform at a middle level, wbelow OECD standards, comparable to Thailand; and (3) Macedonia and Albania much lower score still, comparable to Tunisia, Indonesia, Brazil. Unfortunately, Russia to date is the only Eurasian country to take part in the PISA. Inreading, and somewhere in between on math in PISA. In contrast, in the OECD countries, the scores across the three areas were comparable, at least on average. Girls outperformed boys in general in the transition countries. This was also the trend in OECD. Lcountries sampled. These urban-rural disparities also appear in the OECD countries though they are not as great. Urban-rural disparities in PISA performances are particularly large in Bulgaria, followed by Hungary, Albania, and Romania. C“somewhat” or “a lot” as a result of poor heating or cooling or lighting. Students in the fNorthern Tier CEE countries included in the survey fared better; i.e., fewer assert that they arehindered by these constraints, ranging from only 2-3% in Hungary and the Czech Republic to 10% in Poland to almost 15% in Latvia. The Southern Tier leaders of Romania and Bulgaria aabout OECD average on this score. In contrast, a much higher percentage of students in Macedonia and particularly in Russia and Albania contend that they are hindered by theseconstraints, roughly one-half of students in Russia and Macedonia. Students hindered by pheating, cooling, and/or lighting systems, with two exceptions (in Poland and Romania), performed worse in the PISA tests than “non-hindered” students. Theating, cooling, and lighting for students surveyed in the transition countries. Results range from 12% of students hindered in Hungary to 65% in Russia as a result of a lack of instructionmaterials. A very high percentage of students surveyed in Macedonia, Romania, Latvia, and
5
Albania also contended that a lack of instruction material was an obstacle. In addition, performance has suffered more from this constraint than poor heating, etc. Enrollment trends revisited. Secondary school enrollments have generally suffered more during the transition than enrollments at other levels of schooling. Most of the drop in secondary enrollments, however, has occurred in Eurasia where enrollments overall have fallen substantially, from almost 70% in 1989 to 50% in 2002. Secondary school enrollments are higher today in CEE than when the transition began. In addition, when one disaggregates secondary school enrollments between general secondary and vocational/technical secondary, one finds that most of the drop in secondary school enrollments has been due to a significant drop in vocational or technical school enrollments, again mostly in Eurasia. A reduction in the proportion of vocational enrollments relative to general enrollments from 1989 to 2002 occurred in twenty-two of the twenty-five countries for which data are available. In general, a drop in this ratio occurred in the CEE countries because vocational and technical enrollments remained relatively stable as general secondary enrollment rates increased. In contrast, the proportion of vocational and technical to general secondary dropped in Eurasia due primarily to a more than proportionate decrease in vocational and technical enrollments than a more moderate decline in general secondary enrollments. In 1989, the large majority of transition countries had higher enrollments in vocational and technical schools than in general secondary schools: seventeen countries vs. eight. Most of the countries with a higher proportion of vocational schools are in CEE (and conversely, most of the Eurasian countries, seven countries, had general enrollment rates higher than vocational rates in 1989). The Southern Tier CEE countries had the highest proportion of vocational enrollment to general; six to seven times more vocational secondary enrollments in Macedonia, Croatia, and Romania than general secondary enrollments in 1989. By 2002, there was much more balance between the number of countries where vocational enrollment exceeded general secondary (fourteen countries) and the number of countries where general secondary enrollments exceeded vocational (thirteen). There was a larger proportionate drop in vocational enrollments in CEE than in Eurasia from 1989 to 2002, reflecting in part that there was a larger proportion of vocational enrollments in CEE in 1989. Quality vs. Quantity. We regressed the results from the PISA surveys on six quantity of education indicators to see how closely they correlate. Are any of the quantity of education indicators notably better than others as proxies for quality? Most of the correlations are weak, the “fit” between quantity and quality indicators are poor ones. The best fit between quantity and quality of education indicators is with higher education enrollment rates. Here, there exists a clear and consistent relationship between tertiary enrollments and PISA test results: the greater is the tertiary enrollment, the better are the test results. The r-square is 0.64, and there are no obvious outliers. This is not to suggest causality from one to the other. Rather, countries that have education systems which invest more in higher education are also those that are more likely to produce a higher quality, more relevant education overall (i.e. not confined to higher education).
6
Education gaps. We analyzed which countries appeared to be particularly vulnerable on each education indicator, quantity plus quality, and ranked the countries accordingly. There are many data gaps, particularly for the quality of education indicators. Hence, the overall education deficiencies per country were assessed by calculating the vulnerabilities as a percent of the indicators in which data are available. There were a total of twelve indicators. However, for only two countries, the Czech Republic and Hungary, were there data available for each of these twelve indicators. Seven other countries had data available for ten or eleven indicators. At the other extreme, three countries, Bosnia-Herzegovina, Uzbekistan, and Kazakhstan, had data for only four of the twelve indicators. Given the wide range of available data per country, we produced two lists of vulnerable countries: those with the highest proportion of vulnerable indicators (regardless of the number of indicators per country being tracked); and the most vulnerable countries from a smaller country sample consisting of those countries which have data for a majority (seven or more) of the twelve indicators. From the full sample of twenty-seven countries, ten were found to have at least 50% of education indicators deemed vulnerable. Four are CEE countries: Bosnia-Herzegovina; Albania, Macedonia, and Romania. Six are Eurasian countries: Turkmenistan, Tajikistan, Armenia, Azerbaijan; Uzbekistan, and Georgia. From the limited sample of sixteen countries (which have data for a majority of the twelve indicators), four countries stand out as the most vulnerable: Albania; Armenia; Macedonia; and Romania. Finally, it is important to underscore that there remain numerous data gaps; many “missing pieces to the puzzle.” Most Eurasian countries are not currently included in any of the cross-national performance tests, though a number more are scheduled to be included in the next couple years. Even still, the test results among the four cross-national assessments are not readily interchangeable. Moreover, we have even less data of trends over time. Only TIMSS and PISA tests have surveyed students from a handful of countries more than once, and the results provide only clues of possible trends over time, creating as many questions as answers.
7
Introduction and Methodology1
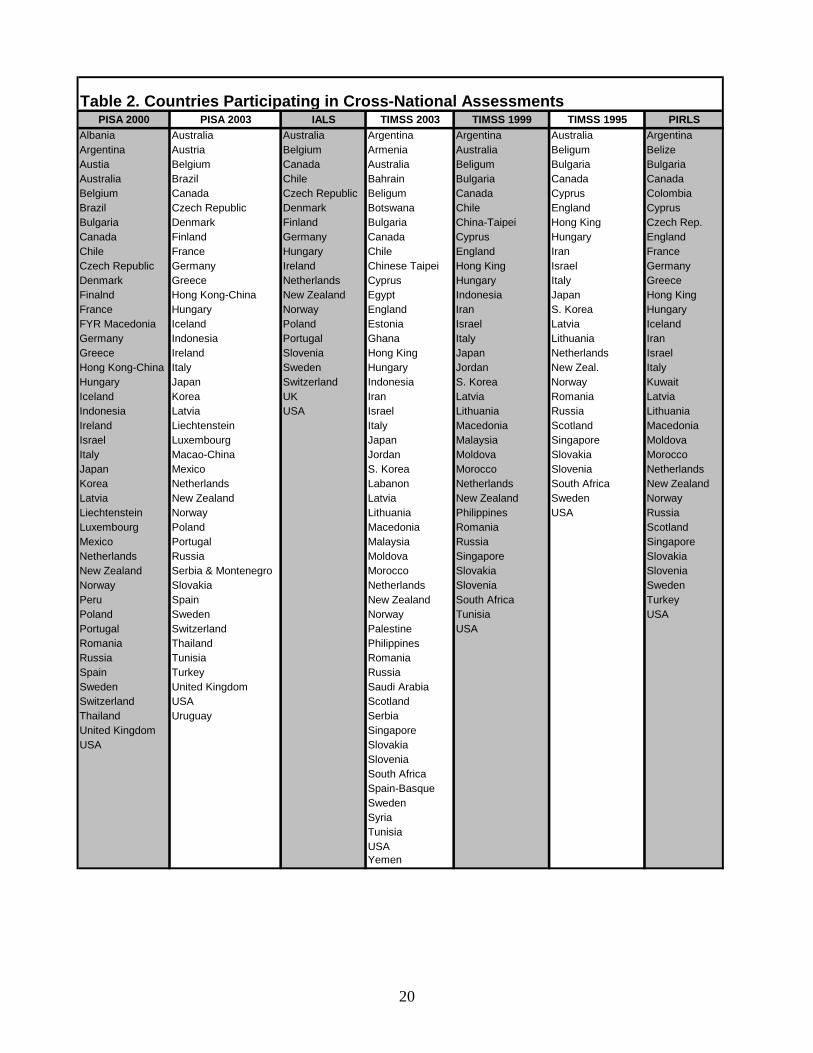
The primary objective of this paper is to analyze the quality of education in the transition region. Much empirical analysis has focused on the “quantity” of education, such as enrollment and education expenditure trends, in no small part because most of the available empirical evidence pertains to the quantity rather than the quality of education. This paper attempts to synthesize the findings from a handful of cross-country assessments which in turn attempt to measure progress across students and/or adults worldwide towards achieving certain academic standards and perhaps more importantly, progress towards preparing students for employment in the global market economy. The conventional wisdom has been that educational aspects of human capital in the former Communist countries were largely an asset going into the transition. The priority under the communist system for universal education was high and hence so were enrollments; performances in various global forums in the sciences and math among students from behind the Iron Curtain were impressive. However, it has also been widely perceived that the type of education in the Communist countries (with emphases on memorization at the expense of analytical and critical thinking, and perhaps premature specialization if not over-specialization) may be ill-suited for the needs of a market economy. Below, we analyze trends in four cross-country surveys on education performance: the Trends in International Mathematics and Sciences Study (TIMSS); the International Adult Literacy Survey (IALS); the Progress in International Reading Literacy Study (PIRLS); and the Program for International Student Assessment (PISA). Participation in the surveys among transition countries remains limited, though it is increasing. Most of the transition countries included are in Central and Eastern Europe (CEE) and few are in Eurasia (where one might expect the quality of education may be the most troublesome). Hence, part of this analysis is also to revisit the salient enrollment and expenditure trends in the region and to compare them with the results of the cross-national surveys. To what extent can some of the quantity of education indicators be used as proxies for the quality of education? Or similarly, how meaningful are the quantity of education indicators? To what extent can we extrapolate the limited evidence from the quality of education surveys to countries not yet included in these surveys? Table 1 shows the transition countries that have participated in the four surveys to date, as well as countries scheduled to participate in the near future (in 2006 and 2007). Sixteen transition countries have so far been included in at least one of the surveys. By 2007, twenty-five transition countries will have participated in at least one survey; i.e., all but Turkmenistan and Tajikistan. This is not to suggest, as should be evident in the analyses to follow, that the various surveys are necessarily readily inter-changeable. Table 2 shows the complete sample of countries worldwide included in the surveys to date. Sample sizes range from twenty countries in the IALS (all OECD countries), to fifty-five countries in the TIMSS. In general, the developing countries are under-represented in these surveys even more so than the transition countries. 1 Many thanks to Luba Fajfer of E&E/DGST for her very helpful feedback and insights on earlier drafts of this research.
8

9
Table 3 provides the basic parameters of each of the four surveys. TIMSS is designed to test academic achievement in the areas of mathematics (numbers, fractions, algebra, and geometry) and the sciences (including chemistry, the life sciences, and physics) amongst students in approximately grade eight. TIMSS more directly assesses student achievement than it does “real world” applicability. That is, it primarily tests a student’s ability to retain and recall information learned during instruction. The International Association for the Evaluation of Educational Achievement (IEA) conducts the assessment every four years. The IEA is an independent international cooperative of national research institutions and government agencies that has been conducting studies of cross-national achievement since 1959. To date, there exist TIMSS results from 1995, 1999, and 2003. The next round will be completed in 2007. The 2003 round surveyed the achievements of 49 countries—36 of which had also participated in either the 1995 and 1999 rounds. TIMSS has assessed the student performance of fourteen countries in the E&E transition region. Of these, seven belong to the Northern Tier CEE, four to the Southern Tier CEE, and three to Eurasia. PIRLS, also administered by the IEA, focused on two aspects of reading literacy (literary and informative) in students in the fourth grade in 2001. The target group is the youngest of all four cross-country assessments. PIRLS assessments took place in thirty five countries worldwide, including eleven transition countries. The next round will take place in 2006. The IALS study was conducted by the OECD and focused on adults’ ability to utilize information to function in the context of advanced, complex societies. IALS defines literacy as the ability to understand and employ printed information in daily activities, at home, at work, and in the community, to achieve one’s goals and to develop one’s potential. It attempts to measure functional literacy in three areas: prose, document, and quantitative. Prose literacy is defined as the knowledge and skills needed to understand and use information from texts, including editorials, news stories, poems, and fiction. Document literacy is defined as the knowledge and skills required to locate and use information contained in various formats, including job applications, payroll forms, transport schedules, maps, tables, and graphics. Quantitative literacy is defined as the knowledge and skills required to apply arithmetic operations, either alone or sequentially, to numbers in printed materials. For each area, IALS scores are grouped into four levels—level four representing the highest level of literacy and level one representing the lowest.2 IALS defines literacy level three as the minimum level required to function in advanced, complex societies. As such, our attention will be focused on the percentage of respondents scoring at or above this level. The one and only IALS assessment was 2 Level 1 – Indicates a person with very poor skills, where the person may, for example, be unable to determine the correct amount of medicine from printed information. Level 2 – Respondents can deal only with material that is simple, clearly laid out, and in which the tasks involved are not too complex. It denotes a weak level of skill, but more hidden than level 1. It identifies people who can read, but test poorly. They may have developed coping skills to manage everyday literacy demands, but their low level of proficiency makes it difficult for them to face novel demands, such as learning new job skills. Level 3 – Is considered a suitable minimum for coping with the demands of everyday life and work in complex, advanced society. It denotes roughly the skill level required for successful secondary school completion and college entry. Like higher levels, it requires the ability to integrate several sources of information and solve complex problems. Level 4 – describes respondents who demonstrate command of higher-order information processing skills.
10
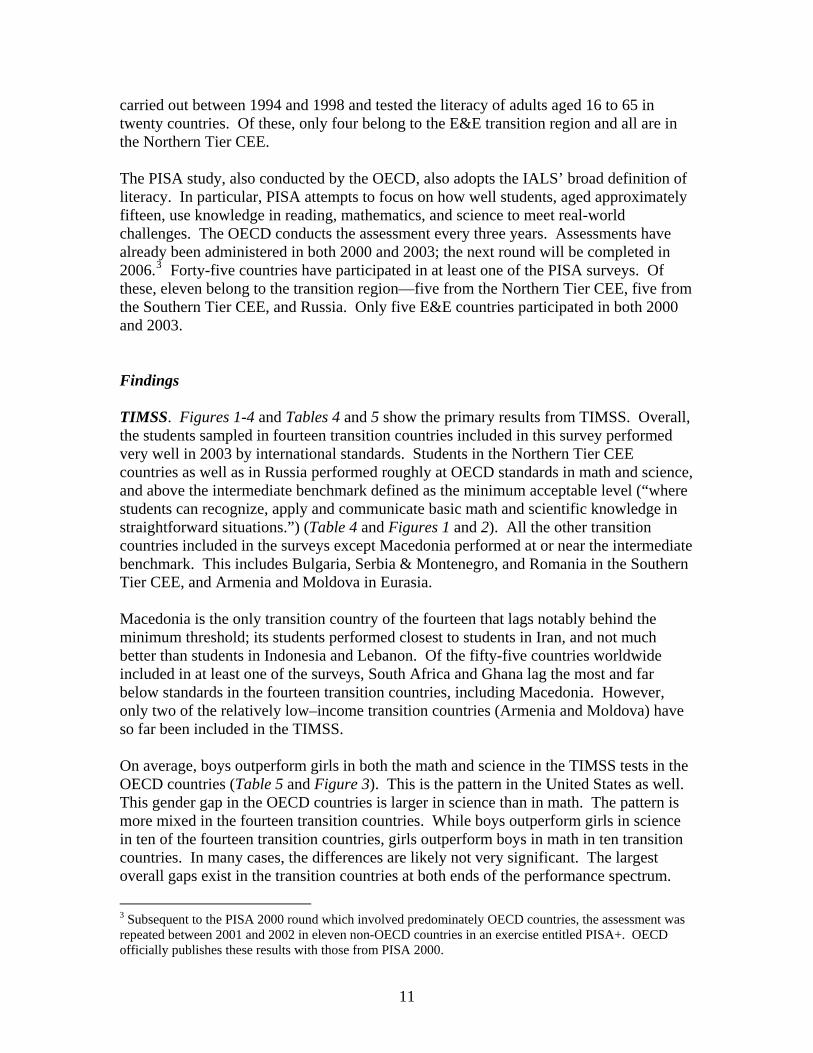
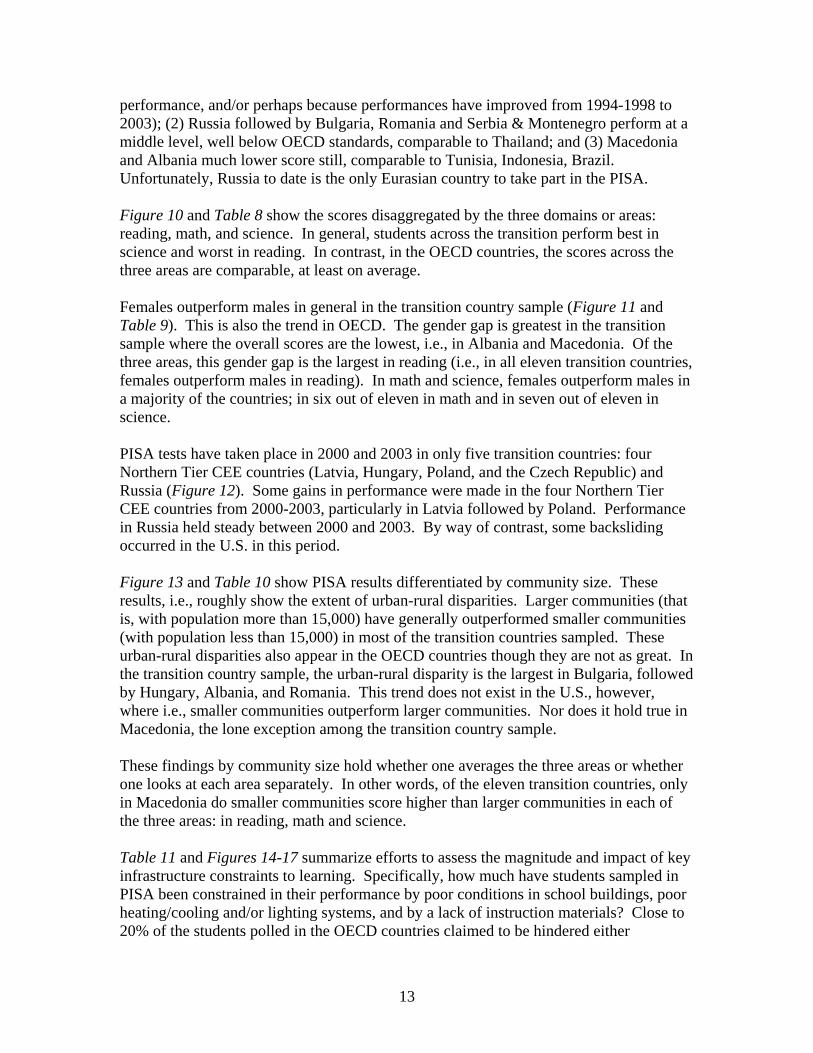
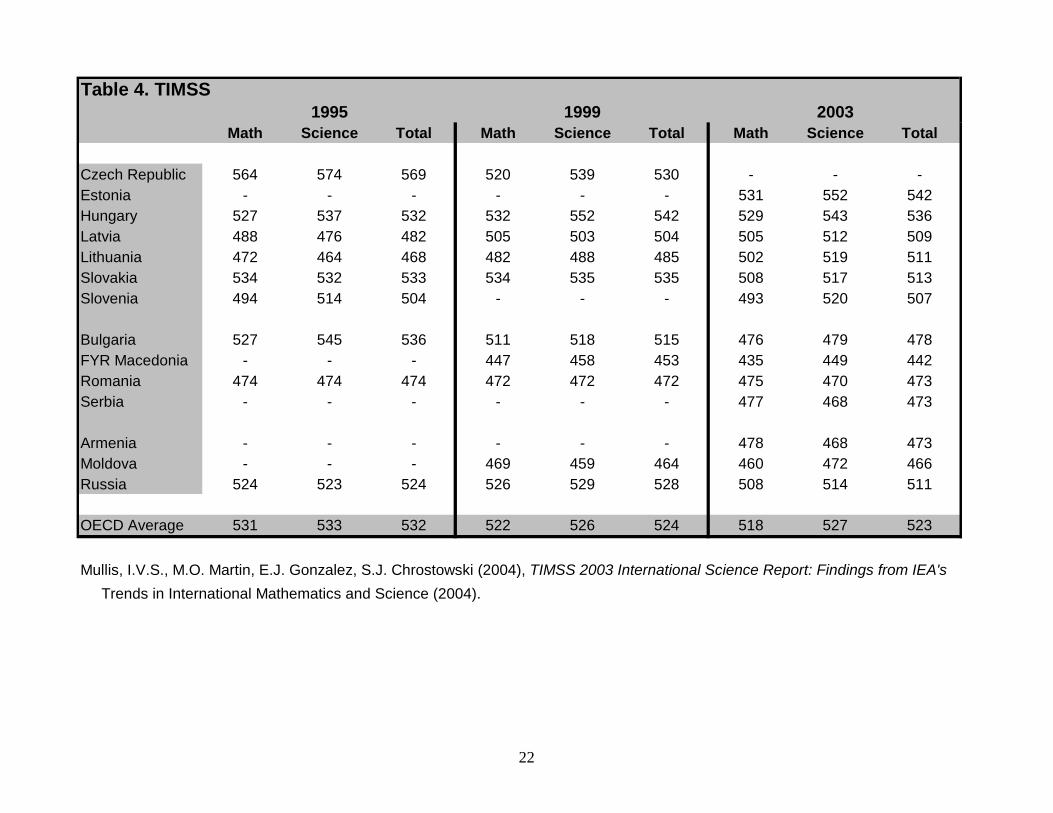
carried out between 1994 and 1998 and tested the literacy of adults aged 16 to 65 in twenty countries. Of these, only four belong to the E&E transition region and all are in the Northern Tier CEE. The PISA study, also conducted by the OECD, also adopts the IALS’ broad definition of literacy. In particular, PISA attempts to focus on how well students, aged approximately fifteen, use knowledge in reading, mathematics, and science to meet real-world challenges. The OECD conducts the assessment every three years. Assessments have already been administered in both 2000 and 2003; the next round will be completed in 2006.3 Forty-five countries have participated in at least one of the PISA surveys. Of these, eleven belong to the transition region—five from the Northern Tier CEE, five from the Southern Tier CEE, and Russia. Only five E&E countries participated in both 2000 and 2003. Findings TIMSS. Figures 1-4 and Tables 4 and 5 show the primary results from TIMSS. Overall, the students sampled in fourteen transition countries included in this survey performed very well in 2003 by international standards. Students in the Northern Tier CEE countries as well as in Russia performed roughly at OECD standards in math and science, and above the intermediate benchmark defined as the minimum acceptable level (“where students can recognize, apply and communicate basic math and scientific knowledge in straightforward situations.”) (Table 4 and Figures 1 and 2). All the other transition countries included in the surveys except Macedonia performed at or near the intermediate benchmark. This includes Bulgaria, Serbia & Montenegro, and Romania in the Southern Tier CEE, and Armenia and Moldova in Eurasia. Macedonia is the only transition country of the fourteen that lags notably behind the minimum threshold; its students performed closest to students in Iran, and not much better than students in Indonesia and Lebanon. Of the fifty-five countries worldwide included in at least one of the surveys, South Africa and Ghana lag the most and far below standards in the fourteen transition countries, including Macedonia. However, only two of the relatively low–income transition countries (Armenia and Moldova) have so far been included in the TIMSS. On average, boys outperform girls in both the math and science in the TIMSS tests in the OECD countries (Table 5 and Figure 3). This is the pattern in the United States as well. This gender gap in the OECD countries is larger in science than in math. The pattern is more mixed in the fourteen transition countries. While boys outperform girls in science in ten of the fourteen transition countries, girls outperform boys in math in ten transition countries. In many cases, the differences are likely not very significant. The largest overall gaps exist in the transition countries at both ends of the performance spectrum.
3 Subsequent to the PISA 2000 round which involved predominately OECD countries, the assessment was repeated between 2001 and 2002 in eleven non-OECD countries in an exercise entitled PISA+. OECD officially publishes these results with those from PISA 2000.
11
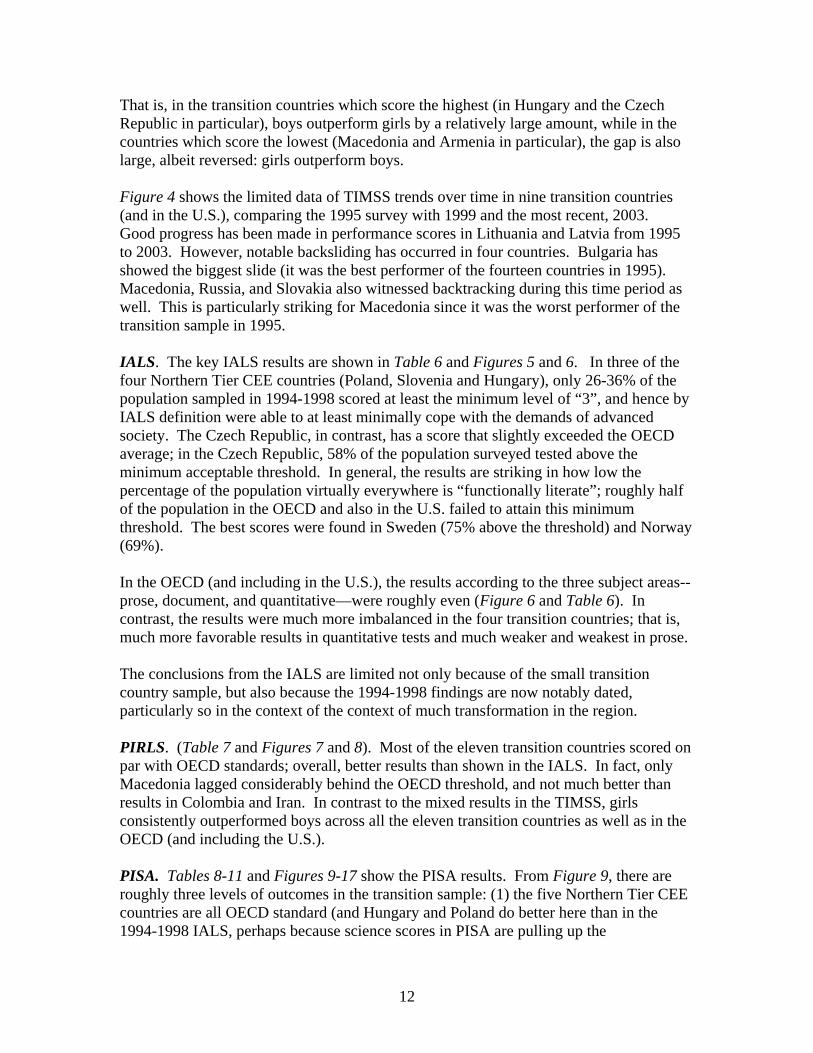
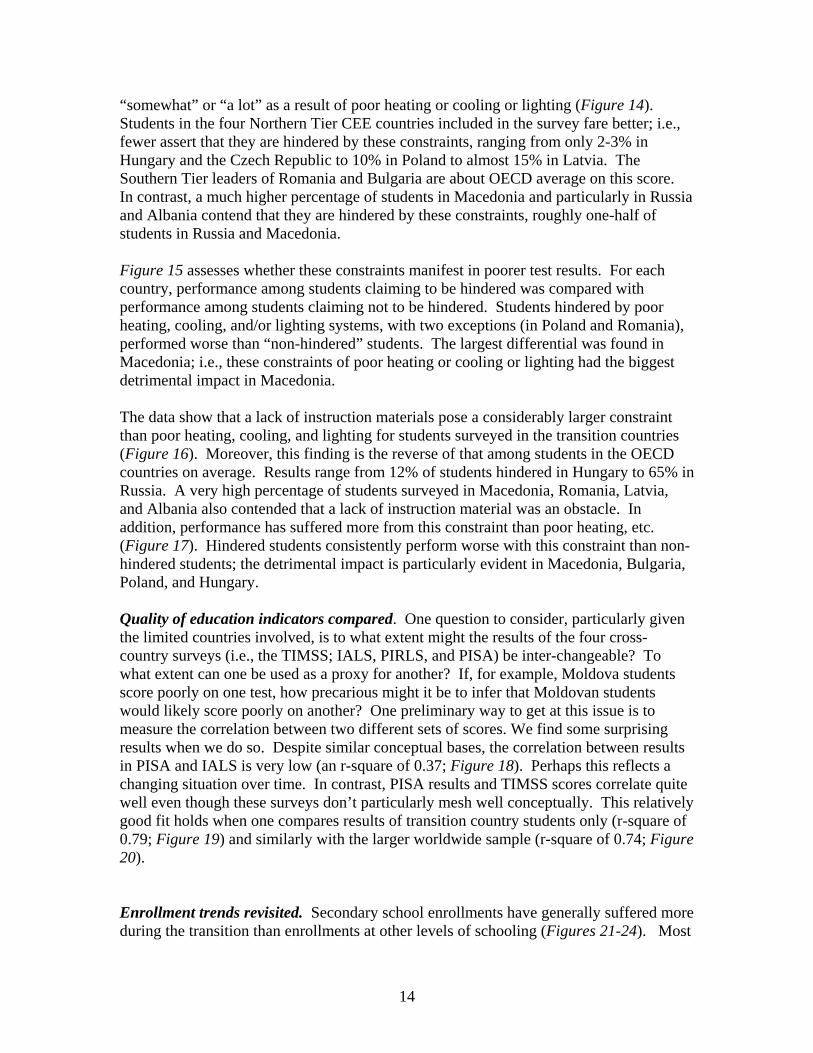
That is, in the transition countries which score the highest (in Hungary and the Czech Republic in particular), boys outperform girls by a relatively large amount, while in the countries which score the lowest (Macedonia and Armenia in particular), the gap is also large, albeit reversed: girls outperform boys. Figure 4 shows the limited data of TIMSS trends over time in nine transition countries (and in the U.S.), comparing the 1995 survey with 1999 and the most recent, 2003. Good progress has been made in performance scores in Lithuania and Latvia from 1995 to 2003. However, notable backsliding has occurred in four countries. Bulgaria has showed the biggest slide (it was the best performer of the fourteen countries in 1995). Macedonia, Russia, and Slovakia also witnessed backtracking during this time period as well. This is particularly striking for Macedonia since it was the worst performer of the transition sample in 1995. IALS. The key IALS results are shown in Table 6 and Figures 5 and 6. In three of the four Northern Tier CEE countries (Poland, Slovenia and Hungary), only 26-36% of the population sampled in 1994-1998 scored at least the minimum level of “3”, and hence by IALS definition were able to at least minimally cope with the demands of advanced society. The Czech Republic, in contrast, has a score that slightly exceeded the OECD average; in the Czech Republic, 58% of the population surveyed tested above the minimum acceptable threshold. In general, the results are striking in how low the percentage of the population virtually everywhere is “functionally literate”; roughly half of the population in the OECD and also in the U.S. failed to attain this minimum threshold. The best scores were found in Sweden (75% above the threshold) and Norway (69%). In the OECD (and including in the U.S.), the results according to the three subject areas-- prose, document, and quantitative—were roughly even (Figure 6 and Table 6). In contrast, the results were much more imbalanced in the four transition countries; that is, much more favorable results in quantitative tests and much weaker and weakest in prose. The conclusions from the IALS are limited not only because of the small transition country sample, but also because the 1994-1998 findings are now notably dated, particularly so in the context of the context of much transformation in the region. PIRLS. (Table 7 and Figures 7 and 8). Most of the eleven transition countries scored on par with OECD standards; overall, better results than shown in the IALS. In fact, only Macedonia lagged considerably behind the OECD threshold, and not much better than results in Colombia and Iran. In contrast to the mixed results in the TIMSS, girls consistently outperformed boys across all the eleven transition countries as well as in the OECD (and including the U.S.). PISA. Tables 8-11 and Figures 9-17 show the PISA results. From Figure 9, there are roughly three levels of outcomes in the transition sample: (1) the five Northern Tier CEE countries are all OECD standard (and Hungary and Poland do better here than in the 1994-1998 IALS, perhaps because science scores in PISA are pulling up the
12
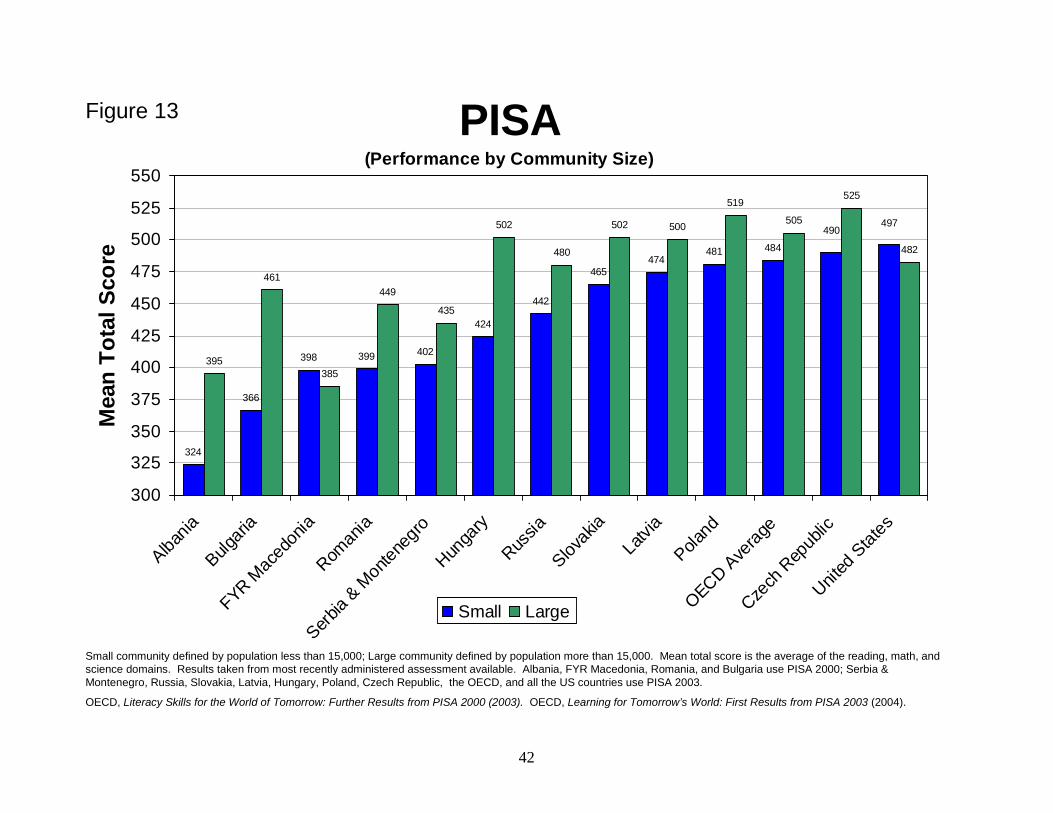
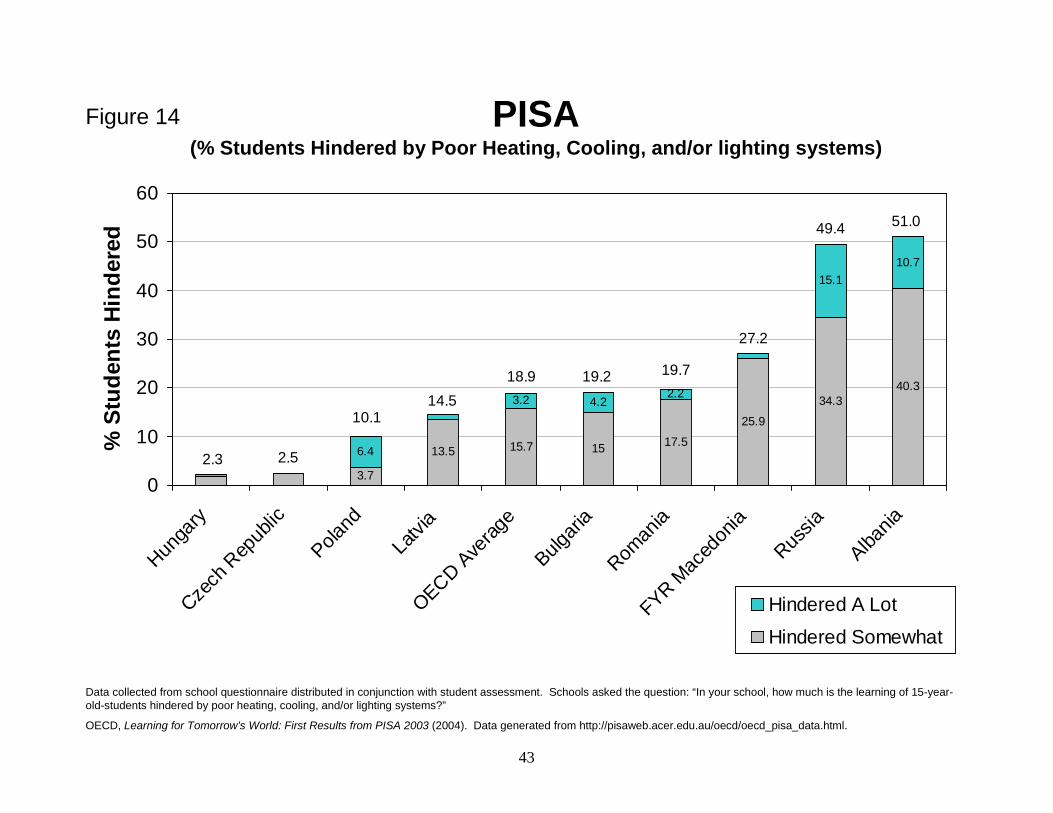
performance, and/or perhaps because performances have improved from 1994-1998 to 2003); (2) Russia followed by Bulgaria, Romania and Serbia & Montenegro perform at a middle level, well below OECD standards, comparable to Thailand; and (3) Macedonia and Albania much lower score still, comparable to Tunisia, Indonesia, Brazil. Unfortunately, Russia to date is the only Eurasian country to take part in the PISA. Figure 10 and Table 8 show the scores disaggregated by the three domains or areas: reading, math, and science. In general, students across the transition perform best in science and worst in reading. In contrast, in the OECD countries, the scores across the three areas are comparable, at least on average. Females outperform males in general in the transition country sample (Figure 11 and Table 9). This is also the trend in OECD. The gender gap is greatest in the transition sample where the overall scores are the lowest, i.e., in Albania and Macedonia. Of the three areas, this gender gap is the largest in reading (i.e., in all eleven transition countries, females outperform males in reading). In math and science, females outperform males in a majority of the countries; in six out of eleven in math and in seven out of eleven in science. PISA tests have taken place in 2000 and 2003 in only five transition countries: four Northern Tier CEE countries (Latvia, Hungary, Poland, and the Czech Republic) and Russia (Figure 12). Some gains in performance were made in the four Northern Tier CEE countries from 2000-2003, particularly in Latvia followed by Poland. Performance in Russia held steady between 2000 and 2003. By way of contrast, some backsliding occurred in the U.S. in this period. Figure 13 and Table 10 show PISA results differentiated by community size. These results, i.e., roughly show the extent of urban-rural disparities. Larger communities (that is, with population more than 15,000) have generally outperformed smaller communities (with population less than 15,000) in most of the transition countries sampled. These urban-rural disparities also appear in the OECD countries though they are not as great. In the transition country sample, the urban-rural disparity is the largest in Bulgaria, followed by Hungary, Albania, and Romania. This trend does not exist in the U.S., however, where i.e., smaller communities outperform larger communities. Nor does it hold true in Macedonia, the lone exception among the transition country sample. These findings by community size hold whether one averages the three areas or whether one looks at each area separately. In other words, of the eleven transition countries, only in Macedonia do smaller communities score higher than larger communities in each of the three areas: in reading, math and science. Table 11 and Figures 14-17 summarize efforts to assess the magnitude and impact of key infrastructure constraints to learning. Specifically, how much have students sampled in PISA been constrained in their performance by poor conditions in school buildings, poor heating/cooling and/or lighting systems, and by a lack of instruction materials? Close to 20% of the students polled in the OECD countries claimed to be hindered either
13
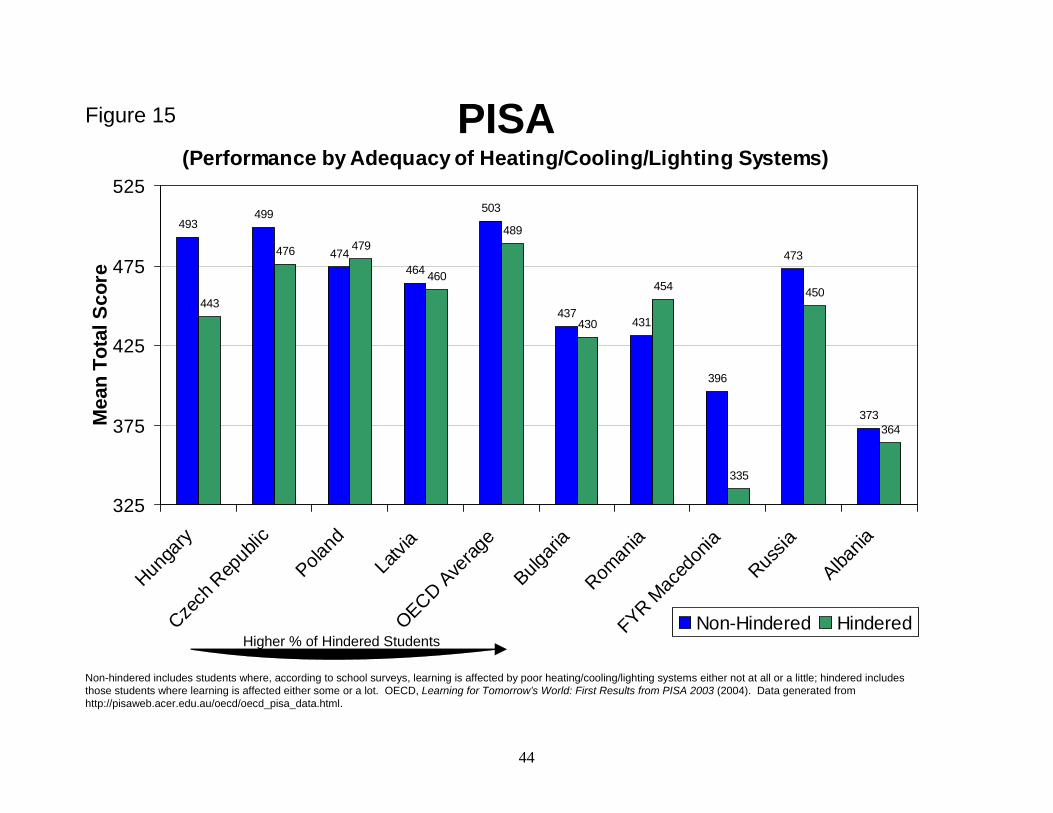
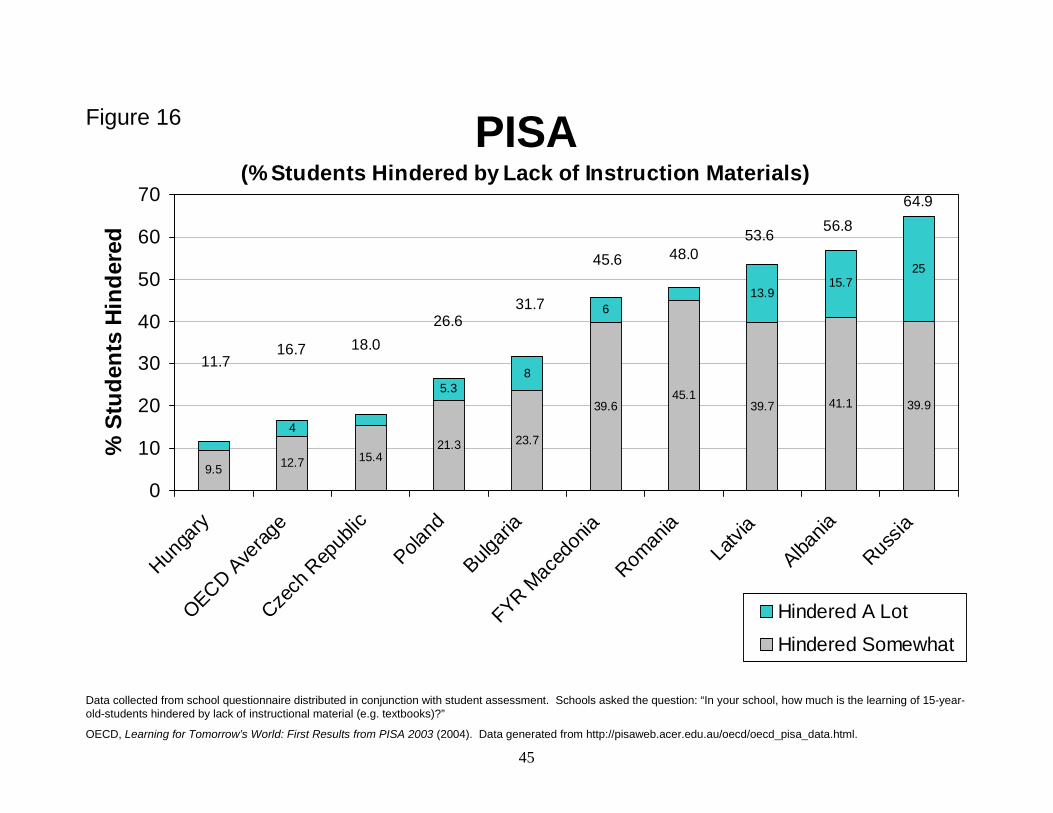
“somewhat” or “a lot” as a result of poor heating or cooling or lighting (Figure 14). Students in the four Northern Tier CEE countries included in the survey fare better; i.e., fewer assert that they are hindered by these constraints, ranging from only 2-3% in Hungary and the Czech Republic to 10% in Poland to almost 15% in Latvia. The Southern Tier leaders of Romania and Bulgaria are about OECD average on this score. In contrast, a much higher percentage of students in Macedonia and particularly in Russia and Albania contend that they are hindered by these constraints, roughly one-half of students in Russia and Macedonia. Figure 15 assesses whether these constraints manifest in poorer test results. For each country, performance among students claiming to be hindered was compared with performance among students claiming not to be hindered. Students hindered by poor heating, cooling, and/or lighting systems, with two exceptions (in Poland and Romania), performed worse than “non-hindered” students. The largest differential was found in Macedonia; i.e., these constraints of poor heating or cooling or lighting had the biggest detrimental impact in Macedonia. The data show that a lack of instruction materials pose a considerably larger constraint than poor heating, cooling, and lighting for students surveyed in the transition countries (Figure 16). Moreover, this finding is the reverse of that among students in the OECD countries on average. Results range from 12% of students hindered in Hungary to 65% in Russia. A very high percentage of students surveyed in Macedonia, Romania, Latvia, and Albania also contended that a lack of instruction material was an obstacle. In addition, performance has suffered more from this constraint than poor heating, etc. (Figure 17). Hindered students consistently perform worse with this constraint than non-hindered students; the detrimental impact is particularly evident in Macedonia, Bulgaria, Poland, and Hungary. Quality of education indicators compared. One question to consider, particularly given the limited countries involved, is to what extent might the results of the four cross-country surveys (i.e., the TIMSS; IALS, PIRLS, and PISA) be inter-changeable? To what extent can one be used as a proxy for another? If, for example, Moldova students score poorly on one test, how precarious might it be to infer that Moldovan students would likely score poorly on another? One preliminary way to get at this issue is to measure the correlation between two different sets of scores. We find some surprising results when we do so. Despite similar conceptual bases, the correlation between results in PISA and IALS is very low (an r-square of 0.37; Figure 18). Perhaps this reflects a changing situation over time. In contrast, PISA results and TIMSS scores correlate quite well even though these surveys don’t particularly mesh well conceptually. This relatively good fit holds when one compares results of transition country students only (r-square of 0.79; Figure 19) and similarly with the larger worldwide sample (r-square of 0.74; Figure 20). Enrollment trends revisited. Secondary school enrollments have generally suffered more during the transition than enrollments at other levels of schooling (Figures 21-24). Most
14
of the drop in secondary enrollments, however, has occurred in Eurasia where enrollments overall have fallen substantially, from almost 70% in 1989 to 50% in 2002. Secondary school enrollments are higher today in CEE than when the transition began. In addition, when one disaggregates secondary school enrollments between general secondary and vocational/technical secondary, one finds that most of the drop in secondary school enrollments has been due to a significant drop in vocational or technical school enrollments, again mostly in Eurasia (Figures 25 and 26). Figures 27-32 and Tables 12-14 show secondary school enrollment trends (total, general, and vocational/technical) for all of the Southern Tier CEE and Eurasian countries individually. They show that the sub-regional (average) trends mask considerable diversity. Total secondary enrollments in the Southern Tier CEE countries range from Croatia and Bulgaria at 85% to Albania and Bosnia-Herzegovina at 50%. In Eurasia, total secondary enrollments range from Belarus and Russia at 70% to Tajikistan and Turkmenistan at less than 30%. Moreover, some countries rank very differently in enrollment levels when one compares vocational/technical enrollments with general enrollments. Most striking is Albania. Albania, alongside Bulgaria, has the highest general secondary enrollment rate in the Southern Tier CEE countries, yet the lowest secondary school enrollment rate in vocational/technical schools. Croatia has the highest vocational enrollment rate in the Southern Tier CEE, yet is among the laggards in general secondary school enrollment. Armenia has among the highest general secondary school enrollment in Eurasia, but also among the lowest vocational/technical enrollments rates. Table 15 looks at the composition of secondary school enrollments more systematically. What was the mix of vocational to general enrollments rates in 1989? What is the proportion roughly today (2002 most recent data)? How has it changed from 1989 to 2002? Overall, there is a great deal of diversity of results among the countries. Perhaps the most evident general trend is the reduction in the proportion of vocational enrollments relative to general enrollments from 1989 to 2002. This occurred in twenty-two of the twenty-five countries for which data are available. In 1989, the large majority of transition countries had higher enrollments in vocational and technical schools than in general secondary schools: seventeen countries vs. eight. Most of the countries with a higher proportion of vocational schools are in CEE (and conversely, most of the Eurasian countries, seven countries, had general enrollment rates higher than vocational rates in 1989). The Southern Tier CEE countries had the highest proportion of vocational enrollment to general; six to seven times more vocational secondary enrollments in Macedonia, Croatia, and Romania than general secondary enrollments in 1989. By 2002, there was much more balance between the number of countries where vocational enrollment exceeded general secondary (fourteen countries) and the number of countries where general secondary enrollments exceeded vocational (thirteen). There was a larger proportionate drop in vocational enrollments in CEE than in Eurasia from
15
1989 to 2002, reflecting in part that there was a larger proportion of vocational enrollments in CEE in 1989. The meaning of these trends needs to be explored. Can one generalize to say that a proportionate drop in vocational and technical school enrollments is a good thing given the overspecialization that took place prior to communism’s collapse? Is this trend a necessary part of the transition to a market-oriented democracy? To what extent does the quality and appropriateness of vocational and technical training differ across countries? Are there key differences between vocational schools and technical schools? We are not aware of an effort which has attempted to systematically address these questions. Quality vs. quantity. We regressed the results from the PISA surveys on six quantity of education indicators to see how closely they correlate (Figures 33-39). Are any of the quantity of education indicators notably better than others as proxies for quality? The six indicators are: basic or primary school enrollment; total secondary school enrollment; general secondary enrollment; vocational/technical enrollment; tertiary or higher education enrollment; and public spending on education as % of GDP. Most of the correlations are weak, the “fit” between quantity and quality indicators are poor ones. Perhaps surprisingly, the poorest fit is between general school enrollments and the PISA scores (an r-square of 0.05); countries with roughly the same general enrollment rates have very different PISA scores (Albania vs. Hungary, e.g.). Vocational enrollment rates correlate somewhat better, though the fit is still poor. However, when one combines the two secondary school enrollment rates, one finds a reasonable fit (tempered by two significant outliers: Macedonia and Albania). In general, the greater is the total secondary enrollment, the better are the PISA test results. Basic enrollment figures do not correlate very closely with PISA results; a very low r-square. However, the same two outliers, Macedonia and Albania, emerge. This may suggest that the primary and secondary education systems in Macedonia and Albania are more inefficient than the norm among the transition countries. In addition, the amount a government spends on education does not correlate very well with PISA test results. The efficiency and targeting of expenditures may be more important than the volume of spending. The best fit between quantity and quality of education indicators is with higher education enrollment rates. Here, there exists a clear and consistent relationship between tertiary enrollments and PISA test results: the greater is the tertiary enrollment, the better are the test results. The r-square is 0.64, and there are no obvious outliers. This is not to suggest causality from one to the other. Rather, countries that have education systems which invest more in higher education are also those that are more likely to produce a higher quality, more relevant education overall (i.e. not confined to higher education).
16
Education gaps. Finally, in a similar vein (albeit in a less sophisticated mode) to previous “hot spots” analyses conducted by the E&E Bureau,4 we analyzed which countries appeared to be particularly vulnerable on each education indicator, quantity plus quality, and ranked the countries accordingly. Table 17 summarizes the results and includes threshold definitions of vulnerability. There are many data gaps, particularly for the quality of education indicators. Hence, the overall education deficiencies per country were assessed by calculating the vulnerabilities as a percent of the indicators in which data are available. There were a total of twelve indicators: enrollments at all levels, education expenditures; the quality of education survey indicators, as well as a proxy indicator to measure “brain drain” (Table 16 and Figure 40).5 However, for only two countries, the Czech Republic and Hungary, was there data available for each of these twelve indicators. Seven other countries had data available for ten or eleven indicators. At the other extreme, three countries, Bosnia-Herzegovina, Uzbekistan, and Kazakhstan, had data for only four of the twelve indicators. Given the wide range of available data per country, it seemed appropriate to produce two lists of vulnerable countries: those with the highest proportion of vulnerable indicators (regardless of the number of indicators per country being tracked); and the most vulnerable countries from a smaller country sample consisting of those countries which have data for a majority (seven or more) of the twelve indicators. From the full sample of twenty-seven countries, ten were found to have at least 50% of education indicators deemed vulnerable. Four are CEE countries: Bosnia-Herzegovina; Albania, Macedonia, and Romania. Six are Eurasian countries: Turkmenistan, Tajikistan, Armenia, Azerbaijan; Uzbekistan, and Georgia. From the limited sample of sixteen countries (which have data for a majority of the twelve indicators), four countries stand out as relatively vulnerable: Albania; Armenia; Macedonia; and Romania. We provide a visual summary of the education profiles of two of these four vulnerable countries: Macedonia (Figures 41 and 42) and Albania (Figures 43 and 44). Macedonia’s enrollment trends are relatively favorable (Figure 41). There has been little deterioration in enrollment numbers. However, the pre-primary enrollment rate in Macedonia is only 27%, well below regional standards (Eurasia: 32%; Southern Tier CEE: 52%; and Northern Tier CEE: 72%). In addition, tertiary enrollment is very low in Macedonia relative to Northern Tier CEE standards (23% vs. 50%), though not Southern Tier CEE and Eurasian averages (24% and 26% respectively). Macedonia falls far short by various standards from the PISA assessments (Figure 42). The performance of its students is dwarfed by OECD standards, across the three subject areas (and most saliently, reading), and by gender (most saliently, males). A high percentage of students in Macedonia are hindered by school infrastructure (heating, cooling, and/ lighting systems), and particularly by a lack of instructional materials;
4 See USAID/EE/DGST, Social Issues Critical for Sustainability of Reform: Education Sector Discussion Paper (August 2003). 5 The “brain drain” proxy, drawn from UNESCO, measures the change of the research and development personnel per million inhabitants between two time periods, 1994-1996 vs. 1999-2001.
17
almost half of the students surveyed found themselves hindered by a lack of instructional materials (vs. 17% of students surveyed in the OECD countries). Enrollment trends in Albania are troublesome (Figure 43). Secondary school enrollment rates have dropped significantly since 1989, from almost 80% to 50%. All of this drop is attributed to vocational and technical enrollments plummeting (while general secondary enrollment rates increased modestly). Pre-primary enrollment rate is only 34%, and the tertiary enrollment rate is only 14%. Albanian students scored very poorly on the PISA test, even worse than students in Macedonia. Over 50% of students surveyed are hindered by heating, cooling, and/or lighting; 57% are hindered by a lack of instruction materials. Large disparities exist by gender (males lag considerably) and by subject areas (Albanian’s score much poorer on reading than on math and science), and by community size (performance of rural students are far below those of urban students). One last observation from this rack-up of education gaps merits explicit attention. It is striking how little quantitative information we have on a number of transition countries. Of a total of twelve indicators, we have data for only four indicators in the case of Bosnia-Herzegovina, Uzbekistan, and Kazakhstan; five in the case of Turkmenistan, Tajikistan, Azerbaijan, and Croatia; and six in the case of Georgia, Ukraine, and Belarus. In eight of the twelve Eurasian countries, we have no more than half of the indicators available. Moreover, the data gaps may very likely be a reasonable proxy for relatively unreliable indicators where data do exist.
18
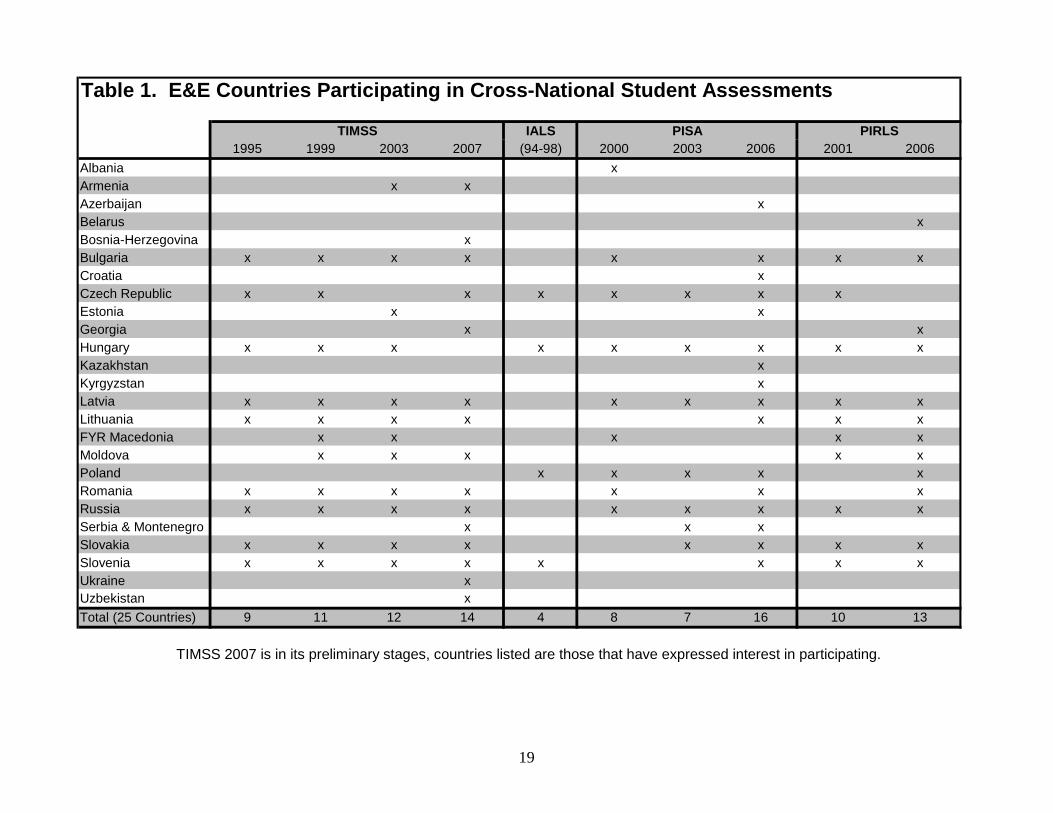
IALS1995 1999 2003 2007 (94-98) 2000 2003 2006 2001 2006
Albania xArmenia x xAzerbaijan xBelarus xBosnia-Herzegovina xBulgaria x x x x x x x xCroatia xCzech Republic x x x x x x x xEstonia x xGeorgia x xHungary x x x x x x x x xKazakhstan xKyrgyzstan xLatvia x x x x x x x x xLithuania x x x x x x xFYR Macedonia x x x x xMoldova x x x x xPoland x x x x xRomania x x x x x x xRussia x x x x x x x x xSerbia & Montenegro x x xSlovakia x x x x x x x xSlovenia x x x x x x x xUkraine xUzbekistan xTotal (25 Countries) 9 11 12 14 4 8 7 16 10 13
TIMSS 2007 is in its preliminary stages, countries listed are those that have expressed interest in participating.
Table 1. E&E Countries Participating in Cross-National Student Assessments
TIMSS PISA PIRLS
19
PISA 2000 PISA 2003 IALS TIMSS 2003 TIMSS 1999 TIMSS 1995 PIRLSAlbania Australia Australia Argentina Argentina Australia ArgentinaArgentina Austria Belgium Armenia Australia Beligum BelizeAustia Belgium Canada Australia Beligum Bulgaria BulgariaAustralia Brazil Chile Bahrain Bulgaria Canada CanadaBelgium Canada Czech Republic Beligum Canada Cyprus ColombiaBrazil Czech Republic Denmark Botswana Chile England CyprusBulgaria Denmark Finland Bulgaria China-Taipei Hong King Czech Rep.Canada Finland Germany Canada Cyprus Hungary EnglandChile France Hungary Chile England Iran FranceCzech Republic Germany Ireland Chinese Taipei Hong King Israel GermanyDenmark Greece Netherlands Cyprus Hungary Italy GreeceFinalnd Hong Kong-China New Zealand Egypt Indonesia Japan Hong KingFrance Hungary Norway England Iran S. Korea HungaryFYR Macedonia Iceland Poland Estonia Israel Latvia IcelandGermany Indonesia Portugal Ghana Italy Lithuania IranGreece Ireland Slovenia Hong King Japan Netherlands IsraelHong Kong-China Italy Sweden Hungary Jordan New Zeal. ItalyHungary Japan Switzerland Indonesia S. Korea Norway KuwaitIceland Korea UK Iran Latvia Romania LatviaIndonesia Latvia USA Israel Lithuania Russia LithuaniaIreland Liechtenstein Italy Macedonia Scotland MacedoniaIsrael Luxembourg Japan Malaysia Singapore MoldovaItaly Macao-China Jordan Moldova Slovakia MoroccoJapan Mexico S. Korea Morocco Slovenia NetherlandsKorea Netherlands Labanon Netherlands South Africa New ZealandLatvia New Zealand Latvia New Zealand Sweden NorwayLiechtenstein Norway Lithuania Philippines USA RussiaLuxembourg Poland Macedonia Romania ScotlandMexico Portugal Malaysia Russia SingaporeNetherlands Russia Moldova Singapore SlovakiaNew Zealand Serbia & Montenegro Morocco Slovakia SloveniaNorway Slovakia Netherlands Slovenia SwedenPeru Spain New Zealand South Africa TurkeyPoland Sweden Norway Tunisia USAPortugal Switzerland Palestine USARomania Thailand PhilippinesRussia Tunisia RomaniaSpain Turkey RussiaSweden United Kingdom Saudi ArabiaSwitzerland USA ScotlandThailand Uruguay SerbiaUnited Kingdom SingaporeUSA Slovakia
SloveniaSouth AfricaSpain-BasqueSwedenSyriaTunisiaUSAYemen
Table 2. Countries Participating in Cross-National Assessments
20
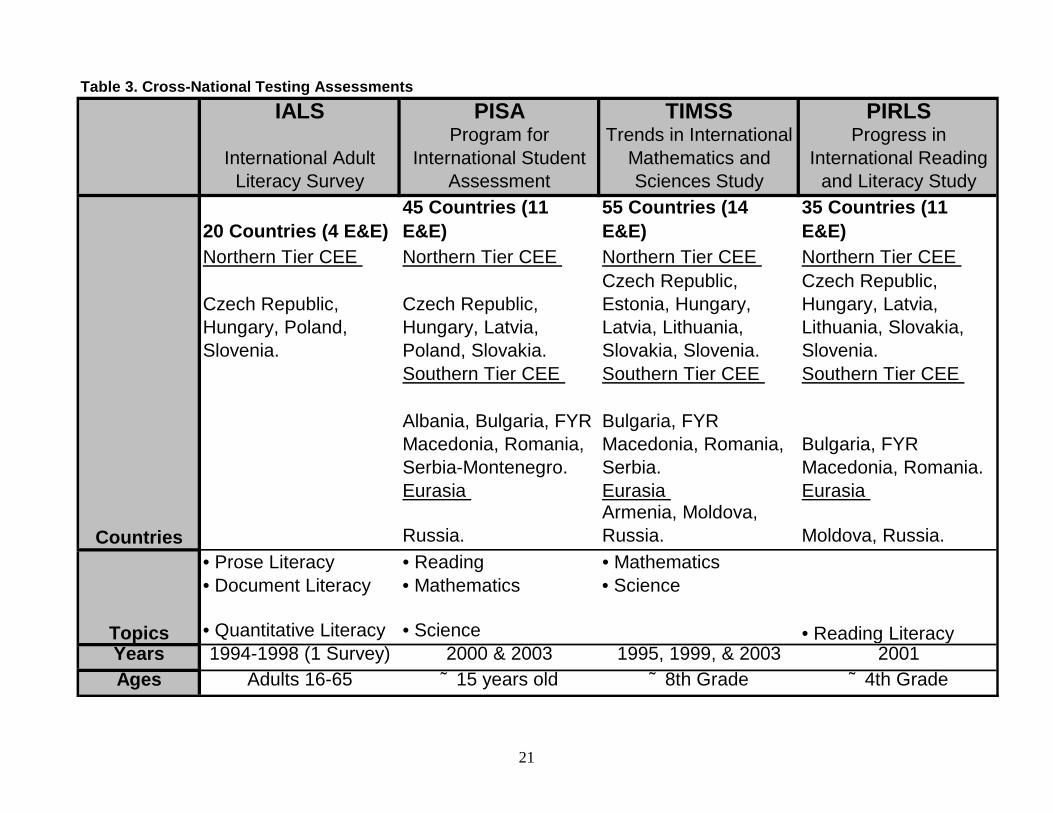
Table 3. Cross-National Testing Assessments
IALS PISA TIMSS PIRLS
International Adult Literacy Survey
Program for International Student
Assessment
Trends in International Mathematics and Sciences Study
Progress in International Reading
and Literacy Study
20 Countries (4 E&E) 45 Countries (11 E&E)
55 Countries (14 E&E)
35 Countries (11 E&E)
Northern Tier CEE Northern Tier CEE Northern Tier CEE Northern Tier CEE
Czech Republic, Hungary, Poland, Slovenia.
Czech Republic, Hungary, Latvia, Poland, Slovakia.
Czech Republic, Estonia, Hungary, Latvia, Lithuania, Slovakia, Slovenia.
Czech Republic, Hungary, Latvia, Lithuania, Slovakia, Slovenia.
Southern Tier CEE Southern Tier CEE Southern Tier CEE
Albania, Bulgaria, FYR Macedonia, Romania, Serbia-Montenegro.
Bulgaria, FYR Macedonia, Romania, Serbia.
Bulgaria, FYR Macedonia, Romania.
Eurasia Eurasia Eurasia
Russia.Armenia, Moldova, Russia. Moldova, Russia.
• Prose Literacy • Reading • Mathematics • Document Literacy • Mathematics • Science
• Quantitative Literacy • ScienceYears 1994-1998 (1 Survey) 2000 & 2003 1995, 1999, & 2003 2001Ages Adults 16-65 ˜ 15 years old ˜ 8th Grade ˜ 4th Grade
Countries
Topics • Reading Literacy
21
Math Science Total Math Science Total Math Science Total
Czech Republic 564 574 569 520 539 530 - - -Estonia - - - - - - 531 552 542Hungary 527 537 532 532 552 542 529 543 536Latvia 488 476 482 505 503 504 505 512 509Lithuania 472 464 468 482 488 485 502 519 511Slovakia 534 532 533 534 535 535 508 517 513Slovenia 494 514 504 - - - 493 520 507
Bulgaria 527 545 536 511 518 515 476 479 478FYR Macedonia - - - 447 458 453 435 449 442Romania 474 474 474 472 472 472 475 470 473Serbia - - - - - - 477 468 473
Armenia - - - - - - 478 468 473Moldova - - - 469 459 464 460 472 466Russia 524 523 524 526 529 528 508 514 511
OECD Average 531 533 532 522 526 524 518 527 523
Mullis, I.V.S., M.O. Martin, E.J. Gonzalez, S.J. Chrostowski (2004), TIMSS 2003 International Science Report: Findings from IEA's Trends in International Mathematics and Science (2004).
Table 4. TIMSS1995 1999 2003
22
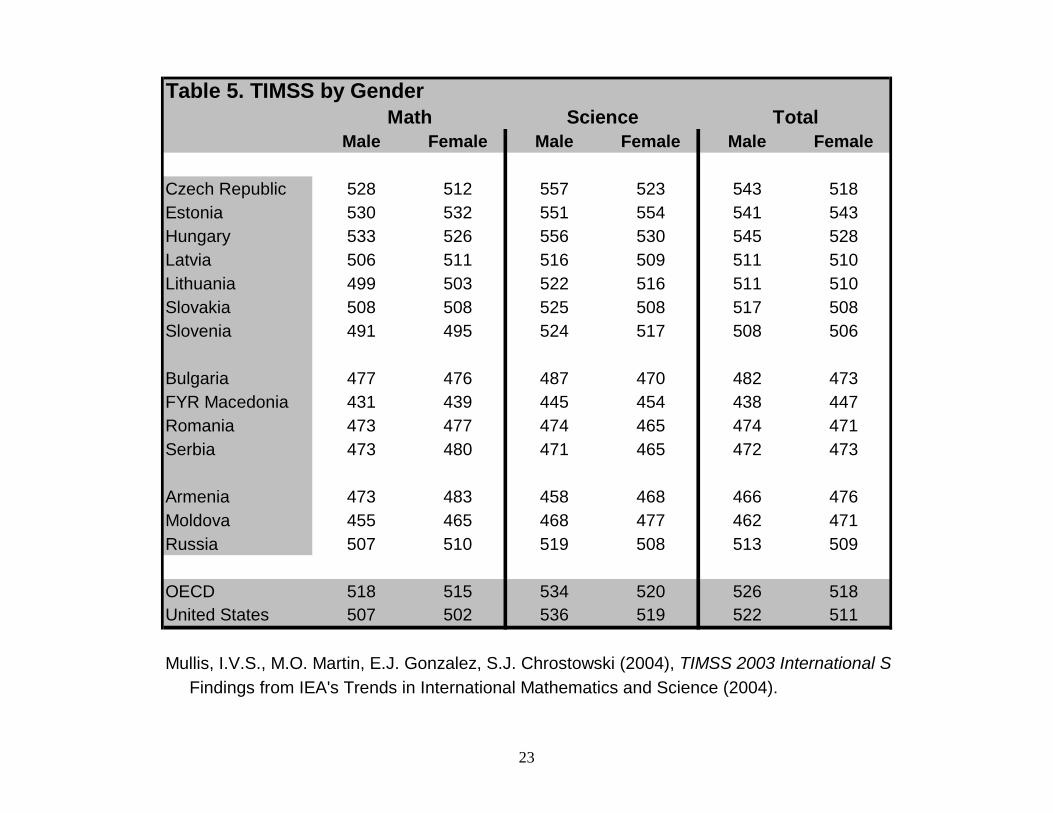
Male Female Male Female Male Female
Czech Republic 528 512 557 523 543 518Estonia 530 532 551 554 541 543Hungary 533 526 556 530 545 528Latvia 506 511 516 509 511 510Lithuania 499 503 522 516 511 510Slovakia 508 508 525 508 517 508Slovenia 491 495 524 517 508 506
Bulgaria 477 476 487 470 482 473FYR Macedonia 431 439 445 454 438 447Romania 473 477 474 465 474 471Serbia 473 480 471 465 472 473
Armenia 473 483 458 468 466 476Moldova 455 465 468 477 462 471Russia 507 510 519 508 513 509
OECD 518 515 534 520 526 518United States 507 502 536 519 522 511
Mullis, I.V.S., M.O. Martin, E.J. Gonzalez, S.J. Chrostowski (2004), TIMSS 2003 International S Findings from IEA's Trends in International Mathematics and Science (2004).
Table 5. TIMSS by GenderMath Science Total
23
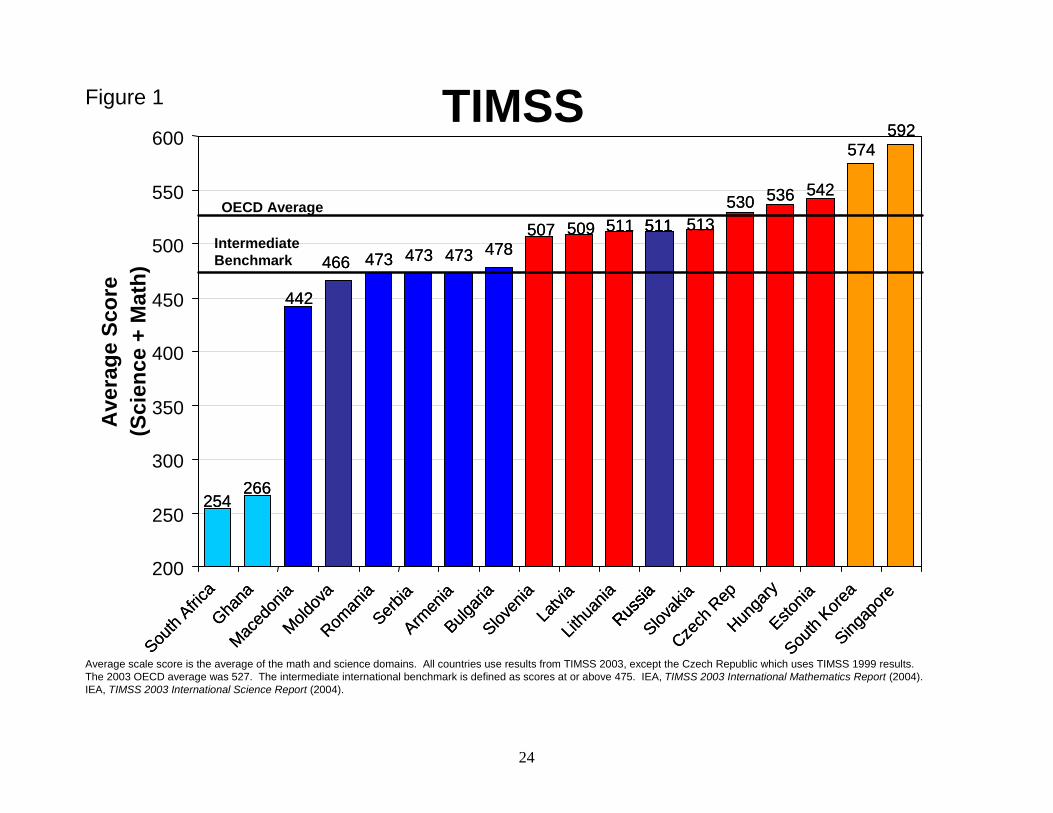
Average scale score is the average of the math and science domains. All countries use results from TIMSS 2003, except the Czech Republic which uses TIMSS 1999 results. The 2003 OECD average was 527. The intermediate international benchmark is defined as scores at or above 475. IEA, TIMSS 2003 International Mathematics Report (2004). IEA, TIMSS 2003 International Science Report (2004).
OECD Average
TIMSS
200
250
300
350
400
450
500
550
600
266254
South
Africa
Ghana
266254
South
Africa
Ghana
478473473473
442
Maced
onia
Roman
iaSerb
iaArm
enia
Bulgari
a
478473473473
442
Maced
onia
Roman
iaSerb
iaArm
enia
Bulgari
a
466
Moldov
a
511
Russia
466
Moldov
a
511
Russia
511
Russia
542536530513511509507
Sloven
iaLa
tvia
Lithu
ania
Slovak
iaCze
ch R
epHun
gary
Estonia
542536530513511509507
Sloven
iaLa
tvia
Lithu
ania
Slovak
iaCze
ch R
epHun
gary
Estonia
574592
South
Korea
Singap
ore574
592
South
Korea
Singap
ore
Ave
rage
Sco
re
(Sci
ence
+ M
ath)
Intermediate Benchmark
Figure 1
24
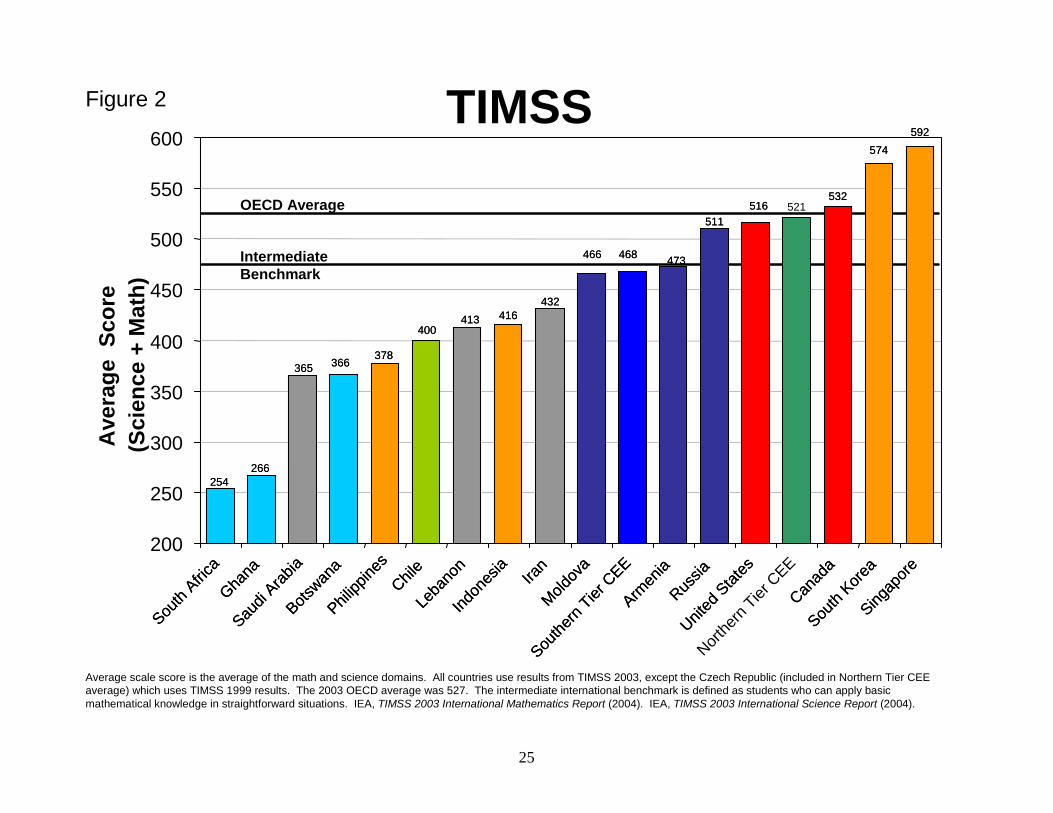
Average scale score is the average of the math and science domains. All countries use results from TIMSS 2003, except the Czech Republic (included in Northern Tier CEE average) which uses TIMSS 1999 results. The 2003 OECD average was 527. The intermediate international benchmark is defined as students who can apply basic mathematical knowledge in straightforward situations. IEA, TIMSS 2003 International Mathematics Report (2004). IEA, TIMSS 2003 International Science Report (2004).
OECD Average
Intermediate Benchmark
TIMSS
521
200
250
300
350
400
450
500
550
600
432416413
400
378366365
266254
South
Africa
Ghana
Saudi
Arabia
Botswan
aPhil
ippine
sChil
eLe
bano
nInd
ones
ia
Iran
432416413
400
378366365
266254
South
Africa
Ghana
Saudi
Arabia
Botswan
aPhil
ippine
sChil
eLe
bano
nInd
ones
ia
Iran
468
Southe
rn Tier
CEE
468
Southe
rn Tier
CEE
511
473466
Moldov
a
Armen
iaRus
sia
511
473466
Moldov
a
Armen
iaRus
siaNort
hern
Tier C
EE
574592
532516
United
Stat
es
Canad
aSou
th Kore
aSing
apore
574592
532516
United
Stat
es
Canad
aSou
th Kore
aSing
apore
Ave
rage
Sco
re
(Sci
ence
+ M
ath)
Figure 2
25
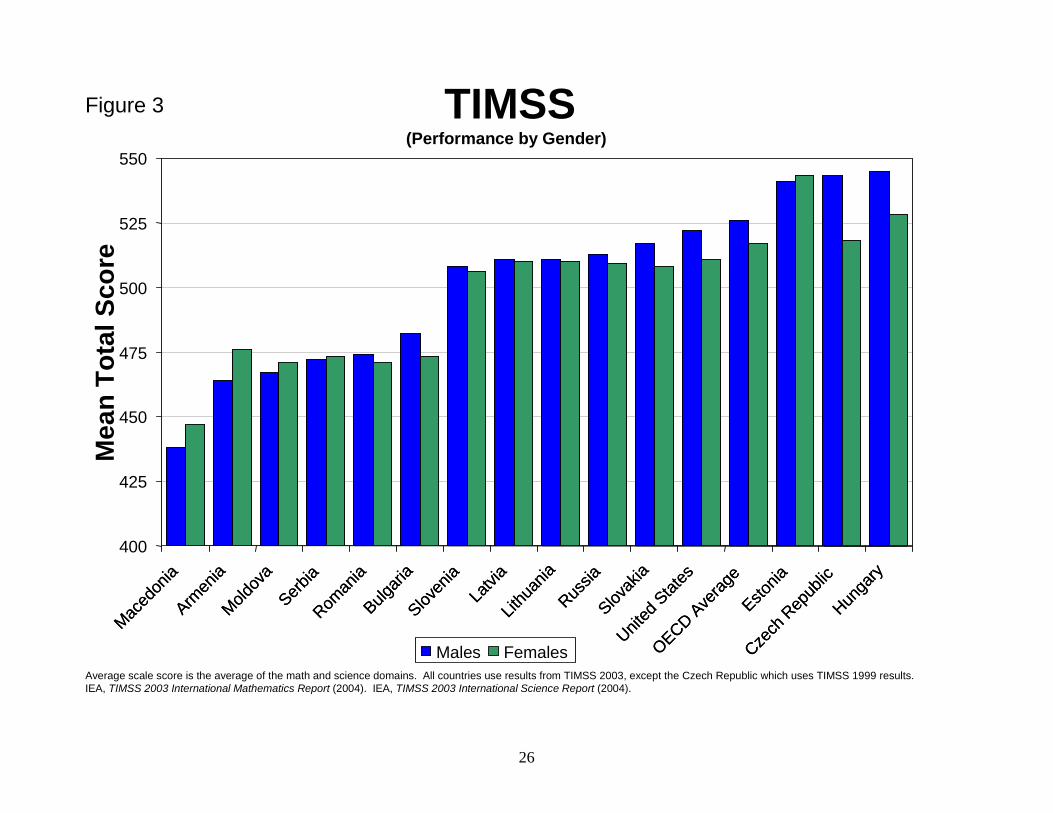
Average scale score is the average of the math and science domains. All countries use results from TIMSS 2003, except the Czech Republic which uses TIMSS 1999 results. IEA, TIMSS 2003 International Mathematics Report (2004). IEA, TIMSS 2003 International Science Report (2004).
TIMSS(Performance by Gender)
400
425
450
475
500
525
550
Maced
onia
Serbia
Roman
iaBulg
aria
Maced
onia
Serbia
Roman
iaBulg
aria
Armen
iaMold
ova
Russia
Armen
iaMold
ova
Russia
United
States
OECD Ave
rage
United
States
OECD Ave
rage
Sloven
iaLa
tvia
Lithu
ania
Slovak
ia
Estonia
Czech
Rep
ublic
Hunga
ry
Sloven
iaLa
tvia
Lithu
ania
Slovak
ia
Estonia
Czech
Rep
ublic
Hunga
ry
Mea
n To
tal S
core
Males Females
Figure 3
26
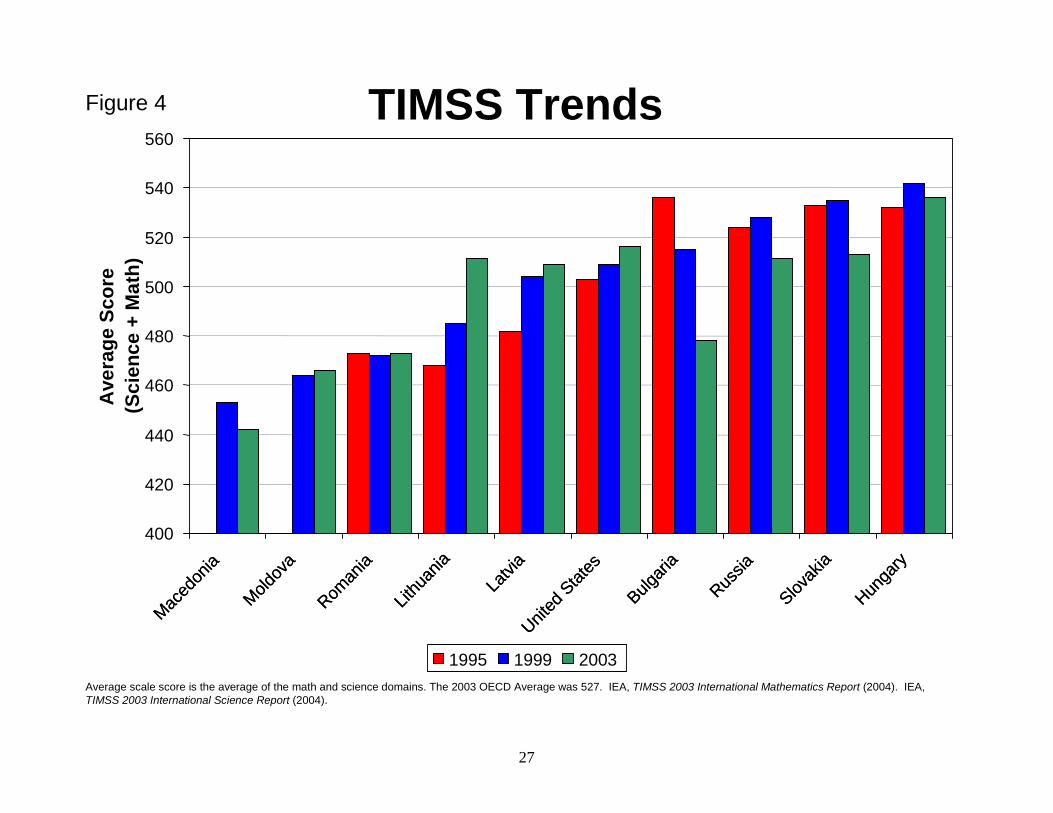
Average scale score is the average of the math and science domains. The 2003 OECD Average was 527. IEA, TIMSS 2003 International Mathematics Report (2004). IEA, TIMSS 2003 International Science Report (2004).
TIMSS Trends
400
420
440
460
480
500
520
540
560
United
States
United
States
Maced
onia
Roman
ia
Bulgari
a
Maced
onia
Roman
ia
Bulgari
a
Moldov
a
Russia
Moldov
a
Russia
Lithu
ania
Latvi
a
Slovak
ia
Hunga
ry
Lithu
ania
Latvi
a
Slovak
ia
Hunga
ry
Ave
rage
Sco
re(S
cien
ce +
Mat
h)
1995 1999 2003
Figure 4
27
Prose LiteracyLevel 1 Level 2 Level 3 Level 4 Level 3+4
Poland 42.6 34.5 19.8 3.1 22.9Slovenia 42.2 34.5 20.1 3.2 23.3Hungary 33.8 42.7 20.8 2.6 23.4Czech Republic 15.7 38.1 37.8 8.4 46.2
OECD Average 19.7 30.3 35.4 14.5 49.9United States 20.7 25.9 32.4 21.1 53.5
Document LiteracyLevel 1 Level 2 Level 3 Level 4 Level 3+4
Poland 45.4 30.7 18 5.8 23.8Slovenia 40.9 31.8 22 5.3 27.3Hungary 32.9 34.2 25 8 33Czech Republic 14.3 28 38.1 19.6 57.7
OECD Average 19.9 27.3 34.4 18.5 52.9United States 23.7 25.9 31.4 19 50.4
Quantitative LiteracyLevel 1 Level 2 Level 3 Level 4 Level 3+4
Poland 39.1 30.1 23.9 6.8 30.7Slovenia 35 30.4 26 8.6 34.6Hungary 20.5 31.6 31.7 16.1 47.8Czech Republic 8.9 22.3 37 31.9 68.9
OECD Average 17.4 26 36 20.7 56.7United States 21 25.3 31.3 22.5 53.8
Total Average LiteracyLevel 1 Level 2 Level 3 Level 4 Level 3+4
Poland 42.4 31.8 20.6 5.2 25.8Slovenia 39.4 32.2 22.7 5.7 28.4Hungary 29.1 36.2 25.8 8.9 34.7Czech Republic 13 29.5 37.6 20 57.6
OECD 19 27.8 35.3 17.9 53.1United States 21.8 25.7 31.7 20.9 52.6
OECD and Statistics Canada, Literacy in the Information Age: Final Report of the International Adult Literacy Survey (2000).
Table 6. IALS: Percent Students at Each Literacy Level
28
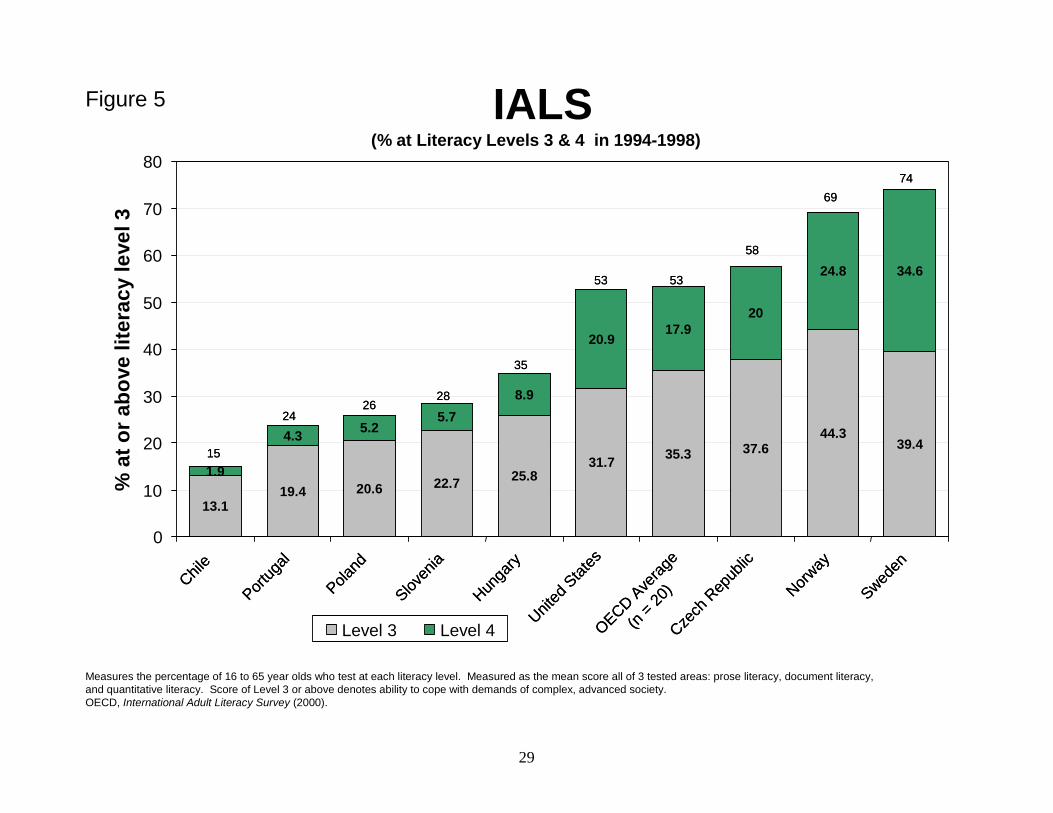
Measures the percentage of 16 to 65 year olds who test at each literacy level. Measured as the mean score all of 3 tested areas: prose literacy, document literacy, and quantitative literacy. Score of Level 3 or above denotes ability to cope with demands of complex, advanced society.OECD, International Adult Literacy Survey (2000).
IALS(% at Literacy Levels 3 & 4 in 1994-1998)
0
10
20
30
40
50
60
70
80
% a
t or a
bove
lite
racy
leve
l 3
Level 3 Level 4
13.1
1.9
Chile
15
13.1
1.9
Chile
15
19.4
4.3
Portug
al
24
19.4
4.3
Portug
al
24
20.6
5.2
Poland
26
20.6
5.2
Poland
26
22.7
5.7
Sloven
ia
28
22.7
5.7
Sloven
ia
28
25.8
8.9
Hunga
ry
35
25.8
8.9
Hunga
ry
35
31.7
20.9
United
Stat
es
53
31.7
20.9
United
Stat
es
53
35.3
17.9
OECD Ave
rage
(n = 2
0)
53
35.3
17.9
OECD Ave
rage
(n = 2
0)
53
37.6
20
Czech
Rep
ublic
58
37.6
20
Czech
Rep
ublic
58
44.3
24.8Norw
ay
69
44.3
24.8Norw
ay
69
39.4
34.6
Sweden
74
39.4
34.6
Sweden
74
Figure 5
29
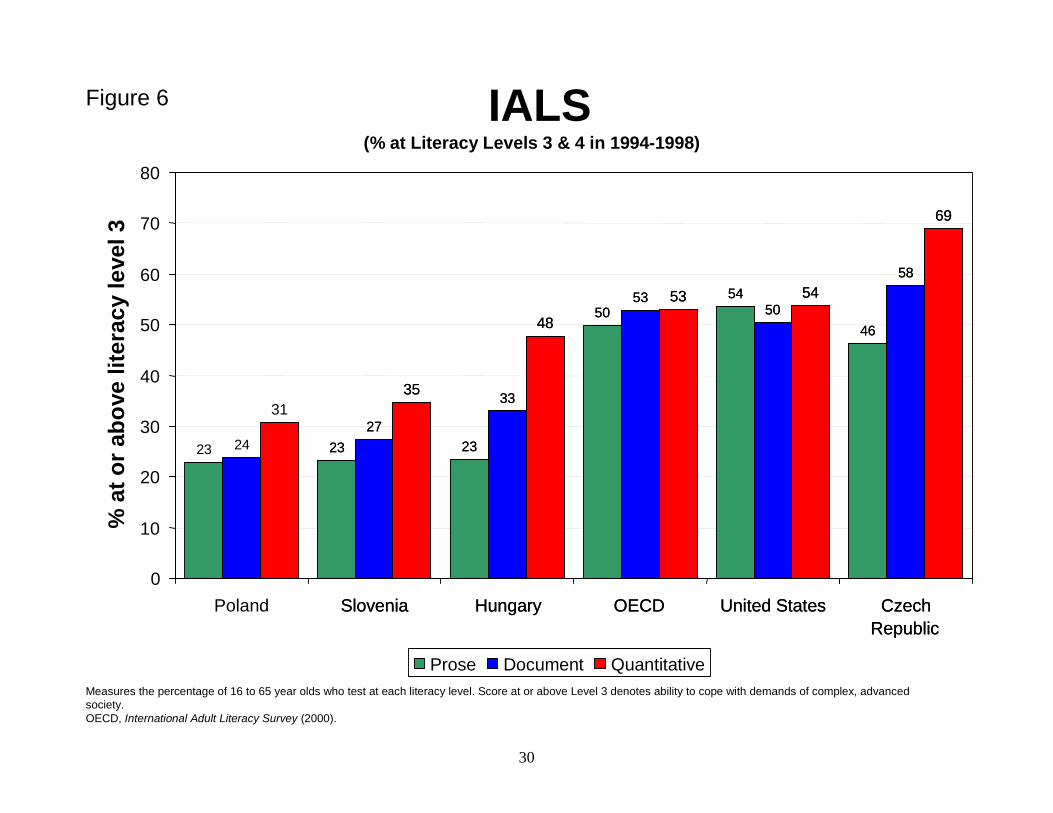
Measures the percentage of 16 to 65 year olds who test at each literacy level. Score at or above Level 3 denotes ability to cope with demands of complex, advanced society.OECD, International Adult Literacy Survey (2000).
IALS(% at Literacy Levels 3 & 4 in 1994-1998)
23 24
31
0
10
20
30
40
50
60
70
80
Poland
2327
35
Slovenia
2327
35
Slovenia
23
33
48
Hungary
23
33
48
Hungary
5053 53
OECD
5053 53
OECD
5450
54
United States
5450
54
United States
46
58
69
CzechRepublic
46
58
69
CzechRepublic
% a
t or a
bove
lite
racy
leve
l 3
Prose Document Quantitative
Figure 6
30
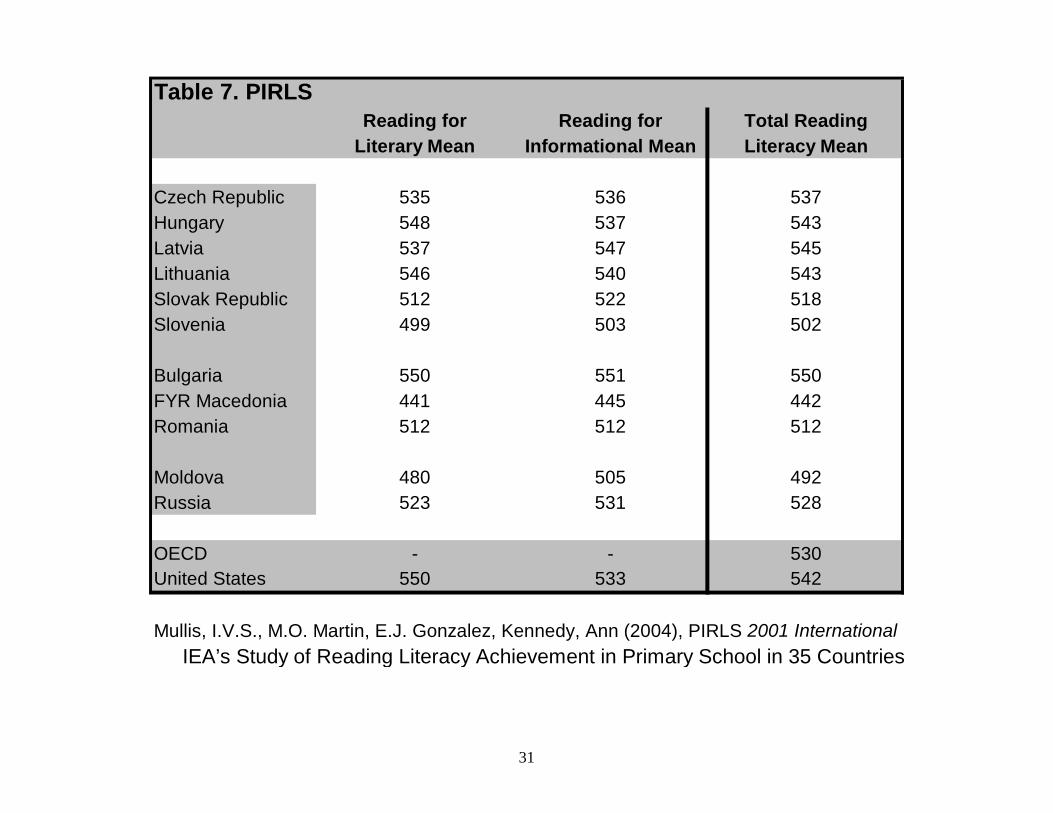
Table 7. PIRLSReading for Reading for Total Reading
Literary Mean Informational Mean Literacy Mean
Czech Republic 535 536 537Hungary 548 537 543Latvia 537 547 545Lithuania 546 540 543Slovak Republic 512 522 518Slovenia 499 503 502
Bulgaria 550 551 550FYR Macedonia 441 445 442Romania 512 512 512
Moldova 480 505 492Russia 523 531 528
OECD - - 530United States 550 533 542
Mullis, I.V.S., M.O. Martin, E.J. Gonzalez, Kennedy, Ann (2004), PIRLS 2001 International IEA’s Study of Reading Literacy Achievement in Primary School in 35 Countries
31
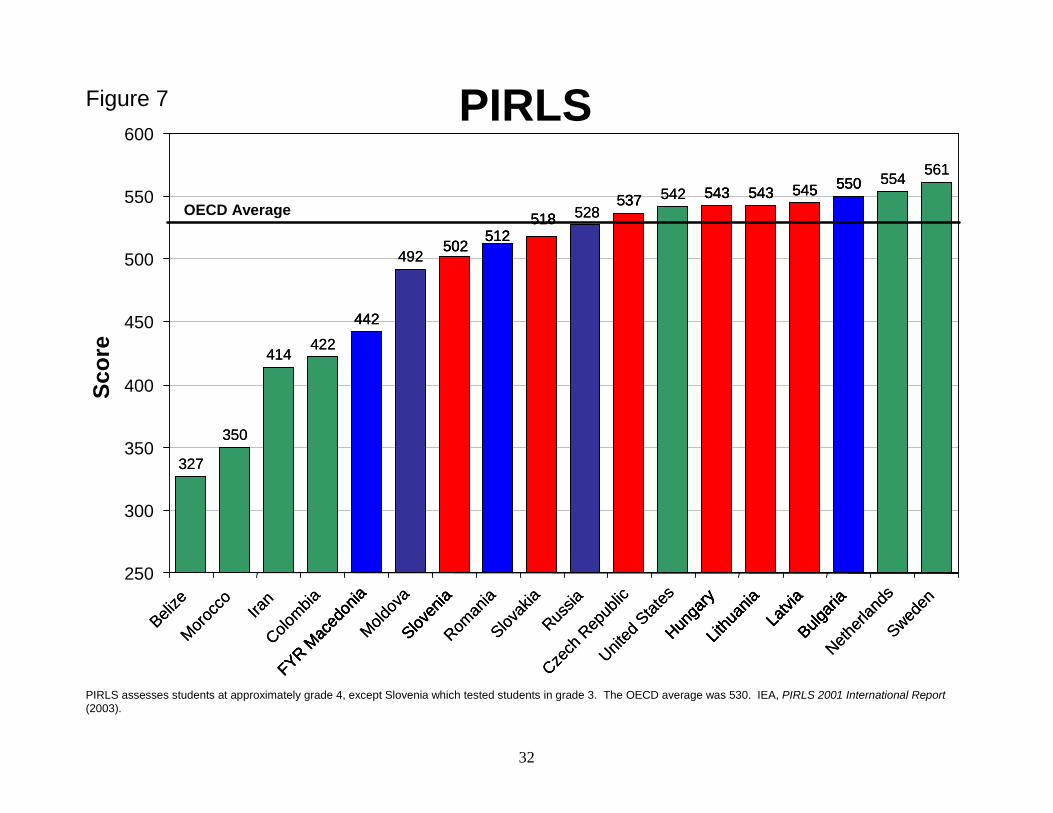
PIRLS assesses students at approximately grade 4, except Slovenia which tested students in grade 3. The OECD average was 530. IEA, PIRLS 2001 International Report(2003).
PIRLS
250
300
350
400
450
500
550
600
327
350
414422
Belize
Morocc
o
Iran
Colombia
327
350
414422
Belize
Morocc
o
Iran
Colombia
492
528
Moldov
a
Russia
492
528
Moldov
a
Russia
Slovak
iaCze
ch R
epub
lic
537 543 543 545
502
518
Sloven
ia
Hunga
ryLit
huan
iaLa
tvia
Slovak
iaCze
ch R
epub
lic
537 543 543 545
502
518
Sloven
ia
Hunga
ryLit
huan
iaLa
tvia
537 543 543 545
502
518
Sloven
ia
Hunga
ryLit
huan
iaLa
tvia
Sloven
ia
Hunga
ryLit
huan
iaLa
tvia
Roman
ia
442
550
512
FYR Mac
edon
ia
Bulgari
a
Roman
ia
442
550
512
FYR Mac
edon
ia
Bulgari
a
442
550
512
FYR Mac
edon
ia
Bulgari
a
FYR Mac
edon
ia
Bulgari
a542
554 561
United
Stat
es
Netherl
ands
Sweden
542554 561
United
Stat
es
Netherl
ands
Sweden
Scor
e
OECD Average
Figure 7
32
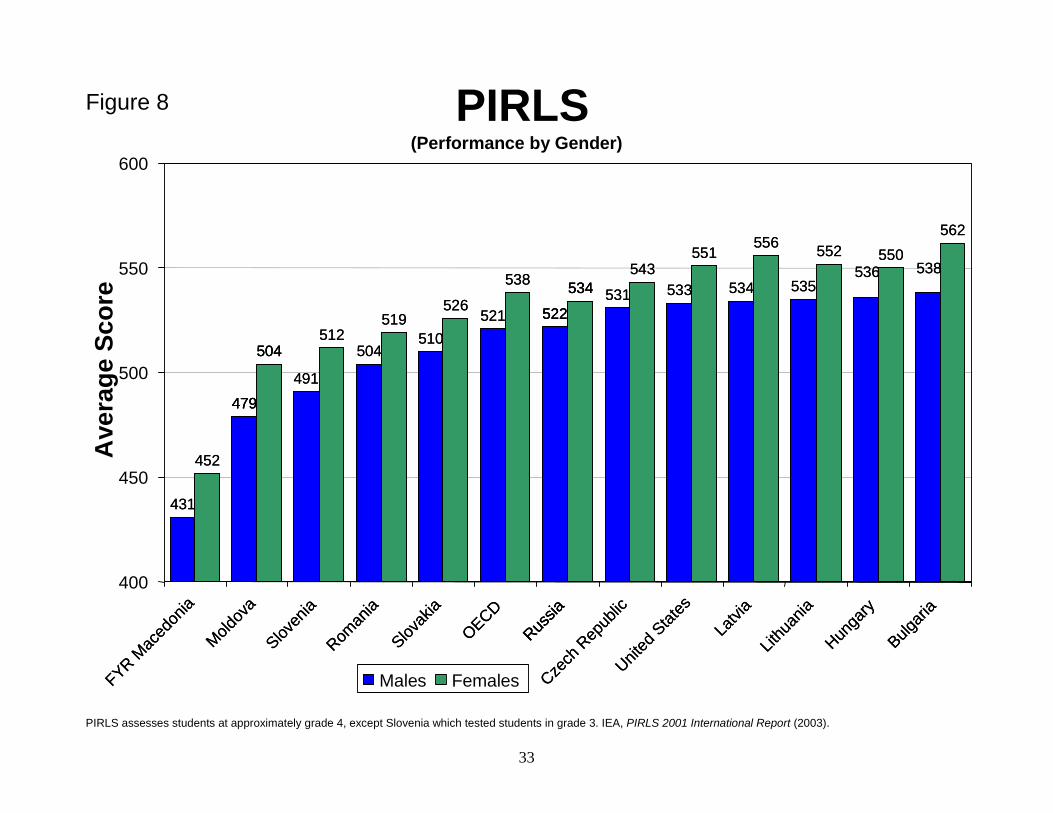
PIRLS assesses students at approximately grade 4, except Slovenia which tested students in grade 3. IEA, PIRLS 2001 International Report (2003).
PIRLS(Performance by Gender)
400
450
500
550
600
Moldov
a
479
522
504
534
Russia
Moldov
a
479
522
504
534
Russia
479
522
504
534
Russia
521
533538
551
OECD
United
Stat
es
521
533538
551
OECD
United
Stat
es491
510
531 534 535
512
526
543
556 552 550536
Sloven
ia
Slovak
ia
Czech
Rep
ublic
Latvi
aLit
huan
iaHun
gary
491
510
531 534 535
512
526
543
556 552 550536
Sloven
ia
Slovak
ia
Czech
Rep
ublic
Latvi
aLit
huan
iaHun
gary
431
504
452
519
562
538
FYR Mac
edon
ia
Roman
ia
Bulgari
a
431
504
452
519
562
538
FYR Mac
edon
ia
Roman
ia
Bulgari
aA
vera
ge S
core
Males Females
Figure 8
33
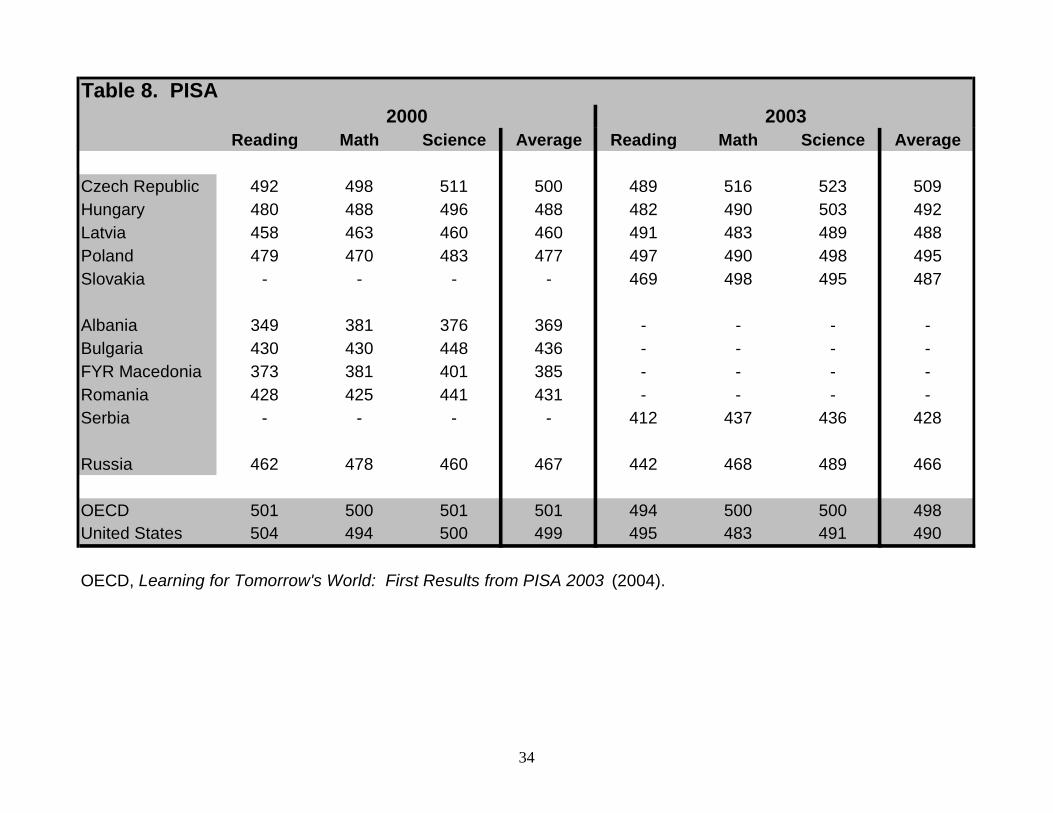
Reading Math Science Average Reading Math Science Average
Czech Republic 492 498 511 500 489 516 523 509Hungary 480 488 496 488 482 490 503 492Latvia 458 463 460 460 491 483 489 488Poland 479 470 483 477 497 490 498 495Slovakia - - - - 469 498 495 487
Albania 349 381 376 369 - - - -Bulgaria 430 430 448 436 - - - -FYR Macedonia 373 381 401 385 - - - -Romania 428 425 441 431 - - - -Serbia - - - - 412 437 436 428
Russia 462 478 460 467 442 468 489 466
OECD 501 500 501 501 494 500 500 498United States 504 494 500 499 495 483 491 490
OECD, Learning for Tomorrow's World: First Results from PISA 2003 (2004).
Table 8. PISA2000 2003
34
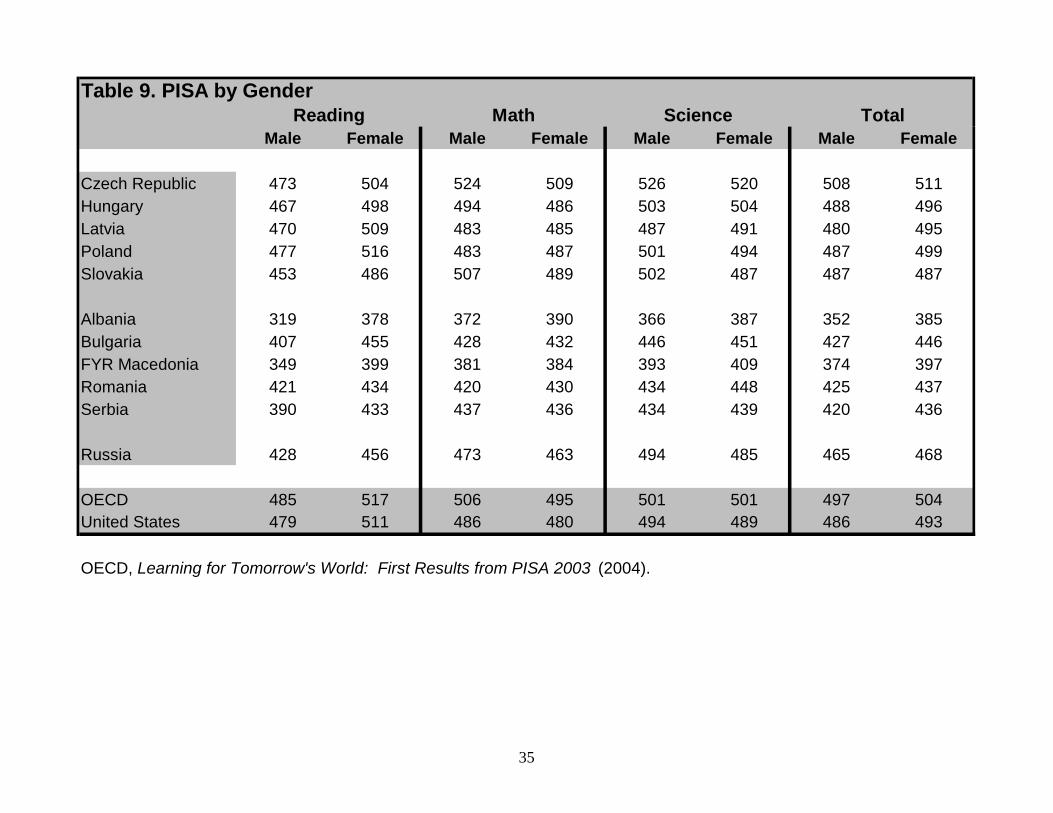
Male Female Male Female Male Female Male Female
Czech Republic 473 504 524 509 526 520 508 511Hungary 467 498 494 486 503 504 488 496Latvia 470 509 483 485 487 491 480 495Poland 477 516 483 487 501 494 487 499Slovakia 453 486 507 489 502 487 487 487
Albania 319 378 372 390 366 387 352 385Bulgaria 407 455 428 432 446 451 427 446FYR Macedonia 349 399 381 384 393 409 374 397Romania 421 434 420 430 434 448 425 437Serbia 390 433 437 436 434 439 420 436
Russia 428 456 473 463 494 485 465 468
OECD 485 517 506 495 501 501 497 504United States 479 511 486 480 494 489 486 493
OECD, Learning for Tomorrow's World: First Results from PISA 2003 (2004).
Table 9. PISA by GenderReading Math Science Total
35
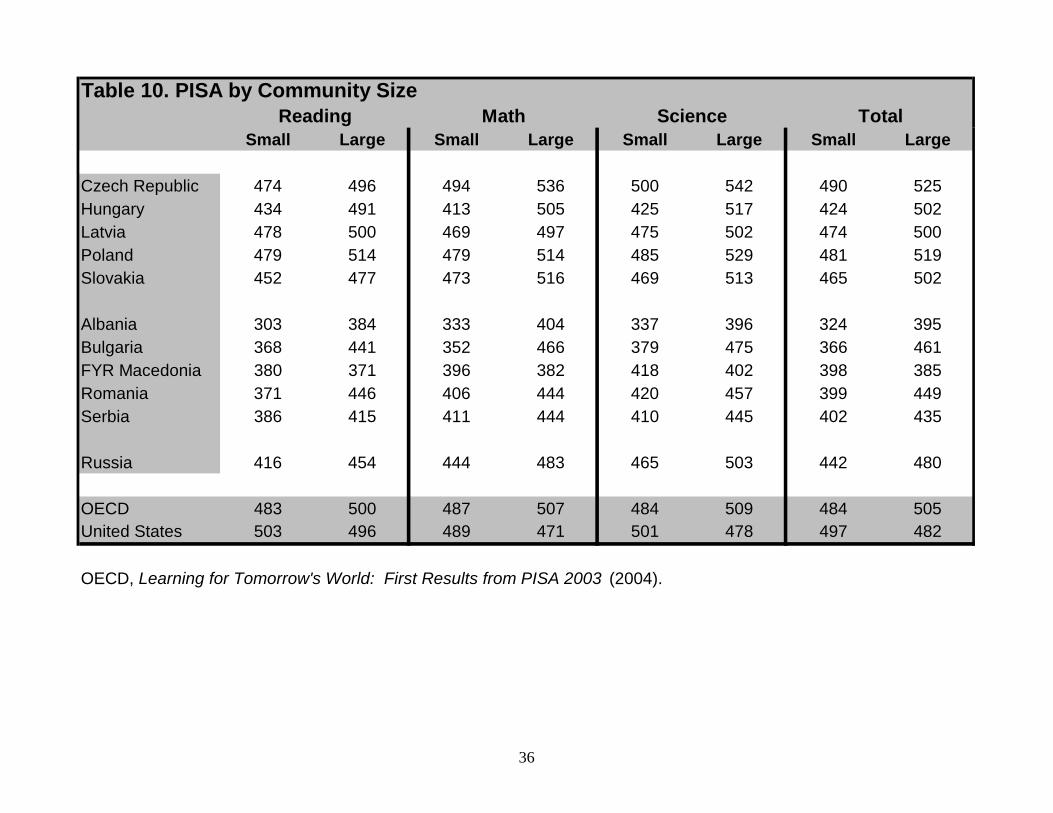
Small Large Small Large Small Large Small Large
Czech Republic 474 496 494 536 500 542 490 525Hungary 434 491 413 505 425 517 424 502Latvia 478 500 469 497 475 502 474 500Poland 479 514 479 514 485 529 481 519Slovakia 452 477 473 516 469 513 465 502
Albania 303 384 333 404 337 396 324 395Bulgaria 368 441 352 466 379 475 366 461FYR Macedonia 380 371 396 382 418 402 398 385Romania 371 446 406 444 420 457 399 449Serbia 386 415 411 444 410 445 402 435
Russia 416 454 444 483 465 503 442 480
OECD 483 500 487 507 484 509 484 505United States 503 496 489 471 501 478 497 482
OECD, Learning for Tomorrow's World: First Results from PISA 2003 (2004).
Table 10. PISA by Community SizeReading Math Science Total
36
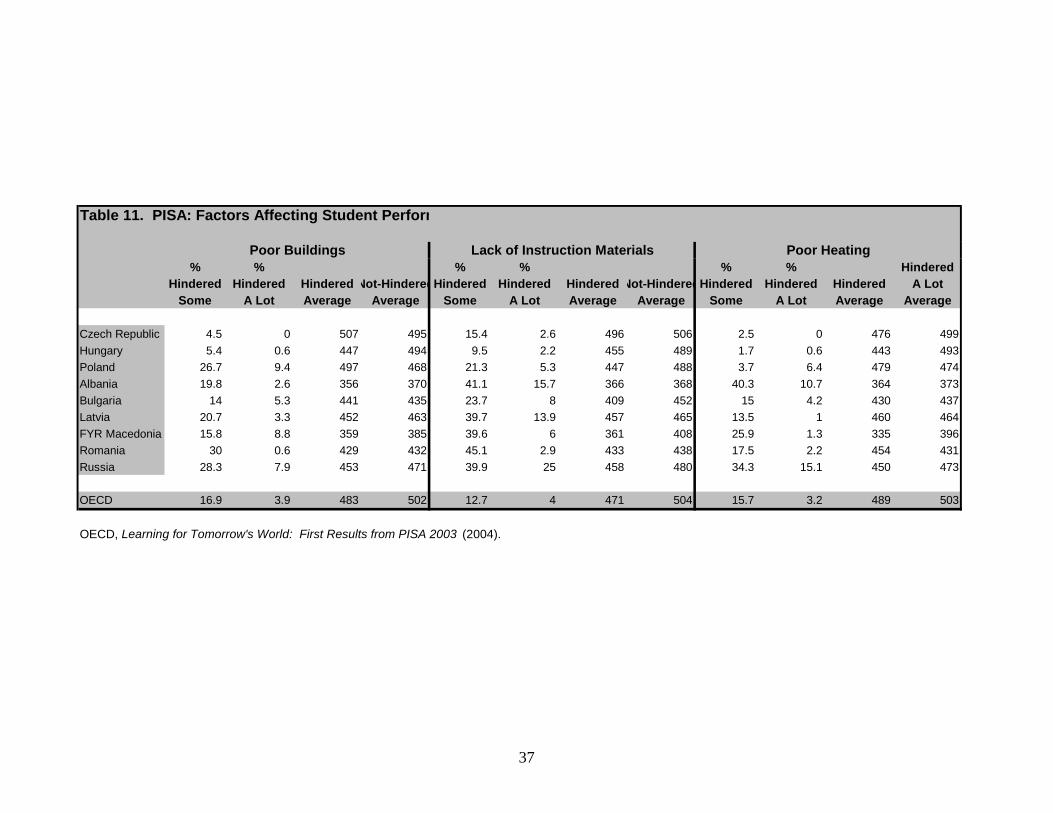
% % % % % % HinderedHindered Hindered Hindered Not-HinderedHindered Hindered Hindered Not-HinderedHindered Hindered Hindered A Lot
Some A Lot Average Average Some A Lot Average Average Some A Lot Average Average
Czech Republic 4.5 0 507 495 15.4 2.6 496 506 2.5 0 476 499Hungary 5.4 0.6 447 494 9.5 2.2 455 489 1.7 0.6 443 493Poland 26.7 9.4 497 468 21.3 5.3 447 488 3.7 6.4 479 474Albania 19.8 2.6 356 370 41.1 15.7 366 368 40.3 10.7 364 373Bulgaria 14 5.3 441 435 23.7 8 409 452 15 4.2 430 437Latvia 20.7 3.3 452 463 39.7 13.9 457 465 13.5 1 460 464FYR Macedonia 15.8 8.8 359 385 39.6 6 361 408 25.9 1.3 335 396Romania 30 0.6 429 432 45.1 2.9 433 438 17.5 2.2 454 431Russia 28.3 7.9 453 471 39.9 25 458 480 34.3 15.1 450 473
OECD 16.9 3.9 483 502 12.7 4 471 504 15.7 3.2 489 503
OECD, Learning for Tomorrow's World: First Results from PISA 2003 (2004).
Table 11. PISA: Factors Affecting Student Perform
Poor Buildings Lack of Instruction Materials Poor Heating
37
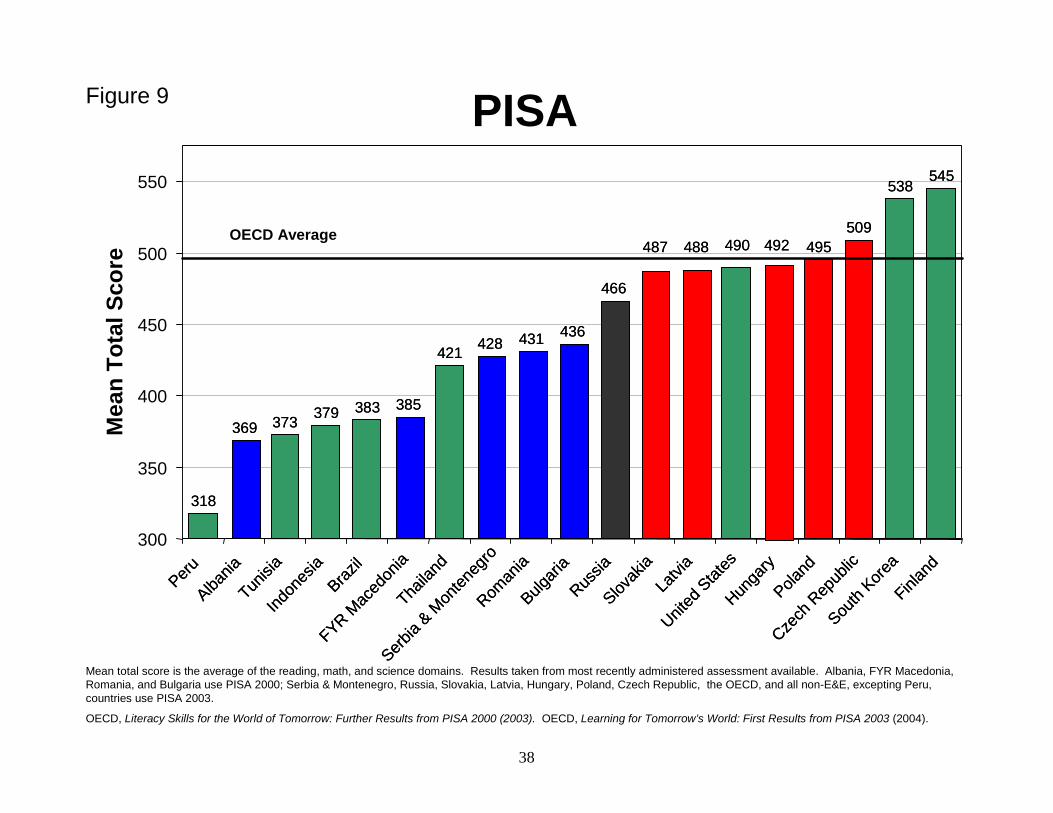
Mean total score is the average of the reading, math, and science domains. Results taken from most recently administered assessment available. Albania, FYR Macedonia, Romania, and Bulgaria use PISA 2000; Serbia & Montenegro, Russia, Slovakia, Latvia, Hungary, Poland, Czech Republic, the OECD, and all non-E&E, excepting Peru, countries use PISA 2003.
OECD, Literacy Skills for the World of Tomorrow: Further Results from PISA 2000 (2003). OECD, Learning for Tomorrow’s World: First Results from PISA 2003 (2004).
OECD Average
PISA
300
350
400
450
500
550
369385
428 431 436
Albania
FYR Mac
edon
iaSerb
ia & M
onten
egro
Roman
iaBulg
aria
369385
428 431 436
Albania
FYR Mac
edon
iaSerb
ia & M
onten
egro
Roman
iaBulg
aria
466
Russia
466
Russia
495509
487 488 492
Slovak
iaLa
tvia
Hunga
ryPola
nd
Czech
Rep
ublic
495509
487 488 492
Slovak
iaLa
tvia
Hunga
ryPola
nd
Czech
Rep
ublic
318
373 379 383
421
Peru
Tunisi
aInd
ones
iaBraz
il
Thaila
nd
318
373 379 383
421
Peru
Tunisi
aInd
ones
iaBraz
il
Thaila
nd
538545
490
United
Stat
es
South
Korea
Finlan
d
538545
490
United
Stat
es
South
Korea
Finlan
dM
ean
Tota
l Sco
reFigure 9
38
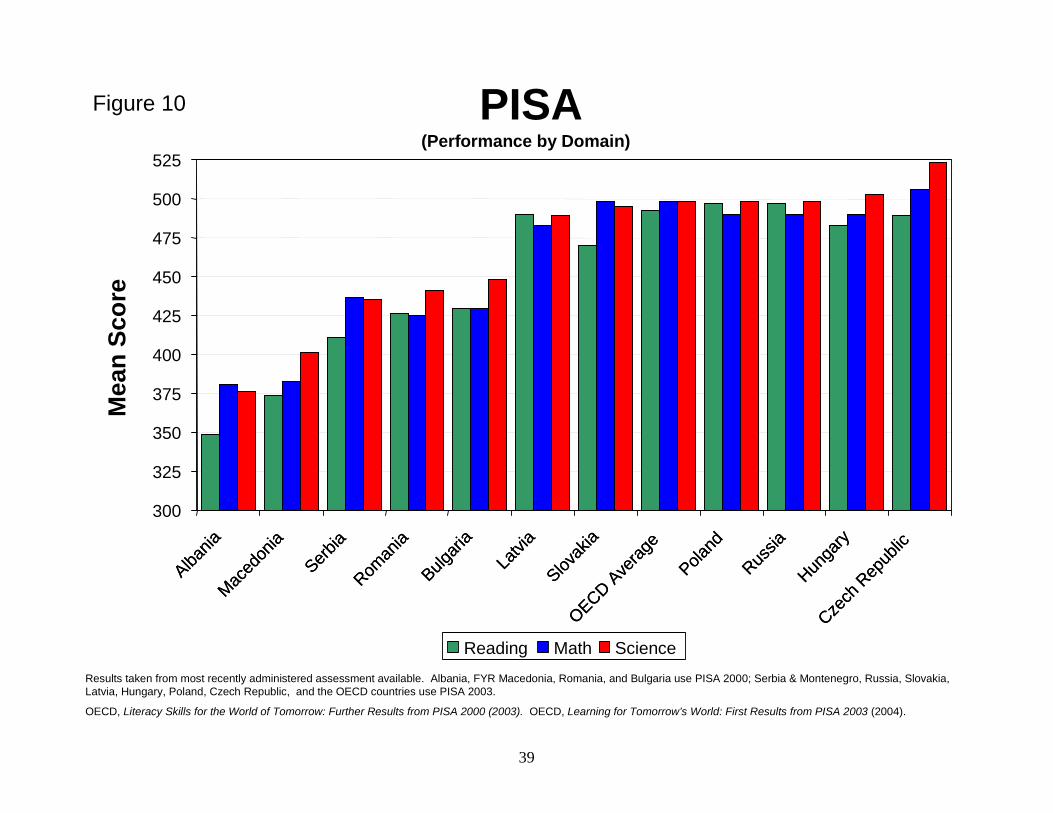
Results taken from most recently administered assessment available. Albania, FYR Macedonia, Romania, and Bulgaria use PISA 2000; Serbia & Montenegro, Russia, Slovakia, Latvia, Hungary, Poland, Czech Republic, and the OECD countries use PISA 2003.
OECD, Literacy Skills for the World of Tomorrow: Further Results from PISA 2000 (2003). OECD, Learning for Tomorrow’s World: First Results from PISA 2003 (2004).
PISA(Performance by Domain)
300
325
350
375
400
425
450
475
500
525
Albania
Maced
onia
Serbia
Roman
iaBulg
aria
Albania
Maced
onia
Serbia
Roman
iaBulg
aria
OECD Ave
rage
OECD Ave
rage
Russia
Russia
Latvi
aSlov
akia
Poland
Hunga
ryCze
ch R
epub
lic
Latvi
aSlov
akia
Poland
Hunga
ryCze
ch R
epub
licM
ean
Scor
e
Reading Math Science
Figure 10
39
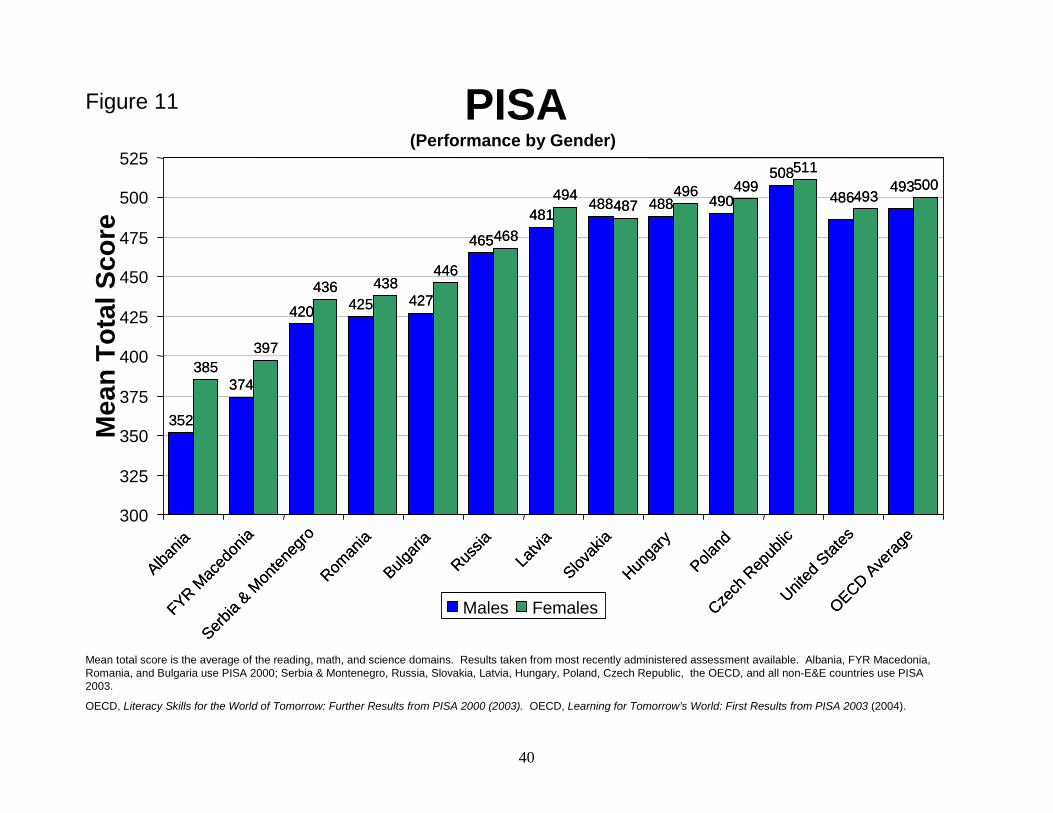
Mean total score is the average of the reading, math, and science domains. Results taken from most recently administered assessment available. Albania, FYR Macedonia, Romania, and Bulgaria use PISA 2000; Serbia & Montenegro, Russia, Slovakia, Latvia, Hungary, Poland, Czech Republic, the OECD, and all non-E&E countries use PISA 2003.
OECD, Literacy Skills for the World of Tomorrow: Further Results from PISA 2000 (2003). OECD, Learning for Tomorrow’s World: First Results from PISA 2003 (2004).
PISA(Performance by Gender)
300
325
350
375
400
425
450
475
500
525
352
374
420 425 427
385397
436 438446
Albania
FYR Mac
edon
ia
Serbia
& Mon
teneg
roRom
ania
Bulgari
a
352
374
420 425 427
385397
436 438446
Albania
FYR Mac
edon
ia
Serbia
& Mon
teneg
roRom
ania
Bulgari
a
465468
Russia
465468
Russia
481488 488 490494
487496 499
Latvi
aSlov
akia
Hunga
ry
Poland
481488 488 490494
487496 499
Latvi
aSlov
akia
Hunga
ry
Poland
508511
Czech
Rep
ublic
508511
Czech
Rep
ublic
493500
486493
United
Stat
esOECD A
verag
e
493500
486493
United
Stat
esOECD A
verag
e
Mea
n To
tal S
core
Males Females
Figure 11
40
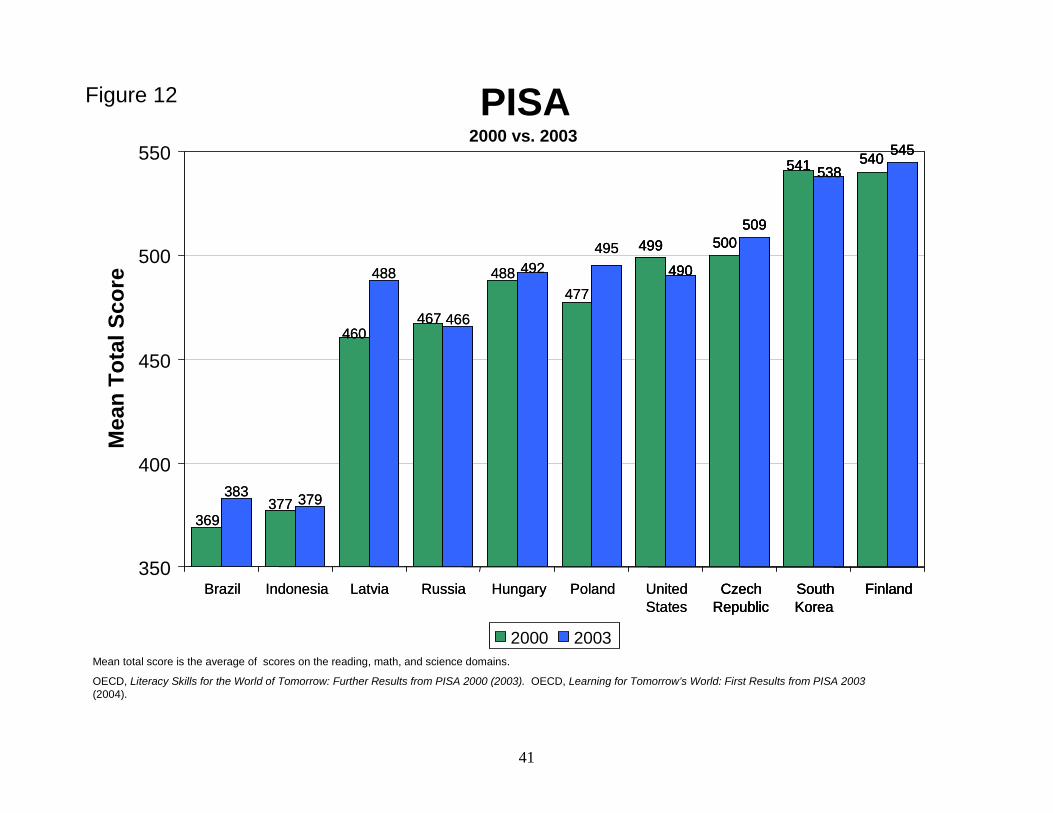
Mean total score is the average of scores on the reading, math, and science domains.
OECD, Literacy Skills for the World of Tomorrow: Further Results from PISA 2000 (2003). OECD, Learning for Tomorrow’s World: First Results from PISA 2003 (2004).
PISA2000 vs. 2003
350
400
450
500
550
377369
379383
Brazil Indonesia
377369
379383
Brazil Indonesia
467 466
Russia
467 466
Russia
477488
460
495492488
Latvia Hungary Poland
500509
CzechRepublic
477488
460
495492488
Latvia Hungary Poland
500509
CzechRepublic
500509
CzechRepublic
UnitedStates
499
545540541 538
490
SouthKorea
FinlandUnitedStates
499
545540541 538
490
SouthKorea
Finland
499
545540541 538
490
SouthKorea
Finland
Mea
n To
tal S
core
2000 2003
Figure 12
41
PISA(Performance by Community Size)
324
366
398 399 402
424
442
465474
481 484
395
461
385
449
435
502
480
502 500
519
505
525
482
497490
300
325
350
375
400
425
450
475
500
525
550
Albania
Bulgari
aFYR M
aced
onia
Roman
ia
Serbia
& Mon
teneg
roHun
gary
Russia
Slovak
ia
Latvi
aPola
ndOECD A
verag
eCze
ch R
epub
licUnit
ed Stat
es
Mea
n To
tal S
core
Small Large
Small community defined by population less than 15,000; Large community defined by population more than 15,000. Mean total score is the average of the reading, math, and science domains. Results taken from most recently administered assessment available. Albania, FYR Macedonia, Romania, and Bulgaria use PISA 2000; Serbia & Montenegro, Russia, Slovakia, Latvia, Hungary, Poland, Czech Republic, the OECD, and all the US countries use PISA 2003.
OECD, Literacy Skills for the World of Tomorrow: Further Results from PISA 2000 (2003). OECD, Learning for Tomorrow’s World: First Results from PISA 2003 (2004).
Figure 13
42
3.7
13.5 15.7 15 17.5
25.9
34.340.3
6.4
3.2 4.22.2
15.110.7
2.52.3
0
10
20
30
40
50
60
Hunga
ryCze
ch R
epub
lic
Poland
Latvi
aOECD A
verag
e
Bulgari
aRom
ania
FYR Mac
edon
ia
Russia
Albania
% S
tude
nts
Hin
dere
d
Hindered A Lot
Hindered Somewhat
10.1
49.4
27.2
19.719.218.914.5
51.0
Data collected from school questionnaire distributed in conjunction with student assessment. Schools asked the question: “In your school, how much is the learning of 15-year-old-students hindered by poor heating, cooling, and/or lighting systems?”
OECD, Learning for Tomorrow’s World: First Results from PISA 2003 (2004). Data generated from http://pisaweb.acer.edu.au/oecd/oecd_pisa_data.html.
PISA (% Students Hindered by Poor Heating, Cooling, and/or lighting systems)
Figure 14
43
PISA (Performance by Adequacy of Heating/Cooling/Lighting Systems)
493499
474464
503
437431
396
473
373
443
476 479
460
489
430
454
335
450
364
325
375
425
475
525
Hunga
ryCze
ch R
epub
lic
Poland
Latvi
aOECD A
verag
e
Bulgari
aRom
ania
FYR Mac
edon
ia
Russia
Albania
Mea
n To
tal S
core
Non-Hindered HinderedHigher % of Hindered Students
Non-hindered includes students where, according to school surveys, learning is affected by poor heating/cooling/lighting systems either not at all or a little; hindered includes those students where learning is affected either some or a lot. OECD, Learning for Tomorrow’s World: First Results from PISA 2003 (2004). Data generated from http://pisaweb.acer.edu.au/oecd/oecd_pisa_data.html.
Figure 15
44
PISA (% Students Hindered by Lack of Instruction Materials)
9.5 12.7 15.421.3 23.7
39.645.1
39.7 41.1 39.9
4
5.38
613.9
15.725
0
10
20
30
40
50
60
70
Hunga
ryOECD A
verag
eCze
ch R
epub
lic
Poland
Bulgari
aFYR M
aced
onia
Roman
ia
Latvi
a
Albania
Russia
% S
tude
nts
Hin
dere
d
Hindered A LotHindered Somewhat
64.956.853.6
48.045.6
31.726.6
18.016.711.7
Data collected from school questionnaire distributed in conjunction with student assessment. Schools asked the question: “In your school, how much is the learning of 15-year-old-students hindered by lack of instructional material (e.g. textbooks)?”
OECD, Learning for Tomorrow’s World: First Results from PISA 2003 (2004). Data generated from http://pisaweb.acer.edu.au/oecd/oecd_pisa_data.html.
Figure 16
45
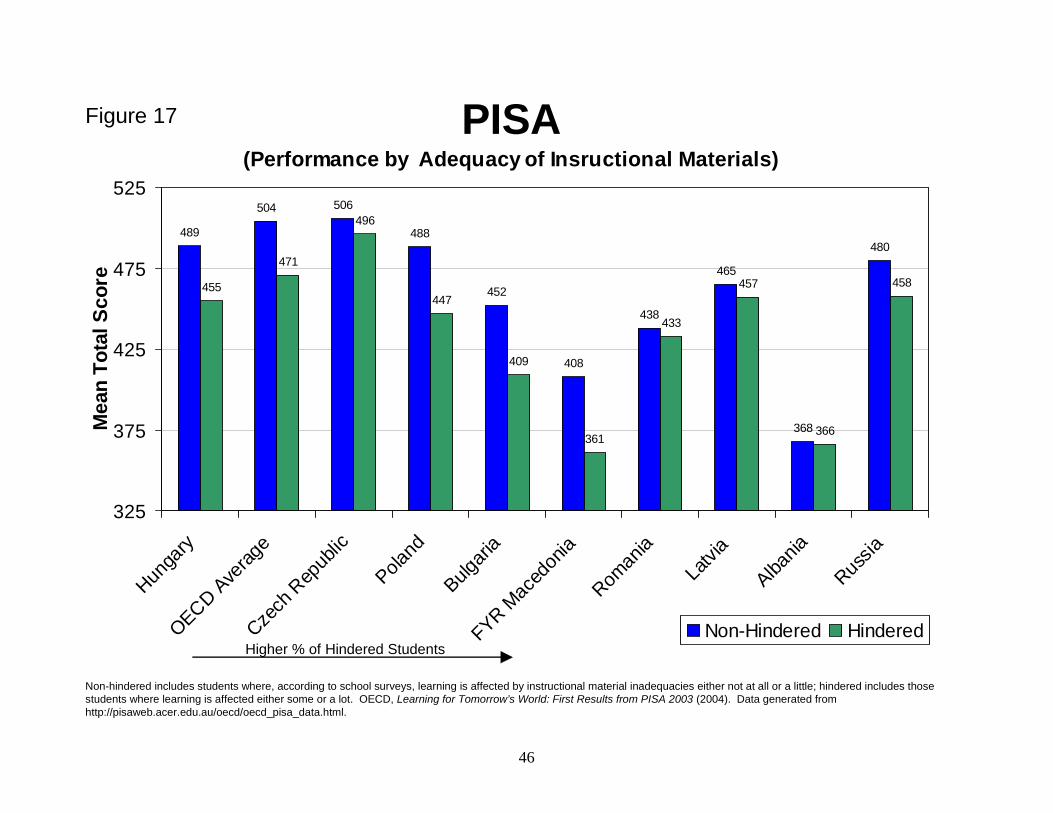
PISA (Performance by Adequacy of Insructional Materials)
489
504 506
488
452
408
438
465
368
480
455
471
496
447
409
361
433
457
366
458
325
375
425
475
525
Hunga
ryOECD A
verag
eCze
ch R
epub
lic
Poland
Bulgari
aFYR M
aced
onia
Roman
ia
Latvi
a
Albania
Russia
Mea
n To
tal S
core
Non-Hindered Hindered
Non-hindered includes students where, according to school surveys, learning is affected by instructional material inadequacies either not at all or a little; hindered includes those students where learning is affected either some or a lot. OECD, Learning for Tomorrow’s World: First Results from PISA 2003 (2004). Data generated from http://pisaweb.acer.edu.au/oecd/oecd_pisa_data.html.
Higher % of Hindered Students
Figure 17
46
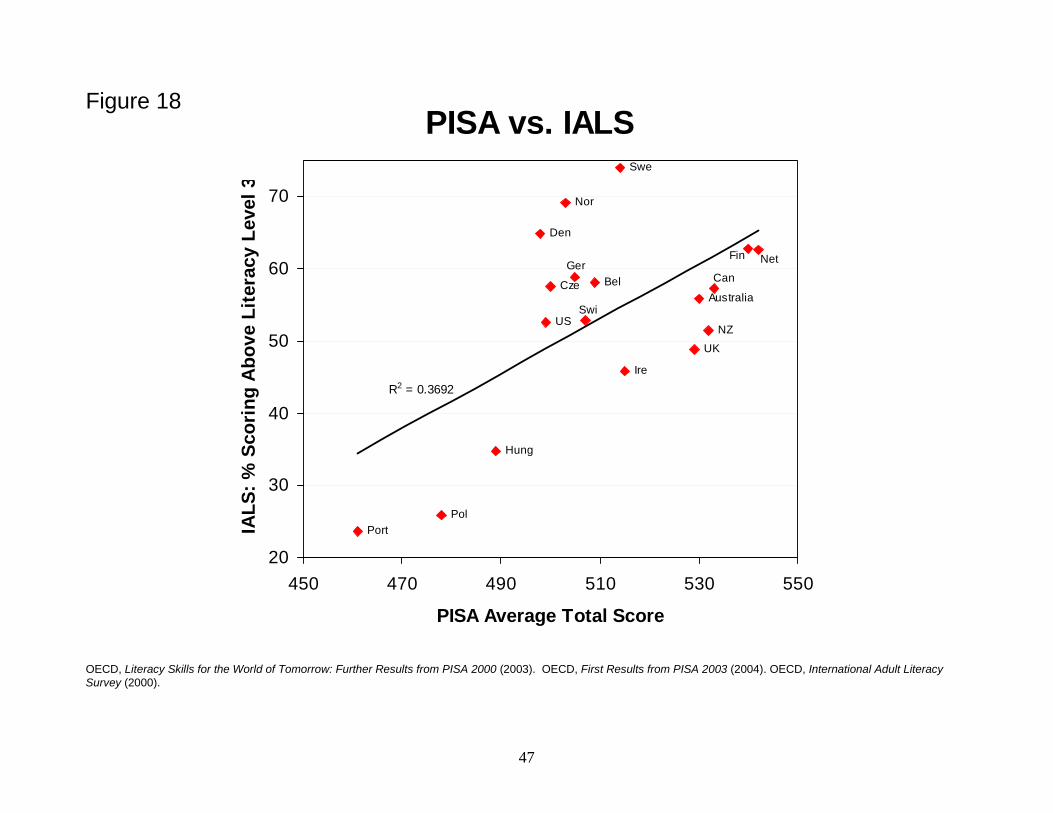
PISA vs. IALS
Fin Net
Australia
NZUK
BelGer
Cze
SwiUS
Ire
Hung
PolPort
Den
Nor
Swe
Can
R2 = 0.3692
20
30
40
50
60
70
450 470 490 510 530 550
PISA Average Total Score
IALS
: % S
cori
ng A
bove
Lite
racy
Lev
el 3
OECD, Literacy Skills for the World of Tomorrow: Further Results from PISA 2000 (2003). OECD, First Results from PISA 2003 (2004). OECD, International Adult Literacy Survey (2000).
Figure 18
47
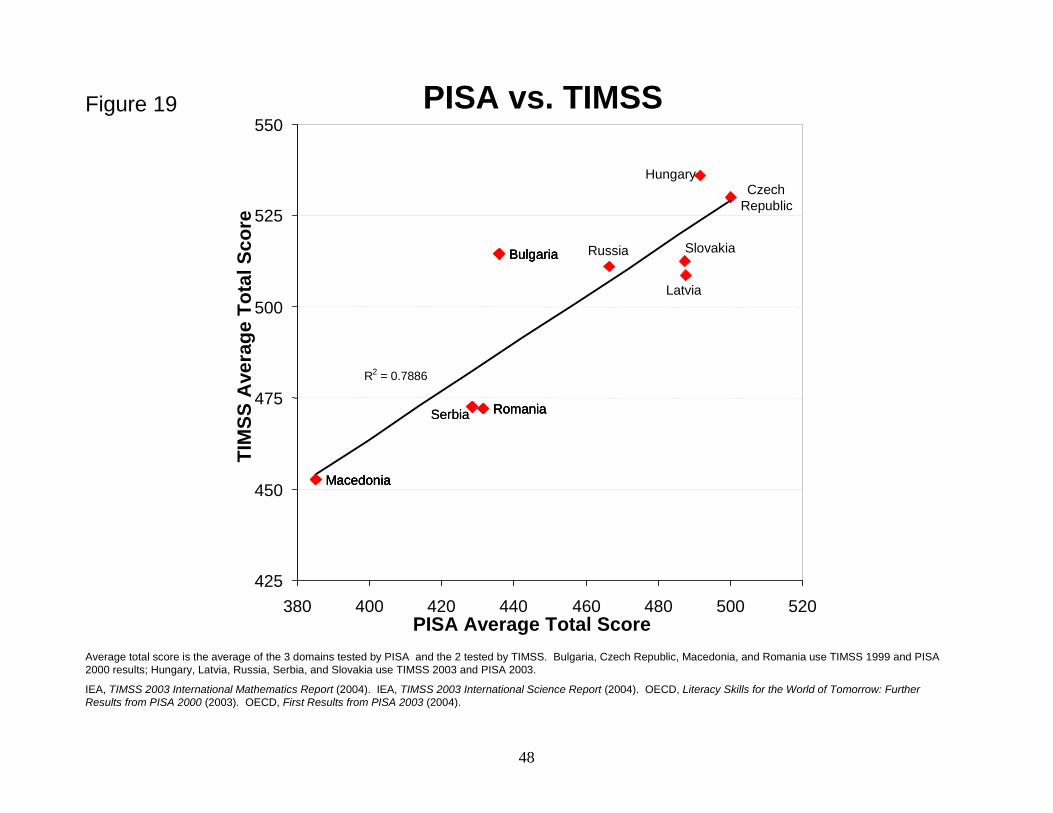
Average total score is the average of the 3 domains tested by PISA and the 2 tested by TIMSS. Bulgaria, Czech Republic, Macedonia, and Romania use TIMSS 1999 and PISA 2000 results; Hungary, Latvia, Russia, Serbia, and Slovakia use TIMSS 2003 and PISA 2003.
IEA, TIMSS 2003 International Mathematics Report (2004). IEA, TIMSS 2003 International Science Report (2004). OECD, Literacy Skills for the World of Tomorrow: Further Results from PISA 2000 (2003). OECD, First Results from PISA 2003 (2004).
PISA vs. TIMSS
CzechRepublic
Slovakia
Latvia
Hungary
Russia
Serbia
Bulgaria
Romania
Macedonia
Serbia
Bulgaria
Romania
Macedonia
Bulgaria
Romania
Macedonia
R2 = 0.7886
425
450
475
500
525
550
380 400 420 440 460 480 500 520PISA Average Total Score
TIM
SS A
vera
ge T
otal
Sco
re
Figure 19
48
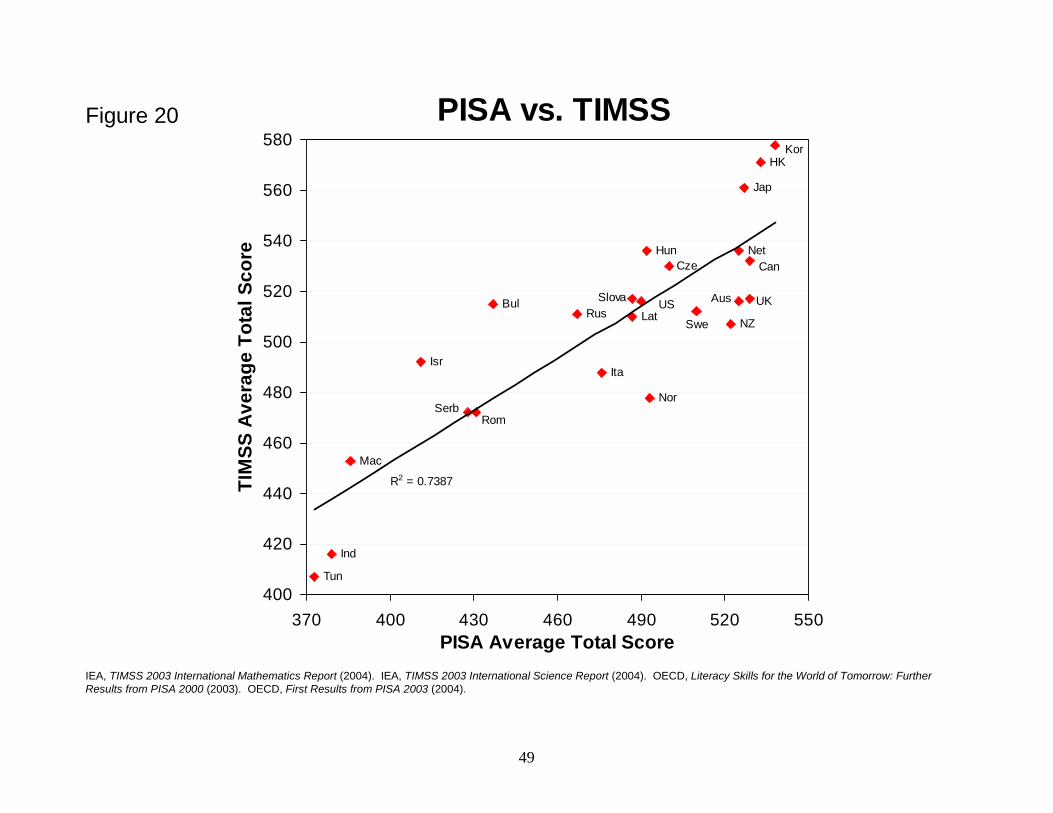
PISA vs. TIMSS
SlovaRus
SerbRom
Mac
Lat
ItaIsr
Tun
Ind
Bul
Nor
Hun
US
Cze
NZSwe
Aus UK
CanNet
Jap
HKKor
R2 = 0.7387
400
420
440
460
480
500
520
540
560
580
370 400 430 460 490 520 550PISA Average Total Score
TIM
SS A
vera
ge T
otal
Sco
re
IEA, TIMSS 2003 International Mathematics Report (2004). IEA, TIMSS 2003 International Science Report (2004). OECD, Literacy Skills for the World of Tomorrow: Further Results from PISA 2000 (2003). OECD, First Results from PISA 2003 (2004).
Figure 20
49
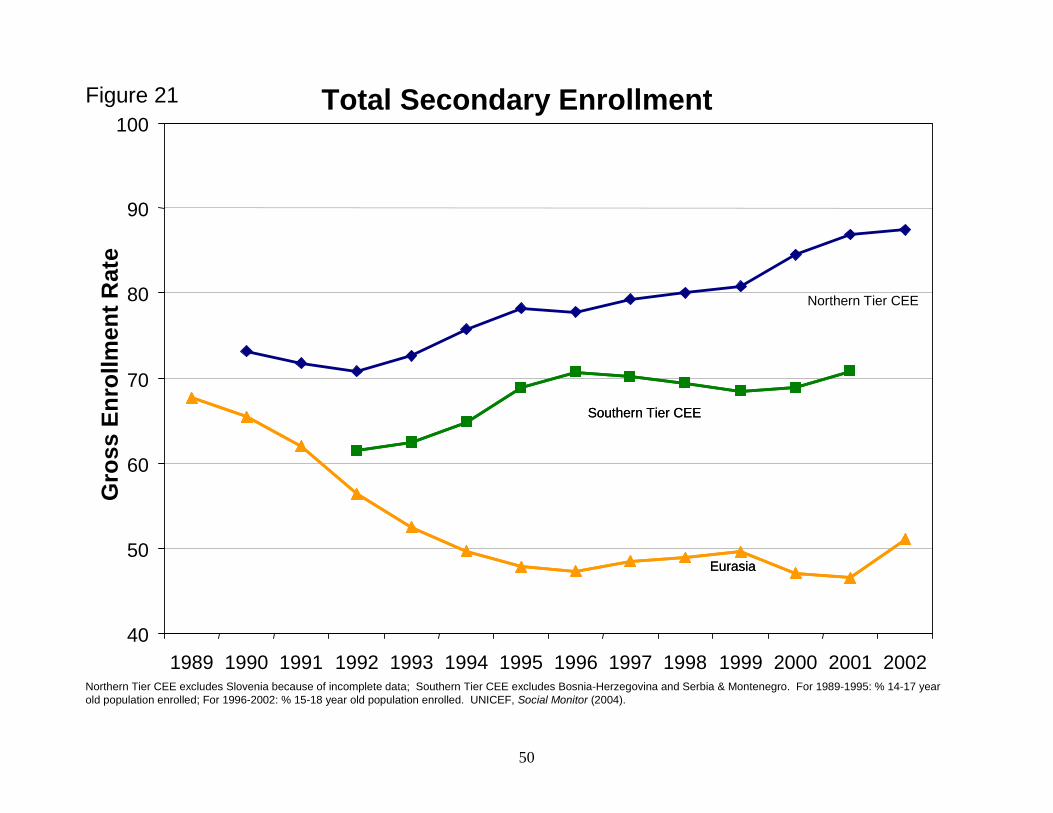
Northern Tier CEE excludes Slovenia because of incomplete data; Southern Tier CEE excludes Bosnia-Herzegovina and Serbia & Montenegro. For 1989-1995: % 14-17 year old population enrolled; For 1996-2002: % 15-18 year old population enrolled. UNICEF, Social Monitor (2004).
Total Secondary Enrollment
40
50
60
70
80
90
100
1989 1990 1991 1992 1993 1994 1995 1996 1997 1998 1999 2000 2001 2002
Gro
ss E
nrol
lmen
t Rat
e
Northern Tier CEE
EurasiaEurasia
Southern Tier CEESouthern Tier CEE
Figure 21
50
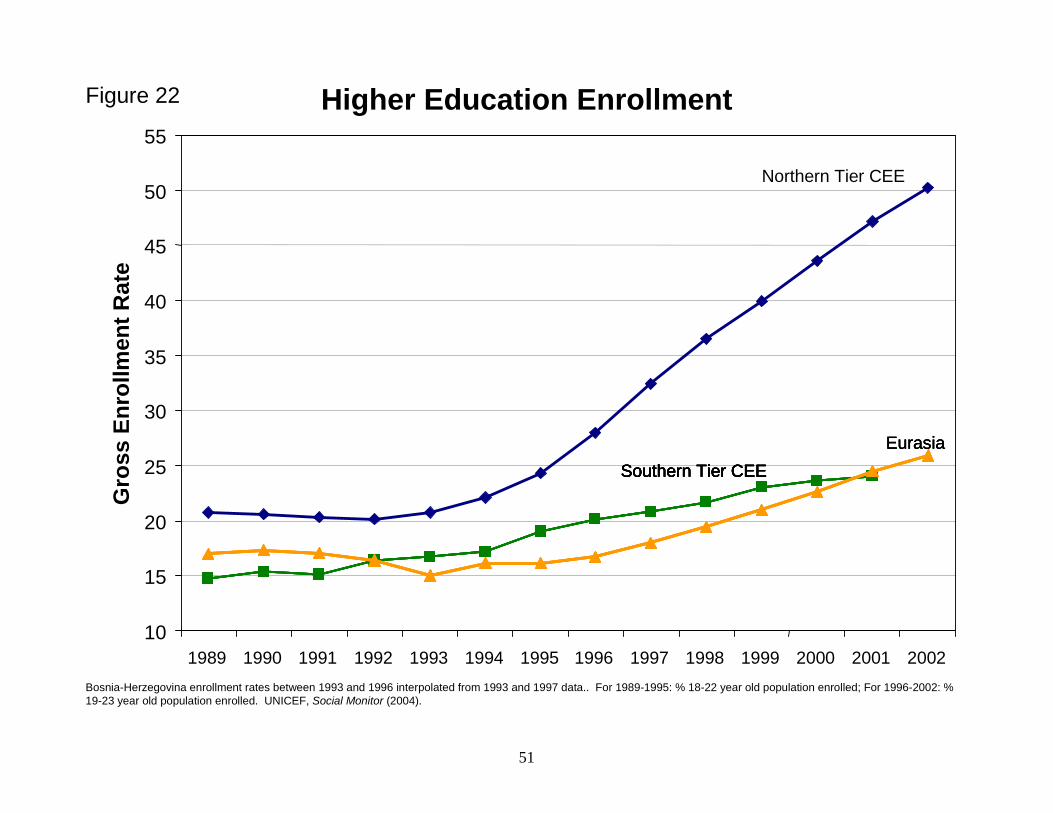
Bosnia-Herzegovina enrollment rates between 1993 and 1996 interpolated from 1993 and 1997 data.. For 1989-1995: % 18-22 year old population enrolled; For 1996-2002: % 19-23 year old population enrolled. UNICEF, Social Monitor (2004).
Higher Education Enrollment
10
15
20
25
30
35
40
45
50
55
1989 1990 1991 1992 1993 1994 1995 1996 1997 1998 1999 2000 2001 2002
Gro
ss E
nrol
lmen
t Rat
e
Southern Tier CEESouthern Tier CEESouthern Tier CEESouthern Tier CEESouthern Tier CEEEurasiaEurasiaEurasia
Northern Tier CEE
Figure 22
51
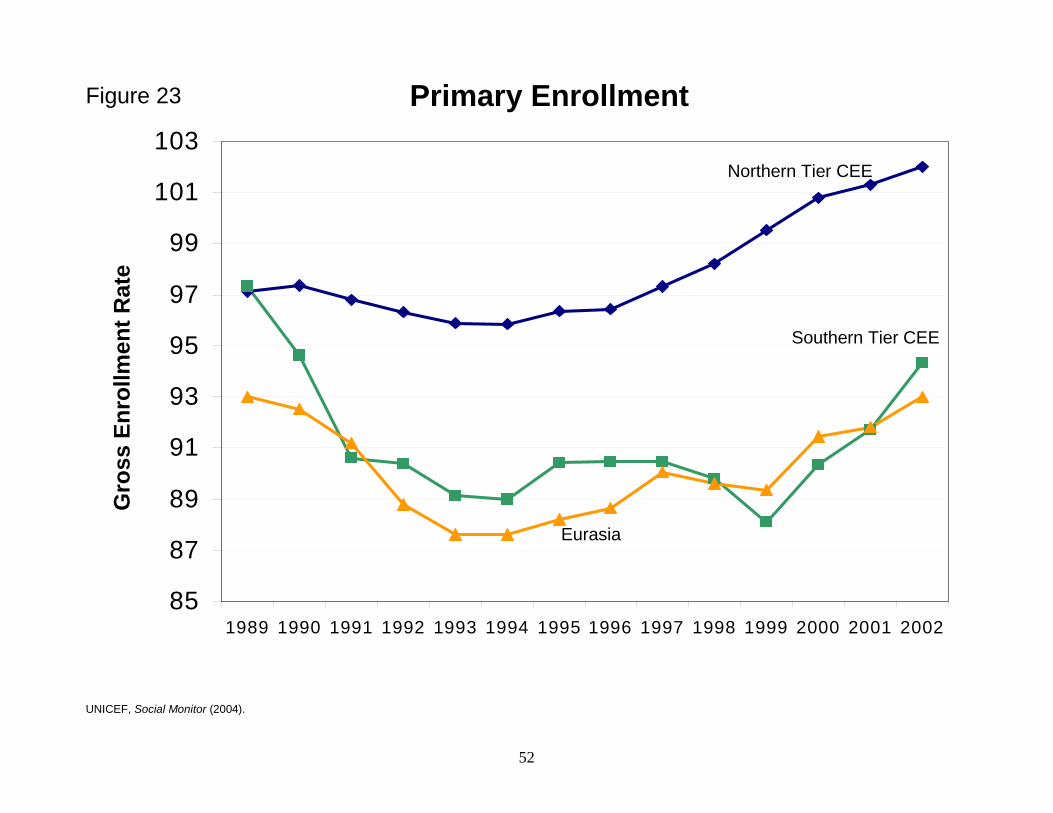
85
87
89
91
93
95
97
99
101
103
1989 1990 1991 1992 1993 1994 1995 1996 1997 1998 1999 2000 2001 2002
UNICEF, Social Monitor (2004).
Primary EnrollmentG
ross
Enr
ollm
ent R
ate
Northern Tier CEE
Figure 23
Southern Tier CEE
Eurasia
52
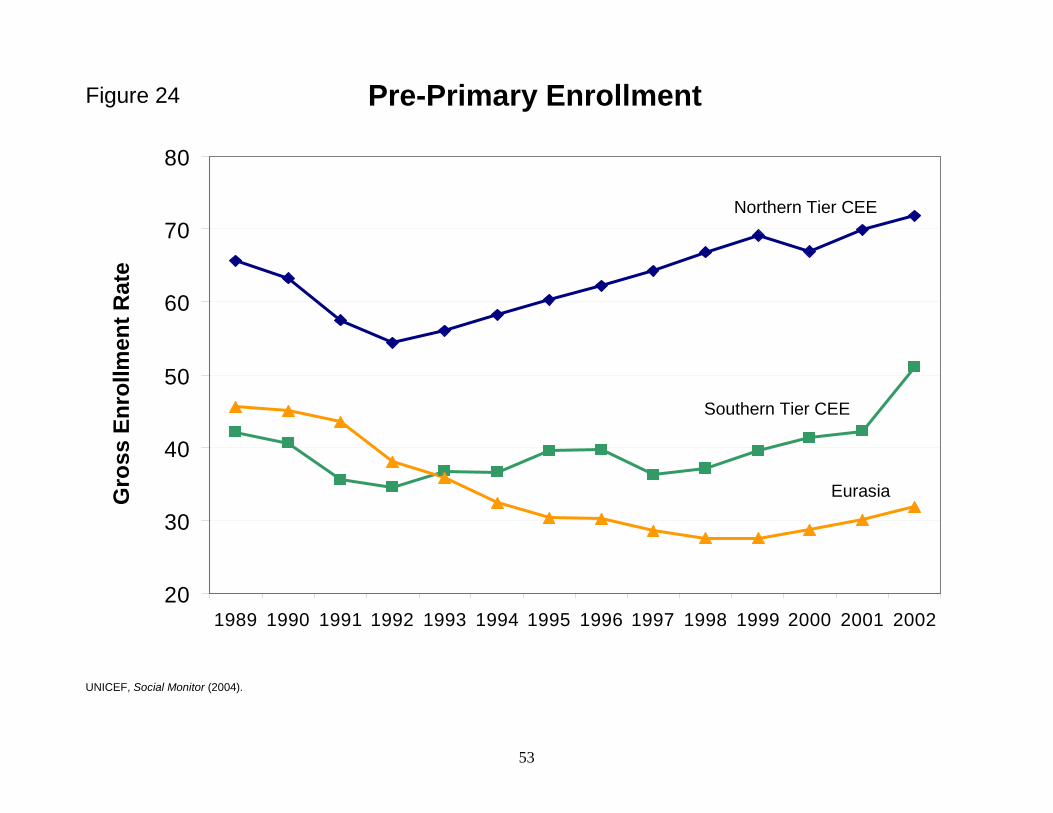
20
30
40
50
60
70
80
1989 1990 1991 1992 1993 1994 1995 1996 1997 1998 1999 2000 2001 2002
UNICEF, Social Monitor (2004).
Pre-Primary EnrollmentG
ross
Enr
ollm
ent R
ate
Northern Tier CEE
Figure 24
Southern Tier CEE
Eurasia
53
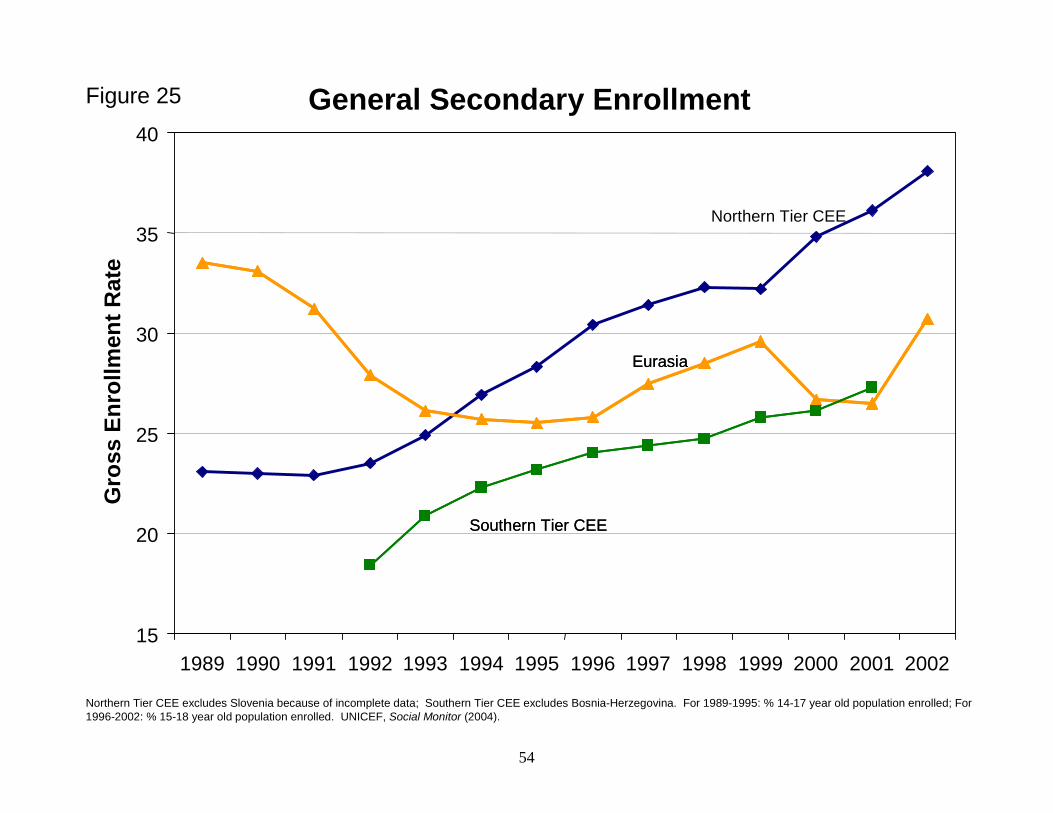
Northern Tier CEE excludes Slovenia because of incomplete data; Southern Tier CEE excludes Bosnia-Herzegovina. For 1989-1995: % 14-17 year old population enrolled; For 1996-2002: % 15-18 year old population enrolled. UNICEF, Social Monitor (2004).
General Secondary Enrollment
15
20
25
30
35
40
1989 1990 1991 1992 1993 1994 1995 1996 1997 1998 1999 2000 2001 2002
Gro
ss E
nrol
lmen
t Rat
e
Northern Tier CEE
EurasiaEurasia
Southern Tier CEESouthern Tier CEE
Figure 25
54
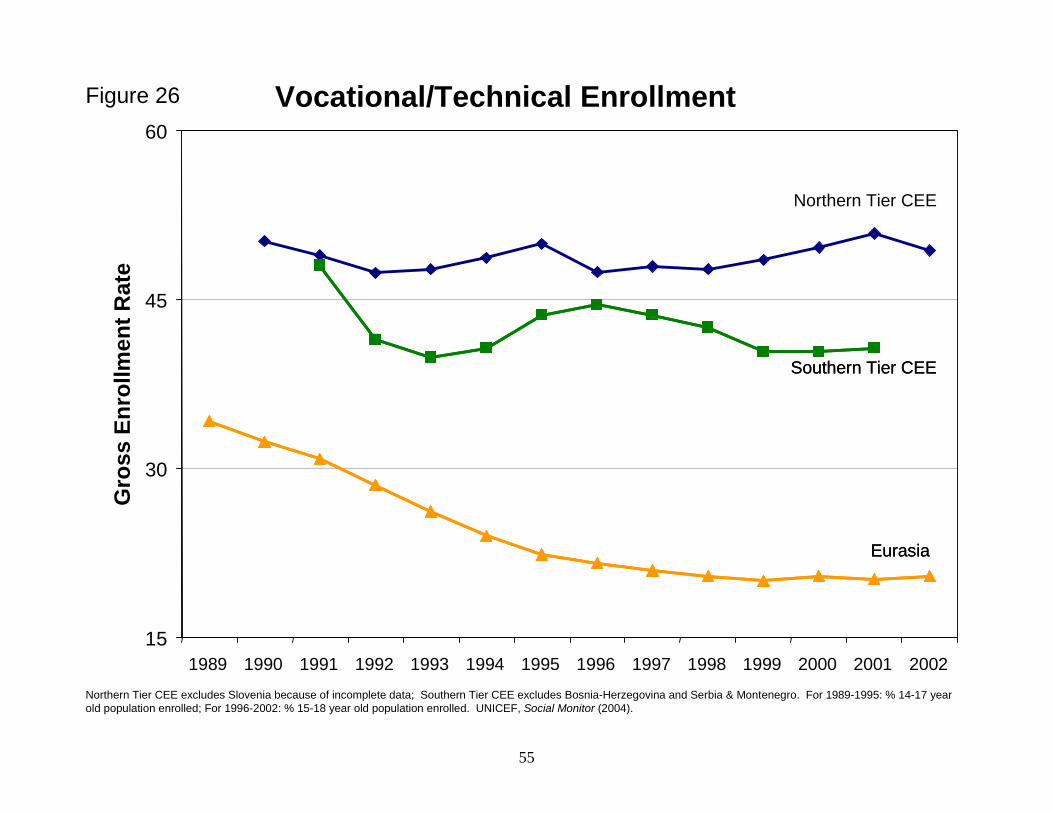
Northern Tier CEE excludes Slovenia because of incomplete data; Southern Tier CEE excludes Bosnia-Herzegovina and Serbia & Montenegro. For 1989-1995: % 14-17 year old population enrolled; For 1996-2002: % 15-18 year old population enrolled. UNICEF, Social Monitor (2004).
Vocational/Technical Enrollment
15
30
45
60
1989 1990 1991 1992 1993 1994 1995 1996 1997 1998 1999 2000 2001 2002
Gro
ss E
nrol
lmen
t Rat
e
Southern Tier CEESouthern Tier CEE
EurasiaEurasia
Northern Tier CEE
Figure 26
55
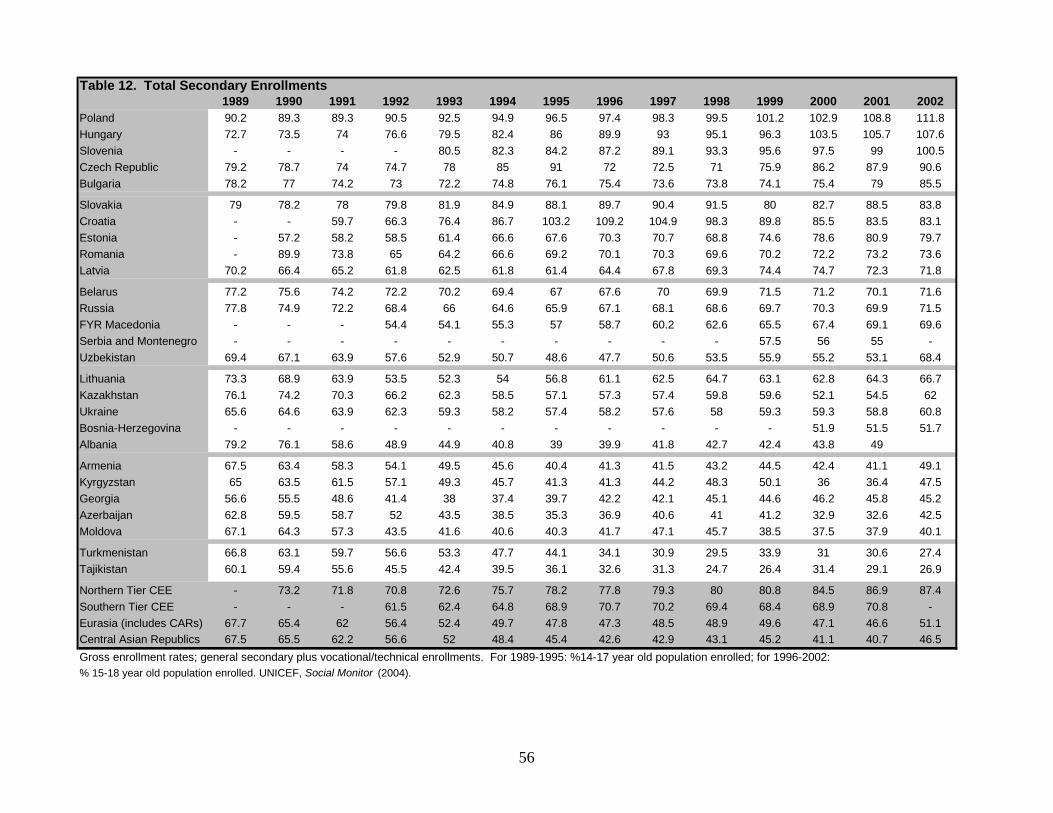
1989 1990 1991 1992 1993 1994 1995 1996 1997 1998 1999 2000 2001 2002Poland 90.2 89.3 89.3 90.5 92.5 94.9 96.5 97.4 98.3 99.5 101.2 102.9 108.8 111.8Hungary 72.7 73.5 74 76.6 79.5 82.4 86 89.9 93 95.1 96.3 103.5 105.7 107.6Slovenia - - - - 80.5 82.3 84.2 87.2 89.1 93.3 95.6 97.5 99 100.5Czech Republic 79.2 78.7 74 74.7 78 85 91 72 72.5 71 75.9 86.2 87.9 90.6Bulgaria 78.2 77 74.2 73 72.2 74.8 76.1 75.4 73.6 73.8 74.1 75.4 79 85.5
Slovakia 79 78.2 78 79.8 81.9 84.9 88.1 89.7 90.4 91.5 80 82.7 88.5 83.8Croatia - - 59.7 66.3 76.4 86.7 103.2 109.2 104.9 98.3 89.8 85.5 83.5 83.1Estonia - 57.2 58.2 58.5 61.4 66.6 67.6 70.3 70.7 68.8 74.6 78.6 80.9 79.7Romania - 89.9 73.8 65 64.2 66.6 69.2 70.1 70.3 69.6 70.2 72.2 73.2 73.6Latvia 70.2 66.4 65.2 61.8 62.5 61.8 61.4 64.4 67.8 69.3 74.4 74.7 72.3 71.8
Belarus 77.2 75.6 74.2 72.2 70.2 69.4 67 67.6 70 69.9 71.5 71.2 70.1 71.6Russia 77.8 74.9 72.2 68.4 66 64.6 65.9 67.1 68.1 68.6 69.7 70.3 69.9 71.5FYR Macedonia - - - 54.4 54.1 55.3 57 58.7 60.2 62.6 65.5 67.4 69.1 69.6Serbia and Montenegro - - - - - - - - - - 57.5 56 55 -Uzbekistan 69.4 67.1 63.9 57.6 52.9 50.7 48.6 47.7 50.6 53.5 55.9 55.2 53.1 68.4
Lithuania 73.3 68.9 63.9 53.5 52.3 54 56.8 61.1 62.5 64.7 63.1 62.8 64.3 66.7Kazakhstan 76.1 74.2 70.3 66.2 62.3 58.5 57.1 57.3 57.4 59.8 59.6 52.1 54.5 62Ukraine 65.6 64.6 63.9 62.3 59.3 58.2 57.4 58.2 57.6 58 59.3 59.3 58.8 60.8Bosnia-Herzegovina - - - - - - - - - - - 51.9 51.5 51.7Albania 79.2 76.1 58.6 48.9 44.9 40.8 39 39.9 41.8 42.7 42.4 43.8 49
Armenia 67.5 63.4 58.3 54.1 49.5 45.6 40.4 41.3 41.5 43.2 44.5 42.4 41.1 49.1Kyrgyzstan 65 63.5 61.5 57.1 49.3 45.7 41.3 41.3 44.2 48.3 50.1 36 36.4 47.5Georgia 56.6 55.5 48.6 41.4 38 37.4 39.7 42.2 42.1 45.1 44.6 46.2 45.8 45.2Azerbaijan 62.8 59.5 58.7 52 43.5 38.5 35.3 36.9 40.6 41 41.2 32.9 32.6 42.5Moldova 67.1 64.3 57.3 43.5 41.6 40.6 40.3 41.7 47.1 45.7 38.5 37.5 37.9 40.1
Turkmenistan 66.8 63.1 59.7 56.6 53.3 47.7 44.1 34.1 30.9 29.5 33.9 31 30.6 27.4Tajikistan 60.1 59.4 55.6 45.5 42.4 39.5 36.1 32.6 31.3 24.7 26.4 31.4 29.1 26.9
Northern Tier CEE - 73.2 71.8 70.8 72.6 75.7 78.2 77.8 79.3 80 80.8 84.5 86.9 87.4Southern Tier CEE - - - 61.5 62.4 64.8 68.9 70.7 70.2 69.4 68.4 68.9 70.8 -Eurasia (includes CARs) 67.7 65.4 62 56.4 52.4 49.7 47.8 47.3 48.5 48.9 49.6 47.1 46.6 51.1Central Asian Republics 67.5 65.5 62.2 56.6 52 48.4 45.4 42.6 42.9 43.1 45.2 41.1 40.7 46.5Gross enrollment rates; general secondary plus vocational/technical enrollments. For 1989-1995: %14-17 year old population enrolled; for 1996-2002: % 15-18 year old population enrolled. UNICEF, Social Monitor (2004).
Table 12. Total Secondary Enrollments
56
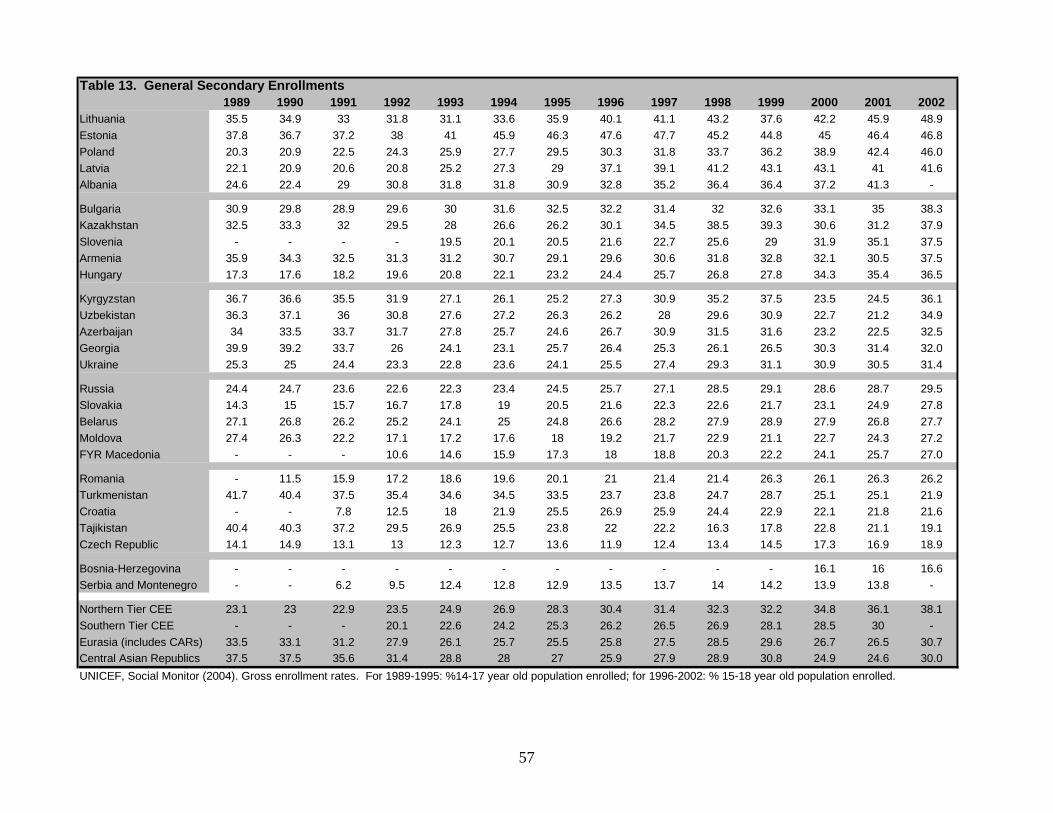
1989 1990 1991 1992 1993 1994 1995 1996 1997 1998 1999 2000 2001 2002Lithuania 35.5 34.9 33 31.8 31.1 33.6 35.9 40.1 41.1 43.2 37.6 42.2 45.9 48.9Estonia 37.8 36.7 37.2 38 41 45.9 46.3 47.6 47.7 45.2 44.8 45 46.4 46.8Poland 20.3 20.9 22.5 24.3 25.9 27.7 29.5 30.3 31.8 33.7 36.2 38.9 42.4 46.0Latvia 22.1 20.9 20.6 20.8 25.2 27.3 29 37.1 39.1 41.2 43.1 43.1 41 41.6Albania 24.6 22.4 29 30.8 31.8 31.8 30.9 32.8 35.2 36.4 36.4 37.2 41.3 -
Bulgaria 30.9 29.8 28.9 29.6 30 31.6 32.5 32.2 31.4 32 32.6 33.1 35 38.3Kazakhstan 32.5 33.3 32 29.5 28 26.6 26.2 30.1 34.5 38.5 39.3 30.6 31.2 37.9Slovenia - - - - 19.5 20.1 20.5 21.6 22.7 25.6 29 31.9 35.1 37.5Armenia 35.9 34.3 32.5 31.3 31.2 30.7 29.1 29.6 30.6 31.8 32.8 32.1 30.5 37.5Hungary 17.3 17.6 18.2 19.6 20.8 22.1 23.2 24.4 25.7 26.8 27.8 34.3 35.4 36.5
Kyrgyzstan 36.7 36.6 35.5 31.9 27.1 26.1 25.2 27.3 30.9 35.2 37.5 23.5 24.5 36.1Uzbekistan 36.3 37.1 36 30.8 27.6 27.2 26.3 26.2 28 29.6 30.9 22.7 21.2 34.9Azerbaijan 34 33.5 33.7 31.7 27.8 25.7 24.6 26.7 30.9 31.5 31.6 23.2 22.5 32.5Georgia 39.9 39.2 33.7 26 24.1 23.1 25.7 26.4 25.3 26.1 26.5 30.3 31.4 32.0Ukraine 25.3 25 24.4 23.3 22.8 23.6 24.1 25.5 27.4 29.3 31.1 30.9 30.5 31.4
Russia 24.4 24.7 23.6 22.6 22.3 23.4 24.5 25.7 27.1 28.5 29.1 28.6 28.7 29.5Slovakia 14.3 15 15.7 16.7 17.8 19 20.5 21.6 22.3 22.6 21.7 23.1 24.9 27.8Belarus 27.1 26.8 26.2 25.2 24.1 25 24.8 26.6 28.2 27.9 28.9 27.9 26.8 27.7Moldova 27.4 26.3 22.2 17.1 17.2 17.6 18 19.2 21.7 22.9 21.1 22.7 24.3 27.2FYR Macedonia - - - 10.6 14.6 15.9 17.3 18 18.8 20.3 22.2 24.1 25.7 27.0
Romania - 11.5 15.9 17.2 18.6 19.6 20.1 21 21.4 21.4 26.3 26.1 26.3 26.2Turkmenistan 41.7 40.4 37.5 35.4 34.6 34.5 33.5 23.7 23.8 24.7 28.7 25.1 25.1 21.9Croatia - - 7.8 12.5 18 21.9 25.5 26.9 25.9 24.4 22.9 22.1 21.8 21.6Tajikistan 40.4 40.3 37.2 29.5 26.9 25.5 23.8 22 22.2 16.3 17.8 22.8 21.1 19.1Czech Republic 14.1 14.9 13.1 13 12.3 12.7 13.6 11.9 12.4 13.4 14.5 17.3 16.9 18.9
Bosnia-Herzegovina - - - - - - - - - - - 16.1 16 16.6Serbia and Montenegro - - 6.2 9.5 12.4 12.8 12.9 13.5 13.7 14 14.2 13.9 13.8 -
Northern Tier CEE 23.1 23 22.9 23.5 24.9 26.9 28.3 30.4 31.4 32.3 32.2 34.8 36.1 38.1Southern Tier CEE - - - 20.1 22.6 24.2 25.3 26.2 26.5 26.9 28.1 28.5 30 -Eurasia (includes CARs) 33.5 33.1 31.2 27.9 26.1 25.7 25.5 25.8 27.5 28.5 29.6 26.7 26.5 30.7Central Asian Republics 37.5 37.5 35.6 31.4 28.8 28 27 25.9 27.9 28.9 30.8 24.9 24.6 30.0UNICEF, Social Monitor (2004). Gross enrollment rates. For 1989-1995: %14-17 year old population enrolled; for 1996-2002: % 15-18 year old population enrolled.
Table 13. General Secondary Enrollments
57
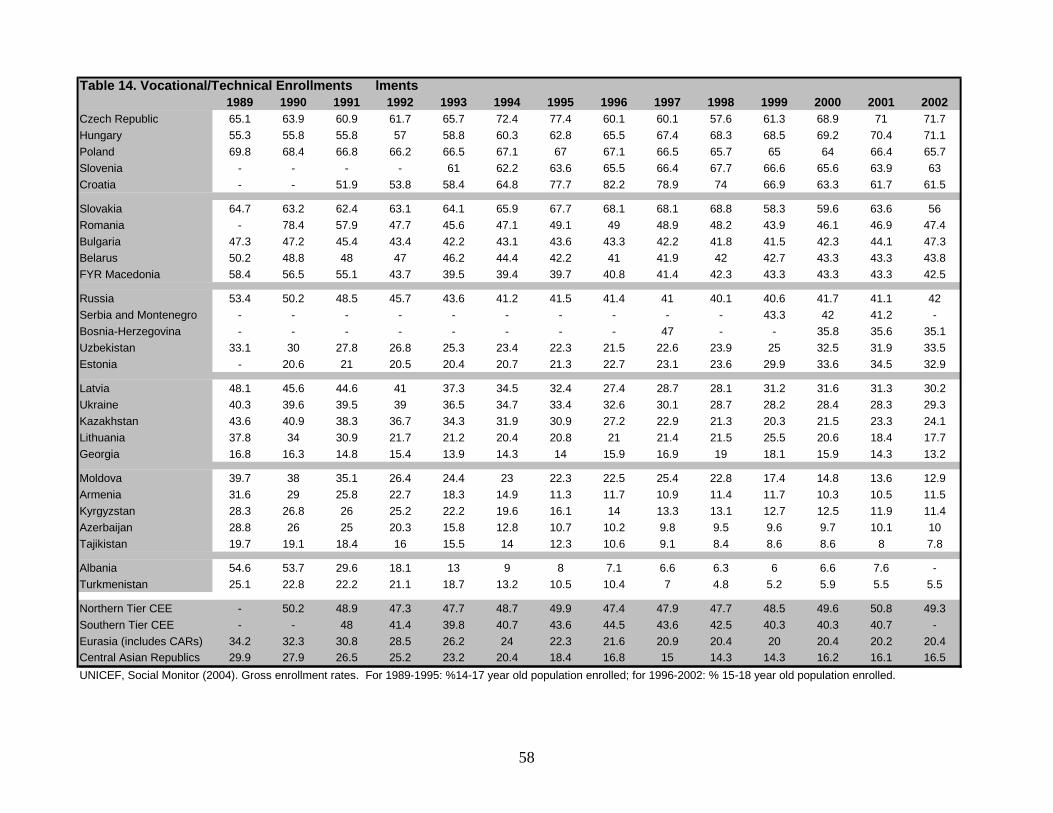
lments1989 1990 1991 1992 1993 1994 1995 1996 1997 1998 1999 2000 2001 2002
Czech Republic 65.1 63.9 60.9 61.7 65.7 72.4 77.4 60.1 60.1 57.6 61.3 68.9 71 71.7Hungary 55.3 55.8 55.8 57 58.8 60.3 62.8 65.5 67.4 68.3 68.5 69.2 70.4 71.1Poland 69.8 68.4 66.8 66.2 66.5 67.1 67 67.1 66.5 65.7 65 64 66.4 65.7Slovenia - - - - 61 62.2 63.6 65.5 66.4 67.7 66.6 65.6 63.9 63Croatia - - 51.9 53.8 58.4 64.8 77.7 82.2 78.9 74 66.9 63.3 61.7 61.5
Slovakia 64.7 63.2 62.4 63.1 64.1 65.9 67.7 68.1 68.1 68.8 58.3 59.6 63.6 56Romania - 78.4 57.9 47.7 45.6 47.1 49.1 49 48.9 48.2 43.9 46.1 46.9 47.4Bulgaria 47.3 47.2 45.4 43.4 42.2 43.1 43.6 43.3 42.2 41.8 41.5 42.3 44.1 47.3Belarus 50.2 48.8 48 47 46.2 44.4 42.2 41 41.9 42 42.7 43.3 43.3 43.8FYR Macedonia 58.4 56.5 55.1 43.7 39.5 39.4 39.7 40.8 41.4 42.3 43.3 43.3 43.3 42.5
Russia 53.4 50.2 48.5 45.7 43.6 41.2 41.5 41.4 41 40.1 40.6 41.7 41.1 42Serbia and Montenegro - - - - - - - - - - 43.3 42 41.2 -Bosnia-Herzegovina - - - - - - - - 47 - - 35.8 35.6 35.1Uzbekistan 33.1 30 27.8 26.8 25.3 23.4 22.3 21.5 22.6 23.9 25 32.5 31.9 33.5Estonia - 20.6 21 20.5 20.4 20.7 21.3 22.7 23.1 23.6 29.9 33.6 34.5 32.9
Latvia 48.1 45.6 44.6 41 37.3 34.5 32.4 27.4 28.7 28.1 31.2 31.6 31.3 30.2Ukraine 40.3 39.6 39.5 39 36.5 34.7 33.4 32.6 30.1 28.7 28.2 28.4 28.3 29.3Kazakhstan 43.6 40.9 38.3 36.7 34.3 31.9 30.9 27.2 22.9 21.3 20.3 21.5 23.3 24.1Lithuania 37.8 34 30.9 21.7 21.2 20.4 20.8 21 21.4 21.5 25.5 20.6 18.4 17.7Georgia 16.8 16.3 14.8 15.4 13.9 14.3 14 15.9 16.9 19 18.1 15.9 14.3 13.2
Moldova 39.7 38 35.1 26.4 24.4 23 22.3 22.5 25.4 22.8 17.4 14.8 13.6 12.9Armenia 31.6 29 25.8 22.7 18.3 14.9 11.3 11.7 10.9 11.4 11.7 10.3 10.5 11.5Kyrgyzstan 28.3 26.8 26 25.2 22.2 19.6 16.1 14 13.3 13.1 12.7 12.5 11.9 11.4Azerbaijan 28.8 26 25 20.3 15.8 12.8 10.7 10.2 9.8 9.5 9.6 9.7 10.1 10Tajikistan 19.7 19.1 18.4 16 15.5 14 12.3 10.6 9.1 8.4 8.6 8.6 8 7.8
Albania 54.6 53.7 29.6 18.1 13 9 8 7.1 6.6 6.3 6 6.6 7.6 -Turkmenistan 25.1 22.8 22.2 21.1 18.7 13.2 10.5 10.4 7 4.8 5.2 5.9 5.5 5.5
Northern Tier CEE - 50.2 48.9 47.3 47.7 48.7 49.9 47.4 47.9 47.7 48.5 49.6 50.8 49.3Southern Tier CEE - - 48 41.4 39.8 40.7 43.6 44.5 43.6 42.5 40.3 40.3 40.7 -Eurasia (includes CARs) 34.2 32.3 30.8 28.5 26.2 24 22.3 21.6 20.9 20.4 20 20.4 20.2 20.4Central Asian Republics 29.9 27.9 26.5 25.2 23.2 20.4 18.4 16.8 15 14.3 14.3 16.2 16.1 16.5UNICEF, Social Monitor (2004). Gross enrollment rates. For 1989-1995: %14-17 year old population enrolled; for 1996-2002: % 15-18 year old population enrolled.
Table 14. Vocational/Technical Enrollments
58
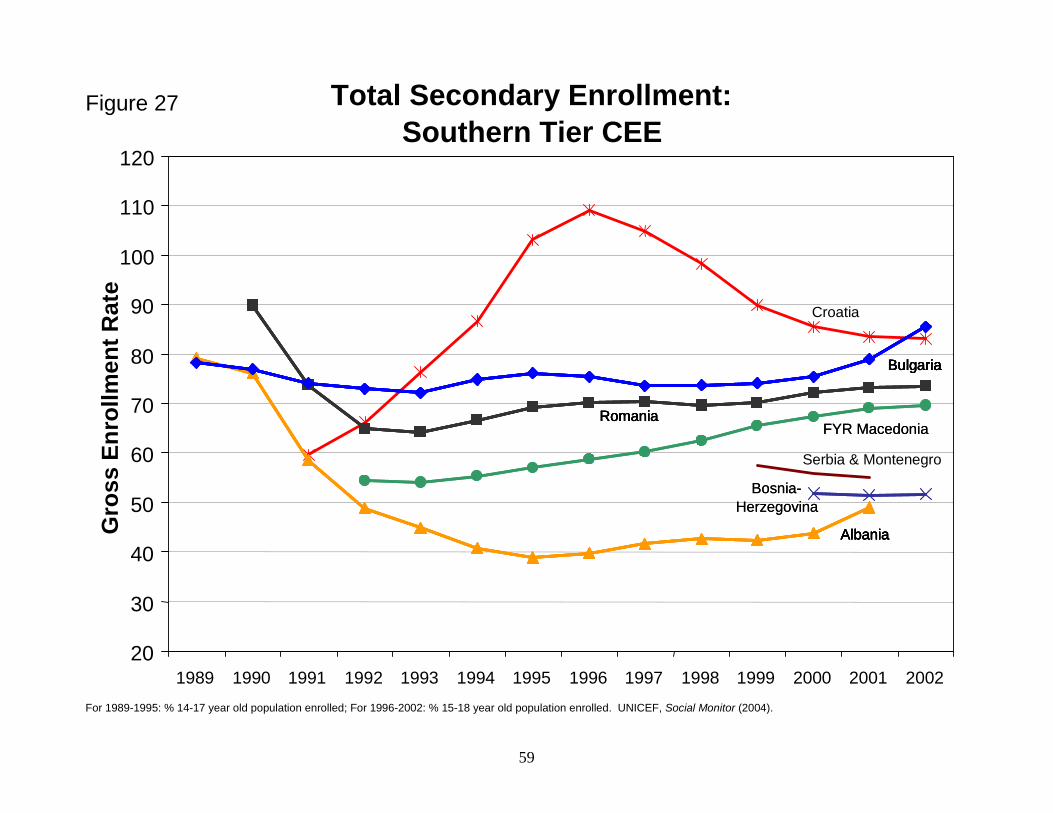
For 1989-1995: % 14-17 year old population enrolled; For 1996-2002: % 15-18 year old population enrolled. UNICEF, Social Monitor (2004).
Total Secondary Enrollment:Southern Tier CEE
20
30
40
50
60
70
80
90
100
110
120
1989 1990 1991 1992 1993 1994 1995 1996 1997 1998 1999 2000 2001 2002
Gro
ss E
nrol
lmen
t Rat
e
AlbaniaAlbaniaAlbaniaAlbania
Croatia
RomaniaRomaniaRomaniaRomania
BulgariaBulgariaBulgariaBulgariaBulgaria
FYR MacedoniaFYR Macedonia
Bosnia-Herzegovina
Bosnia-Herzegovina
Serbia & Montenegro
Figure 27
59
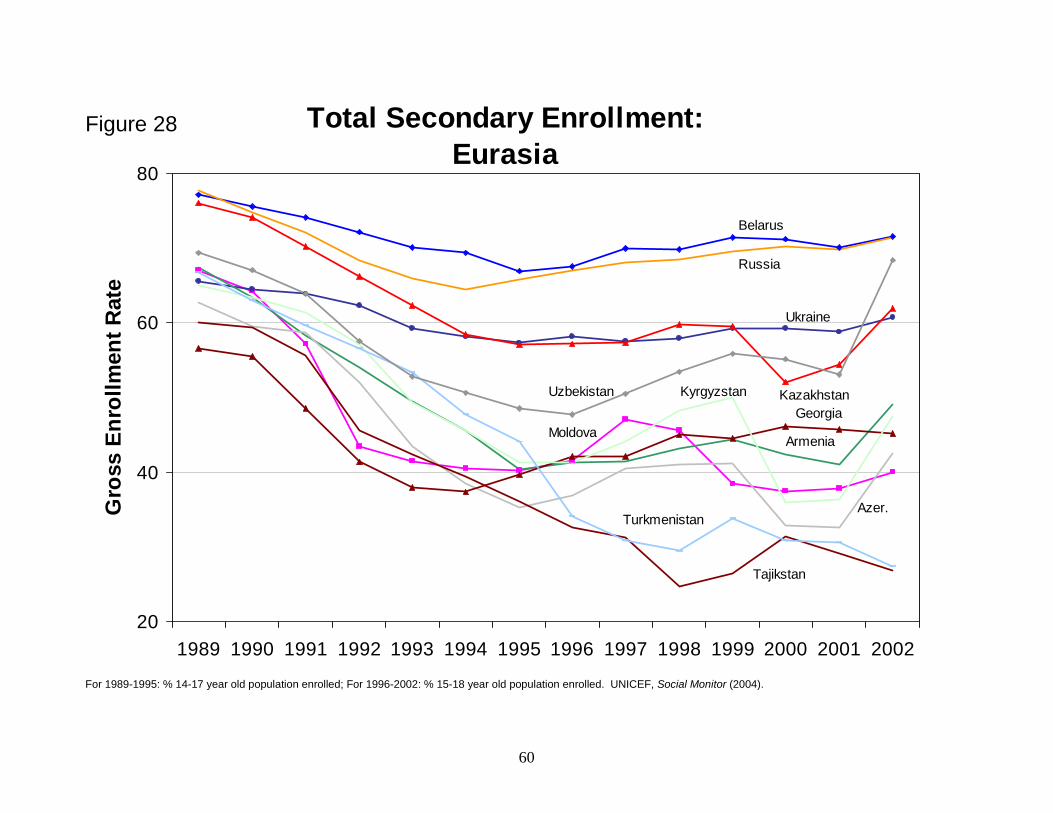
Total Secondary Enrollment:
Eurasia
20
40
60
80
1989 1990 1991 1992 1993 1994 1995 1996 1997 1998 1999 2000 2001 2002
Gro
ss E
nrol
lmen
t Rat
e
Turkmenistan
Belarus
Russia
Tajikstan
KazakhstanUzbekistan
Ukraine
Armenia
Kyrgyzstan
Azer.
MoldovaGeorgia
For 1989-1995: % 14-17 year old population enrolled; For 1996-2002: % 15-18 year old population enrolled. UNICEF, Social Monitor (2004).
Figure 28
60
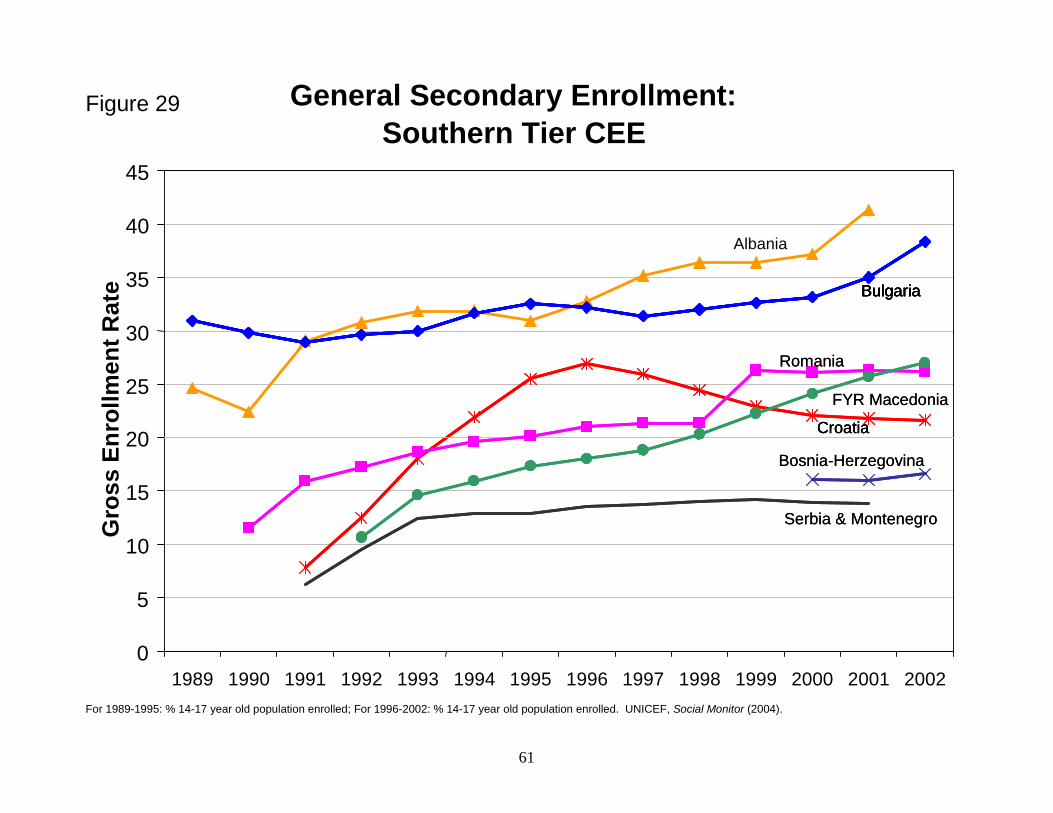
For 1989-1995: % 14-17 year old population enrolled; For 1996-2002: % 14-17 year old population enrolled. UNICEF, Social Monitor (2004).
General Secondary Enrollment:Southern Tier CEE
0
5
10
15
20
25
30
35
40
45
1989 1990 1991 1992 1993 1994 1995 1996 1997 1998 1999 2000 2001 2002
Gro
ss E
nrol
lmen
t Rat
e
Albania
CroatiaCroatiaCroatia
RomaniaRomania
BulgariaBulgariaBulgariaBulgariaBulgaria
FYR MacedoniaFYR Macedonia
Bosnia-HerzegovinaBosnia-Herzegovina
Serbia & MontenegroSerbia & Montenegro
Figure 29
61
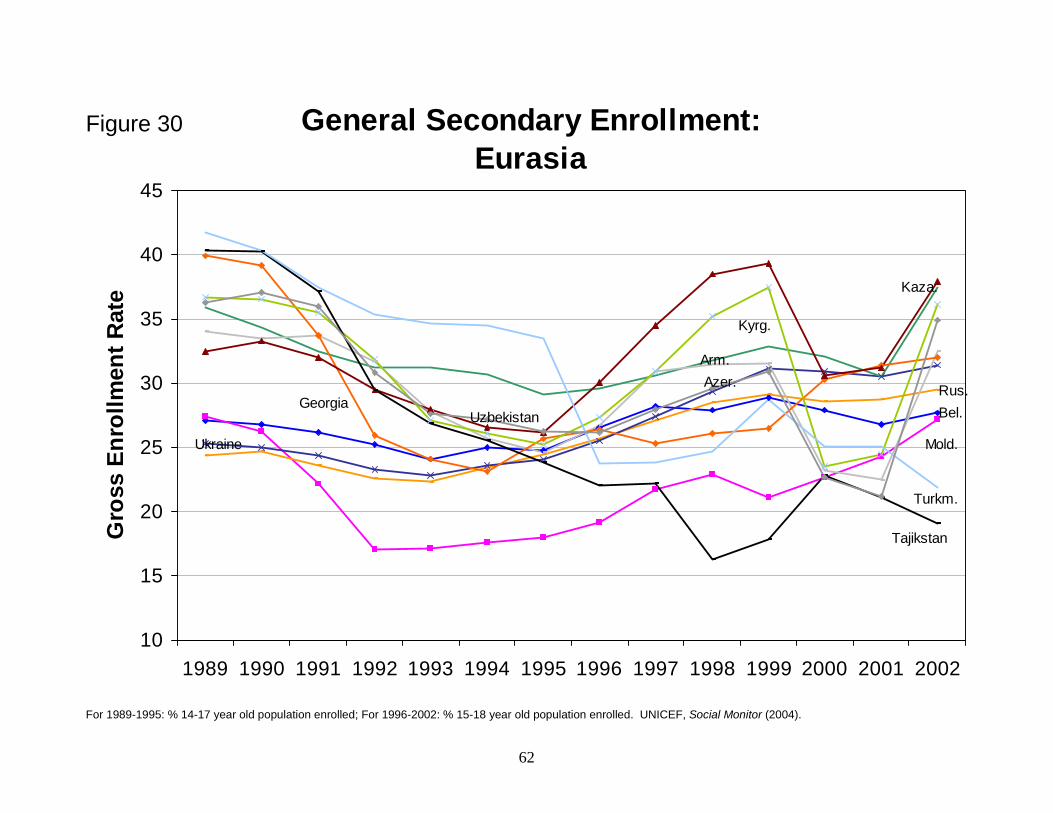
General Secondary Enrollment:
Eurasia
10
15
20
25
30
35
40
45
1989 1990 1991 1992 1993 1994 1995 1996 1997 1998 1999 2000 2001 2002
Gro
ss E
nrol
lmen
t Rat
e
Turkm.
Bel.Rus.
Tajikstan
Kaza.
Uzbekistan
Ukraine
Arm.
Kyrg.
Azer.
Mold.
Georgia
For 1989-1995: % 14-17 year old population enrolled; For 1996-2002: % 15-18 year old population enrolled. UNICEF, Social Monitor (2004).
Figure 30
62
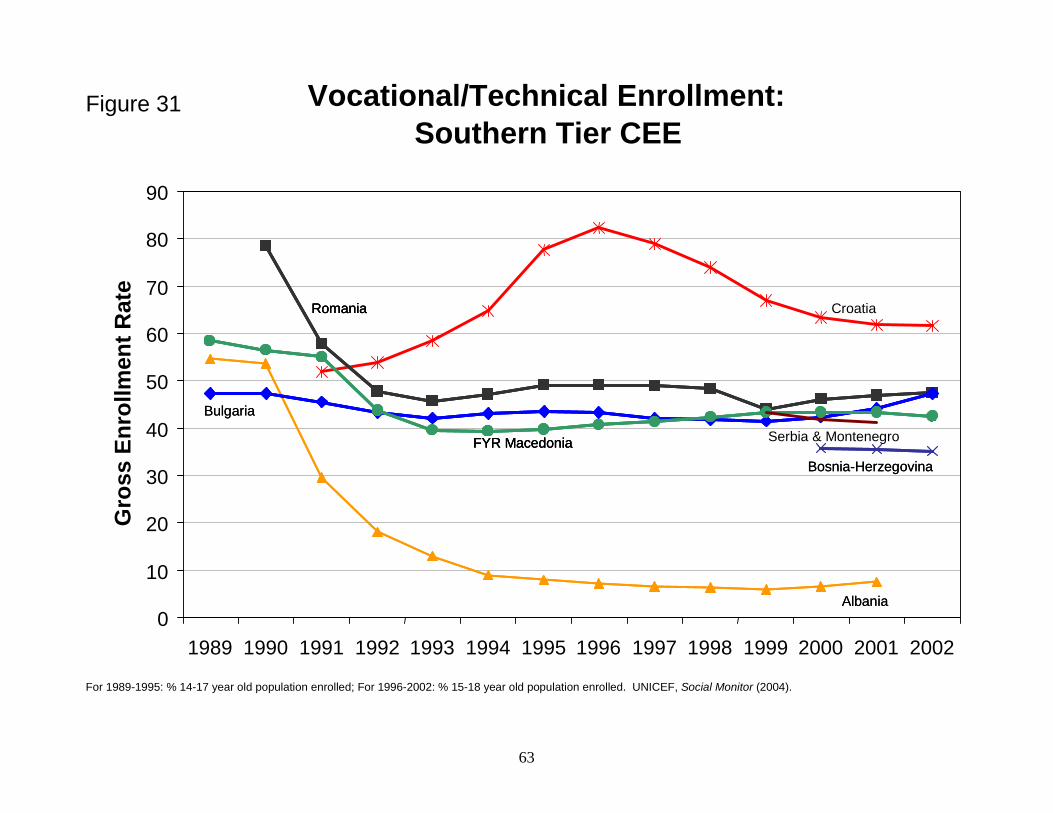
For 1989-1995: % 14-17 year old population enrolled; For 1996-2002: % 15-18 year old population enrolled. UNICEF, Social Monitor (2004).
Vocational/Technical Enrollment:Southern Tier CEE
0
10
20
30
40
50
60
70
80
90
1989 1990 1991 1992 1993 1994 1995 1996 1997 1998 1999 2000 2001 2002
Gro
ss E
nrol
lmen
t Rat
e
AlbaniaAlbania
CroatiaRomaniaRomaniaRomania
BulgariaBulgaria
FYR MacedoniaFYR MacedoniaFYR Macedonia
Bosnia-HerzegovinaBosnia-Herzegovina
Serbia & Montenegro
Figure 31
63
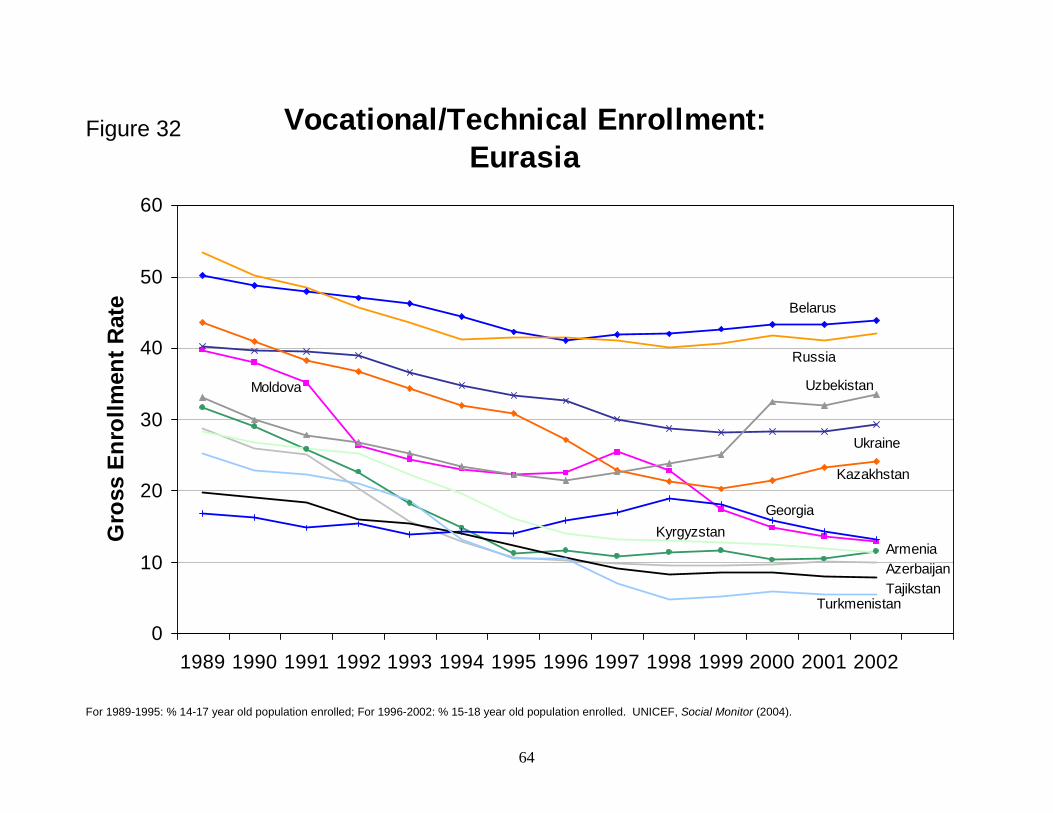
Vocational/Technical Enrollment:
Eurasia
0
10
20
30
40
50
60
1989 1990 1991 1992 1993 1994 1995 1996 1997 1998 1999 2000 2001 2002
Gro
ss E
nrol
lmen
t Rat
e
Turkmenistan
Belarus
Russia
Tajikstan
Kazakhstan
Uzbekistan
Ukraine
ArmeniaKyrgyzstan
Azerbaijan
Moldova
Georgia
For 1989-1995: % 14-17 year old population enrolled; For 1996-2002: % 15-18 year old population enrolled. UNICEF, Social Monitor (2004).
Figure 32
64
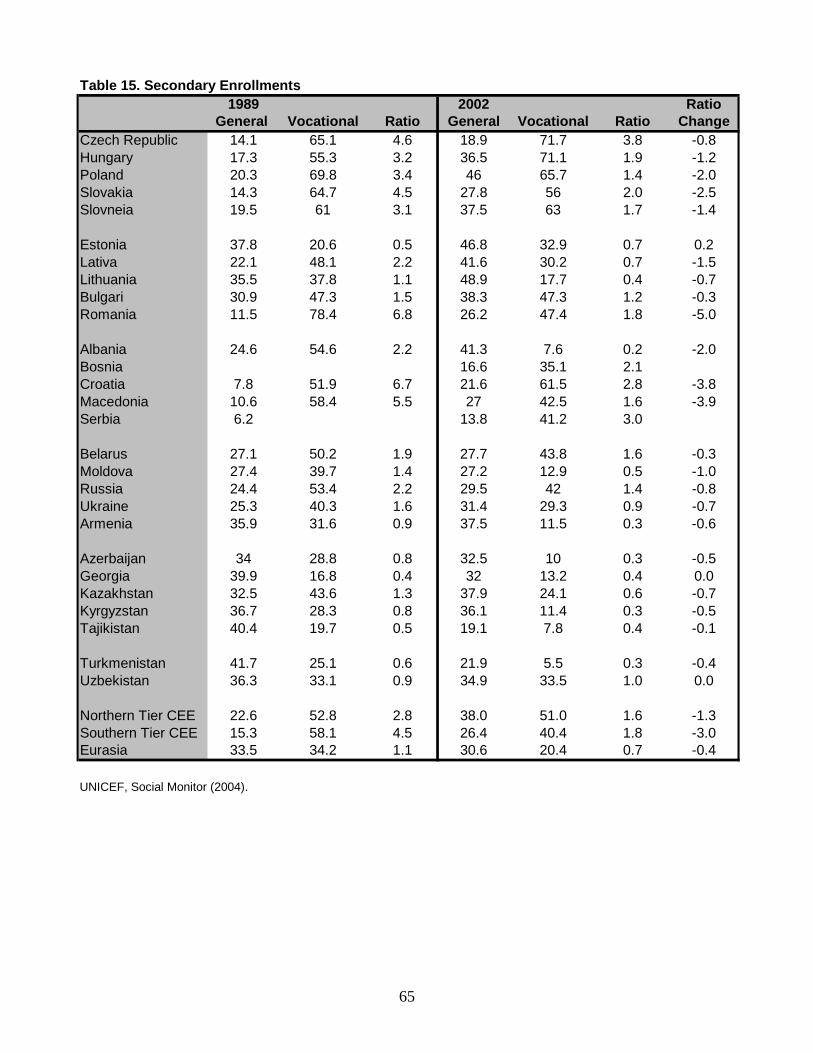
Table 15. Secondary Enrollments1989 2002 Ratio
General Vocational Ratio General Vocational Ratio ChangeCzech Republic 14.1 65.1 4.6 18.9 71.7 3.8 -0.8Hungary 17.3 55.3 3.2 36.5 71.1 1.9 -1.2Poland 20.3 69.8 3.4 46 65.7 1.4 -2.0Slovakia 14.3 64.7 4.5 27.8 56 2.0 -2.5Slovneia 19.5 61 3.1 37.5 63 1.7 -1.4
Estonia 37.8 20.6 0.5 46.8 32.9 0.7 0.2Lativa 22.1 48.1 2.2 41.6 30.2 0.7 -1.5Lithuania 35.5 37.8 1.1 48.9 17.7 0.4 -0.7Bulgari 30.9 47.3 1.5 38.3 47.3 1.2 -0.3Romania 11.5 78.4 6.8 26.2 47.4 1.8 -5.0
Albania 24.6 54.6 2.2 41.3 7.6 0.2 -2.0Bosnia 16.6 35.1 2.1 Croatia 7.8 51.9 6.7 21.6 61.5 2.8 -3.8Macedonia 10.6 58.4 5.5 27 42.5 1.6 -3.9Serbia 6.2 13.8 41.2 3.0
Belarus 27.1 50.2 1.9 27.7 43.8 1.6 -0.3Moldova 27.4 39.7 1.4 27.2 12.9 0.5 -1.0Russia 24.4 53.4 2.2 29.5 42 1.4 -0.8Ukraine 25.3 40.3 1.6 31.4 29.3 0.9 -0.7Armenia 35.9 31.6 0.9 37.5 11.5 0.3 -0.6
Azerbaijan 34 28.8 0.8 32.5 10 0.3 -0.5Georgia 39.9 16.8 0.4 32 13.2 0.4 0.0Kazakhstan 32.5 43.6 1.3 37.9 24.1 0.6 -0.7Kyrgyzstan 36.7 28.3 0.8 36.1 11.4 0.3 -0.5Tajikistan 40.4 19.7 0.5 19.1 7.8 0.4 -0.1
Turkmenistan 41.7 25.1 0.6 21.9 5.5 0.3 -0.4Uzbekistan 36.3 33.1 0.9 34.9 33.5 1.0 0.0
Northern Tier CEE 22.6 52.8 2.8 38.0 51.0 1.6 -1.3Southern Tier CEE 15.3 58.1 4.5 26.4 40.4 1.8 -3.0Eurasia 33.5 34.2 1.1 30.6 20.4 0.7 -0.4
UNICEF, Social Monitor (2004).
65
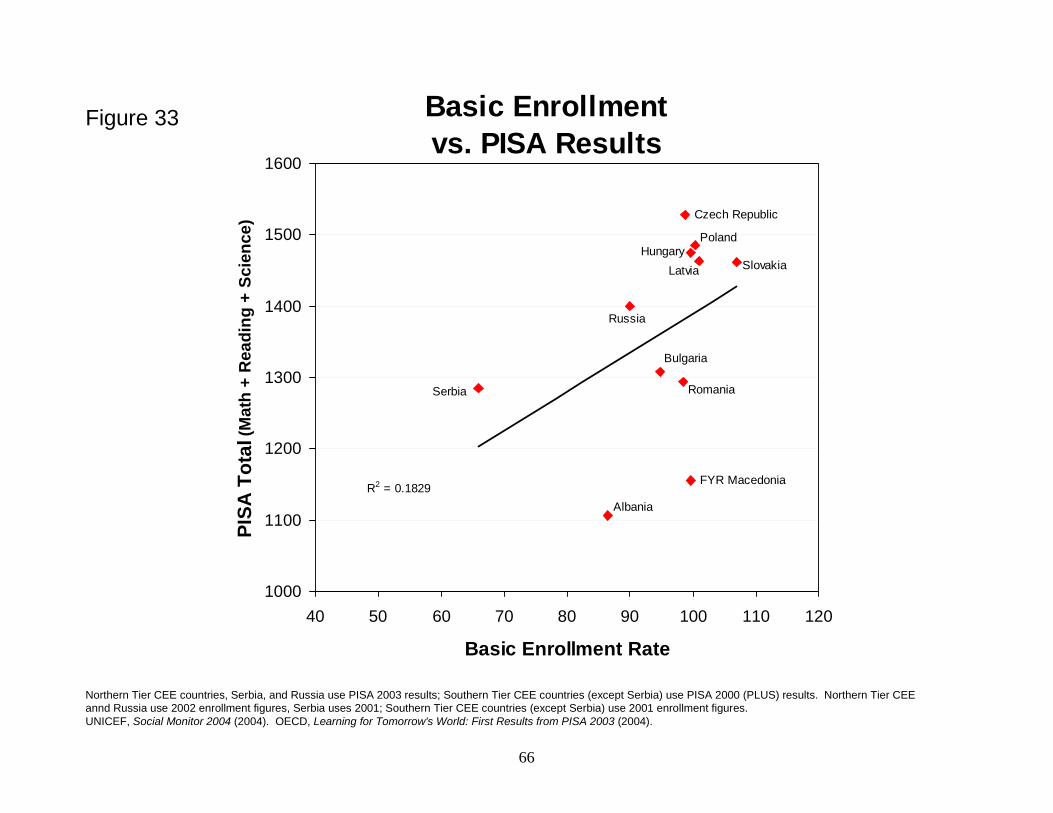
Basic Enrollment vs. PISA Results
Albania
Serbia
FYR Macedonia
Romania
Bulgaria
Russia
Latvia Slovakia
Czech Republic
HungaryPoland
R2 = 0.1829
1000
1100
1200
1300
1400
1500
1600
40 50 60 70 80 90 100 110 120
Basic Enrollment Rate
PISA
Tot
al (M
ath
+ R
eadi
ng +
Sci
ence
)
Northern Tier CEE countries, Serbia, and Russia use PISA 2003 results; Southern Tier CEE countries (except Serbia) use PISA 2000 (PLUS) results. Northern Tier CEE annd Russia use 2002 enrollment figures, Serbia uses 2001; Southern Tier CEE countries (except Serbia) use 2001 enrollment figures.UNICEF, Social Monitor 2004 (2004). OECD, Learning for Tomorrow's World: First Results from PISA 2003 (2004).
Figure 33
66
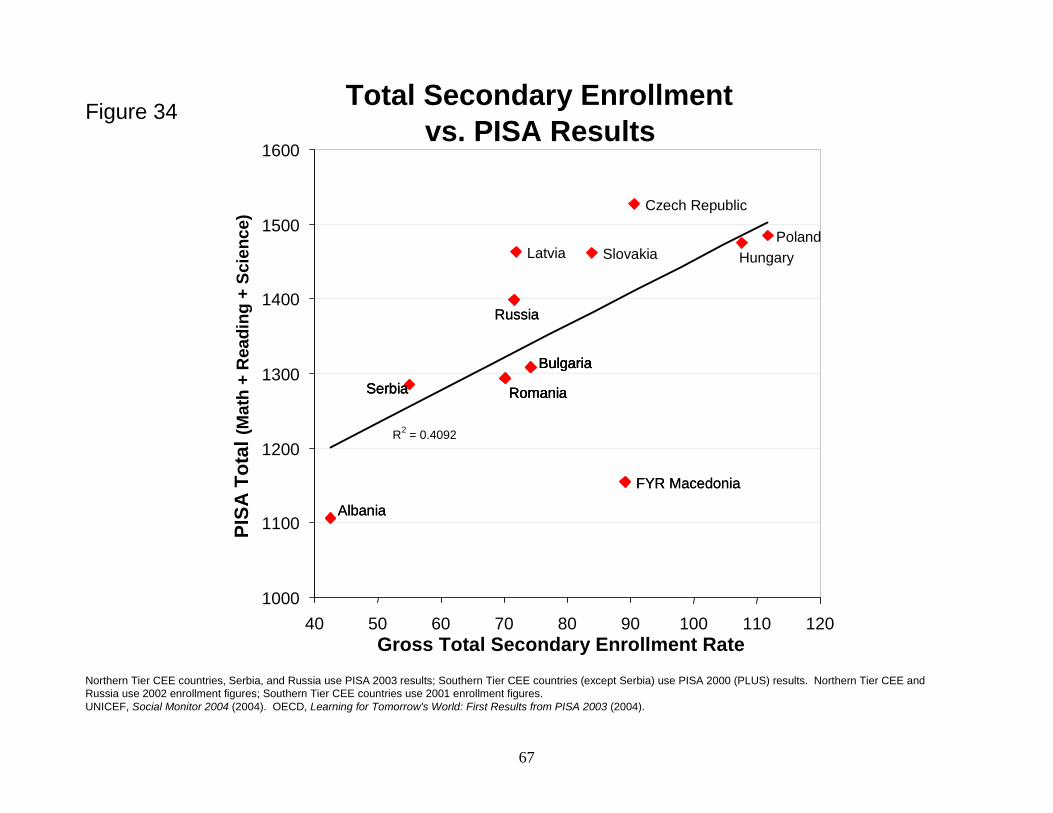
Northern Tier CEE countries, Serbia, and Russia use PISA 2003 results; Southern Tier CEE countries (except Serbia) use PISA 2000 (PLUS) results. Northern Tier CEE and Russia use 2002 enrollment figures; Southern Tier CEE countries use 2001 enrollment figures.UNICEF, Social Monitor 2004 (2004). OECD, Learning for Tomorrow's World: First Results from PISA 2003 (2004).
Total Secondary Enrollment vs. PISA Results
Albania
FYR Macedonia
Albania
FYR Macedonia
Serbia Romania
Bulgaria
Serbia Romania
Bulgaria
Serbia Romania
Bulgaria
RussiaRussia
Latvia Slovakia
Czech Republic
HungaryPoland
R2 = 0.4092
1000
1100
1200
1300
1400
1500
1600
40 50 60 70 80 90 100 110 120Gross Total Secondary Enrollment Rate
PISA
Tot
al (M
ath
+ R
eadi
ng +
Sci
ence
)
Figure 34
67
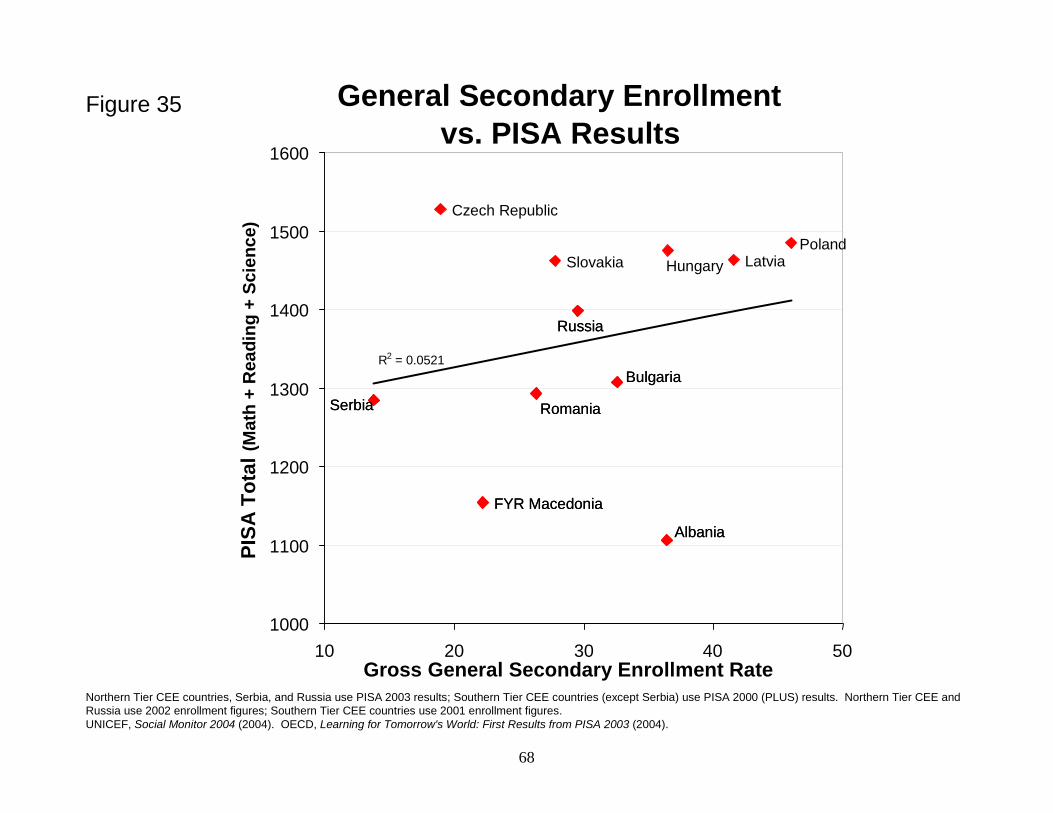
Northern Tier CEE countries, Serbia, and Russia use PISA 2003 results; Southern Tier CEE countries (except Serbia) use PISA 2000 (PLUS) results. Northern Tier CEE and Russia use 2002 enrollment figures; Southern Tier CEE countries use 2001 enrollment figures.UNICEF, Social Monitor 2004 (2004). OECD, Learning for Tomorrow's World: First Results from PISA 2003 (2004).
General Secondary Enrollment vs. PISA Results
Albania
FYR Macedonia
Albania
FYR Macedonia
Serbia Romania
Bulgaria
Serbia Romania
Bulgaria
RussiaRussia
LatviaSlovakia
Czech Republic
HungaryPoland
R2 = 0.0521
1000
1100
1200
1300
1400
1500
1600
10 20 30 40 50Gross General Secondary Enrollment Rate
PISA
Tot
al (M
ath
+ R
eadi
ng +
Sci
ence
)
Figure 35
68
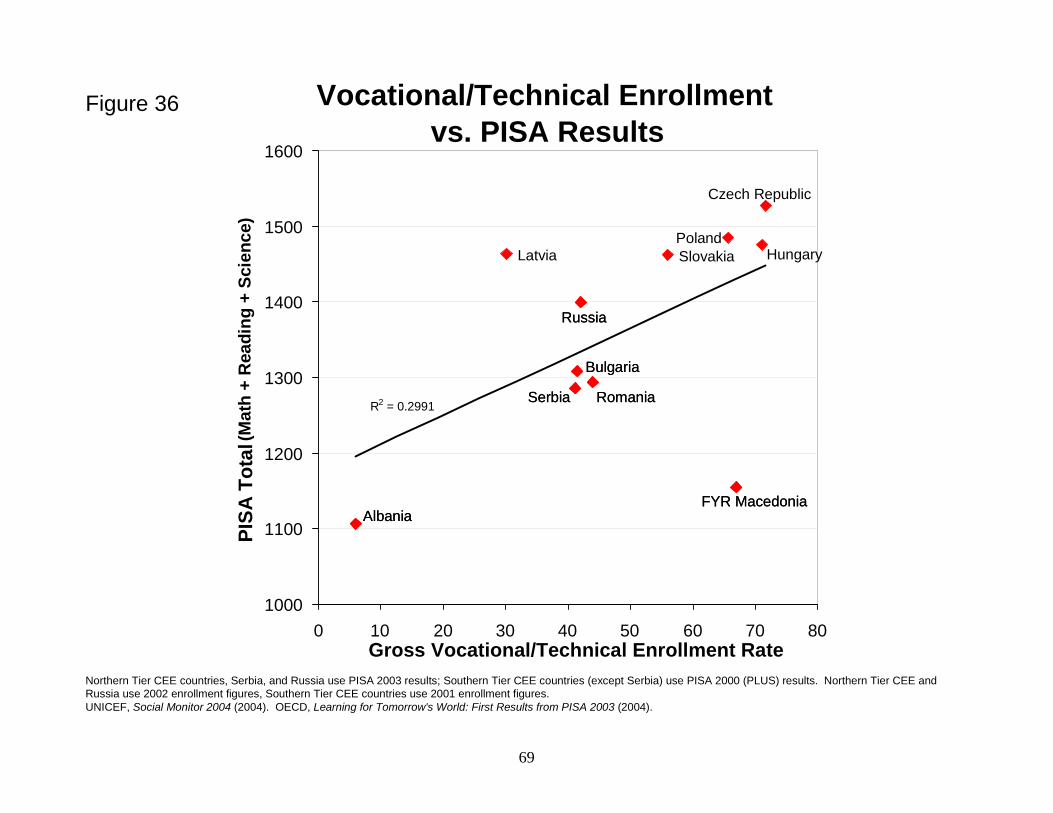
Northern Tier CEE countries, Serbia, and Russia use PISA 2003 results; Southern Tier CEE countries (except Serbia) use PISA 2000 (PLUS) results. Northern Tier CEE and Russia use 2002 enrollment figures, Southern Tier CEE countries use 2001 enrollment figures.UNICEF, Social Monitor 2004 (2004). OECD, Learning for Tomorrow's World: First Results from PISA 2003 (2004).
Vocational/Technical Enrollment vs. PISA Results
AlbaniaFYR Macedonia
AlbaniaFYR Macedonia
Serbia Romania
Bulgaria
Serbia Romania
Bulgaria
RussiaRussia
Latvia Slovakia
Czech Republic
HungaryPoland
R2 = 0.2991
1000
1100
1200
1300
1400
1500
1600
0 10 20 30 40 50 60 70 80Gross Vocational/Technical Enrollment Rate
PISA
Tot
al (M
ath
+ R
eadi
ng +
Sci
ence
)
Figure 36
69
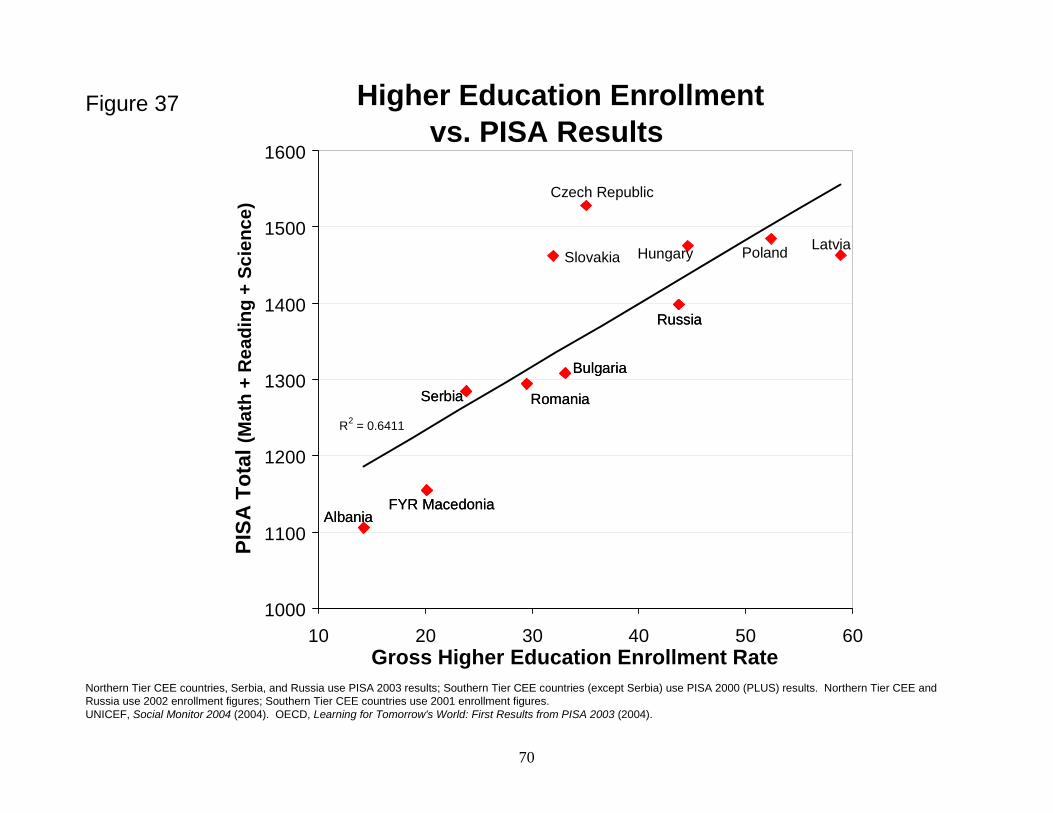
Northern Tier CEE countries, Serbia, and Russia use PISA 2003 results; Southern Tier CEE countries (except Serbia) use PISA 2000 (PLUS) results. Northern Tier CEE and Russia use 2002 enrollment figures; Southern Tier CEE countries use 2001 enrollment figures.UNICEF, Social Monitor 2004 (2004). OECD, Learning for Tomorrow's World: First Results from PISA 2003 (2004).
Higher Education Enrollment vs. PISA Results
Albania
Serbia
FYR Macedonia
Romania
Bulgaria
Albania
Serbia
FYR Macedonia
Romania
Bulgaria
RussiaRussia
LatviaSlovakia
Czech Republic
Hungary Poland
R2 = 0.6411
1000
1100
1200
1300
1400
1500
1600
10 20 30 40 50 60Gross Higher Education Enrollment Rate
PISA
Tot
al (M
ath
+ R
eadi
ng +
Sci
ence
)
Figure 37
70
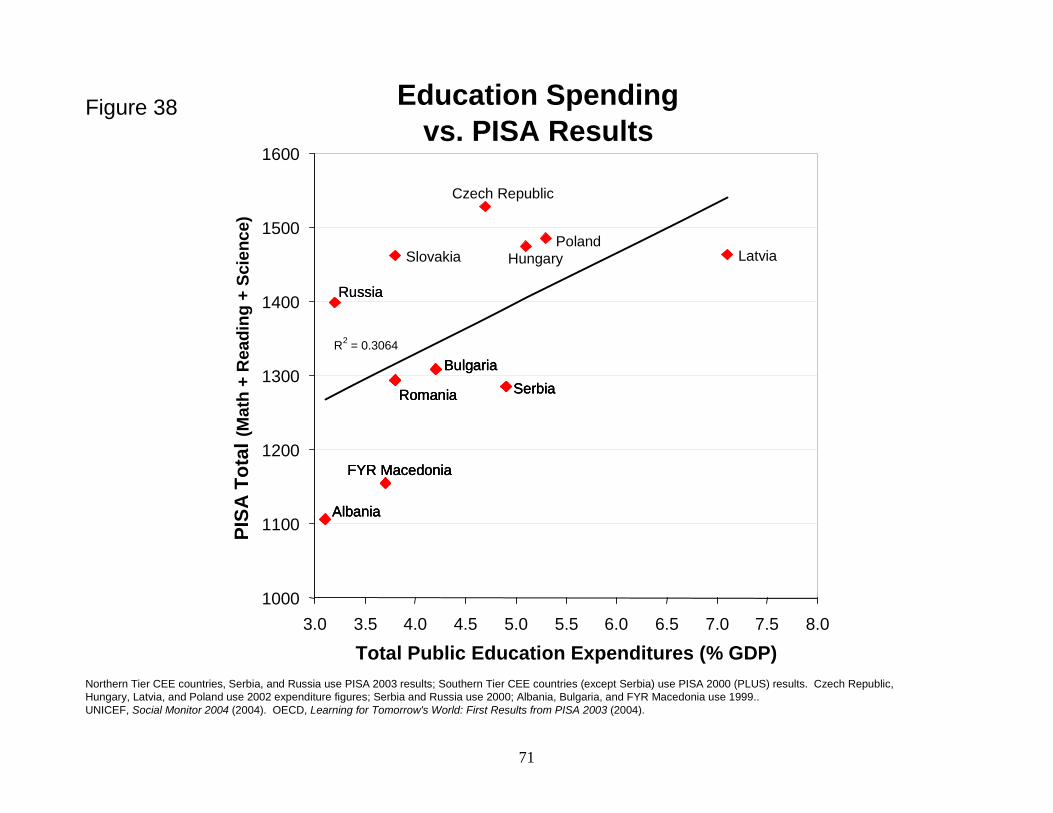
Northern Tier CEE countries, Serbia, and Russia use PISA 2003 results; Southern Tier CEE countries (except Serbia) use PISA 2000 (PLUS) results. Czech Republic, Hungary, Latvia, and Poland use 2002 expenditure figures; Serbia and Russia use 2000; Albania, Bulgaria, and FYR Macedonia use 1999..UNICEF, Social Monitor 2004 (2004). OECD, Learning for Tomorrow's World: First Results from PISA 2003 (2004).
Education Spending vs. PISA Results
Albania
Serbia
FYR Macedonia
Romania
Bulgaria
Albania
Serbia
FYR Macedonia
Romania
Bulgaria
Albania
Serbia
FYR Macedonia
Romania
Bulgaria
RussiaRussia
LatviaSlovakia
Czech Republic
HungaryPoland
R2 = 0.3064
1000
1100
1200
1300
1400
1500
1600
3.0 3.5 4.0 4.5 5.0 5.5 6.0 6.5 7.0 7.5 8.0
Total Public Education Expenditures (% GDP)
PISA
Tot
al (M
ath
+ R
eadi
ng +
Sci
ence
)
Figure 38
71
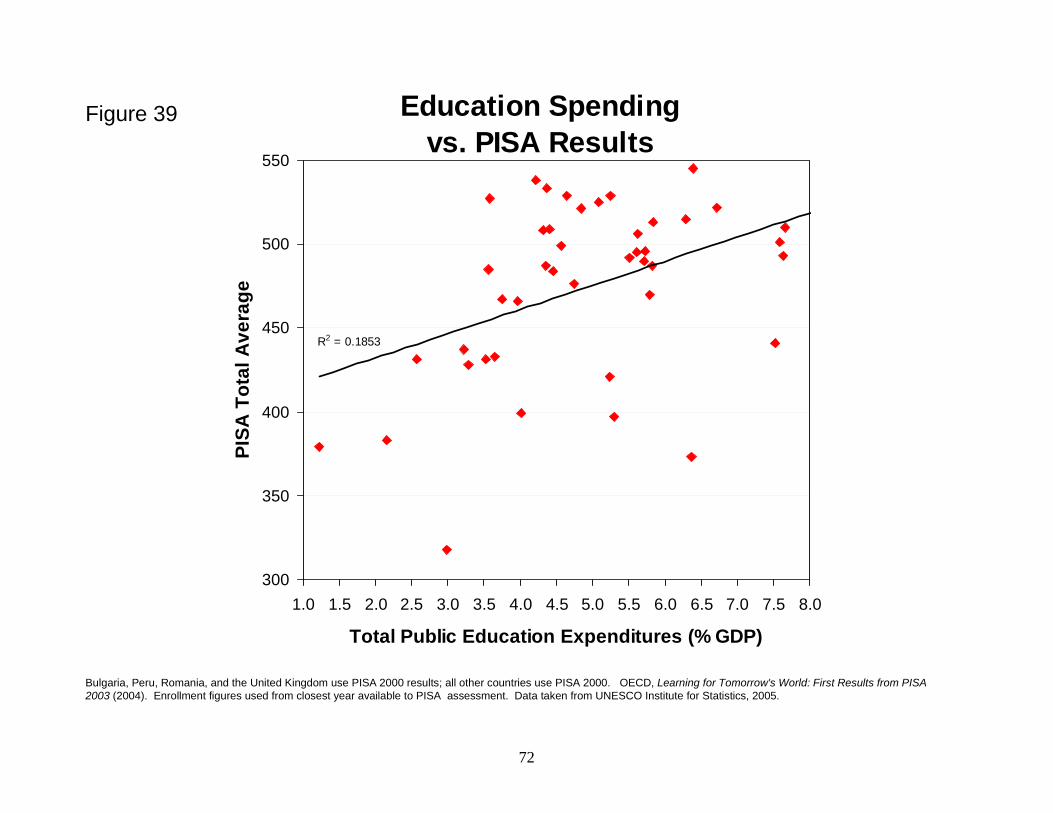
Education Spending
vs. PISA Results
R2 = 0.1853
300
350
400
450
500
550
1.0 1.5 2.0 2.5 3.0 3.5 4.0 4.5 5.0 5.5 6.0 6.5 7.0 7.5 8.0
Total Public Education Expenditures (% GDP)
PISA
Tot
al A
vera
ge
Bulgaria, Peru, Romania, and the United Kingdom use PISA 2000 results; all other countries use PISA 2000. OECD, Learning for Tomorrow's World: First Results from PISA 2003 (2004). Enrollment figures used from closest year available to PISA assessment. Data taken from UNESCO Institute for Statistics, 2005.
Figure 39
72

73
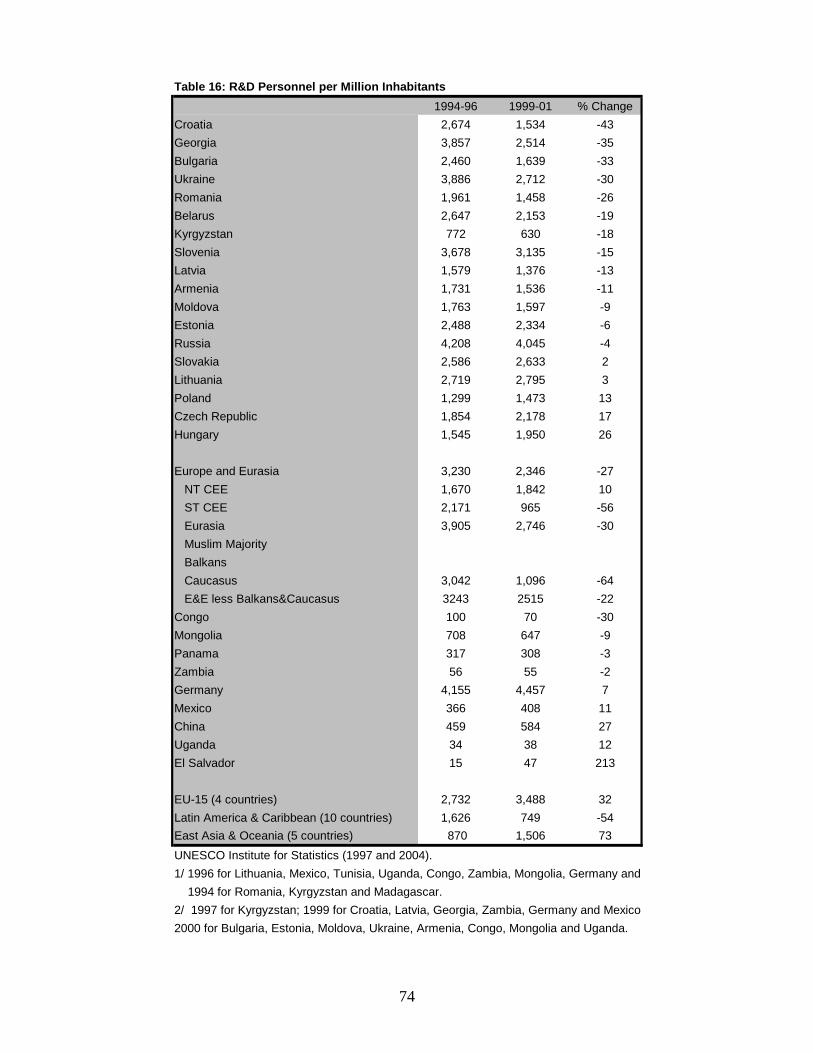
1994-96 1999-01 % ChangeCroatia 2,674 1,534 -43Georgia 3,857 2,514 -35Bulgaria 2,460 1,639 -33Ukraine 3,886 2,712 -30Romania 1,961 1,458 -26Belarus 2,647 2,153 -19Kyrgyzstan 772 630 -18Slovenia 3,678 3,135 -15Latvia 1,579 1,376 -13Armenia 1,731 1,536 -11Moldova 1,763 1,597 -9Estonia 2,488 2,334 -6Russia 4,208 4,045 -4Slovakia 2,586 2,633 2Lithuania 2,719 2,795 3Poland 1,299 1,473 13Czech Republic 1,854 2,178 17Hungary 1,545 1,950 26
Europe and Eurasia 3,230 2,346 -27 NT CEE 1,670 1,842 10 ST CEE 2,171 965 -56 Eurasia 3,905 2,746 -30 Muslim Majority Balkans Caucasus 3,042 1,096 -64 E&E less Balkans&Caucasus 3243 2515 -22Congo 100 70 -30Mongolia 708 647 -9Panama 317 308 -3Zambia 56 55 -2Germany 4,155 4,457 7Mexico 366 408 11China 459 584 27Uganda 34 38 12El Salvador 15 47 213
EU-15 (4 countries) 2,732 3,488 32Latin America & Caribbean (10 countries) 1,626 749 -54East Asia & Oceania (5 countries) 870 1,506 73
2000 for Bulgaria, Estonia, Moldova, Ukraine, Armenia, Congo, Mongolia and Uganda.2/ 1997 for Kyrgyzstan; 1999 for Croatia, Latvia, Georgia, Zambia, Germany and Mexico;
Table 16: R&D Personnel per Million Inhabitants
UNESCO Institute for Statistics (1997 and 2004).1/ 1996 for Lithuania, Mexico, Tunisia, Uganda, Congo, Zambia, Mongolia, Germany and 1994 for Romania, Kyrgyzstan and Madagascar.
74
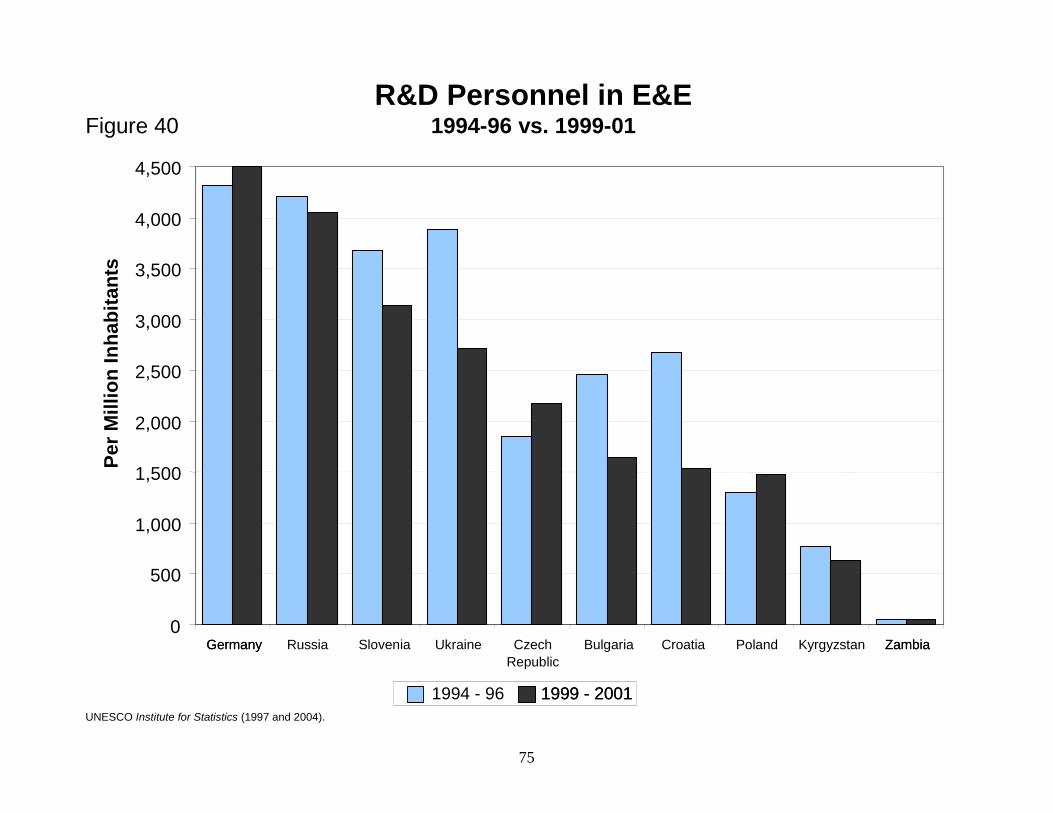
R&D Personnel in E&E1994-96 vs. 1999-01
UNESCO Institute for Statistics (1997 and 2004).
Per M
illio
n In
habi
tant
s
Economies1994 - 96 1999 - 20011999 - 2001
0
500
1,000
1,500
2,000
2,500
3,000
3,500
4,000
4,500
Russia Slovenia Ukraine CzechRepublic
Bulgaria Croatia Poland KyrgyzstanGermany ZambiaGermany Zambia
Figure 40
75
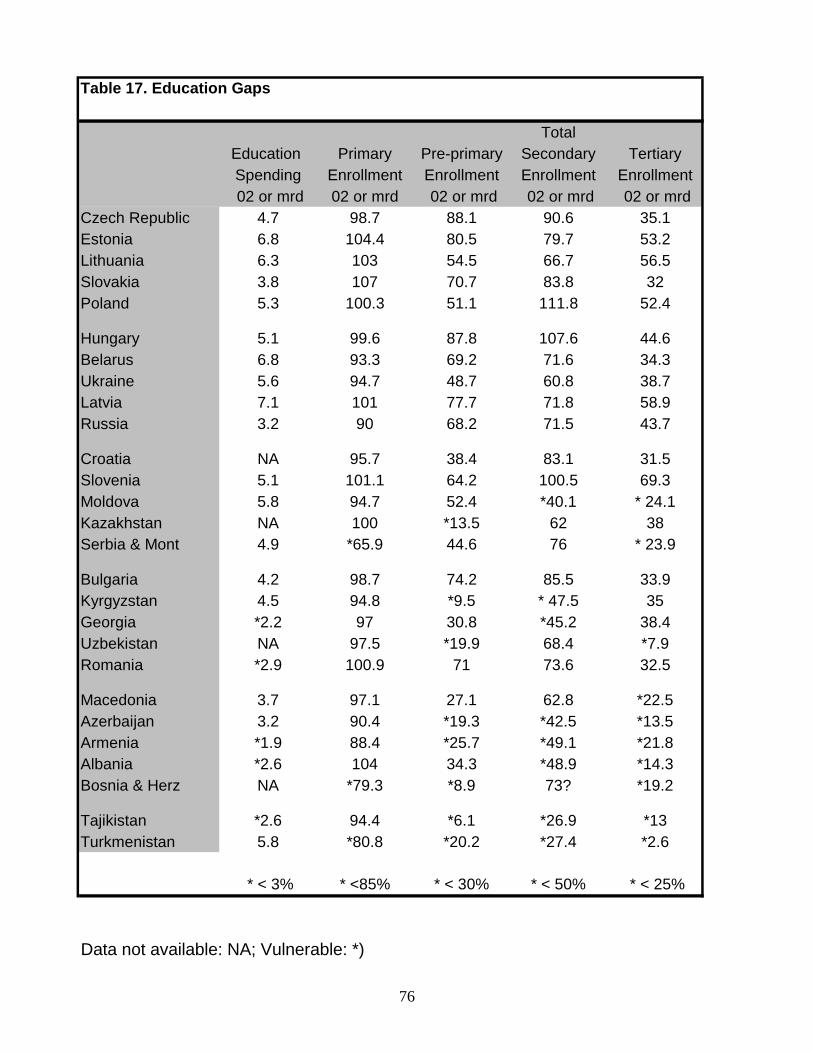
Table 17. Education Gaps
TotalEducation Primary Pre-primary Secondary TertiarySpending Enrollment Enrollment Enrollment Enrollment 02 or mrd 02 or mrd 02 or mrd 02 or mrd 02 or mrd
Czech Republic 4.7 98.7 88.1 90.6 35.1Estonia 6.8 104.4 80.5 79.7 53.2Lithuania 6.3 103 54.5 66.7 56.5Slovakia 3.8 107 70.7 83.8 32Poland 5.3 100.3 51.1 111.8 52.4
Hungary 5.1 99.6 87.8 107.6 44.6Belarus 6.8 93.3 69.2 71.6 34.3Ukraine 5.6 94.7 48.7 60.8 38.7Latvia 7.1 101 77.7 71.8 58.9Russia 3.2 90 68.2 71.5 43.7
Croatia NA 95.7 38.4 83.1 31.5Slovenia 5.1 101.1 64.2 100.5 69.3Moldova 5.8 94.7 52.4 *40.1 * 24.1Kazakhstan NA 100 *13.5 62 38Serbia & Mont 4.9 *65.9 44.6 76 * 23.9
Bulgaria 4.2 98.7 74.2 85.5 33.9Kyrgyzstan 4.5 94.8 *9.5 * 47.5 35Georgia *2.2 97 30.8 *45.2 38.4Uzbekistan NA 97.5 *19.9 68.4 *7.9Romania *2.9 100.9 71 73.6 32.5
Macedonia 3.7 97.1 27.1 62.8 *22.5Azerbaijan 3.2 90.4 *19.3 *42.5 *13.5Armenia *1.9 88.4 *25.7 *49.1 *21.8Albania *2.6 104 34.3 *48.9 *14.3Bosnia & Herz NA *79.3 *8.9 73? *19.2
Tajikistan *2.6 94.4 *6.1 *26.9 *13Turkmenistan 5.8 *80.8 *20.2 *27.4 *2.6
* < 3% * <85% * < 30% * < 50% * < 25%
Data not available: NA; Vulnerable: *)
76
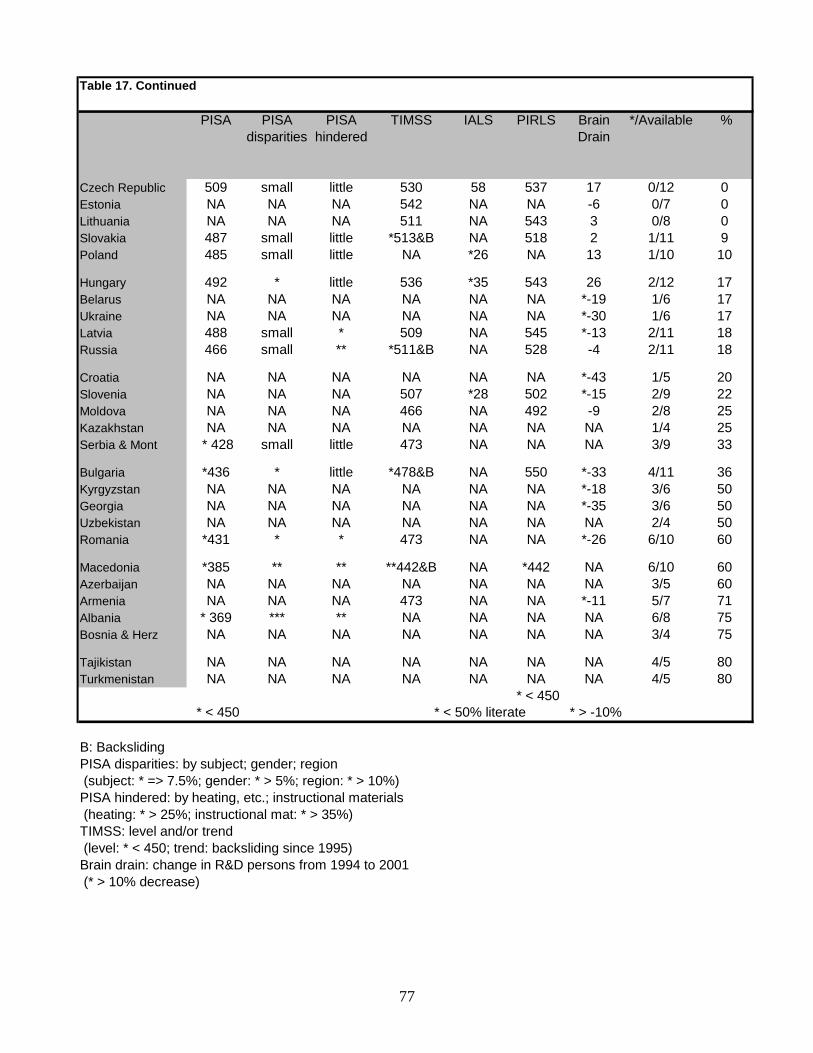
Table 17. Continued
PISA PISA PISA TIMSS IALS PIRLS Brain */Available %disparities hindered Drain
Czech Republic 509 small little 530 58 537 17 0/12 0Estonia NA NA NA 542 NA NA -6 0/7 0Lithuania NA NA NA 511 NA 543 3 0/8 0Slovakia 487 small little *513&B NA 518 2 1/11 9Poland 485 small little NA *26 NA 13 1/10 10
Hungary 492 * little 536 *35 543 26 2/12 17Belarus NA NA NA NA NA NA *-19 1/6 17Ukraine NA NA NA NA NA NA *-30 1/6 17Latvia 488 small * 509 NA 545 *-13 2/11 18Russia 466 small ** *511&B NA 528 -4 2/11 18
Croatia NA NA NA NA NA NA *-43 1/5 20Slovenia NA NA NA 507 *28 502 *-15 2/9 22Moldova NA NA NA 466 NA 492 -9 2/8 25Kazakhstan NA NA NA NA NA NA NA 1/4 25Serbia & Mont * 428 small little 473 NA NA NA 3/9 33
Bulgaria *436 * little *478&B NA 550 *-33 4/11 36Kyrgyzstan NA NA NA NA NA NA *-18 3/6 50Georgia NA NA NA NA NA NA *-35 3/6 50Uzbekistan NA NA NA NA NA NA NA 2/4 50Romania *431 * * 473 NA NA *-26 6/10 60
Macedonia *385 ** ** **442&B NA *442 NA 6/10 60Azerbaijan NA NA NA NA NA NA NA 3/5 60Armenia NA NA NA 473 NA NA *-11 5/7 71Albania * 369 *** ** NA NA NA NA 6/8 75Bosnia & Herz NA NA NA NA NA NA NA 3/4 75
Tajikistan NA NA NA NA NA NA NA 4/5 80Turkmenistan NA NA NA NA NA NA NA 4/5 80
* < 450 * < 450 * < 50% literate * > -10%
B: BackslidingPISA disparities: by subject; gender; region (subject: * => 7.5%; gender: * > 5%; region: * > 10%)PISA hindered: by heating, etc.; instructional materials (heating: * > 25%; instructional mat: * > 35%)TIMSS: level and/or trend (level: * < 450; trend: backsliding since 1995)Brain drain: change in R&D persons from 1994 to 2001 (* > 10% decrease)
77
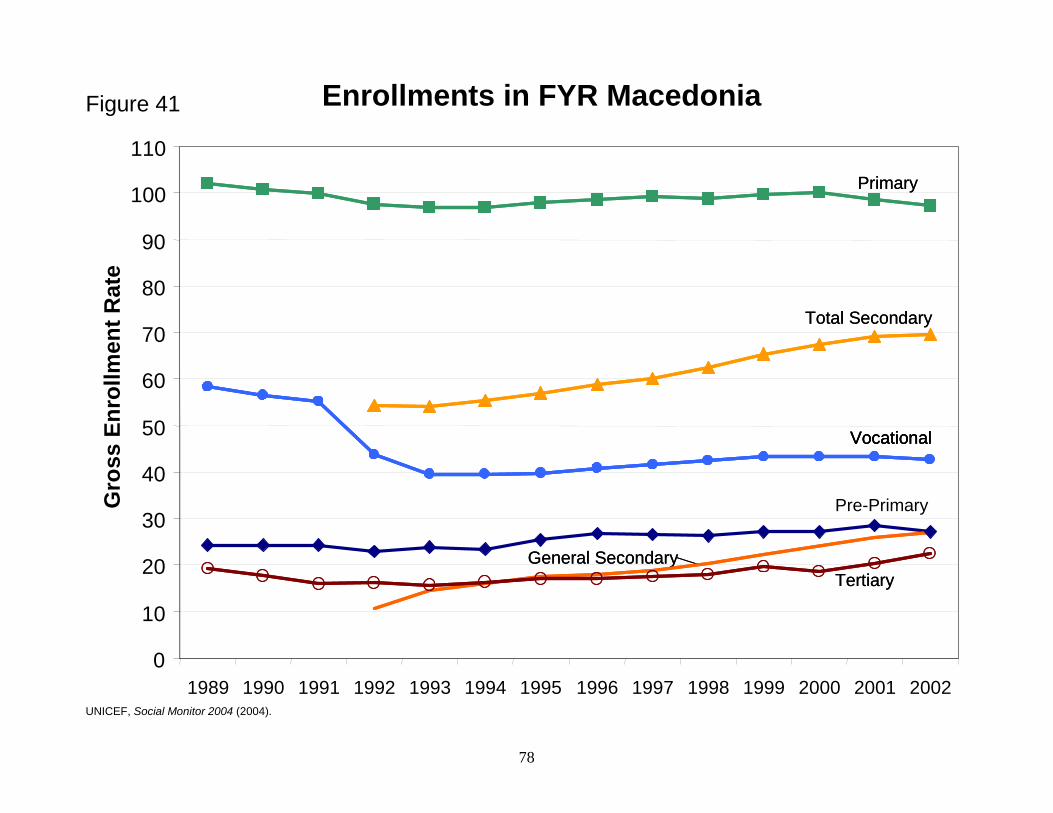
UNICEF, Social Monitor 2004 (2004).
Enrollments in FYR Macedonia Figure 41G
ross
Enr
ollm
ent R
ate
Pre-Primary
General SecondaryGeneral Secondary
PrimaryPrimary
Total SecondaryTotal Secondary
VocationalVocationalVocational
TertiaryTertiary
0
10
20
30
40
50
60
70
80
90
100
110
1989 1990 1991 1992 1993 1994 1995 1996 1997 1998 1999 2000 2001 2002
78
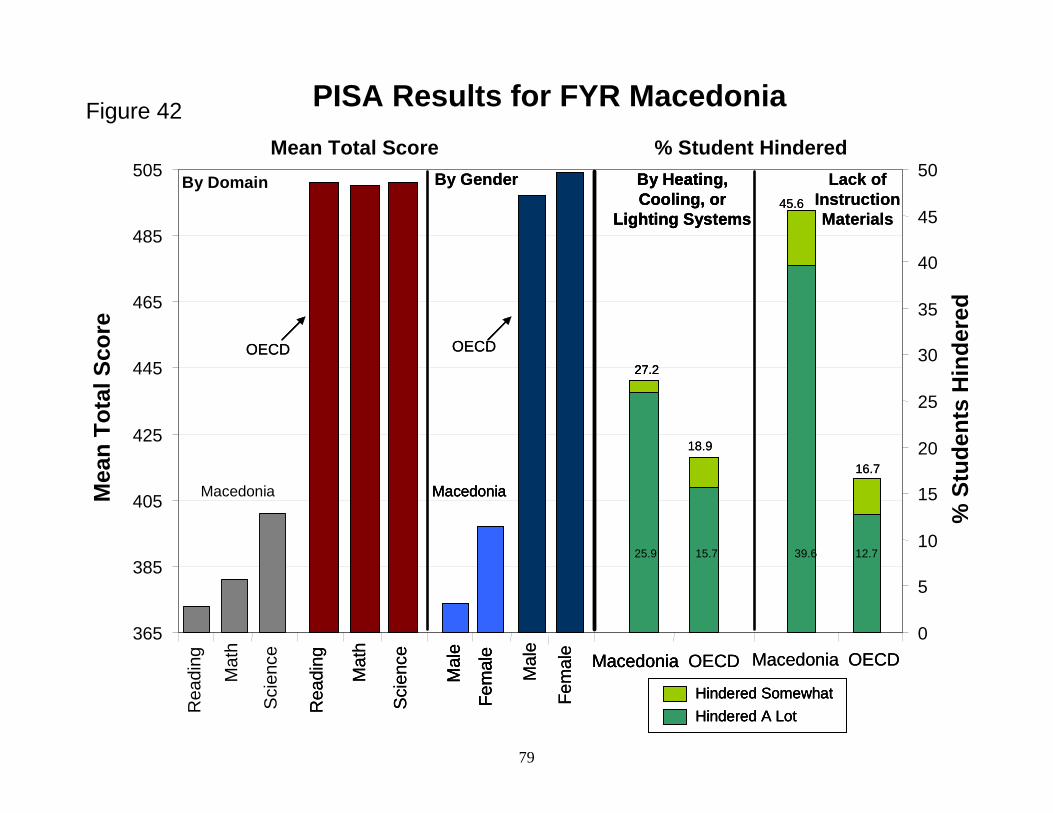
PISA Results for FYR MacedoniaFigure 42M
ean
Tota
l Sco
re
% S
tude
nts
Hin
dere
d
% Student HinderedMean Total ScoreBy Domain
Rea
ding
Mat
h
Sci
ence
365
385
405
425
445
465
485
505
0
5
10
15
20
25
30
35
40
45
50
Macedonia
By Gender
Mal
e
Fem
ale
Macedonia
By Gender
Mal
e
Fem
ale
Macedonia
Mal
e
Fem
ale
Macedonia
Rea
ding
Mat
h
Sci
ence
OECD
Rea
ding
Mat
h
Sci
ence
OECD
Mal
e
Fem
ale
OECD
Mal
e
Fem
ale
OECD
Hindered SomewhatHindered A Lot
By Heating, Cooling, or
Lighting Systems
Macedonia
25.9
27.2
Hindered SomewhatHindered A LotHindered SomewhatHindered A Lot
By Heating, Cooling, or
Lighting Systems
Macedonia
25.9
27.2
By Heating, Cooling, or
Lighting Systems
Macedonia
25.9
27.2
OECD
15.7
18.9
OECD
15.7
18.9
Lack of Instruction Materials
Macedonia
39.6
45.6
Lack of Instruction Materials
Macedonia
39.6
45.6
OECD
12.7
16.7
OECD
12.7
16.7
79
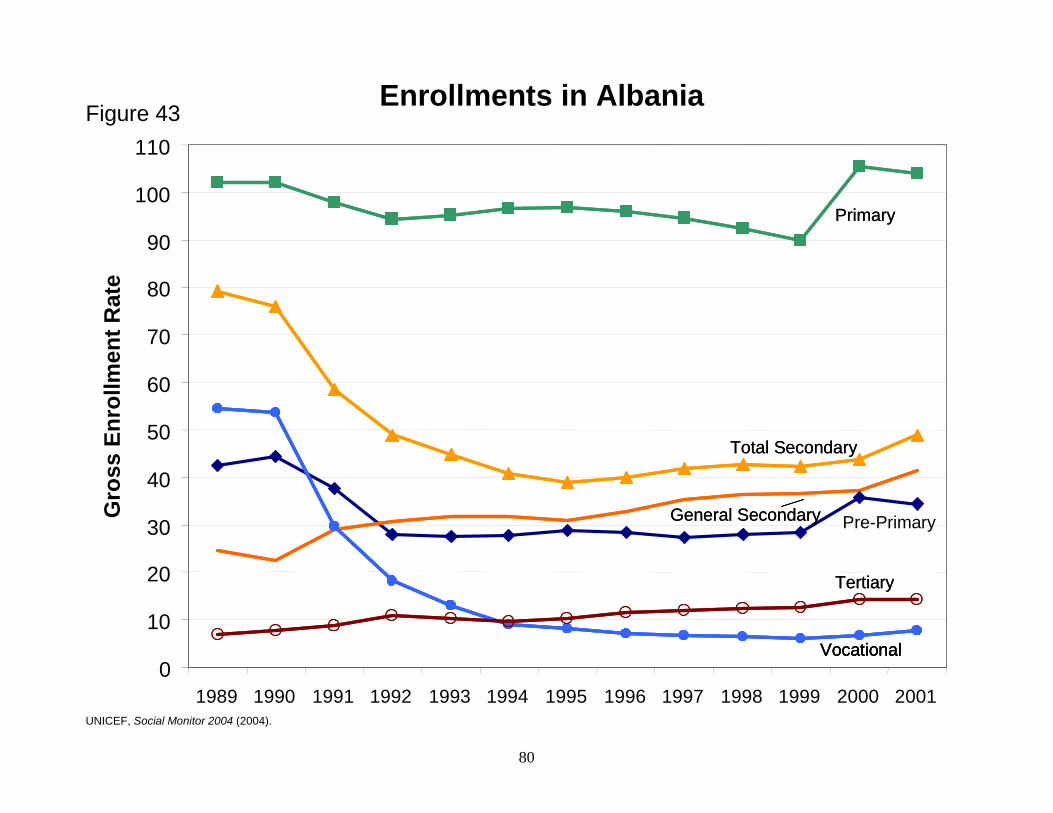
UNICEF, Social Monitor 2004 (2004).
Enrollments in Albania Figure 43
Gro
ss E
nrol
lmen
t Rat
e
Pre-PrimaryGeneral SecondaryGeneral Secondary
PrimaryPrimary
Total SecondaryTotal Secondary
VocationalVocationalVocational
TertiaryTertiary
0
10
20
30
40
50
60
70
80
90
100
110
1989 1990 1991 1992 1993 1994 1995 1996 1997 1998 1999 2000 2001
80
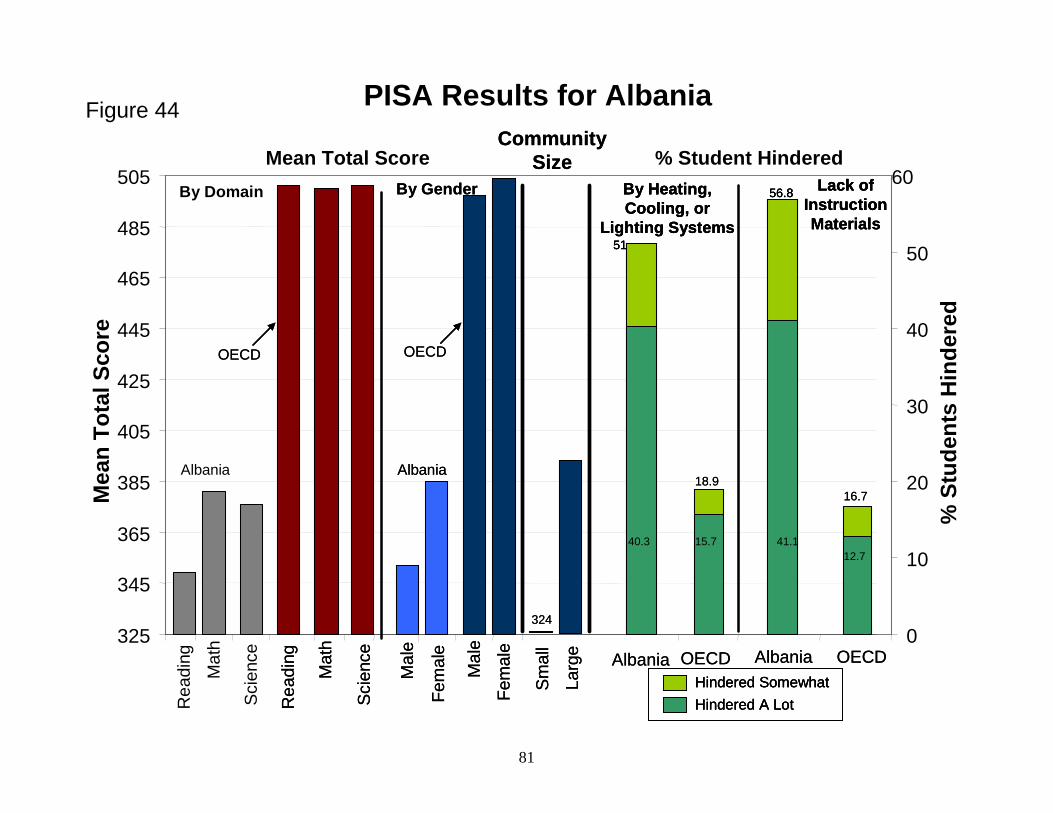
PISA Results for AlbaniaFigure 44M
ean
Tota
l Sco
re
% S
tude
nts
Hin
dere
d
% Student HinderedMean Total ScoreBy Domain
Rea
ding
Mat
h
Sci
ence
Albania
By Gender
Mal
e
Fem
ale
Albania
By Gender
Mal
e
Fem
ale
Albania
325
345
365
385
405
425
445
465
485
505
0
10
20
30
40
50
60
Mal
e
Fem
ale
OECD
Mal
e
Fem
ale
OECD
Rea
ding
Mat
h
Sci
ence
OECD
Rea
ding
Mat
h
Sci
ence
OECD
Larg
eLa
rge
Community Size
Smal
l
324
Community Size
Smal
l
324
Albania
By Heating, Cooling, or
Lighting Systems
Hindered SomewhatHindered A Lot
40.3
51
Albania
By Heating, Cooling, or
Lighting Systems
Hindered SomewhatHindered A Lot
40.3
51
By Heating, Cooling, or
Lighting Systems
Hindered SomewhatHindered A Lot
40.3
51
OECD
15.7
18.9
OECD
15.7
18.9
Albania
Lack of Instruction Materials
41.1
56.8
Albania
Lack of Instruction Materials
41.1
56.8 Lack of Instruction Materials
41.1
56.8
OECD
12.7
16.7
OECD
12.7
16.7
81
References Berryman, Sue, Rasnake, Roger, Allison, Christine. (2002) Education Systems of Europe and Eurasia: Strategic Investment Options for USAID. Aguirre International and the International Science and Technology Institute. Brown, Giorgina, Micklewright, John, Schnepf, Sylke, Waldmann, Robert. (2005) Cross National Surveys of Learning Achievement: How Robust are the Findings? ISTAT, Rome. Micklewright, John. (2000) Education, Inequality, and Transition. UNICEF Innocenti Research Centre, Florence. Mullis, I.V.S., M.O. Martin, E.J. Gonzalez, Kennedy, Ann (2004), PIRLS 2001 International Report: IEA’s Study of Reading Literacy Achievement in Primary School in 35 Countries, International Study Center, Lynch School of Education, Boston, College: Chestnut Hill, MA. Mullis, I.V.S., M.O. Martin, E.J. Gonzalez, S.J. Chrostowski (2004), TIMSS 2003 International Science Report: Findings from IEA's Trends in International Mathematics and Science Study at the Fourth and Eight Grades, International Study Center, Lynch School of Education, Boston, College: Chestnut Hill, MA. OECD (2004), Learning for Tomorrow's World: First Results from PISA 2003, Organization for Economic Development and Cooperation: Paris. OECD and Statistics Canada, Literacy in the Information Age: Final Report of the International Adult Literacy Survey. Ottawa, Ontario: Statistics Canada, 2000. OECD and UNESCO (2003), Literacy Skills for the World of Tomorrow: Further Results from PISA 2000, Organization for Economic Development and UNESCO Institute for Statistics. UNICEF, Innocenti Social Monitor 2004, Florence: UNICEF Innocente Research Center, 2004. Statistical Annex. USAID/EE/DGST. Social Transition Strategy. Bureau for Europe and Eurasia, 2005. USAID/EE/DGST. Social Issues Critical for Sustainability of Reform: Education Sector Discussion Paper (August 2003). US Department of Education. Comparing NAEP, TIMSS, and PISA in Mathematics and Science (2004).
82