Embed Size (px)
Citation preview

AP42 Section: 11.2
Reference: 3
Title: Atmospheric Emissions from Asphalt Roofing Processes,
€PA-65012-74-101
OH. EPA Contract No. 6842-1 321, Pedco Environmental, Cincinnati,
October 1974.

E PA-650/2 -74-1 01, 1' 11 OCTOBER 1974'
I 1 I I I
1 ASPHALT ROOFING 1 AP-42 Sec t ion 8.2
Reference Number
Environmental Protmtion ? e ~ . - .~,. i

~ _ _ _ _ ~
I
I I I I I I I I I
I ‘ I I I 1 I I 1 1
I EPA-650/2-74-101
ATMOSPHERIC EMISSIONS FROM ASPHALT ROOFING
PROCESSES
by
R . W . Gerstle
PEDCo-Environmental , Inc . -4tkinson Square (Suite 13)
Cincinnati, Ohio 45246
Contract N o . 68-02-1321 (Task 15) ROAP No. 2lAXM-011
Program Element N o . 1AB015
EPA Project Officer: Belur N . Murthy
Control Systems Laboratory National Environmental Research Center
Research Triangle Park , North Carolina 27711
Prepared for
OFFICE OF RESEARCH AND DEVELOPMENT U . S . ENVIRONMENTAL PROTECTION AGENCY
WASHINGTON, D . C . 20460
October 1974

EPA REVIEW NOTICE
This report has been reviewed by the National Environmental Research Center - Research Triangle Park, Office of Research and Development, EPA, and approved for publication. Approval does not signify that the contents necessarily reflect the views and policies of the Environmental Protection Agency, nor does mention of trade names o r commercial products constitute endorsement o r recommendation for use.
This document is available to the public for sale through the National Technical Information Service, Springfield, Virginia 22161.
.. 11
I I I I I 1 I I I I I I I I I I I I I d

I I I I I I( I 1 I I
l I I I 1 I I I
e
ABSTRACT
Asphalt roo f i ng manufacturing processes and the types o f a i r p o l l u t i o n c o n t r o l devices app l i ed t o them a re described. Q u a n t i t a t i v e data on c o n t r o l l e d and u n c o n t r o l l e d p a r t i c u l a t e and gaseous emissions, i n c l u d i n g p o l y c y c l i c compounds, from t h e a s p h a l t b lowing and f e l t s a t u r a t i n g processes a re provided. I n f o r m a t i o n on p l a n t l oca t i ons , p roduc t i on ra tes , and i n d u s t r y growth i s included. T o t a l u n c o n t r o l l e d p a r t i c u l a t e emissions from f e l t sa tu ra t i ng , c o n s i s t i n g l a r g e l y o f organic p a r t i c - u l a t e compounds, averaged from 3.9 t o 8.7 l b per t o n o f sa tu ra ted f e l t ; CO and gaseous hydrocarbons were a l s o emit ted. Control devices reduced these emissions by about 50%. compounds accounted f o r 0.0003% o f t he p a r t i c u l a t e ma t te r both before and a f t e r c o n t r o l . P a r t i c u l a t e m a t t e r was most ly smal ler than 1 micron. For a s p h a l t b lowing operat ions c o n t r o l l e d by fume i n c i n e r a t i o n , par- t i c u l a t e emissions amounted t o 0.3 t o 3.1 l b per 1000 g a l . (0.075 t o 0.79 l b per ton ) o f asphal t ; p o l y c y c l i c organic ma t te r ranged between 0.0008 and 0.0019% of the t o t a l p a r t i c u l a t e ; CO and gaseous hydrocarbons a r e a l s o emit ted. equipped w i t h a v a i l a b l e c o n t r o l devices does n o t have a major impact on ambient a i r concentrat ions.
Seven i d e n t i f i e d p o l y c y c l i c organic
These data i n d i c a t e t h a t a wel l -operated p l a n t
iii

TABLE OF CONTENTS
LIST OF FIGURES
Page No.
vii
LIST OF TABLES viii
ACKNOWLEDGMENTS X
SUMMARY AND CONCLUSIONS 1
1.0 INTRODUCTION 7
1.1 Technical Objectives 1.2 Industrial Classification 1 . 3 Acquisition of Information
2.0. INDUSTRY TRENDS AND ECONOMIC FACTORS FACTORS
2.1 Product Shipments 2.2 Industry Trends
7
9 a
.. 11
11 11
2.2 .1 Historical Sales Rates 11 2.2.2 Relationship to Construction
Industry ' 15 2.2.3 Relationship to Mining and
Mineral Products Industry 15
2.3 Geographic and Demographic Data 2 ..4 Economic Factors 2 . 5 Industry Growth Projections
1 9 2 1 23
3 . 0 RAW MATERIALS AND PRODUCT SPECIFICATIONS 26
3 . 1 Raw Materials 26
3 . 1 . 1 Bitumens 3.1.2 Filkers 3 . 1 . 3 Felts and Woven Fabrics
26 29 29
3 . 2 Product Description 30
3 .2 .1 Prepared Roofing 30 3 . 2 . 2 Asphalt Shingles 30 3 . 2 . 3 Adhesive Compounds for Build-Up
Roofs, Damp Proofing and Waterproofing 31 3.2 .4 Bituminous Cements 3 1
iv
-
I I I I 1 I I I I I 1 I I I 1 i I I I

I I I I I I I 1 I t I P I 1 fi tl I 1
TABLE OF CONTENTS (Continued) Page No.
3.3 New Product Development .. 32
4.0 PROCESS DESCRIPTION AND ATMOSPHERIC EMISSIONS
4.1 General 4.2 Saturator
33
33 35
35 4.2.1 Process Description 4.2.2 Atmospheric Emissions from Saturators 36
47 4.3 Asphalt Blowing
4.3.1 Process Description 4.3.2 Emissions
4.4 Mineral Surfacing Application 4.5 Hot Asphalt Storage 4.6 Sand Dryer
47 50
58 59 61
62
62
5 .0 CONTROL TECHNOLOGY AND COSTS
5.1, Control of Saturator Emissions
5.1.1 Electrostatic Precipitators 5.1.2 Scrubbers
63 64 r .
b 4 6 6 6 9
5.1.3 Afterburners 5.1.4 Mesh Filters 5.1.5 Saturator Emission Control Costs
5.2 5.3 Control of Surfacing Agents 5.4 Control of Holding Tank Emissions
Control of Asphalt Blowing Emissions
6.0 IMPACT OF ATMOSPHERIC EMISSIONS
6.1 Emission Summary
6.1.1 Particulate Emissions 6.1.2 Gaseous Emissions
6.2 Pollutant Effects 6.3 Ambient Air Concentrations
6.3.1 Method of Calculations 6.3.2 Calculated Ambient Air Concentrations
V
71 72 73
74
74
14 76
16 82
82 83

TABLE OF CONTENTS ( C o n t i n u e d )
6.4 Emission Impact
7 . 0 REFERENCES
8.0 APPENDICES
vi
Page No.
88
90
93
-
I I I I 1 I I I I 1 1 1 0 I f I I t I l

I I
I 1 0
1 f I I: I IE' 1 I 1 I 1 I
i
i
NO.
2 . 1
-
2.2
2.3
2.4
4 . 1
4 .2
4.3
4.4
5.1
5.2
6 . 1
6 .2
LIST OF FIGURES
Sale of Asphalt Roofing Products in the United States
New Housing Starts and Strip Shingle Production
Production of Petroleum Asphalts in the United States
Location of Major Asphalt Roofing Manu- facturing Centers and Number of Plants Identified in Each State
Asphalt Roofing Mill Process
Particle Size Distribution in Uncontrolled Saturator Exhaust
Air Blowing of Asphalt
Relation of Particulate Emissions and Asphalt Melt Point
Flow Diagram for Low-Voltage Electrostatic Precipitators
Flow Diagram for HEAF
Retention of Particulate Matter in Lung in Relation to Particle
Estimated Atmospheric Concentration of Emissions from Asphalt Roofing Plants
vii
Page No.
14
1 6
1 8
20
3 4
42
49
53
6 4
6 8
79
8 4

L I S T OF TABLES
Page No. No.
2 1 Average P a r t i c u l a t e and PPOM Emissions
4 2 Gaseous Emissions
1.1 Asphal t Roofing Products 8
-
2 . 1 Annual Shipments of Asphal t Products 1 2
2 . 2 P roduc t ion of Asphal t S a t u r a t e d Products by S i z e C l a s s , 1 9 6 7 13
2.3 Petroleum - Runs t o S t i l l s and Ref inery P roduc t s 1 7
2 . 4 Popu la t ions of Asphal t Roofing P l a n t Areas 2 1
2 . 5 C o n s t r u c t i o n M a t e r i a l s - I n d i c e s of Wholesale Prices 2 2
2 .6 Annual Changes i n Sales of A s p h a l t Roofing . Products and Other Parameters 25
3 .1 C l a s s i f i c a t i o n of B i t u m e n s 27
3 . 2 Elemental Analyses o f Aspha l t F r a c t i o n s and N a t u r a l Aspha l t s 28
4 . 1 Reported Uncontrol led P a r t i c u l a t e Emissions from Asphal t S a t u r a t o r s 37
4 . 2 P a r t i c u l a t e Emissions from Asphal t Sa tu ra to r s 38
4.3 PPOM Emissions from Asphal t S a t u r a t o r s
4 . 4 R e l a t i o n of PPOM t o Tota l Pa r t i cu la t e and Product Q u a n t i t i e s 45
4 ..5 Gaseous Emissions from Asphal t S a t u r a t o r s 46
4 . 6 Pa r t i cu la t e Emissions from Asphal t Blowing 51
4 . 1 PPOM Emissions from Asphal t Blowing 54
4 .8 Gaseous Emissions from Aspha l t Blowing 57
4 . 9 Ana lys i s of Vapors Disp laced During F i l l i n g 85/lOO Paving-Grade Asphal t i n t o a Fixed- . Roof Tank 60
v i i i
I 1
I I 1
I 1 I I I 1 t I I I 1 I
i
i

I I I I 1 I I 1 I I I I I a 1E I I 1 I
b
No.
5.1
5.2
-
6.1
6.2
6 . 3
6 . 4
6 . 5
LIST OF TABLES (continued)
Page No.
Control Equipment Used on Saturators
Economics Of Various Systems for Controlling
6 3
Emissions from Roofing Plant Saturators 70
Particulate and PPOM Emission Data Summary 7 5
Gaseous Emission Summary 77
Carcinogenic Potential of Selected Asphalt Roofing Emission Compounds 80
Atmospheric Concentrations of Particulate Pollutants from a lO-Ton/Hour Asphalt Roofing Plant 86
Atmospheric Concentrations of Gaseous Pollutants from a lO-Ton/Hour Roofing Plant 87
ix

1
ACKNOWLEDGMENTS
Dr. Belur Murthy of the Control Systems Laboratory,
u .S . Environmental Protection Agency, was EPA Project Officer,
providing technical review and direction. Mr. Richard
Gerstle, Project Manager f o r PEDCo-Environmental Specialists,
Inc., directed and participated in the preparation of this
report. Mr. William DeWees directed the field sampling and
analytical effort that comprised a major part of this study.
In addition, some of the major asphalt roofing manu-
facturers, especially Celotex Division of Jim walther Corpor-
ation and Johns-Manville Corporation, cooperated in providing
information for this study.
X
1 I I I I 1 1 I 1 I 1 I- 1 t f I I I 1
A

I I I I I I I 1 1 I I I I li I E I 1 I
SUMMARY AND CONCLUSIONS
The asphalt roofing industry as defined under Standard
Industrial Classification 2952 comprises establishments primarily
engaged in manufacturing asphaltic roofing products in roll
and shingle form. There are approximately 230 establishments
in the country which produced a total of 9.4 million short
tons of product in 1972 valued at $700 million. The industry
is related to the building industry and in recent years has
been growing at a rate of 3 to 4 percent per year. Raw material
supplies and costs are closely tied to the petroleum refining
industry.
The manufacture of asphalt roofing products consists of
impregnating a felt with specially prepared, heated asphalt.
This is accomplished by passing a continuous sheet of the felt
(usually heavy paper) over rollers in a saturator which is a
long narrow trough containing asphalt at 400-450°F. This dipping
causes the asphalt to coat the felt on both sides. The saturated
felt may be coated with granules and cut into shingles, or
shipped in roll form. Product specifications dictate the weight
(thickness) and exact type of felt, and the asphalt melt point.
Asphalt used in the saturator is prepared by blowing air
through it to reduce its volatile content and raise its melting
point. This batch operation is performed in vertical tanks or
stills with asphalt at a temperature of 430-500°F. Many roofing
plants buy asphalt which has already been blown, usually at an
oil refinery.
1

Atmospheric emissions of both gaseous and particulate
organic compounds occur from the blowing and saturating pro-
'cesses. These organic compounds include small amounts of
particulate polycyclic organic matter (PPOM). In addition,
gaseous emissions of CO, aldehydes, and sulfur compounds also
occur. The quantity of these emissions depends on the type
of product and on the type of emission control equipment.
Emissions of particulate and polycyclic particulate
matter (PPOM) are summarized in Table 1, and are based on
measured emission data obtained during this study.
Table 1. AVERAGE PARTICULATE AND PPOM EMISSIONS
Saturating
Blowing
- - operation I Particulate, lb/ton of felt I PPOM: 8 of particulate x
Uncontrolled I Controlled I Uncontrolled I Controlled
6.3 2.7 3.0 3.2
4.5 0.32 1.65 13
a) Seven identified compounds only. BaP is approximately 10% of this quantity.
These data show particulate emissions of approximately 6 . 3
and 2.7 pounds per ton of saturated felt for saturating operations
without controls and with controls. Higher control efficiencies
can be expected when control equipment is operated under optimum
2
1 1 I t I 1 1 I i I 1 I 1 t I i I 1 I

. _
1 1 1 I ! I I 1 1 I 1 1 P I I
) ‘I I 1 I
conditions. Approximately 50% by weight of the particulate
emissions are less than one micron in size.
PPOM accounted for 0.0003% of the collected particulate
matter. PPOM was reduced by passage through control devices
used to reduce particulate emissions. This reduction was in
direct proportion to the particulate reduction.
Saturator emissions are controlled by a variety of de-
vices including afterburners, High Energy Air Filters (HEAF),
and low voltage electrostatic precipitators. Operating costs
for saturator control devices vary widely depending on the type
of device and are in the range of $0.26 to $3.1 per ton of
saturated felt. When afterburners are used, the heat generated
is partially used to preheat asphalt.
Particulate emission rates from blowing operations are
highly variable and increase when high-melt-point asphalt is
produced.
These emissions averaged 4.5 and 0.3 pounds per ton of
saturated felt for the uncontrolled and controlled conditions
respectively. PPOM emissions from blowing amounted to 0.0013% of
the total particulate after a fume incinerator.
Practically all asphalt blowing operations are controlled
by direct-fired fume incinerators. These devices are fre-
quently process heaters used to preheat the asphalt before gas
or light oil are used as fuels.
3

Emissions of carbon monoxide and gaseous hydrocarbons
a r e summarized i n Table 2.
Table 2 . GASEOUS EMISSIONS
( l b / t o n o f s a t u r a t e d f e l t )
a ) T o t a l gaseous hydrocarbons expres sed as methane.
NOTE: Range v a l u e s are averages of t e s t d a t a .
These d a t a show t h a t CO averaged 6 . 3 and 2 . 7 pounds p e r
t on of s a t u r a t e d f e l t be fo re and a f t e r con t ro l equipment.. .
Gaseous hydrocarbons averaged approximate ly 0 . 5 pound pe r
t o n of f e l t . Aldehydes were p r e s e n t i n sma l l amounts and
a v e r a g e less t h a n 0 .05 pound p e r t o n . Fume i n c i n e r a t o r s
were o n l y p a r t i a l l y e f f e c t i v e i n r educ ing t h e s e p o l l u t a n t s .
Blowing o p e r a t i o n s y i e lded emiss ions s i m i l a r t o t h o s e
from f e l t s a t u r a t i n g . I n a d d i t i o n , hydrogen s u l f i d e i n t h e
range of 0 . 3 t o 0 . 7 p a r t per m i l l i o n was p r e s e n t i n t h e un-
c o n t r o l l e d g a s s t ream.
t h e H2S was reduced t o l e s s t han 0 . 0 2 ppm.
A f t e r passage through a fume i n c i n e r a t o r
4
P 1 I 1 I 1 1 1 I I I s 3 1 I1 1 I I I I,

I I 1 I 1 1 I 1 1 1 1 I I t I 0 I I I
Sulfur dioxide emissions from blowing operations vary
directly with the asphalt's sulfur content, and during one
test amounted to 0.5% of the sulfur present in the asphalt.
Particulate emissions from other processes associated with
roofing include those from sand drying and application of
surfacing agents.
available equipment and are not usually a problem.
These emissions are readily controlled by
Ambient air concentrations were calculated utilizing a
single point dispersion model; and emission parameters de-
termined from this study. These calculations show that
asphalt roofing plants with emission controls would not be
expected to cause primary ambient air standards for par-
ticulate, CO and gaseous hydrocarbons to be exceeded under
normal operating conditions. Particulate emissions from un-
controlled plants could however, cause excessive ambient air
concentrations. Odors also occur from poorly controlled
plants.
Ambient air standards for PPOM compounds do not exist.
However, based on available information, it does not appear
that roofing plants with typical particulate controls are
a major contributor of these compounds to the ambient air.

CONVERSION FACTORS
ENGLISH UNITS TO METRIC UNITS
Multiply by To Obtain
Atmosphere 760.0
BTU (British Thermal Units) 252.0
Cubic foot 28.32
Foot 30.48
Gallons (US) 3.785
Grain 0.065
Crains/cubic foot 2288
tlorsepower 0.7457
Pound 435.6
Tons (long) 1016
Tons (short) 907.0
6
millimeters of mercury
gram calories
liters
centimeter
liters
gram
milligrams/cubic meter
kilowatts
grams
kilogram ,
kilogram
I. I I t I 1 I I I I I I 1 I I Y 1 I 1

I I 1 1 I 1 I 1 1 I 1 I I I 1 1 I 1 I
1.0 INTRODUCTION
This report presents results of a study to characterize
and measure atmospheric emissions from asphalt roofing manu-
facturing processes and related information on control equip-
mcnt and the impact of emissions on the ambient air in the
vicinity of asphalt roofing plants.
1.1 TECHNICAL OBJECTIVES
The primary objectives of this study were to measure
the atmospheric emissions of particulate polycyclic organic
matter (PPOM) from asphalt roofing manufacturing processes:
to describe the demographic parameters of this industry, such
as size, location, and growth patterns: to determine the
impact of emissions on the ambient air: and to predict the
degree of control required to maintain levels of pollutants
in the ambient air. The characterization of PPOM included
quantitative measurements of effluent gas streams to deter-
mine concentrations of selected polycyclic organic compounds
before and after control devices. Two asphalt blowing and
two saturating operations, representing the major process
segments, were tested to determine emission rates. Emission
rates were related to various process variables to provide a
basis for estimating emissions from other plants within this
industry.
7

1.2 INDUSTRY CLASSIFICATION
The asphalt roofing industry, Standard Industrial Clas-
sification 2952, comprises establishments engaged primarily
in manufacturing asphalt and tar roofing products in roll
and shingle form, either smooth or faced with grit, and in
manufacturing roofing cements and coatings. Products within
these categories are listed in Table 1.1.
Table 1.1 ASPHALT ROOFING PRODUCTS CATEGORIES
Roll roofing and cap sheets
Smooth-surfaced Mineral-surfaced
Strip shingles
Standard Self-sealing
Individual shingles
Asphalt sidings
Roll form Shingle form
Insulated siding
Saturated felts
Asphalt Tar
Adhesive compounds
Built-up roofing Damp proofing and waterproofing
Bituminous cement (asphalt putty)
8
I I I I I I I I 1 1 I I I 1 I I I I I

il I I 1 I 1 I 1 1 !I 1 I I 1 I I I I I
1.3 ACQUISITION OF INFORMATION
Process descriptions were formulated by consulting the
technical literature, visiting asphalt roofing plants, and
conversing with various industry personnel and control equip-
ment vendors. Statistical data were obtained largely from
the U.S. Government Department of Commerce and the Bureau of
Mines.
from listings of the Asphalt Roofing Manufacturer's Association,
Dun 6, Bradstreet, and EPA's emission data survey listings. It
is believed that all major manufacturing plants as of mid-1973
were identified in these surveys.
Plant locations were determined to the extent possible
Equipment vendors were contacted,to obtain information on
efficiencies and costs of controls and related information as
applied to asphalt roofing.
Some emission data were obtained from the literature
and from vendor's information. Since these data usually were
not related to process parameters, their usefulness was limited.
Therefore, emission data for this report were obtained mainly
from field tests conducted as part of this project at two
asphalt blowing and two saturator operations. Standard stack
sampling methods as specified in the Federal Register were used
in the emission tests wherever possible. The particulate
sampling train (EPA Method 5 ) included impingers contained in
an ice-water bath and a final "cold" filter to trap PPOM com-
pounds. All PPOM analyses were performed with gas chromato-
graphic separation and mass spectrophotometric detection by .
9

a I I I I I I I I I I I I I I I I 1 1
Battclle Laboratories in Columbus, Ohio. Emissions were
. sampled under two distinct operating conditions at each plant,
and samples were collected before and after the control device.
10
I! 1 I' 1 1; li E 1 I 1 I I ' I 1 I I I I I
2.0 INDUSTRY TRENDS AND ECONOMIC FACTORS
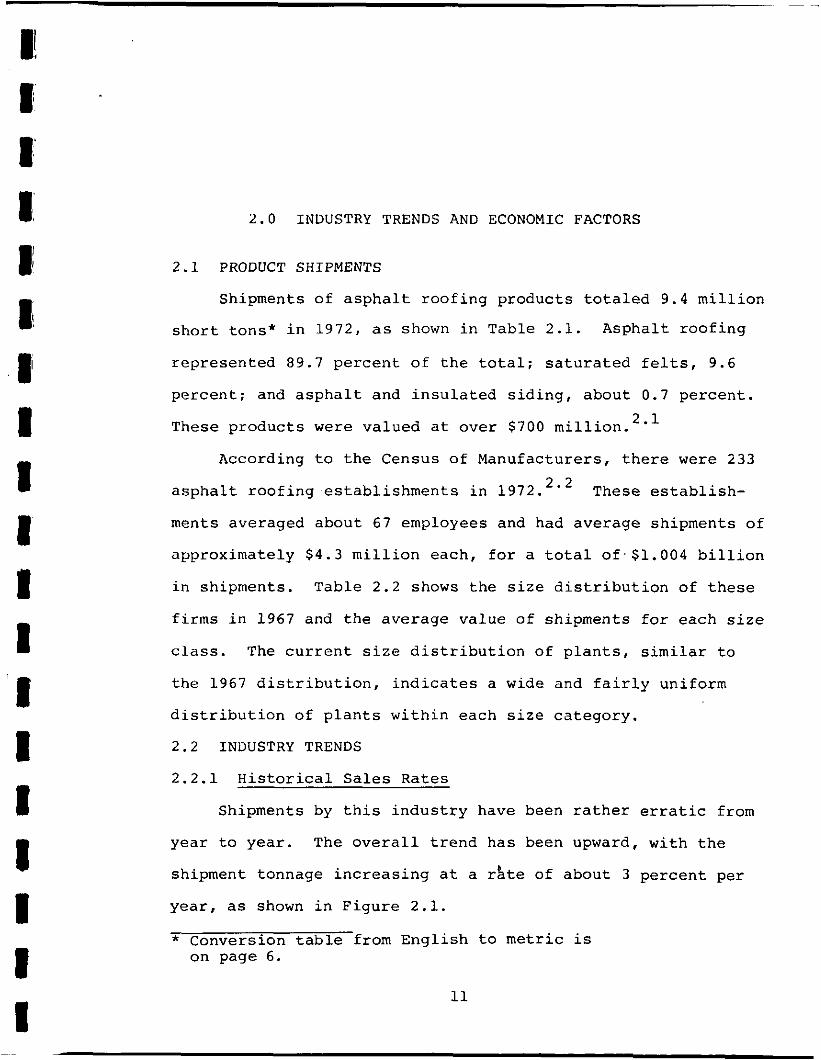
2.1 PRODUCT SHIPMENTS
Shipments of asphalt roofing products totaled 9.4 million
short tons* in 1972, as shown in Table 2.1. Asphalt roofing
represented 89.7 percent of the total; saturated felts, 9 .6
percent; and asphalt and insulated siding, about 0.7 percent.
These products were valued at over $700 million. 2.1
According to the Census of Manufacturers, there were 2 3 3
asphalt roofing establishments in 1972. 2 * 2
ments averaged about 6 7 employees and had average shipments of
approximately $4.3 million each, for a total of.Sl.004 billion
in shipments. Table 2.2 shows the size distribution of these
firms in 1967 and the average value of shipments for each size
class. The current size distribution of plants, similar to
the 1 9 6 7 distribution, indicates a wide and fairly uniform
distribution of plants within each size category.
2.2 INDUSTRY TRENDS
2.2.1 Historical Sales Rates
These establish-
Shipments by this industry have been rather erratic from
year to year. The overall trend has been upward, with the
shipment tonnage increasing at a rate of about 3 percent per
year, as shown in Figure 2.1.
* Conversion table from English to metric is on page 6.
11

4
N Lo H U 3 a
!& 8
GI 0 Lo El z w E H
. x Lo
7.4
N
a, .-I a m El
CI 0 N VI
N yl m N E
1 I I I I 1 I I 1 I I I I I I 1 I I 1
12

I I I I I I
I
1
I I
1
Table 2.2 PRODUCTION OF ASPHALT SATURATED 2.3 PRODUCTS BY SIZE CLASS, 1967
Number of employees
1 to 4
5 to 9 . 10 to 19
20 to 49
50 to 99
100 to 249
250 to 499
500 to 999
Total
Number of establishments
33
22
33
46
44
42
4
2
226
13

m I- d Y Y
n W I- 4 LL 3 I- U v)
I I I
ln a, c, m c, Ul
v a, c, .-I C 3 a, c CI
C .-I
10 c, 0 I a 0 h a tn C -4 u.l 0 0 h c, rl m c a rn m u.l 0 a, rl m ffl
rl
N
a, M I tn 4 ru
14
1 I I I 1 I I I I I I I I 1 I I I I I
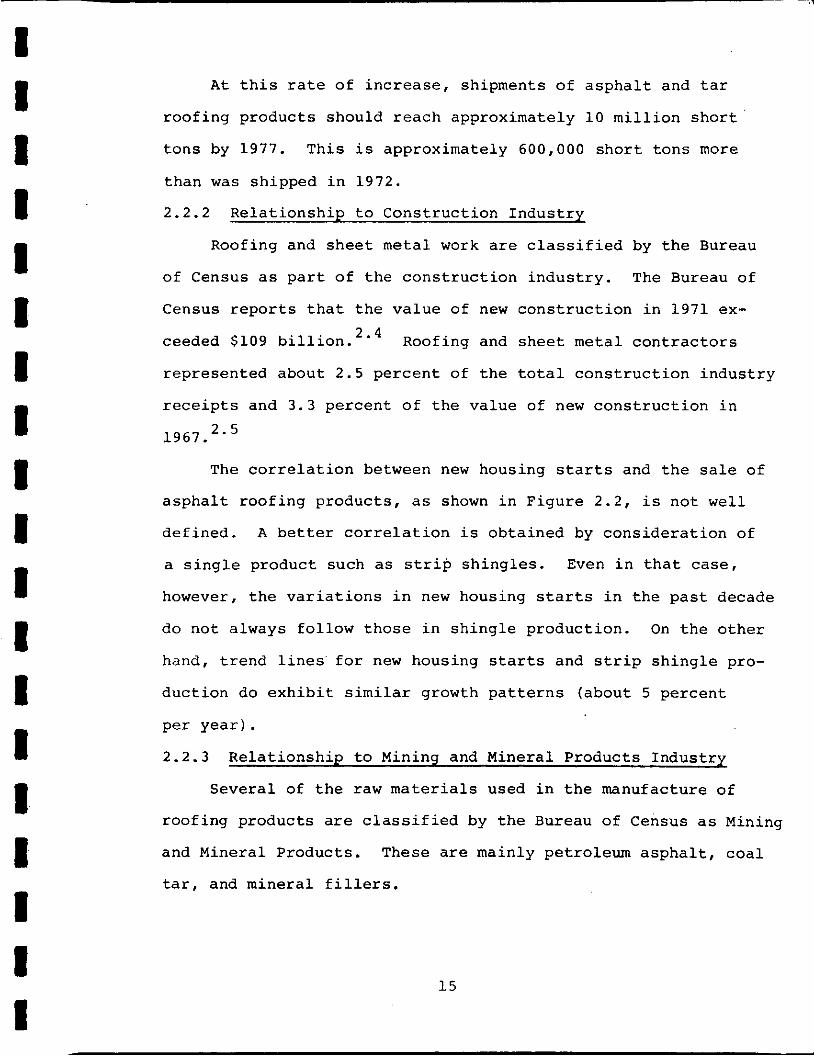
At this rate of increase, shipments of asphalt and tar
roofing products should reach approximately 10 million short
tons by 1977. This is approximately 600,000 short tons more
than was shipped in 1972.
2.2.2 Relationship to Construction Industry
Roofing and sheet metal work are classified by the Bureau
of Census as part of the construction industry. The Bureau of
Census reports that the value of new construction in 1971 ex-
ceeded $109 billion. 2.4
represented about 2.5 percent of the total construction industry
receipts and 3.3 percent of the value of new construction in
Roofing and sheet metal contractors
2.5 1967.
The correlation between new housing starts and the sale of
asphalt roofing products, as shown in Figure 2.2, is not well
defined. A better correlation is obtained by consideration of
a single product such as strip shingles. Even in that case,
however, the variations in new housing starts in the past decade
do not always follow those in shingle production. On the other
hand, trend lines for new housing starts and strip shingle pro-
duction do exhibit similar growth patterns (about 5 percent
per year).
2.2.3 Relationship to Mining and Mineral Products Industry
Several of the raw materials used in the manufacture of
roofing products are classified by the Bureau of Census as Mining
and Mineral Products. These are mainly petroleum asphalt, coal
tar, and mineral fillers.
15

0
- d g c 0 .d u U 3 a 0 !-I a
a .rl b 4J v)
a c m rn u b m u rn tn c TI u) 3 0 c
cu (v
16
~
I I I I I 1 I I 1 I I I I 1 I 1 1 I 1 -

I I I I 1 I I I I
, I I
' I I I I I I I I
' .
Figure 2.3 shows the amount of asphalt used in roofing
products in relation to total asphalt production. These data
show that the roofing products industry consumes approximately
16 percent of the asphalt produced. Paving consumes the major
portion.
has decreased from 25 percent in 1953 to the current 16 percent,
even though total consumption has increased.
The percent of asphalt used in the roofing industry
Table 2.3 shows the total asphalt produced as a function
of quantities of petroleum and natural gas refined.
Table 2.3 PETROLEUM-RUNS TO STILLS AND REFINERY PRODUCTS, BY CLASS 2.6
(in millions of barrels of 4 2 gallons)
?ROD"CT I Iuo I I U S 1 lw I I j I 1 I910 I(;;;;,)
The quantity of asphalt produced as a percent of crude
input increased from 2.6 in 1950 to 3.2 in 1960 and to 3.5
percent in 1972.
If asphalt shortages occur and prices rise, the roofing
industry would probably increase its portion of total asphalt
consumption and the paving industry would switch to other
17

. \
\ i-.,
8
I
18
v) a, U
4J [I)
v a, U .r(
c 3
a, c 4J
c .rl
10 4 d m c a 10 m
a
5 a, d 0 N
4J a, a W 0 c 0
.rl 4J 0 5 a 0 u P4
m
N
a, u 5 0 .d h
~
I I 1 I 1 I I 1 I 1 I I 1 1 I 1 I I I ,

4; I; I I
I # It I 1 1 II I I I
I I I I I
paving materials, such as concrete. This would occur because
there is no known substitute for asphalt roofing.
Although coal tars are a part of the mining and minerals
industry classification, their use is 'not a major factor in
the roofing industry because of their increased cost.
In 1 9 7 2 the roofing industry used almost 2.5 million tons
of mineral granules in shingle production. This amount, how-
ever, is less than l percent of total sand and gravel shipments
in the U.S.
2 . 3 GEOGRAPHIC AND DEMOGRAPHIC DATA
Figure 2.4 shows the approximate location of asphalt
producing centers in the U . S . and the number of identified
establishments in each state. This map shows that major producing
areas coincide with population centers and that this industry is
located in 3 4 states.
vidual asphalt roofing plants compiled from available listings.
The table also gives the approximate dollar value of products
produced in each state.
Table A-1, Appendix A , is a listing of indi-
Six large plants account for about 20 percent of the
production of asphalt roofing products in the United States.
The balance of production is in medium-sized plants. Table 2.4
summarizes plant location and population data, which show that
the large majority of plants are located in larger cities and
urban areas.
1 9

. .. . . . ~ . ... . ... .... -- . .
20
I 1 I 1 I 1 1 1 I I I I
I I I I P

I ' I I I I I 1 I
' 1 I I I I I
I 1 1 I I 1
I I
Under 10
Table 2.4 POPULATIONS OF ASPHALT ROOFING PLANT AREAS
1 0 5 0 to 1 0 0 500 to Over to 50 100 to 500 1,000 1,000
Number of plants
Six largest plants
4 2 4 2 22 4 5 2 6 2 5
1 2 3
Asphalt is a major component in roofing product manufac-
ture as well as a by-product from crude oil refining. The
quantity of asphalt present in the crude oil varies consider-
ably from one geographic area to another. This variation would
suggest that certain economies could be achieved by locating
plants near the geographic areas where large quantities of crude
oil are refined. This occurs to some extent, since a large
portion of roofing product sales comes from plants 1ocated.h
Texas, California, Illinois, and Ohio, which also have large
refining facilities. Location of plants in 30 other states,
however, indicates that shipping economics favor manufacturing
of roofing products in the geographical area in which they are
to be used. To serve these regional plants, asphalt must be
transported from the refinery to the plant.
2.4 ECONOMIC FACTORS
Table 2.5 shows the indices of wholesale prices on various
commodities in selected years from 1 9 5 0 to 1971.
2 1

Table 2.5 CONSTRUCTION MATERIALS INDICES OF 2.5 WHOLESALE PRICES
(1967 = 100)
NA = Not available. X = Not applicable.
The indices for asphalt roofing generally appear very
stable, showing a slight price increase over a long period of
time. A large increase occurs, however, from 1970 to 1971;
over 3 times the total rise for the last 15 years. Softwood
lumber is the only other commodity that even approximates to
such a pattern of sharp increase. With such a price jump not
occurring throughout the industry, a drop in sales of asphalt
products might be expected. The sales, however, increased.
The following conclusions are drawn from these data-on the
relationship between the roofing industry and the total con-
struction industry:
1) Although the roofing industry represents a major seg-
ment of the construction industry, the sale of roofing products
22
I! I I I I I 1 1 I I' I I 1 I I I I I I

4 I .I I 1 I I I I I I 1 I I I I I I I
is not as dependent upon new construction start's as is the rest
of the construction industry. This is true partly because of
the large replacement market for roofing products.
2 ) After a tradition of few large price changes, the
price of asphalt roofing increased 2 3 . 4 percent in 1 year with
no apparent loss in sales, an indication that there are few
economically feasible substitutes. This finding suggests that
the industry could pass along price increases that might result
from the installation of pollution control devices without sub-
stantial loss of product sales.
Currently, residential property holders spend about $ 3 2 0
per year per residence for improvements, maintenance, and
repairs. 2 . 6
1965 (when adjusted for inflation). Roofing represents about
7 percent of this maintenance bill, which includes roofing pro-
ducts, labor, and profits. Revenues of this segment of the
construction industry exceeded $1 billion in 1971.
2.5 INDUSTRY GROWTH PROJECTIONS
This amount has remained relatively constant since
The asphalt roofing industry appears economically healthy,
having been able to date to pass on increased costs of raw
materials and labor to the consumer. The industry has shown
steady overall increases in sales, with fluctuations occurring
at various intervals. Possible shortages of crude oil and
therefore of asphalt, probably will not affect the roofing
industry greatly, since it represents only a small portion of
total asphalt consumption. Because the refining of crude always
2 3

r e s u l t s i n t h e product ion of a s p h a l t i c compounds or r e s i d u a ,
changes i n r e f i n i n g product mix w i l l have l i t t l e e f f e c t on
a s p h a l t p roduc t ion .
Records show t h a t the p roduc t ion of s a t u r a t e d f e l t s and
i n s u l a t e d s i d i n g h a s been f a i r l y l e v e l . Product ion of r o o f i n g
p roduc t s ( e s p e c i a l l y s h i n g l e s ) , however, has grown a t a n
average rate of about 3 . 6 p e r c e n t d u r i n g t h e l a s t 1 0 y e a r s .
Table 2.6 shows t h e percentage changes i n v a r i o u s parame-
ters and changes i n r o o f i n g product s a l e s . N o d i r ec t c o r r e l a -
t i o n s between t h e s e parameters a r e e v i d e n t .
P r o j e c t i o n s of t h e growth t r e n d s of t h e a s p h a l t r o o f i n g
i n d u s t r y a r e t h u s best based on p a s t performance, a s shown
earlier i n F i g u r e 2 . 1 ; t h e i n d u s t r y w i l l probably con t inue f o r
t h e n e a r f u t u r e t o grow a t an ave rage r a t e of 3 t o 4 p e r c e n t per
year . T h i s t r e n d w i l l con t inue u n t i l some o t h e r product
f i n a l l y r e p l a c e s a s p h a l t a s an economical r o o f i n g c o n s t i t u e n t .
N o such p roduc t i s c u r r e n t l y e v i d e n t .
24
I I ~ 8, I I I I I 'I I I I I I I I I I I I

W z H
I I I 1 I I I I 1 I I 1 I I I I I 1 I
2 5

3 . 0 RAW MATERIALS AND PRODUCT SPECIFICATIONS
This section describes the raw materials used in the
asphalt industry and the resulting asphalt products as a basis
for understanding of the major process steps and potential
pollutant emissions. Additional detailed information is
given in the references for this section.
3.1 RAW MATERIALS
Three major types of raw materials are required to pro-
duce asphalt roofing materials: (1) bitumens, consisting
mainly of asphalt and.tar, ( 2 ) solid filler and coating mate-
rials, and ( 3 ) felts and woven fabrics.
3.1.1 Bitumens
Within the United States the term "bitumen" refers to
either asphalt or coal tar products. The two major sources
of bituminous material are petroleum, which yields petroleum
asphalt, and coal, which yields coal tar and roofing pitch.
Table 3 . 1 classifies bituminous materials.
3.1.1.1 Asphalt - Asphalt is defined by the American Society for Testing and Materials as "a dark brown to black cementi-
tious material, solid or semisolid in consistency, in which
the predominant constituents are bitumens which occur in nature
3 . 1
as such or are obtained as residua in refining petroleum. w3.3
26
I I I I I 1 I I 1 I I I I 1 I 1 I I I

I I I 1 1 I I I' 1 I I I I I I I I I I
3 . 2 Table 3.1 CLASSIFICATIONa OF BITUMENS
Asphalts
1. Petroleum asphalts
A. Straight-reduced asphalts 1. Atmospheric or vacuum reduction 2. Solvent precipitated
8. Thermal asphalts, as residues from cracking operations on petroleum stocks
C. Air-blown asphalts 1. Straight-blown 2. "Catalytic"-blown
2. Native asphalts
A. With mineral content below 5 percent 1. Asphalitites such as gilsonite,
grahamite, and glance pitch 2. Bermudez and other natural deposits
B. With mineral content over 5 percent 1. Rock asphalts 2. Trinidad and other natural deposits
Tars and derivatives ~ :I
1. Residua from coke-derived coal tars
A. Coal tars reduced to float grades, as road tar grades for paving purposes
B. Coal-tar pitches, with reduction carried out to soften-point grades
2. Residua from other pyrogenous distillates as from water-gas, wood, peat, bone, shale, rosin, and fatty acid tars
aThe following terms relate to the generic terms used in defining asphalt composition:
Carboids - highest carbon fraction insoluble in C S 2 . Carbenes - insoluble in CCL4 but soluble in CS . Asphaltenes - insoluble in pentane, hexane, an3 naptha. Petrolenes (malthene) - define as nonasphaltenes. Carbines are not present in blown asphalts.

petroleum asphalts are by far the most important source of
asphalt in the United States today. These asphalts result
from the distillation of crude oil and represent the non-
volatile components remaining in the still after distillation
(bottoms). These asphalts are mainly classified by their
physical characteristics, not their chemical composition.
Most asphalt stock (flux) used in the roofing industry
is air-blown to modify the properties of the flux. Asphalt
must have very high viscosity (estimated at 7 x 10 poises
minimum) to hold granules in place in roofing shingles. Granule
movement during the life of the shingle must be small. Air-
blown asphalts have higher viscosity than other types and are
therefore more suitable for shingle manufacture.
..
8
Because of their cohesiveness, asphalts also are inherently
waterproof and weather resistant. Air-blown asphalts are par-
ticularly durable. Table 3.2 shows the chemical analyses and
some physical properties of typical asphalts. The relatively
high softening point of air-blown asphalt results from the
removal of some of the more volatile compounds.
Table 3.2 ELEMENTAL ANALYSES OF ASPHALT 3.3 FRACTIONS AND NATURAL ASPHALTS
11.0-30.6 10.5-83.5 69.4-77.0 81.0-84.1
31.7-19.5 60.5-61.3 ma. 5-1,. 3
I I
. -nul a". B
7.3-1.0 10.0-10.6
7.8-11.2 10.9-11.5
5.) 7.9
10.7 10.1
- - 4.6-8.1 0..-5.1
3.7-7.3 1.1-5.4
3 .0 3.7
6 . 1 1.9
-
II
0.4-0.9 0.5-0.5
0.5-0. 1 0.4
0.4 0 .1
0.1 0.8
-
a- - - 0-1.1
0.7-1.4
1.0-1.8 0.8-1.3
-
I I I I I I I I I I I I 1 I I I I I I

~
I I I I I I I I' I I I I I I I I I I I
3.1.1.2
products obtained in the pyrogenous treatment of organic sub-
stances. The most'important source of coal tar in the United
States is from coke oven operations.
Tars - - Tars constitute the volatile oily decomposition
The use of coal tar and coal-tar pitch in the roofing indus-
try has been almost exclusively confined to built-up roofing,
i.e. tar applied directly to the roof. These tars represent
only a small po'rtion of the total roofing industry materials.
3.1.2 Fillers -- Fillers used for roofing products include mineral fillers
such as sand and other fine oxides, silicates, carbonates, and
sulfates; organic fillers such as vegetable starches, grain
dust, coal, and peat; inorganic fibers such as glass and asbestos:
and organic fibers such as wood, rag, and paper. These fillers
impart various physical properties and decorative variations to
roofing products.
3.1 .3 Felts and Woven Fabrics
3.4
Felts are generally formed of paper, rag, or asbestos fibers,
with or without additions, on a machine similar to that used for
manufacturing paper. Felts are marketed on the basis of weight
in pounds per 4 8 0 square feet, known as the "number" ranging
from 15 to as high as 90. Most common weights are in the 2 7
to 5 5 pound range. The "number" of the felt multiplied by
0.225 will give its weight in pounds per 108 square feet (100
ft of coverage). High-grade rag felt will test approximately
1 mil in thickness, and not less than 0.5 pound on the Mullen
2
29

strength tester per unit "number". These relations hold approx-
imately constant for all weights. The use of a perforated sheet
of felt has been suggested to provide a change in weight. 3.5
Woven fabrics ordinarily used for manufacturing prepared
roofings include burlap or hessian (composed of jute fibers),
sheeting, and osnaburg and duck (composed of cotton fibers).
These are marketed in various weights, expressed in arbitrary
ways. Woven fabrics do not take up nearly so large a percentage
of bituminous saturation as felted fabrics.
3.2 PRODUCT DESCRIPTION
- __ .__
3.5
3.2.1 Prepared Roofinq
Prepared roofings are comprised of a single layer or multi-
ple layers of a fabric (woven or felted), saturated, and/or
coated with bituminous compositions. The finished product is
supplied in flat sheets or wound in rolls. The fabrics and
bituminous compositions can be assembled in an extremely large
number of combinations.
Laminated roofing consists of two or more layers of
bituminized felted or woven fabrics, in various combinations
with structural supports (wire mesh, sheet metal, etc.). Roll
roofing can also be decorated with granular materials or cut
to special shingles.
3.2.2 Asphalt Shingles
Asphalt shingles are cut in relatively small units from
roofing coated with mineral granules and are intended to be
laid in overlapping courses. Prepared roofing shingles are
Cut in a variety of patterns and finishes. I I I 30

I I I 1 I I I I I I I I I I I I I I I
I
"Individual shingles" are units cut in a single pattern
in distinction to the "strip shingles," which are cut with a
repetition of pattern.
3.2.3 Adhesive Compounds for Built-up Roofs, Dampproofing,
and Waterproofing
Adhesive compounds are used in three classes of work:
1. Construction of built-up roofs exposed to wide temperature fluctuations.
2. Construction of above-ground membrane water- proofing of structures exposed to wide temper- ature fluctuations and severe vibrations (i-e., bridges, culverts).
3. Construction of underground membrane water- proofing exposed to moderate temperature conditions (i.e., tunnels, foundations, dams).
The adhesive products are made of tar-pitches and asphalts
similar in composition to the surface coatings of sheet roofings.
Adhesive compounds for built-up roofing are generally of softer
consistency than the coating compounds for prepared roofing, but
are of similar composition.
3.2.4 Bituminous Cements
Bituminous cements are of plastic, troweling consistency
and are used for repairing composition or metal roofing, above-
ground dampproofing, and to a small extent, waterproofing.
Often these products are referred to as "asphalt putty."
Cements may consist of two or more of the following materials: 3.6
1. A base of one or more bituminous materials,
. oils and resins. with.or without the addition of vegetable
31

2 . Mineral fillers such as those used for filling the coatings of prepared roofings (clay, cement, influsorial earth, calcium carbonate, mica, soapstone) and pigments.
3 . 3 NEW PRODUCT DEVELOPMENT
Research is under way on producing roofing tiles and
other roofing accessories from molded mixtures of asphalt and
other fibrous and mineral matter. 3 * 7
attempts have been made to produce such products commercially.
The process generally involves mastication and subsequent
Several unsuccessful
molding under pressure. Mineral fillers with dispersed asphalt
can be formed into sheets, coated, surfaced, and cut into any
desired form.of roofing product.
Production of roofing materials by extruding a mastic of
asphalt, mineral filler, and glass fibers in sheet form, coated
with asphalt and surfaced with granules, has been proposed.
This product could be reinforced with a variety of items (bitu-
minized felt, metal, or wooden lathes) and the surface glazed
with fusible glass. Molded units have also been proposed for
roof copings and interlocking roof tiles.
32
I I I 1 I I I I I I I I I I I I I I I

I I I I I I I I I I 1 I I I I I I
f I I
4.0 PROCESS DESCRIPTION AND ATHOSPHERIC EMISSIONS
4.1 GENERAL
Figure 4.1 is a simplified schematic diagram of the
asphalt roofing manufacturing process.
usually coated on both sides with an asphalt coating of
controlled thickness. In production of shingles, colored
granules are embedded firmly in the surface coating on one
side: a parting agent is applied to the other side: and the
felt is cut into shingles or rolled on a mandrel. The
purpose of the parting agent is to prevent the shingles or
felt surfaces from sticking together. When roofing is made
in rolls, no granules are used. The asphalt used in the
saturator is first prepared by blowing air through the raw
asphalt to achieve selected properties.
Saturated felt is
The main points of emission of organic particulate in
the roofing process are the saturator, the blowing operation
and the hot asphalt storage tanks. The air-blowing operation
is not always done at the plant site, and the asphalt is fre-
quently purchased in the blown form. The sand dryer and appli-
cation of the mineral parting agent are potential sources of
inorganic particulate. The coating mixer, where the asphalt
sand is blended prior to application, is a minor source of
particulate emissions.

I 1 I I I I I I I I
34

I c I 1 t I t I c I E 1 I I I I I 1 1
4.2 SATURATOR
4.2.1 Process Description
Saturation is accomplished by dipping the felt in asphalt,
spraying it with asphalt, or both. In these operations the
asphalt is maintained at a temperature of 400 to 500°F. Where
both methods are used, the felt is sprayed before dipping.
This spray, applied to one side of the felt only, drives the
moisture out of the opposite side. The felts should contain
less than 7 percent moisture to prevent subsequent blistering
of the asphalt. The trend has been away from spraying and pre-
saturation, since moisture can also be boiled out of the felt
during submersion in the hot liquid asphalt. In any case, the
spray and dipping operations are generally housed together and
form one process.
Standard felt weights (thickness) are 1 5 , 30, and 55 pounds [ per 4 8 0 square feet of felt The felts are a fibrous
paper similar to thin cardboard, as described in Section 3.0.
As shown in Figure 4.1, a saturator line consists of a
large roll of felt (actually paper), a dry looper section that
takes up surges in line speed, a spray section (if used), a
dipping section, a drying section with heated rolls, coating
and surfacing areas, a final cooling section consisting of
both water sprays and water-cooled rolls, a finish looper
area, and finally a roll winder or shingle cutter. Typical
lines are about 5 to 6 feet wide for processing a 4- to 5-foot
width of felt, and they are over 100 feet long.
35

1 The saturation process is limited by the properties of the
felt and the speed at which the felt can be fed to the saturator.
Maximum speeds are 600 feet per minute (fpm) for 15- to 30-
pound felts and 400 to 500 fpm for the heavier weights; more
-typically, however, the average speeds are 2 5 0 to 400 fpm.
Although mechanical breakdowns and changes of the felt roll
cause shutdown of the line, the process is essentially continu-
ous, often over more than one shift per day and for 6 or 7 days
per week.
The entire saturator is enclosed by a hood, which vents
the fumes to a control device or directly to the atmosphere.
‘Phesc hoods have a wide range of capture efficiencies, depending
on design and ventilation rates. The impact of OSHA regulations
has effected some improvements in hood capture efficienckes;
some saturator rooms, however, are characterized by a hazy
atmosphere.
4.2.2. Atmospheric Emissions From Saturators
Emissions from the saturator consist of water vapor, con-
densed asphalt (hydrocarbon) droplets, and gaseous organic
vapors. These emissions are highly visible and odorous. There
are no available published test results relating emissions to
process production rates.
4.2.2.1 Particulate - Particulate emission rates depend on a number of factors including weight and moisture content of the
felt, line speed, and the spraying/dipping process. Spraying
probably tends to increase emissions by direct entrainment of
36
t 1 I 1 4 I 4 1 1 1 I 1 1 1 1 I I:

c I I E I I I I fi I I 1 I I b I 1' 1 I
Temperature: O F
asphalt in the vent air stream.
and moisture content of the felt and line $peed determine the
total amount of water entering the saturator and also the total
process weight. Moisture in the felt is vaporized by the hot
asphalt, and the vapor carries with it small asphalt droplets
and gaseous products steam-distilled from the asphalt.
Most felts are dipped. Weight ... -
$
Emission data from the literature and from vendors are
summarized in Table 4.1. These data show particulate emissions
in the range of 19 to 71 pounds per hour; the test results did
not include process weight data.
Grains/scf lb/hr Reference scfma
0.42 0.59 0.79 0.53 0.08-0. lob
71 4.1 63 4.1 68 4.1 55 4.1 19-24b 4.2
20,000 12,500 10,100 12,000 27,300b
140 130 260 138 128-134
8 I
a Standard cubic feet per minute correctea to 60°F and 14.7 psia.
condensable particulate. bIn-stack filterable particulate only; other data include
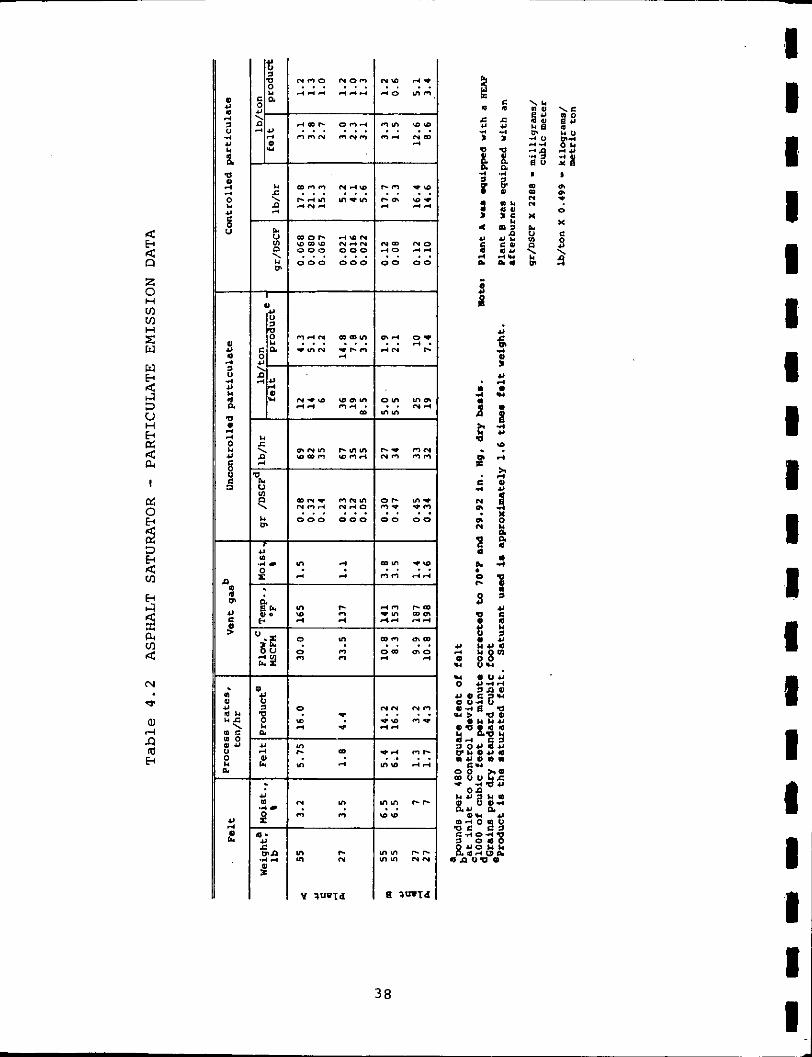
Particulate emission data obtained during the field tests
conducted'as part of this study are presented in Table 4.2.
The particulate sampling techniques, as described in Appendix B,
followed methods 1 through 5 of the Federal Register .of
37
N(O d. . . . . 4 0 m n
n m (O-n
0- n m . . . .
4
4 m c o n - nnn n n n . . . . . .
m o r - 4 -n (O0I -n r4-n 0 0 0 0 0 0
0 0 0 0 0 0 . . . . . . n m n o
4 0 4-
0 0 0 0 . . . .
n-n m m m . . . . . . * m n * e n
4
m r ( 4 N c . . Z?
m n - n n m NCld N d O
0 0 0 0 0 0 . . . . . . or- m c
n c -,.l 0 0 0 0 . . . .
m 0 n
9 0 n
m Y) c YI 4
mY) c c -nu . . n
n n
v) c “l n
Y ‘IUPId
3 8

If 1 t 1 I I E 1 . I' I I P 1 e 1 t 1 1 I
-
December 23, 1971. The particulate train was, however, modi-
fied by placing the filter after the impingers to collect con-
densible compounds. Tests were conducted at two plants during
processing of two different weights of felt at each plant.
The 55-pound felts were 4 feet wide and ran at line speeds of
approximately 413 fpm at plant A, and from 277 to 317 fpm at
plant B. In all cases the asphalt impregnated on the,felt
amounted to approximately 1.6 times the weight of the felt.
The 27-pound felt was 3 feet wide and ran at line speeds of
360 fpm at plant A, and 250 to 340 fpm at plant B. Moisture
contents of the felt at plant B were approximately twice those
at plant A. Asphalt was maintained at a temperature of 430°F
at plant A and 450°F at plant B.
The data in Table 4.2 show that uncontrolled emissions at
plant A were highly variable.
62 pounds for the 55-pound felt and 39 pounds for the 27-pound
felt, yielding averages of 3.9 and 8.7 pounds per ton of satu-
rated felt for the two.weighted tested. Emissions from the
saturator were controlled by a HE #system (see Section 5.0)
at plant A. With the larger machine, the HEAF operated at a
pressure drop of 27 inches of water; with the smaller machine
the observed'pressure drop was 20.5 inches. Tests at this
plant were not performed simultaneously at the control device
inlet and outlet, since no sampling sites were available at
Average hourly emissions were
@ . egistered trademark - Johns-Manville Corp.
39

the inlet. Instead, samples of uncontrolled emissions were
obtained while the control device was bypassed. Controlled
and uncontrolled emissions are thus not directly comparable,
but average values can be compared, since the same product
was being run. Values obtained at the outlet indicated average
hourly emission rates of 18 and 5 pounds for the 55- and 27-
pound felts, respectively. Comparable control device effi-
ciencies were 71 percent and 87 pement by weight. These
emissions averaged 1.2 pounds per ton of saturated felt for
both weights of felt.
The fairly low collection efficiencies for this control
device, which relies mainly on mechanical impaction, are
probably due to the large amount of condensible matter that
passes through the HEAF in gaseous form and to the fine particle
size of the particulate matter. Some HEAF units, however, have
demonstrated measured efficiencies above 98 percent as applied
to asphalt saturators. Differences in sampling procedures
could account for differences in emission rates and collection
efficiencies.
At plant B the two weights of felt were run on the same
line at different times. Uncontrolled emissions from plant B
ranged from 27 to 3 4 pounds per hour and were essentially the
Same for both felt weights. This apparent anomaly is due to
mechanical problems with the 55-pound felt machine, reqqiring
frequent opening of the hood doors with loss of fume into the
room and thus lower measured emissions from the stack. The
40
I I 1 It I I I 1 I 1 I 1 t I I 8 I I I

machine that ran the 21-pound felt operated much more con-
sistently with the hood tightly closed; the 32.5 pound-per-
hour emission rate is representative of emissions from this
line. The average enission rate of 8.7 pounds per ton of
product is identical to the average obtained with the 27-pound
felt at plant A .
The plant B saturator was controlled with a fume incinera-
tion system, in which the exhaust fumes were passed into a
process heater furnace fired with No. 2 fuel oil. The process
heater was used to heat the saturant in the saturation process.
The heater was regulated by the saturant temperature, auto-
matically reducing the firebox temperature when the saturant
became too hot. Maximum heat input of the furnace was 10
million BTU per hour. The variable operation of the fume
incinerator and the burning of No. 2 fuel'oil caused low par-
ticulate collection efficiency. Controlled emissions were 13.5
and 15.5 pounds per hour for the 55- and 27-pound felts, respec-
tively, ( 0 . 9 and 4.2 pounds per ton of product) resulting in
collection efficiencies of 5 6 and 52.3 percent by weight.
Particle size data on saturator emissions are lackinq.
Samples obtained during the field testing portion of this study
with a Brink's Impactor yielded the data shown in Figure 4.2.
These limited data show that the particles emitted are very
small, 50 percent measuring less than 0.8 micron in diameter.
This small particle size is evidenced by the high opacity of
the plume when it is not controlled.
41
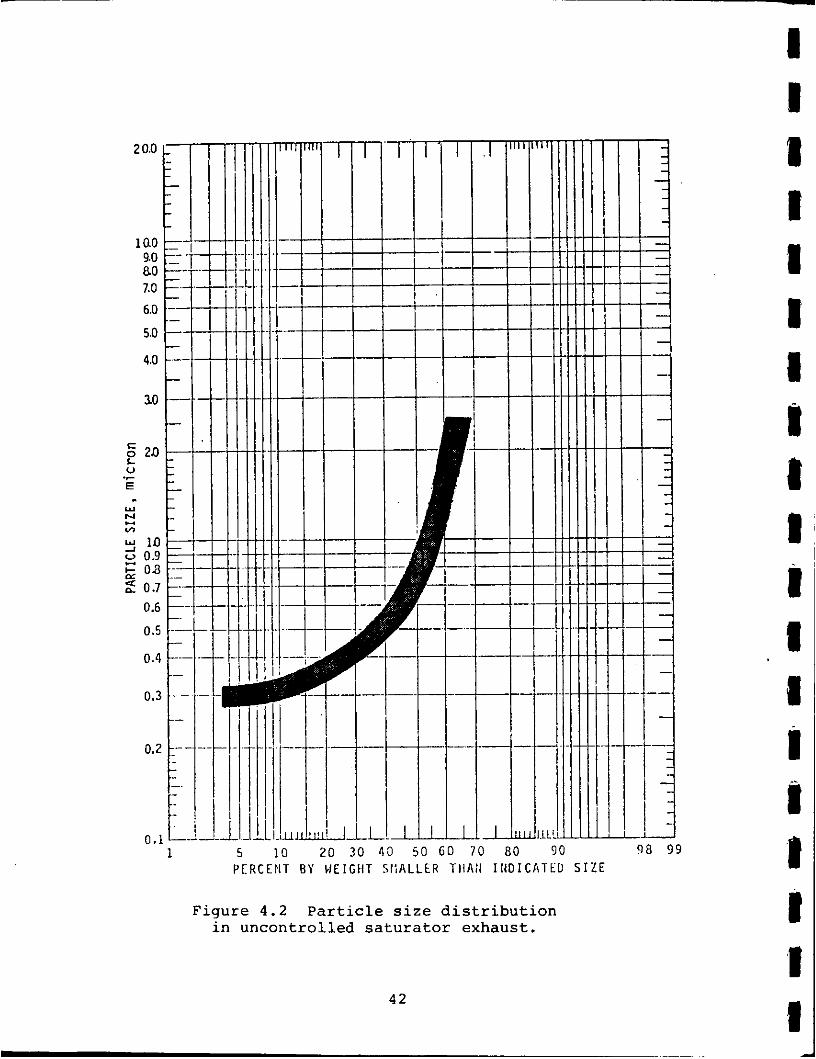
5 10 20 30 40 50 G O 70 80 90 9 8 99 P C R C E F I T B Y W E I G t I T S I i A L L E R T H A i I I N D I C A T E D S I Z E
Figure 4.2 Particle size distribution in uncontrolled saturator exhaust.
4 2

I I I 1 I 1 I 1
I 1 I I
1 1 1 1 I
i
i
~
4.2.2.2 PPOM Emissions - Table 4.3 summarizes the PPOM emis-
sions measured in this study. These data were obtained by
using the EPA-5 particulate sampling method with filter relo-
cated to follow the impinger as described in Appendix B. The
collected sample fractions were extracted with methylene
chloride. The remaining sample was separated on a chromato-
graphic column and analyzed by mass spectrometry. These data
show uncontrolled total PPOM emissions of 21 to 1 1 4 milligrams
(mgm) per hour at plant A (0.00012 percent to 0 .00048 percent
of total particulate matter), the heavier shingle material
yielding the higher emission rate. At this plant the PPOM
emissions were reduced by passage of effluent through a HEAF
unit, the emissions measuring 5.0 and 37.6 mgm per hour (0 .0002
to 0.00044 percent of total particulate emissions). Emission
rates for each of the individual PPOM compounds were lower after
passage through the HEAP unit, and overall collection efficiency
was 70 percent.
At plant B, the uncontrolled PPOM emissions ranged from
1 6 . 6 to 2 7 mgm per hour ( 0 . 0 0 0 1 2 to 0 .00018 percent of total
particulate). These emissions were controlled by a fume incine-
rator. This device, however, had essentially no effect on the
PPOM compounds; emissions at the inlet and the outlet, measured
simultaneously, were approximately the same.* Since total par-
ticulate was reduced, the portion of PPOM as a percent of par-
ticulate increased to 0.0003 percent.
*Neglecting the unusually high benz(a)pyrene and benz(e)pyrene values, which were apparently caused by interferences in analyses.
43

3 a a
3 PI D4
!
4 4
I I I t I I I I

1 I 1 1 1 1 1 I
1 1 1 1 1 1 II
I I
i
m
Felt weight
PPOM compounds thus amount to approximately 0.0003 per-
cent of the total.particulate in either controlled or uncon-
trolled emissions. Table 4.4 summarizes the PPOM emissions
measured in this study with relation to total particulate and
product tonnages.
Uncontrolled Controlled
% PPOM x mg/ton of % PPOM x mg/ton of in particulate product in particulate product
Table 4.4 RELATION OF PPOM TO TOTAL
PARTICULATE AND PRODUCT TONNAGES
1.2-4.8
1.2-1.8
I r
2-8 2.8-4.4 1.5-2.4
5-1 2.0-3.3 1.1-6.3
55
27
4.2.2.3 Gaseous Emissions - Although reported data for gaseous emissions from the saturator are practically nonexistent, gase-
ous hydrocarbons, carbon oxides, aldehydes, and odorous com-
pounds are emitted because of the nature of the process.
Table 4 . 5 summarizes the gaseous emission data obtained
during the field tests of two saturators. The saturator ex-
haust is essentially air at a temp-erature of 140 to 190°F,
containing 1.1 to 3.8 percent moisture. In a l l cases, multiple
samples of each contaminant were taken during the particulate
tests. Hydrocarbons and carbon monoxide (after conversion to
methane) were analyzed with a flame ionization detector. Alde-
hydes were collected in a solution of MBTH (3-methyl-2-benzo-
thiazolone hydrazone hydrochloride and analyzed colorimetrically.
45

a a, rl rl 0 U 4J C 0 V
-
a a, rl rl 0 U CI c 0 U c 3
-
P W VI N
W m 0 VI
, .
VI W W m N 9 P W
m i m .oI P m r l
I r n I V I
0 rl W rl I- .oI 0
m W m
rl N 0
m 0 0
N P N L n
rl 4. 0 m
4. rl W
m I W m N
m m
rl I V I
m
0 m 4.
m i m
m m m
rl 4. m N
46
W 4. rl W
0 0
m P
N m
0 O N W P ’ . m w
W 4. i m I N
0 0
4. 4. rl m 0 0
N m N N
rl
N 0 m P rl m
.oI 0 I . I N 0 VI
mu, 0 m
N rl
I I I 1 1 f 1 I I 1 I I I
I t Y I I
i
-

Measurements for gaseous hydrocarbons, aldehydes, and
carbon monoxide were made at plant A. These measurements
showed average carbon monoxide emissions in the range of 57
to 82 pounds per hour (3 .5 to 5 . 1 pounds per ton of saturated
felt), at concentrations of 410 to 614 ppm. Concentrations
after the HEAP unit were lower than the uncontrolled emissions,
but probably because the samples were taken at differen.t times.
Concentrations of gaseous hydrocarbons ranged from 40 to 80 ppm,
with hourly emission rates of 4 to 5.5 pounds (0 .25 to 0.34
pound per ton). Concentrations of total aldehydes ranged
from 0.7 to 5 ppm, with hourly emissions of 0 .3 to 0.5 pound
(0.02 to 0.03 pound per ton of saturated felt). Emissions of
aldehydes were approximately 5 0 percent lower after the HEAF
unit. Although tests at the inlet and outlet were not con-
ducted simultaneously, some reduction in aldehydes could be
caused by condensation and adsorption on the fiber mat.
Emissions of CO at plant B were somewhat lower than those
at plant A, measuring 2 . 2 pounds per hour (0.14 pound per ton
of product) before control. Hydrocarbon concentrations aver-
aged 5 2 0 ppm, or 12.8 pounds per hour ( 0 . 8 pound per ton).
Use of the fume incinerator gave a 24 percent reduction of
hydrocarbons and no reduction in CO. As mentioned in the dis-
cussion of particulate emissions, this incinerator was burning
No. 2 oil and was not operating under maximum control effi-
ciency conditions.
4.3 ASPHALT BLOWING
4.3.1 Process Description
Although 'the processes are not always done at the same
47

site, preparation of the asphalt is an integral part of felt
saturating. Preparation consists of oxidizing the asphalt by
bubbling air through liquid (430-500°F) asphalt from 1 to 4
hours. The industry refers to this operation as "blowing".
Blowing may be done either in vertical cylindrical tanks, as
shown in Figure 4 . 3 , or in horizontal chambers. Because
blowing time is shorter than in horizontal Chambers, vertical
stills are usually used. One or more blowing vessels may be
operated simultaneously at a plant. They are usually con-
c
a common vent system and thus form a semicontinuous
process.
In this operation, atmospheric air is compressed-to about
10 to 15 psig and piped into a sparger in the bottom of the
blowing vessel. Preheated asphalt is then pumped into the
vessel and blowing is started. Blowing is continued until an
asphalt with the desired melting point is achieved. The
higher the desired melting point, the longer the blowing time.
The blowing operation uses 1.5 to 2 cfm of air per gallon of
asphalt charged.
The blowing operation removes volatile compounds from the
asphalt and also oxidizes some compounds. Because the operation
is exothermic, cooling water is required to control temperatures.
The water is frequently applied to the walls of the vessel.
Air, entrained asphalt droplets, gaseous hydrocarbons, carbon
oxides, and some sulfur compounds are emitted from the blowing
chambers. These emissions pass through a primary control device
48
I I 1 I 1 1 1 I I I 1 I I 1 1 1 1 1 I

I 1 1 1 1 1 I 1 s 1 1 1 I I
i
W u ~
m - W > A W
1 m
+
m
e c, 4 ‘ m c a v) m W 0 b’l c
4 9

such as a settling chamber or cyclone-type particulate collec-
tor, and an emission control device (usually a process heater
furnace) before entering the atmosphere. Particulate matter
(oil) captured in the primary control device is generally
burned in an asphalt heater or mixed with raw asphalt.
4.3.2 Emissions
The cyclic nature of the blowing operation results in a
wide range of emissions, which appear very high as the blowing
starts and then decrease as the operation progresses. Par-
ticulate emissions also increase rapidly once the blowing
chamber temperature exceeds 450'F. Uncontrolled asphalt losses
from horizontal stills have been estimated to amount to about
3 to 5 percent of the amount charged. Losses from vertical
stills are generally lower, on the order of 1 to 2 percent of
the amount charged. One single reported field test showed 3.9
pounds of asphalt emitted per ton of asphalt charged after a
settling chamber, 4*4 about 0.2 percent of the amount charged.
4.3.2.1 Particulate - Tahle 4.6 presents the particulate emis- sion data obtained during tests at two blowing operations.
Tests were conducted simultaneously before and after a fume
incinerator at each plant. Emission data are presented on a
concentration basis, as pounds per hour, and also as pounds
per 1000 gallons charged (1000 gallons equal about 4 tons,
based on density of 8 pounds per gallon). In all cases except
the third test at plant C, only one still was operated at a
time. Total emissions were thus related to a single batch of
50
I 1 1 I I 1 I I c 1 1 1 I I 1 1 I I I -

1 1 I
u 2 3 0 4
H
H
m
- 3 1 1 4
a m
r: 0 e: 1 Lq
(I) z 0 H m 1 Lc .. Y 8 I w
3 U H
2 1 1 2
W
.3 1 aJ a m H 1
1 I I I I
u O D .
r n C . .
n
u o n d e 0 0 . .
- e o C r ( ln
. .
4 n . + m n
n n . . 2 '
r n - o w n n
n n n r
-
C I - * N .
v - 4 , . . 0 0
1 m o 4 - 4 - . . .
m y 1 Y N N 4 0 0
> o o . . .
1 ? y : n n l n 3
0 0 0
- 3 . . r t n r
5 ??Id
51

asphalt. The samples of uncontrolled emissions were taken
after a cyclone separator in each case.
As these data show, total uncontrolled vent gas flows
are relatively low, about 2 to 3 thousand SCfm. Moisture
content of this gas stream is high, and temperature is in the
200 to 300'F range. Uncontrolled particulate emissions were
much higher for the higher-melt-point asphalts as determined
by tests over the total cycle; these emissions amounted to
25.2 and 57.4 pounds per 1 0 0 0 gallons of blown asphait (6 .3
to 1 4 . 4 pounds per ton). Shorter blowing times required for
the lower-melt-point asphalts resulted in much lower emissions,
from 1 to 5.6 pounds per 1000 gallons (0.25 to 1.4 pounds per
ton). Figure 4.4 shows the relationship between emissions
and melting point. At both plants the vent gas entered a
fume incinerator, which was used both to reduce emissions and
to preheat the asphalt entering the blowing operation.
These units achieved particulate reduction efficiencies
in the 8 5 to 9 5 percent range. Controlled emissions for the
high-melt-point asphalt averaged 3.15 pounds per 1000 gallons
(0 .79 pound per ton); for the low-melt-point asphalt, emissions
averaged 0.3 pound per 1000 gallons (0.075 pound per ton). The
single outlet test at plant B for the low-melt-point asphalt
yielded extraordinarily high emissions because of an apparent
afterburner malfunction, which caused excessive emissions from
the oil fired in this unit.
4.3.3.2 PPOM Emissions - Table 4.7 summarizes the PPOM emission
52
I 1 1 I I 1 1 1 I 1 I 1 I I I 1 I 1 E

30 'UlXOd 11% 11VHdSW 1WNIJ
53

a, c a, $4 c 4J c m c a, .c a 0
N
a,
- - m
a, c a, $4 x a a, N c a,
- v
m
a, c a,
. $ 4 h a m - - 2 a, m
a l a, $4
c m rl 0 c 0 4 x c 4J
I m
5
2
a, c a, $4 x a c . m - N
a, Ll -4 Q
54
a, c a, $4
a . m Y
2 a, ci -d r
m rl
N
m
m rl
m
rl
I I m R
I' I t I I I I 1 I I I I I 1 I 1 I 1 E 1

i1 I .I
data obtained at the two plants tested. Total hourly emissions
ranged from 49 to 176 milligrams before the control device, and
33 to 9 5 milligrams after a fume incinerator. Both of these
tests were run while high-melt-point asphalt was being blown
and on the basis of particulate emission data would be expected
to yield emission rates higher than those resulting from blowing
of low-melt-point asphalt.
Tests of controlled and uncontrolled emissions were con-
ducted simultaneously at the fume incinerator inlet and outlets.
At plant B, the incinerator yielded 81 percent reduction in the
total identified PPOM compounds. At plant C, emissions at the
outlet were more than 2 times those detected at the incinerator
inlet. This increase in PPOM emissions is probably due to par-
tial reaction of some organic compounds in the fume burner.
PPOM percent of total particulates is also shown in
Table 4.7. Before the fume incinerator, PPOM accounted for
less than 0.0002 percent of total particulate: after the incin-
erator, PPOCl accounted for between 0.00082 and 0.0019 percent
of total particulate.
Published measurements of PPOM emissions from horizontal
asphalt blowing stills showed benz(a)pyrene concentrations of
less than 20 and 4 micrograms per cubic meter of exhaust gas
before and after a steam spray-baffle control In
measurements before a control device, pyrene and anthracene
were found in much higher concentrations: 5,800 and 310 micro-
grams per cubic meter, respectively.
5 5

4.3.3.3 Gaseous Emissions - Emissions of carbon monoxide and gaseous hydrocarbons from asphalt blowing processes cover a
wide range, as shown in Table 4.8. This range is mainly due
to the cyclic nature of the blowing process and the variable
factors such as temperature and oxygen content that affect
these emission rates. Carbon monoxide averaged 62 ppm (0.73
pound per hour) and 341 ppm (15.2 pounds per hour) before and
after the fume incinerator, respectively, at plant B. At
plant C, CO emissions were higher, averaging 1418 to 3956 ppm
at the inlet and outlet, respectively.
At both plants carbon monoxide emissions increased by a
factor of at least 10 after passage of the stream through the
fume incinerator.
Controlled carbon monoxide emissions ranged from 15 pounds
per hour at plant B to 179 pounds per hour at plant C (approx-
imately 2 to 28 pounds per 1000 gallons or 0.5 to 7 pounds per
ton of Lsphalt).
Gaseous hydrocarbon emissions ranged from 32 to 36.7
pounds per hour before the fume incinerator, and averaged 18.7
pounds per hour at the outlets. Controlled hydrocarbon
emissions were equivalent to an emission factor of 2.5 pounds
per 1000 gallons or 0.65 pound per ton of asphalt.
Data reported earlier on emissions from a horizontal still
showed average concentrations of 900 ppm for CO and 2500 ppm
for gaseous hydrocarbons. These data are similar to those
found in the current tests on vertical stills. 4 . 4
56
1' 1 1 I 1 I I 1 I 1 I I I 1 I l a '4 I

~
I I 1 1
I 1 I 1 I i I 1 I 1 I I 1 1 1 I
c7 z z 0 cl
H
m
v) 3 0 W v)
8 m
-J.
a, 4 .Q
c-4 tu
'c a 7
r C L. L C C L
-
T a r c C b + c C c E .. L
-
m W P W 4
W 0 0
0
m m W P W rl W
rl 0
W 0 rl
m d w l m m
m W m W m rl -J.
N -J. m m N
rl 0 0 0
0
m r- m 0
W W rl m 0
m W m P
m m W W
m r l W m I:\ P P-
m
P W W W
'0 0
N -r
m' 0 rl p1
0 m
W rl rl 4 O r l m 4- 1 0
W m I ' 0
rl W W
N 0 N 0 rl
0
W W P
N 0 W
0 m 0
4 m P- m
W 101
m I .: P-
W O W
0 W
.
0 0 4J
h 0 4
m r-4 W . .
a, 0) m m c u m c u m tnh mi4 ea , C ( U m . > a m > oa.4 va .4 u X
m a o a
57
(0 h 0 L,
h a, C .si 0 c .si
a,
U-l
>I P .a a, 4 r-4 0 h 4J c 0 U
m u C rb rl a c u 0 a 4J
m
5
m ln u
.rl c
!.l a,
rl m
.. a, c, 0 z

Limited
. . .0.08 t o 0.43
a t o r . Again
d a t a on aldehydes show emiss ions i n t h e range of
pound pe r hour be fo re and a f t e r t h e fume i n c i n e r -
p a r t i a l o x i d a t i o n of s o m e o rgan ic compounds i n
~
t h e i n c i n e r a t o r y i e l d e d a h igher o u t l e t va lue .
Measurement of hydrogen s u l f i d e a t t h e fume i n c i n e r a t o r
i n l e t d u r i n g t es t s a t p l a n t C y i e l d e d v a l u e s of 0.3 t o 0 .7
p a r t per m i l l i o n .
0 . 0 0 0 5 ppm. 4.5
i n c i n e r a t o r would o x i d i z e most of t h e H S t o SO and r e d i c e
t h e odor l e v e l cons ide rab ly . Th i s g a s stream a l s o con ta ined
5110 ppm of S O 2 , y i e l d i n g an ave rage emiss ion rate of 11.5
pounds per hour o r 0.43 pound pe r t o n o f a s p h a l t . The raw
a s p h a l t con ta ined 2 . 1 percent s u l f u r .
4 . 4 MINERAL SURFACING APPLICATION
The odor t h r e s h o l d f o r H2S is approximately
Passage of t h e e f f l u e n t through t h e fume
2 2
Approximately 700 pounds of m i n e r a l g r a n u l e s a r e a p p l i e d
t o a ton of s h i n g l s ( f i n i s h e d p r o d u c t ) . These g r a n u l e s a r e
purchased from vendors and are v i r t u a l l y d u s t l e s s . P o i n t s
of g r a n u l e a p p l i c a t i o n a r e n o t hooded o r o the rwise exhausted.
The t o p c o a t i n g f o r s h i n g l e s c o n s i s t s of c o l o r e d g r a n u l e s ,
which a r e p r e s s e d i n t o t h e ho t a s p h a l t c o a t i n g . The o p p o s i t e
s ide of t h e r o l l i s coa ted w i t h a p a r t i n g agen t t o p reven t
s t i c k i n g .
P a r t i n g a g e n t s f o r roll r o o f i n g c o n s i s t of t a l c , s l a g ,
mica, o r sand. Except when sand i s used , a p p l i c a t i o n of
t h e s e m a t e r i a l s i s extremely d u s t y . Approximately 3 t o 5
pounds o f p a r t i n g a g e n t a r e a p p l i e d per 1 0 0 square f e e t of
r o o f i n g , depending on whether t h e a g e n t i s a p p l i e d t o one or
58
1 P 1 I I I I I I 1 t I 1 I 1 I I I 1 I~

I 1 I 1 I t 1 I I I I I 1 I 1 I 1 I I
both sides. Generation of dust is related to the fineness of
the particles rather than the quantity applied. When exces-
sive dust presents a problem at, the work area, exhaust nozzles
provide minimum control; ideally the entire application area
is enclosed and equipped with exhaust devices. Emissions from
the area can be captured with a fabric filter and returned to
the system by screw conveyor. Fine washed sand is sometimes
used. This agent is more costly than talc, but creates less
dust. - Emission rates from these application operations are not
reported in the literature. The control devices commonly used
(fabric filter) are more than 99 percent efficient, however,
and emissions from this source should not present a problem.
4.5 HOT ASPHALT STORAGE
Roofing manufacturers generally store asphalt in a liquid
state in fixed-roof tanks. Heaters maintain the asphalt at
a usable temperature of 350 to 4 0 0 D F . Emissions from storage
areas depend on storage temperature, properties of the asphalt,
and throughput of the tanks. Although emissions are normally
not visible, they are odorous and may be a problem during
filling operations. Some manufacturers vent the tanks to an
afterburner where the hydrocarbons are oxidized. Actual emis-
sions are unknown. Table 4.9 presents an analysis of gases
emitted from a paving asphalt storage tank during filling.
The total quantity emitted would vary directly with the quantity
of asphalt pumped into the tank. Heavy hydrocarbons would thus
59

T a b l e 4.9 ANALYSIS OF VAPORS DISPLACED DURING FILLING
SS/lOO PAVING-GRADE ASPHALT INTO A FIXED-ROOF TANK^^ 4,.
Component
Methane
E t h a n e
Heavy h y d r o c a r b o n s ( 2 8 " A P I g r a v i t y )
N i t r o g e n
V o l u m e , %
Trace
Trace
0 . 1
67 .3
Oxygen
Carbon d i o x i d e
Water
Argon
I t I 1 1 -
1 3 . 0
1.4
18.2
Trace
1 asample was c o l l e c t e d over a 3-1/2 h o u r filling p e r i o d .
Noncondensab le s were a n a l y z e d by m a s s spectrometer. Con- d e n s a b l e h y d r o c a r b o n s were s e p a r a t e d f r o m t h e steam, and g r a v i t y and d i s t i l l a t i o n c u r v e s were d e t e r m i n e d .
60
1 I 1 I I I I I t I I t I I

I I I I 1 I I I I I I I 1 1 ,I I I
: I I
amount to about 4 cubic feet per 30,000 gallons of asphalt
(0.01 pound per ton of asphalt, based on an assumed molecular
weight of 120).
4.6 SAND DRYER
Sand, or another type of filler, is blended with asphalt
to form a slurry, which is applied at a controlled thickness
to the saturated felt. The sand acts as a binder to stabilize
the asphalt. Moisture content of the sand is about 5 percent
by weight as stored: before blending, the sand must be dried.
Drying is done either in a direct-fired rotary dryer or, more
commonly, in an indirect, heated, baffled column. Inorganic
particulate emissions in the form of sand result from the
direct-fired drying operation.
61

5.0 CONTROL TECHNOLOGY AND COSTS
The manufacture of asphalt roofing generates two basic - air pollutants: gaseous and condensible hydrocarbons from
the saturator and blowing operations, and particulate matter
from the application of mineral coating agents. Information
obtained in plant visits and discussions with industry per-
sonnel indicates that the hydrocarbon emissions are by far
the most difficult to control and cause the greatest emission
problem. Small amounts of sulfur compounds and asphaltic odors
are also emitted.
No control techniques have been developed specifically
for PPOM compounds, and no information is available on the
fate of these compounds as they pass through control systems
used in this industry.
5.1 CONTROL OF SATURATOR EMISSIONS
Many systems have been used over the years to reduce
emissions from the saturator, largely on a trial-and-error
basis. Table 5.1 summarizes the devices currently in use and
indicates their relative popularity.
I I I 1 1 I I I I 1 I I I C I I t
62
1 I

I I 1 I I 11 I I I I I I I I I I I I I
Device
Low-voltage ESP
ESP/scrubber combination
Scrubber
Afterburner
NEAF (High Energy Air Filter)
- Percent ofa total lines
12
3
3
52
30
Based on a survey of 61 operating lines in late 1973 Value is percent of lines surveyed, not percent of production.
a
5.1.1 Electrostatic Precipitators
Low-voltage (approximately 10,000 volts) electrostatic
precipitators, as shown in Figure 5.1, have been used with
some success to reduce particulate emissions. 5.1
efficiencies are reportedly in the low 90 percent range,
however, and maintenance of electrostatic precipitators is
difficult because of the cohesive tar-like characteristics of
the particulate. Additionally, water sprays used in the ducts
form an oil emulsion that is difficult to break. Recently,
the use of detergents has reduced this problem.
control
6 3

Figure 5.1 Flow diagram for low- 5.1 voltage electrostatic precipitators.
The industry has recently renewed its interest in low-
voltage precipitators because of fuel shortages, costs of
afterburners
In the newer
quently used
facilitate c
and the water pollution aspects of scrubbing.
installations a fiber mesh precleaner is fre-
and the system is installed in modules to
eaning and maintenance. 5 . 2 vent gas velocities
. across the precipitator are in the range of 2.5 to 3 . 3 feet
per second.
5.1.2 Scrubbers
Low-energy scrubbers are not ideal for control of satu-
rator emissions, since their collection efficiencies in the 7 0
percent range are not adequate for eliminating opacity and
odors. Use of more efficient venturi scrubbers has generally
been avoided because of high operating costs and probl'ems of
water pollution control.
5.1.3 Afterburners
The most popular control system currently used for both
particulate and gaseous control is fume incineration or after-
burning. Although incineration can be done in the presence of
6 4
I I I I 1 1 1 I I I 1 I I I 1 I 1 1 I

I I I I I I I I I I 1 I 1 I I I I I I
a catalyst at approximately 800°F, the advantage of this rela-
tively low operating temperature is more than offset by problems
associated with catalyst fouling.
can remove up to 99 percent of the hydrocarbon emissions when
designed for 0 . 3 second retention at 1400'F. 5 . 3 Fuel can be
either natural gas or No. 2 fuel oil. Users of direct-flame
afterburners report that odors associated with the saturation
process are completely eliminated. 5.4'5.5
are properly designed and operated, they provide a satisfactory
means of controlling saturator emissions. Availability and cost
of fuel are potential problems.
Direct-flame afterburners
If afterburners
Afterburners are installed both with and without heat
recovery, according to the decision of individual plant opera-
tors. In general, heat recovery is more economical for new
facilities, but it is not always possible to achieve maximum
recovery since the afterburner exhaust oftentimes contains
more heat than the process requires. Maximum heat recovery is
realized only when the roofing manufacturing facility also
produces the paper (dry felt), since the felt-drying process
requires copious quantities of heat for generation of steam
to be used in the drying drums. Afterburner exhaust can be
used for generating this steam or the 200 to 14OO0F afterburner
exhausts can be mixed with ambient air, the temperature lowered
to 450°F, and the exhaust stream blown on the exposed side of
the felt as it turns on the drying drum. It has been reported
that a typical felt manufacturing process.uses 14 to 18 million
65

BTU per hour. 5 - 4
to treat 25,000 cfm of saturator exhaust at 1400'F. Thus,
maximum heat utilization is in the range of 40 to 50 percent.
Approximately 4 0 percent recovery is also realized from a
properly designed exhaust gas preheater. Recovered heat can
also be used to preheat asphalt in the saturators and/or in
the blowing operation.
About 36 million BTU per hour is required
Most afterburners use natural gas as fuel, with light oil
as standby when gas is on an interruptable basis. Fuel costs
are variable and because of the projected scarcity of natural
gas are in a state of flux.
$1.25 per million BTU for natural gas and $2.10 per million
BTU for No. 2 fuel oil (30C per gallon) in late 1973 in the
Midwest.
Fuel costs were approximately
Process heaters used to preheat the asphalt (either raw or
blown) can also function as fume incinerators. These devices
should yield control efficiencies comparable to those of an
afterburner system. High efficiencies, however, require care-
ful introduction of the vent gases to ensure good mixing and
maintenance of a firebox temperature of a least 1300OF. Pro-
cess heaters in which firebox temperatures are controlled by
the exit temperature of the material being heated may yield
low fume control efficiencies when the firebox temperature
is reduced.
r . > . 1 . 4 Mesh Filtprs -
The search for efficient devices to control o i l y mists
66
I I I 1 1 1 I I 1 I I I I I 1 I I1
1 II
I I 1 I I I I I I I 1 I 1 I 1 I I I I
led,to the development of the High Energy Air Filter (HEW).
This device, shown in Figure 5.2, consists of a slowly moving
glass-fiber filter pad through which the process exhausts
pass. The thickness and number of fibers in the pad result
' in a high degree of impingement, yielding reported collection
efficiencies as high as 96 to 98 percent at a pressure drop of
24 inches of water. 5'6
As commonly used with a 1-inch-thick pad, the HEAF operates
with pressure drops in the range of 2 0 to 25 inches of water
and face velocities of 400 to 500 feet per minute. The fiber
pad is in roll form, and as the portion of the pad exposed to
the gas stream becomes loaded with particulate, the roll
advances to expose a clean portion. The entire roll is dis-
posed of after use. Some saturator installations also utilize
a stationary steel wool demister pad after the HEAF to further
reduce carryover. Because of their oil content, disposal of
the rolls may be a problem in some landfill operations.
Efficiency is related to face velocity.
Cooling of the gas stream is required to collect conden-
sible compounds.
with ambient air because this greatly increases the amount of
air to be handled. Although the HEAF cannot remove gaseous
emissions and vapors, improvement in odor control has been
reported, with odor unit reductions in the range of 50 to
90 percent.
Cooling is not generally done_ by dilution
PI
5.6
I 67

RETAINING SCREEN
Figure 5.2 Flow diagram for HEAF. 5.7
68
I I I 1 1 I 1 1 1 I 1 1 1 I I 1 1 1 I

I I I
I I I I I I I I I
I I 1 I I I I
1:
Mist eliminators such as the Brink H-E type have not been
used on saturator emissions because of the high viscosity of
the particulate. These systems are designed so that the par-
ticulate agglomerates in the filter medium and eventually flows
downward to the base for collection. Although the saturator
emissions are believed to be too viscous to flow from the
mesh, operations at slightly increased temperatures could
reduce this problem.
5.1.5 Costs of Saturator Emission Control
Although the costs of controlling emissions from asphalt
saturators depend on many factors, there is generally a direct
relationship between control costs and exhaust volume. Factors
that affect exhaust volume are the area of saturator hood
openings, asphalt characteristics (relating to fire hazards),
width of the felt, and line speed. Based on published data,
estimated installation and operating costs for a ."typical"
saturator are given in Table 5.2.
One manufacturer has standardized new saturator exhaust
rates at 10,000 acfm (8000 scfm). Compared with a more
typical exhaust rate of 20,000 to 30,000 scfm, such a design
would yield substantial savings in operation of a control
device. There are, however, some conflicting views regarding
minimum exhaust rates. Although asphalt does not have a lower
explosive limit (LEL), many of the constituents do. 5 ' 9
knowledge of specific process weight rates, hood configurations,
and saturator construction details, the required exhaust rates
Without
69

70
I 1

I I I I I 1 I I I I I I 1 I I I I I I
are difficult to determine. For this reason, operating costs
could vary widely from those shown in Table 5 . 2 . Costs of
operating an incinerator or afterburner are especially vari-
able depending on exhaust gas rates; these costs could be as
low as $70,000 per year instead of $180,000.
In summary, two control systems have proved most effec-
tive to date in controlling particulate emissions from satu-
rator exhausts: direct-flame afterburners and HEW units.
Low-voltage precipitators have found increased popularity in
the last year and are being installed on some existing plants.
Generally, H E W ' S are used on existing plants where heat
recovery is not a practical design consideration. Most new
installations utilize afterburners with heat recovery.
5.2 CONTROL OF ASPHALT BLOWING EMISSIONS
Emissions from asphalt blowing are very similar to those
from saturators: concentrations are much more variable, however,
and tend to be much higher at peak periods. Conversion from
older horizontal stills to vertical blowing stills significantly
reduce emissions and facilitates control. Almost all stills
are now vertical. Existing controls consist almost entirely 5.10 of fume incineration in a process heater or afterburner.
Heat generated by the afterburner is used to preheat asphalt
for the blowing and saturator operations. These furnaces are
oil- or gas-fired, and particulate removal efficiencies
generally range from 8 0 to 9 0 percent. In all stills surveyed
during this study, emissions were controlled by combustion in
71

direct-fired units.
One manufacturer is contemplating installation of a HEW
on an asphalt-blowing operation, but there are no existing
installations from which to collect data. A Brink mist elimi-
nator has reportedly been installed on a blowing operation at
a west coast refinery, but no test data are available. 5 . 8
Total exhaust gas flow rates from blowing operations are
in the range of 2000 to 3000 scfm per still (150 scfm per 1000
gallons). Because the volume is considerably smaller than flow
from the saturator, blowing is less expensive to control:
operating costs for an incinerator amount to about one-tenth
of the costs incurred on a saturator.
5.3 CONTROL OF SURFACING AGENTS
Handling of sand, talc, and mica parting agents emits fine
dust particles during receiving operations and application.
These emissions are well controlled with fabric filters. Be-
cause use of a fabric filter with pneumatic receiving and
handling systems is an integral part of the plant process, its
cost cannot be considered a control cost. Particulate control
efficiencies above 99 percent are common for these devices as
applied to these emissions. Installed costs of control equip-
ment are in the range of $2.65 per cfm (1973).
The industry considers sand drying to be a minor source
of particulate (fine sand). Newer plants no longer dry sand
but purchase it at a specified moisture content. Where sand
is dried, however, fabric filters can control particulate f
72
I~ I I I I I 1 I I I 1 I I I I I .I 1 I

I I 1 1 I I I I I I ‘I I 1 I I 1 I 1 I
emissions very effectively, with efficiencies of approximately
99 percent.
5.4 CONTROL OF HOLDING TANK EMISSIONS
Because emissions from this source are relatively low,
mqst facilities have no control system. One plant vents fumes
from the holding tank to an incinerator. The most common con-
trol method, however, is merely to hold the asphalt at a low
temperature (approximately 350°F) to reduce vapor formation.
73

6.0 IMPACT OF A’?MOSPHERIC EMISSIONS
The impact on the environment of atmospheric emissions
from the manufacture of asphalt roofing depends on: 1) the
types and quantities of emissions, 2) the resulting atmos-
pheric concentrations of the emissions due to dispersion,
3) the location of the plant in regard to Surrounding land
use, and 4 ) the effects of the pollutants. In this chapter
these factors are discussed in relation to the total impact
of an asphalt manufacturing plant upon the surrounding area.
6.1 EMISSION SUMMARY
Emissions from asphalt roofing processes, described
earlier in this report, are summarized in this section.
6.1.1 Particulate Emissions
Organic particulate matter is emitted mainly during
asphalt blowing and saturation of tne felt. Emissions from
these operations contain polycyclic hydrocarbons, some of
which are known to be carcinogenic. Consequently, these
emissions are espec5ally significant in evaluating potential
environmental impact.
Table 6.1 summarizes the particulate and PPOM emission
data presented in Chapter 4 . 0 . These data, based on measured
emissions, show that saturators emit on the average 6.3 and
7 4
1 I I I I I I I 1 I 1 I I I I I I I I
~~~

I I I 1 I 1 I I 1 I I I 1 I I 1 I
8 1 I
‘0 W 4 4 0 L- u C 0 u
-
a w rl rl 0 L- u c 0 U c 3
- a W rl rl 0 L- u c 0 U
-
U ?J r: 0 L- c, c 0 U c 3
-
c 0
u rn L- w a 0
‘p
W N , d W I . I rl
m
o m m
N
W m * m
9’ 0 r i w a m L n d
d rl
I . I
0
W r- m w
w m c o o tn I . 1 1 .
m w m m p.
. .
.r- m m .
0
75
m u m a
Iu 0 m a, Ln m h a, > m a, L! m m a,
lu Ln c a m

2.7 pounds per ton of saturated felt with no control and with
average control, respectively. A well-controlled plant would
emit about 0.6 pound per ton, at a control efficiency of 90
percent. PPQM emissions average approximately 0.0003 percent
of the particulate both before and after a control device.
Although particulate emissions from asphalt blowing are
more variable, they average 0.27 pound per ton of saturated
felt with a fume incinerator contro1,device. Uncontrolled
blowing operations are not in use. PPOM compounds account
for an average of 0.0013 percent of the particulate.
6.1.2 Gaseous Emissions
Table 6.2 summarizes measured gaseous emission data.
These data show that only limited control is achieved by the
fume incinerators and HEAF unit tested. In blowing operations,
gaseous emissions actually increased after passage of effluent
through fume incinerators. The reported concentrations of
hydrocarbons represent total hydrocarbons as measured with a
flame ionization detector; no further characterization of these
compounds was obtained. Sulfur dioxide emissions vary with
sulfur content of the asphalt.
pound per ton of asphalt (0.26 pound per ton of saturated felt)
was reported when the asphalt contained 2.1 perceat sulfur.
Thus, only a small portion of the sulfur in the asphalt is
emitted.
A single measurement of 0.43
6.2 POLLUTANT EFFECTS
Effects of pollutants from asphalt roofing manufacturing
I I I I 1 I 1 1 I 1 1 I I I- I I I
, 76
I I
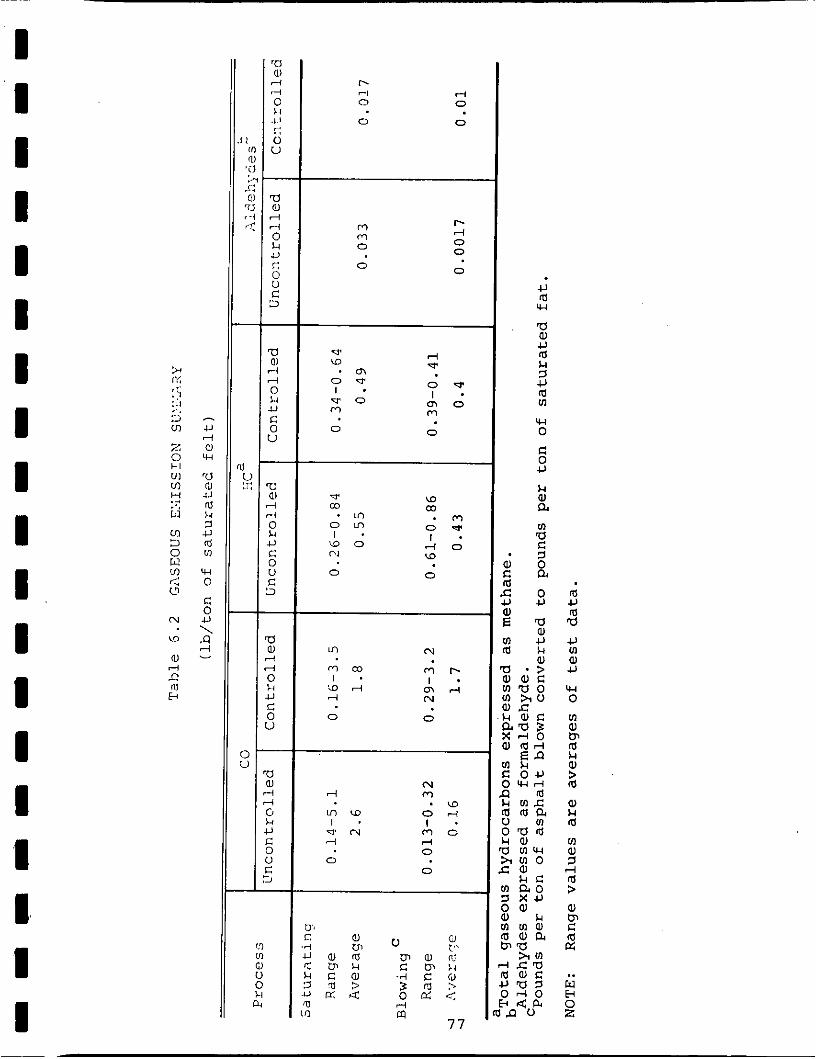
~
I 1 I I I I I I I I I I 1 I I 1 I 1 I
r- rl P-l
0 0
0 0
0 0
cf. ID m m
. m . m I . I .
w o 4 0 CI W
0 9 o m
0 0
In N
0 0
N -4 m
. a m w 0 4 I . 1 .
P' N m o 4 3
0 0
0
4J m W
a a, 4J m I-I I 4J m 01
W 0
c 0 4J
I-I a, a ln a c 1 0 a 0 4J
a a,
m 4J
a 4J ln a, 4J
W 0 VI a, 0 m Ll a, > Id
a, I-I m ln a, I rl m > Q) 0 c
m
2 .. GI h 0 z

processes depend on the resulting concentrations in ambient
air and on possible interactions with other compounds in the
air. Of prime concern is particulate matter: emissions should
not cause ambient air concentrations to exceed Federal and/or
State ambient air levels. The Federal 24-hour primary and
secondary particulate standards are 260 and 150 pg/m , respec- tively . 6'1 reduce visibility, cause soiling, and possibly affect human
health. Since particulate matter in asphalt plant emissions
is very fine, its potential for health effects is increased
by the possibility of retention in the lung. Figure 6.1 shows
percent retention of particles in the lung as a function of
particle size. The organic (asphaltic) nature of the particu-
3
Concentrations in excess of these values will
distinctive odor associated late matter also contributes to a
with asphalt.
The PPOM content of the part culate is of particular con-
cern because of possible carcinogenic effects, Table 6.3 shows
the potential carcinogenic effects of selected PPOM compounds
found in emissions from asphalt processing.
An acceptable ambient air level for PPOM compounds
has not been established. Epidemiological data, based on
benz(a)pyrene (BaP) as an indicator of PPOM, indicate that 3 a two-thirds reduction in BaP (6 pg/lOOO m3 to 2 pg/m ) could
reduce the lung cancer rate by 20 percent. 6'3 Seasonal peaks
of 79 pg/lOOO m3 in Osaka, Japan: 12 ug/lOOO m3 in Los Angeles:
and 76 ug/lOOO m3 in Birmingham have been reported, 6.3 A
78
I I I I 1 I I I 1 I I I I I '1 I I I I

...... ......... -d
.....
-. ...
I 1 I I I I I I I I I I 1 I I 1
I I I I
.. ..
..... - .. ..
no
70
ra
50
4 0
30
70
10
0
. . . . . . . . .
...
.
7!, 50 15 1 0 2 0 30 4.0
.....
....
....
. . . .
....
F i g u r e 6 .1 R e t e n t i o n of p a r t i c u l a t e m a t e i n l u n g i n r e l a t i o n t o p a r t i c l e size. k.5
7 9

Table 6.3 CARCINOGENIC POTENTIAL OF SELECTED ASPHALT 6.3
ROOFING EMISSION COMPOUNDS
Compound
Benz (a) phenanthrene
7,12 - Dimethylbenz (a)anthracene Renz (c)pyrene
Benz (a)pyrcne
3 - !.fehtylcholanthrene Dibenz (a,h)pyrene
Dibenz(a,i)pyrene
Carcinoqenici tya
+++ ++++ b -
+++ ++++ +++ +++
- N o t carcinogenic +++, ++++ Strongly carcinogenic a bCode of relative carcinogenicity: References 6 . 2 and 6.3 show a weak to inactive carcinogenic effect for benz(e)pyrene (BeP). Primary reason for inclusion in the test matrix is the concurrent presence of BeP and BaP.
80
I I I I I I I I I1 I , II
I I I 1 I I I

I I I I I I I I il I I I I I I I I I I
I I i
median value of 6.6 ug/lOOO m3 was obtained for 100 U . S . cities
in 1959. 6.4
a Birmingham-type city) in 1969 indicated concentrations of
benzene-soluble* particulate (annual average) ranging from 6
to 25 Ug/lOOO m . m3 for BaP has been proposed in Russia.
Data obtained in 7 U . S . cities (not including
3 An industrial hygiene standard of 150 ug/loOO 6 .5
6 .6 The effects of carbon monoxide are health related. 3 The Federal 1-hour ambient air standard for CO is 4U Ug/lOOO m .
Gaseous hydrocarbons affect visibility through their par-
ticipation in photochemical smog reactions, cause odors, and
potentially affect health. 6.7 One would expect only a small
percentage of compounds emitted in the asphalt roofing process
to be photochemically reactive. The low efficiencies of the
fume incinerators were probably caused by unburned methane or
light ends in the fuel oil. The Federal standard for nonmethane
hydrocarbons is 160 ug/m , based on a three-hour average. 3
Sulfur dioxide can affect visibility, construction
materials and other substances, and human health. In conjunction
with the fine particulate matter, SO2 produces adverse health
effects that are dependent on concentration. The Federal SO2
standard for a 24-hour period is 260 pg/m : for a 3-hour period, 3
3 it is 1300 pg/m . I
Aldehydes, also precursors and products of photochemical
reactions, are assigned a general level of significance at
* Indicative of total amount of organic matter present, not necessarily equivalent to polycyclic matter.
81

160 vg/m3 over a
more significant
1-hour period. 6.1
aldehydes in terms of effects, induces eye
Formaldehyde, one of the
irritation or physiological response (optical chronaxy) at
about 70 pg/m . 3 6.7
6 . 3 AMBIENT AIR CONCENTRATIONS
Atmospheric concentrations of pollutants emitted by asphalt
roofing processes must be known before environmental effects
can be assessed. A dispersion model utilizing emission data
provides an estimate of maximum ground-level concentrations at
various times and distances from point of emission.
6.3.1 Method of Calculation
The Gifford-Pasquill'atmospheric dispersion model yields
"first approximations" of short-term maximum concentrations
as a function of atmospheric stability and effective stack
height. 6.8
the Briggs plume rise equation, which generally yields a higher
effective stack height than does the Holland equation. In
evaluation of plants for which physical stack heights are
fairly short, changes in effective stack height due to plume
rise have a significant effect on the resulting calculated
ground-level concentrations. Turner concludes that the general
equations are accurate within a factor of 3 for (a) receptors
within several hundred meters exposed under all classes of
atmospheric stabilities, and (b) receptors within several
thousand meters under neutral or moderately unstable condi-
tions. 6 * 8
This dispersion calculation program incorporates
The PTMAX computer program, which incorporates this
82
I I I I I I I I I I I I I I I 11 I Ij I

I I I I I I I I I I 1 I I 0 I I I I I
dispersion model, was used to calculate ambient air concen-
trations resulting from asphalt roofing processes under a
variety of conditions.
The following parameters were used as input data for the
dispersion calculation:
physical stack height = 9.1 meters (30 feet)*
stack gas exit velocity = 15 m/sec
inside stack diameter = 1 meter
wind speed = 0.5 to 10 m/sec
atmospheric pressure = 1013 mb (1 atmosphere)
stack gas temperature = 348OK
ambient temperature = 293OK
With these parameters, ambient air concentrations were
determined as functions of various emission rates, wind speeds,
and atmospheric stabilities.
6.3.2 Calculated Ambient Air Concentrations
Figure 6.2 shows the maximum short-term ambient air con-
centrations resulting from selected stack emission rates. These
concentrations are calculated to occur under atmospheric stabil-
ity classes of C and D, and at wind speeds in the 7 to 10
m/second range. Applying this information to asphalt roofing
manufacture requires the use of representative emission rates
for typical process combinations and control efficiencies.
Production rates in the industry vary over a wide range, from
1 to 2 tons per hour to approximately 20 tons of saturated
* Many stacks are higher than 30 feet. However, some emis- sions such as fugitive leaks from buildings are at points much lower; 30 feet represents an approximate average height.
83
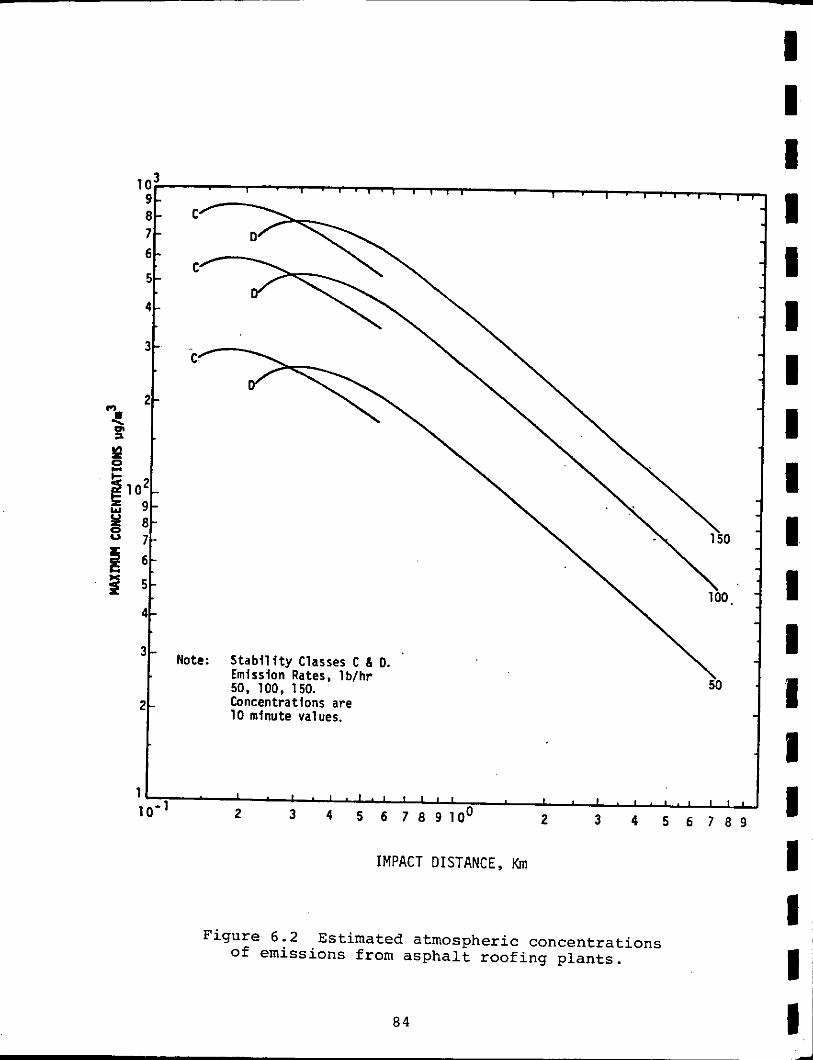
I I I
!t
Note:
l o - #
Emission Rates, 1 b/hr 50. 100. 150.
\ S t a b i l i t v Classes C & 0.
50 Concentrations are 10 mlnute values.
0- 2 3 4 5 6 7 8 9 1 0 , . I . I . , , , , , I I . , . , . , I ) ,
2 3 4 5 6 7 8 9 I IMPACT DISTANCE, Km 1
I I I
1,
Figure 6 . 2 Est imated a tmospher ic c o n c e n t r a t i o n s of emiss ions from a s p h a l t r o o f i n g p l a n t s .
8 4
I I 1 I I I 1

I I I I I I I I I
I I I I I I I I I
i
felt per hour. The average size plant produces less than 5
tons of product per hour. Newer plants tend to operate a
number of saturation lines in parallel, with typical average
production rates between 10 and 20 tons per hour. For these
calculations a rate of 10 tons per hour was selected.
Table 6,.4 summarizes the resulting particulate and PPON
ambient air levels for a 10-ton-per-hour plant employing vari-
ous combinations of processing and control equipment. For a
20-ton-per-hour plant, the resulting concentrations would be
twice those calculated in this illustration. These data show
that uncontrolled particulate concentrations amount to 150
ug/m3 on a 24-hour basis for a saturator.
operation at the same site the concentration would increase to
about 156 pg/m . PPOM concentrations up to 0.45 ug/lOOO m
could be reached on a 24-hour basis. These data represent
typical average values. Process difficulties and/or control
equipment malfunctions on the blowing operation could increase
emission levels many times.
With a blowing
3 3
The use of a plume rise equation such as the Holland
equation, which gives a lower effective stack height; also
increases the calculated ambient air concentrations ,by a factor
of 2 or 3 beyond those shown in Table 6.4.
Ambient concentrations of gaseous pollutants emitted
from the hypothetical 10-ton-per-hour plant are shown in
Table 6.5 for various processing and controi combinatlons.
These data show that the maximum 1-hour CO concentration for
85

m El
H 3 4 l=l
2
8 w 3 3 U H
2 PI
a 0 m z
3 E4 z w U z 0 U
E a w X m 0
4 E v
W
0) rl
E
n m
a m m 4 0
0 0 . .
m E
3 PI
0 z H [r, 0 2
PI 8 z a 3 0 X \ z 0 El
I 0 rl
4
8 a L
OD 0
0
!-! c
N
- V !-! &
v N
c -4 E 0 rl
-
a o m w m rl
am I - w N
a Iu
hrl O r l 4 0 a!-! !-!CI 1 c C I O m o m
m
-
m W
m rl
m m ?I
N
m
a Iu rl rl 0
!-!!-! I u c , 3 c 0 0 4 0 m
86
a m m r l 0 0 . .
- a
N m F - N
o m r( m m
m W
-
N u l
0 m . m . .,
OD
W
W
a" Y
-
I I I 1 I I I 1 I I 1 I I 1 1 1 I 1

I I I I I I 1 I I 1 I I I I I I I I I
cI
i
m r l r l
c * rl
0 0 rl
m o m In - . - d o rl
m N ., 2.W d C l l 4
87

3 this hypothetical plant is 0.12 mg/m , total hydrocarbons 3 (3-hour average) amount to 31 ug/m3, and aldehydes 1.3 ug/m .
Again, with respect to larger plants, ambient air concentra-
tions would increase in proportion to emissions.
6.4 EMISSION IMPACT
The overall impact of an average-sized asphalt roofing
plant with controls usually applied in this industry to meet
state and local particulate regulations is not great under
typical operating conditions. Malfunctions and process diffi-
culties could cause ambient air concentrations to exceed the
standards. These plants do, however, contribute to the overall
atmospheric burden, and the potential contribution of plants
located in densely populated areas, even with control equipment,
should not be ignored. Particular attention should be given to
plants with inadequate hooding over the saturator, since this
deficiency causes higher-than-average ground-level emissions
and resulting higher ambient air concentrations, usually with
accompanying odor problems.
Possible synergisms in interactions between the organic
particulate matter and gases in the atmosphere are difficult to
evaluate, since so little is known about effects of these sub-
stances. The presence of PPOM and fine particulate in air
presents the possibility of increased lung retention of car-
cinogenic compounds. The percent of PPOM in the various size
fractions was not determined in the analyses done for this study
because of the large sample volume required for this aetermina- I
88
I 1 I I I I I 1 I I I I 1 1 I 1 1 I I

I I I I I 1 I I ,I 1 1 I I I 1 I I I I
tion. Therefore, although any extraordinary health effects
of the particulate matter emitted in the manufacture of asphalt
roofing remain unidentified, such effects are possible.
I
I
I
I ,
I
89

2.1
2.2
2.3
2.4
2.5
3.1
3.2
3.3
3.4
3.5
3.6
3.7
4.1
4.2 !
4.3
4.4
7.0 REFERENCES
Asphalt and Tar Roofing and Siding Products, Summary for 1972. u . S . Dept. of Commerce, Series MA-29A (72)-1, and earlier summaries.
Bureau of the Census, Census of Manufacturers: 1972.
Bureau of the Census, Census of Manufacturers: 1967.
Statistical Abstract of the United States -1972, 93rd Edition, U. S . Dept. of Commerce.
U. S . Bureau of Census, Census of Construction Industries, 1967, Series CC 67-I-1B.
Berry, G. W. Roofing Materials. In: Kirk-Othmer Encyclopedia of Chemical Technology, Volume 17, 2nd Edition, Standen, A. (ea.). New York, John Wiley & Sons, Inc., 1967.
Ibid, Volume 2, p. 763-806.
Ibid, p . 787.
Abraham, H., Asphalts and Allied Substances; Volume 111. Princeton, D. Van Nostrand Co., Inc., 1963. p. 133-194.
Ibid, p. 231-241.
Ibid, p . 366 - 415.
Ibid, p. 64-119.
Weiss, S . M. In: Air Pollution Engineering Manual, Second Edition, Danielson, J. A. (ed.). National Air Pollution Control Administration. Raleigh, North Carolina. Public Health Service Publication 999-AP-40. 1967. p. 390.
Bay Area Air Pollution Control District. Test Report Submitted to Johns-Manville on March 9, 1973.
Hoiberg, A. J., et. al. Asphalt. In: Kirk-Othmer Encyclopedia of Chemical Technology, Volume 2, 2nd Edition, Standen, A . (ea.). New York, John Wiley & Sons, Inc., 1967. p. 762-806.
Von Lehmden. D. J., R. P. Hangebrauck, and; J. E. Meeker. Polynuclear Hydrocarbon Emissions from Selected Industrial Processes. J. Air Pollution Control ASSOC. 15: 306-312, July 1965. -
90
I I 1 I I I 1 I I 1 1 I I ! I I I I 1 I

I I 1 I I I I 1 1 1 1 I 1 I I 1 I 1 I
4.5
4.6
5.1
5.2
5.3
5.4
5.5
5.6
5.7
5.8
5.9
REFERENCES (Continued)
Leonardes, G. et. al. Odor Threshold Determination of 53 Odorant Chemicals. J. Air Pollution Control Assoc. 19:91-95, - February 1969.
Weiss, S. M. In: Air Pollution Engineering Manual, Second Edition, Danielson, J. A. (ed.). National Air Pollution Control Administration. Raleigh, North Carolina. Public Health Service Publication 999-AP-40. 1967. pp. 642 & 644.
Goldfield, J., and R. G. McAnlis. Low Voltage Electro- static Precipitators to Collect Oil Mists from Roofing Felt Asphalt Saturators and Stills. American Industrial Hygiene Assoc. J., p. 411, July-August 1963.
Private communication. United Air Specialists Inc., Cincinnati, Ohio. Feb., 1972.
Rolke, R. W. et al. Afterburner Systems Study. Shell Development Company. Emeryville, California. EPA Contract EHS D-71-3. P. 18-20: 169-178. Aug., 1972 - NTIS NO. PB-212 560.
Private communication with industry 1972.
Private communication with Mr. Will
spokesman, November
am Greig, GAF Corp., New York, New York. November 16, 1972.
Goldfield, J., V. Greco, and; K. Gandhi. Glass Fiber Mats to Reduce Effluents from Industrial Processes. J. Air Pollution Control Assoc. - 20:466-469, July 1970.
High Energy Air Filter for Reducing Industrial Effluents, Filtration Engineering. May 1970.
Private communication with Mr. David R. Duros, Monsanto Enviro-Chem Systems, Inc., Cincinnati, Ohio. November 21, 1972.
Handbook of Industrial Loss Prevention (2nd Edition). Factory Mutual Engineering Corp., New York, 1967. p. 42-4.
5.10 American Fume Burner Cleans Air. The Oil and Gas Journal, p. 57-58, March 20, 1972.
91
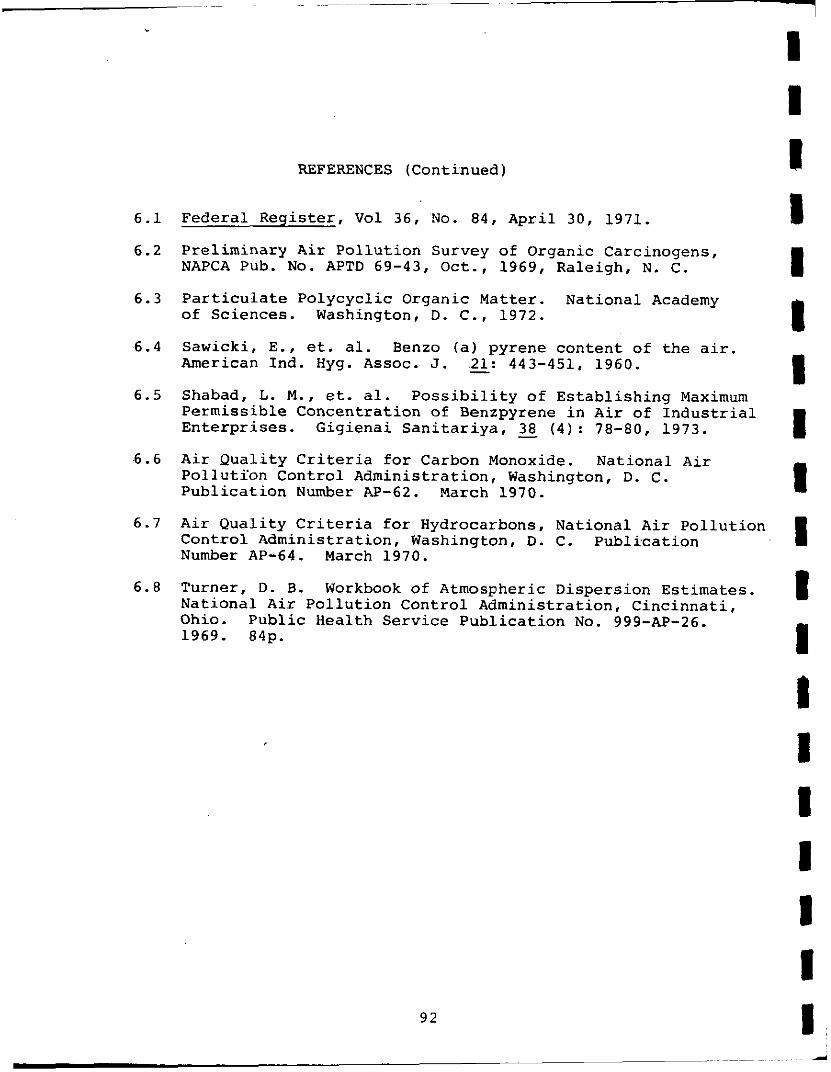
6.1
6.2
6.3
6.4
6.5
6.6
6.7
6.8
REFERENCES (Continued)
Federal Register, Vol 36, No. 84, April 30, 1971.
Preliminary Air Pollution Survey of Organic Carcinogens, NAPCA Pub. No. APTD 69-43, Oct., 1969, Raleigh, N. C.
Particulate Polycyclic Organic Matter. of Sciences. Washington, D. C., 1972.
Sawicki, E., et. al. Benzo (a) pyrene content of the air. American Ind. Hyg. Assoc. J. 21: 443-451, 1960.
Shabad, L. M., et. al. Possibility of Establishing Maximum Permissible Concentration of Benzpyrene in Air of Industrial Enterprises. Gigienai Sanitariya, 38 (4): 78-80, 1973.
Air Quality Criteria for Carbon Monoxide. National Air Polluti’on Control Administration, Washington, D. C. Publication Number AP-62. March 1970.
Air Quality Criteria for Hydrocarbons, National Air Pollution Control Administration, Washington, D. C. Publication Number AP-64. March 1970.
National Academy
-
-
Turner, D. B. Workbook of Atmospheric Dispersion Estimates. National Air Pollution Control Administration, Cincinnati, Ohio. Public Health Service Publication No. 999-AP-26. 1969. 84p.
92
I 1 I 1 I I I I I I I I I 1 I I t I I d

I I 1 1 I 1 I I I 1 a I f 1 1 I I I I
Y
8 . 0 APPENDICES
A . Asphalt Roofing P l a n t s i n 1 9 7 3 - SIC 2 9 5 2
B . Emission T e s t Procedures and R e s u l t s
j
93

APPENDIX A. LOCATION OF ASPHALT ROOFING PLANTS
Table A-1 presents a listing of asphalt roofing manufacturing
plants by state in 1973. Total annual sales are also shown for
each state. This listing is comprised mainly of plants with 20
or more employees. Plants which only produce blown asphalt are
not included in this table.
This tabulation shows a grand total of 202 installations
with annual sales of approximately $881 million. The 1972 Depart-
ment of Commerce's Census of Manufacturers shows 233 establish-
ments with total production value of approximately $1,000 million.
Information for Table A-1 was obtained from: 1) Asphalt
Roofing Manufacturers' Association, 2) Economic Information
Systems Inc. Report on SIC 2952 of April 22, 1974, and 3 ) the
U.S. EPA National Emission Data Survey for 1972.
94
I I I I I I 1 I I I I 1 P 1 I I I I 1

I I I I t I 1 I I 1 1 I 1 I I I I 1 I
Table A - 1 LISTING OF ASPHALT ROOFING PLANTS IN 1973a SIC 2952
__ Company Name and Location
Alabama
Celotex Corp. Birmingham, Jefferson, 35200
GAF Mobile, Baldwin, 36600
Koppers Co. Woodard, Jefferson, 35189
Logan Long Co. Tuscaloosa, Tuscaloosa 35401
4 $4.5 6 Total Plants and Sales x 10
Arkansas
Bear Brand Roofing Inc. Bearden, Quachita 71720
Celotex Corp. Camden, Columbia 71701
Elk Roofing Co. Stephens, Quachita 71746
Southern Asphalt Roofing Corp. Little Rock, Pulaski 72200
4 $23 6 Total Plants and Sales x 10
California
Bird & Son, Inc. San Mateo, San Mateo 94403
Bird & Son, Inc. Wilmington, Lake 90744
Celotex Corp. Los Angeles, Los Angeles 90031
Certain Teed Products Corp. Richmond, Contra Costa 94804
95

'l'ahlc A-l(Continued) LISTING OF ASPHALT ROOFING PLANTS IN 1473
SIC 2952 - -. _ _ _
Company Niimc and Location
California, (Continued)
Fibreboard Corp. Martinez, Contra Costa 94553
Fibreboard Corp. Oakland, Alameda 94600
Flintkote Co. Los Angeles, Los Angeles 90000
Flintkote Co. San Andreas, Calaveras 95249
Johns-Manville Products Los Anqeles, Los Angeles 90058 and Pittsburg, Contra Costa
Lloyd A. Fry Roofing Co. Compton, Los Anqeles 90223
Lloyd A. Fry Roofing Co. San Leandro, Alameda 94577
Lunday-Thagard Oil Co. South Gate, Los Anqeles 90280
Nicolet Industries Hollister, Santa Cruz 95023
Owens Corning Fiberqlas Santa Clara, Santa Clara 95000
Rigid Mfg. Co., Inc. Los Angeles, Los Anqeles 90022
Mrs. Paul Smithwick Los Angeles, Los Angeles 90066
Standard Materials Co., Inc. Merced, Merced 95340
Thermo Materials, Inc. San Diego, San Diego 92109
United States Gypsum Co. South Gate, Los Angeles 90280
20 $70 6 Total Plants and Sales x 10
96
I 1 1 1 I I 1 I I I I 1 I I 1 1 I 1 1
~~

I I I I I I I I I 1 1 I 1 I 1 1 I 1 t
Table A-l(Conthued). LISTING OF ASPHALT ROOFING PLANTS IN 1973
51C 2952
.
Company Name and Location
Colorado
Colorado BitumUlS Co. Denver, Denver 80216
GAF Corp. Denver, Denver 80216
Lloyd A. Fry Roofing Co. Denver, Denver 80216
3 $9.5 6 Total Plants andlSales x 10
Connecticut
Allied Chemical Corp. Mountville, New London 06353
Tilo Co., Inc. Stratford, Fairfield 06497
2 $13 6 Total Plants and Sales x 10
Delaware
Artic Roofings , InC. Edge Moore, New Castle 19809
Artic Roofings, Inc. Wilmington, New Castle 19809
2 $9 6 Total Plants and Sales x 10
Florida
GAF Corp. Tampa, Hillsborough
Gardner Martin Asphalt Corp. Tampa, Hillsborough 33605
Lloyd A. Fry Roofing Co., I n c . Ft. Lauderdale, Broward 33316
97

Table A-l(Continued). LISTING OF ASPHALT ROOFING PLANTS IN 1973
SIC 2952
__ ~
Comkany Name and Location
Florida (Continued)
Lloyd A. Fry Roofing Co., Inc. Jacksonville, Duval 32206
4 $7 6 Total Plants and Sales x 10
Georgia
Certain Teed Products Corp. Port Wentworth, Effingham 91407
Certain Teed Products Corp. Savannah, Chatham 31402
GAF Corp. Savannah, Chatham 31402
Gibson Homans Co. Conyers, Rockdale ? 30207
Johns-Manville Products Savannah, Chatham 31402
Lloyd A. Fry Roofing Co. Atlanta, Fulton 30311
Mullins Bros. Pvgn. Cntrc. E. Point, Fulton 30044
Southern Paint Products Atlanta, Fulton 30310
The Ruberoid Co. Savannah, Chatham 31402
Total Plants and Sales x 10 9 $55 6
Illinois
Allied Asphalt Paving Co. Hillside, Cook 60162
Allied Chemical Corp. Chicago, Cook 60623
98 I
1 1 I I 1 I 1 I I I I I I I I I I I 1

I t 1 I I I I 1 1 I I I I I I 1 I 1 I
Table A-l(Continued). LISTING OF ASPHALT ROOFING PLANTS IN 1973
SIC 2952
Company Name and Location
Illinois (Continued)
Ama1,gamated Roofing Div. Bedford Park, Cook 60501
Becker Roofing Co. (2 plants) Chicago, Cook 60647
Bird & Son Inc. Chicago, Cook 60620
Celotex Co. Elk Grove Village, Cook 60007
Celotex Co. Peoria, Peoria 61600
Celotex Co. Wilmington, Kankakee 60481
Certain Teed Products Corp. Chicago Heights, Cook 60411
Certain Teed Products Corp. E. Saint Louis, Saint Clair 62205
Crown Trygg Corp. Joliet, Will 60434
Flintkote Co. Chicago Heights, Cook
FS Services, Inc. Kingston Mines, Peoria 61533
GAF Corp. Joliet, Will 60433
Globe Industries, Inc. Chicago, Cook 60600
J. W. Mortell Co. Inc. Kankakee, Kankakee 60901
Johns-Manville Corp. Madison, Madison 62060
Johns-Manville Corp. Waukegan, Lake 60085
Koppers Co. Chicago, Cook 60000
99

Table A-l(Continued). LISTING OF ASPHALT ROOFING PLANTS IN 1973
SIC 2952 - __...
Company Nnrnc and Location
Illinois (Continued)
Lloyd A. Fry Roofing Co. Argo, Cook 60501
Lloyd A. Fry Roofing Co. Summit, Clay 60501
Logan Long Co. Chicago, Cook 60638
McCalman Construction Co. Danville, Vermilion 61832
Midwest Products Co., Inc. Chicago, Cook 60619
Nicolet Industries Union, Boone 62635
Rock Road Construction Co. Chicago, Cook
Seneca Petroleum Co., Inc. Chicago, Cook 60616
Triangle Construction Co. Kankakee, Kankakee 60901
Washington Paint Products Chicago, Cook 60624
30 $145 6 Total Plants and Sales x 10
Indiana
Asbestos Mfg. Corp. Michigan City, La Porte 46360
GAF Corp. Mount Vernon, Posey 47620
Globe Industries, Inc. Lowell, Lake 46356
H. B. Reed & Co. , Inc. Gary, Lake 46406
100
1 I 1 1 1 I I II I I I I I I 1 1 1 I
!

I I 1 I I 1 I I I I I I 1 I I 1 I I I
Table A-l(C0ntinued). LISTING OF ASPHALT ROOFING PLANTS IN 1973
SIC 2952
Company Name and 'Location
Indiana (Continued)
Lloyd A. Fry Brookville, Franklin 47021
4 $20 6 Total Plants and Sales x 10
Iowa
Becker Roofing Co., Inc. Burlington, Des Moines 52601
Celotex Corp. Dubuque, Dubuque 52001
Tufcrete Co., Inc. Des Moines, Polk 50309
3 $13 6 Total Plants and Sales x 10
Kansas
Royal Brank Roofing, Inc. Phillipsburg, Phillips 67661
1 $4.5 6 Total Plants and Sales x 10
Louisiana
Bird & Son, Inc. Shreveport, Caddo 71102
Delta Roofing Milis, Inc. Slidill, Saint Tammann 70458
Johns-Manville Corp. Marrero, Jefferson 70072
Slidell Felt Mills, Inc. Slidell, Saint Tammann 70458
4 $46 6 Total Plants and Sales x 10
101

Table A-l(Continued). LISTING OF ASPHALT ROOFING PLANTS IN 1973
SIC 2952 - - Company Name and Location
Maryland
Congoleum-Nairn, Inc. Finksburg, Carroll 21048
Baltimore, Baltimore 21224
Lloyd A. Fry Roofing Co. Jessup 20794
GAF Corp.
3 $22 6 Total Plants and Sales x 10
Massachusetts
Bird & Son, Inc. Norwood, Norfolk 02062
Essex Chemical Corp. Peabody, Essex 01960
GAF Corp. Millis, Norfolk 02054
Lloyd A. Fry Roofing Co., Inc. Waltham, Middlesex 02154
Patrick Ross Co. Cambridge, Middlesex 02142
I I I 1 1 I I 1 I I I 1 I
5 $15 6 Total Plants and Sales x 10
Michigan
Lloyd A. Fry Roofing Co. Detroit, Wayne 48217
GAF Corp. Warren, Macomb 48089
Minnesota
I 1 :
Duval Mfg. Co., Inc. Minneapolis, Hennepin 55426
102 I

I 1 1 I I 1 I I 1 I 1 I 1 I I I I I I
Table A-l(Continued). LISTING OF ASPHALT ROOFING PLANTS IN 1973
SIC 2952 - - - -
Company Name and Location
Minnesota (Continued)
Duvall Mfy. Co., Inc. Minneapolis, Hennepin 55412
EDCO Products, Inc. Hopkins, Hennepin 55343
GAF Corp. Minneapolis, Hennepin 55411
Lloyd A. Fry Roofing Co. Minneapolis, Hennepin 55412
B. F. Nelson Mfy. Co., Inc. Minneapolis, Hennepin 55413
E. J. Pennig Co., Inc. St. Paul, Ramsey 55103
United States Gypsum Co. St. Paul, Ramsey 55100
8 $35 6 Total Plants and Sales x 10
Mississippi
Atlas Roofing Mfg. Co. Meridian, Lauderdale 39301
Lloyd A. Fry Roofing Co. Hazelwood
2 $12 6 Total Plants and Sales x 10
Missouri
Certain Teed Products Corp. Kansas City, Jackson 64126
GAF Corp. Kansas City, Jackson 64126
Lloyd A. Fry Roofing Co., Inc. Hazelwood, St. Louis 63042
103

T a b l e A - l ( C o n t i n u e d ) . LISTING OF ASPHALT ROOFING PLANTS I N 1973
SIC 2952 __ Company N a m e and L o c a t i o n
-
M i s s o u r i ( c o n t i n u e d )
L loyd A. F r y Roofing C o . , I n c . N. Kansas C i t y , Clay 64116
Midwest P r e C o t e Co. Kansas C i t y , C l a y a 64119
Tamko A s p h a l t P r o d u c t s , InC. J o p l i n , J a s p e r 64801
6 $34 6 T o t a l P l a n t s a n d S a l e s x 1 0
N e w Hampshire
T i l o C o . , I n c . Manches t e r , Hi l lsboro 03101
1 $2 6 T o t a l P l a n t s a n d Sales x 1 0
N e w ' Jersey
A t l a n t i c C e m e n t Co . Bayonne, Hudson 07002
B i r d f. S o n , I n c . P e r t h Amboy, Midd lesex 08862
Celotex Corp. Edgewater, M i d d l e s e x 07020
Celotex Corp. P e r t h Amboy, M i d d l e s e x 08862
F l i n t k o t e C o . , Inc. E . Rutherford, Bergen 07073
F l i n t k o t e C o . , I nc . Whippany, Morris 07981
GAF Corp. S o u t h Bound Brook, Somerse t 08880
Johns -Manv i l l e Corp. Manville, Somerset 08835
Karnak Chemica l Corp. C l a r k , Union 07066
104
I I 1 I 1 I 1 I I I I 1 I I I 11 1
1 I!

I I I I I 1 1 I 1 I I I I I 1 I I I I
Table A-l(Continued). LISTING OF ASPHALT ROOFING PLANTS IN 1973
SIC 2952
Company Name and Location
New Jersey (Continued)
Congoleum Nairm, Inc. Kearny, Bergen 07032
Koppers Co., Inc. Westfield, Union 07090
Lloyd A. Fry Roofing Co., Inc. Kearny, Bergen 07032
Middlesex CNC Products Excv. Woodbridge, Middlesex 07095
Tilo Co., Inc.. Westfield, Union 07092
United States Gypsum Co. Jersey City, Hudson 07300
15 $52 6 Total Plants and Sales x 10
New Mexico
Dura Roofing Mfg. Inc. Albuquerque, .Bernalillo 87103
1 $4.5 6 Total Plants and Sales x 10
New York
Alken-Murry Corp. New York, New York
Allied Chemical Corp. Binghamton, Broome 13902
Durok Bldg. Materials Hastings-Hdsn., Westchester 10706
Tilo Co. Inc. Poughkeepsie, Dutchess 12603
Tilo Co. , Inc. Watertown, Jefferson 13601
Weatherpanel Sidings,' Inc. Buffalo, Erie 14207
6 $14 Total Plants and Sales x lo6 105

_-
Table A-l(Continued). LISTING OF ASPHALT ROOFING PLANTS IN 1973
SIC 2952 --- .__._I_-_-_._ __- Company Niirne and Location
North Carolina
Celotex Corp. Goldsboro, Sampson 07530
Lloyd A. Fry Roofing Co., Inc. Morehead City, Carteret 28557
Rike Roofing & Mfg. Co. Charlotte, Mecklenburg 28201
6 Total Plants and Sales x 10
Ohio
Celotex Corp. Cincinnati, Hamilton 45215
Certain Products Co. Milan, Erie 44846
Consolidated Paint Varnish Cleveland, Cuyahoga 44114
Gibson Homans Co., Inca Cleveland, Cuyahoga 44106
Johns-Manville Corp. Cleveland, Cuyahoga 44134
Koppers Co., Inc. Cleveland, Cuyahoga 44106
Koppers Co., Inc. Youngstown, Mahoning 44500
Lloyd A. Fry Roofing Co. Medina, Cuyahoga 44256
Logan Long Co. , Inc. Franklin, Warren 45005
Midwest Products Co., Inc. Cleveland, Cuyahoga 44110
Overall Paint, Inc. Cleveland, Cuyahoga 44146
Ranco Industrial Products Cleveland, Cuyahoga 44120
.
106
3 5 8
I 1 1 1 I I 1 I
1 1 1 I 1 1 I I I I
I '
I

I I I I I I I I I 1 1 I 1 I I
, I I I I
Table A-l(Continued). LISTING OF ASPHALT ROOFING PLANTS IN 1973
SIC 2952 -__I_
Company Name and Location
Ohio (Continued)
SET Products, Inc. Cleveland, Cuyahoga 44106
Tremco Mfg. Coi. Cleveland, Cuyahoga 44104
0
14 $60 6 L
Total Plants and Sales x 10
Oklahoma
Allied Materials Corp. Stroud, Lincoln 74079
Big Chief Roofing Co., Inc. Ardmore, Carter 73401
Lloyd A. Fry Roofing Co., Inc. Oklahoma City, Caradian 73117
3 $12 6 Total Plants and Sales x 10
Oregon
Bird & Son, Inc. Portland, Multnomah 97200
Fibreboard Corp. Portland, Multnomah 97210
Flintkote Co., Inc. Portland, Multnolnah 97208
Herbert Malarkey Roofing Co. Portland, Multnomah 97217'
Lloyd A. Fry Roofing Co., Inc. Portland, Multnomah 97210
Shell Oil Co.. Portland, Multnomah 97210
6 $16 6 Total Plants and Sales x 10
10 7
1

Table A-l(Continued). LISTING OF ASPHALT ROOFING PLANTS IN 1973
SIC 2952 .- Company Name and Location . Pennsylvania
Allied Chemical Corp. Philadelphia, Philadelphia 19146
Celotele Corp. Philadelphia, Philadelphia 19146
Celotex Corp. Sunbury, Northumberland 17801
Certain Teed Products Corp. York, York 17303 '
and St. Gobian, Luzerne, 18707
ESB Inc. Del. Mertztown, Berks 19539
GAF Corp. Erie, Erie 16500
Keystone Roofing Mfg. Co. York, York 17403
Lloyd A. Fry Roofing Co. Emmaus, Lehigh 18049
Lloyd A. Fry Roofing Co. York, York 17404
Monsey Products CO., Inc. Philadelphia, Philadelphia
H. C. Price Co. Philadelphia, Philadelphia
Tilo CO. Inc. Philadelphia, Philadelphia
19128
19115
19118
13 $63 6 Total Plants and Sales x 10
South Carolina
Bird L Son, Inc. Charleston Hts., Charleston 29405
1 $14 Total Plants and Sales x 10 6
108
-
I 1 I I 1 I 1 1 1 I I 1 I 1 1 1 I I I!

I I 1 I I I I I I I I I I I 1 4 I I I.
Table A-l(Continued). LISTING OF ASPHALT ROOFING PLANTS IN 1973
SIC 2952
~
Company Name and Location
Tenne s s ee
Celotex Corp. Memphis, Shelby 38100
Lloyd A. Fry Roofing Co. Memphis, Shelby 38107
2 $3 6 Total Plants and Sales x 10
Texas
American Petrofina Tex. Mt. Pleasant, Titus 75455
Celotex Corp. Houston, Liberty 77000
Celo tex Corp. San Antonio, Bexar 78200
Certain Teed Pats. Corp. Dallas, Dallas 75216
Dainqerfield Mfg. Co. Dainqerfield, Morris 75638
Flintkote Co. Ennis, Ellis 75119
GAF Corp. Dallas, Dallas
Gulf States.Asphalt Co., Inc. Beaumont, Jefferson 77704
Johns-Manville Corp. Ft. Worth, Tarrant 76107
Lloyd A. Fry Roofing Co. Irving, Dall'as 75060
Lloyd A. Fry Roofing Co. Houston, Harris 77029
Lloyd A. Fry Roofing Co. Lubbock, Lubbock 79408
109
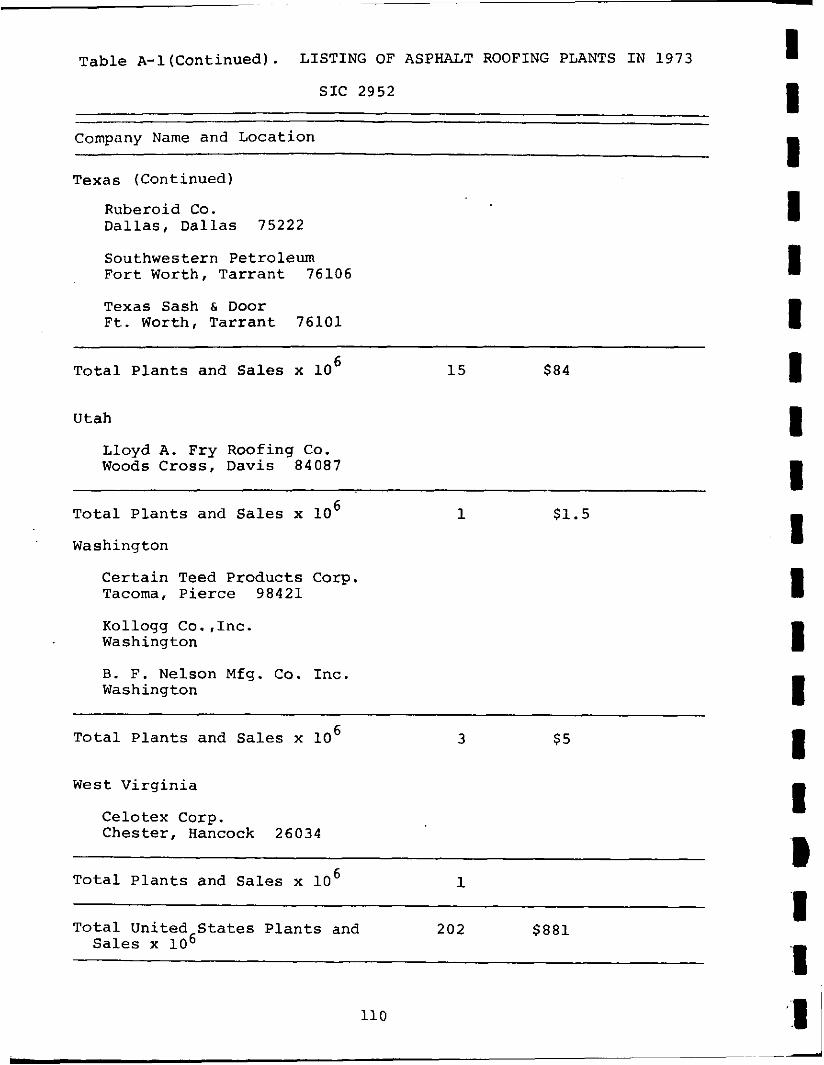
T a b l e A- l (Con t inued) . LISTING OF ASPHALT ROOFING PLANTS I N 1973
SIC 2952
.-
Company N a m e and Locat ion
Texas (Continued)
Ruberoid C o . Dallas, Dallas 75222
Southwestern Petroleum F o r t Worth, T a r r a n t 76106
Texas Sash & Door F t . Worth, T a r r a n t 76101
~ ~
15 $84 6 T o t a l P l a n t s and S a l e s x 10
Utah
Lloyd A. Fry Roofing Co. Woods Cross, Davis 84087
1 $1.5 6 T o t a l P l a n t s and S a l e s x 10
Washington
C e r t a i n Teed P r o d u c t s Corp. Tacoma, Pierce 98421
Kollogg Co. , Inc. Washington
B. F . Nelson M f g . C o . Inc. Washington
6 Tota l P l a n t s and S a l e s x 10
W e s t V i r g i n i a
Ce lo tex Corp. Ches t e r , Hancock 26034
1 6 T o t a l P l a n t s and S a l e s x 10
T o t a l Uni ted S t a t e s P l a n t s and 202 $881 S a l e s x 106
I I 1 1 I I I I I I 1 I I I I 1 I I '.! 110

I I I I I I I 1 I I 1 I I I I I I I I
APPENDIX B. EMISSION TEST PROCEDURES AND RESULTS
INTRODUCTION
To obtain quantitative emission data, tests were conducted
at three plants. The following tests were made:
Plant A - Particulate, PPOM, and gaseous emissions from felt saturators running 27- and 55-pound felt. Tests were made with and without a HEAF collector in the vent stream.
Plant B - Particulate, PPOM, and gaseous emission from a felt saturator running 21- and 55-pound felt, and from an asphalt blowing operation. Tests were made simultane- ously before and after process heaters used as fume incinerators on each process.
Plant C - Particulate, PPOM, and gaseous emissions from an asphalt blowing operation. Tests were made simultane- ously before and after a process heater used as a fume incinerator.
This appendix describes the test procedures used, and the raw
data used to calculate the emissions summarized in this report.
TEST PROCEDURES
Emission testing procedures followed those described in
EPA methods 1 through 5. Method 1 was used to locate sampling
sites. The selected sites, which were at times not ideal,
are shown in Figures B-1 throuqh B-9 along with the number of
B.l
sampling points utilized at each site.
Particulate . .
Particulate matter was sampled isokinetically by using the
sampling trains illustrated in Figures B-10 and B-11.
111

P- l
I_
IIL
m 0
i
I 1 I I I I I I I I I I I I 1 I I I

I I I I \I I I I I I I 1 I I I I I I I
- 44'+
t
B 0
A 0
1
I I 44" I . 0
0 0
0"
- I"
ROOF 1-1 BYPASS STACK
Figure B - 2 . Line 1 s a t u r a t o r bypass s t a c k - P l a n t A .
113
__

I t ~
T O INCINERATOR
Figure B-3 . A s p h a l t b lowing i n l e t - P l a n t B .
, . . . . 114
-
I I I I I I I I I 1 I I I I I 1 I I I

-
I I I I I I I I I I I I I I I I I I I
-1 80"
295"
0
- 41.5'-
-4 FROM / INCINERATOR
0 0 0 0
Figure B-4. Asphalt blowing o u t l e t - Plant B .
115

Figure B-5. S a t u r a t o r inlet - P l a n t B.
116
I I I I I I I I I I I I I I
1 I I
I~
I

I I I - I I I I I I I I I I I I I I I I
27"
t - 16"
'b 8"+ 8 ' y 4 0 0 0
6 0"
4
FROM INCINERATOR
FROM INCINERATOR
012
0 0 0
0 0
0 0 0
0 0 01
0 12 012
0 0 0 0
0 0 0 - 0
0 0 0 0
0 0 0 0 0 0 0 0 . 0 1 0 1
I 1 ' I I n B
Figure B-6. Saturator outlet - Plant B.
117
I I C

118
I I I I I I I I I I I I I I I I I I I -

I I I I .I I I I I I rn I I I I I I I I
24 SAMPLING POINTS 30 in. I O
N
>FUME INCINERATOR
F i g u r e B-8. A s p h a l t blowing i n l e t - P l a n t C.
119
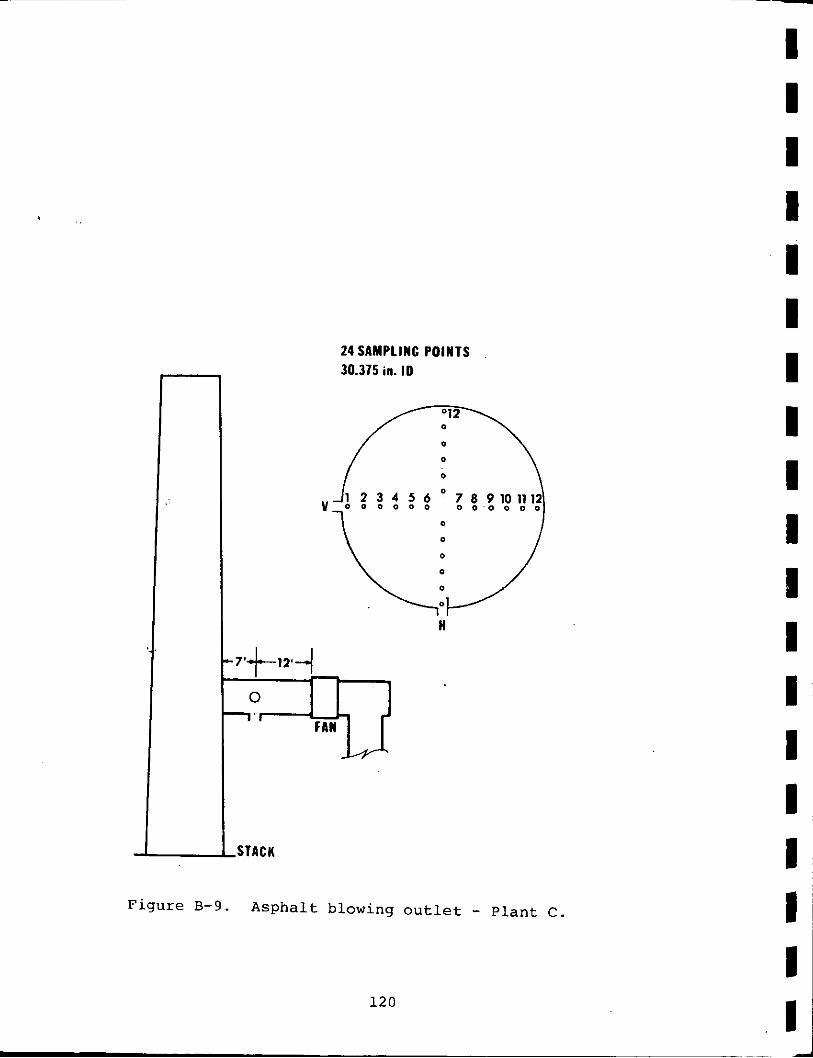
24 SAMPLING POINTS 30.375 in. I O
H
7 4 - 1 2 4
.STACW
Figure B-9. Asphal t blowing outlet - P l a n t C .
120
I I I I I I I I I I 1 I I I I I I I I

I I I I (1
Y
121
$ a, Ll u m a a, rl
a, u a 4 . 1 u .d u Ll a m
Ll 0
W
C .r( m
'd 5 [I]
rb m

1 2 2
-1 4: U
I I I I 1 I I I I I I 1 1 I I' I' 1 I
I

I I I I I I I I I I 1 I I 1 I P 1 I I
For uncontrolled emission streams, the sampling train in
Figure B-10 was used. With this train, the organic particulate
was condensed in the impingers which contained water (Impingers 1,
2 and 3 ) . The final filter was used as a back-up to ensure
complete particulate collection. After sampling, the filter was
removed and placed into a container for transfer to the laboratory.
The impinger contents were measured and placed in glass containers
for later analysis, and the entire sampling train was rinsed with
acetone and methylene chloride.
third container for later analysis.
These rinsings were placed into a
For gas streams with relatively low particulate concen-
trations as found after a control device the EPA Method 5 sampling
train as shown in Figure B-11 was used. Sample recovery in this
case yielded: 1) an acetone and methylene chloride rinse of the
probe and front half of the filter holder, 2 ) the filter, 3 ) the
impinger contents, and 4 ) an acetone and methylene chloride rinse
of the impingers and connecting glassware. The filterable parti-
culate was considered to be that portion caught in the probe and
on the filter. Analysis consisted of drying the acetone/methy-
lene chloride fraction in a tared beaker at room temperature and
weighing the residue. The filters were desiccated and weighed.
The impinger solutions were extracted with ether and chloroform
in a separatory funnel. This extract was placed in tared beakers
and dried at room temperature and weighed. The remaining
impinger solution was boiled to dryness and weighed. Total
particulate was the sum of these individual fractions.
123

When using the EPA Method 5 train considerable seepage of
liquid organic matter through the filter occurred, and a true
breakdown between filterable and non-filterable or condensible
particulate could not be made. A l s o , in all cases, drying of
the collected particulate residues was a problem since the
samples continually lost weight in a desiccator. This was due
to loss of the lighter organic portions of the sample. To
prevent undue sample loss, all final sample weights were recorded
after 4 8 hours in a desiccator.
Polycyclic Particulate Organic Matter
Previous studies on the collection of these compounds
have shown the necessity for cooling the sample to at least
65" F. before all PPOM compounds can be collected.
This was accomplished by utilizing the particulate sampling
train shown in Figure B-10. With the impingers contained in an
ice-water bath, the final filter was maintained at less than
65OF.
traversing the ducts as required for particulate sampling. Sample
recovery consisted of three fractions: namely, the filter,
the impinger contents, and an acetone and methylene chloride rinse
of the entire train interior, up to the final filter. The samples
were kept in dark glass containers and refrigerated during
storage.
B.2,B.3
PPOM collection was accomplished by isokinetically
PPOM analysis consisted of the following steps: B.4
with methylene chloride, and the aqueous impinger solutions were extracted four times with methylene chloride.
The used filters were soxhlet extracted for 30 hours
124
I I .I 1 I I I I I I I I 1 I I 11 1 I I -

~
I I 1 1 1 1 I I I 1 1 I I 1 I 1 I I I
These extracts were combined and reduced to a small volume on a rotary evaporator, at which stage the acetone and methylene chloride rinses supplied were added to the evaporator and the whole reduced in volume. When no further solvent could be removed, the volume remaining was approxi- mately 20 ml of black oily liquid. One ml of this solution was subjected to quantitative liquid chromatography on an alumina column. Following elution of the aliphatic hydro- carbons with 25 ml of petroleum ether, the sample was eluted with 50 mls of 10% methylene chloride in petroleum ether. This latter fraction would contain the compounds of interest that were present. This sample was evaporated with a stream of nitrogen to a volume of about 25 !.11 for further analyses.
The sample was then analyzed by gas chromatographic-mass spectrometry using chemical ionization with methane. The chromatographic separation was accomplished using 6 to 18 foot long, 2 . 5 % Dexil 300 columns programed from 240° to 300' C at l0C per min. A Varian 1700 chromatograph was interfaced with a Finnigan 1015 quadruple mass spectro- meter equipped with a System Industries 1500 data acquisi- tion system. The total ion chromatogram was displayed on the CRT unit. Individual ion chromatograms for the nominal masses of the protonated molecular ions of the compounds of interest were overlayed with this chromatogram to locate the desired polynuclear aromatic compounds. Benzpyrenes were quantitated by this layer chromatography and spectro- fluorescence.
The detection limit for this procedure is on the order of
3 nanograms, and the accuracy for well defined peaks is + 10%. - ALDEHYDES
Aldehydes were collected in a solution of MBTH (3-methyl-2-
benzothiazolone hydrazone hydrochloride) contained in 2-liter
flasks.
described in EPA Method 7 . B'l
metrically.
Samples were collected by following procedures
Analysis was performed colori-
HYDROGEN SULFIDE
These compounds were collected in a solution of cadmium
sulfate and hydroxide contained in a set of midget impingers:
The resulting concentration was determined colorimetrically.B-6
125

Gaseous Hydrocarbons and Carbon Monoxide
These compounds were collected in rfedlarR plastic bags
and analyzed with a flame ionization detector calibrated with
a methane/air mixture. CO was catalytically converted to CH4
in the presence of hydrogen and analyzed as CH4.
TEST RESULTS
I t I
Tables B-1 through B-21 contain the field data and analytical
results obtained during the studies. These data were summarized
in the body of this report. 1
I , I 1 1 I 1
Registered Trademark
126
I 1 I I

I I I I I 1 I 1 1 1 1 I
1 I 1 I I I I 1
B. 1
B. 2
B. 3
B.4
B. 5
B. 6
REFERENCES FOR APPENDIX B
Federal Register, Vol. 36, No. 247, Part 11, December 23, 1971.
Stenburg, R. L., et al., Sample Collection Techniques for Combustion Source-Benzopyrene Determination. Industrial. Hygiene Journal. August 1961.
Diehl, E. K., et al., Polynuclear Hydrocarbon Emission from Coal-Fired Installations. ASME Paper 66-Pw-2. J. of Engineering for Power, 1966.
Jones, P.W. and P.E. Strop, Analysis of Carcinogenic PNA's from Asphalt Roofing Industry. Battelle Columbus Laboratories, March 11, 1974, May 30, 1974 and July 18, 1974.
Selected Methods for the Measurement of Air Pollutants. U.S. Department of Health, Education and Welfare, May 1965. Publication 99-AP-11.
Jacobs, M.B., et al., Analytical Chemistry, 29 (9). September 1957.
127

T a b l e B - 1 SUMMARY OF PROCESS DATA FOR NUMBER 3
ROLL ROOFING MACHINE - PLANT A
Date
T e s t N o .
Felt w e i g h t a
F e l t w i d t h , i n c h e s
F e l t m o i s t u r e , %
F e l t s p e e d , fpm
F e l t , t o n s / h r
S a t u r a n t t e m p e r a t u r e , "F
S o f t e n i n g p o i n t , OF
S a t u r a n t , t o n s / h r
T o t a l p r o c e s s w t . , t o n s / h r
HEAF C o n t r o l Device
2 F i l t e r media speed, f t /h r
Pressure d r o p across HEAF and demister, i n c h e s H20
3/26/14
BP3-1&2
2 1
36
3 . 5
350-400'
1 . 8 5
427
105-115
2.66
4 . 5 1
48 .5
20.5
a ) Pounds p e r 480 sq. f t .
b, F e l t ra te determined by p l a n t p e r s o n n e l
128
3/21/14 3/28/14
L3-1&2 BP3-3&4 L3-3&4
2 1
36
3 .1
3 50- 400b
1 . 7 7
426
105-115
2.52
4 . 2 9
N e w Des ign
48.5
20.5
2 1
36
3.4
35 0-4 O O b
1 . 8 0
431
105-115
2.60
4.40
48.5
20 .5
1 1 1 1 1 1 1 1 1 1 1, 1 1 1 1 1 1 1 1 -

I I 1 I I I I I I 1 I I I 1 1 1 1 I 1
T a b l e B-2 SUMMARY O F PROCESS DATA FOR NUMBER 1 SHINGLE MACHINE - PLANT A
Date
T e s t N o .
F e l t w e i g h t a
F e l t w i d t h , i n c h e s
F e l t mois ture , %
F e l t speed, f p m
F e l t , t o n s / h r
S a t u r a n t temperature, OF
S o f t e n i n g p o i n t , OF
S a t u r a n t , t o n s / h r
T o t a l process w t . , t o n s / h r
HEAF C o n t r o l Device
F i l t e r media speed, f t 2 / h r
P r e s s u r e drop across HEAF and d e m i s t e r , i n c h e s of H 2 0
3/26/74 3/27/74
L1-1 t o 4 BP1-1 t o 4
55 55
48 48
3.4 3 .1
b 350-440
5.69 5.78
435 435
120-130 120-130
10.25 1 0 . 2 5
15 .94 16 .03
New Design
4 7 . 1 4 7 . 1
27.0 27.0
.
a ) Pounds per 480 sq. f t . b, F e l t r a te d e t e r m i n e d by p l a n t personnel
129

I I f I
&s3& FJOdd
y l m m 3 m ..N rl N N W
m 0 o w r l P I w . . . . . r l o o y l m r l
m m r . m n
. r l d O r l W m o o r l n m O . . . . . r l O O 9 1 N O
- u rl a, w
~m r l r l ~ m
w o o n r l N O
. o o m . m . . . O
a rl
r- N - m
ar c 0 - P -
n r l r l r n - * O O N N
r l o o w . 4 . . . O
I
a 0
2 3 Et a: v)
Ln
* 0 W
m =? rl rl . n m
m Ln m
n n . n m o
m q o m N . . . r l m
. - r - m r l r l y l - . I n
m X I 1 1 . 1 I
I I I I I
4 0 rl C
.4
N m m
.-I 0 - 0
. r l a L " r l W 0
rl
03
0 m
W 0
W m w 0 0 o w
w m n w m w w m o r l n
21 m . o m . . . e, \ m - r . m m m m m r . r l o n m m r l . . w m
I I I I I o r n o . . N N N P W
a 0 h
I
w r. rl
0 U d P
m
L
I
0 m L u 10 0
I l l
I
5 a W I m
rl a
Lo 5
rl
U 0 E
m
a, 4 u
rl m W
W 0
C 0
AJ \
4
a C .4 Y
H 2
0
W m A
U m
I I
u Lo W
0 u 0
U C 0: u U a 14
a u 10 0 \ u 0,
0)
5 rl 0 La
C 0 U \
2
L u a: \ u m
u Jz '. 4
Ll c \
rl n
130

I 1. I I 1 1 I I I 1 1 I I 1 I 1 I I 1
,LSX,L
WOdd
13 1
m X
C 4
^^^^_ a n u a m

A
I c r rlp' GI\
CIN u)\ cum w
m I
w r-
w . 0
v, rl
0
m v, w m o r l 0 O N r l 0 0
0 0 0 0
m , w
m o o 0 0 0 4 0 0 0 p ' w m m -
0 0 0 0
m
rl
rl c o w o 0 0 m c o w o ulul
0 0 0 4 0 0
m I m N
0
co m 0
N 4
0 0
W 0
0 0
a, c a, $4
i? - a, N c a, m
-
a,
a, ).I x a m N c a,
- v
m
132
a, c cu L! % a c m N c 0) S! ..-I 0
I . -
a, c a, L! >I a .rl
m N c a, a ..-I 0
. Y
1 I I 1 I I I I I I I 1 I I I I I 1 I

I I I 1 I 1 I 1 1 1 l(b I 1 I 1 I I I 1
Table B-6 GASEOUS EMISSION DATA ASPHALT SATURATOR - PLANT A
-__ Compound
HCa
co
CHOHb
HCa
co
CHOHb
Uncontrolled Li n
58 ppm
614
2.39 4 .80
Lini
43 ppm
512
3.3 2.9
Controlled 1
79 PPm
410
2.46 0.69
3
71 ppm
466
2.5 2.2
a) b)
NOTE:
Total gaseous hydrocarbons expressed as CH4. Total aldehydes expressed as formaldehyde.
H2S not detectable in any sample.
133

~ 1
Inlet temp., OF
Outlet temp., OF
Plant B
Table €3-7 PROCESS DATA FOR FELT SATURATOR-ROLL ROOFING
175 175
1200 1200
Test No.
Felt
Felt Weighta
Felt Width, inches
Felt moisture, %
Felt speed, fpm
Felt rates, tons/hr
Saturant temp., OF
Softening point, OF
Saturant, tons/hr
Total process wt., tons/hr
Afterburner.Contro1 Device
1 & 2
27
36
7
251
1.27
450
130-150
1.90
3.17
3 & 4 (PPOM)
27
36
7
326
1.65
455
130-150
2.47
4.12
5 . & 6
27
36
7
340
1.72
448
130-150
2.58
4.3
Fuel rate 71 sal/hr of #2 fuel oil = 10.3 X lo6 BTUjhr
134
175
1150
I
i 11 I I I I I I t I B I I I I I 1 1 I i

I 1 I 1 I I I I 1 I 11 1 I 1 I 1 I 1
P l a n t B
Table B-8 PROCESS DATA FOR FELT SATURATOR-SHINGLE LINE
T e s t No.
F e l t
F e l t Weighta
F e l t Width, i n c h e s
F e l t moisture , %
F e l t speed, fpm
F e l t , tons /hr
Sa turant temp., OF
Sof t en ing p o i n t , OF
S a t u r a n t , t ons /h r
Tota l process w t . . t ons /h r
Af t e rbu rne r C o n t r o l Device
Fuel ra te
I n l e t temp., OF
O u t l e t temp., OF
a ) Pounds per 480 sq. f t .
9 & 1 0
51.5
48
6.5
277
5.35
440
130-150
8.83
14.18
11 & 12
51.5
48
6.5
317
6.12
445
130-150
10.10
16.22
1 3 & 1 4 (PPOM)
51.5
48
6.5
180
3.48
460
130-150
5.24
9.22
135

Table B-9 PROCESS DATA FOR ASPHALT BLOWING - PLANT B
Plant B
Location - Test No.
Still No.
Quantity of Asphalt, gallons
Charged 17,920 17,920 17,920
After Blowing
Still Temp. OF
Middle
Air Blowing Pressure, psig
Blowing Time, minutes
Product Asphalt
Melt Point, OF
450-490 450-480 450-490
9
291
247
9 9
254 45
223. 132
Afterburner
Fuel Rate rt2 oil gal/hr
Inlet Temp. O F
Outlet Temp. OF
53
300
1000
53 53
32 5 270
1000 1000
\
I I 1
136 I

1: a r r C L + C C ci
-
a m rl rl
+I d 0 U
E!
-
LI
4 2 a
m N r l
" 2 m W rn PI Eo
Io
4
0 m m
OD o m m N r l O m o w . o r l w
d P V I N r l N F - r l m . * m m . - 0 m o o . m . o * m ~ m r l 7 4 . . * w o . r l m r l m 0 0 0
0 * * o C O N * o m - P r l W r l r l 0 . w m N . d o *
m N d W m r l w * . m m . . o m o o . m . o w N w r l r l r l . . m w o . r l m r l m 0 0 0
m Eo P O D P
o ) c n r l * * m . m m m > N * ' O
w > " " ' "
m m m m r - N - ~ m m 4 r l m m . r l w 4 e - r m .
. r l m m m 0 m . . m E o m d m o o m
N 2 ,
P
* . w
m 4
o m m -
m P * P m
. * rl rl
m * m m
. P W r l r l o 0 0 0 d . .
0 0
0 rl
N
r l m o . m m m O P N * *. *
0 0
m o o m
I N l n r n r l m N c o . N N Iz
m r l w . 0 . O P P O . d
0
0 W N V I P r - P c P v ) N rl * m w *
w * m . . r ( r l m N m N . . m w o o m
k W m ' O - m m m N N
rl
0 -4 4J m E -4
rn H
4J d m
m P4
::
z
13 7

m
I I 1, I I I I
I
W d o N p l o l P 7 F * . O O C
r l l - m m o r l o r l o o o c \ . I n . . . r l . . I
o o c m m m c r w ~
m m - 4 W N
m r l m
PI w - m m o m m 0 0 0 - 4 * m . - r - m m m m o w o 0 . N . .
o r l o o . m * L . r l > m . m N w cr
m r l m
m m m m o m m m m w m m m w m r l r l d m N m O r l O . . . . . \ . w . N . r l 0 0 0 0 0 m w c ) r l m m r l
m rl
rl w v ) m w o l - N m r n - 4 w v ) m m .
\ * w . . - 0 1 n m r l r l o ~ m
m r l d
“ I I I “ I I I
138
* m m a
‘ E C O .-I 0
l- N
‘ X . m u

r \ ;I I I I 1 1 I 1 1 I 1 I I I I I: I
1 I I I
rl m r l w w o m r l w I- rl . m . m N \ m m w - - I - m w o m m
&S3& WOdd
N N m a .
N
m 0 rl
w m m m - m w w
w m m r - m o o - N . . w 4 0 0
m w
w w m w m m P 4 * N . r l w 0 \ w m o w m r ) m o N N w
rl
&sa& Wdd
rl . I - w w
O N r l * W N N N N . . r l N r l U N w r l
rl m c, 0 E4
I
139
ti 3: E -4
N m m
. N

.Table B-13. PPOM EMISSIONS ASPHALT BLOWING - PLANT B (net weight .in sample, micrograms)
~~
Compound
Benz ( c ) phenanthrene
7,12-Dimethylbenz(a)anthracene
Benz (a) pyrene + Benz (e) pyrene Dibenz (a,h)pyrene
Dibenz (a, i ) pyrene
140
~~ ~~
Test No. 15
Inlet
5/14/74
57.0
6.6
42.0
8.5
8.5
Test No. 16
Outlet
5/14/14
4.1
-- 1.3
2.1
2 .'1
'I 1 I I I I 1 1 I I I I I 1 I 1 1 1 I

I I I I 1 I I I I I I I 1 I I' 1 I I
I 1
Table B-14 GASEOUS EMISSION DATA - PLANT B Test Number
Saturator
1 Inlet 2 Outlet 3 Inlet 4 Outlet 5 Inlet 6 Outlet 9 Inlet
10 Outlet 11 Inlet 12 Outlet 13 Inlet 14 Outlet
Asphalt Blowing
7 Inlet 8 Outlet
15 Inlet 16 Outlet 17 Inlet 18 Outlet
co PPm
2.3 2.4 6.8 4.7
36 70 15
192 40
-
- -
179 1018
4 3 3 4
Gaseous HC PPm
i
800 300 970 240 180 360 310
340 330
- ,
- -
5900 410
5400 850
3090 1150
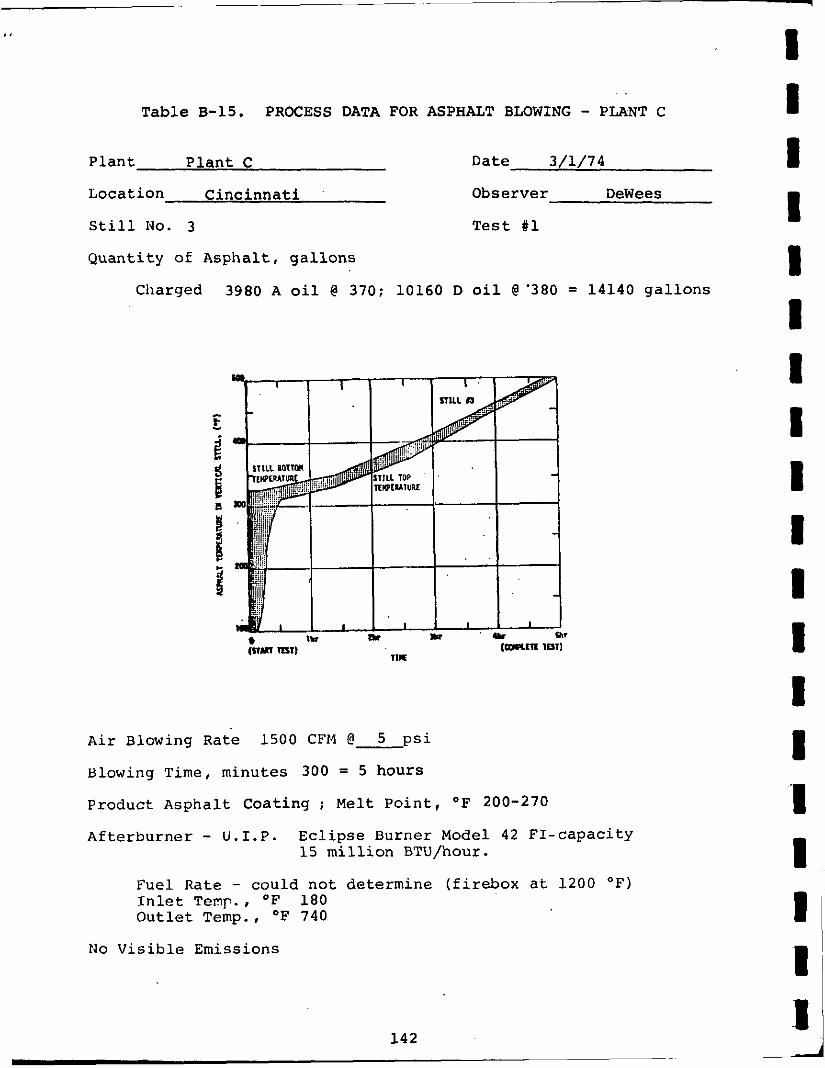
Table B-15. PROCESS DATA FOR ASPHALT BLOWING - PLANT C
P l a n t P l a n t C Date 3/1/74
Location C i n c i n n a t i Observer DeWees
S t i l l No. 3 T e s t #1
Q u a n t i t y of Aspha l t , g a l l o n s
Charged 3980 A o i l @ 370; 10160 D o i l @‘380 = 14140 g a l l o n s
A i r Blowing Rate
Blowing Time, m i n u t e s 300 = 5 hours
Product Asphal t Coat ing ; M e l t P o i n t , O F 200-270
Afte rburne r - U.I .P . E c l i p s e B u r n e r Model 42 FI -capac i ty
1500 CFM ( ? L p s i
15 m i l l i o n BTU/hour.
Fuel Rate - could n o t de te rmine ( f i r e b o x a t 1200 OF) I n l e t Temy., OF 180 O u t l e t Temp., OF 740
No V i s i b l e Emissions
1 4 2
7
I 1 I I 1 1 I I I I I I I I ‘I I 1 1 I

i 1 I 11 I I I I I I I I I I I I I ,I I
T a b l e B-15. ( c o n t i n u e d ) . PROCESS DATA FOR ASPHALT BLOWING - PLANT C
P l a n t P l a n t C Date 3/5/14
Location C i n c i n n a t i Observer DeWees
S t i l l No. 3 T e s t # 2
Q u a n t i t y of A s p h a l t , g a l l o n s
Charged 3980 A o i l @ 370; 10160 D o i l @ 380 = 14140 g a l l o n s
A i r B l o w i n g Rate 1500 CFM @ 5 p s i
Blowing T i m e , m i n u t e s 133 = 2 - 2 2 h o u r s
P r o d u c t A s p h a l t S a t u r a n t ; M e l t P o i n t , OF 130
A f t e r b u r n e r - U.I.P. Eclipse Burne r Model 4 2 F I - c a p a c i t y 15 m i l l i o n BTU/hour.
F u e l Rate - could n o t d e t e r m i n e ( f i r e b o x a t 1 2 0 0 O F )
Inlet Temp. , OF 160-240 O u t l e t Temp. , OF 660-700
No V i s i b l e E m i s s i o n s
1 4 3

Table B-15. (cont inued) . PROCESS DATA FOR ASPHALT BLOWING - PLANT C
P l a n t P l a n t C Date 3/6/74
Location C i n c i n n a t i Observer D e W e e s
S t i l l No. 4 , 3 T e s t #3
Q u a n t i t y of A s p h a l t , ga l lons
Charged 3980 A o i l and 10160 D o i l #4 ( fo r 40min.); 13500 A o i l #3 Average cha rge blown = 13,700 gal lons
A i r B l o w i n g Rate 1500 CFM @ 5 p s i
Blowing T i m e , m inu te s 127 = 2 . 1 hour s
P roduc t Aspha l t S a t u r a n t ; M e l t P o i n t , F 130
A f t e r b u r n e r - U.I.P. E c l i p s e Burner Model 4 2 FI -capac i ty 15 m i l l i o n BTU/hour.
Fue l R a t e - could n o t de t e rmine ( f i r e b o x a t 1200 O F )
I n l e t Temp., O F 225-180 O u t l e t Temp. , OF 705
No V i s i b l e E m i s s i o n s
1 4 4

i i I I I I I I 1 I I I I I I I I I I L
Table B-15. (cont inued) . PROCESS DATA FOR ASPHALT BLOWING - PLANT C
P l a n t P l a n t C Date 4/5/74
Location C i n c i n n a t i Observer DeWees
S t i l l NO. 3 T e s t # 4
Q u a n t i t y of A s p h a l t , ga l lons
Charged 3980 A o i l @ 370; 10160 D o i l @ 380 = 14140 ga l lons
' %
A i r Blowing Rate 1500 CFM I? 5 p s i
Blowing T i m e , minu te s 135 = 2 . 2 5 hours
p i o d u c t Aspha l t Coating ; M e l t P o i n t , OF 200-270
A f t e r b u r n e r - U . I . P . E c l i p s e Burne r Model 42 F I - c a p a c i t y 1 5 m i l l i o n BTU/hour.
Fue l Rate - cou ld n o t de t e rmine ( f i r e b o x a t 1200 OF) I n l e t Teny., OF 170 O u t l e t Temp., OF 550
No V i s i b l e E m i s s i o n s
145
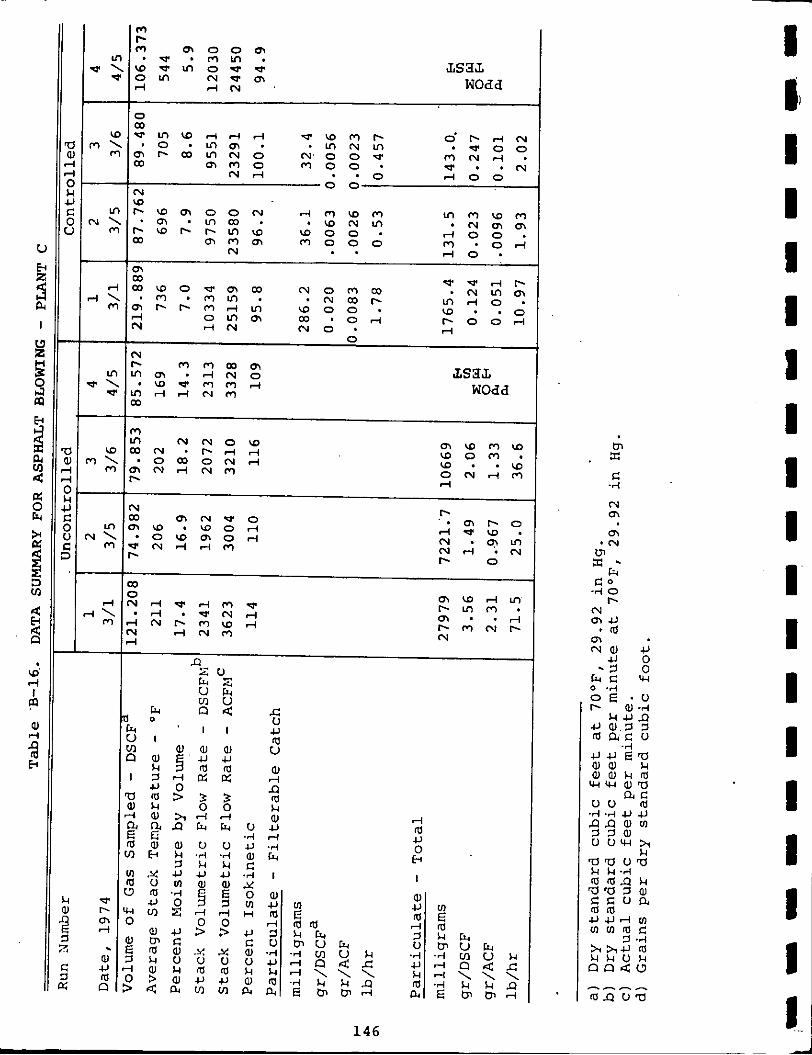
I d d N
&S3& WOdd
I S O N d
0 0 I N
I 4 0 . N . .
r.
.-i
a, u
m
. m a
m m w m u w o m I
w . . c O N r l V rl
N m m ~ w o m w . w o r l * o w m o r l
- m r l r l m r.
d m u 0
E i
I
146

I I I I I I I 1 1 I I I I I I I I I 1
Table B-17- PPOM EMISSIONS ASPHALT BLOWING - PLANT C (net weight in sample, micrograms)
Compound Benz(c)’phenanthrene
7,12-Dimethylbenz (a) anthracene
Benz (e) pyrene
Benz (a) pyrene
3-Methylchol- anthrene
Dibenz (a,h)pyrene
Dibenz (a, i) pyrene
Test 4 Inlet 4/5/74
18
11
0 . 4
1.0
147
Test 4 Outlet 4/5/74
0.3 ’
8.5
3.1
1.2
0.865
0.07
0.07

T e s t Number
1 I n l e t
1 O u t l e t
2 I n l e t
2 O u t l e t
3 I n l e t
3 O u t l e t
4 I n l e t
4 O u t l e t
Table B-18. GASEOUS EMISSION DATA - PLANT C
co PPm
358, 416
497
416, 428
416, 8933
532, 7669
3351, 9106
210
1436
Gaseous HCa ppm
6733
656
a ) E x p r e s s e d as me thane b) Expressed as fo rma ldehyde
148
b Aldehydes PPm
~~
0.6, 14.2
3.65, 15.1
c0.02
0.7, 0.3
c0.02
0.1
-
I I I I I 1 I I I1 I II I~ I I I I I I I

I I I I I I I I I I I I I I I I I I 1 -
, REPORT N 2. E PA-BfBO/2-74-101
TECHNICAL REPORT DATA
3. RECIPIENT'S ACCESSIOWNO.
I
. T I T L E A N D SUSTITLE
Atmospheric Emissions from Asphalt Roofing Processes
6. REPORT D A T E
October 1974 6. PERFORMING ORGANIZATION CODE
.AUTHOR181
R.W. Gerstle 8. PERFORMING ORGANIZATION REPORT N O
DNTRACTIGRANT NO. "'-""'7 (Task 30) and
.PERFORMING O R ~ A N I Z A T I O N NAME AND ADDRESS
PEDCo-Environmental, Inc. Atkinson Square (Suite 13) Cincinnati, Ohio 45246 .- - ~~
13.TYPE O F Final; lfF'J$flTRIoD 2. SPONSOAING AOENCY N A M E A N D ADDRESS
14. SPONSORING AGENCY CODE EPA, Office of Research and Development NERC-RTP, Control Systems Laboratory Research Triangle Park, NC 27711
10. PROGRAM ELEMENT NO.
lAB015; ROAP 2WZM-011 m 68-ua-wav
68-02-1321 ITiWk 15)
b. ABSTRACT Asphalt roofing manufacturing processes and the types of a i r pollution control devices applied t o them are described. controlled and uncontrolled particulate and gaseous emissions, including polycyclic compounds, from the asphalt blowing and f e l t s a t u r a t i n g processes are provided. rates, and industry growth i s included. Total uncontrolled particulate emissions from f e l t saturating, consisting largely of organic par t ic- ulate compounds, averaged from 3.9 to 8.7 lb per ton of saturated f e l t ; CO and gaseous hydrocarbons were also emitted. Control devices reduced these emissions by about 50%. compounds accounted for 0.0003% o f the particulate matter b o t h before and after control. For asphalt blowing operations controlled by fume incineration, par- ticulate emtssions amounted t o 0.3 t o 3.1 lb per 1000 gal. (0.075 t o 0.79 lb per ton ) of asphalt; polycyclic organic matter ranged between 0.0008 and 0.0019% of the total particulate; CO and gaseous hydrocarbons are also emitted. equipped w i t h available control devices does not have a major impact on
Quantitative da ta on
Information on p l a n t locations, production
Seven identified polycyclic organic
Particulate matter was mostly smaller than 1 micron.
These d a t a indicate t h a t a well-operated plant
DESCRIPTORS
4ir Pollution Gases uphalt Plants Xoofing ?olycyclic Compounds :arbon Monoxide Iydrocarbons , OlSTRl8UTlON STATEMENT
Jnlimited
ambient a i r concentrations.
b.lDENTIFIERS1OPEN E N D E D TERMS C. COSATI Fk.ld/Croup
Air Pollution Control 13B, 07D Stationary Sources 13H Polycyclic Organic Mat- 13C
ter 07C Particulates 07B Felt Saturation 19. SECURITY CLASS [ThIsRcport)
20. SECURITY CLASS ( T h i s w e )
21. NO. OF PAGES Unclassified 159
22. PRICE
Unclassified
K E Y WORDS A N 0 DOCUMENT ANALYSIS
1