Embed Size (px)
Citation preview
Strive • Lead • Excel | To Make a Difference
Report of the Auditor-General No. 8 of 2016-17Auditor-General’s Report on the Financial Statements of State Entities
Volume 3
Local Government Authorities and Tasmanian Water and Sewerage Corporation Pty Ltd 2015-16
December 2016
CONTENTS
INTRODUCTION 3
SIGNIFICANT FINANCIAL REPORTING MATTERS 5
FINANCIAL ANALYSIS 7
FINANCIAL SUSTAINABILITY 8
OPERATIONAL EFFICIENCY 9
AUDIT SUMMARY – OTHER LOCAL GOVERNMENT ENTITIES 10
2 Auditor-General’s Report, Volume 3 - Local Government Authorities and TasWater 2015-16 - Summary Report
INTRODUCTIONThis Report contains the results of our audits of financial reports of entities in the local government sector, comprising the 29 councils, TasWater and seven other local government entities with a 30 June 2016 year end.
Councils were created under the Local Government Act 1993 (LGA) and provided governance, planning, service delivery, community development, asset management and local regulation to their regional areas. Councils determined service provision according to local needs and requirements of State legislation, and in some cases, established subsidiary or other entities as required to assist them achieve their objectives.
Councils vary widely in their size and location and in the broad range of community services they supply. For comparison purposes in this Report, we group them based on the Australian Classification of Local Government compressed into the five classifications used by Department of Premier and Cabinet’s Local Government Division (LGD). This classification was based upon a national standard and is updated periodically for changes in population and other determining factors. The classification groups were:
• Urban medium, with populations between 30 000 – 70 000• Urban small, with populations of up to 30 000• Rural agricultural, very large, with populations between 10 000 – 20 000 at a density of
<30 per square kilometre• Rural agricultural, large, with populations between 5 000 – 10 000 at a density of <30
per square kilometre• Rural agricultural, small and medium, with populations of up to 5 000 at a density of
<30 per square kilometre.
CONCLUSION The audits of all 29 councils and other entites included in this report were completed satisfactorily and unqualified audit reports were issued in all cases.
Emphasis of matter
Our audit opinion for TasWater included an ‘emphasis of matter’ paragraph that drew attention to Note 9 in TasWater’s financial report. This note stated that the adopted valuation technique used to measure the fair value of infrastructure assets had not been applied consistently since the initial valuation on 1 July 2013, being the date TasWater commenced trading.
We include an emphasis of matter paragraph to highlight matters presented or disclosed in the financial report that we believe are important to bring to the users’ attention, so as to assist with their understanding of the financial report. Including an emphasis of matter does not modify our audit opinion.
Other matter
In its 2015-16 financial report, West Coast Council failed to comply with section 84(2)(da) of the LGA and did not disclose an activity, overnight recreational vehicle parking and camping services, as SBA. The disclosure was not made on the basis that Council disagreed with the findings of the Regulator and disputed that it provided any services at all.
We included an ‘other matter’ paragraph to highlight the non-disclosure as we believed it was important to inform the users of the financial report. Including an ‘other matter’ paragraph does not modify our audit opinion.
Key recommendations included matters that:• posed a significant business or financial risk to council• could potentially have resulted in a modified audit opinion if not addressed as a matter
of urgency
3Auditor-General’s Report, Volume 3 - Local Government Authorities and TasWater 2015-16 - Summary Report
• were of a systemic nature that posed a moderate business or financial risk if not addressed as high priority within the current financial year
• may have escalated to high risk if not addressed promptly• were low risk matters which had been reported to management in the past but had not
been satisfactorily resolved or addressed.
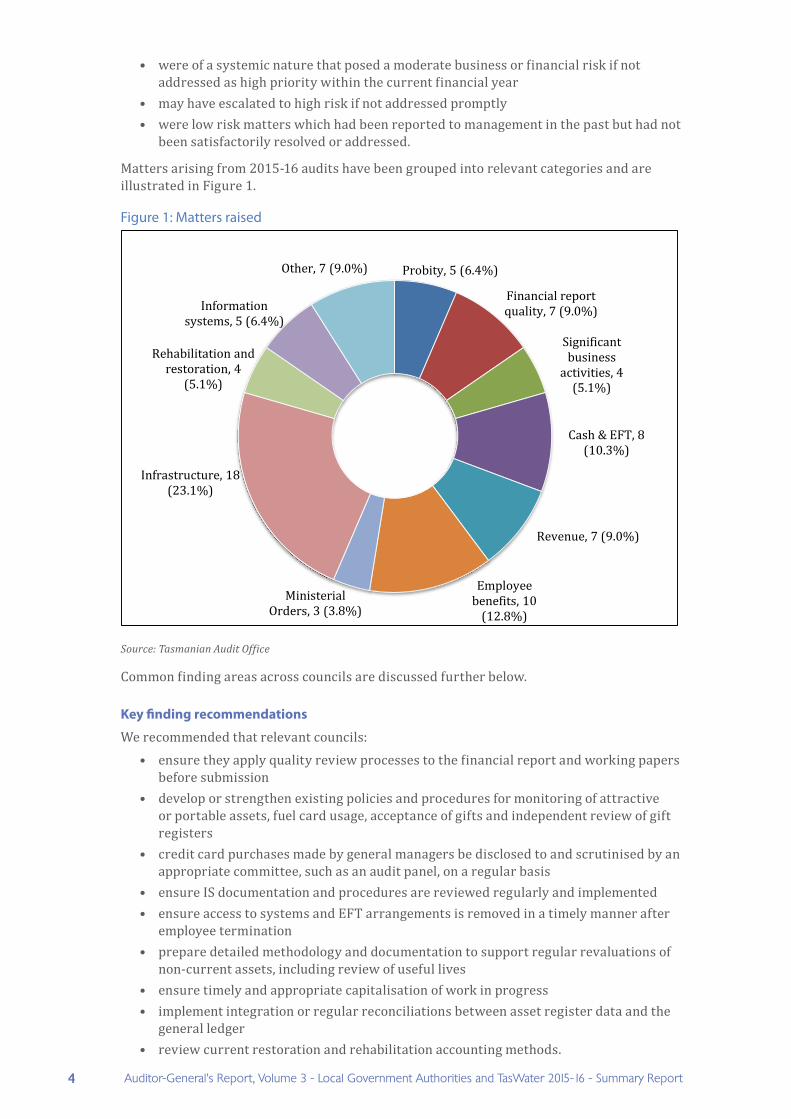
Matters arising from 2015-16 audits have been grouped into relevant categories and are illustrated in Figure 1.
Figure 1: Matters raised
Probity, 5 (6.4%)
Financial report quality, 7 (9.0%)
Significant business
activities, 4 (5.1%)
Cash & EFT, 8 (10.3%)
Revenue, 7 (9.0%)
Employee benefits, 10
(12.8%)Ministerial
Orders, 3 (3.8%)
Infrastructure, 18 (23.1%)
Rehabilitation and restoration, 4
(5.1%)
Information systems, 5 (6.4%)
Other, 7 (9.0%)
Source: Tasmanian Audit Office
Common finding areas across councils are discussed further below.
Key finding recommendations
We recommended that relevant councils:• ensure they apply quality review processes to the financial report and working papers
before submission• develop or strengthen existing policies and procedures for monitoring of attractive
or portable assets, fuel card usage, acceptance of gifts and independent review of gift registers
• credit card purchases made by general managers be disclosed to and scrutinised by an appropriate committee, such as an audit panel, on a regular basis
• ensure IS documentation and procedures are reviewed regularly and implemented• ensure access to systems and EFT arrangements is removed in a timely manner after
employee termination• prepare detailed methodology and documentation to support regular revaluations of
non-current assets, including review of useful lives • ensure timely and appropriate capitalisation of work in progress• implement integration or regular reconciliations between asset register data and the
general ledger• review current restoration and rehabilitation accounting methods.
4 Auditor-General’s Report, Volume 3 - Local Government Authorities and TasWater 2015-16 - Summary Report
SIGNIFICANT FINANCIAL REPORTING MATTERS Local government entities are required to prepare annual reports, with financial reports complying with AAS, other authoritative pronouncements of the AASB, and the LGA. This Chapter highlights the common or significant matters across the sector.
KEY RESULTS AND DEVELOPMENTS
Ministerial Orders
Twenty-six councils fully complied with the three Orders gazetted on 19 February 2014, with the remaining three at least partially complying with all three Orders.
All councils had established audit panels with independent members in accordance with the Local Government (Audit Panels) Amendment Order 2015.
Infrastructure Financial Accounting
At 30 June 2016, there were 32 instances where councils had not adopted the 22 recommendations made in our Report No. 5 of 2013-14, Infrastructure Financial Accounting in Local Government (the Infrastructure Report), compared with 50 at 30 June 2015.
Land Under Roads
At 30 June 2016, 25 councils had adopted our recommendation by recognising all land under roads regardless of when acquired.Two councils had only recognised land under roads acquired post 1 July 2008 and two councils had not recognised any land under roads regardless of when acquired. Four councils recognised land under roads in any form for the first time in 2015-16.A further seven councils that had previously recognised land under roads post 1 July 2008, recognised land under roads acquired before 1 July 2008 for the first time during 2015-16.Land under roads recognised by council’s totalled $1.29bn.Twenty-two (out of 27) councils valued land under roads, on an individual road basis, with the rate provided by the Office of the Valuer-General (OVG) for the relevant property class where the road is located.Significant Business Activities
Eighteen councils disclosed one or more SBAs.
The Tasmanian Economic Regulator (the Regulator) determined that free recreational vehicle (RV) parking at Queenstown and Rosebery was an SBA of West Coast Council. Council did not include required information in the 2015-16 financial report and an ‘other matter’ paragraph was included within our audit opinion as a result.
Eleven councils determined that they did not have any SBAs to report.
Remuneration Disclosures
Four councils fully adopted our model disclosure by disclosing individual key management personnel remuneration.Three councils disclosed the total dollar amount of the General Manager’s remuneration. Eight councils, including one of those above, disclosed the aggregate remuneration of all key management personnel remuneration, but not by individual employee.One council separately identified the remuneration paid to the General Manager in the annual report.TasWater disclosed Director and Senior Executive Remuneration in the notes to its financial report in accordance with Australian Accounting Standard AASB 124 Related Party Disclosures. The Directors’ report attached to the financial report disclosed the dollar value of individual remuneration classified into short-term and post-employment benefits.
5Auditor-General’s Report, Volume 3 - Local Government Authorities and TasWater 2015-16 - Summary Report
Related party disclosures
Applies to annual reporting periods beginning on or after 1 July 2016.
Removes the exemption from AASB 124 for not-for-profit public sector entities.The requirements apply prospectively, with comparative information not required in the first period of application.The principle underpinning AASB 124 is that transactions with related parties should be disclosed and key management personnel (KMP) are related parties.Requires disclosure of related party relationships, transactions and outstanding balances, including commitments.Prescribes specific and general disclosures for related party relationships, related party transactions and resulting balances.Includes transactions with close family members of KMP.
Related party transactions occurring during the course of delivering a public sector entity’s objectives, which occur on the same terms as those provided to the general public, may be considered by the entity as not material for the purposes of disclosure in the financial statements. These are sometimes termed ordinary citizen transactions.Due to the significance of these new requirements councils will need to prioritise identification of related parties and establishment of systems to capture transactions in order to comply with the requirements of AASB 124.
RECOMMENDATIONSWe continued to make a number of recommendations from matters discussed in this Chapter.
Ministerial Orders
We recommend that those councils who had not yet adopted long-term financial and asset management plans and strategies prioritise completion.
Infrastructure assets
We recommend that councils continue to review infrastructure financial accounting practices, and those that have not yet adopted the recommendations from our Infrastructure Report, do so.
Land under roads
We recommend that:• those councils yet to recognise all land under roads do so• the five councils currently not valuing on an individual road reservation basis using
rates provided by the OVG, consider the adoption of this method of valuation, so as to ensure consistency across local government.
Significant Business Activities
We continue to recommend that councils revisit the applicable SBA reporting requirements under Section 84(2)(da) of the LGA as new business activities commence and during the preparation of their annual financial reports, and that these assessments be documented.
Remuneration disclosures
We continue to recommend that all local government entities consider disclosure of specific information relating to remuneration of each member of KMP consistent with the illustrative example provided by the office for Local Government Financial Statements for 30 June 2016. The illustrative example followed disclosure requirements for Government businesses and departments.
6 Auditor-General’s Report, Volume 3 - Local Government Authorities and TasWater 2015-16 - Summary Report
Related party disclosures
We recommend that councils prioritise identification of related parties and establishment of systems to capture transactions in order to comply with the requirements of AASB 124.
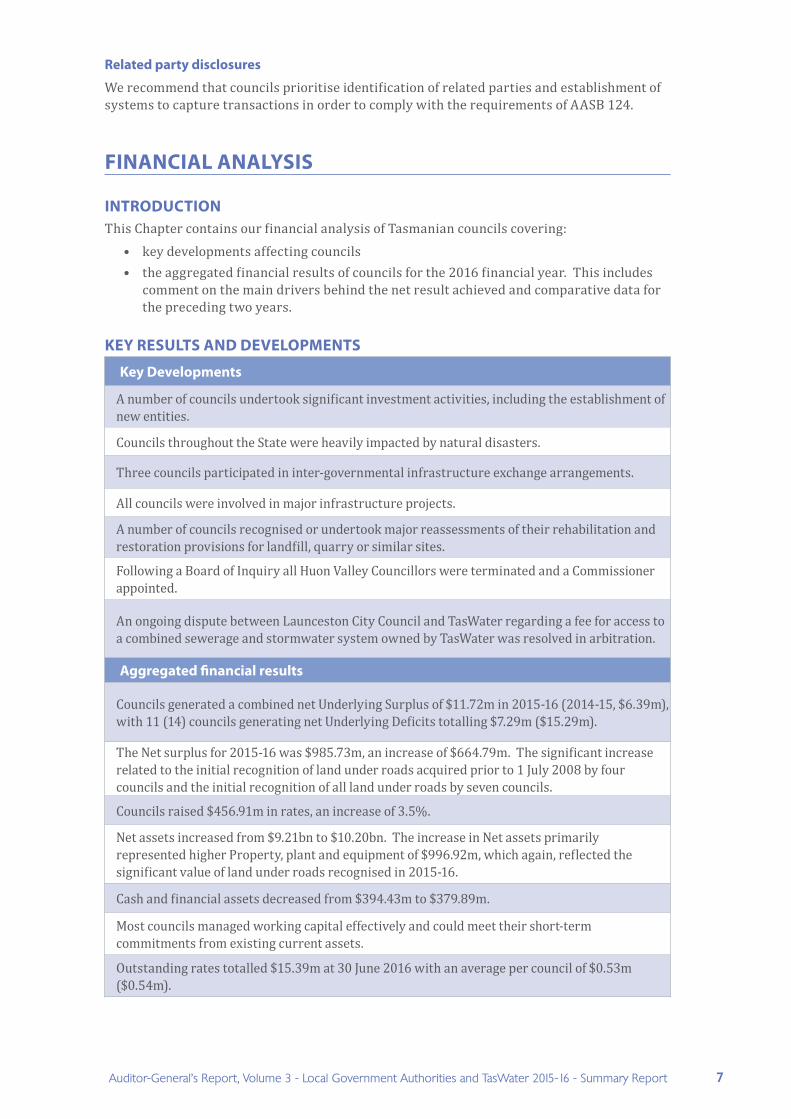
FINANCIAL ANALYSIS
INTRODUCTIONThis Chapter contains our financial analysis of Tasmanian councils covering:
• key developments affecting councils• the aggregated financial results of councils for the 2016 financial year. This includes
comment on the main drivers behind the net result achieved and comparative data for the preceding two years.
KEY RESULTS AND DEVELOPMENTS
Key Developments
A number of councils undertook significant investment activities, including the establishment of new entities.
Councils throughout the State were heavily impacted by natural disasters.
Three councils participated in inter-governmental infrastructure exchange arrangements.
All councils were involved in major infrastructure projects.
A number of councils recognised or undertook major reassessments of their rehabilitation and restoration provisions for landfill, quarry or similar sites.
Following a Board of Inquiry all Huon Valley Councillors were terminated and a Commissioner appointed.
An ongoing dispute between Launceston City Council and TasWater regarding a fee for access to a combined sewerage and stormwater system owned by TasWater was resolved in arbitration.
Aggregated financial results
Councils generated a combined net Underlying Surplus of $11.72m in 2015-16 (2014-15, $6.39m), with 11 (14) councils generating net Underlying Deficits totalling $7.29m ($15.29m).
The Net surplus for 2015-16 was $985.73m, an increase of $664.79m. The significant increase related to the initial recognition of land under roads acquired prior to 1 July 2008 by four councils and the initial recognition of all land under roads by seven councils.
Councils raised $456.91m in rates, an increase of 3.5%.
Net assets increased from $9.21bn to $10.20bn. The increase in Net assets primarily represented higher Property, plant and equipment of $996.92m, which again, reflected the significant value of land under roads recognised in 2015-16.
Cash and financial assets decreased from $394.43m to $379.89m.
Most councils managed working capital effectively and could meet their short-term commitments from existing current assets.
Outstanding rates totalled $15.39m at 30 June 2016 with an average per council of $0.53m ($0.54m).
7Auditor-General’s Report, Volume 3 - Local Government Authorities and TasWater 2015-16 - Summary Report
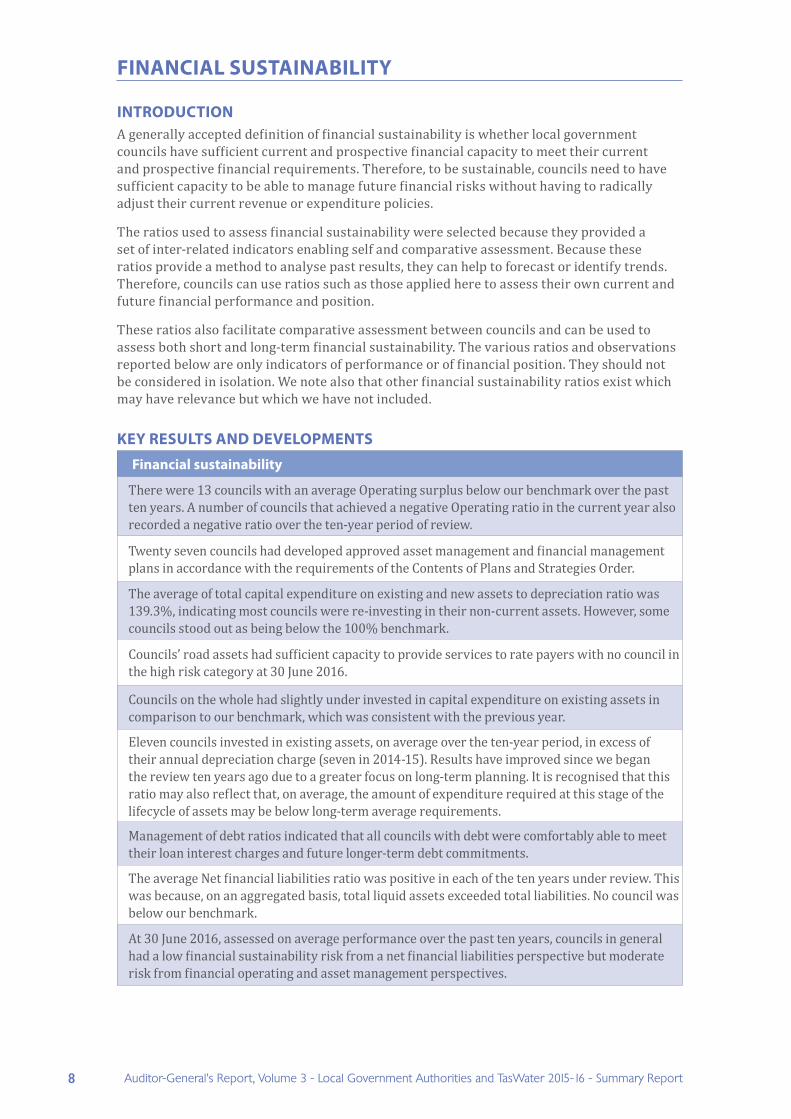
FINANCIAL SUSTAINABILITY
INTRODUCTIONA generally accepted definition of financial sustainability is whether local government councils have sufficient current and prospective financial capacity to meet their current and prospective financial requirements. Therefore, to be sustainable, councils need to have sufficient capacity to be able to manage future financial risks without having to radically adjust their current revenue or expenditure policies.
The ratios used to assess financial sustainability were selected because they provided a set of inter-related indicators enabling self and comparative assessment. Because these ratios provide a method to analyse past results, they can help to forecast or identify trends. Therefore, councils can use ratios such as those applied here to assess their own current and future financial performance and position.
These ratios also facilitate comparative assessment between councils and can be used to assess both short and long-term financial sustainability. The various ratios and observations reported below are only indicators of performance or of financial position. They should not be considered in isolation. We note also that other financial sustainability ratios exist which may have relevance but which we have not included.
KEY RESULTS AND DEVELOPMENTS
Financial sustainability
There were 13 councils with an average Operating surplus below our benchmark over the past ten years. A number of councils that achieved a negative Operating ratio in the current year also recorded a negative ratio over the ten-year period of review.
Twenty seven councils had developed approved asset management and financial management plans in accordance with the requirements of the Contents of Plans and Strategies Order.
The average of total capital expenditure on existing and new assets to depreciation ratio was 139.3%, indicating most councils were re-investing in their non-current assets. However, some councils stood out as being below the 100% benchmark.
Councils’ road assets had sufficient capacity to provide services to rate payers with no council in the high risk category at 30 June 2016.
Councils on the whole had slightly under invested in capital expenditure on existing assets in comparison to our benchmark, which was consistent with the previous year.
Eleven councils invested in existing assets, on average over the ten-year period, in excess of their annual depreciation charge (seven in 2014-15). Results have improved since we began the review ten years ago due to a greater focus on long-term planning. It is recognised that this ratio may also reflect that, on average, the amount of expenditure required at this stage of the lifecycle of assets may be below long-term average requirements.
Management of debt ratios indicated that all councils with debt were comfortably able to meet their loan interest charges and future longer-term debt commitments.
The average Net financial liabilities ratio was positive in each of the ten years under review. This was because, on an aggregated basis, total liquid assets exceeded total liabilities. No council was below our benchmark.
At 30 June 2016, assessed on average performance over the past ten years, councils in general had a low financial sustainability risk from a net financial liabilities perspective but moderate risk from financial operating and asset management perspectives.
8 Auditor-General’s Report, Volume 3 - Local Government Authorities and TasWater 2015-16 - Summary Report
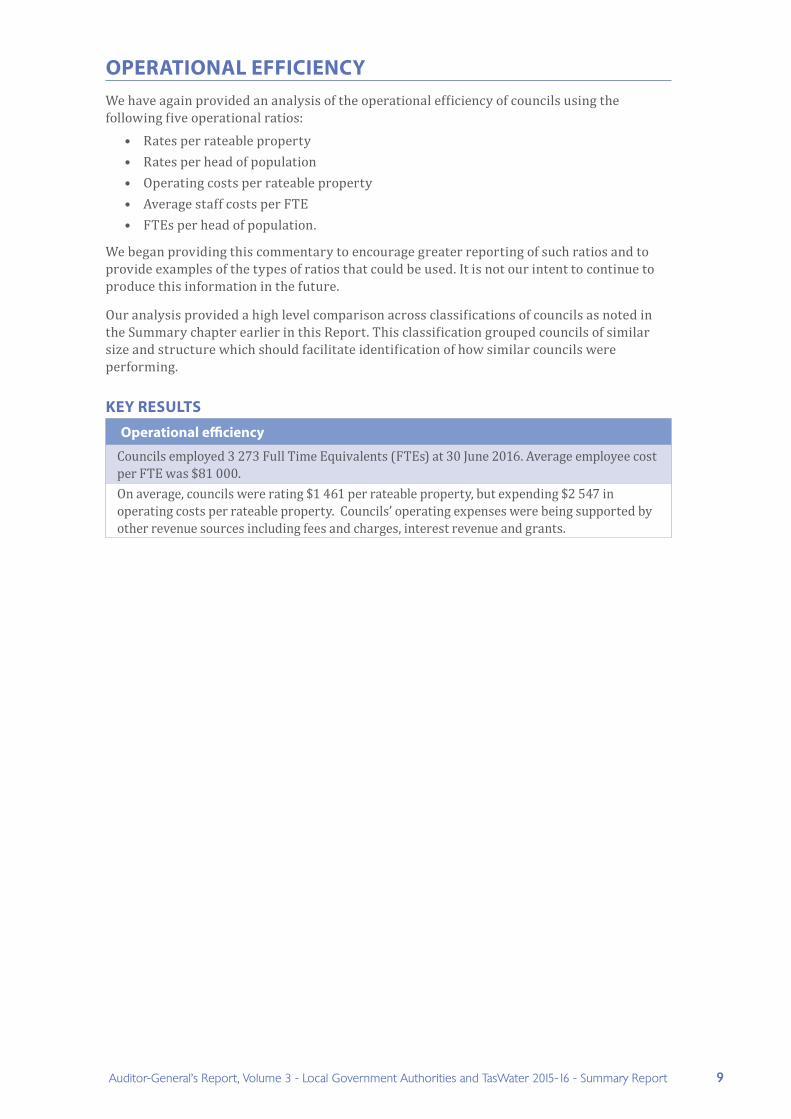
OPERATIONAL EFFICIENCY We have again provided an analysis of the operational efficiency of councils using the following five operational ratios:
• Rates per rateable property • Rates per head of population • Operating costs per rateable property • Average staff costs per FTE • FTEs per head of population.
We began providing this commentary to encourage greater reporting of such ratios and to provide examples of the types of ratios that could be used. It is not our intent to continue to produce this information in the future.
Our analysis provided a high level comparison across classifications of councils as noted in the Summary chapter earlier in this Report. This classification grouped councils of similar size and structure which should facilitate identification of how similar councils were performing.
KEY RESULTS
Operational efficiency
Councils employed 3 273 Full Time Equivalents (FTEs) at 30 June 2016. Average employee cost per FTE was $81 000.On average, councils were rating $1 461 per rateable property, but expending $2 547 in operating costs per rateable property. Councils’ operating expenses were being supported by other revenue sources including fees and charges, interest revenue and grants.
9Auditor-General’s Report, Volume 3 - Local Government Authorities and TasWater 2015-16 - Summary Report
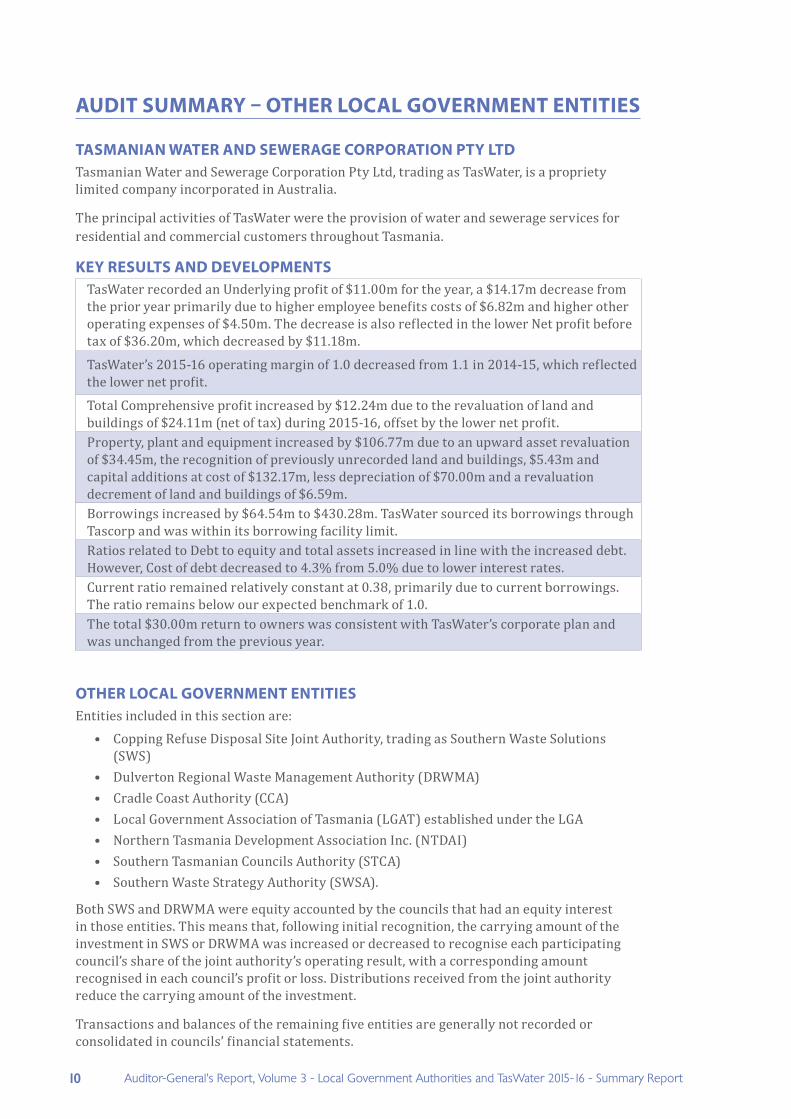
AUDIT SUMMARY – OTHER LOCAL GOVERNMENT ENTITIES
TASMANIAN WATER AND SEWERAGE CORPORATION PTY LTDTasmanian Water and Sewerage Corporation Pty Ltd, trading as TasWater, is a propriety limited company incorporated in Australia.
The principal activities of TasWater were the provision of water and sewerage services for residential and commercial customers throughout Tasmania.
KEY RESULTS AND DEVELOPMENTSTasWater recorded an Underlying profit of $11.00m for the year, a $14.17m decrease from the prior year primarily due to higher employee benefits costs of $6.82m and higher other operating expenses of $4.50m. The decrease is also reflected in the lower Net profit before tax of $36.20m, which decreased by $11.18m.
TasWater’s 2015-16 operating margin of 1.0 decreased from 1.1 in 2014-15, which reflected the lower net profit.
Total Comprehensive profit increased by $12.24m due to the revaluation of land and buildings of $24.11m (net of tax) during 2015-16, offset by the lower net profit.Property, plant and equipment increased by $106.77m due to an upward asset revaluation of $34.45m, the recognition of previously unrecorded land and buildings, $5.43m and capital additions at cost of $132.17m, less depreciation of $70.00m and a revaluation decrement of land and buildings of $6.59m.Borrowings increased by $64.54m to $430.28m. TasWater sourced its borrowings through Tascorp and was within its borrowing facility limit.Ratios related to Debt to equity and total assets increased in line with the increased debt. However, Cost of debt decreased to 4.3% from 5.0% due to lower interest rates.Current ratio remained relatively constant at 0.38, primarily due to current borrowings. The ratio remains below our expected benchmark of 1.0. The total $30.00m return to owners was consistent with TasWater’s corporate plan and was unchanged from the previous year.
OTHER LOCAL GOVERNMENT ENTITIESEntities included in this section are:
• Copping Refuse Disposal Site Joint Authority, trading as Southern Waste Solutions (SWS)
• Dulverton Regional Waste Management Authority (DRWMA)• Cradle Coast Authority (CCA)• Local Government Association of Tasmania (LGAT) established under the LGA• Northern Tasmania Development Association Inc. (NTDAI)• Southern Tasmanian Councils Authority (STCA)• Southern Waste Strategy Authority (SWSA).
Both SWS and DRWMA were equity accounted by the councils that had an equity interest in those entities. This means that, following initial recognition, the carrying amount of the investment in SWS or DRWMA was increased or decreased to recognise each participating council’s share of the joint authority’s operating result, with a corresponding amount recognised in each council’s profit or loss. Distributions received from the joint authority reduce the carrying amount of the investment.
Transactions and balances of the remaining five entities are generally not recorded or consolidated in councils’ financial statements.
10 Auditor-General’s Report, Volume 3 - Local Government Authorities and TasWater 2015-16 - Summary Report
Key results and developments
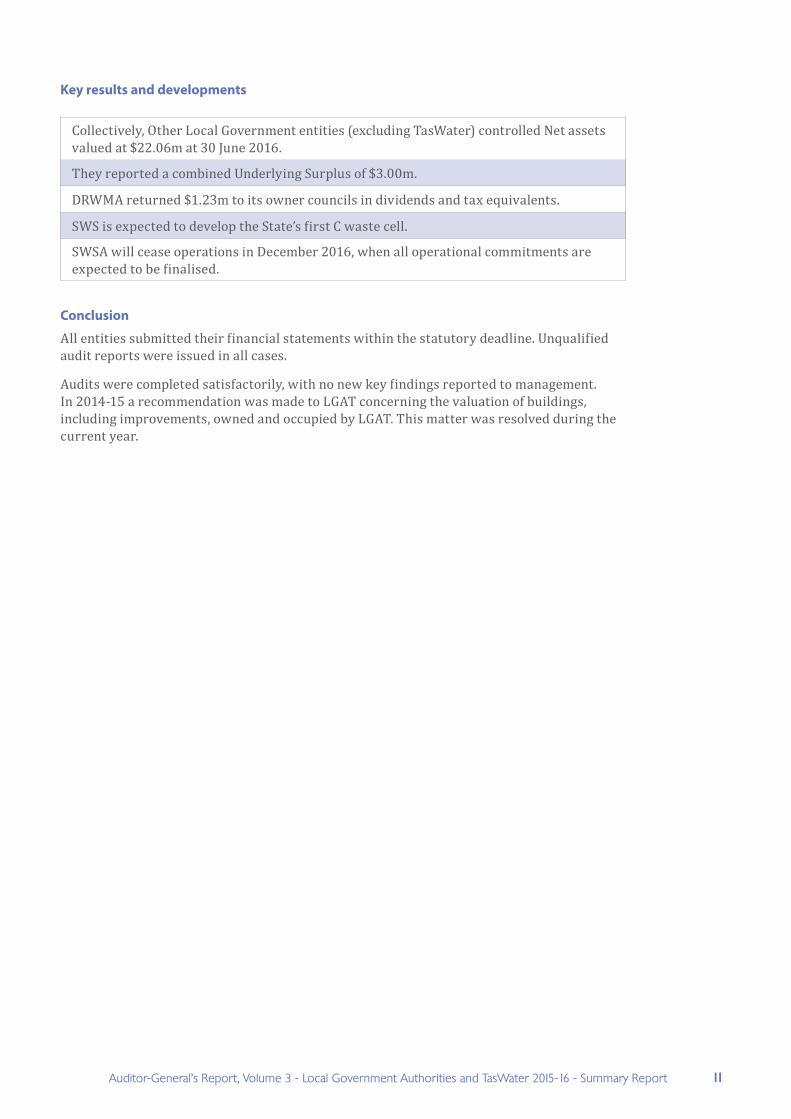
Collectively, Other Local Government entities (excluding TasWater) controlled Net assets valued at $22.06m at 30 June 2016.
They reported a combined Underlying Surplus of $3.00m.
DRWMA returned $1.23m to its owner councils in dividends and tax equivalents.
SWS is expected to develop the State’s first C waste cell.
SWSA will cease operations in December 2016, when all operational commitments are expected to be finalised.
Conclusion
All entities submitted their financial statements within the statutory deadline. Unqualified audit reports were issued in all cases.
Audits were completed satisfactorily, with no new key findings reported to management. In 2014-15 a recommendation was made to LGAT concerning the valuation of buildings, including improvements, owned and occupied by LGAT. This matter was resolved during the current year.
11Auditor-General’s Report, Volume 3 - Local Government Authorities and TasWater 2015-16 - Summary Report
Phone (03) 6173 0900 Fax (03) 6173 0999 Email [email protected] Web www.audit.tas.gov.au
Address Level 8, 144 Macquarie Street, Hobart Level 2, Henty House, 1 Civic Square, Launceston Postal Address GPO Box 851, Hobart 7001 Office Hours 9am to 5pm Monday to Friday
For the full report go to: http://www.audit.tas.gov.au/publications


![VOL. CCCXXXII OVER THE COUNTER SALES ... - Government …...GAZETTE TASMANIAN OVER THE COUNTER SALES $3.40 INCLUDING G.S.T. [287] ... 288 TASMANIAN GOVERNMENT GAZETTE 8 MAY 2019 MARY](https://img.pdfslide.net/doc/110x75/6047ed633ef68a6c630ba273/vol-cccxxxii-over-the-counter-sales-government-gazette-tasmanian-over.jpg)