Embed Size (px)
Citation preview

No content below the
line
No content below the
line
No content below the
line
No content below the
line
2
•
•
•
•

No content below the
line
No content below the
line

No content below the
line
No content below the
line
4
0
10
20
30
40
50
60
70
80
90
100
1990
1991
1992
1993
1994
1995
1996
1997
1998
1999
2000
2001
2002
2003
2004
2005
2006
2007
2008
2009
2010
2011
2012
2013
2014
2015
2016
VIX
S&P 500 1M Trailing Volatility

No content below the
line
No content below the
line
5
“…. as we know, there are known knowns; there are things we know we know. We
also know there are known unknowns; that is to say we know there are some
things we do not know. But there are also unknown unknowns – the ones we don’t
know we don’t know.”
- Donald Rumsfeld
Current Volatility
Environment
Historical Volatility Patterns
Expected News Flow
Unexpected News flow
“Tail Event” Intensity
Hist. Implied / Realized Premium
Current Dealer Inventories of
SPX vol
Other market positioning /
noise

No content below the
line
No content below the
line
6
•
•
•
•
•

No content below the
line
No content below the
line
7
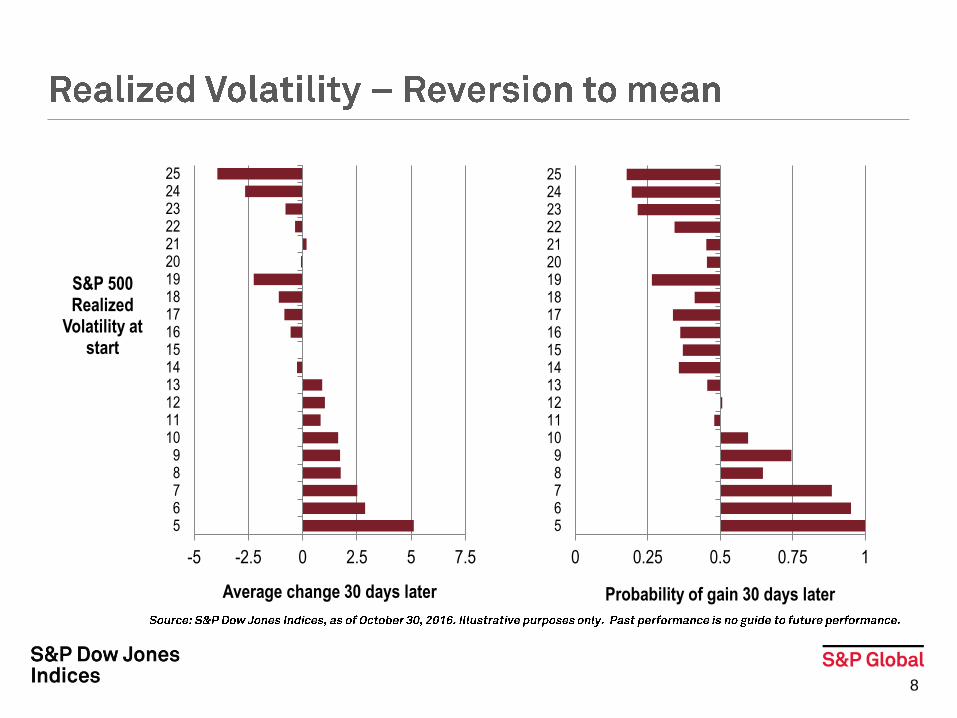
•
No content below the
line
No content below the
line
8
-5 -2.5 0 2.5 5 7.5
56789
10111213141516171819202122232425
Average change 30 days later
S&P 500 Realized
Volatility at start
0 0.25 0.5 0.75 1
56789
10111213141516171819202122232425
Probability of gain 30 days later

No content below the
line
No content below the
line
9
R² = 0.9941
5
10
15
20
25
30
35
40
5 15 25 35 45 55
Vo
lati
lity,
1M
Su
bse
qu
en
t
Current Volatility by Percentile Band (5% intervals)

No content below the
line
No content below the
line
10
0%
20%
40%
60%
80%
100%
120%
1896
1899
1902
1906
1909
1912
1915
1919
1922
1925
1928
1931
1934
1938
1941
1944
1947
1950
1953
1957
1960
1963
1966
1969
1972
1975
1979
1982
1985
1988
1991
1994
1997
2001
2004
2007
2010
2013

No content below the
line
No content below the
line
11
0%
10%
20%
30%
40%
50%
60%
0% 10% 20% 30% 40% 50% 60% 70%
Rea
lized
Vo
l, 21
Day
s L
ater
Realized Vol, Current
1966 to 2016
1916 to 1966
•

No content below the
line
No content below the
line
12
•
•
•

No content below the
line
No content below the
line
13
0
10
20
30
40
50
60
70
80
90
100
199
1
199
2
199
3
199
4
199
5
199
6
199
7
199
8
199
9
200
0
200
1
200
2
200
3
200
4
200
5
200
6
200
7
200
8
200
9
201
0
201
1
201
2
201
3
201
4
201
5
201
6
VIX
S&P 500 1M Trailing Volatility
VIX, 1 Yr Trailing
S&P 500 1M Realized Vol, 1Yr Trailing
Difference

No content below the
line
No content below the
line
14
•
•

No content below the
line
No content below the
line
R² = 0.91 (excluding outlier)
0
50
100
150
200
250
300
350
400
0 200 400 600 800
Av
era
ge
P2
Realized Volatility2
15
•
𝑷𝟐= 𝑽𝑰𝑿𝟐 − 𝑹𝒁𝒎𝟐
• 𝑅𝑍𝑚
•
No content below the
line
No content below the
line
16

No content below the
line
No content below the
line
17
0
5
10
15
20
25
30
35
40
45
50
0 5 10 15 20 25 30 35 40 45 50
Realized Volatility
Expected VIX
Mean Reversion

No content below the
line
No content below the
line
18
No content below the
line
No content below the
line
19
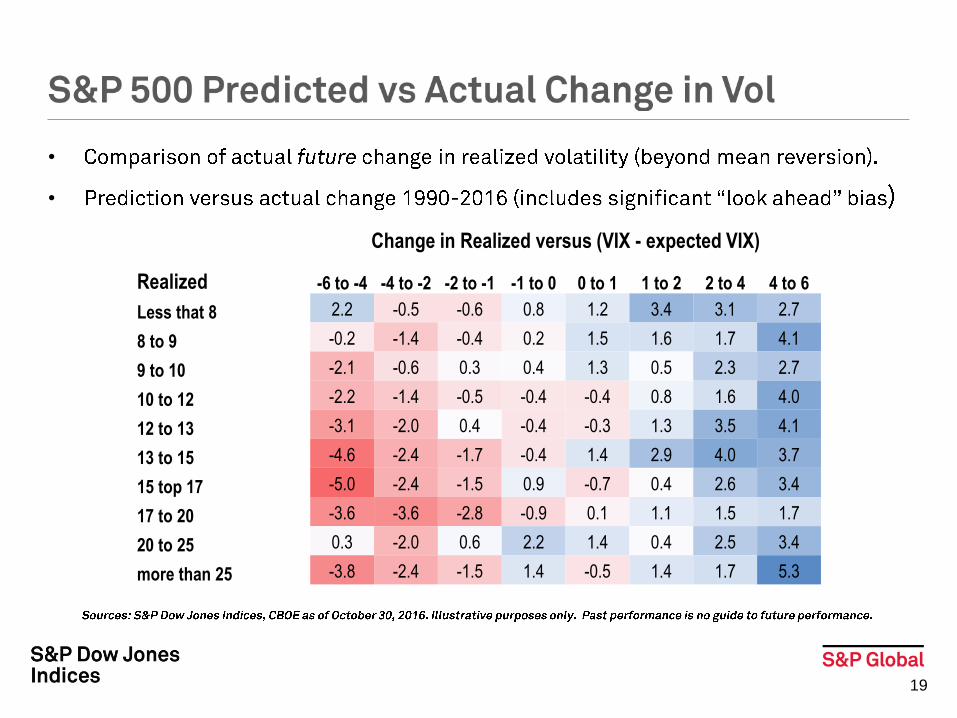
•
•
Change in Realized versus (VIX - expected VIX)
Realized -6 to -4 -4 to -2 -2 to -1 -1 to 0 0 to 1 1 to 2 2 to 4 4 to 6
Less that 8 2.2 -0.5 -0.6 0.8 1.2 3.4 3.1 2.7
8 to 9 -0.2 -1.4 -0.4 0.2 1.5 1.6 1.7 4.1
9 to 10 -2.1 -0.6 0.3 0.4 1.3 0.5 2.3 2.7
10 to 12 -2.2 -1.4 -0.5 -0.4 -0.4 0.8 1.6 4.0
12 to 13 -3.1 -2.0 0.4 -0.4 -0.3 1.3 3.5 4.1
13 to 15 -4.6 -2.4 -1.7 -0.4 1.4 2.9 4.0 3.7
15 top 17 -5.0 -2.4 -1.5 0.9 -0.7 0.4 2.6 3.4
17 to 20 -3.6 -3.6 -2.8 -0.9 0.1 1.1 1.5 1.7
20 to 25 0.3 -2.0 0.6 2.2 1.4 0.4 2.5 3.4
more than 25 -3.8 -2.4 -1.5 1.4 -0.5 1.4 1.7 5.3

No content below the
line
No content below the
line
20
•
•
-20.00
-15.00
-10.00
-5.00
0.00
5.00
10.00
15.00
20.00
25.00
Sep
201
3
Nov
201
3
Jan
2014
Mar
201
4
May
201
4
Jul 2
014
Sep
201
4
Nov
201
4
Jan
2015
Mar
201
5
May
201
5
Jul 2
015
Sep
201
5
Nov
201
5
Jan
2016
Mar
201
6
May
201
6
Jul 2
016
Sep
201
6
1M C
han
ge
Predicted change in realized volatility
Actual change in realized volatility

No content below the
line
No content below the
line
21
U.S. Equity Index Commodity VIX® CBOE Volatility Index® OVX CBOE Crude Oil ETF Volatility Index
VXNSM CBOE NASDAQ Volatility Index GVZ CBOE Gold ETF Volatility Index
VXOSM CBOE S&P 100 Volatility Index VXSLV CBOE Silver ETF Volatility Index
VXDSM CBOE DJIA Volatility Index VXGDX CBOE Gold Miners ETF Volatility Index
RVXSM CBOE Russell 2000 Volatility Index VXXLE CBOE Energy Sector ETF Volatility Index
VXSTSM CBOE Short-Term Volatility Index
VXVSM CBOE 3-Month Volatility Index Currency VXMTSM CBOE Mid-Term Volatility Index EUVIX CBOE/CME FX Euro Volatility IndexSM
JYVIX CBOE/CME FX Yen Volatility IndexSM
Single Stock BPVIX CBOE/CME FX British Pound Volatility IndexSM
VXAZN CBOE Equity VIX® on Amazon EVZ CBOE EuroCurrency ETF Volatility Index
VXAPL CBOE Equity VIX® on Apple
VXGS CBOE Equity VIX® on Goldman Sachs Ex-U.S. Equity VXGOG CBOE Equity VIX® on Google VXEFA CBOE EFA ETF Volatility Index
VXIBM CBOE Equity VIX® on IBM VXEEM CBOE Emerging Markets ETF Volatility Index
VXFXI CBOE China ETF Volatility Index
Rates VXEWZ CBOE Brazil ETF Volatility Index
TYVIX CBOE/CBOT 10-year U.S. Treasury Note Volatility Index SP51VIX S&P/ASX 200 VIX
SRVIX CBOE Interest Rate Swap Volatility Index V2X VSTOXX
SPJGBV S&P/JPX JGB VIX VHSI Hang Seng Volatility Index
VIXC S&P/TSX 60 Volatility Index
Volatility VVIX CBOE VIX of VIX Index

No content below the
line
No content below the
line
22
•
0
5
10
15
20
25
30
35
40
45
50
0 10 20 30 40 50 60
Ave
rag
e R
V, 3
0 d
ays
late
r
Realized Volatility (5%ile Average)
R2 = 0.99

No content below the
line
No content below the
line
23
•
0
100
200
300
400
500
600
700
0 500 1000 1500 2000 2500
VIX
Pre
miu
m t
o M
ean
Rev
ersi
on
2
Realized Volatility (5%ile Average)
R2 = 0.82
2

No content below the
line
No content below the
line
24
•
0
5
10
15
20
25
30
35
40
0 5 10 15 20 25 30 35 40 45 50
Ave
rag
e R
V, 3
0 d
ays
late
r
Realized Volatility (5%ile Average)
R2 = 0.98

No content below the
line
No content below the
line
25
•
0
100
200
300
400
500
600
700
0 200 400 600 800 1000 1200 1400 1600
VIX
Pre
miu
m t
o M
ean
Rev
ersi
on
2
Realized Volatility (5%ile Average)
R2 = 0.86
2

No content below the
line
No content below the
line
26
•
0
10
20
30
40
50
60
70
80
0 10 20 30 40 50 60 70 80 90
Ave
rag
e R
V, 3
0 d
ays
late
r
Realized Volatility (5%ile Average)
R2 = 0.97

No content below the
line
No content below the
line
27
•
0
200
400
600
800
1000
1200
1400
1600
1800
0 1000 2000 3000 4000 5000
VIX
Pre
miu
m t
o M
ean
Rev
ersi
on
2
Realized Volatility (5%ile Average)
R2 = 0.82
2

No content below the
line
No content below the
line
28
•
0
1
2
3
4
5
6
7
0 1 2 3 4 5 6 7 8
Ave
rag
e R
V, 3
0 d
ays
late
r
Realized Volatility (5%ile Average)
R2 = 0.95

No content below the
line
No content below the
line
29
•
2
0
2
4
6
8
10
12
0 5 10 15 20 25 30 35 40
VIX
Pre
miu
m t
o M
ean
Rev
ersi
on
2
Realized Volatility (5%ile Average)
R2 = 0.80
2
No content below the
line
No content below the
line
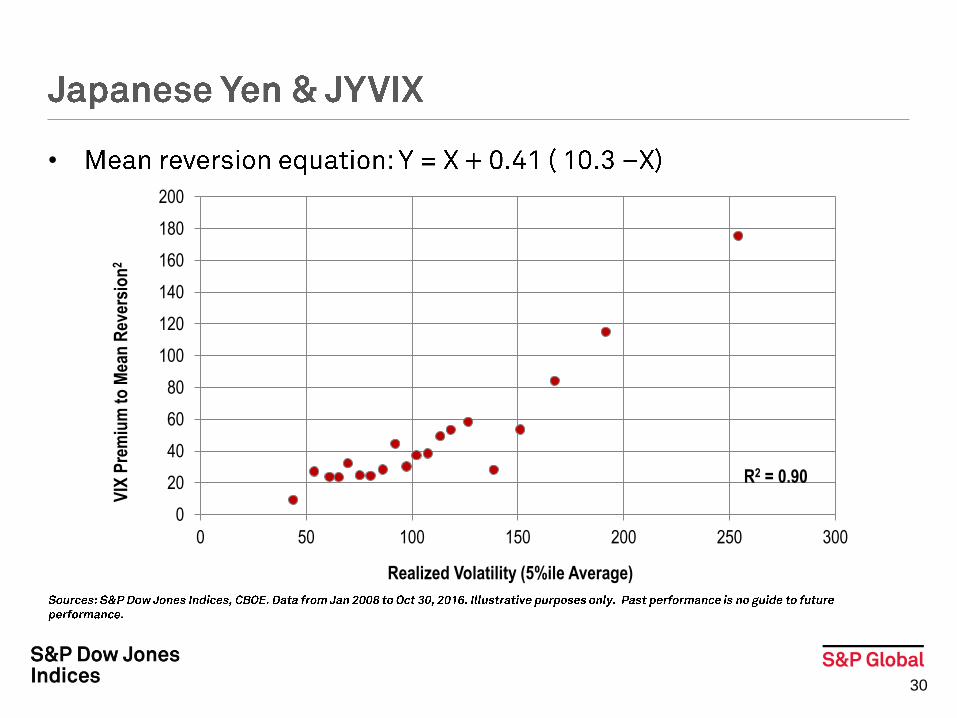
30
•
0
20
40
60
80
100
120
140
160
180
200
0 50 100 150 200 250 300
VIX
Pre
miu
m t
o M
ean
Rev
ersi
on
2
Realized Volatility (5%ile Average)
R2 = 0.90

No content below the
line
No content below the
line
31
•
0
2
4
6
8
10
12
14
16
0 5 10 15 20 25
Ave
rag
e R
V, 3
0 d
ays
late
r
Realized Volatility (5%ile Average)
R2 = 0.86
No content below the
line
No content below the
line
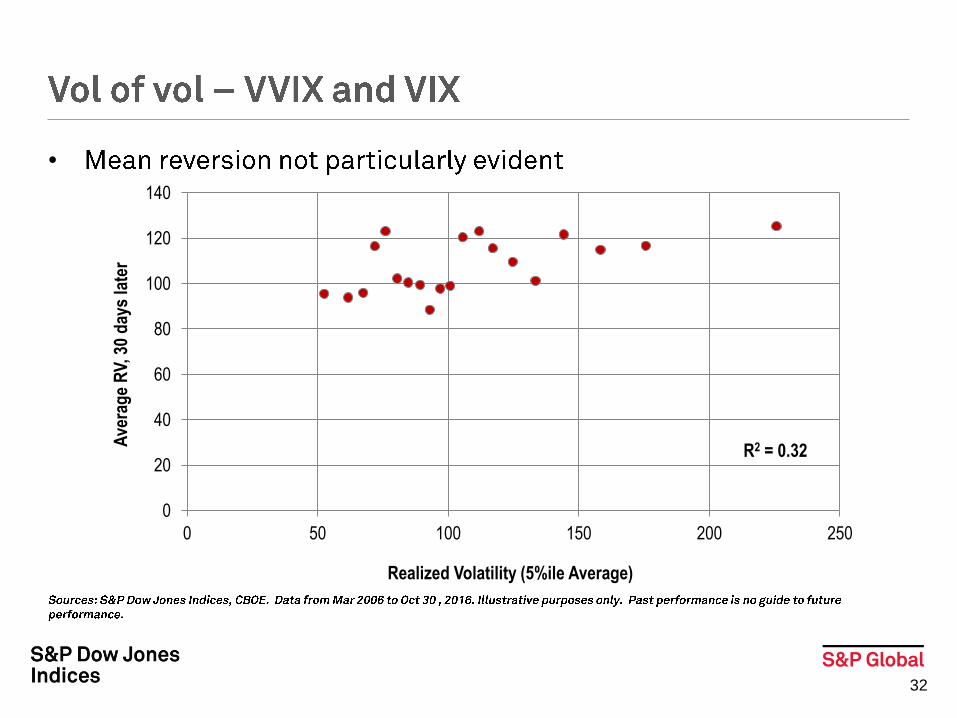
32
•
0
20
40
60
80
100
120
140
0 50 100 150 200 250
Ave
rag
e R
V, 3
0 d
ays
late
r
Realized Volatility (5%ile Average)
R2 = 0.32

No content below the
line
No content below the
line
33
•
2 2
-5000
-4500
-4000
-3500
-3000
-2500
-2000
-1500
-1000
-500
0
0 2000 4000 6000 8000 10000 12000 14000 16000 18000
VIX
Pre
miu
m t
o M
ean
Rev
ersi
on
2
Realized Volatility (5%ile Average)
R2 = 0.00

No content below the
line
No content below the
line
34
•
•
•
•
•

No content below the
line
No content below the
line

No content below the
line
No content below the
line
36
-
-
-
No content below the
line
No content below the
line
37
80%
85%
90%
95%
100%
105%
110%
115%
120%
125%
130%
28
-Se
p-0
1
02
-Oct
-01
06
-Oct
-01
10
-Oct
-01
14
-Oct
-01
18
-Oct
-01
22
-Oct
-01
26
-Oct
-01
30
-Oct
-01
Pri
ce R
etu
rn
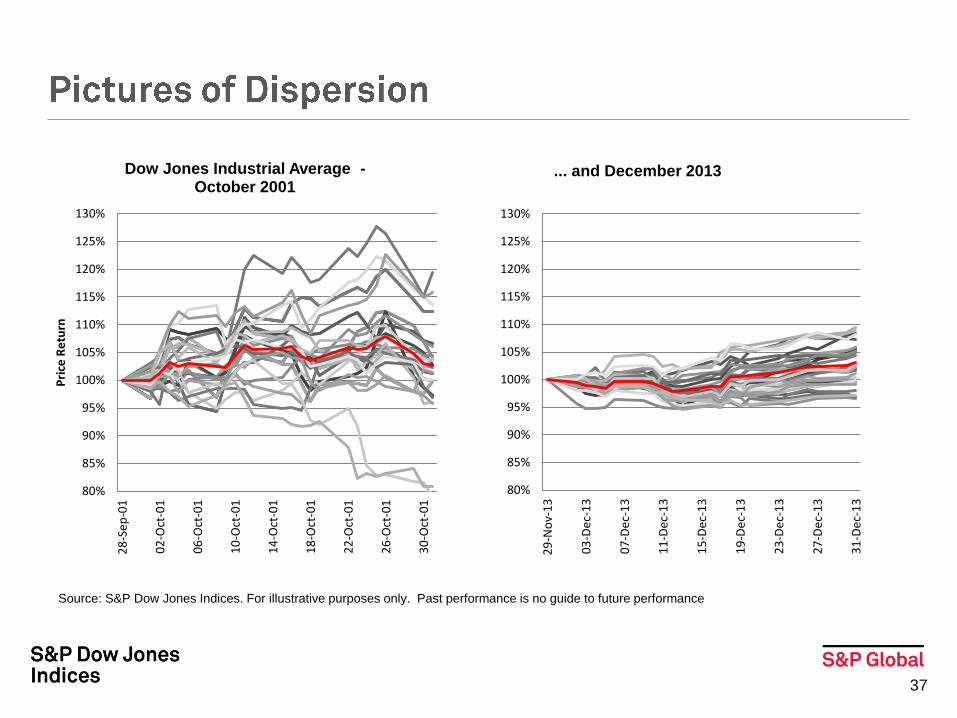
Dow Jones Industrial Average -October 2001
80%
85%
90%
95%
100%
105%
110%
115%
120%
125%
130%
29
-No
v-1
3
03
-De
c-1
3
07
-De
c-1
3
11
-De
c-1
3
15
-De
c-1
3
19
-De
c-1
3
23
-De
c-1
3
27
-De
c-1
3
31
-De
c-1
3
... and December 2013
Source: S&P Dow Jones Indices. For illustrative purposes only. Past performance is no guide to future performance

No content below the
line
No content below the
line
38
0%
15%
30%
45%
60%
75%
Jan-9
1
Jan-9
2
Jan-9
3
Jan-9
4
Jan
-95
Jan-9
6
Jan-9
7
Jan-9
8
Jan-9
9
Jan-0
0
Jan-0
1
Jan-0
2
Jan-0
3
Jan-0
4
Jan-0
5
Jan
-06
Jan-0
7
Jan-0
8
Jan-0
9
Jan-1
0
Jan
-11
Jan-1
2
Jan-1
3
Jan-1
4
Jan-1
5
Jan-1
6
S&P 500® 1-Month Dispersion(Annualized)
VIX® (Month Average)
No content below the
line
No content below the
line
0.0%
0.5%
1.0%
1.5%
2.0%
2.5%
3.0%
10
12
14
16
18
20
22
24
29 J
ul
03 A
ug
08 A
ug
11 A
ug
16 A
ug
19 A
ug
24 A
ug
29 A
ug
01 S
ep
07 S
ep
12 S
ep
15 S
ep
20 S
ep
23 S
ep
28 S
ep
03 O
ct
06 O
ct
11 O
ct
14 O
ct
19 O
ct
24 O
ct
27 O
ct
01 N
ov
04 N
ov
09 N
ov
14 N
ov
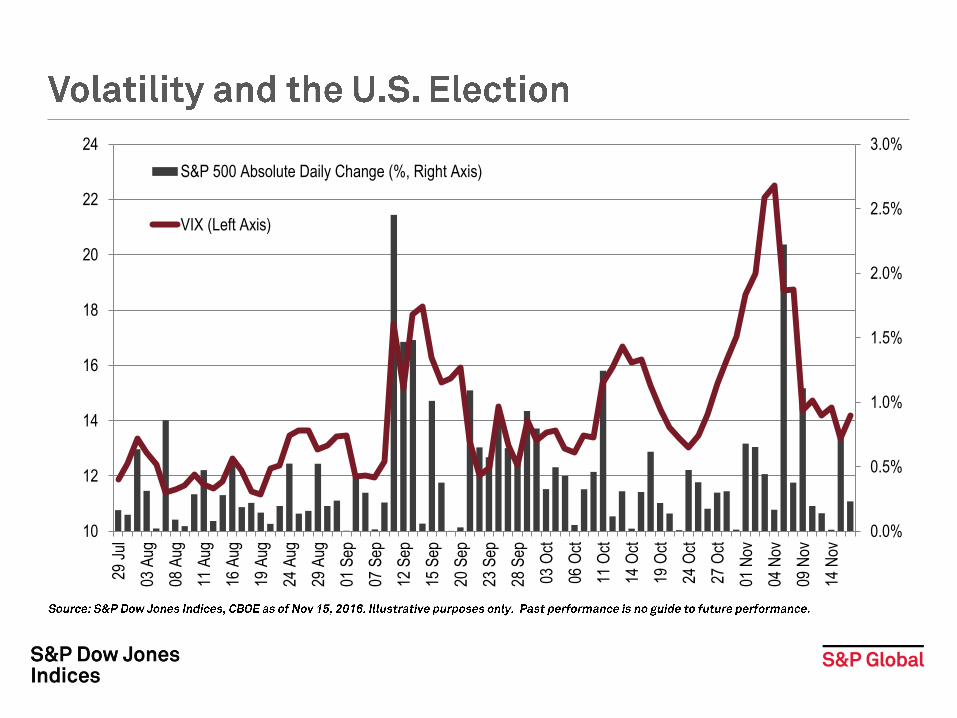
S&P 500 Absolute Daily Change (%, Right Axis)
VIX (Left Axis)

No content below the
line
No content below the
line
0.0%
0.5%
1.0%
1.5%
2.0%
2.5%
3.0%
3.5%
10
12
14
16
18
20
22
24
29 J
ul
03 A
ug
08 A
ug
11 A
ug
16 A
ug
19 A
ug
24 A
ug
29 A
ug
01 S
ep
07 S
ep
12 S
ep
15 S
ep
20 S
ep
23 S
ep
28 S
ep
03 O
ct
06 O
ct
11 O
ct
14 O
ct
19 O
ct
24 O
ct
27 O
ct
01 N
ov
04 N
ov
09 N
ov
14 N
ov
S&P 500 1-Day Dispersion
VIX (Left Axis)
40

No content below the
line
No content below the
line
41
-
-
-

No content below the
line
No content below the
line
42

No content below the
line
No content below the
line
43
-
-
-

No content below the
line
No content below the
line
44

No content below the
line
No content below the
line
45
𝑀𝑎𝑟𝑘𝑒𝑡 𝐼𝑚𝑝𝑎𝑐𝑡 𝑀𝐼 = 𝐾 𝑉
𝑽

No content below the
line
No content below the
line
46
•
•
•
-
-
No content below the
line
No content below the
line
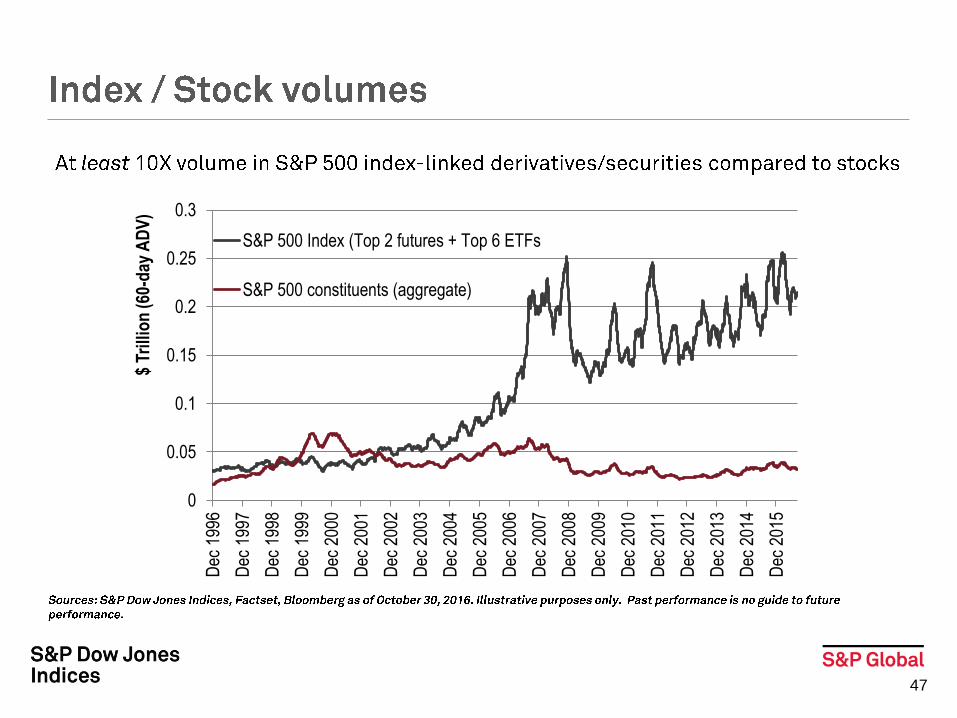
47
0
0.05
0.1
0.15
0.2
0.25
0.3D
ec 1
996
Dec
199
7
Dec
199
8
Dec
199
9
Dec
200
0
Dec
200
1
Dec
200
2
Dec
200
3
Dec
200
4
Dec
200
5
Dec
200
6
Dec
200
7
Dec
200
8
Dec
200
9
Dec
201
0
Dec
201
1
Dec
201
2
Dec
201
3
Dec
201
4
Dec
201
5
$ Tr
illio
n (
60-d
ay A
DV
)
S&P 500 Index (Top 2 futures + Top 6 ETFs
S&P 500 constituents (aggregate)

No content below the
line
No content below the
line
48
0%
50%
100%
150%
200%
250%
300%
350%
400%
Jan2000
Jan2001
Jan2002
Jan2003
Jan2004
Jan2005
Jan2006
Jan2007
Jan2008
Jan2009
Jan2010
Jan2011
Jan2012
Jan2013
Jan2014
Jan2015
Jan2016
Index-Weighted Average Stock Iliquidity (21D trailing percentage of period average)
Index Illiquidity (21D trailing percentage of period average)

No content below the
line
No content below the
line
49
0.00
15.00
30.00
45.00
60.00
75.00
90.00
0%
50%
100%
150%
200%
250%
300%
Jan2000
Jan2001
Jan2002
Jan2003
Jan2004
Jan2005
Jan2006
Jan2007
Jan2008
Jan2009
Jan2010
Jan2011
Jan2012
Jan2013
Jan2014
Jan2015
Jan2016
Index-Weighted Average Stock Liquidity (21D trailing percentage of period average)
VIX (Right Axis)
No content below the
line
No content below the
line
50
•
•
•
•
•
•

No content below the
line
No content below the
line
52
VIX premium to expected
Realized Volatility -6 to -4 -4 to -2 -2 to -1 -1 to 0 0 to 1 1 to 2 2 to 4 4 to 6
Less that 8 11 205 221 128 65 34 41 13
8 to 9 10 176 96 72 44 22 35 10
9 to 10 37 199 94 76 71 42 37 18
10 to 12 96 261 146 159 156 83 115 49
12 to 13 58 72 41 44 38 38 67 34
13 to 15 111 145 97 75 103 63 98 36
15 top 17 78 109 78 77 67 53 85 67
17 to 20 36 92 62 83 68 65 130 71
20 to 25 60 120 53 72 62 53 90 65
more than 25 98 86 37 40 33 51 62 42

No content below the
line
No content below the
line
All information presented prior to the launch date is back-tested. Back-tested
performance is not actual performance, but is hypothetical. The back-test calculations are based on the same methodology that was in effect when the index was
officially launched. Complete index methodology details are available at www.spdji.com. It is not possible to invest directly in an index.
S&P Dow Jones Indices defines various dates to assist our clients in providing transparency on their products. The First Value Date is the first day for which there
is a calculated value (either live or back-tested) for a given index. The Base Date is the date at which the Index is set at a fixed value for calculation purposes. The
Launch Date designates the date upon which the values of an index are first considered live: index values provided for any date or time period prior to the index’s
Launch Date are considered back-tested. S&P Dow Jones Indices defines the Launch Date as the date by which the values of an index are known to have been
released to the public, for example via the company’s public website or its datafeed to external parties. For Dow Jones-branded indicates introduced prior to May
31, 2013, the Launch Date (which prior to May 31, 2013, was termed “Date of introduction”) is set at a date upon which no further changes were permitted to be
made to the index methodology, but that may have been prior to the Index’s public release date.
Past performance of the Index is not an indication of future results. Prospective application of the methodology used to construct the Index may not result in
performance commensurate with the back-test returns shown. The back-test period does not necessarily correspond to the entire available history of the Index.
Please refer to the methodology paper for the Index, available at www.spdji.com for more details about the index, including the manner in which it is rebalanced,
the timing of such rebalancing, criteria for additions and deletions, as well as all index calculations.
Another limitation of using back-tested information is that the back-tested calculation is generally prepared with the benefit of hindsight. Back-tested information
reflects the application of the index methodology and selection of index constituents in hindsight. No hypothetical record can completely account for the impact of
financial risk in actual trading. For example, there are numerous factors related to the equities, fixed income, or commodities markets in general which cannot be,
and have not been accounted for in the preparation of the index information set forth, all of which can affect actual performance.
The Index returns shown do not represent the results of actual trading of investable assets/securities. S&P Dow Jones Indices LLC maintains the Index and
calculates the Index levels and performance shown or discussed, but does not manage actual assets. Index returns do not reflect payment of any sales charges or
fees an investor may pay to purchase the securities underlying the Index or investment funds that are intended to track the performance of the Index. The
imposition of these fees and charges would cause actual and back-tested performance of the securities/fund to be lower than the Index performance shown. As a
simple example, if an index returned 10% on a US $100,000 investment for a 12-month period (or US $10,000) and an actual asset-based fee of 1.5% was
imposed at the end of the period on the investment plus accrued interest (or US $1,650), the net return would be 8.35% (or US $8,350) for the year. Over a three
year period, an annual 1.5% fee taken at year end with an assumed 10% return per year would result in a cumulative gross return of 33.10%, a total fee of US
$5,375, and a cumulative net return of 27.2% (or US $27,200).

No content below the
line
No content below the
line
General Disclaimer
Copyright © 2016 S&P Dow Jones Indices LLC, a division of S&P Global. All rights reserved. STANDARD & POOR’S, S&P, SPDR, S&P 500, S&P EUROPE 350, S&P 100, S&P
1000, S&P COMPOSITE 1500, S&P MIDCAP 400, S&P SMALLCAP 600, GIVI, GLOBAL TITANS, S&P RISK CONTROL INDICES, S&P GLOBAL THEMATIC INDICES, S&P TARGET
DATE INDICES, S&P TARGET RISK INDICES, DIVIDEND ARISTOCRATS, STARS, GICS, HOUSINGVIEWS, INDEX ALERT, INDEXOLOGY, MARKET ATTRIBUTES, PRACTICE
ESSENTIALS, S&P HEALTHCARE MONITOR, SPICE, and SPIVA are registered trademarks of Standard & Poor’s Financial Services LLC, a division of S&P Global (“S&P”). DOW
JONES, DJ, DJIA and DOW JONES INDUSTRIAL AVERAGE are registered trademarks of Dow Jones Trademark Holdings LLC (“Dow Jones”). These trademarks together with
others have been licensed to S&P Dow Jones Indices LLC. Redistribution, reproduction and/or photocopying in whole or in part are prohibited without written permission. This
document does not constitute an offer of services in jurisdictions where S&P Dow Jones Indices LLC, Dow Jones, S&P or their respective affiliates (collectively “S&P Dow
Jones Indices”) do not have the necessary licenses. All information provided by S&P Dow Jones Indices is impersonal and not tailored to the needs of any person, entity or
group of persons. S&P Dow Jones Indices receives compensation in connection with licensing its indices to third parties. Past performance of an index is not a guarantee of
future results.
It is not possible to invest directly in an index. Exposure to an asset class represented by an index is available through investable instruments based on that index. S&P Dow
Jones Indices does not sponsor, endorse, sell, promote or manage any investment fund or other investment vehicle that is offered by third parties and that seeks to provide an
investment return based on the performance of any index. S&P Dow Jones Indices makes no assurance that investment products based on the index will accurately track
index performance or provide positive investment returns. S&P Dow Jones Indices LLC is not an investment advisor, and S&P Dow Jones Indices makes no representation
regarding the advisability of investing in any such investment fund or other investment vehicle. A decision to invest in any such investment fund or other investment vehicle
should not be made in reliance on any of the statements set forth in this document. Prospective investors are advised to make an investment in any such fund or other vehicle
only after carefully considering the risks associated with investing in such funds, as detailed in an offering memorandum or similar document that is prepared by or on behalf
of the issuer of the investment fund or other investment product or vehicle. S&P Dow Jones Indices LLC is not a tax advisor. A tax advisor should be consulted to evaluate the
impact of any tax-exempt securities on portfolios and the tax consequences of making any particular investment decision. Inclusion of a security within an index is not a
recommendation by S&P Dow Jones Indices to buy, sell, or hold such security, nor is it considered to be investment advice. Closing prices for S&P Dow Jones Indices’ US
benchmark indices are calculated by S&P Dow Jones Indices based on the closing price of the individual constituents of the index as set by their primary exchange. Closing
prices are received by S&P Dow Jones Indices from one of its third party vendors and verified by comparing them with prices from an alternative vendor. The vendors receive
the closing price from the primary exchanges. Real-time intraday prices are calculated similarly without a second verification.
These materials have been prepared solely for informational purposes based upon information generally available to the public and from sources believed to be reliable. No
content contained in these materials (including index data, ratings, credit-related analyses and data, research, valuations, model, software or other application or output
therefrom) or any part thereof (“Content”) may be modified, reverse-engineered, reproduced or distributed in any form or by any means, or stored in a database or retrieval
system, without the prior written permission of S&P Dow Jones Indices. The Content shall not be used for any unlawful or unauthorized purposes. S&P Dow Jones Indices and
its third-party data providers and licensors (collectively “S&P Dow Jones Indices Parties”) do not guarantee the accuracy, completeness, timeliness or availability of the
Content. S&P Dow Jones Indices Parties are not responsible for any errors or omissions, regardless of the cause, for the results obtained from the use of the Content. THE
CONTENT IS PROVIDED ON AN “AS IS” BASIS. S&P DOW JONES INDICES PARTIES DISCLAIM ANY AND ALL EXPRESS OR IMPLIED WARRANTIES, INCLUDING, BUT NOT
LIMITED TO, ANY WARRANTIES OF MERCHANTABILITY OR FITNESS FOR A PARTICULAR PURPOSE OR USE, FREEDOM FROM BUGS, SOFTWARE ERRORS OR DEFECTS,
THAT THE CONTENT’S FUNCTIONING WILL BE UNINTERRUPTED OR THAT THE CONTENT WILL OPERATE WITH ANY SOFTWARE OR HARDWARE CONFIGURATION. In no
event shall S&P Dow Jones Indices Parties be liable to any party for any direct, indirect, incidental, exemplary, compensatory, punitive, special or consequential damages,
costs, expenses, legal fees, or losses (including, without limitation, lost income or lost profits and opportunity costs) in connection with any use of the Content even if advised
of the possibility of such damages.
Credit-related information and other analyses, including ratings, research and valuations are generally provided by licensors and/or affiliates of S&P Dow Jones Indices,
including but not limited to S&P Global’s other divisions such as Standard & Poor’s Financial Services LLC and S&P Capital IQ LLC. Any credit-related information and other
related analyses and statements in the Content are statements of opinion as of the date they are expressed and not statements of fact. Any opinion, analyses and rating
acknowledgement decisions are not recommendations to purchase, hold, or sell any securities or to make any investment decisions, and do not address the suitability of any
security. S&P Dow Jones Indices does not assume any obligation to update the Content following publication in any form or format. The Content should not be relied on and is
not a substitute for the skill, judgment and experience of the user, its management, employees, advisors and/or clients when making investment and other business decisions.
S&P Dow Jones Indices LLC does not act as a fiduciary or an investment advisor. While S&P Dow Jones Indices has obtained information from sources they believe to be
reliable, S&P Dow Jones Indices does not perform an audit or undertake any duty of due diligence or independent verification of any information it receives.
No content below the
line
No content below the
line
To the extent that regulatory authorities allow a rating agency to acknowledge in one jurisdiction a rating issued in another jurisdiction for certain regulatory purposes, S&P Global Ratings
Services reserves the right to assign, withdraw or suspend such acknowledgement at any time and in its sole discretion. S&P Dow Jones Indices, including S&P Global Ratings Services,
disclaim any duty whatsoever arising out of the assignment, withdrawal or suspension of an acknowledgement as well as any liability for any damage alleged to have been suffered on
account thereof.
Affiliates of S&P Dow Jones Indices LLC, including S&P Global Ratings Services, may receive compensation for its ratings and certain credit-related analyses, normally from issuers or
underwriters of securities or from obligors. Such affiliates of S&P Dow Jones Indices LLC, including S&P Global Ratings Services, reserve the right to disseminate its opinions and
analyses. Public ratings and analyses from S&P Global Ratings Services are made available on its Web sites, www.standardandpoors.com (free of charge), and www.ratingsdirect.com and
www.globalcreditportal.com (subscription), and may be distributed through other means, including via S&P Global Rating Services publications and third-party redistributors. Additional
information about our ratings fees is available at www.standardandpoors.com/usratingsfees.
S&P Global keeps certain activities of its various divisions and business units separate from each other in order to preserve the independence and objectivity of their respective activities.
As a result, certain divisions and business units of S&P Global may have information that is not available to other business units. S&P Global has established policies and procedures to
maintain the confidentiality of certain non-public information received in connection with each analytical process.
In addition, S&P Dow Jones Indices provides a wide range of services to, or relating to, many organizations, including issuers of securities, investment advisers, broker-dealers, investment
banks, other financial institutions and financial intermediaries, and accordingly may receive fees or other economic benefits from those organizations, including organizations whose
securities or services they may recommend, rate, include in model portfolios, evaluate or otherwise address.
The Global Industry Classification Standard (GICS®) was developed by and is the exclusive property and a trademark of Standard & Poor’s and MSCI. Neither MSCI, Standard & Poor’s
nor any other party involved in making or compiling any GICS classifications makes any express or implied warranties or representations with respect to such standard or classification (or
the results to be obtained by the use thereof), and all such parties hereby expressly disclaim all warranties of originality, accuracy, completeness, merchantability or fitness for a particular
purpose with respect to any of such standard or classification. Without limiting any of the foregoing, in no event shall MSCI, Standard & Poor’s, any of their affiliates or any third party
involved in making or compiling any GICS classifications have any liability for any direct, indirect, special, punitive, consequential or any other damages (including lost profits) even if
notified of the possibility of such damages.
TSX is a trademark of TSX, Inc. and has been licensed for use by S&P Dow Jones Indices. RAFI is a trademark of Research Affiliates, LLC and has been licensed for use by S&P Dow
Jones Indices. CASE-SHILLER is a registered trademark of CoreLogic Case-Shiller, LLC and has been licensed for use by S&P Dow Jones Indices. LSTA is a trademark of Loan
Syndications and Trading Association, Inc. and has been licensed for use by S&P Dow Jones Indices. VIX is a trademark of Chicago Board Options Exchange, Incorporated and has been
licensed for use by S&P Dow Jones Indices. BVL is a trademark of Bolsa de Valores de Lima S.A. and has been licensed for use by S&P Dow Jones Indices. VALMER is a trademark of
Bolsa Mexicana de Valores, S.A.B. de C.V. and has been licensed for use by S&P Dow Jones Indices. NZX is a trademark of NZX Limited and has been licensed for use by S&P Dow
Jones Indices. ISDA is a trademark of the International Swaps & Derivatives Association, Inc. and has been licensed for use by S&P Dow Jones Indices. GSCI is a registered trademark of
The Goldman Sachs Group, Inc. (“Goldman”) and has been licensed for use by S&P Dow Jones Indices. The S&P GSCI index is not created, owned, endorsed, sponsored, sold or
promoted by Goldman or its affiliates and Goldman bears no liability with respect to such index or data related thereto. Goldman provides no guarantee as to the accuracy and/or the
completeness of the S&P GSCI index or any data related thereto.
All trade names, trademarks and service marks, and attendant goodwill, now owned by Citigroup Index LLC or any of its affiliates and used in connection with the S&P/Citigroup
International Treasury Bond (Ex-US) Indices shall remain its or its affiliates’ respective sole property, and all rights accruing from their use shall inure solely to the benefit of Citigroup Index
LLC or any of its affiliates.
IN NO EVENT WHATSOEVER SHALL CITIGROUP INDEX LLC OR ANY OF ITS AFFILIATES BE LIABLE WITH RESPECT TO SUCH INDICES FOR ANY DIRECT, INDIRECT, SPECIAL,
INCIDENTAL, PUNITIVE OR CONSEQUENTIAL DAMAGES, INCLUDING BUT NOT LIMITED TO, LOSS OF PROFITS, LOST TIME OR GOODWILL, EVEN IF IT THEY HAVE BEEN
ADVISED OF THE POSSIBILITY OF SUCH DAMAGES, REGARDLESS OF THE FORM OF ACTION, WHETHER IN CONTRACT, TORT (INCLUDING NEGLIGENCE), STRICT LIABILITY
OR OTHERWISE.
Brookfield Redding, Inc. and/or its affiliates (including but not limited to Brookfield Asset Management Inc., collectively “Co-Publisher”) own certain intellectual property rights with respect to
the Dow Jones Brookfield Infrastructure Indexes, which rights have been licensed to S&P for use.
SAM Indexes Gmbh and/or its successors or affiliates (collectively, “SAM”) own certain intellectual property rights with respect to the Dow Jones Sustainability Indexes, which rights have
been licensed to S&P for use.
.