Embed Size (px)
DESCRIPTION
No-Fault Auto Insurance Fraud in New York State Trends, Challenges & Costs. Hearing on No-Fault Auto Insurance New York State Senate Insurance Committee April 26, 2011. Robert P. Hartwig, Ph.D., CPCU, President & Economist - PowerPoint PPT Presentation
Citation preview
No-Fault Auto Insurance Fraud in New York State
Trends, Challenges & Costs
Hearing on No-Fault Auto InsuranceNew York State Senate Insurance Committee
April 26, 2011Robert P. Hartwig, Ph.D., CPCU, President & Economist
Insurance Information Institute 110 William Street New York, NY 10038Tel: 212.346.5520 Cell: 917.453.1885 [email protected] www.iii.org

2
New York’s No-Fault Fraud Tax: Estimated Aggregate Annual Cost, 2005-2010 ($ Millions)
$203.6
$231.0
$192.9
$116.3
$67.8
$1.4$0
$50
$100
$150
$200
$250
2005 2006 2007 2008 2009 2010
Fra
ud
Ta
x (
$ M
illio
ns
)
*2010 figure is based on data through Q4:2010.Source: Insurance Information Institute calculations and research from ISO/PCI data.
No-Fault Fraud Is Costing Honest New York State Drivers Hundreds of Millions of Dollars
The total fraud tax levied on New York vehicle owners exceeded more than $200
million in 2010 for the second straight year.
NY’s no fault fraud tax burden soared by 241% between 2006 and 2009
Figure 1.

3
New York’s No-Fault Fraud Tax: Estimated Cumulative Cost, 2005-2010 ($ Millions)
$812.9
$609.3
$378.4
$185.5
$69.2$1.4
$0
$100
$200
$300
$400
$500
$600
$700
$800
$900
2005 2006 2007 2008 2009 2010
Cu
mu
lta
ive
Fra
ud
Ta
x (
$ M
illio
ns
)
*2010 figure is based on data through Q4:2010Source: Insurance Information Institute calculations and research from ISO/PCI data.
The cumulative no-fault fraud tax burden on New
York vehicle owners exceeded $813 million from
2005 through 2010
No-Fault Fraud Is Costing Honest New York State Drivers Hundreds of Millions of Dollars
Figure 2.

4
Estimated Per Claim Cost of No-Fault Fraud in New York State, 2005-2010
$1,311
$1,581
$1,379
$848
$489
$9$0
$200
$400
$600
$800
$1,000
$1,200
$1,400
$1,600
$1,800
2005 2006 2007 2008 2009 2010
Fra
ud
Ta
x P
er
Cla
im
*2010 figure is based on data through Q4:2010.Source: Insurance Information Institute calculations and research from ISO/PCI data.
Fraud and Abuse Are Raising the Costs of Insurance in New York State
The estimated per claim cost of no-fault fraud (a.k.a. Fraud
Tax) was $1,311 in 2010NY’s no-fault fraud
tax of $1,311 accounted for 15.1% of the average claim
cost of $8,664 in 2010
Figure 3.

5
NY No-Fault (PIP) Claim Severity Has Trended Up Sharply Upward, 2005-2010*
$8,664
$5,873$6,129
$6,853
$7,492
$8,269
$8,692
$5,000
$5,500
$6,000
$6,500
$7,000
$7,500
$8,000
$8,500
$9,000
2004 2005 2006 2007 2008 2009 2010
Source: ISO/PCI Fast Track data; Insurance Information Institute
The Average Cost of New York No-Fault Claims Rose Rapidly in Recent Years
No-Fault claim severity (average cost per claim) is up 47.5%
($2,791) in 2010 compared to 2004
Figure 4.

6
New York State No-Fault Claim Severity, 1997–2010:Q4
Sources: ISO/PCI Fast Track data; Insurance Information Institute.
$5,6
75 $6,0
63$6
,699
$8,3
47$8
,327
$7,8
88$7
,507
$8,2
34$9
,235
$8,7
27$8
,577
$7,7
73$7
,311
$6,9
58$6
,870
$6,1
56$6
,052
$5,8
20$5
,991
$5,6
15$6
,094
$5,9
14 $6,2
50$6
,269 $6
,530
$6,6
06$7
,063 $7
,323
$7,3
78$7
,297 $7
,670
$7,7
40$8
,443
$8,1
77 $8,5
07$8
,025
$8,5
63$8
,726
$8,6
46$8
,830
$8,6
46 $8,9
90$8
,647
$8,4
07
$5,000
$5,500
$6,000
$6,500
$7,000
$7,500
$8,000
$8,500
$9,000
$9,500
1997
1998
1999
2000
1:01
1:02
1:03
1:04
2:01
2:02
2:03
2:04
3:01
3:02
3:03
3:04
4:01
4:02
4:03
4:04
5:01
5:02
5:03
5:04
6:01
6:02
6:03
6:04
7:01
7:02
7:03
7:04
8:01
8:02
8:03
8:04
9:01
9:02
9:03
9:04
10:0
110
:02
10:0
310
:04
No
-Fa
ult
Cla
im S
ev
eri
ty
1.0%
1.2%
1.4%
1.6%
1.8%
2.0%
2.2%
2.4%
No
-Fa
ult C
laim
Fre
qu
en
cy
Avg. Claim Severity
Frequency
About 15% of No-Fault Claim Costs in 2010 Were Attributable to Fraud and Abuse
No-Fault Claim Severity
Claim Severity nearly reached a record high
in 2010:Q2: $8,990
Avg. Claim Severity Rose 63% in 5 years
after 1997 Presbyterian
Decision
Avg. Claim Severity is up 50% since 2004:Q4 though 2010:Q4
Claim Frequency is up 22% since
2008:Q3
Figure 5.
7
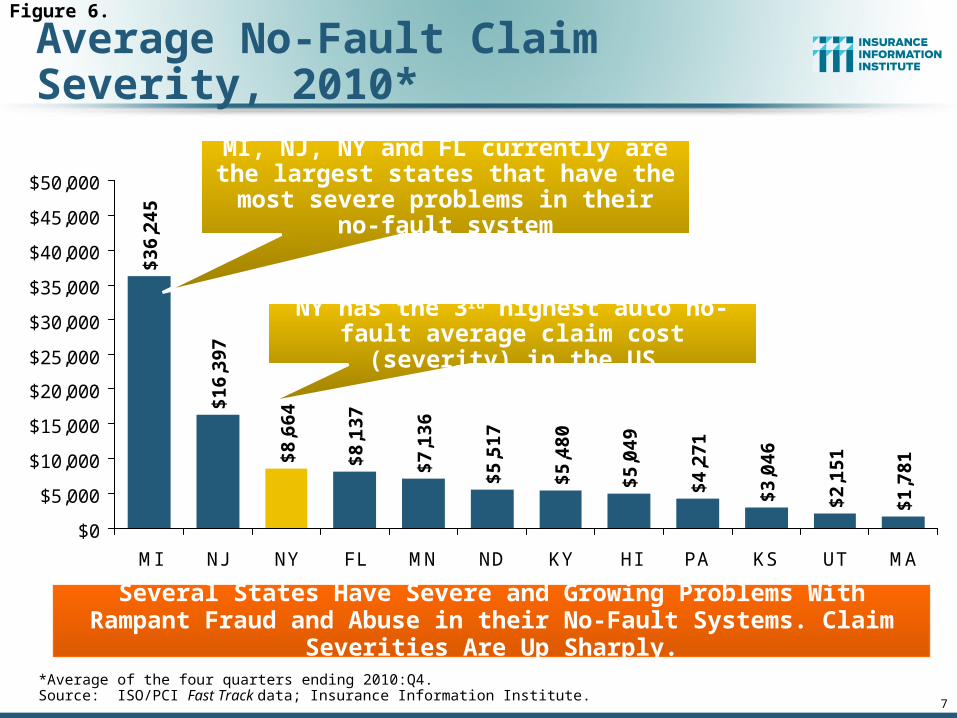
Average No-Fault Claim Severity, 2010*
$1
6,3
97
$8
,66
4
$8
,13
7
$5
,04
9
$4
,27
1
$3
,04
6
$2
,15
1
$1
,78
1
$3
6,2
45
$7
,13
6
$5
,51
7
$5
,48
0
$0
$5,000
$10,000
$15,000
$20,000
$25,000
$30,000
$35,000
$40,000
$45,000
$50,000
MI NJ NY FL MN ND KY HI PA KS UT MA
Several States Have Severe and Growing Problems With Rampant Fraud and Abuse in their No-Fault Systems. Claim Severities Are Up Sharply.
*Average of the four quarters ending 2010:Q4.Source: ISO/PCI Fast Track data; Insurance Information Institute.
MI, NJ, NY and FL currently are the largest states that have the most severe
problems in their no-fault system
NY has the 3rd highest auto no-fault average claim cost (severity) in the US
Figure 6.

8
New York No-Fault (PIP) Claim Frequency Is Trending Sharply Upward*
1.51
1.571.61
1.55
1.62
1.74
1.48 1.49
1.43
1.55 1.571.52
1.20
1.30
1.40
1.50
1.60
1.70
1.80
08:Q1 08:Q2 08:Q3 08:Q4 09:Q1 09:Q2 09:Q3 09:Q4 10:Q1 10:Q2 10:Q3 10:Q4
*Claim frequency is defined as the number of claims per 100 earned car years.Source: ISO/PCI Fast Track data; Insurance Information Institute
2008:Q1 through 2010:Q4
The Number and Average Cost of NY No-Fault Claims Have Been Generally Rising Since 2004
No-Fault claim frequency jumped by 21.7% between
Q3 2008 and Q4 2010
Figure 7.

Medical Cost Inflation Has Outpaced Overall Inflation Over 50 Years
719.81
1589.80
0
300
600
900
1200
1500
1800
61 66 71 76 81 86 91 96 01 06 11*
Ind
ex V
alu
e (1
961=
100)
All ItemsMedical Care
*Based on change from Feb. 2010 to Feb. 2011. Source: Department of Labor (Bureau of Labor Statistics)
A medical expense that cost $1,000 in 1961 would cost nearly $16,000 based on medical cost inflation trends over
the past 50 years.
Figure 8.

10
No-Fault Fraud Was Front Page News a Decade Ago in 2001
Figure 9.

11
Figure 10.
Sparking Interest in Action…

12
Figure 11.
…And Urgent Calls for Reform

13
Average Expenditure on Auto Insurance, NY State vs. US: 1997-2008*
$959
$960
$930
$939
$1,1
72
$1,1
22
$1,0
83
$1,0
47
$1,0
44
$705
$703
$685
$690
$726 $7
86 $830
$843
$831
$817
$796
$789
$1,1
68
$1,1
00
$1,0
15
$0
$200
$400
$600
$800
$1,000
$1,200
$1,400
97 98 99 00 01 02 03 04 05 06 07 08
NY US
In the wake of NY’s first no-fault crisis, the average expenditure on auto insurance in NY state fell by $128 or 10.9% between 2004 and 2008, much more
than the 6.4% drop in the US overall.*Latest available.Source: National Association of Insurance Commissioners.
NY ranked as the 2nd most expensive state during the last crisis, falling to 4th by 2007
Figure 12.
Thank you for your timeand your attention!
Twitter: twitter.com/bob_hartwig
Insurance Information Institute Online:
www.iii.org
www.InsuringFlorida.org