Embed Size (px)
Citation preview
JOURNAL OF VIROLOGY, Mar. 2010, p. 2657–2665 Vol. 84, No. 60022-538X/10/$12.00 doi:10.1128/JVI.02124-09Copyright © 2010, American Society for Microbiology. All Rights Reserved.
No Increase in Hepatitis B Virus (HBV)-Specific CD8� T Cells inPatients with HIV-1–HBV Coinfections following HBV-Active
Highly Active Antiretroviral Therapy�
Megan Crane,1† Sunee Sirivichayakul,2† J. Judy Chang,1‡ Anchalee Avihingsanon,2Sasiwimol Ubolyam,2 Supranee Buranapraditkun,2 Pattarawat Thantiworasit,2
Fiona Wightman,1 Stephen Locarnini,3 Gail Matthews,4 Gregory J. Dore,4Kiat Ruxrungtham,2 and Sharon R. Lewin1,5*
Department of Medicine, Monash University, Melbourne, Australia1; HIV-NAT, Thai Red Cross AIDS Research Centre andVaccine and Cellular Immunology Laboratory, Faculty of Medicine, Chulalongkorn University, Bangkok, Thailand2;Victorian Infectious Diseases Research Laboratory, Melbourne, Australia3; National Centre in HIV Epidemiology and
Clinical Research, University of New South Wales, Sydney, Australia4; and Infectious Diseases Unit,Alfred Hospital, Melbourne, Australia5
Received 7 October 2009/Accepted 23 December 2009
Following treatment of hepatitis B virus (HBV) monoinfection, HBV-specific T-cell responses increasesignificantly; however, little is known about the recovery of HBV-specific T-cell responses following HBV-activehighly active antiretroviral therapy (HAART) in HIV-HBV coinfected patients. HIV-HBV coinfected patientswho were treatment naïve and initiating HBV-active HAART were recruited as part of a prospective cohortstudy in Thailand and followed for 48 weeks (n � 24). Production of gamma interferon (IFN-�) and tumornecrosis factor � (TNF-�) in both HBV- and HIV-specific CD8� T cells was quantified using intracellularcytokine staining on whole blood. Following HBV-active HAART, the median (interquartile range) log declinefrom week 0 to week 48 for HBV DNA was 5.8 log (range, 3.4 to 6.7) IU/ml, and for HIV RNA it was 3.1 (range,2.9 to 3.5) log copies/ml (P < 0.001 for both). The frequency of HIV Gag-specific CD8� T-cell responsessignificantly decreased (IFN-�, P < 0.001; TNF-�, P � 0.05). In contrast, there was no significant change inthe frequency (IFN-�, P � 0.21; TNF-�, P � 0.61; and IFN-� and TNF-�, P � 0.11) or magnitude (IFN-�, P �0.13; TNF-�, P � 0.13; and IFN-� and TNF-�, P � 0.13) of HBV-specific CD8� T-cell responses over 48 weeksof HBV-active HAART. Of the 14 individuals who were HBV e antigen (HBeAg) positive, 5/14 (36%) lost HBeAgduring the 48 weeks of follow-up. HBV-specific CD8� T cells were detected in 4/5 (80%) of patients prior toHBeAg loss. Results from this study show no sustained change in the HBV-specific CD8� T-cell responsefollowing HBV-active HAART. These findings may have implications for the duration of treatment of HBV inHIV-HBV coinfected patients, particularly in HBeAg-positive disease.
Individuals infected with human immunodeficiency virus(HIV) and hepatitis B virus (HBV) are at increased risk ofliver disease progression and liver-related mortality (35). De-spite the introduction of effective highly active antiretroviraltherapy (HAART), liver disease remains a major cause ofnon-AIDS-related deaths in HIV-1-infected patients (31).Current guidelines recommend the early consideration ofHBV-active HAART in the majority of coinfected individuals(28), and treatment of both HBV and HIV is generally lifelong.This is in contrast to HBV-monoinfected patients, where HBVtreatment ceases following production of antibody to HBV eantigen (HBeAg) or HBV surface antigen (HBsAg) (23).HBeAg and HBsAg seroconversions are considered importantendpoints of treatment as they are associated with HBV DNA
clearance, normalization of alanine aminotransferase (ALT),and a reduction in the risk of liver disease (12).
Little is known about the immune events precipitatingHBeAg or HBsAg seroconversion. However, a reduction inantigen burden following anti-HBV treatment may reduce T-cell tolerance and exhaustion, allowing for a more efficientHBV-specific T-cell and B-cell immune response against eitherHBeAg and/or HBsAg (11, 13, 21). Circulating HBV-specificCD4� and CD8� T cells are rarely detected in untreatedchronic HBV infection (5, 24). Following treatment of HBVmonoinfection with nucleos(t)ide analogues such as lamivu-dine (LMV), there is an increase in functional HBV-specificCD4� and CD8� T cells both in the peripheral blood (5, 18)and within the liver (32). However, recovery of HBV-specific Tcells appears to be transient and has been shown to declinefollowing long-term therapy (5, 14, 20).
We have previously shown that the HBV-specific T-cell re-sponse is impaired in HIV-HBV coinfection (7, 9). In onesmall observational study (n � 5), HBV-active HAART wasassociated with the recovery of CD8� HBV-specific T cells(19); however, in this study, two patients had received priorHAART, and the HBV-specific T-cell responses were exam-ined only during the first 24 weeks of treatment (19). In addi-
* Corresponding author. Mailing address: Infectious Diseases Unit,Alfred Hospital, Burnet Institute, Level 2, Commercial Road, Mel-bourne, VIC 3004, Australia. Phone: 613 9076 8491. Fax: 613 90762431. E-mail: [email protected].
† M.C. and S.S. are joint first authors.‡ Present address: Partners AIDS Research Center, Massachusetts
General Hospital, Charlestown, MA.� Published ahead of print on 6 January 2010.
2657
on June 21, 2018 by guesthttp://jvi.asm
.org/D
ownloaded from
tion, HBeAg status was not defined, and HBV-specific T-cellresponses were measured only by IFN-� production followingstimulation with HLA-A2-restricted epitopes (19).
In the present study, we used an overlapping peptide librarycovering the complete HBV genome to assess change in HBV-specific CD8� T cells following the introduction of HBV-activeHAART in treatment-naïve HIV-HBV-coinfected patients inThailand. Overall, we show that there was no sustained changein the magnitude, frequency, or quality of HBV-specific T-cellresponses following initiation of effective HBV-activeHAART.
MATERIALS AND METHODS
Patient population. Patients with HIV-1 and chronic HBV were recruitedfrom King Chulalongkorn Memorial Hospital and HIV-NAT, the Thai RedCross AIDS Research Centre, Thailand (n � 32), as a substudy of two prospec-tive randomized clinical trials for initiation of HBV-active HAART (Tenofovir inHIV/HBV Coinfection [TICO] study) and HIV-NAT 023, both funded by GileadSciences, San Francisco, CA. Participation was with the approval of the hospitalethics committee, and signed consent was obtained. Inclusion criteria wereHIV-1 infection documented by enzyme-linked immunosorbent assay (ELISA),age �18 years, HBV DNA of �2 � 103 IU/ml, HBsAg positive for �6 months,and hepatitis C virus (HCV) antibody negative. All patients were naïve totreatment for either HIV or HBV. HBeAg serology was performed using astandard commercial assay (Abbott HBe EIA; Abbott Laboratories, AbbottPark, IL). Clinical details on the patients included in the TICO study have beenpublished previously (25). To be included in this immunology substudy, anevaluable whole-blood specimen was required prior to the initiation of HAART
(n � 24). This was defined as a specimen that would provide at least 8,000 CD8�
T cells by flow cytometry and had a background response to dimethyl sulfoxide(DMSO) of �0.4% cytokine-positive T cells.
All patients were treated with an HBV-active efavirenz-based HAART regi-men defined as including LMV/emtricitabine (FTC) and/or tenofovir (TDF).
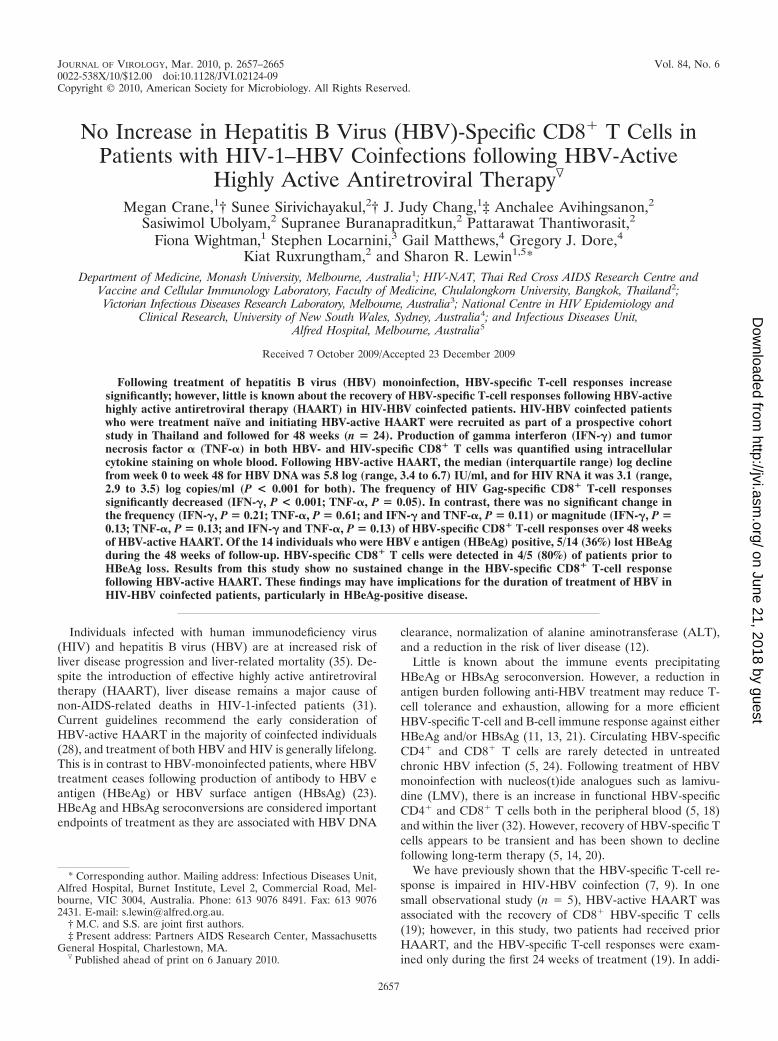
Measuring cytokine production by ICS. Intracellular cytokine staining (ICS)was performed as previously described (7). Briefly, 200 �l of fresh whole bloodwas incubated for 6 h at 37°C with an overlapping HBV peptide library thatcovered the entire HBV genome and was designed for the genotype A consensussequence and included additional peptides for genotypes B, C, and D in areas ofhigh variability (8, 9) or with HIV-1 Gag peptides (obtained through the AIDSResearch and Reference Reagent Program, Division of AIDS, National Instituteof Allergy and Infectious Diseases, National Institutes of Health) and eitherDMSO as a negative control or pokeweed mitogen (PWM; Sigma) and staphy-lococcal enterotoxin B (SEB; St. Louis, MO) as positive controls (Fig. 1). Surfacestaining was performed for 30 min at room temperature (RT) with anti-CD8-phycoerythrin (PE) (BD Biosciences, San Jose, CA), and intracellular stainingwas performed, following erythrocyte lysis and permeabilization, for 1 h (at RT)with anti-gamma interferon-fluorescein isothiocyanate (IFN-�–FITC) and anti-tumor necrosis factor alpha-allophycocyanin (TNF-�–APC; BD Biosciences).Cells were acquired on a FACSCalibur instrument (BD Biosciences) and ana-lyzed using WEASEL, version 2 (Walter and Eliza Hall Institute, Parkville,Australia).
Evaluation of cytokine-positive responses. If a patient did not respond tomitogen, did not have at least 8,000 CD8� cells collected, or had a DMSO(background) response of �0.4% cytokine-positive cells, the HBV-specific re-sponse was not considered to be evaluable and was not included in the analysis.Cytokine responses that were less than 2-fold and less than 0.05% above back-ground were considered undetectable and included as zero (Fig. 1). The mag-nitude of patient responses was determined as the sum of the percentage ofCD8� cytokine-positive cells for each peptide pool. The frequency of response
FIG. 1. ICS for HBV-specific CD8� T cells. CD8� T cells were identified by forward and side scatter and expression of CD8-PE. Data fromat least 8,000 CD8� T cells were collected for analysis. The percentage of HBV-specific T cells was defined as the percentage of cytokine-producingCD8� T cells. A positive response was considered to be �0.05% cytokine� CD8� T cells above background (the response to stimulation withDMSO and costimulatory molecules alone) and also at least 2-fold above background. The positive control included pokeweed mitogen/staphylococcal enterotoxin (PWM/SEB). A representative example from an HIV-HBV-coinfected patient with production of either TNF-� orIFN-� or both cytokines from CD8� T cells to DMSO, PWM/SEB, HBV precore protein, and HIV Gag peptides is shown.
2658 CRANE ET AL. J. VIROL.
on June 21, 2018 by guesthttp://jvi.asm
.org/D
ownloaded from
was determined as the number of patients who had a response above zero to atleast one peptide pool, after subtraction of background. The number of patientswith a detectable response was expressed as a percentage of the number ofpatients who had evaluable specimens at each time point. To determine thespecificity of the response, we calculated the mean response to each gene productas a proportion of the total proteome response for all patients. If a patient didnot have a detectable response to a particular gene product, then the responsewas included as zero.
HBV DNA and HIV-1 RNA quantification. HBV DNA testing was performedas previously described (7) at the Victorian Infectious Diseases Laboratory(VIDRL), Melbourne. Briefly, HBV DNA was measured using the Versant HBVDNA 3.0 bDNA assay (lower limit of detection, 3.6 � 102 IU/ml; Bayer Health-Care, Tarrytown, NY) or, for samples below the lower limit of detection, theCOBAS TaqMan HBV Test (lower limit of detection, 3 � 101 IU/ml; RocheDiagnostics, Branchberg, NJ). HIV RNA was quantified using the Bayer VersantHIV bDNA assay as per the manufacturer’s instructions (lower limit of detec-tion, 50 copies/ml; Bayer HealthCare–Diagnostics).
Liver biopsy specimen assessment. All liver biopsy specimens were examinedby the same two pathologists (St. Vincent’s Hospital, Melbourne, Australia), andthe Metavir histological score for activity and fibrosis was used (3). Liver biopsywas optional.
Statistical analysis. The median decline in HBV DNA and HIV RNA viralloads was assessed and compared between HBeAg-positive and HBeAg-negativegroups with a Wilcoxon rank sign test. Changes in CD4 counts over time wereassessed by Kruskal-Wallis, with Dunn’s posttest. Differences between patient
groups were assessed by a Mann-Whitney U test. To compare the number ofHBeAg-positive and HBeAg-negative patients who had undetectable levels ofHBV DNA after 48 weeks, we used a test of proportions (chi-square). Changesin magnitude and frequency of T-cell responses over time were assessed by ageneralized estimating equation (GEE) and chi-square test for trend in propor-tions, respectively. The specificity of the HBV peptide pool responses was ana-lyzed by two-way analysis of variance (ANOVA) and a Bonferroni posttest. Datawere analyzed using STATA (StataCorp, College Station, TX) and GraphPadPrism, version 5 (GraphPad Software, Inc., San Diego, CA). Statistical signifi-cance was set at a P value of � 0.05.
RESULTS
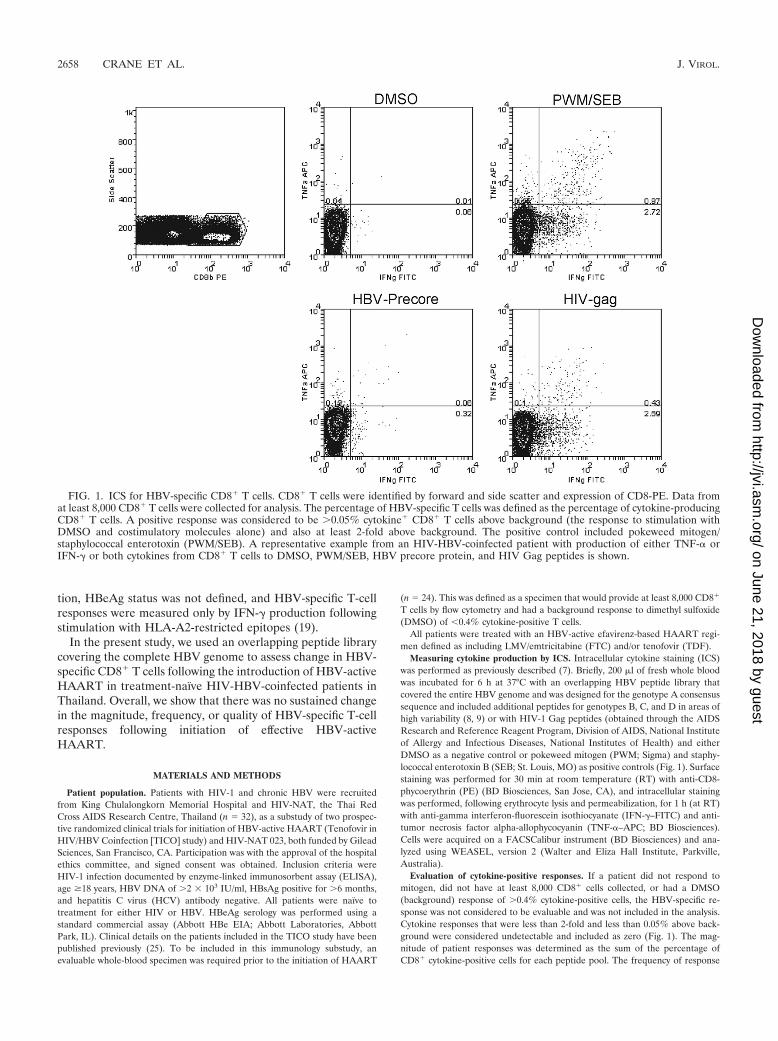
Patient characteristics. Patient demographics prior to initi-ation of HBV-active HAART (n � 24) and following 48 weeksof treatment (n � 22; two patients, one HBeAg positive andone HBeAg negative, did not complete 48 weeks of follow-up)are summarized in Table 1. The patients had advanced HIVinfection with a median (interquartile range [IQR]) CD4 countof 60 (range, 29 to 200) cells/�l and median HIV RNA of 4.8(range, 4.6 to 5.2) log copies/ml. Baseline HBV DNA was 8.5log (range, 7.6 to 8.8 log) IU/ml baseline, and ALT was 39
TABLE 1. Baseline demographics and clinical parameters of patients
ParameterValue for the indicated groupd
All patients HBeAg-negative patients HBeAg-positive patients
No. of patients 24 10 14Gender (no. of males/no. of females) 16/8 8/2 8/6Age (yr) 34 (28–38) 35 (32–46) 31 (28–38)HBeAb positive (no.) 9 9 0ALT before therapy (U/liter) 39 (34–78) 47 (33–84) 39 (30–74)
HBV DNA valuesBefore therapy (log IU/ml) 8.5 (7.6–8.8) 8.1 (3.2–8.6) 8.8 (7.9–8.9)Decline from 0 to 48 wks (log IU/ml) 5.8a (3.4–6.7) 6.6c (2.3–6.8) 5.4c (3.6–6.8)No. of patients with �30 IU/ml at 48 wks/no. of
patients tested (%)12/22 (55) 7/9 (78) 5/13 (39)
HBV genotypes (no. of patients with the genotype/no. of patients tested %)
B 5/23 (22) 2/9 (22) 3/14 (21)C 18/23 (78) 7/9 (78) 11/14 (79)
Liver biopsy specimen dataNo. of specimens 19 7 12A score 1.0 (1.0–1.5) 1.0 (1.0–2.0) 1.0 (0.0–1.4)F score 1.0 (0.0–2.0) 1.0 (0.0–2.0) 0.6 (0.0–2.8)
HIV RNA valuesBefore therapy (log copies/ml) 4.8 (4.6–5.2) 4.8 (4.5–5.1) 4.8 (4.6–5.4)Decline from 0 to 48 weeks (log copies/ml) 3.1a (2.9–3.5) 3.2 (2.9–3.8) 3.0 (2.8–3.5)No. of patients with �50 copies/ml at 48 wks/no.
of patients tested (%)22/22 (100) 9/9 (100) 13/13 (100)
CD4� T-cell count (cells/�l)Before therapy 60 (29–200) 94 (40–215) 45 (26–152)Increase after 48 wks 166b (97–237) 189 (132–277) 138 (58–200)
Treatment (no. of patients)LMV or FTC 10 2 8TDF 4 2 2LMV/TDF or FTC/TDF 10 6 4
a P � 0.001 for changes over time for all patients (Kruskal-Wallis test with a Dunn’s posttest).b P � 0.002 for changes over time for all patients (Kruskal-Wallis test with a Dunn’s posttest).c P � 0.02 for differences between HBeAg-negative and HBeAg-positive patients (Wilcoxon rank sign test).d Data are medians (IQRs), with ranges shown in parentheses, unless otherwise noted.
VOL. 84, 2010 T-CELL RESPONSES IN HIV-HBV COINFECTION 2659
on June 21, 2018 by guesthttp://jvi.asm
.org/D
ownloaded from
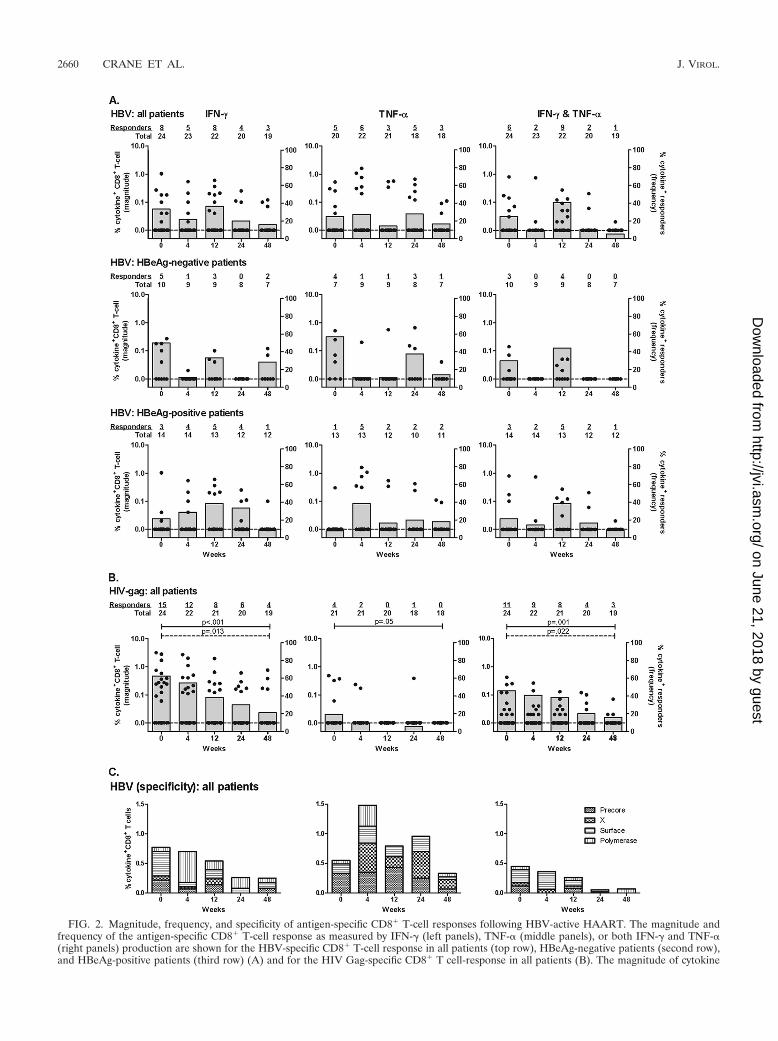
FIG. 2. Magnitude, frequency, and specificity of antigen-specific CD8� T-cell responses following HBV-active HAART. The magnitude andfrequency of the antigen-specific CD8� T-cell response as measured by IFN-� (left panels), TNF-� (middle panels), or both IFN-� and TNF-�(right panels) production are shown for the HBV-specific CD8� T-cell response in all patients (top row), HBeAg-negative patients (second row),and HBeAg-positive patients (third row) (A) and for the HIV Gag-specific CD8� T cell-response in all patients (B). The magnitude of cytokine
2660 CRANE ET AL. J. VIROL.
on June 21, 2018 by guesthttp://jvi.asm
.org/D
ownloaded from
(range, 34 to 78) U/liter. Over half of the cohort was HBeAgpositive (14/24, or 58%). Patients were infected only with ge-notype C (8/23, or 78%; one patient did not have HBV geno-type data available at baseline) and genotype B (5/23, or 22%).Patients had minimal liver disease identified on liver biopsyspecimens (n � 19; median A and F scores were both 1).
As expected, following initiation of HAART, there was asignificant decline in HIV RNA (median [IQR] log declinefrom week 0 to week 48 was 3.1 [range, 2.9 to 3.5] log copies/ml) with no significant difference in HIV RNA declines be-tween HBeAg-positive and HBeAg-negative patients (P �0.32, Wilcoxon rank sign test). All patients had an undetectableHIV RNA (�50 copies/ml) at week 48. CD4� T-cell countsincreased significantly in all patients, with a median increase of166 (range, 97 to 237) cells/�l (P � 0.002, Kruskal-Wallis test)(Table 1).
The median (IQR) decline in HBV DNA from week 0 toweek 48 was 5.8 log (range, 3.4 to 6.7) IU/ml. The median logdecline in HBV DNA for HBeAg-positive and HBeAg-nega-tive patients was 5.4 (range, 3.6 to 6.8) log IU/ml and 6.6(range, 2.3 to 6.8) log IU/ml, respectively (P � 0.02, Wilcoxonrank sign test) (Table 1). Twelve of 22 (55%) patients had anundetectable HBV DNA level (�30 IU/ml) at week 48. Atbaseline, HBV DNA was lower in HBeAg-negative individualsthan in HBeAg-positive individuals but the difference did notreach statistical significance (P � 0.07, Mann-Whitney U test).More HBeAg-negative patients than HBeAg-positive patientshad undetectable HBV DNA at 48 weeks (7/9 and 5/13, re-spectively; P � 0.07, chi-squared test).
ALT levels did not significantly change over time (data notshown). Two patients had a hepatic flare, defined as an in-crease in ALT of �200 U/liter from baseline or more than fivetimes the upper limit of normal of ALT (see Fig. 3B). One ofthese patients died at week 12 secondary to hepatic flare.
Effects of treatment on HBV-specific T-cell responses. (i)Frequency and magnitude of responses. Production of IFN-�and/or TNF-� in CD8� T cells was measured by ICS pretreat-ment (week 0) and at weeks 4, 12, 24, and 48 following treat-ment initiation. Of the 32 patients initially enrolled in thestudy, 75% (n � 24) had measurable IFN-�-positive (IFN-��)or TNF-�-positive (TNF-��) (single) CD8� T-cell responsesand/or IFN-�� and TNF-�� (dual) CD8� T-cell responses atbaseline and at least one additional ICS measurement over thestudy period. Patients excluded from this analysis (n � 8) didnot have an evaluable sample at baseline because either therewere too few CD8� T cells available for analysis (n � 5) or nosample was available (n � 3). Prior to initiation of HBV-activeHAART, 33% (8/24; IFN-��) and 25% (5/20; TNF-��) had adetectable CD8� T-cell response to at least one HBV peptidepool (Fig. 2A). Responses were detected to all peptide poolswithout any clearly dominant pool. There was no significantdifference between the numbers of individuals who had a re-
sponse to each pool or the magnitude of the responses to eachpool at each time point (two-way ANOVA and Bonferroniposttest) (Fig. 2C). Following initiation of HBV-activeHAART, the number of patients who had a detectable IFN-��
cytokine response to at least one peptide pool was 22%, 36%,20%, and 16% at week 4, 12, 24, and 48, respectively (Fig. 2A).The number of patients with a detectable HBV-specificTNF-�� response was 27%, 14%, 28%, and 17% at week 4, 12,24, and 48, respectively (Fig. 2A). There were no significantchanges in the frequency of HBV-specific CD8� T-cell re-sponses over time (IFN-��, P � 0.21; TNF-��, P � 0.61;chi-square test for frequency of proportions). In addition,there was no significant change in the frequency of HBV-specific T cells when HBeAg-positive and HBeAg-negativepatients were assessed separately (Fig. 2A). The findings weresimilar when the magnitude of the HBV-specific response wasevaluated (Fig. 2A).
CD8� T-cell responses to HIV Gag peptides were includedas a positive control in each assay. As expected, we observed asignificant decline in the frequency of HIV-specific CD8� T-cell responses over time (IFN-��, P � 0.001; TNF-��, P �0.05; chi-square test for frequency of proportions) (Fig. 2B)and magnitude of IFN-�� CD8� T-cell HIV Gag-specific re-sponses over time but not TNF-�� responses (IFN-��, P �0.013; TNF-��, P � 0.09; GEE) (Fig. 2B).
Quality of responses. Given that functional antiviral T cellsare associated with production of more than one antiviral cy-tokine (2, 4), we also assessed the capacity of HBV-specificCD8� T cells to produce both cytokines (i.e., both IFN-�� andTNF-��) following HBV-active HAART. Prior to initiation ofHBV-active HAART, 6/24 (25%) had a detectable IFN-��
TNF-�� CD8� T-cell response to at least one HBV peptidepool (Fig. 2A). There were no significant changes in the fre-quency of HBV-specific IFN-�� TNF-�� CD8� T-cell re-sponses over time (P � 0.11, chi-square test for frequency ofproportions) or magnitude (P � 0.13, GEE). However, asexpected, we observed a significant decline in the frequency ofHIV-specific IFN-�� TNF-�� CD8� T-cell responses overtime (P � 0.001, chi-square test for frequency of proportions)and magnitude (P � 0.022, GEE) (Fig. 2B).
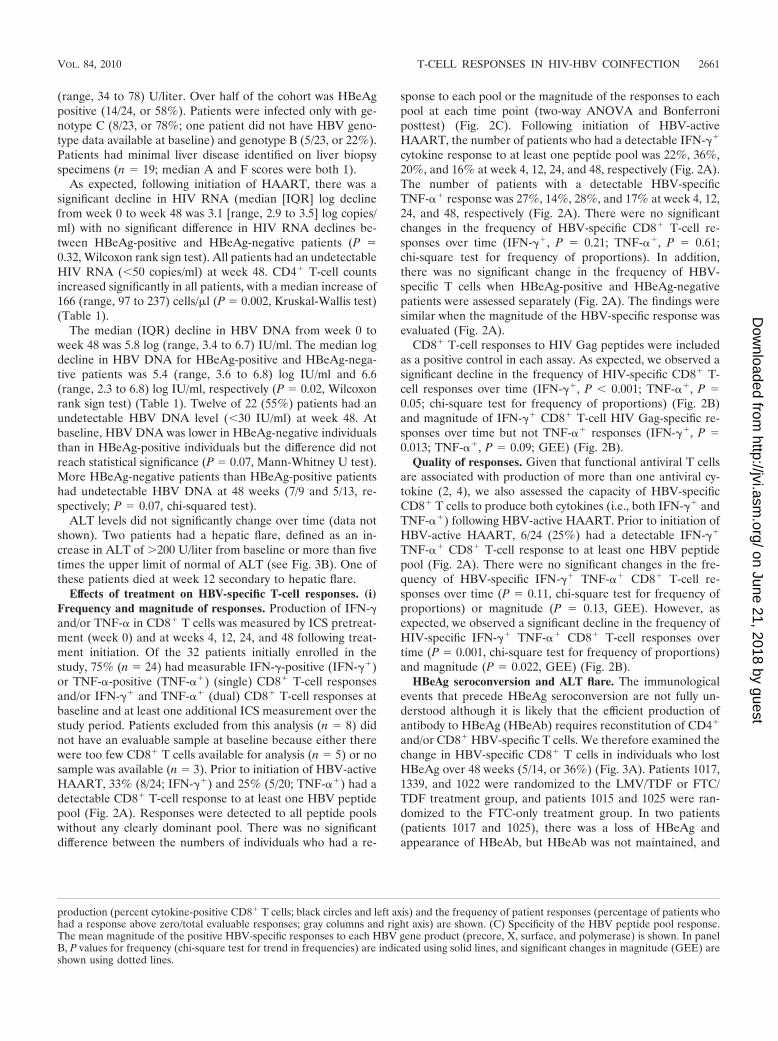
HBeAg seroconversion and ALT flare. The immunologicalevents that precede HBeAg seroconversion are not fully un-derstood although it is likely that the efficient production ofantibody to HBeAg (HBeAb) requires reconstitution of CD4�
and/or CD8� HBV-specific T cells. We therefore examined thechange in HBV-specific CD8� T cells in individuals who lostHBeAg over 48 weeks (5/14, or 36%) (Fig. 3A). Patients 1017,1339, and 1022 were randomized to the LMV/TDF or FTC/TDF treatment group, and patients 1015 and 1025 were ran-domized to the FTC-only treatment group. In two patients(patients 1017 and 1025), there was a loss of HBeAg andappearance of HBeAb, but HBeAb was not maintained, and
production (percent cytokine-positive CD8� T cells; black circles and left axis) and the frequency of patient responses (percentage of patients whohad a response above zero/total evaluable responses; gray columns and right axis) are shown. (C) Specificity of the HBV peptide pool response.The mean magnitude of the positive HBV-specific responses to each HBV gene product (precore, X, surface, and polymerase) is shown. In panelB, P values for frequency (chi-square test for trend in frequencies) are indicated using solid lines, and significant changes in magnitude (GEE) areshown using dotted lines.
VOL. 84, 2010 T-CELL RESPONSES IN HIV-HBV COINFECTION 2661
on June 21, 2018 by guesthttp://jvi.asm
.org/D
ownloaded from
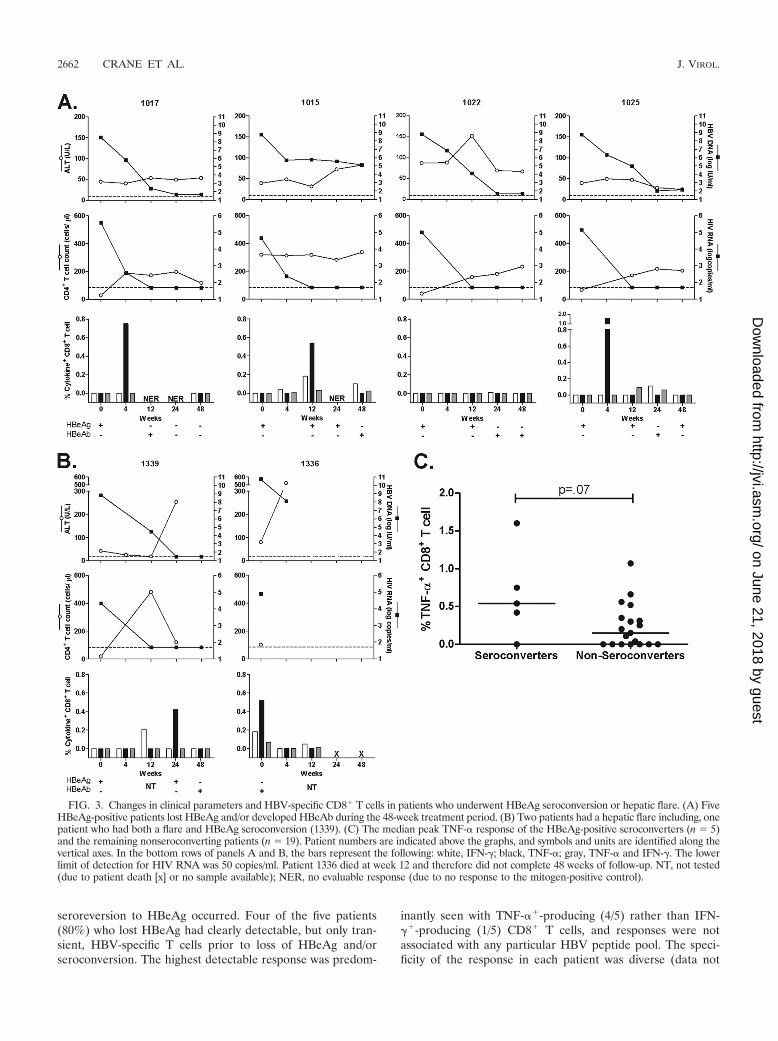
seroreversion to HBeAg occurred. Four of the five patients(80%) who lost HBeAg had clearly detectable, but only tran-sient, HBV-specific T cells prior to loss of HBeAg and/orseroconversion. The highest detectable response was predom-
inantly seen with TNF-��-producing (4/5) rather than IFN-��-producing (1/5) CD8� T cells, and responses were notassociated with any particular HBV peptide pool. The speci-ficity of the response in each patient was diverse (data not
FIG. 3. Changes in clinical parameters and HBV-specific CD8� T cells in patients who underwent HBeAg seroconversion or hepatic flare. (A) FiveHBeAg-positive patients lost HBeAg and/or developed HBeAb during the 48-week treatment period. (B) Two patients had a hepatic flare including, onepatient who had both a flare and HBeAg seroconversion (1339). (C) The median peak TNF-� response of the HBeAg-positive seroconverters (n � 5)and the remaining nonseroconverting patients (n � 19). Patient numbers are indicated above the graphs, and symbols and units are identified along thevertical axes. In the bottom rows of panels A and B, the bars represent the following: white, IFN-�; black, TNF-�; gray, TNF-� and IFN-�. The lowerlimit of detection for HIV RNA was 50 copies/ml. Patient 1336 died at week 12 and therefore did not complete 48 weeks of follow-up. NT, not tested(due to patient death [x] or no sample available); NER, no evaluable response (due to no response to the mitogen-positive control).
2662 CRANE ET AL. J. VIROL.
on June 21, 2018 by guesthttp://jvi.asm
.org/D
ownloaded from
shown), with maximal response to peptides from the X (patient1017 and 1339), precore (1015 and 1025), and surface (1022)proteins. None of the five patients who lost HBeAg had adetectable HBV-specific T-cell response prior to treatment.The maximum magnitude of the HBV-specific response at anytime after treatment was higher in the HBeAg-positive patientswho seroconverted (n � 5) than in the rest of the cohort (n �19), but this difference did not reach statistical significance(P � 0.07) (Fig. 3C).
As hepatic flare is thought to be secondary to infiltration ofboth HBV-specific and non-HBV-specific T cells and/or theproduction of proinflammatory cytokines, we also examinedthe frequency of circulating HBV-specific T cells in the limitednumber of patients with hepatic flare (n � 2). One individual(1339) (Fig. 3B) had a significant increase in ALT and, asdescribed above, clear but transiently detected HBV-specificTNF-�� CD8� T cells in the weeks prior to HBeAg serocon-version. This patient had only mild liver disease (necroinflam-matory score [A] of 1; fibrosis score [F] of 1) at baseline. Thispatient also had a detectable IFN-� response at the time ofALT flare. The other patient (1336) with hepatic flare diedfrom hepatic decompensation. There was a clearly detectableTNF-� response in the weeks prior to flare. This patient didnot consent to a liver biopsy.
DISCUSSION
This is the first report of a prospective, comprehensive lon-gitudinal study of HBV-specific T cells following initiation ofHBV-active HAART in HIV-1–HBV-coinfected individuals.Overall there was no significant increase in HBV-specificCD8� T-cell responses over time following initiation of HBV-active HAART. The incidence of HBeAg seroconversion washigh (36%), and in nearly all cases, we could detect an HBV-specific T-cell response prior to seroconversion although thiswas only transient.
Recovery of HBV-specific T-cell responses has been previ-ously described following treatment of HBV monoinfectionwith LMV and adefovir. In these studies, HBV-specific T-cellresponses increased initially and then returned to pretreatmentlevels within the first 24 weeks of treatment (5, 14, 20). Otherstudies have shown that HBV-specific T-cell responses in-crease again soon after HBV DNA rebound (14, 29), suggest-ing that there is a role for sustained antigenic stimulation indetection of HBV-specific responses. We found that there wasno change in the frequency or magnitude of HBV-specificCD8� T cells following HBV-active HAART. One explanationmay have been that we missed any transient recovery; however,we evaluated HBV-specific responses at similar frequencies toprevious studies of HBV monoinfection (5, 14, 20). It is pos-sible that reconstitution of HBV-specific T-cell responses mayrequire a longer time in the setting of HIV-HBV coinfectionthan in HBV monoinfection, and therefore more prolongedfollow-up of this patient cohort may be of interest. An alter-native explanation is that patients in our cohort were unable togenerate an efficient antigen response secondary to advancedHIV infection (median CD4 count, 60 cells/�l). However,these patients could clearly generate a response to HIV Gagpeptides as well as a mitogen (data not shown). Finally, an-other explanation may be that HBV-specific T cells may traffic
to the liver following initiation of HAART and immune recon-stitution and are therefore not detected in blood. We haverecently shown that untreated HIV-HBV-coinfected patientsexpress high levels of CXCL-10 (10), the principal chemokineinvolved in trafficking of CXCR3� T cells to the liver in otherinfections such as HCV (16).
We observed a significant decline in HIV-specific responseson HAART, as previously reported. This is generally thoughtto occur secondary to a decline in antigenic stimulus (1, 17).Therefore, it is possible that one might expect HBV-specificT-cell responses also to decline following effective treatment;however, we found no change in the HBV-specific T-cell re-sponse despite significant declines in HBV DNA levels. Thismay have several explanations. First, although the median de-cline in HBV DNA from week 0 to week 48 was 5.8 logs, only55% of patients had an HBV DNA of �30 IU/ml at week 48,in contrast to 100% of patients having an HIV RNA of �50copies/ml. However, even when we compared patients who haddetectable HBV DNA to those who cleared HBV DNA by 48weeks, we found no differences in HBV-specific T-cell re-sponses (data not shown). Second, in contrast to HIV, follow-ing treatment of HBV infection and despite significant reduc-tions in HBV DNA levels, there was little change in levels ofcirculating HBV proteins, namely, HBsAg (6, 26). We per-formed quantitative HBsAg (qHBsAg) analysis on a subset ofpatients (n � 12), and while there was a decrease in qHBsAglevels following treatment, the levels overall remained veryhigh even at 48 weeks (data not shown). This is in agreementwith previous reports of a minimal decline in HBsAg followingnucleoside analogue treatment in both HBV monoinfectionand HIV-HBV coinfection (6, 26, 34). The persistence ofHBsAg, despite treatment, may be a consequence of limitedrecovery of HBV-specific T cells or, alternatively, may lead toongoing immune exhaustion and therefore suppress an effec-tive immune response (22, 30).
The immune events precipitating HBeAg seroconversion arestill poorly understood even though seroconversion is an im-portant endpoint of treatment. Spontaneous HBeAg serocon-version occurs at greater frequency in certain HBV genotypes,namely, B and C (27), and is more common in individuals withALT levels more than two to five times the upper limit ofnormal (ULN) prior to treatment (11, 21, 37). In addition,HBeAg seroconversion has been associated with a lower HBVDNA level (21) and an increase in T-cell proliferation in vitroin response to core protein and HBeAg (36) at the time ofALT flare, as well as a fall in quantitative HBeAg, at leastduring pegylated interferon therapy (13). Recently, it has beendemonstrated that the expression of the T-cell exhaustionmarker PD-1 on total CD8� T cells significantly declined inpatients who had treatment-induced HBeAg seroconversion(11). Therefore, it is feasible that a reduction in HBV-relatedantigenic stimuli may reduce T-cell tolerance and exhaustionand lead to a more efficient HBV-specific immune response.Together with HAART-induced recovery of CD4� T cells, thismay potentially lead to higher rates of HBeAg and/or HBsAgseroconversion. We detected HBV-specific CD8� T cells in themajority of individuals prior to HBeAg seroconversion al-though detection of these cells was only transient. This studywas not adequately powered to determine if the magnitude ofHBV-specific T cells differed in HBeAg-positive patients who
VOL. 84, 2010 T-CELL RESPONSES IN HIV-HBV COINFECTION 2663
on June 21, 2018 by guesthttp://jvi.asm
.org/D
ownloaded from
seroconverted from levels in those that did not seroconvert.Therefore, this study needs to be repeated in a larger cohort todetermine if the detection of an increase in HBV-specific Tcells is significantly associated with, or predictive of, durableHBeAg seroconversion. In addition, it would be important toalso assess the HBV-specific CD4� T-cell response in thissetting.
This study had several limitations. First, we were unfortu-nately unable to measure HBV-specific CD4� T-cell responsesprior to or following treatment, given the low median CD4�
T-cell count at the time of treatment initiation in this cohort.Understanding the changes in HBV-specific CD4� T cells maybe critical to our interpretation of HBV-specific CD8� T-cellkinetics and development of antibodies to either HBeAg orHBsAg. Second, we were able to measure the production ofIFN-� and TNF-� only from HBV-specific T cells because wehad access only to a four-color flow cytometer in Thailand. Weselected these two cytokines, in preference to others such asinterleukin-2 (IL-2) and IL-10, because our previous study ofHBV monoinfected patients identified IFN-� and TNF-� asbeing produced in greater magnitude and frequency than ei-ther IL-2 or IL-10 in HBV-specific CD8� T cells in the bloodand liver (8). In addition, both IFN-� and TNF-� have beendemonstrated to be important in the cytolytic and noncytolyticclearance of HBV (15). It is possible that recovery of HBV-specific cytokines other than IFN-� and TNF-� may occurfollowing HBV-active HAART. For example, the productionof other cytokines such as IL-17, IL-2, RANTES, and CD107amay be important and should be examined in future studies.Finally, it would also be important to analyze changes in theintrahepatic compartment following initiation of HBV-activeHAART. Newer techniques such as fine-needle aspiration ofthe liver may allow such studies in the future (33).
In this prospective clinical trial of initiation of HBV-activeHAART in HIV-HBV coinfection in an Asian population,there was little change in the frequency or magnitude of HBV-specific T cells, despite good control of HBV DNA replicationand significant recovery of total CD4� T cells after 48 weeks.These findings may have implications for the duration of treat-ment of HBV in HIV-HBV-coinfected individuals, given thatHBeAg seroconversion is an important endpoint of treatment.Longer follow-up is required to determine if the absence ofrecovery of HBV-specific T cells following initiation of HBV-active HAART is associated with clinical outcomes such asliver disease progression and durability of HBeAg and HBsAgseroconversion.
ACKNOWLEDGMENTS
This study was funded by the National Institutes of Health (NIHR21 AI055379-01) and Gilead Sciences. S.R.L. is supported by theAlfred Foundation and is a National Health and Medicine ResearchCouncil Practitioner Fellow (grant 251651).
K.R. has recently received research grants/funding, honoraria, orhas been a consultant or advisor to, or received lecture sponsorshipsfrom Abbott, Boehringer-Ingelheim, Bristol-Myers-Squibb, Gilead,GlaxoSmithKline, Hoffmann-LaRoche, Janssen-Cilag, Merck Sharpe& Dolme, Tibotec and Virco. S.R.L. has received research grants/funding from Roche, Bristol-Myers-Squibb, Gilead, and Pfizer.
We thank Tim Spelman for his expert statistical advice, Pip Marksfor study coordination, and the patients for their participation in thisstudy.
REFERENCES
1. Alatrakchi, N., C. Duvivier, D. Costagliola, A. Samri, A. G. Marcelin, G.Kamkamidze, M. Astriti, R. Agher, V. Calvez, B. Autran, and C. Katlama.2005. Persistent low viral load on antiretroviral therapy is associated with Tcell-mediated control of HIV replication. AIDS 19:25–33.
2. Appay, V., D. C. Douek, and D. A. Price. 2008. CD8� T cell efficacy invaccination and disease. Nat. Med. 14:623–628.
3. Bedossa, P., and T. Poynard. 1996. An algorithm for the grading of activityin chronic hepatitis C. The METAVIR Cooperative Study Group. Hepatol-ogy 24:289–293.
4. Betts, M. R., M. C. Nason, S. M. West, S. C. De Rosa, S. A. Migueles, J.Abraham, M. M. Lederman, J. M. Benito, P. A. Goepfert, M. Connors, M.Roederer, and R. A. Koup. 2006. HIV nonprogressors preferentially main-tain highly functional HIV-specific CD8� T cells. Blood 107:4781–4789.
5. Boni, C., A. Penna, A. Bertoletti, V. Lamonaca, I. Rapti, G. Missale, M. Pilli,S. Urbani, A. Cavalli, S. Cerioni, R. Panebianco, J. Jenkins, and C. Ferrari.2003. Transient restoration of anti-viral T cell responses induced by lamivu-dine therapy in chronic hepatitis B. J. Hepatol. 39:595–605.
6. Brunetto, M. R., F. Moriconi, F. Bonino, G. K. Lau, P. Farci, C. Yurdaydin,T. Piratvisuth, K. Luo, Y. Wang, S. Hadziyannis, E. Wolf, P. McCloud, R.Batrla, and P. Marcellin. 2009. Hepatitis B virus surface antigen levels: aguide to sustained response to peginterferon alfa-2a in HBeAg-negativechronic hepatitis B. Hepatology 49:1141–1150.
7. Chang, J. J., S. Sirivichayakul, A. Avihingsanon, A. J. Thompson, P. Revill,D. Iser, J. Slavin, S. Buranapraditkun, P. Marks, G. Matthews, D. A. Coo-per, S. J. Kent, P. U. Cameron, J. Sasadeusz, P. Desmond, S. Locarnini, G. J.Dore, K. Ruxrungtham, and S. R. Lewin. 2009. Impaired quality of thehepatitis B virus (HBV)-specific T-cell response in human immunodeficiencyvirus type 1-HBV coinfection. J. Virol. 83:7649–7658.
8. Chang, J. J., A. J. Thompson, K. Visvanathan, S. J. Kent, P. U. Cameron, F.Wightman, P. Desmond, S. A. Locarnini, and S. R. Lewin. 2007. The phe-notype of hepatitis B virus-specific T cells differs in the liver and blood inchronic hepatitis B virus infection. Hepatology 46:1332–1340.
9. Chang, J. J., F. Wightman, A. Bartholomeusz, A. Ayres, S. J. Kent, J.Sasadeusz, and S. R. Lewin. 2005. Reduced hepatitis B virus (HBV)-specificCD4� T-cell responses in human immunodeficiency virus type 1-HBV-coin-fected individuals receiving HBV-active antiretroviral therapy. J. Virol. 79:3038–3051.
10. Crane, M., B. Oliver, G. Matthews, A. Avihingsanon, S. Ubolyam, V. Mark-ovska, J. J. Chang, G. J. Dore, P. Price, K. Visvanathan, M. French, K.Ruxrungtham, and S. R. Lewin. 2009. Immunopathogenesis of hepatic flarein HIV/hepatitis B virus (HBV)-coinfected individuals after the initiation ofHBV-active antiretroviral therapy. J. Infect. Dis. 199:974–981.
11. Evans, A., A. Riva, H. Cooksley, S. Phillips, S. Puranik, A. Nathwani, S.Brett, S. Chokshi, and N. V. Naoumov. 2008. Programmed death 1 expres-sion during antiviral treatment of chronic hepatitis B: impact of hepatitis Be-antigen seroconversion. Hepatology 48:759–769.
12. Fattovich, G. 2003. Natural history of hepatitis B. J. Hepatol. 39(Suppl.1):S50–S58.
13. Fried, M. W., T. Piratvisuth, G. K. Lau, P. Marcellin, W. C. Chow, G.Cooksley, K. X. Luo, S. W. Paik, Y. F. Liaw, P. Button, and M. Popescu. 2008.HBeAg and hepatitis B virus DNA as outcome predictors during therapywith peginterferon alfa-2a for HBeAg-positive chronic hepatitis B. Hepatol-ogy 47:428–434.
14. Gotto, J., G. J. Webster, D. Brown, J. Jenkins, G. M. Dusheiko, and A.Bertoletti. 2006. The impact of HBV-DNA fluctuations on virus-specificCD8� T cells in HBeAg� chronic hepatitis B patients treated with a steroidand lamivudine. J. Viral Hepat. 13:415–425.
15. Guidotti, L. G., T. Ishikawa, M. V. Hobbs, B. Matzke, R. Schreiber, and F. V.Chisari. 1996. Intracellular inactivation of the hepatitis B virus by cytotoxicT lymphocytes. Immunity 4:25–36.
16. Helbig, K. J., A. Ruszkiewicz, L. Semendric, H. A. Harley, S. R. McColl, andM. R. Beard. 2004. Expression of the CXCR3 ligand I-TAC by hepatocytesin chronic hepatitis C and its correlation with hepatic inflammation. Hepa-tology 39:1220–1229.
17. Kalams, S. A., P. J. Goulder, A. K. Shea, N. G. Jones, A. K. Trocha, G. S.Ogg, and B. D. Walker. 1999. Levels of human immunodeficiency virus type1-specific cytotoxic T-lymphocyte effector and memory responses declineafter suppression of viremia with highly active antiretroviral therapy. J. Virol.73:6721–6728.
18. Kondo, Y., S. Asabe, K. Kobayashi, M. Shiina, H. Niitsuma, Y. Ueno, T.Kobayashi, and T. Shimosegawa. 2004. Recovery of functional cytotoxic Tlymphocytes during lamivudine therapy by acquiring multi-specificity.J. Med. Virol. 74:425–433.
19. Lascar, R. M., R. J. Gilson, A. R. Lopes, A. Bertoletti, and M. K. Maini.2003. Reconstitution of hepatitis B virus (HBV)-specific T cell responseswith treatment of human immunodeficiency virus/HBV coinfection. J. Infect.Dis. 188:1815–1819.
20. Lau, G. K., H. Cooksley, R. M. Ribeiro, K. A. Powers, E. Shudo, S. Bowden,C. K. Hui, J. Anderson, J. Sorbel, E. Mondou, F. Rousseau, S. Lewin, A. S.Perelson, S. Locornini, and N. V. Naoumov. 2007. Impact of early viral
2664 CRANE ET AL. J. VIROL.
on June 21, 2018 by guesthttp://jvi.asm
.org/D
ownloaded from
kinetics on T-cell reactivity during antiviral therapy in chronic hepatitis B.Antivir. Ther. 12:705–718.
21. Liaw, Y. F., E. Gane, N. Leung, S. Zeuzem, Y. Wang, C. L. Lai, E. J.Heathcote, M. Manns, N. Bzowej, J. Niu, S. H. Han, S. G. Hwang, Y.Cakaloglu, M. J. Tong, G. Papatheodoridis, Y. Chen, N. A. Brown, E. Alba-nis, K. Galil, and N. V. Naoumov. 2009. 2-Year GLOBE trial results: telbi-vudine is superior to lamivudine in patients with chronic hepatitis B. Gas-troenterology 136:486–495.
22. Loirat, D., M. Mancini-Bourgine, J. P. Abastado, and M. L. Michel. 2003.HBsAg/HLA-A2 transgenic mice: a model for T cell tolerance to hepatitis Bsurface antigen in chronic hepatitis B virus infection. Int. Immunol. 15:1125–1136.
23. Lok, A. S., and B. J. McMahon. 2007. Chronic hepatitis B. Hepatology45:507–539.
24. Maini, M. K., C. Boni, C. K. Lee, J. R. Larrubia, S. Reignat, G. S. Ogg, A. S.King, J. Herberg, R. Gilson, A. Alisa, R. Williams, D. Vergani, N. V. Naou-mov, C. Ferrari, and A. Bertoletti. 2000. The role of virus-specific CD8(�)cells in liver damage and viral control during persistent hepatitis B virusinfection. J. Exp. Med. 191:1269–1280.
25. Matthews, G. V., E. Seaberg, G. J. Dore, S. Bowden, S. R. Lewin, J. Sasa-deusz, P. Marks, Z. Goodman, F. H. Philp, Y. Tang, S. Locarnini, and C. L.Thio. 2009. Combination HBV therapy is linked to greater HBV DNAsuppression in a cohort of lamivudine-experienced HIV/HBV coinfectedindividuals. AIDS 23:1707–1715.
26. Moucari, R., V. Mackiewicz, O. Lada, M. P. Ripault, C. Castelnau, M.Martinot-Peignoux, A. Dauvergne, T. Asselah, N. Boyer, P. Bedossa, D.Valla, M. Vidaud, M. H. Nicolas-Chanoine, and P. Marcellin. 2009. Earlyserum HBsAg drop: a strong predictor of sustained virological response topegylated interferon alfa-2a in HBeAg-negative patients. Hepatology 49:1151–1157.
27. Orito, E., M. Mizokami, H. Sakugawa, K. Michitaka, K. Ishikawa, T. Ichida,T. Okanoue, H. Yotsuyanagi, and S. Iino. 2001. A case-control study forclinical and molecular biological differences between hepatitis B viruses ofgenotypes B and C. Japan HBV Genotype Research Group. Hepatology33:218–223.
28. Panel on Antiretroviral Guidelines for Adults and Adolescents. 3 November2008, posting date. Guidelines for the use of antiretroviral agents in HIV-1-infected adults and adolescents. Department of Health and Human Ser-
vices, National Institutes of Health, Bethesda, MD. http://www.aidsinfo.nih.gov/ContentFiles/AdultandAdolescentGL.pdf.
29. Rehermann, B., P. Fowler, J. Sidney, J. Person, A. Redeker, M. Brown, B.Moss, A. Sette, and F. V. Chisari. 1995. The cytotoxic T lymphocyte responseto multiple hepatitis B virus polymerase epitopes during and after acute viralhepatitis. J. Exp. Med. 181:1047–1058.
30. Reignat, S., G. J. Webster, D. Brown, G. S. Ogg, A. King, S. L. Seneviratne,G. Dusheiko, R. Williams, M. K. Maini, and A. Bertoletti. 2002. Escapinghigh viral load exhaustion: CD8 cells with altered tetramer binding in chronichepatitis B virus infection. J. Exp. Med. 195:1089–1101.
31. Rosenthal, E., D. Salmon-Ceron, C. Lewden, V. Bouteloup, G. Pialoux, F.Bonnet, M. Karmochkine, T. May, M. Francois, C. Burty, E. Jougla, D.Costagliola, P. Morlat, G. Chene, and P. Cacoub. 2009. Liver-related deathsin HIV-infected patients between 1995 and 2005 in the French GERMIVICJoint Study Group Network (Mortavic 2005 Study in collaboration with theMortalite 2005 survey, ANRS EN19). HIV Med. 10:282–289.
32. Tang, T. J., R. A. de Man, J. G. Kusters, J. Kwekkeboom, W. C. Hop, R. G.van der Molen, S. W. Schalm, and H. L. Janssen. 2004. Intrahepatic CD8T-lymphocytes and HBV core expression in relation to response to antiviraltherapy for chronic hepatitis B patients. J. Med. Virol. 72:215–222.
33. Tang, T. J., H. L. Janssen, J. G. Kusters, R. A. de Man, S. W. Schalm, andJ. Kwekkeboom. 2003. The intrahepatic immune response during chronichepatitis B infection can be monitored by the fine-needle aspiration biopsytechnique. FEMS Immunol. Med. Microbiol. 39:69–72.
34. Thibault, V., C. Aubron-Olivier, H. Agut, and C. Katlama. 2002. Primaryinfection with a lamivudine-resistant hepatitis B virus. AIDS 16:131–133.
35. Thio, C. L., E. C. Seaberg, R. Skolasky, Jr., J. Phair, B. Visscher, A. Munoz,and D. L. Thomas. 2002. HIV-1, hepatitis B virus, and risk of liver-relatedmortality in the Multicenter Cohort Study (MACS). Lancet 360:1921–1926.
36. Tsai, S. L., P. J. Chen, M. Y. Lai, P. M. Yang, J. L. Sung, J. H. Huang, L. H.Hwang, T. H. Chang, and D. S. Chen. 1992. Acute exacerbations of chronictype B hepatitis are accompanied by increased T cell responses to hepatitisB core and e antigens. Implications for hepatitis B e antigen seroconversion.J. Clin. Invest. 89:87–96.
37. Tseng, T. C., C. J. Liu, C. C. Wang, P. J. Chen, M. Y. Lai, J. H. Kao, and D. S.Chen. 2008. A higher alanine aminotransferase level correlates with earlierhepatitis B e antigen seroconversion in lamivudine-treated chronic hepatitisB patients. Liver Int. 28:1034–1041.
VOL. 84, 2010 T-CELL RESPONSES IN HIV-HBV COINFECTION 2665
on June 21, 2018 by guesthttp://jvi.asm
.org/D
ownloaded from