Embed Size (px)
Citation preview

PARAMETERIZATION OF THE VERTICAL VARIABILITY OF TROPICAL CIRRUS I
CLOUD MICROPHYSICAL AND OPTICAL PROPERTIES
FINAL REPORT (NASA Grant No. NAGS-1 1618)
February 20,2004
Hermann E. Gerber Gerber Scientific Inc.
1643, Bentana Way, Reston, VA 20190

ABSTRACT
Cloud Integrating Nephelometers (CIN) were flown on the U. North Dakota Citation aircraft and the NASA WB-57 aircraft for the purpose of measuring in-situ the optical extinction coefficient and the asymmetry parameter (9) at a wavelength of 635 nm of primarily ice particles encountered during the NASA CRYSTAL-FACE study of large cumulus clouds (Cu) and their anvils found in the southern Florida region. The probes’ performance was largely successful and produced archived data for vertical profiles of extinction, asymmetry parameter, and effective radius (Re), the latter being obtained by combining CIN and CVI (total water; Oregon State U.) measurements. Composites of the CIN and CVI data describing the average microphysical and optical behavior of the Cu and their anvils showed the following: The extinction increases with height as a result of the size of the particles also decreasing with height as shown by the Re measurements; near the top of anvils the size of the primary ice particles is about 10-um radius; and the value of g does not vary significantly with height and has a mean value of about 0.73 consistent with the idea that ambient ice crystals are primarily of complex shape and reflect solar radiation more efficiently than particles of pristine crystal shape. Other observations include: The g measurements were found to be an indicator of the phase of the cloud permitting identification of the clouds with water droplets, rain, and ice; visual ranges as small as several tens of meters were occasionally found in “extinction cores” that coincided with strong updraft cores; and comparison of the cloud probes on the Citation showed significant disagreement.
2

CONTENTS
Abstract Contents 1. Introduction 2. Work done by P.I.
2.1 Pre C-F science team meeting 2.2 Integration of CIN on Citation and WB-57 2.3 C-F field experiment 2.4 Post C-F data analysis 2.5 Post C-F science meeting
3. Results 4. Publications 5. APPENDIX A - P.I. travel 6. APPENDIX B - Laser light trap 7. APPENDIX C - CIN calibration 8. ADDENDIX D - Science team presentation
2 3 4 4 4 4 5 5 6 6 7 7
9 11
a
3

1. Introduction
As one member of the original proposal (P.1.s; Heymsfield, Twohy, Gerber), this P.I. was responsible for deploying a Cloud Integrating Nephelometer (CIN) on the N. Dakota Citation aircraft. This probe has the capability of measuring in-situ the cloud extinction coefficient at a wavelength of 635 nm, and the asymmetry parameter of the cloud particles. It responds to particles ranging from about 5-um to 2500-um diameter, and does so independently of the particle composition and shape. A further responsibility was to act as Co- PI with Dr. Timothy Garrett ( U. of Utah) for the deployment of a second CIN on the NASA WB- 57.
The purpose of these deployments was to participate in the NASA CRYSTAL-FACE (C- F) field experiment on Florida Cb and their anvils. This effort involved the following phases: pre-experiment science team planning meeting, instrumentation interfacing with aircraft, participation in the experiment, post experiment C-F presentations meeting, data analysis, and reporting of results. The following describes the performance of the present P.I. for each of these phases.
2. Work Done by P.I.
2.7 Pre C-F science team meeting
The post experiment science team meeting at Greenbelt, MD was attended (see APPENDIX A for travel made by the P.I.) for orientation, planning, and discussions including instrumentation installation, data protocol, and scientific issues and goals.
2.2 Integration of CIN on Citation and WE-57
Instructions and drawings were prepared for Michael Poellot of the University of North Dakota (U.N.D.) for the purpose of installing the CIN on the Citation aircraft. This included output cable interfacing, mounting plate configuration, power requirements, and laser safety. The CIN was sent to U.N.D. several months prior to C-F to permit its installation and for some test flights. This interfacing of the CIN proceeded without any problems.
The interfacing of the U. of Utah (T. Garrett) CIN on the NASA WB-57 occurred at Ellington AFB in Houston. It was necessary for the present P.I. to travel to Ellington to assist in this process. This interfacing was a complex affair, given that mounting places for the CIN were changed several times requiring extra effort. In addition, the NASA individuals responsible for mounting probes on the WB-57 were not satisfied with the venting of the laser beam of the CIN to the atmosphere, given their eye-safety concerns. This concern existed, even-though the laser was eye-safe beyond two feet from the CIN, and NASA’s internal safety review group gave the as-is CIN deployment a green light.
In order to alleviate the CIN laser eye-safety concern an attempt was made to develop on short notice a light trap for the CIN laser beam in order to prevent any laser light from passing into the surrounding atmosphere. With kind design suggestions from C-F colleagues l l u l l l LIIc w l l l v c l ~ ~ l y UI ~ ~ u ~ a d o , this P.1. aeveiopea ana had fabricated a light trap (see APPENDIX 6) that was added to U. Of Utah CIN. This addition was in place for the WB-57 irern ,k I In:..r.r..:&.. -L --I---
4

flights during C-F, and it proved to be successful in enhancing safety and while not disrupting probe performance.
2.3 C-F field experiment
The CIN on the Citation operated without interruption on all the F-C flights. Initial data reduction commenced on the data produced by this CIN. In this regard, a software program was written to linearly extrapolate in-cloud CIN offsets for each data point in each of the 4 channels. The extrapolation was based on offsets measured during out-of-cloud flight segments which totaled as many as 60 on each flight. Preliminary data (extinction coefficient, asymmetry parameter) were entered into the NASA Ames C-F archive. Combination of the extinction data (proportional to the total projected particle surface area) with the total water content measured by the CVI of Oregon State University (Dr. Cynthia Twohy) produced values of the particles effective radius, Re. Preliminary values of the Re data were also entered into the archive.
On the earliest flight of the NASA WB-57 the U. of Utah CIN failed. The failure was caused by loss of heater power in the CIN, power that was turned off in the WB-57. The electronics of the CIN remained on during this period while the aircraft flew at maximum altitude and then descended into the warm and humid air near sea level. The temperature change during descent was 110°F. As result of this episode all interior surfaces of the CIN experienced heavy condensation, contaminating optics, destroying a laser-beam steering prism, and shorting out ICs on circuit boards. The P.I. repaired the boards with parts express mailed from Gerber Scientific Inc. (GSI), and a miniature bicycle mirror (suggested by Andy Heymsfield) was a makeshift replacement for the prism. All other optics were dissembled and cleaned. The U. of Utah CIN was then re-installed on the WB-57 where it functioned for the rest of the C-F flights.
Both the GSI and the U. of Utah CIN probes were calibrated in the GSI cloud chamber prior to and after the C-F experiment. The calibration constant for the former remained unchanged; however, the damage and repair of the latter during C-F required reliance on the post primary and cloud chamber calibrations. The primary calibration requires dis-assembly of the wings of the probe in order that the response of the four diffuser/photomultiplier combinations in the probe can be matched up. The cloud chamber calibration runs the CIN co- located with a GSI Particulate Volume Monitor (PVM-1OOA) that outputs a value of the total surface area of the cloud droplets per unit volume of air. This area used to scale the CIN is directly comparable with the extinction coefficient measured by the CIN, given that efficiency factor for extinction as a function of droplet size can be assumed to be a constant as predicted by Mie theory. The post experiment cloud chamber calibration of the four channels of the U. of Utah CIN is shown in APPENDIX C; exposure to a field calibration diffuser plate is followed by the responses in the chamber's cloud of the four CIN channels and the two PVM-IOOA channels.
2.4 Post C-F Data Analysis
The reduction of the data (extinction coefficient and asymmetry parameter) from the Citation CiN was compieted and submitted for all C-F flights to the NASA Ames archive. Effective radius, Re, values were calculated from the reduced CIN data and the Oregon State
5

University CVI data and also submitted to the archive.
The P.I. traveled to NCAR to relate Citation CIN measurements to the CPI images collected by the NCAR CPI probe (Andy Heymsfield and Aaron Bansemer) that was also located on the Citation aircraft. An effort was made to primarily correlate asymmetry parameters measured with the CIN to crystal habits observed with the CPI probe.
2.5 Post C-F Science Meeting
The P. I. attended the Salt-Lake-City Science Team Meeting and presented preliminary results from the microphysical and optical measurements made from the Citation during C-F; see APPENDIX D.
3. Results
The deployment of the CIN probe on both the U.N.D. Citation and on the NASA WB-57 probed to be largely successful. Temporary failure of the WB-57 CIN due to heater power failure on the WB-57 was the only interruption in the data collected by both probes.
These measurements were the first ever made of the in-situ extinction coefficient and asymmetry parameter in the large Cu, Cb, and anvils experienced by the aircraft during C-F. The measurements also provided, in conjunction with the Oregon State U. CVI measurements, meaningful values of the effective radius, Re, of the cloud particles. The CVI measure of the total water content ratioed by the CIN measure of the total projected area (proportional to the extinction coefficient) of the cloud particles over a particle size range from about 5-um to 2500- um diameter provided Re values much superior to other previous methods. The extinction coefficient, asymmetry parameter, and Re data were submitted to the NASA Ames archive.
The CIN measurements produced results including the following: 1) On the average the extinction coefficient increases with height in the large Cu and in their anvils. This effect appears to be a result of the decrease in size and increase in the total surface area of the cloud particles (water and ice) with height. 2) A measure of particle size, the effective radius Re, generally decreases with height, with values of about IO-um radius found near the tops of the anvils. The CPI images confirm the presence of such small particles which tend to form lose aggregates. 3) The asymmetry parameter, g, of the ice particles in these clouds averages about 0.73, and has an approximate Gaussian distribution about the mean. Values of g extend from less than 0.70 to about 0.78 for ice, with the former consisting compact aggregates (“mini snow balls”), and the latter consisting of pristine single crystals such as rosettes. The average value of g is consistent with the prior conclusion that ambient ice crystals consist of mostly ‘?junk ice” which describes crystals with complex shapes and aggregates. This relatively small value of g is significantly less than earlier theoretical calculations on pristine crystal shapes, and leads to ice clouds that reflect solar radiation more than expected. 4) Occasionally “extinction cores” are found in the large Cu. These cores correlate with updraft cores, and have extinctions corresponding to visual ranges of only several tens of meters. 5) The measured value of g was observed to be sensitive to the water phase of the cloud. Given that water clouds have a large value of 9-0.87, makes it possible to differentiate ice and
6

liquid water clouds, and to observe the transition in g values between ice and liquid water in mixed-phase clouds. 6) Comparison of the performance of the different cloud probes on the Citation showed significant disagreements. For example, the King, FSSP, and CVI measurements in a water cloud traversed during C-F differed by a factor of about 3. The comparison of extinction coefficients measured with the CIN and with the NCAR 2-DC probe showed a consistent difference of about a factor of 2.
4. Publications
Garrett, T., H. Gerber, D. Baumgardner, C. Twohy, and T. Weinstock, 2003: Small, highly reflective ice crystals in low-latitude cirrus. Geophys, Res. Let., 30, 1-4.
Garret, T., et al., 2004: In situ measurements of microphysical and radiative evolution of a low latitude cirrus anvil. (submitted to J.A.S.)
Gerber, H., et al., 2004: Nephelometer measurements in Florida thunderstorms. Pmc. 14fh Int. Conf on Clouds and Precip., Bologna, Italy, 18-23 July. (accepted for presentation).
5. Appendix A - P.I. Travel
1) Jan. 30 - Feb. 1, 2002, Greenbelt, MD; pre C-F Science team planning meeting 2) May 2 - May 5, 2002, Ellington AFB, Houston; interfacing U. of Utah CIN with WB-57 3) June 27 - Aug. 2,2002, Key West, FL; C-F experiment 4) Jan. 27 - Feb. 1, 2003, Boulder, CO; C-F data analysis 5) Feb. 22 - Feb. 28, 2003, Salt Lake City; post C-F Science team presentations meeting
7

6. Appendix B - Laser light trap
. ... , -.
8
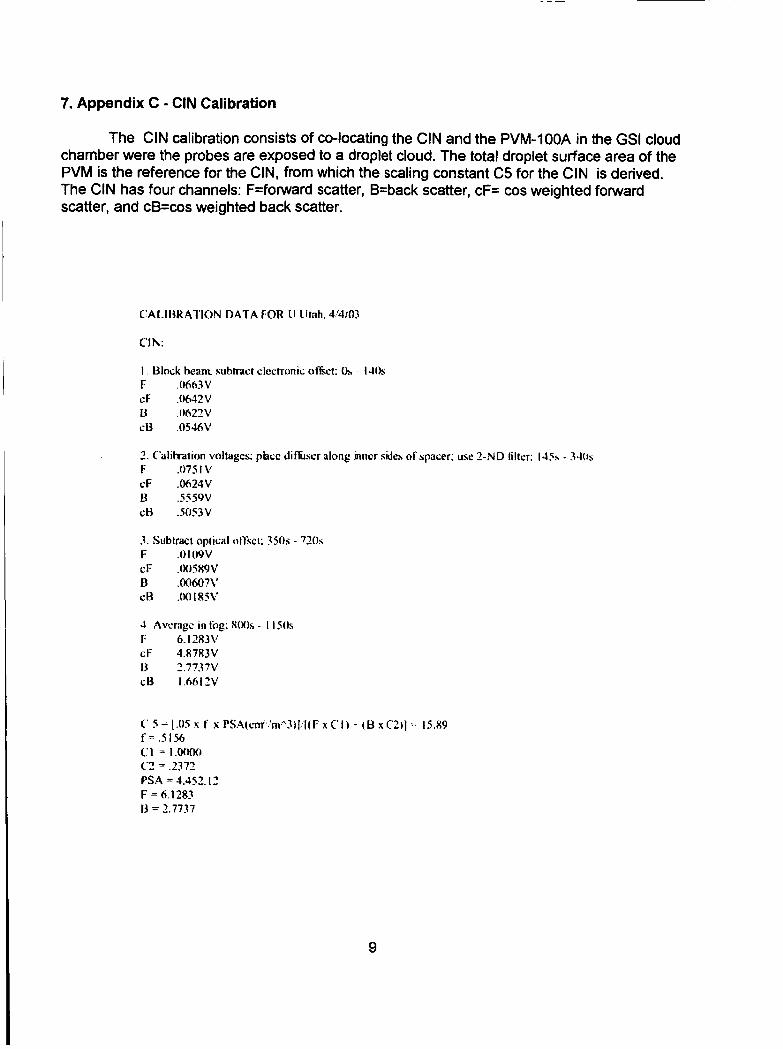
7. Appendix C - CIN Calibration
The CIN calibration consists of co-locating the CIN and the PVM-IOOA in the GSI cloud chamber were the probes are exposed to a droplet cloud. The total droplet surface area of the PVM is the reference for the CIN, from which the scaling constant C5 for the CIN is derived. The CIN has four channels: F=foward scatter, B=back scatter, cF= cos weighted forward scatter, and cB=cos weighted back scatter.
CA1.IBKATION DATA FOR LJ Utah. 4.'4103
Clh:
2 . Cialibration vnltages: phcc difk.\er alorig miicr skits orspacer, usc 2-ND filter: 145s - 341s 1; ,075 I V CF .0624V B .5LS9V cw .5053v
4. Avcragc in fog; 8(tf)s - I 150s 1; 6.1283V c f 4.8783V u 2.7737V CB I.66lZV
9

CLOUD CHAMBER COMPARISON; 44/03 10 '-1---11 ~
t 8 r 6
4 6 I
2 r i 0 I
CIN; No. 002
blaCk=F red = cF green = 8 blue = IS
PVM-100A. NO. 007
black = L w c fed- PSA
i
2 / .
1 145Q.W 1
t
i 1 7
TIME (s)
10

8. APPENDIX D - Science Team presentation
CITATION MEASUREMENTS OF CLOUD PROPERTIES DURING CRYSTAL-FACE
Hermann Gerber, Gerber Scientific Cynthia Twohy, Oregon State U. Andrew Heymsfield, NCAR Aaron Bansemer, NCAR Michael Poellot, U. North Dakota
11

Abstract
This presentation discusses in-situ measurements with aircraft based cloud probes of cloud physical and optical properties during the Crystal-Face (CF) experiment in Florida. Given that the lead author was primarily responsible for the deployment of the CIN (Cloud Integrating Nephelometer) on the Citation aircraft, the subject of this talk will mostly deal with the CIN measurements. The paper is divided into four parts: 1) the CIN is described and related to most of the other cloud probes flown on the Citation as well as the WB-57; 2) an initial attempt is made to compare the cloud probes on the Citation for several case studies ranging from the simplest case, a water cloud with small droplets, to the most complex case, an anvil ice cloud with a broad spectrum of complex crystals; 3) a few examples are given of the extinction coefficient (e) measured by the CIN in anvils, and of the effective radius (Re) given by the ratio of the ice water content (IWC) measured by the counter-flow virtual impactor (CVI), and the particle surface area (PSA) measured by the CIN; and 4) a list of the most significant preliminary observations is given, as well as some recommendations.
The following lists the figures prepared for this presentation. Greater detail of each figure follows this abstract. Fig. 1 - photo of CIN Fig. 2 - schematic and capabilities of CIN Fig. 3 - streamline analysis of flow around CIN Fig. 4 - cloud-probe size-range comparison Fig. 5 - scaling FSSP and CIN droplet surface area Fig. 6 - LWC comparison in warm cloud with small droplets Fig. 7 - FSSP droplet spectra in warm cloud . Fig. 8 - effective radius (Re) calculations for warm cloud Fig. 9 - Re comparison in warm cloud Fig. 10 - CPI images of cloud with large droplets Fig. 11 - size spectrum of cloud with large droplets Fig. 12 - Surface area distribution in the overlap region of the CPI and 2-DC probes Fig. 13 - CPI images of approximately isometric ice crystal aggregates Fig. 14 - CPI images chain-like aggregates and small particles Fig. 15 - Comparison of CIN, FSSP, 2-DC extinction coefficients, e, 25 July Fig. 16 - Comparison of CIN, FSSP, 2-DC extinction coefficients, e, 26 July Fig. 17 - CPI images of bullet rosettes Fig. 18 - extinction coefficients (e) measured with CIN, 16 July Fig. 19 - effective radii (Re) measured with CVI and CIN, 16 July Fig. 20 - extinction coefficients (e) measured with CIN, 26 July Fig. 21 - asymmetry parameter (9) measured with CIN, 26 July Fig. 22 - observations and recommendations Fig. 23 - questions
12

Fig. 1 - This photograph of the CIN (Cloud integrating Nephelometer) shows an instrument about 60-cm long and weighting 25 Ibs. It consists of an electronics enclosure, here seen attached to the underside of an aircraft fuselage; and an elliptical strut that is split down the middle and moved apart about 4 cm forming two separate "wings". This gap faces into the flight direction of the aircraft, and contains a collimated laser beam (635 nm) that is projected down the center line of the gap. Particles intersecting !he Isse: Seam s a W i iighi into detectors imbedded in the inside walls of the wings. For additional information see Gerber et al., 2000: Nephelometer measummnts ..... J. Atmos. Sci., 57, 3021-3034.
13

CLOUD INTEGRATING NEPHELOMETER
. 1. asymmetry parameter, g 2. optical extinction coefficient 3. backscatter rat0
Fig 2 - The CIN measures the asymmetry parameter, g, which is related to the reflectivity of the particles, and which is used to parameterize the scattered light phase function in radiative transfer calculations. It further measures the optical extinction coefficient, e, and the hemispheric backscatter ratio, b. The CIN utilizes four Lambertian detectors (SI - S4) that measure the light scattered by particles out of the laser beam. This geometry is closely related to one of the integrating nephelometer concepts originally described by Beutell and Brewer, 7949: lnstmments for the measurement of visual range. J. Sci. Instmm., 26, 357-359. Integrating nephelometers are a well known and proven technology, and they have the advantage of usually containing a relatively large sample volume in comparison to other cloud probes. The “cosine masks” work in conjunction with two of the detectors in order that g can be measured. The CIN produced a continuous data set for all flights of the Citation. On 9 July the CIN data is questionable after 70,000s due to icing conditions.
14

Fig. 3 - Recently Cynthia Twohy of Oregon State U. utilized fluid dynamic calculations to determine the streamline pattern around the CIN under conditions of 100 m/s aircyaft speed, and with the CIN parallel to the aircraft direction. This figure shows the CIN wings and the location of the laser beam looking from the end of the wings. The streamline calculations show only modest deviation from the desired parallel and constant-velocity flow near where particles would intersect the laser beam shown as the small circle in the center between the wings. The flow initially decelerates in front of the wings, but has close to the free air velocity in between the wings. There is however, some shear noticeably near the front of the wings and the center axis, suggesting that oriented ice crystals may change orientation as a result.
15

SIZE RANGE OF CLOUD PROBES
2-Dc CAPS
CPI VIPs SPP
FSSP
INTEGRAL CIN
SINGLE-PARTICLE PROBES
>ROBES CV,
b I I I rl 1 10 100 1000 ?oooo
PARTICLE DIAMETER (urn)
SAMPLE DEPEND ON DIRECT I VOLUME PARTICLE SHAPE COMPARISON
tiny Yes yes
large no yes
SINGLE-PARTICLE PROBES
INTEGRAL PROBES
Fig. 4 - In order to illustrate how the CIN relates to the other cloud probes, the estimated size range of operation of most of the cloud probes used during C-F is compared. The probes fit into two categories; the first are "single-particle" probes that measure the image or signal from individual particles to generate a size spectrum, and the second are "integral" probes that sense an ensemble of particles and directly measure an integrated property of the size spectrum. For the latter, the CIN measures the 2d moment (particle surface area or e) of the spectrum, while the CVI measures the 3d moment (volume of the condensed phase).
It was suggested earlier by Brian Toon, as well as other speakers at this meeting that the data from the two categories of probes should be compared. There are several reasons why this suggestion makes sense: 1) the most obvious reason is that the integral probes cover a particle size range that encompasses nearly the entire range of interest; whereas, the single particle probes only cover increments of this range, and thus data must be combined from several probes to cover the entire range; 2) the sample volume of the integral probes is generally much greater and easier to define than that of the single-particle probes, potentially making measurements with the former easier to make; 3) the output of the single-particle probes depends on particle shape; whereas, the output of the integral probes does not; and 4) data from all the probes listed in this figure are directly comparable.
It has been clear from the literature for some time that the single-particle probes generally produce data with large error bars, especially when integrated properties are derived from particle spectra. The possibility exists to constrain the errors in those probes by scaling their outputs to the Q U ~ L J ~ S of the integra! prebes, if the latkr ais mnsidered as proauung accurate results. This procedure could be best applied to clouds with spherical particles; application to clouds with ice particles would be more difficult given the various ways single- particle probes are used to sense ice crystals.
16

DYCOMS, FLT 06
8 2000
v 6 5
2 3 lo00 Y
E :
[I5
w 0
a
v) I-
a
0
0 120 180 240 300 0 60
TIME (s)
Fig. 5 - A comparison is shown of droplet surface area measured with the CIN and FSSP while flying horizontally with the NCAR C-130 in a stratocumulus during the recent DYCOMS-II study. This illustrates that scaling the FSSP measurements with a constant value can yield close agreement with the CIN.
17

FIGURE 6
1.2
1 .I
1 .o 0.9
0.8
0.7
0.6 <
0, v
!i O5 0.4
0.3
0.2
0.1
0.0
-0.1
CITATION; CVI vs King vs FSSP; 11 July, PM - - - - - . . . , , . . , , , , , , , , ,
King = squares TEMP. = BC KINGIFSSP = 0.58 ~.
cvi= circles FSSP = triangles
FSSP NO. = 2flOicc FSSP SIZE = IS15 urn AIR SPEED = 96 rn/s
65470 65475 65480 65485 65465
TIME (s)
18

FIGURE 7
CITATION; FSSP-100 DROPLET SPECTRA; 11 July, PM
103
b' CD 0 U = I O ' 2
1 00
I O - '
19

FIGURE 8
FSSP
CIN
KING
CVI
EFFECTIVE RADIUS
= r3n(r)Ar r r2n(r)Ar Re
20

FIGURE 9
EFFECTIVE RADIUS COMPARISON; 11 July, PM; 65471~435481s
t
0 5 15i ci,
Y c
% 101 0 . - n
/
0 CVI /
0 CVI t//, , , , , , I , , , , I , , , 0
1:l q /
/’ / 0 King /
0 5 10 15 20 Re (urn); FSSP-100
Fig. 6 - Fig. 9 - This series of figures compares the King, CVI, FSSP, and CIN probes on the Citation for the simplest cloud scenario: a warm cloud with droplet sizes that all fall within the size ranges for these probes. Figure 6 shows LWC measured by three of the probes over a period of about 20s; significant differences are seen. Figure 7 shows all the size spectra for the 20-s period; the lines connect only the spectra points for 65,479s and 65,480s seen in FiQ. 6. The CIN measurement of e (or particle surface area) can be compared to the preceding three probes by comparing Re as calculated in Fig. 8. The results of this comparison are shown in Fig. 9, and raise the possibility that the CIN was making accurate measurements, given that the scaling of the FSSP is likely not an issue here, and that the relative shape of the, FSSP spectra have been thought to he re.asonsb!y acwrate. HaWeVer, this singie result IS not. definitive proof of CIN accuracy, nor does it disqualify the King probe or CVI measurements from being more accurate. Unfortunately, the Citation did not fly through additional warm clouds during C-F with all probes functioning, so that this approach can not be expanded.
21

I FIGURE 10
19 lT.57.51.'
Bb 19.17.5744?~9 19.1?.57.46' 19.17 57 5cx e
22
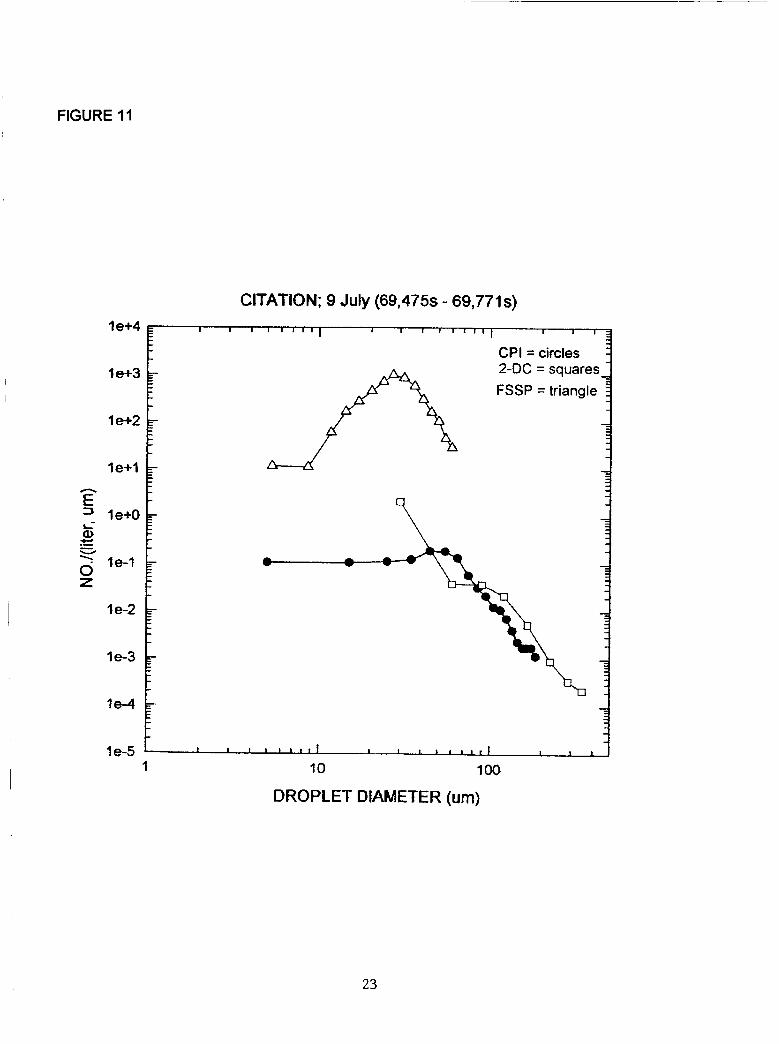
FIGURE 11
CPI = circles -
- FSSP = triangle ?
le+2 ,r - -
1 e+l - -
- 1 e+3 2-DC = squares - - - - -
- - - - - - - -
€ =) le+O I- Q, .- -
le-? 0 z le-2
23
- - - - - - - -
0 - - - -
- - - E c
- - -

FIGURE 12
CPI 2-DC
CITATION; 9 July (69,475s - 69,771s)
10 20 100 500
DROPLET DIAMETER (urn)
Fig. 10 - Fig. 12 - This series of figures looks at probe performance for a droplet cloud with increased complexity, where large drops (an a few ice crystals) extend into the size ran e of the 2-DC and CPI probes. Figure 10 shows CPI images of drops in this cloud; the arrow in the upper left indicates that the largest drops are about 200-um in diameter. The value of g 360) measured by the CIN is close to what one would expect from Mie calculations for these 6 rops. Figure 11 compares FSSP, CPI, and 2-DC spectra for this cloud; agreement is poor with ,. significant roll off in the latter two probes for particles smaller than 50 um - 100 um. Figure 12 magnifies the spectral region where the 2-DC 2nd CP! probes oiieiiap, ana snows the droplet area measured by each. The difference in the surface area measured by the two probes in the overtap region averages a factor of 3.
s
1 24

g = .681 +/- .Ol3
Fig. 13 - This CPI image shows ice par tic!^^ with incressed cmplsxiiy. Tiese ice particies are reasonably isometric and consist mostly of tightly packed aggregates. Probe comparisons for this case are yet to be made. This type of particle produced the smallest values of g, some values being smaller than .700.
~
25

Fig. 14 - This CPI image S ~ O W S ice pzlrticles with a high degree of complexity. Some particles appear to consist of chain-like aggregates, while others appear like small frozen droplets. This case is from an anvil outflow with the Citation flying at a highest level. 1
26

FIGURE 15
Citation July 25 ao I 1 i
L I ! t ! N j
1 2D+FSSP
L 6 . 5 X 1 O4
0. I 100.0
27

FIGURE 16
Citation July 26 MI-----, ' ' ' ' . / ' ' ' ' ' ' ' . ' ' . ' I
7.6x10' 78x10' I O X l a ' 1 2 X 1 0 * 8 4 X I O ' LlBxlO' n m
0.1
Fig. 15 - Fig. 16 - The extinction coefficient, e, measured directly with the CIN is compared to a calculated e from spectra measured with the 2-DC and FSSP for the entire Citation flight on July 25 (Fig. 15), and for July 26 (Fig. 16). The correlation between the measurements is remarkably good, suggesting that the treatment of the anvils' wide variety of complex ice crystals in calculating e from spectra is consistent. There is, however, about a factor of 2 offset between CIN and 2-DC + FSSP e measurements, which also appears in the rest of the entire Citation data set. As of now no explanation has been found as to the reason behind this factor of 2 offset.
The few preceding descriptions of probe comparisons illustrate again the difficulty of obtaining consistency among cloud probes, especially when higher moments of the spectra are calculated. This should not lower one's opinion of single-particle probes, given that only they can give particle shape and size information which is crucial for physical process studies that feed models. However, when properties such as LWC, IWC, extinction, and optical thickness are needed, the integra! prnbes shou!d be used, O i 8ii attempt made io scaie the single-particle probes to the integral probes (assuming that the latter can be trusted). In any case, the two types of probes should be flown together on the same aircraft whenever possible, given the potential synergisms between the two types.
28

g = .757 +I- .007 T = - 4 G C H = 10.400 m
Fig 17 - The last CPI image shows bullet rosettes observed on Citation flight on 25 July. This is a rare instance in the entire Citation ice-crystal data set where well-defined single crystal shapes were present. These crystals produced a relatively large value of g. The CPI data set from the Citation shows that anvils and associated clouds in C-F consisted of ice particles for vvI ~ L I I 11 larye majority couid be classified as “junk ice”, with a wide range of different aggregates, other complex shapes, and wide spectral ranges-reflecting perhaps the high degree of turbulence and mixing in the Florida storms. Small frozen droplets also were prevalent at high levels.
. . , L . m i L A L - 1- -- -
29

C I TAT1 0 N 16 JULY
:: / N ( C L O U D INTEGRATING NEPHELOMETER) 180
170
160 h E 150
s- 130
140
: 120 Y
30 20
10
0
68OOO 7oooO 72000 74000 76000 78000 80000 82000
TIME (5 )
Fig 18 - This figure is an example of the extinction coefficient, e, data produced by the CIN during C-F; this is for the Citation flight on 16 July. Profiles through two anvils are shown by 1 and 2. The former corresponds to an upward aircraft spiral though an aged anvil near the western ground site, while the latter corresponds to transects at ever lower altitudes of a new anvil. Generally, e increases with high in the anvils; however, the aged anvil shown by 1 has the opposite trend. The dense anvi! dood indlcsted by 2 is at the highest ievei rlown by the Citation and closest to the anvil source region, and contains many small crystals and their aggregates as shown in Fig. 14 which corresponds to 2 in the present figure.
30

80
70
n 60 E 3 9 5 0 - W
i3 a
2 4 0 -
W
5 30- LL w i!!
20
10
0
TIME (s)
I I I I I I i I I .. - CVI (ice, g/rnA3) $. .. CIN (ext. coeff., I/Km) - - t ' 5 .
j .
i. E :.
- - f '
- . . .: :. .:I 7 .
-
-
I
Fig. 19 - The effective radius, Re, calculated by ratioing the CVI (IWC) and CIN (e) measurements is shown for the 16-Ju!y fllgh?. The general deciease of iie witin increasing height in the anvils as shown by 1 and 3 is consistent with the trend seen in the rest of the Re data set. The smallest values of Re of about 10 urn are found at the highest anvil level 2 and are consistent with the small crystals and their aggregates seen by the CPI.
I 31

FIGURE 20
h
E C m m (D
€ s
lu 0 L LL w 0 0
c W
t- z
B F z 0 t- X W
C I TAT1 0 N 26 JULY
80
60
i 40 L
i.
20 -
F
_- I
7 W O 80000 82000 84000 86000 74000 76000
TIME (s)
32

FIGURE 21
C I TAT1 0 N 26 JULY $' ' I ! ' ' ' ' , , , , , , , , , , , , , , , ~ , ,
9 I 4
--. t T = -lO°C
I I
OJOC T=+lO°C 1
8OOOO 81000 82000 79000
TIME (s)
Fig. 20 - Fig. 21 - A second example of extinction measured by the CIN on 26 July is shown in Fig. 20. Here the Citation spiraled down through a cloud three times for the "melting layer experiment". Figure 21 magnifies the time interval for the central spiral and shows values of g
0 C isotherm is highly correlated with an increase in g, and the pass through a cloud portion with only water droplets yields close to the expected value of g. The values of g close to .890 correspond to regions with rain.
as the aircraft descended incloud from a temperature af -10 C ta +In Y . Th I I IY a nacc yuee thrnm LI 11 vuyl a n h I +hrr LI I=
33

FIGURE 22
OBSERVATIONS
1. Existence of 'extinction cores" with many small particles
2. Particle size, Re, decreases with height
3. Ext coeff. increases with height (except near cloud top?)
4. g in ice varies over a small range around .73
5. g indicates ice or water presence and mixture thereof
6. Ctoud probes disagree
RECOM"DATI0NS
1. Additional Citation nights in warm, mixed phase, and ice douds with FSSP, 2-DC, CPI, CVI, CIN, PVM, and King probes focussed on probe accuracy and synergism.
2. Design/wnstnrct gfass-bead sedimentation chamber br CIN
34

Fig. 22 (details) - The reduction of the CIN data, and initial data analysis of this data and of other Citation cloud probes has led to the following observations:
1) The Florida thunderstorms contain regions that are exceptionally dense optically, with large values of the extinction coefficient. These “extinction core” regions appear to be located with and a result of updraft cores.
2) The average ice-crystal size in the anvils, as indicated by Re, invariably decreases with height, as has been noted also in earlier studies by A. Heymsfield.
3) The extinction coefficient increases with height in the anvils in most cases, except perhaps close to anvil top.
4) The CIN on the Citation produced a rich data set of g values which will be related in subsequent analyses to various cloud and environmental parameters. The value of g in the anvils varies over a relatively small value about .730. This value is close to the average value of g measured by the CIN instrument in Arctic ice clouds during the SHEBA-FIRE study (Garrett et al, 2007: Shodwave, single-scattering ..... J. Geophys. Res., 706, 15,755-75,772). The largest values of g in the Florida clouds correspond to pristine single-habit crystals and to small frozen droplets and their low-density aggregates, while the smallest values of g, some smaller than .700 correspond to dense aggregates.
measurement of g provides a quick indication of cloud composition without having to look at data from particle imaging probes.
properties of the cloud particles, such as LWC and extinction, were compared.
5) The value of g is sensitive to the ratio of water to ice in the clouds. The
6) The cloud probes on the Citation showed significant disagreement when integrated
Two recommendations are given in this figure: 1) The first suggests additional aircraft flights in water and ice clouds focused on better
defining accuracy and synergism between cloud probes. In particular, a formal strategy should be evolved that stresses the optimum relationship between “single-particle’’ and “integral” probes. This would include specifying different cloud-types to fly through in order to enhance accuracy of given probes of the probe ensemble. A simple example would consist of flying through small-droplet warm clouds for improving scaling accuracy of the FSSP.
2) CIN scaling accuracy depends on co-located comparisons with the surface area channel of the PVM (Particle Volume Monitor) in a cloud chamber. A more direct calibration of the CIN is recommended. This could be in the form of a monodisperse glass-bead sedimentation chamber or transmissometer run co-located with the CIN in an ambient cloud environment.
35

ARE CLOUD PROBES SuFFlcIENTLY ACCURATE TO SERVE AS "GROUND "RUTH" FOR REMOTE SENSING?
A NATIONAL, CALIBRATION FACILITY FOR CLOUD PROBES?
Fig. 23 - The answer (in the opinion of the principal author) to the first question would be "in most cases the accuracy of the cloud probes is insufficient". While in some cases, such as narrow size distributions of cloud particles, the relative size spectrum can be quite accurate; however, the broader spectra measured by an ensemble of different probes rarely matches up. When integrated properties calculated from the spectra are desired the accuracy decreases further. Integral probes can improve the overall lack of accuracy, if they themselves can be proved to be accurate.
Calibration of cloud probes is often an individual matter. A national facility to calibrate the probes would be beneficial. The two icing tunnels (NASA Lewis and NRC nf Canada) that have been used for calibrations are not designed specifically for probe calibration. Innovative and improved means to generate drops and ice crystals more realistic as to what is found in ambient clouds would need to be part of a national facility.
I 36