Embed Size (px)
Citation preview

Population Forecast for Israel and West Bank
2025
Presentation at the Sixth Herzliya Conference
January 23, 2006
byBennett Zimmerman,
Roberta Seid, PhD& Michael L. Wise PhD
Bennett Zimmerman, Roberta Seid, Ph.D. & Michael L. Wise, Ph.D.Copyright 2005 All Rights Reserved

Forecasting RequirementsCurrent Population Accuracy The original Study, ‘Arab Population in the West Bank and Gaza: The Million Person Gap’ found the population in the Territories was 2.5 million instead of the 3.8 million published by Palestine Bureau of Statistics. Given the magnitude of the errors in the PCBS Model -- its 2004 population was inflated by over 50% -- demographers and state agencies should first correct current figures before issuing forecasts.
Constant Updating with Recent Trends and Changes in TrendThe future demographic balance in the region will also be driven by trends in Jewish majority which in recent years has shown rising birth rates and immigration, while the Arab population has experienced high but declining birth rates and emigration.
Consideration of All Possible ScenariosOn top of an exaggerated current population size, many demographers only assumed that Arab and Jewish growth rates would move in tandem, or that Jewish growth rates would decline and Arab rates would remain stable. There are clearly other realistic possibilities.
Arab GrowthHigh Med Low
Jew
ish
Gro
wth
Hig
h
Med
Low

10
Total Fertility RateBirths/Woman
8
6
4
2
0Egypt
Total Fertility Rates (TFR)Middle Eastern Comparisons
1970/75 – 2000/05
Source: UN Population Division
Fertility rates have dropped in every Middle Eastern country without exception.
5.7
3.3
7.5
3.3
4.9
2.2
Syria Lebanon
7.8
3.6
Jordan
2.3
Iran
6.4
1970/1975
2000/2005
7.3
4.5
7.6
3.0
Libya SaudiArabia

10
Total Fertility RateBirths/Woman
8
6
4
2
0
Total Fertility Rates (TFR)Israel Jews and Israel Moslems
1960 – 2004
Source: Israel Central Bureau of Statistics
Forecasts for Israel have been consistently wrong because they apply yesterday’s highfertility rates to tomorrow’s forecast despite long-term decline in Israel Arab fertility.
9.23
1960/1964
3.39
8.47
1965/1969
3.36
1970/1974
3.28
1975/1979
3.00
5.54
1980/1984
2.80
4.70
1985/1989
2.79
4.67
1990/1994
2.62
4.67
1995/1999
2.62
4.36
2004
2.71
Jews Moslems
7.25
9.22
5
Total Fertility RateBirths/Woman
4
3
2
1
0
Total Fertility Rates (TFR)Israel Jews and Israel Arabs
2000 - 2004
Israeli Jewish Fertility rates, the highest in the Western world, have stabilized and evenstarted to rise across the board in all sectors (Orthodox, secular, and new immigrant).
After plateauing from 1985 – 2000, Israeli Arab fertility rates have been steadily falling.
2000 2002 2003
Jews Arabs
2004
2.71
4.404.22
4. 004.17
2.732.642.66

5
Total Fertility RateBirths/Woman
4
3
2
1
0
Total Fertility Rates (TFR)Israel Jews and Israel Arabs
2000 - 20044.74
2000
4.58
2002
4.50
2003 2003
2.71
4.364.40
4.224. 00
4.17
3.072.77 2.85
2.662.552.29 2.31
2.13
2.732.642.66
Moslems
Druze
ChristianArabs
Christian Arab and Druze rates have fallen below Jewish fertility. Israeli Moslem fertility, especially among Bedouin (highest fertility in the country), fell markedly with recent reductionsin government subsidies for large families.
Jews Arabs

100
Thousands of Births
80
60
40
20
0
Demographic Momentum in IsraelJewish Births vs. Arab Births
1995 - 2005
Source: Israel Central Bureau of Statistics
Since 1995, Israel Jewish births have increased rapidly while Israel Arab births have begunto drop
80.4
1995
Jews Arabs
1996
36.5
85.6
35.8
1997
88.3
36.2
1998
91.3
38.8
1999
92.6
39.4
2000
95.6
40.8
2001
95.2
41.4
2002
98.6
40.9
2003
103.6
41.3
2004
104.4
40.9
105.2
38.8
2005

Children per Family
8
6
4
2
0
Gallup Survey on Ideal Family SizeConvergence in Fertility Intentions
Source: Gallup News Service, “Attitudes Toward Family Size Among Palestinians and Israelis”, Lydia Saad, March 17 2006
Desired family size is now the same for Israeli Jews and Israeli Arabs
Young West Bank Arabs desire a family size only one-half a child higher than young Israelis
IsraelJews
What is the ideal number of children in a family?
3.06
3.73
IsraelArabs
4.52
West Bank Arabs
3.683.88
5.26
3.593.68 3.853.52
4.55 4.40 4.17
5.07
Ort
hodo
x
Tra
ditio
nal
Secu
lar
50+
30-4
9
20-2
9
15-1
9
50+
30-4
9
20-2
9
15-1
9

Gallup Survey on Ideal Family SizeConvergence in Fertility Intentions
“There is not a large difference [in fertility intentions] in a region where fertility could be a potent political tool. . . The possibility that the once burgeoning Palestinian Arab population in Israel, the West Bank, and the Gaza Strip will eventually be the majority in that region has been widely accepted as a looming threat to Israel. . . However the assumption that Palestinians will eventually out-number the Jewish population in the region has come under recent criticism.
“The recent Gallup data is instructive because there is clearly an element of personal choice in having children, and thus Gallup finds strong evidence that people’s preferred family size has a strong bearing on actual fertility rates. Gallup has been measuring American’s notion of ideal number of children since 1936, the trend lines for preferred number of children and the U.S. are quite parallel.
“Gallup finds no difference in preferred number of children by age in Israel, but does among [younger] Palestinians.
Gallup Comments
-- Lydia Saad, “Attitudes Toward Family Size Among Palestinians and Israelis”, Gallup News Service, March 17 2006
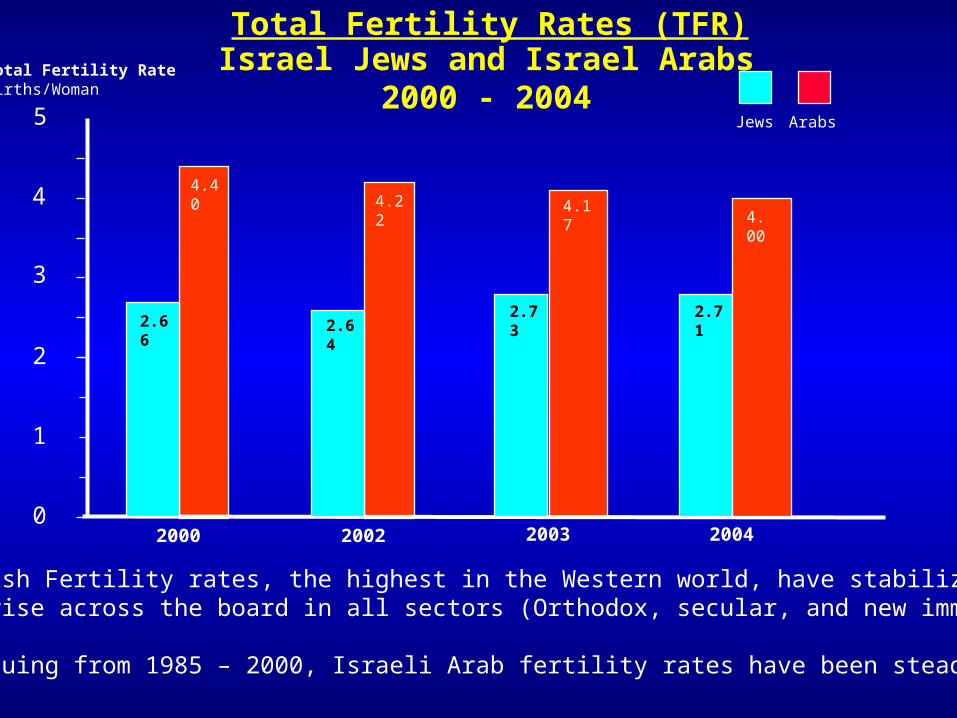
Forecast for Israel and West Bank 2025Sources and Assumptions
Israel Jews• Updates Israel Central Bureau Statistics (ICBS) Forecast 2000 – 2025• Jewish fertility since 2000 above highest scenarios considered by ICBS. Current level: 2.7 births/woman• New Forecast includes slightly higher fertility scenarios for Israel Jewish population• Considers net immigration (aliyah + returning Israelis – Israeli emigrants) at various levels, including average from 2001 – 2004 of 20,000 per year.
Israel Arabs• Updates ICBS Forecast 2000 – 2025• Arab fertility since 2000 near lowest levels considered by ICBS. Current level: 4.0 births/woman• New Forecast develops slightly lower fertility scenarios for Israel Arab population• Assesses the impact of different migration levels
West Bank Arabs• Starts with 2004 West Bank Arab population figure of 1.4 million as measured in ‘Arab Population in the West Bank and Gaza: The Million Person Gap’ • New Forecast applies UN Population Division fertility assumptions (supplied by PCBS) (Also develops higher fertility scenario than UN and PCBS. Current level: 5.0 births/woman)• Considers migration at different levels with Israeli controlled borders.
•‘Forecast for Israel and West Bank 2025’ builds on updated population, fertility and migration data.
• Develops fully independent scenarios (High-Medium-Low) for each population group.
Forecast does not include the aggressive convergence in fertility intentions as reported by Gallup

ICBS Forecast for IsraelIsrael’s Official Forecast
(2000 - 2025)Jewish Portion of Population
Different Scenarios
20252000
81%
High Medium Low
High 74% 76% 77%
Medium 74% 75% 77%
Low 73% 75% 76%
Arab Growth
J
ewis
h G
row
th

8.0
6.0
4.0
2.0
2000 2005 2010 2015 2020 2025
Millions of People
ICBS Forecast for Israel: Mid-Case ScenarioIsrael’s Official Forecast
(2000 - 2025)
Source: ICBS, Demographic Trends in Israel, by Ahmad Hleihal, Director, Demography Sector
10.0
12.0
0.0
Jews
IsraeliArabs
75% Jewish
Jewish Affiliated/Recent Immigrants
Israel Jews 4.96 77.8% 6.51 70.3%+ Recent Immig. 0.23 3.5% 0.43 4.7%Jews & Others 5.18 81.4% 6.94 75.0% Israel Arabs 1.19 18.6% 2.32 25.0%
2000 2025

ICBS Forecast for IsraelIsrael’s Official Forecast
(2000 - 2025)
• Others are comprised of mostly immigrants from the Former Soviet Union who have moved to Israel under the Law of Return but who are not halachically Jewish. Beginning in 1995, the ICBS began to report on Jews & Others together due to the Jewish affiliation of these immigrants. + Israeli Arabs are comprised of Moslem, Christian Arabs, and Druze citizens of Israel.
Source: ICBS, Demographic Trends in Israel, by Ahmad Hleihal, Director, Demography Sector
Base ForecastPopulation Population
2000 2025(In Millions) (In Millions)
High Variant 6.75 69.0%Jews Medium Variant 4.96 77.8% 6.51 70.3%
Low Variant 6.29 71.4%High Variant 0.53 5.5%
Others* Medium Variant 0.23 3.5% 0.43 4.7%Low Variant 0.40 4.5%High Variant 7.29 74.5%
Jews & Others Medium Variant 5.18 81.4% 6.94 75.0%Low Variant 6.68 75.9%High Variant 2.50 25.5%
Israeli Arabs+ Medium Variant 1.19 18.6% 2.32 25.0%Low Variant 2.12 24.1%

Fertility Assumptions in ICBS Forecast for Israel: JewsIsrael’s Official Forecast
(2000 - 2025)
2.00
2.50
3.00
3.50
4.00
2000 - 05 2021 - 25
2.6 2.6
2.4
2.1
Total Fertility Rates
The ICBS assumed Jewish fertility rates (births expected per woman) would remainStable at 2.6 in the high case scenario and drop to 2.1 in the low case scenario
Net Immigration was expected to drop from 10,000/year to 7,000/year in the high caseand 4,000/year to -2,000 emigration in the low case
High Scenario
Medium Scenario
Low Scenario

Actual Fertility vs. Assumptions in ICBS Forecast for Israel: Jews (2000 - 2004)
2.00
2.50
3.00
3.50
4.00
2000 - 05 2021 - 25
2.6 2.6
2.4
2.1
Actuals2000 2002 2003 2004 2.66 2.64 2.73 2.71
Actual fertility rates for the Jewish sector were higher than the highest rates consideredby the ICBS in its forecast
Total Fertility Rates
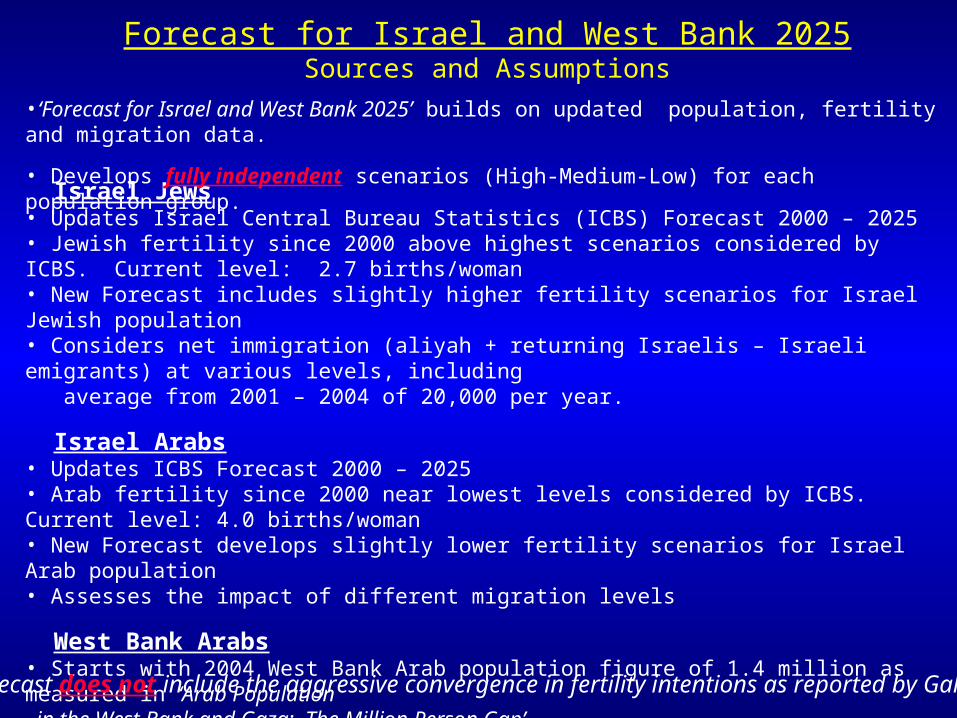
‘Forecast for Israel and West Bank 2025’: JewsFertility Assumptions in New Forecast
(2004 - 2025)
2.00
2.50
3.00
3.50
4.00
2000 - 05 2021 - 25
2.6 2.6
2.4
2.1
ICBS Assumptions
2.00
2.50
3.00
3.50
4.00
2004 2025
2.7
3.0
2.4
2.7
New Forecast Assumptions
‘Forecast for Israel 2025’ considers three modestly higher fertility scenariosand also assesses the impact of different immigration levels, including a scenario with20,000 immigrants, the net aliyah average from 2001 - 2004
Total Fertility Rates

Fertility Assumptions in ICBS Forecast for Israel: Israel MoslemsIsrael’s Official Forecast
(2000 - 2025)
3.8
2.1
The ICBS assumed Moslem fertility rates (births expected per woman) would remainstable at 4.7 in the high case scenario and gradually drop to 2.6 in the low case scenario
No immigration or emigration scenarios were considered for the sector
2.00
2.50
3.00
3.50
4.00
2000 - 05 2021 - 25
2.6
4.50
4.74.7
Total Fertility Rates
High Case Scenario
Medium Case Scenario
Low Case Scenario

Actuals vs. Assumptions in ICBS Forecast for Israel: Israel Moslems (2000 - 2004)
3.8
2.00
2.50
3.00
3.50
4.00
2000 - 05 2021 - 25
2.6
4.50
4.74.7
Total Fertility Rates
Actuals
2000 2002 2003 2004Moslems 1,090 83% 4.74 4.58 4.50 4.36Christians 116 9% 2.55 2.29 2.31 2.13Druze 112 8% 3.07 2.77 2.85 2.66Total Arab 1,318 4.40 4.22 4.17 4.02
Moslem
Total Arab
Actual fertility rates for Moslems were decreasing to the lowest level consideredby the ICBS in its forecast
Similar reductions occurred in all communities of the Arab sector

3.8
2.1
2.00
2.50
3.00
3.50
4.00
2000 - 05 2021 - 25
2.6
4.50
4.74.7
Total Fertility Rates
Moslem
Total Arab
3.0
2.00
2.50
3.00
3.50
4.00
2004 2025
2.4
4.50
4.04.0
Total Fertility Rates
‘Forecast for Israel 2025’ considers three modestly lower fertility scenarios for the total Israel Arab sector and also assesses the impact of different migration levels
Note: ‘Forecast for Israel and West Bank 2025’ applies TFR rates to total Arab sector, which has a lower rate than Moslem-only sector
‘Forecast for Israel and West Bank 2025’: Israel ArabFertility Assumptions in New Forecast
(2004 - 2025)

3.2
3.00
3.50
4.00
4.50
5.00
2004 2025
2.4
5.50
4.0
5.4
Total Fertility Rates
‘Forecast for Israel and West Bank 2025’: West Bank ArabsFertility Assumptions in New Forecast
(2004 - 2025)
2.50
Highest Scenario drops from most recent W.BankLevel (5.0) to current Israel Arab rate (4.0)
Middle Scenario uses UN Population Estimates (sourced from PCBS)
Lowest Scenario drops from most recent W.Banklevel to current lowest Israel Arab rate
‘Forecast for Israel 2025’ takes the population figures found in ‘Arab Population in the West Bank and Gaza’ and applies three fertility scenarios
5.0

Forecast for Israel and West Bank (2004 - 2025)
Jewish Portion of PopulationDifferent Scenarios
20252004
81%
High Medium Low
High 76% 79% 83%
Medium 74% 77% 81%
Low 72% 76% 80%
Arab Growth
J
ewis
h G
row
thHigh Medium Low
High 62% 66% 71%
Medium 59% 63% 68%
Low 56% 61% 66%
J
ewis
h G
row
thArab Growth
67%
Israel
Israel & West Bank

8.0
6.0
4.0
2.0
2004 2010 2015 2020 2025
Millions of People
‘Forecast for Israel and West Bank 2025’: Mid-Case Scenario (2004 - 2025)
Source: Forecast for Israel 2025, Copyright 2005 Zimmerman, Seid, Wise
10.0
12.0
0.0
Jews
IsraeliArabs
West BankArabs
63% Jewish
Israel Jews 5.49 67% 7.51 63% Israel Arabs 1.32 16% 2.20 18%West Bank Arabs 1.40 17% 2.24 19%
2004 2025

‘Forecast for Israel and West Bank 2025’ (2004 - 2025)
2004 TotalScenario Base Fertility
+ 0 + 10,000 + 20,000 + 50,000High 7.10 7.37 7.65 8.47 2.7 to 3.0
Jews & Others Medium 5.49 6.97 7.24 7.51 8.33 2.7 to 2.7Low 6.85 7.11 7.38 8.19 2.7 to 2.4
- 10,000 + 0 + 10,000High 1.97 2.31 2.64 4.0 to 4.0
Israeli Arabs+ Medium 1.32 1.88 2.20 2.52 4.0 to 3.0Low 1.76 2.07 2.38 4.0 to 2.4
+ 0 - 10,000 - 15,000 - 20,000High 2.66 2.34 2.18 2.02 5.0 to 4.0
West Bank Arabs# Medium 1.40 2.54 2.24 2.08 1.93 5.4 to 3.2Low 2.32 2.02 1.88 1.73 5.0 to 2.4
Annual Net MigrationForecast 2025
Annual Net Migration
Annual Net Migration
Forecast calculations use Spectrum Policy Modeling System Software, from the Policy Center
The 2004 population base, and the fertility and migration assumptions behind a full range of forecast scenarios are specified for each population group. They are based on recent actual data. Readers can independently assess the impact of different assumptions on forecast outcomes by using these tables.
Scenarios marked in GREEN would support the Best Case outcome for Jews.Scenarios marked in YELLOW are considered by the authors to be the most likely Mid-Case outcome. Scenarios marked in RED would support the Best Case outcome for Arabs.

‘Forecast for Israel and West Bank 2025’
Contact InformationIn USA
Mr. Bennett ZimmermanPh: 310-617-4180
E-mail: [email protected]
Arab Population in the West Bank and Gaza: The Million Person Gap debuted at the American Enterprise Institute in Washington, D.C. on January 10, 2005 The Begin-Sadat Center for Strategic Studies recently published a complete version of the Study in February 2006. This study can be accessed at www.biu.ac.il/Besa/mideast.html as Report #65
The authors of this study have completed a companion piece, “Forecast for Israel and West Bank 2025,” which was introduced in Israel at the 6th Herzliya Conference on January 23 2006 and in the USA at the American Enterprise Institute on February 23, 2006.
Further information on both studies can be found at www.pademographics.com