Embed Size (px)
Citation preview
Project Report to the EU
28- 01
QUALPOISS 2The Evaluation of a Simple,
Cheap, Rapid Method of Non-Protein Nitrogen Determination
in Fish Products Through the Processing/Merchandising Chain
Nóvember 2001
Sigurður Einarsson
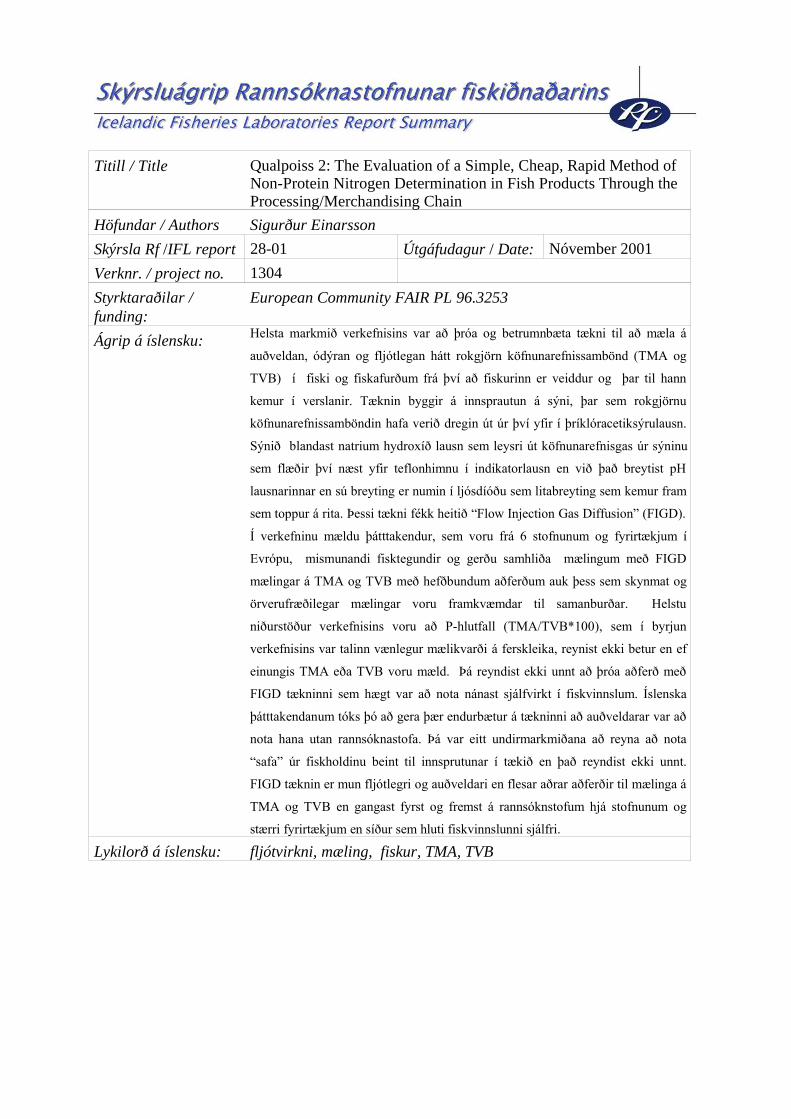
Titill / Title Qualpoiss 2: The Evaluation of a Simple, Cheap, Rapid Method ofNon-Protein Nitrogen Determination in Fish Products Through theProcessing/Merchandising Chain
Höfundar / Authors Sigurður Einarsson
Skýrsla Rf /IFL report 28-01 Útgáfudagur / Date: Nóvember 2001
Verknr. / project no. 1304
Styrktaraðilar /funding:
European Community FAIR PL 96.3253
Ágrip á íslensku: Helsta markmið verkefnisins var að þróa og betrumnbæta tækni til að mæla á
auðveldan, ódýran og fljótlegan hátt rokgjörn köfnunarefnissambönd (TMA og
TVB) í fiski og fiskafurðum frá því að fiskurinn er veiddur og þar til hann
kemur í verslanir. Tæknin byggir á innsprautun á sýni, þar sem rokgjörnu
köfnunarefnissamböndin hafa verið dregin út úr því yfir í þríklóracetiksýrulausn.
Sýnið blandast natrium hydroxíð lausn sem leysri út köfnunarefnisgas úr sýninu
sem flæðir því næst yfir teflonhimnu í indikatorlausn en við það breytist pH
lausnarinnar en sú breyting er numin í ljósdíóðu sem litabreyting sem kemur fram
sem toppur á rita. Þessi tækni fékk heitið “Flow Injection Gas Diffusion” (FIGD).
Í verkefninu mældu þátttakendur, sem voru frá 6 stofnunum og fyrirtækjum í
Evrópu, mismunandi fisktegundir og gerðu samhliða mælingum með FIGD
mælingar á TMA og TVB með hefðbundum aðferðum auk þess sem skynmat og
örverufræðilegar mælingar voru framkvæmdar til samanburðar. Helstu
niðurstöður verkefnisins voru að P-hlutfall (TMA/TVB*100), sem í byrjun
verkefnisins var talinn vænlegur mælikvarði á ferskleika, reynist ekki betur en ef
einungis TMA eða TVB voru mæld. Þá reyndist ekki unnt að þróa aðferð með
FIGD tækninni sem hægt var að nota nánast sjálfvirkt í fiskvinnslum. Íslenska
þátttakendanum tóks þó að gera þær endurbætur á tækninni að auðveldarar var að
nota hana utan rannsóknastofa. Þá var eitt undirmarkmiðana að reyna að nota
“safa” úr fiskholdinu beint til innsprutunar í tækið en það reyndist ekki unnt.
FIGD tæknin er mun fljótlegri og auðveldari en flesar aðrar aðferðir til mælinga á
TMA og TVB en gangast fyrst og fremst á rannsóknstofum hjá stofnunum og
stærri fyrirtækjum en síður sem hluti fiskvinnslunni sjálfri.
Lykilorð á íslensku: fljótvirkni, mæling, fiskur, TMA, TVB
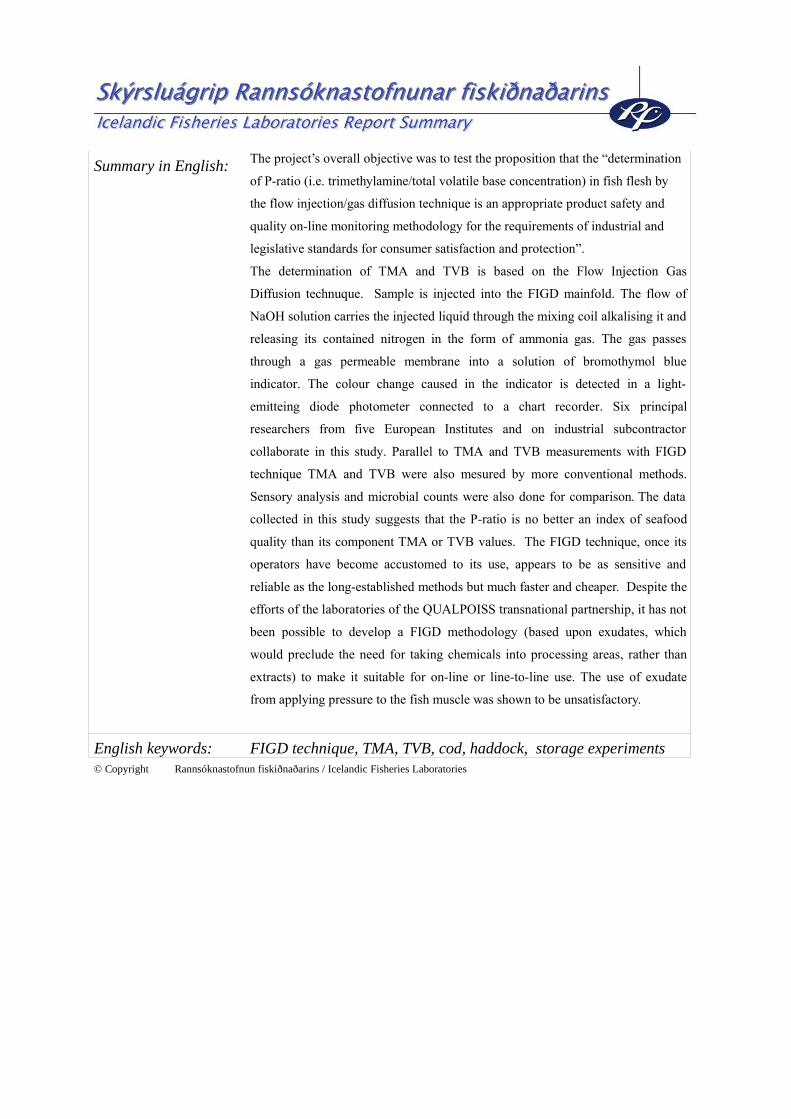
Summary in English: The project’s overall objective was to test the proposition that the “determination
of P-ratio (i.e. trimethylamine/total volatile base concentration) in fish flesh by
the flow injection/gas diffusion technique is an appropriate product safety and
quality on-line monitoring methodology for the requirements of industrial and
legislative standards for consumer satisfaction and protection”.
The determination of TMA and TVB is based on the Flow Injection Gas
Diffusion technuque. Sample is injected into the FIGD mainfold. The flow of
NaOH solution carries the injected liquid through the mixing coil alkalising it and
releasing its contained nitrogen in the form of ammonia gas. The gas passes
through a gas permeable membrane into a solution of bromothymol blue
indicator. The colour change caused in the indicator is detected in a light-
emitteing diode photometer connected to a chart recorder. Six principal
researchers from five European Institutes and on industrial subcontractor
collaborate in this study. Parallel to TMA and TVB measurements with FIGD
technique TMA and TVB were also mesured by more conventional methods.
Sensory analysis and microbial counts were also done for comparison. The data
collected in this study suggests that the P-ratio is no better an index of seafood
quality than its component TMA or TVB values. The FIGD technique, once its
operators have become accustomed to its use, appears to be as sensitive and
reliable as the long-established methods but much faster and cheaper. Despite the
efforts of the laboratories of the QUALPOISS transnational partnership, it has not
been possible to develop a FIGD methodology (based upon exudates, which
would preclude the need for taking chemicals into processing areas, rather than
extracts) to make it suitable for on-line or line-to-line use. The use of exudate
from applying pressure to the fish muscle was shown to be unsatisfactory.
English keywords: FIGD technique, TMA, TVB, cod, haddock, storage experiments© Copyright Rannsóknastofnun fiskiðnaðarins / Icelandic Fisheries Laboratories
1
EXECUTIVE SUMMARY FROM THE CO-ORDINATORS
W.HORNER and ANDREW PALFREMAN
Final Report 01-10-97/ 31-1-2001
University of Hull
Cottingham Road
Hull
HU6 7RX
tel: +1482 4664 426
fax: +1482 470 129
e-mail: [email protected]

2
3
TABLE OF CONTENTS
Research Partners
1. Executive Summary 1.1 Research hypothesis 1.2 Specific objectives 1.3 Achievement of tasks 1.4 Results 1.5 Overall conclusion 2. Objectives 3. Project Milestones 4. Achievement of Tasks and sub-tasks 4.1 The three principal tasks 4.2 Task 1 4.2.1 Outline of task 4.2.2 Sub-tasks associated with Task 1 4.3 Task 2 4.3.1 Outline of Task 2 4.3.2 Sub-tasks associated with Task 2 4.4 Task 3 4.4.1 Outline of Task 3 4.4.2 Sub-tasks associated with Task 3 5. Discussion of Results 5.1 Principal General Results 5.2 Subsidiary Results 5.2.1 Inter-laboratory sensory analysis of standardisation 5.2.2 Development and standardisation of methodology to obtain an exudate 5.2.3 IFHQ – Hull 5.2.4 TEI – Athens 5.2.5 IFL – Iceland 5.2.6 IPIMAR – Lisbon 5.2.7 UBNB – Spain Table 4.1: Employment of Species by Partners Table 4.2: The Industrialisation of the FIGD approach Table 5.1: Summary of P-ratio and Sensory Score Results from Qualpoiss1 6. Conclusions Appendix 1: QUALPOISS 2 Project Workplan Appendix 2: Final annual reports of project partners
4
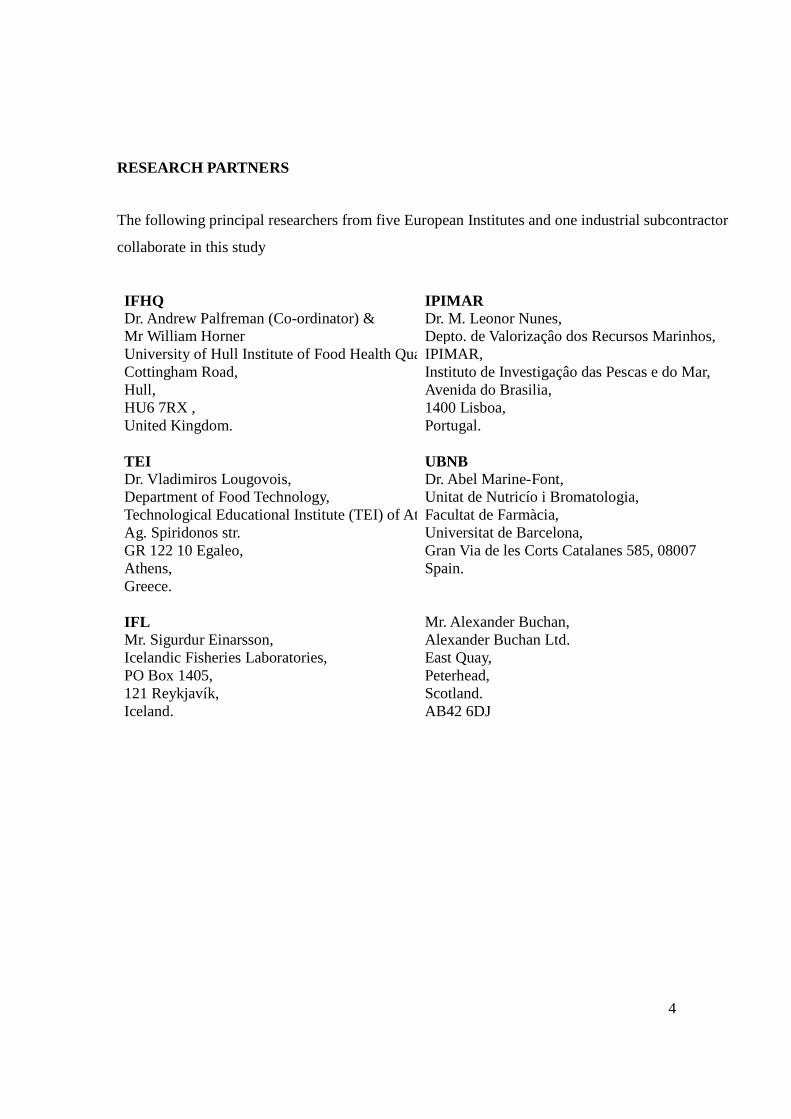
RESEARCH PARTNERS
The following principal researchers from five European Institutes and one industrial subcontractor
collaborate in this study
IFHQ Dr. Andrew Palfreman (Co-ordinator) & Mr William Horner University of Hull Institute of Food Health QuaCottingham Road, Hull, HU6 7RX , United Kingdom.
IPIMAR Dr. M. Leonor Nunes, Depto. de Valorizaçâo dos Recursos Marinhos, IPIMAR, Instituto de Investigaçâo das Pescas e do Mar, Avenida do Brasilia, 1400 Lisboa, Portugal.
TEI Dr. Vladimiros Lougovois, Department of Food Technology, Technological Educational Institute (TEI) of AthAg. Spiridonos str. GR 122 10 Egaleo, Athens, Greece.
UBNB Dr. Abel Marine-Font, Unitat de Nutricío i Bromatologia, Facultat de Farmàcia, Universitat de Barcelona, Gran Via de les Corts Catalanes 585, 08007 Spain.
IFL Mr. Sigurdur Einarsson, Icelandic Fisheries Laboratories, PO Box 1405, 121 Reykjavík, Iceland.
Mr. Alexander Buchan, Alexander Buchan Ltd. East Quay, Peterhead, Scotland. AB42 6DJ
5
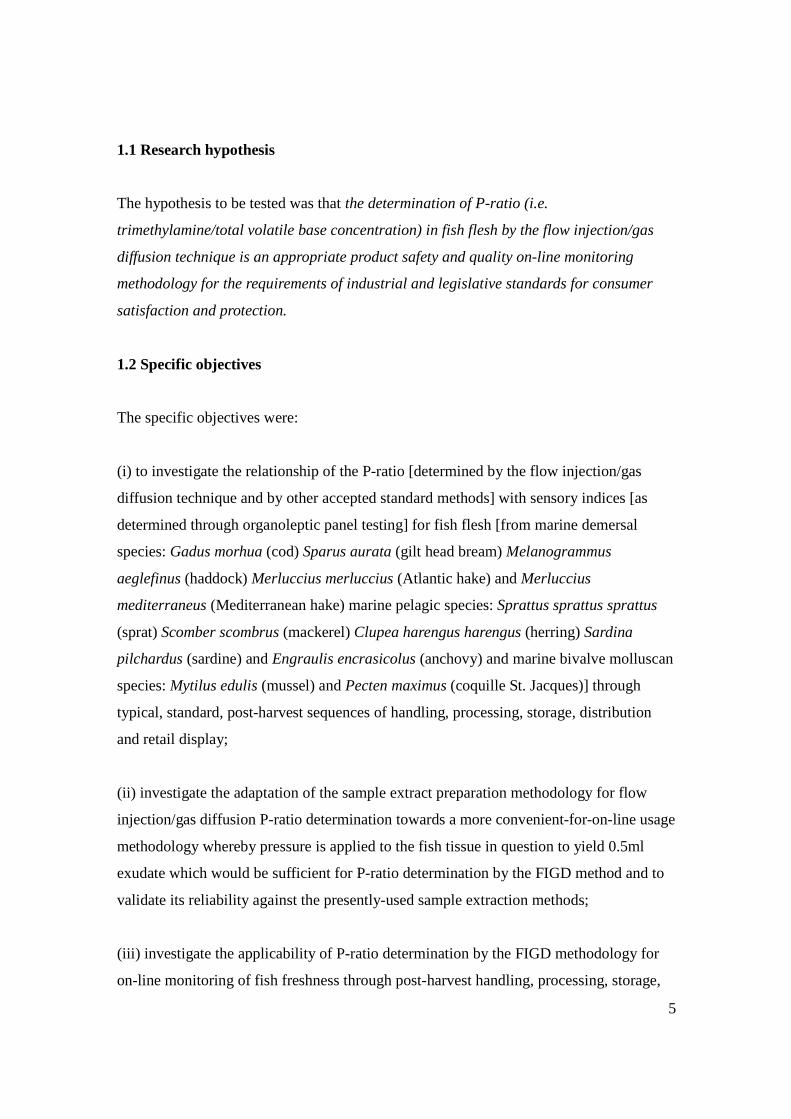
1.1 Research hypothesis
The hypothesis to be tested was that the determination of P-ratio (i.e.
trimethylamine/total volatile base concentration) in fish flesh by the flow injection/gas
diffusion technique is an appropriate product safety and quality on-line monitoring
methodology for the requirements of industrial and legislative standards for consumer
satisfaction and protection.
1.2 Specific objectives
The specific objectives were:
(i) to investigate the relationship of the P-ratio [determined by the flow injection/gas
diffusion technique and by other accepted standard methods] with sensory indices [as
determined through organoleptic panel testing] for fish flesh [from marine demersal
species: Gadus morhua (cod) Sparus aurata (gilt head bream) Melanogrammus
aeglefinus (haddock) Merluccius merluccius (Atlantic hake) and Merluccius
mediterraneus (Mediterranean hake) marine pelagic species: Sprattus sprattus sprattus
(sprat) Scomber scombrus (mackerel) Clupea harengus harengus (herring) Sardina
pilchardus (sardine) and Engraulis encrasicolus (anchovy) and marine bivalve molluscan
species: Mytilus edulis (mussel) and Pecten maximus (coquille St. Jacques)] through
typical, standard, post-harvest sequences of handling, processing, storage, distribution
and retail display;
(ii) investigate the adaptation of the sample extract preparation methodology for flow
injection/gas diffusion P-ratio determination towards a more convenient-for-on-line usage
methodology whereby pressure is applied to the fish tissue in question to yield 0.5ml
exudate which would be sufficient for P-ratio determination by the FIGD method and to
validate its reliability against the presently-used sample extraction methods;
(iii) investigate the applicability of P-ratio determination by the FIGD methodology for
on-line monitoring of fish freshness through post-harvest handling, processing, storage,
6
distribution and retail display through trial operation in factory and distribution chain
situations in each of the partner countries.
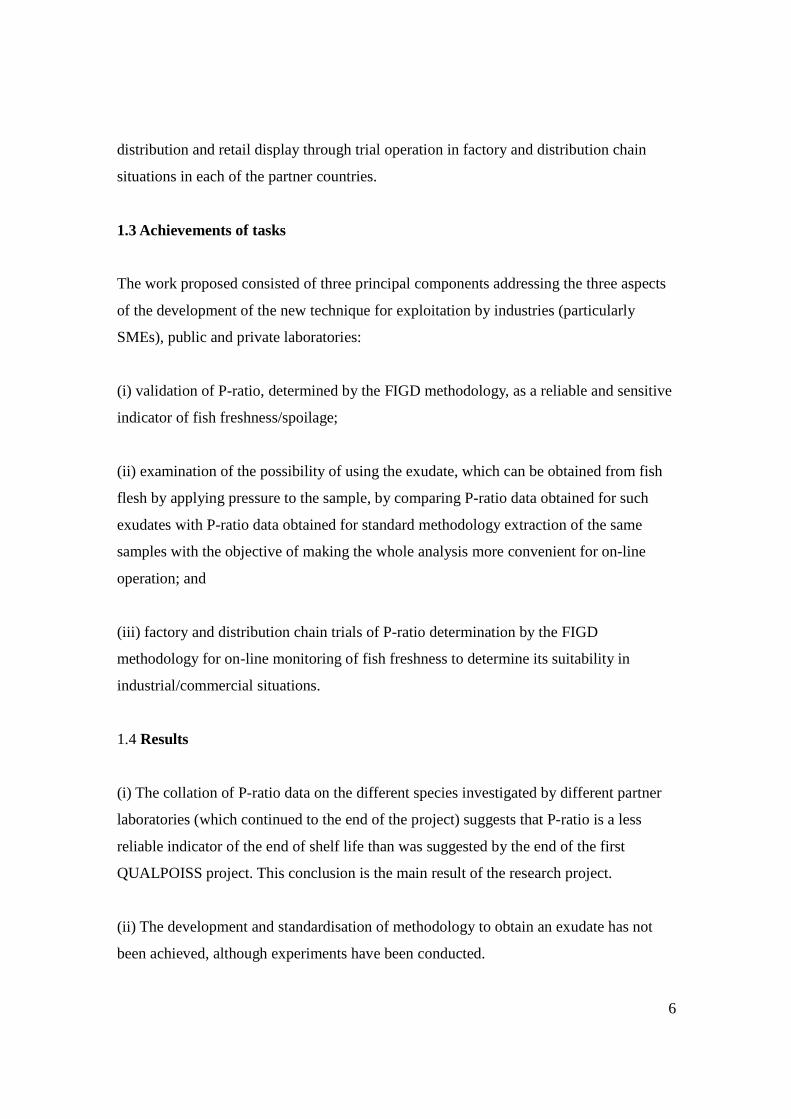
1.3 Achievements of tasks
The work proposed consisted of three principal components addressing the three aspects
of the development of the new technique for exploitation by industries (particularly
SMEs), public and private laboratories:
(i) validation of P-ratio, determined by the FIGD methodology, as a reliable and sensitive
indicator of fish freshness/spoilage;
(ii) examination of the possibility of using the exudate, which can be obtained from fish
flesh by applying pressure to the sample, by comparing P-ratio data obtained for such
exudates with P-ratio data obtained for standard methodology extraction of the same
samples with the objective of making the whole analysis more convenient for on-line
operation; and
(iii) factory and distribution chain trials of P-ratio determination by the FIGD
methodology for on-line monitoring of fish freshness to determine its suitability in
industrial/commercial situations.
1.4 Results
(i) The collation of P-ratio data on the different species investigated by different partner
laboratories (which continued to the end of the project) suggests that P-ratio is a less
reliable indicator of the end of shelf life than was suggested by the end of the first
QUALPOISS project. This conclusion is the main result of the research project.
(ii) The development and standardisation of methodology to obtain an exudate has not
been achieved, although experiments have been conducted.
7
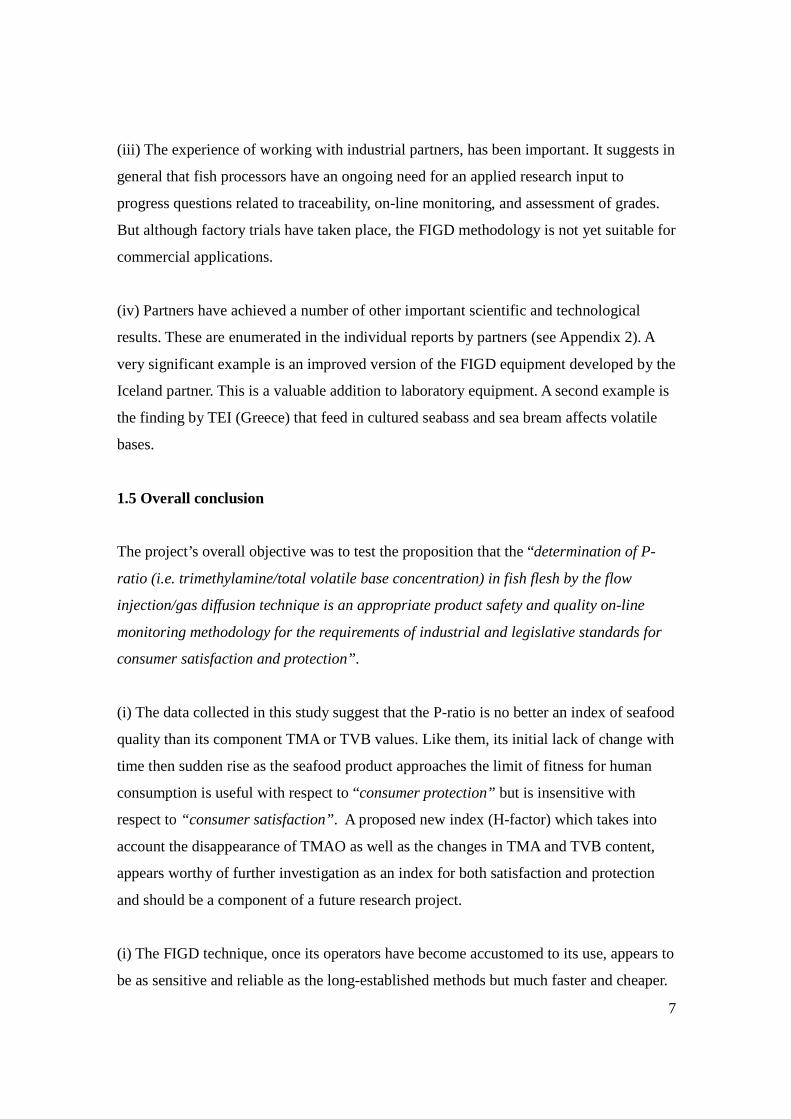
(iii) The experience of working with industrial partners, has been important. It suggests in
general that fish processors have an ongoing need for an applied research input to
progress questions related to traceability, on-line monitoring, and assessment of grades.
But although factory trials have taken place, the FIGD methodology is not yet suitable for
commercial applications.
(iv) Partners have achieved a number of other important scientific and technological
results. These are enumerated in the individual reports by partners (see Appendix 2). A
very significant example is an improved version of the FIGD equipment developed by the
Iceland partner. This is a valuable addition to laboratory equipment. A second example is
the finding by TEI (Greece) that feed in cultured seabass and sea bream affects volatile
bases.
1.5 Overall conclusion
The project’s overall objective was to test the proposition that the “determination of P-
ratio (i.e. trimethylamine/total volatile base concentration) in fish flesh by the flow
injection/gas diffusion technique is an appropriate product safety and quality on-line
monitoring methodology for the requirements of industrial and legislative standards for
consumer satisfaction and protection”.
(i) The data collected in this study suggest that the P-ratio is no better an index of seafood
quality than its component TMA or TVB values. Like them, its initial lack of change with
time then sudden rise as the seafood product approaches the limit of fitness for human
consumption is useful with respect to “consumer protection” but is insensitive with
respect to “consumer satisfaction”. A proposed new index (H-factor) which takes into
account the disappearance of TMAO as well as the changes in TMA and TVB content,
appears worthy of further investigation as an index for both satisfaction and protection
and should be a component of a future research project.
(i) The FIGD technique, once its operators have become accustomed to its use, appears to
be as sensitive and reliable as the long-established methods but much faster and cheaper.
8
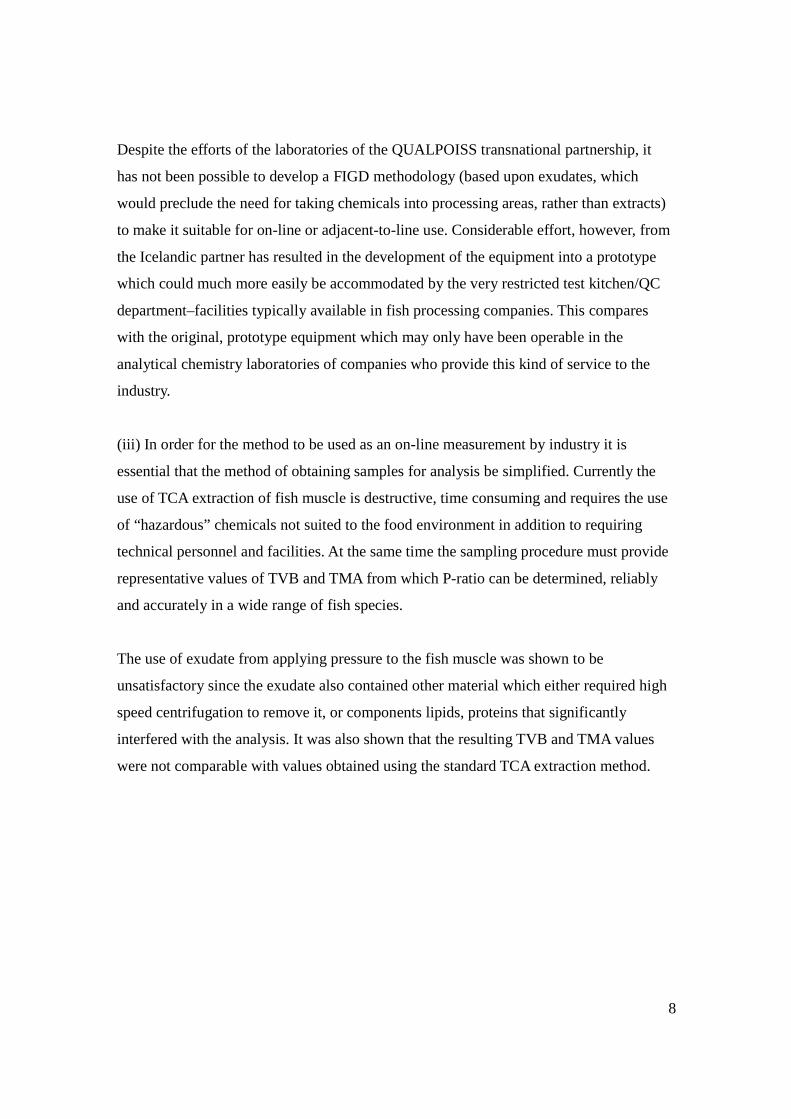
Despite the efforts of the laboratories of the QUALPOISS transnational partnership, it
has not been possible to develop a FIGD methodology (based upon exudates, which
would preclude the need for taking chemicals into processing areas, rather than extracts)
to make it suitable for on-line or adjacent-to-line use. Considerable effort, however, from
the Icelandic partner has resulted in the development of the equipment into a prototype
which could much more easily be accommodated by the very restricted test kitchen/QC
department–facilities typically available in fish processing companies. This compares
with the original, prototype equipment which may only have been operable in the
analytical chemistry laboratories of companies who provide this kind of service to the
industry.
(iii) In order for the method to be used as an on-line measurement by industry it is
essential that the method of obtaining samples for analysis be simplified. Currently the
use of TCA extraction of fish muscle is destructive, time consuming and requires the use
of “hazardous” chemicals not suited to the food environment in addition to requiring
technical personnel and facilities. At the same time the sampling procedure must provide
representative values of TVB and TMA from which P-ratio can be determined, reliably
and accurately in a wide range of fish species.
The use of exudate from applying pressure to the fish muscle was shown to be
unsatisfactory since the exudate also contained other material which either required high
speed centrifugation to remove it, or components lipids, proteins that significantly
interfered with the analysis. It was also shown that the resulting TVB and TMA values
were not comparable with values obtained using the standard TCA extraction method.
9
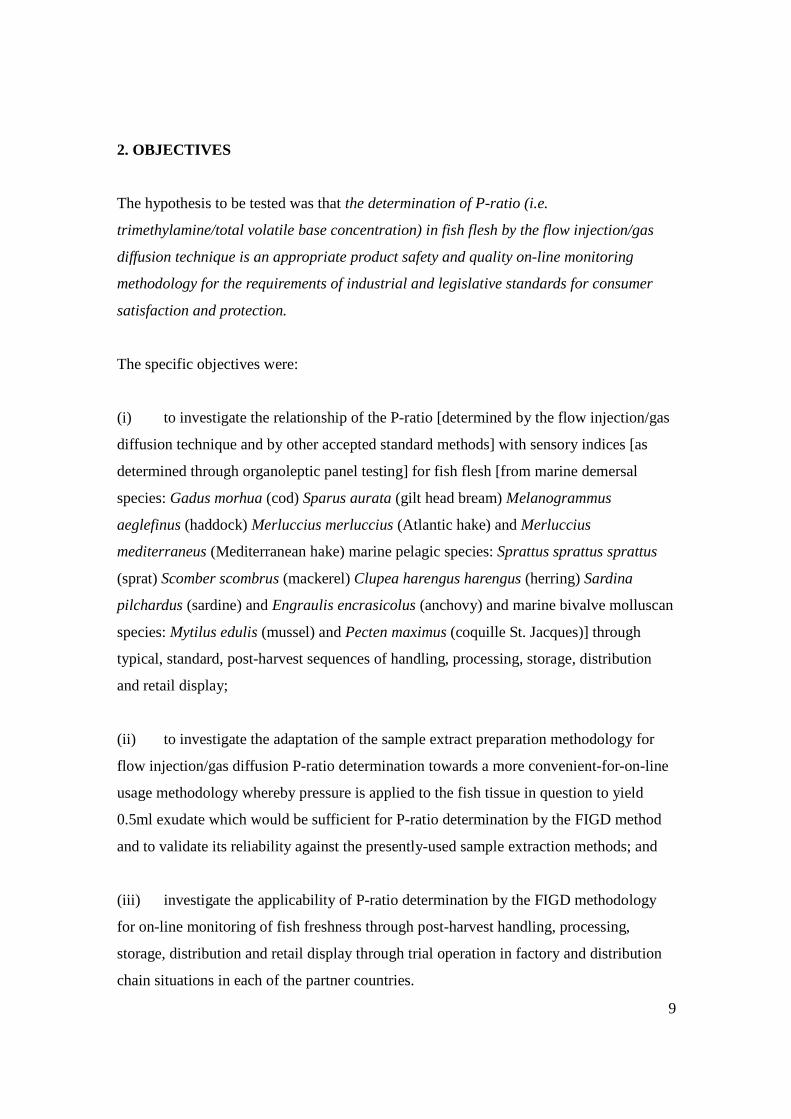
2. OBJECTIVES
The hypothesis to be tested was that the determination of P-ratio (i.e.
trimethylamine/total volatile base concentration) in fish flesh by the flow injection/gas
diffusion technique is an appropriate product safety and quality on-line monitoring
methodology for the requirements of industrial and legislative standards for consumer
satisfaction and protection.
The specific objectives were:
(i) to investigate the relationship of the P-ratio [determined by the flow injection/gas
diffusion technique and by other accepted standard methods] with sensory indices [as
determined through organoleptic panel testing] for fish flesh [from marine demersal
species: Gadus morhua (cod) Sparus aurata (gilt head bream) Melanogrammus
aeglefinus (haddock) Merluccius merluccius (Atlantic hake) and Merluccius
mediterraneus (Mediterranean hake) marine pelagic species: Sprattus sprattus sprattus
(sprat) Scomber scombrus (mackerel) Clupea harengus harengus (herring) Sardina
pilchardus (sardine) and Engraulis encrasicolus (anchovy) and marine bivalve molluscan
species: Mytilus edulis (mussel) and Pecten maximus (coquille St. Jacques)] through
typical, standard, post-harvest sequences of handling, processing, storage, distribution
and retail display;
(ii) to investigate the adaptation of the sample extract preparation methodology for
flow injection/gas diffusion P-ratio determination towards a more convenient-for-on-line
usage methodology whereby pressure is applied to the fish tissue in question to yield
0.5ml exudate which would be sufficient for P-ratio determination by the FIGD method
and to validate its reliability against the presently-used sample extraction methods; and
(iii) investigate the applicability of P-ratio determination by the FIGD methodology
for on-line monitoring of fish freshness through post-harvest handling, processing,
storage, distribution and retail display through trial operation in factory and distribution
chain situations in each of the partner countries.
10
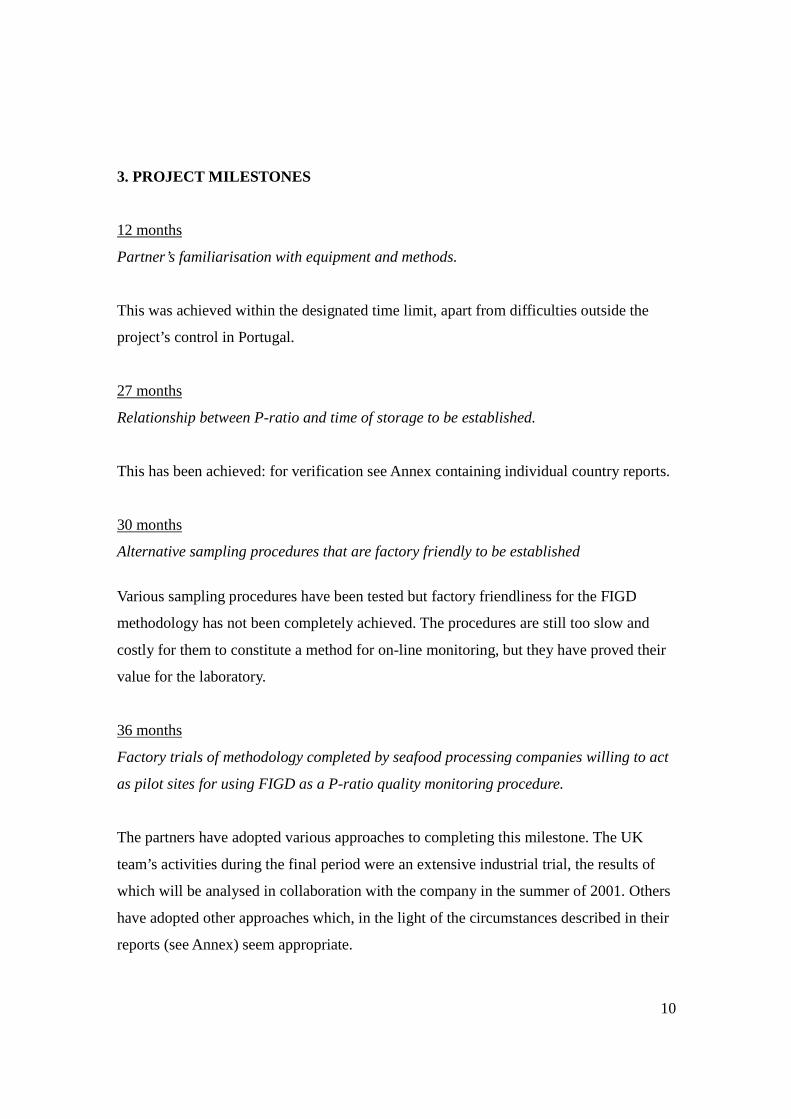
3. PROJECT MILESTONES
12 months
Partner’s familiarisation with equipment and methods.
This was achieved within the designated time limit, apart from difficulties outside the
project’s control in Portugal.
27 months
Relationship between P-ratio and time of storage to be established.
This has been achieved: for verification see Annex containing individual country reports.
30 months
Alternative sampling procedures that are factory friendly to be established
Various sampling procedures have been tested but factory friendliness for the FIGD
methodology has not been completely achieved. The procedures are still too slow and
costly for them to constitute a method for on-line monitoring, but they have proved their
value for the laboratory.
36 months
Factory trials of methodology completed by seafood processing companies willing to act
as pilot sites for using FIGD as a P-ratio quality monitoring procedure.
The partners have adopted various approaches to completing this milestone. The UK
team’s activities during the final period were an extensive industrial trial, the results of
which will be analysed in collaboration with the company in the summer of 2001. Others
have adopted other approaches which, in the light of the circumstances described in their
reports (see Annex) seem appropriate.
11
4. ACHIEVEMENT OF TASKS AND SUBTASKS
4.1 The three principal tasks
The work proposed consists of three principal components addressing the three aspects of
the development of the new technique for exploitation by industries (particularly SMEs),
public and private laboratories:
(i) validation of P-ratio, determined by the FIGD methodology, as a reliable and
sensitive indicator of fish freshness/spoilage;
(ii) examination of the possibility of using the exudate, which can be obtained from
fish flesh by applying pressure to the sample, by comparing P-ratio data obtained for
such exudates with P-ratio data obtained for standard methodology extraction of the
same samples [in each case, ten replicates from each fish sample would be used to
examine intra- and intersample variability] with the objective of making the whole
analysis more convenient for on-line operation [because, at the beginning of the study,
the sample preparation procedure was seen as the time obstacle for FIGD’s usage in
rapid, on-line, objective monitoring of freshness quality]; and
(iii) factory and distribution chain trials of P-ratio determination by the FIGD
methodology for on-line monitoring of fish freshness to determine its suitability in
industrial/commercial situations.
4.2 Task 1
4.2.1 Outline of task
Task 1 required partners to focus on the investigation of the relationship of P-ratio
(determined by the FIGD method) with a decomposition index (determined through
organoleptic panel testing) for selected species of fish through the post-harvest sequence
of handling, processing, storage, distribution and retail display. In general terms it is quite
12
evident that this task was achieved by the project, as is evidenced in the periodic reports
and attached final reports. The project has shown that the P-ratio can be reliably
determined by the Flow Injection Gas Diffusion (FIGD) method. At present, FIGD
appears satisfactory for TVB; for TMA, it still requires some methodology development.
4.2.2 Sub-tasks associated with Task 1
Sub-tasks 1.i (acquisition, installation and commissioning of FIGD equipment in partner
laboratories) and 1.ii (familiarisation of partner laboratories with the FIGD technique)
were completed by month 3 except for the case of the Portuguese partner (IPIMAR) who
had to be sent a replacement FIGD detector box after repeated failure to make the
original work properly after dismantling by customs in transit.
Sub-task 1.iii (inter-laboratory FIGD technique standardisation exercise to determine P-
ratio for replicate sets of unknown fish extract samples supplied by industrial sub-
contractor) was completed by month 6 and 1.iv by month 12 (except for part of 1.iii for
the aforementioned reason in the case of the Portuguese partner).
Sub-task 1.iv (validation of FIGD technique for P-ratio determination against standards
approaches), as adapted and expanded, has been a major component of the work by all
partners throughout the project period.
Sub-task 1.v (inter-laboratory sensory analytical technique standardisation using replicate
sets of unknown frozen fish (0-14 days post-mortem) was changed by partners because of
doubts about practicability of, and legal position on, shipping food samples in various
stages of decay across national frontiers. No two fish of the same species are the same
anyway and panellists in the different countries have no experience in tasting the species
which would have been prepared in Scotland. It was also felt that the exercise had no
relevance to the rest of the project as each partner country would be following the
spoilage of its own particular allocated species, although there was some experimentation
with species prepared by the Scottish industrial partners. The standardisation that was,
13
therefore, agreed upon was to use both the Torry/EU schemes and the QIM schemes for
the species concerned where these both existed and train the panels accordingly.
Sub-task 1.vi (the production of laboratory model simulations of fish handling/
processing/ merchandising sequence) was completed by month 15. The results are
reported in University of Hull Annual Report for period 01-10-98 to 30-09-99 section 3.1
in Periodic report No. 2 as well as in country results.
The idea of using the industrial simulation model to show the effect of the temperature
variations typically involved in the fish supply chain was pursued in depth by the UK
partner, partly because chilled display of previously frozen fish was considered less
common for the species and countries of the other partners, partly because most of the
literature deals with fish spoilage at 0°C in melting ice and partly because each partner
wished to extend this part of the investigation along avenues which the plenary meetings
considered would better assist the validation of the technique and development of the
methodology for use by the industry.
Sub-task 1.vii (relationship between P-ratio and decomposition index (for different
species) to be established) was programmed for completion by month 21 was, in fact,
continued to the end of the project – much of the experimental data presented in the
periodic and final reports from each partner are concerned with this particular project
sub-task. There has also been an agreed divergence of species studied from the original
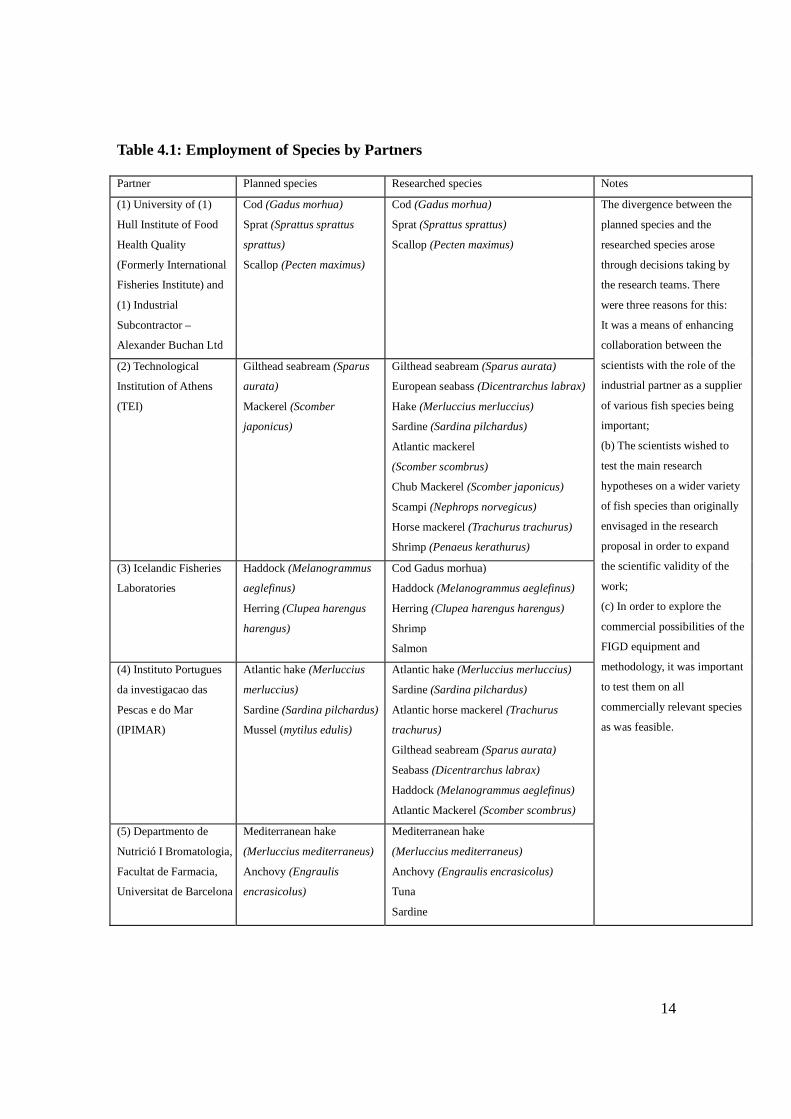
programme. This divergence is summarised in Table 4.1.
14
Table 4.1: Employment of Species by Partners
Partner Planned species Researched species Notes
(1) University of (1)
Hull Institute of Food
Health Quality
(Formerly International
Fisheries Institute) and
(1) Industrial
Subcontractor –
Alexander Buchan Ltd
Cod (Gadus morhua)
Sprat (Sprattus sprattus
sprattus)
Scallop (Pecten maximus)
Cod (Gadus morhua)
Sprat (Sprattus sprattus)
Scallop (Pecten maximus)
(2) Technological
Institution of Athens
(TEI)
Gilthead seabream (Sparus
aurata)
Mackerel (Scomber
japonicus)
Gilthead seabream (Sparus aurata)
European seabass (Dicentrarchus labrax)
Hake (Merluccius merluccius)
Sardine (Sardina pilchardus)
Atlantic mackerel
(Scomber scombrus)
Chub Mackerel (Scomber japonicus)
Scampi (Nephrops norvegicus)
Horse mackerel (Trachurus trachurus)
Shrimp (Penaeus kerathurus)
(3) Icelandic Fisheries
Laboratories
Haddock (Melanogrammus
aeglefinus)
Herring (Clupea harengus
harengus)
Cod Gadus morhua)
Haddock (Melanogrammus aeglefinus)
Herring (Clupea harengus harengus)
Shrimp
Salmon
(4) Instituto Portugues
da investigacao das
Pescas e do Mar
(IPIMAR)
Atlantic hake (Merluccius
merluccius)
Sardine (Sardina pilchardus)
Mussel (mytilus edulis)
Atlantic hake (Merluccius merluccius)
Sardine (Sardina pilchardus)
Atlantic horse mackerel (Trachurus
trachurus)
Gilthead seabream (Sparus aurata)
Seabass (Dicentrarchus labrax)
Haddock (Melanogrammus aeglefinus)
Atlantic Mackerel (Scomber scombrus)
(5) Departmento de
Nutrició I Bromatologia,
Facultat de Farmacia,
Universitat de Barcelona
Mediterranean hake
(Merluccius mediterraneus)
Anchovy (Engraulis
encrasicolus)
Mediterranean hake
(Merluccius mediterraneus)
Anchovy (Engraulis encrasicolus)
Tuna
Sardine
The divergence between the
planned species and the
researched species arose
through decisions taking by
the research teams. There
were three reasons for this:
It was a means of enhancing
collaboration between the
scientists with the role of the
industrial partner as a supplier
of various fish species being
important;
(b) The scientists wished to
test the main research
hypotheses on a wider variety
of fish species than originally
envisaged in the research
proposal in order to expand
the scientific validity of the
work;
(c) In order to explore the
commercial possibilities of the
FIGD equipment and
methodology, it was important
to test them on all
commercially relevant species
as was feasible.
15
Sub-task 1.viii (interlaboratory sample exchanges) was programmed for completion by
month 27 was, in fact, repeated and only completed by the end of the project. The
exchange of sample extracts from the different partner laboratories taken under this sub-
task did not occur exactly as envisaged in the proposal. It was felt that the objective of the
exercise could be achieved through the industrial partner preparing, coding and
distributing the extracts, as in the first such exercise, then collating the data and
identifying the samples for the partners to interpret the results. Herring was used to
prepare the extracts which were distributed at the Barcelona meeting for the second
collaborative study and at the Reykjavik meeting for the third collaborative study.
In respect of the various scientific investigations the project flourished, and proved an
excellent tool for research. For example, the UK partner examined the disappearance of
TMAO as a freshness/spoilage index using FIGD; the Greek partner examined additional
species and the relationship of FIGD with microbiological data as well as sensory data
through iced storage; the Icelandic partner developed the FIGD equipment so that it was
more industry user friendly and the relationship of FIGD with electrical conductance data
as well as sensory data through iced storage; the Portuguese partner examined in more
detail the relationship of FIGD with sensory data obtained using the QIM schemes
developed for their experimental species and with the same biochemical data obtained
using the Conway Microdiffusion Technique; and the Spanish partner examined the
relationship of FIGD (including TMAO data) with evolution of biogenic amines
(determined using HPLC) Ph and microbiological data as well as sensory data through
iced storage.
4.3 Task 2
4.3.1 Outline of Task 2
Task 2 required the project to adapt the sampling procedure to make the FIGD
methodology more suitable for commercial, on-line operation for freshness monitoring.
16
The project has made some progress, but within the timescale it has not been possible to
finalise the techniques. Two achievements which might be mentioned in this context are
the development of an improved version of the FIGD box by the Icelandic partner and the
industrial trial by the UK partner.
4.3.2 Sub-tasks associated with Task 2
Sub-tasks 2.i (the development of a methodology to obtain an exudate) and 2.ii (the
investigation of P-ratios from exudates) continued to the end of the project as no
methodology which would allow operation of the technique to be located in food
processing areas had been found within the scheduled timescale. Development work
focused upon the use of exudates (rather than trichloracetic acid extracts) which have
been obtained by freezing then thawing the samples. Although it was possible to obtain
exudates sufficient for analysis on line, none of the exudates proved representative of the
whole fish with a reliability that would enable a line supervisor to make an accept/reject
decision with a satisfactory degree of confidence. IFL refers to the difficulty of obtaining
satisfactory exudate, an experience shared by others (TEI, IFHQ).
4.4 Task 3
4.4.1 Outline of Task 3
Task 3 required the project to conduct on-line factory trials using the FIGD methodology.
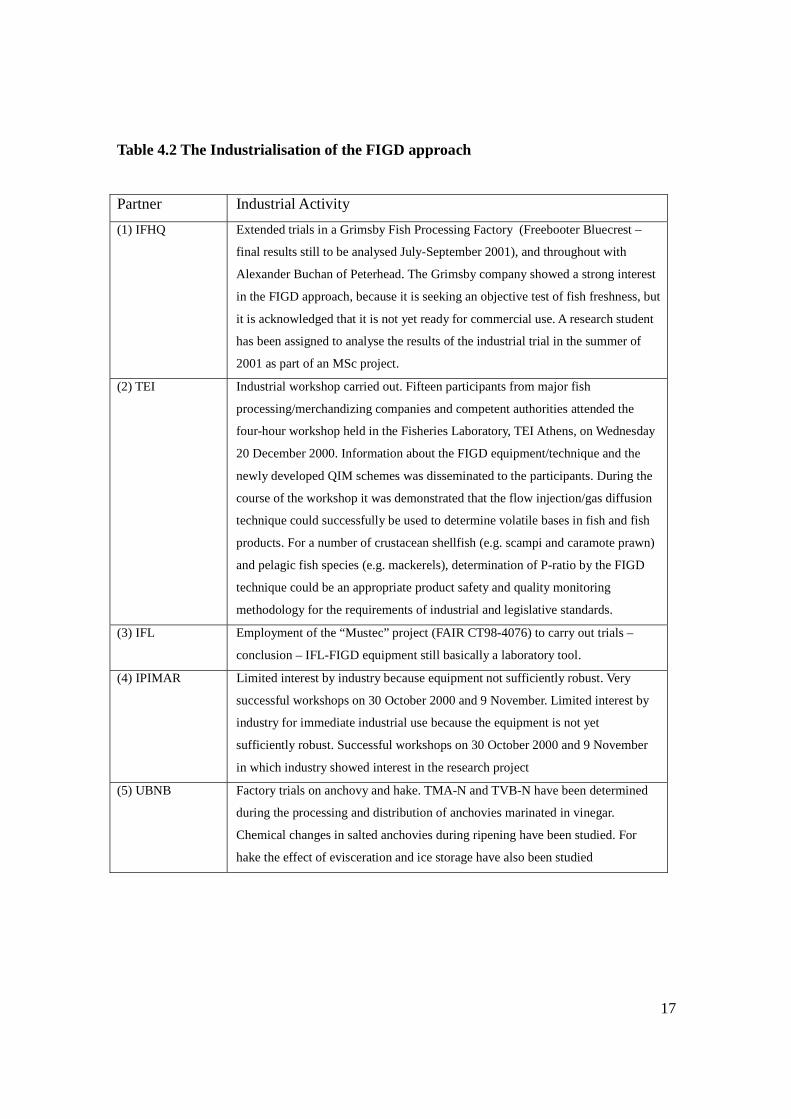
In the context of what has been achieved by the project, each partner has attempted to
test the FIGD approach in an industrial context are summarised in Table 3.2.
17
Table 4.2 The Industrialisation of the FIGD approach
Partner Industrial Activity
(1) IFHQ Extended trials in a Grimsby Fish Processing Factory (Freebooter Bluecrest –
final results still to be analysed July-September 2001), and throughout with
Alexander Buchan of Peterhead. The Grimsby company showed a strong interest
in the FIGD approach, because it is seeking an objective test of fish freshness, but
it is acknowledged that it is not yet ready for commercial use. A research student
has been assigned to analyse the results of the industrial trial in the summer of
2001 as part of an MSc project.
(2) TEI Industrial workshop carried out. Fifteen participants from major fish
processing/merchandizing companies and competent authorities attended the
four-hour workshop held in the Fisheries Laboratory, TEI Athens, on Wednesday
20 December 2000. Information about the FIGD equipment/technique and the
newly developed QIM schemes was disseminated to the participants. During the
course of the workshop it was demonstrated that the flow injection/gas diffusion
technique could successfully be used to determine volatile bases in fish and fish
products. For a number of crustacean shellfish (e.g. scampi and caramote prawn)
and pelagic fish species (e.g. mackerels), determination of P-ratio by the FIGD
technique could be an appropriate product safety and quality monitoring
methodology for the requirements of industrial and legislative standards.
(3) IFL Employment of the “Mustec” project (FAIR CT98-4076) to carry out trials –
conclusion – IFL-FIGD equipment still basically a laboratory tool.
(4) IPIMAR Limited interest by industry because equipment not sufficiently robust. Very
successful workshops on 30 October 2000 and 9 November. Limited interest by
industry for immediate industrial use because the equipment is not yet
sufficiently robust. Successful workshops on 30 October 2000 and 9 November
in which industry showed interest in the research project
(5) UBNB Factory trials on anchovy and hake. TMA-N and TVB-N have been determined
during the processing and distribution of anchovies marinated in vinegar.
Chemical changes in salted anchovies during ripening have been studied. For
hake the effect of evisceration and ice storage have also been studied
18
4.4.2 Sub-tasks associated with Task 3
Sub-task 3.i was to establishing agreements with and training appropriate industrial
partners to conduct on-line trials of P-ratio determination using FIGD methodology and
collect the data therefrom and Sub-task 3.ii was the assessment of the effectiveness of P-
ratio determination using the FIGD and (if proved valid) the exudate sampling
methodology as a routine fish freshness quality monitoring technique in
industrial/commercial situations. As noted above partners approached these sub-tasks in
different ways, appropriate to their own industrial situation.
5. DISCUSSION OF RESULTS
5.1 Principal general results
The collation of P-ratio data on the different species investigated by different partner
laboratories under Task 1. (which continued to the end of the project) suggests that P-
ratio is a less reliable indicator of the end of shelf life than was suggested by the end of
the first QUALPOISS project. This conclusion is the main result of the research project.
From the first inter-laboratory collaborative QUALPOISS study, it appeared that a P-ratio
of < 5% indicated that the fish is of EEC 'E' or 'A' grade freshness quality, whereas a P-
ratio > 20% (P fitness upper limit) suggested that the fish is of EEC 'B' grade to unfit
freshness quality. This conclusion from the first study arose from storage trials of white-
fleshed, demersal species. When such fish are kept at higher storage temperatures,
however, the use of this conclusion as a guide to freshness quality would tend to lead
more frequently (12% of samples, cf. 6% of samples stored at 0°C on this data) to the
rejection of fish before the expiry of its sensory fitness for processing into consumer
products. Only 2% of fish stored at 0°C and 3% of fish stored at 4°C, however, would be
likely to be rejected on sensory grounds before rejection on P-ratio grounds.
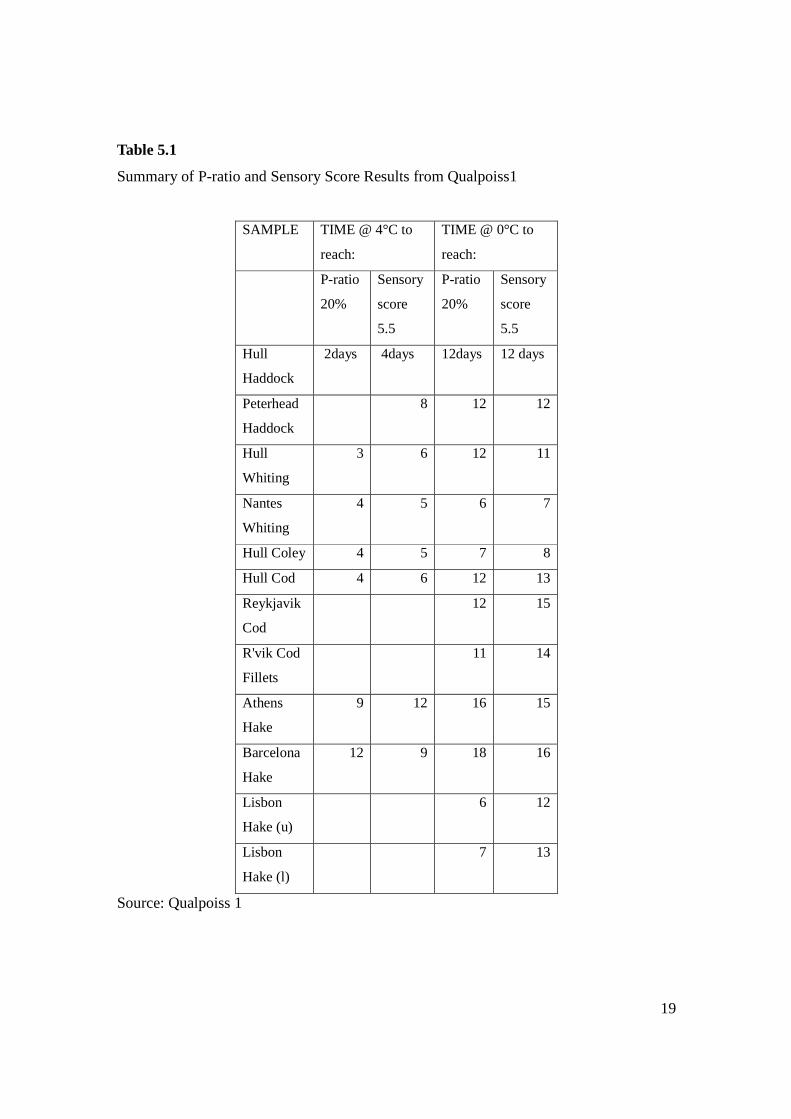
The following table compared the time taken for respective P-ratios and sensory scores to
reach theses limits.
19
Table 5.1
Summary of P-ratio and Sensory Score Results from Qualpoiss1
SAMPLE TIME @ 4°C to
reach:
TIME @ 0°C to
reach:
P-ratio
20%
Sensory
score
5.5
P-ratio
20%
Sensory
score
5.5
Hull
Haddock
2days 4days 12days 12 days
Peterhead
Haddock
8 12 12
Hull
Whiting
3 6 12 11
Nantes
Whiting
4 5 6 7
Hull Coley 4 5 7 8
Hull Cod 4 6 12 13
Reykjavik
Cod
12 15
R'vik Cod
Fillets
11 14
Athens
Hake
9 12 16 15
Barcelona
Hake
12 9 18 16
Lisbon
Hake (u)
6 12
Lisbon
Hake (l)
7 13
Source: Qualpoiss 1
20
In the second (current) study, levels of TMA in some species observed (anchovy, sardine,
horse mackerel, sea bream, sea bass) remained very low (often <2mg TMA-N/100g flesh)
throughout the storage period. The standard deviation as a percentage of the sample mean
is very high for replicate observations on fish with such low levels which in turn makes
the P-ratio a less reliable index. The P-ratio was, however, an index of similar usefulness
(i.e. similar to the first study ranges of P-ratio being found) for other species: herring,
shrimp, skate, monkfish and scallops.
An alternative index, the H-factor, which takes into account the disappearance of TMAO
as well as the evolution of TMA and other volatile bases, has been proposed by the UK
partner as worthy of further investigation.
On this basis, the P-ratio appeared to show potential usefulness as an objective indicator
of the approach of the end of the "good" freshness quality shelf life of fish at 0°C. (The
Lisbon Hake results were an exception to this, but the P-ratios, in this case, showed a
widely distorted upward trend with time due to the large effect of experimental
error/inter-individual variation in readings taken whilst TVB-N and TMA-N
concentrations remained very low.) When the fish was stored at slightly higher (typical
refrigerator) temperatures, however, the surpassing of the 20% upper limit for P-ratio
usually (with the exception of the "Barcelona Hake" samples) preceded the sensory
indication of loss of freshness quality.
Having completed this three-year programme, it appeared that the FIGD methodology
could give data on the flesh concentration of these volatile bases and precursor in a wide
range of different species of marine demersal and pelagic fish and shellfish which is at
least as accurate and reliable as the long-established methods against which it was tested.
Also data obtained for replicate samples amongst the different laboratories coincided
more closely than the data obtained for the replicates using the established methods.
However the finding of this second phase is that TMA and TVB levels increase over the
entire storage period but imperceptibly over the period when the fish could be deemed
“fresh”. TMAO levels, on the other hand, appear to fall over the first days of storage but,
21
again, only gradually. The up and down variation in these results, obtained when different
fish or different parts of the same fish are used to follow the changes in these substances
with time of storage, over the first 7 days of storage, can be greater than the mean
increase.
The use, therefore, of the concentration of any single one of these substances as an index
of spoilage is limited by the lack of sensitivity over precisely the period up to when the
fish appears obviously spoiled. Malle and Poumeyrol ( ) suggested that the % ratio of
TMA to TVB (P-ratio) was somewhat more sensitive (than TMA, TVB or TMAO
concentrations) as an index of spoilage over the first few days. The data accumulated
through the activities of the six partner laboratories of this project suggests that P-ratio is
no better an index of freshness than the level of TMA or TVB.
As TMA is largely, if not entirely, derived from the reduction of TMAO through
prolonged storage of fish, the ratio of TMA to TMAO plus TMA (S-ratio) has also been
examined for its potential as an index, but this appeared to promise no more sensitive an
index of spoilage in the early period than did P-ratio.
Dividing the P-ratio by the S-ratio produces the ratio of TMAO plus TMA to TVB (H-
factor). During the initial period of storage, theory has suggested that some of the
TMAO is lost, not because it is reduced by spoilage bacteria to TMA, but, like in frozen
storage, it is converted enzymically to DMA. The later is one of the volatile bases making
up the TVB concentration. The value {[TMAN] + [TMAON]}/ [TVBN], with the
numerator decreasing and the denominator increasing due to this suggested DMA
production, consequently exaggerates the effect which, if it happens, could make the ratio
more sensitive as an index of spoilage in the first few days of storage.
This period is the one which is of greatest concern to the chilled fish products industry.
To be able to predict the remaining shelf-life (RSL) of packaged chilled fish by objective
chemical means as well as by sensory analysis would be a bonus in marketing such
products. The fish processing industry refers to the age of its incoming fish supplies as
“Harvest plus however many days it has been kept since then. So H + 5 means the fish
22
has been kept in ice for 5 days since capture. For this reason, the ratio {[TMAN] +
[TMAON]}/ [TVBN] has been referred to as the H-factor.
On the evidence of preliminary trials by the UK partner, the methodology looked more
promising as a means of establishing an objective index of RSL It was, therefore,
suggested that further investigation of H-factor by FIGD be pursued to establish its
accuracy as a RSL predictor for the industry – especially for those species of fish which
are being increasingly imported to meet EU demands as its own shortfall in fish supply
widens.
IPIMAR’s and results suggest that TVB and TMA-N are valuable indices in assessing the
degree of fish deterioration, but do not accurately enough distinguish difference freshness
grades, and that detailed information concerning the early stages of freshness and their
differentiation cannot be obtained by these chemical indices. UB also found that TMA-N
was more suitable as an indicator of spoilage rather than freshness. Also it appears from
IPIMAR’s results that, for horse mackerel and for sardine, the volatile nitrogen
compounds change over the year, being low in January, increasing to a maximum
between July and October and decreasing again towards the end of the year. TMAO-N
appears to decrease as QIM (Quality Index Method) scores increase, but it does not
appear to be a good freshness indicator due to different initial conditions. Similar
problems with the development of the volatile bases emerged from the work by TEI. IFL
concluded that TMA and TVB values do not increase significantly in most sea foods until
after 8-10 days of storage, when the signs of spoilage become clearer using other
methods of assessment. Therefore TMA and TVB add little new information about fish
freshness or as predictors of the future shelf life of the fish. However, IFL believes that
the IFL-developed FIGD equipment might be used to adjudicate when there is a
disagreement about freshness. Work conducted at IFHQ demonstrated that the evolution
of TVB and TMA during a typical processing time temperature profile could be seen to
increase only after relatively long periods (>8 hours) of storage at temperatures >5°C
which would not be encountered during commercial processing. The chief value of the
IFL-FIGD equipment is in the laboratory.
23
5.2 Subsidiary results
5.2.1 Inter-laboratory sensory analysis of fish standardisation
The distribution of sensory analysis samples between the different partners was deemed
to be impractical since not all sensory panels would be familiar or trained with an
individual fish species and none of the species being investigated is common to all the
partners' countries. It was therefore decided at the Athens plenary meeting that the
standardisation of sensory analysis should be in the form of where a species was common
between two or more partners, the sensory schemes and attributes to be used would be
standardised. This has been carried out for the analysis of both raw and cooked fish, the
sensory panels have been trained and assessments have been made during storage trials
under standard conditions (refrigerated storage on ice).
The assumption that a standard model of time and temperature during the processing
chain for all fish species being investigated could be established, although ideal, has been
found to be impractical. The main reason is the differences in the time period that either
the individual species are characterised as fresh, both by sensory and chemical analysis
and the rate at which any significant changes in either sensory characteristic or chemical
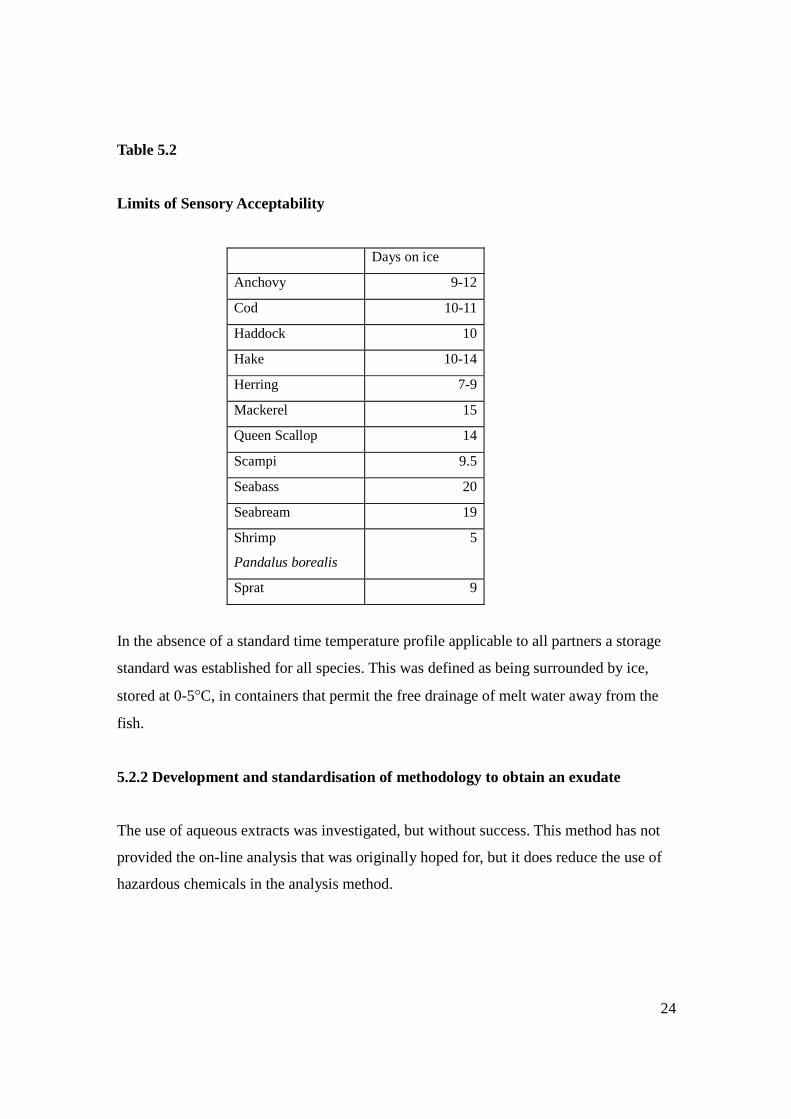
indices are noticeable. Table 11 illustrates the substantial variability in sensory
characteristics between species. In addition the temperature and conditions experienced
during processing within each country was shown to differ.
24
Table 5.2
Limits of Sensory Acceptability
Days on ice
Anchovy 9-12
Cod 10-11
Haddock 10
Hake 10-14
Herring 7-9
Mackerel 15
Queen Scallop 14
Scampi 9.5
Seabass 20
Seabream 19
Shrimp
Pandalus borealis
5
Sprat 9
In the absence of a standard time temperature profile applicable to all partners a storage
standard was established for all species. This was defined as being surrounded by ice,
stored at 0-5°C, in containers that permit the free drainage of melt water away from the
fish.
5.2.2 Development and standardisation of methodology to obtain an exudate
The use of aqueous extracts was investigated, but without success. This method has not
provided the on-line analysis that was originally hoped for, but it does reduce the use of
hazardous chemicals in the analysis method.
25
5.2.3 IFHQ – Hull
The experience of working with industrial partners, in Peterhead (Alexander Buchan) and
in Grimsby (Freebooter Bluecrest) was important. It suggested in general that fish
processors have an ongoing need for an applied research input to progress questions
related to traceability, on-line monitoring, and assessment of grades. IFHQ has assigned a
research student to analyse the results of the collaboration with the Grimsby company
during the summer of 2001. However, we do not expect the scientific results to alter
materially the basic conclusion of the project set out under 5.1 above.
5.2.4 TEI - Athens
Sea bream is one of the study species. The TEI team found that feed affects TMAO
levels. Sea bass is another important commercial species in Greece but the small
amounts of TMAO in the species make it unsuitable for this study. Only 1.5 mg TMAN
/100 g fish after 15 days storage, but the situation for sea bream is not much better.
Nevertheless the FIGD equipment is capable of determining very small concentrations.
The pH level important for TVB and TMA determinations - if it is too high, secondary
deamination occurs producing a falsely high result.
5.2.5 IFL - Iceland
IFL investigated the use of fish eyes for the determination of TVB and TMA, since
although the eyes may be used in freshness grading, they are not part of the final fillet.
Although initial results show that the values obtained during storage trial were
comparable although lower than values obtained from the fillet muscle, this method
would only be suitable for large whole fish and could not therefore be employed with
many of the fish species being investigated as part of this project. IFHQ has attempted
several approaches to obtaining a suitable exudate, such as squeezing muscle, using
"drip" and soaking muscle tissue, the latter two methods showing limited success.
26
5.2.6 IPIMAR - Lisbon
Sardine is one of the pelagic species to be studied but when stored at 0°C for the 8-10
days after capture, flesh TMA concentrations are still too low to measure.
Mussel is not an important species in Portugal therefore IPIMAR has little research
experience with it. Could the study species be changed in this case? Shellfish have been
included in the study due to an enquiry from Scofro Foods (Fort William) Christine
Monzie via Alex Buchan. They are an industry who process scallops and wanted a
standardised method for chemical assessment of scallop (Pecten virens) quality. Uglow
(pers.com.) has shown that live mussels, when kept out of water prior to cooking show
flesh concentration of TMA increasing with time of storage, so an in-depth study of this
would be interesting. But, for the Portuguese study, octopus or squid would be a more
relevant study subject for which it is possible to get fresher supplies (i.e. direct from the
boat). It was, therefore, agreed to change the IPIMAR shellfish study subject from
mussel to squid.
5.2.7 UBNB - Spain
Mediterranean hake and anchovy were the allotted study species, which could be
obtained fresh and appeared suitable for a P-ratio study. Histamine analysis might also
be useful in the case of anchovy. Dr Ruiz-Capillas is in the process of developing a
FIGD methodology for this.
27
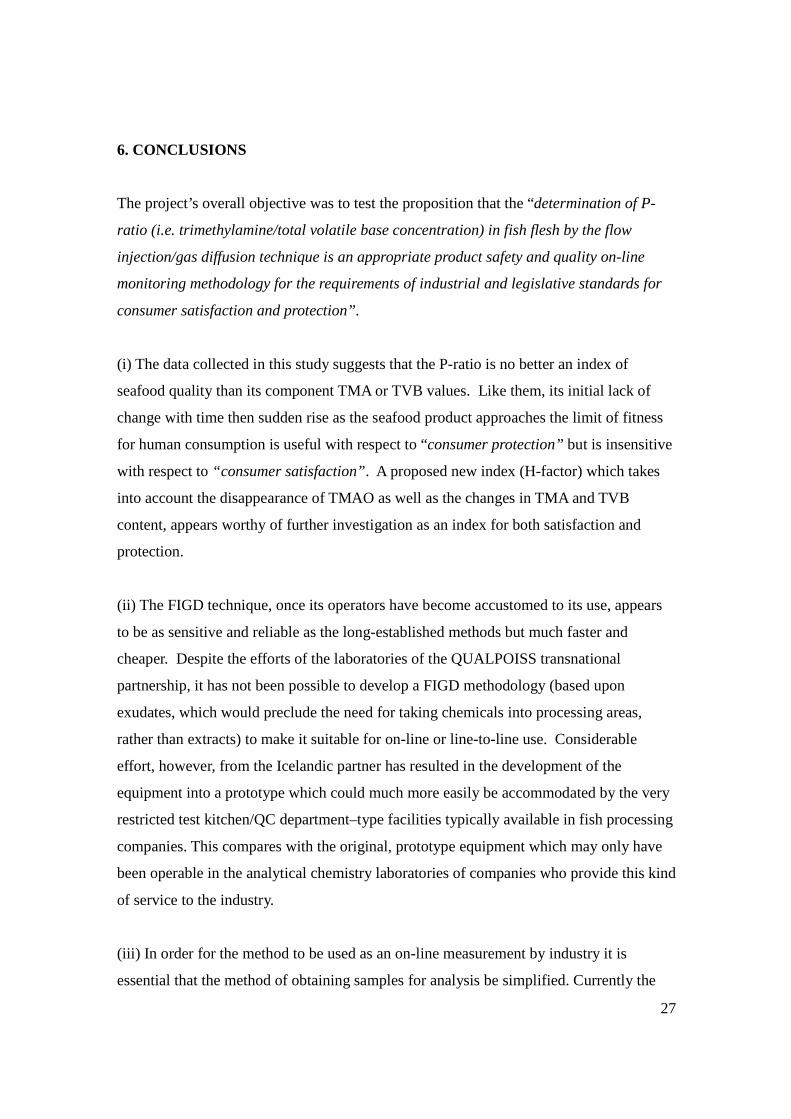
6. CONCLUSIONS
The project’s overall objective was to test the proposition that the “determination of P-
ratio (i.e. trimethylamine/total volatile base concentration) in fish flesh by the flow
injection/gas diffusion technique is an appropriate product safety and quality on-line
monitoring methodology for the requirements of industrial and legislative standards for
consumer satisfaction and protection”.
(i) The data collected in this study suggests that the P-ratio is no better an index of
seafood quality than its component TMA or TVB values. Like them, its initial lack of
change with time then sudden rise as the seafood product approaches the limit of fitness
for human consumption is useful with respect to “consumer protection” but is insensitive
with respect to “consumer satisfaction”. A proposed new index (H-factor) which takes
into account the disappearance of TMAO as well as the changes in TMA and TVB
content, appears worthy of further investigation as an index for both satisfaction and
protection.
(ii) The FIGD technique, once its operators have become accustomed to its use, appears
to be as sensitive and reliable as the long-established methods but much faster and
cheaper. Despite the efforts of the laboratories of the QUALPOISS transnational
partnership, it has not been possible to develop a FIGD methodology (based upon
exudates, which would preclude the need for taking chemicals into processing areas,
rather than extracts) to make it suitable for on-line or line-to-line use. Considerable
effort, however, from the Icelandic partner has resulted in the development of the
equipment into a prototype which could much more easily be accommodated by the very
restricted test kitchen/QC department–type facilities typically available in fish processing
companies. This compares with the original, prototype equipment which may only have
been operable in the analytical chemistry laboratories of companies who provide this kind
of service to the industry.
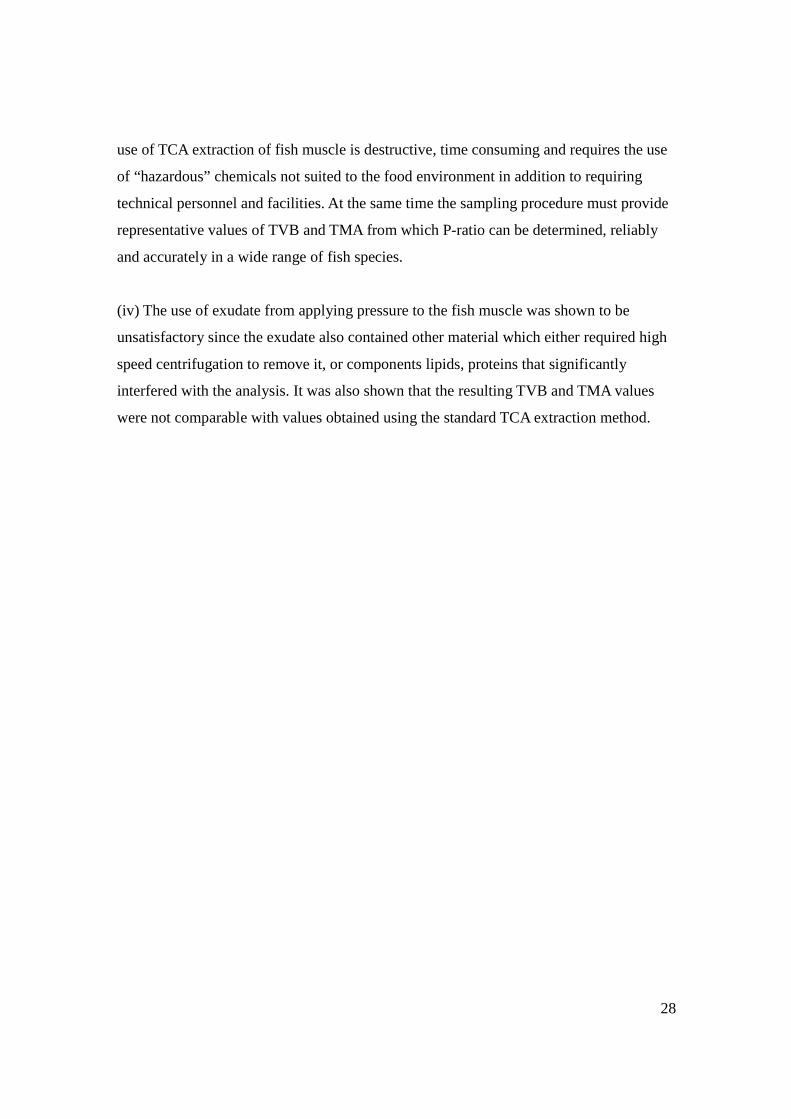
(iii) In order for the method to be used as an on-line measurement by industry it is
essential that the method of obtaining samples for analysis be simplified. Currently the
28
use of TCA extraction of fish muscle is destructive, time consuming and requires the use
of “hazardous” chemicals not suited to the food environment in addition to requiring
technical personnel and facilities. At the same time the sampling procedure must provide
representative values of TVB and TMA from which P-ratio can be determined, reliably
and accurately in a wide range of fish species.
(iv) The use of exudate from applying pressure to the fish muscle was shown to be
unsatisfactory since the exudate also contained other material which either required high
speed centrifugation to remove it, or components lipids, proteins that significantly
interfered with the analysis. It was also shown that the resulting TVB and TMA values
were not comparable with values obtained using the standard TCA extraction method.
29
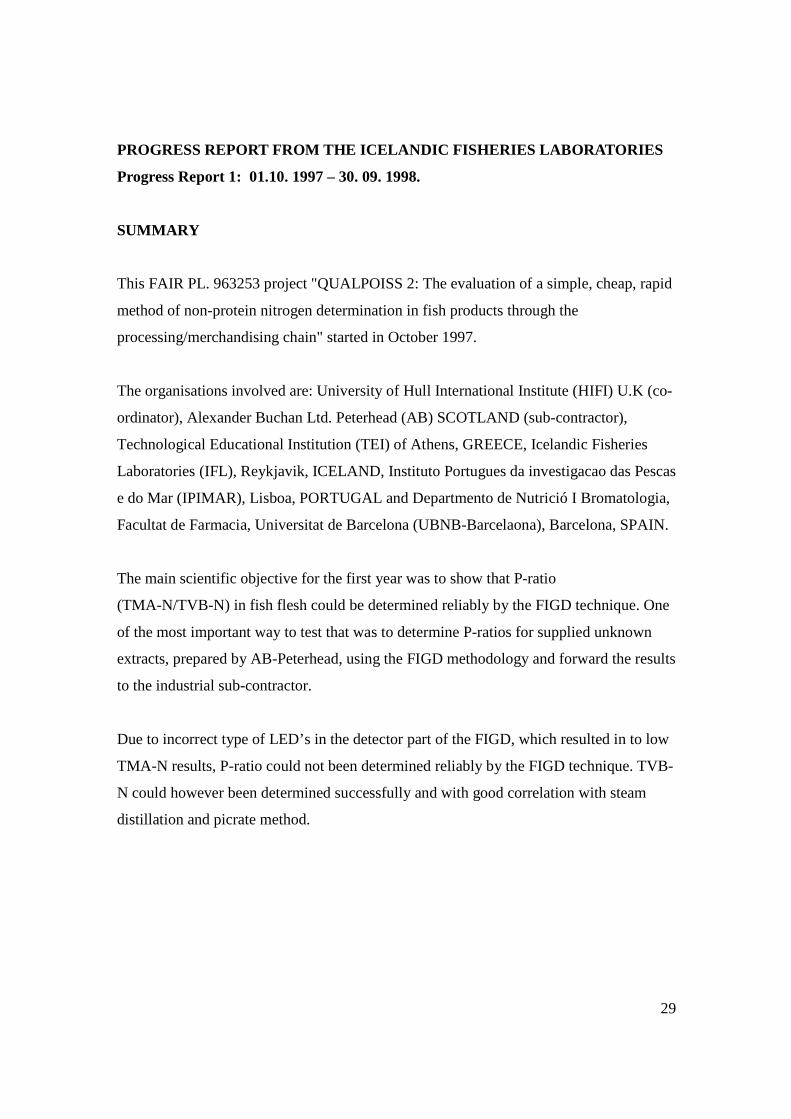
PROGRESS REPORT FROM THE ICELANDIC FISHERIES LABORATORIES
Progress Report 1: 01.10. 1997 – 30. 09. 1998.
SUMMARY
This FAIR PL. 963253 project "QUALPOISS 2: The evaluation of a simple, cheap, rapid
method of non-protein nitrogen determination in fish products through the
processing/merchandising chain" started in October 1997.
The organisations involved are: University of Hull International Institute (HIFI) U.K (co-
ordinator), Alexander Buchan Ltd. Peterhead (AB) SCOTLAND (sub-contractor),
Technological Educational Institution (TEI) of Athens, GREECE, Icelandic Fisheries
Laboratories (IFL), Reykjavik, ICELAND, Instituto Portugues da investigacao das Pescas
e do Mar (IPIMAR), Lisboa, PORTUGAL and Departmento de Nutrició I Bromatologia,
Facultat de Farmacia, Universitat de Barcelona (UBNB-Barcelaona), Barcelona, SPAIN.
The main scientific objective for the first year was to show that P-ratio
(TMA-N/TVB-N) in fish flesh could be determined reliably by the FIGD technique. One
of the most important way to test that was to determine P-ratios for supplied unknown
extracts, prepared by AB-Peterhead, using the FIGD methodology and forward the results
to the industrial sub-contractor.
Due to incorrect type of LED’s in the detector part of the FIGD, which resulted in to low
TMA-N results, P-ratio could not been determined reliably by the FIGD technique. TVB-
N could however been determined successfully and with good correlation with steam
distillation and picrate method.
30
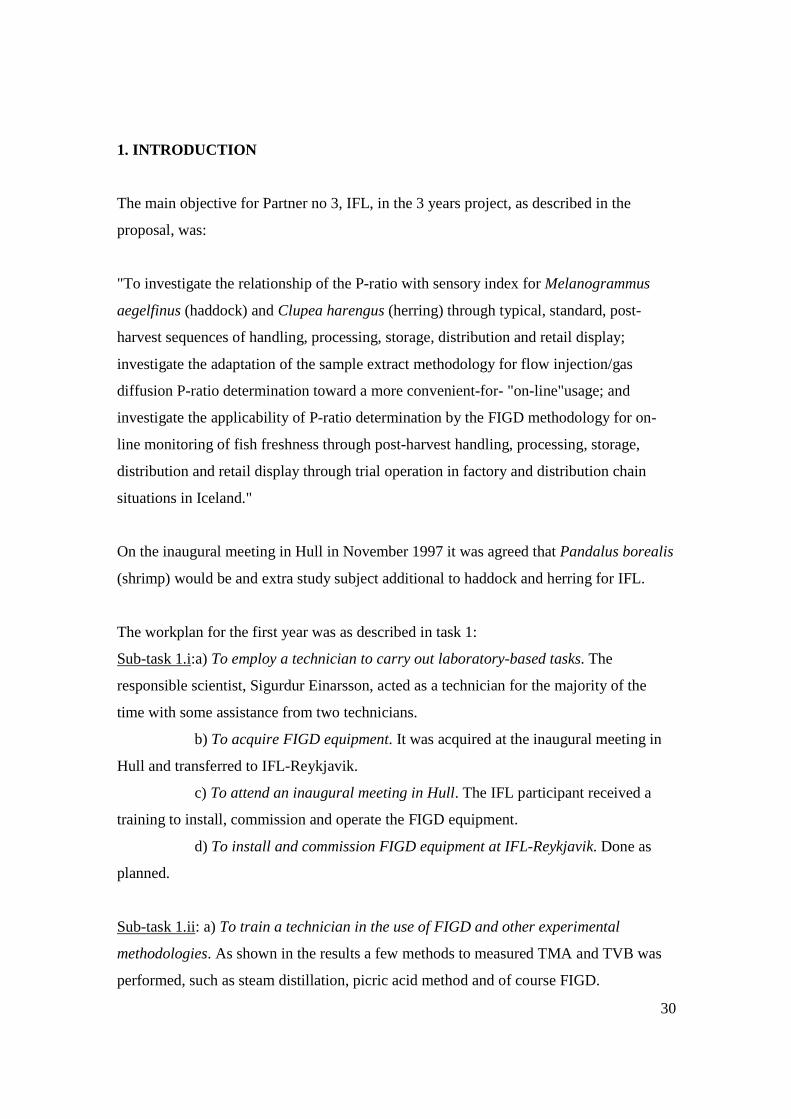
1. INTRODUCTION
The main objective for Partner no 3, IFL, in the 3 years project, as described in the
proposal, was:
"To investigate the relationship of the P-ratio with sensory index for Melanogrammus
aegelfinus (haddock) and Clupea harengus (herring) through typical, standard, post-
harvest sequences of handling, processing, storage, distribution and retail display;
investigate the adaptation of the sample extract methodology for flow injection/gas
diffusion P-ratio determination toward a more convenient-for- "on-line"usage; and
investigate the applicability of P-ratio determination by the FIGD methodology for on-
line monitoring of fish freshness through post-harvest handling, processing, storage,
distribution and retail display through trial operation in factory and distribution chain
situations in Iceland."
On the inaugural meeting in Hull in November 1997 it was agreed that Pandalus borealis
(shrimp) would be and extra study subject additional to haddock and herring for IFL.
The workplan for the first year was as described in task 1:
Sub-task 1.i:a) To employ a technician to carry out laboratory-based tasks. The
responsible scientist, Sigurdur Einarsson, acted as a technician for the majority of the
time with some assistance from two technicians.
b) To acquire FIGD equipment. It was acquired at the inaugural meeting in
Hull and transferred to IFL-Reykjavik.
c) To attend an inaugural meeting in Hull. The IFL participant received a
training to install, commission and operate the FIGD equipment.
d) To install and commission FIGD equipment at IFL-Reykjavik. Done as
planned.
Sub-task 1.ii: a) To train a technician in the use of FIGD and other experimental
methodologies. As shown in the results a few methods to measured TMA and TVB was
performed, such as steam distillation, picric acid method and of course FIGD.
31
Sub-task 1.iii: a) To determine P-ratios for the supplied unknown extracts using the
FIGD methodology and forward the results to the industrial sub-contractor. Extracts of
haddock and mackerel arrived to IFL from AB-Peterhead Scotland on May 12th 1998 in
good condition. The TMA and TVB-N in the samples were as shown in the results
chapter.
Sub-task 1.iv: a) To employ and train a research assistant. The responsible scientist
carried out the laboratory-based tasks with an assistance form a technician who helped
out with a technical problems regarding the FIGD and another technician who carried out
some of the measurements.
b) To determine P-ratio of fish extracts replicate samples using the FIGD
and other methodologies. Experiments were done to compare TVB-N results measured
by the FIGD technique and steam distillation in shrimp and haddock as the results show
in chapter 3. Due to technical problems with the FIGD the TMA was not measured
during this period.
c) To collate, evaluate and present the results of the inter-laboratory P-
ratio… This part has been postponed until the meeting in Athens in January 1999 where
each participant will present his or her results. After that IFL will collate, evaluate and
present the results and send to each participant.
2. MATERIAL AND METHODS
2.1. Raw material
For sub-task 1.iia, samples of different fish species at different freshness stages were
analysed for TMA-N and TVB-N using FIGD, steam distillation and picrate method.
For sub-task 1.ivb, deep water unpeeled red shrimp (Pandalus borealis) was caught in
August 1998 north of Iceland and stored in ice at an ambient temperature of 1°C for up
to11 days. Haddock (Melanogrammus aeglefinus) was caught SW of Iceland by day boat
in August 1998 and stored in ice at ambient temperature of 1°C for 14 days. TVB-N was
32
measured in the samples on days 1, 3, 5, 8, 10, 12 and 14 by steam distillation, and
picrate method and the FIGD technique.
2.2. Chemical testing
2.2.1. Preparation of sample:
The same preparations were done for all of the following methods except 2.2.6. Fish
extracts for TVB-N and TMA-N determination were prepared by blending 100g samples
of macerated flesh with 200 ml of 7,5% trichloroacetic acid (TCA, Merck 807) for 2 min.
in Waring blender at high speed and filtered the homogenates to produce a clear solution.
2.2.2. Chemical analysis
Flow injection gas diffusion method (FIGD)
APPARATUS
- Ismatec (Reglo-Digital MS-4/8-100) peristaltic pump with variable flow rate
(1-100 rpm), 4 channels and 8 rollers
- Detector (Made by HIFI, Hull)
- Chart recorder (Perkin Elmer 56)
- Gas permeable membrane. PTFE sealing tape nº reference 512-238 (RS Tel:
+44 1536 201201, Fax: +44 1536 201501)
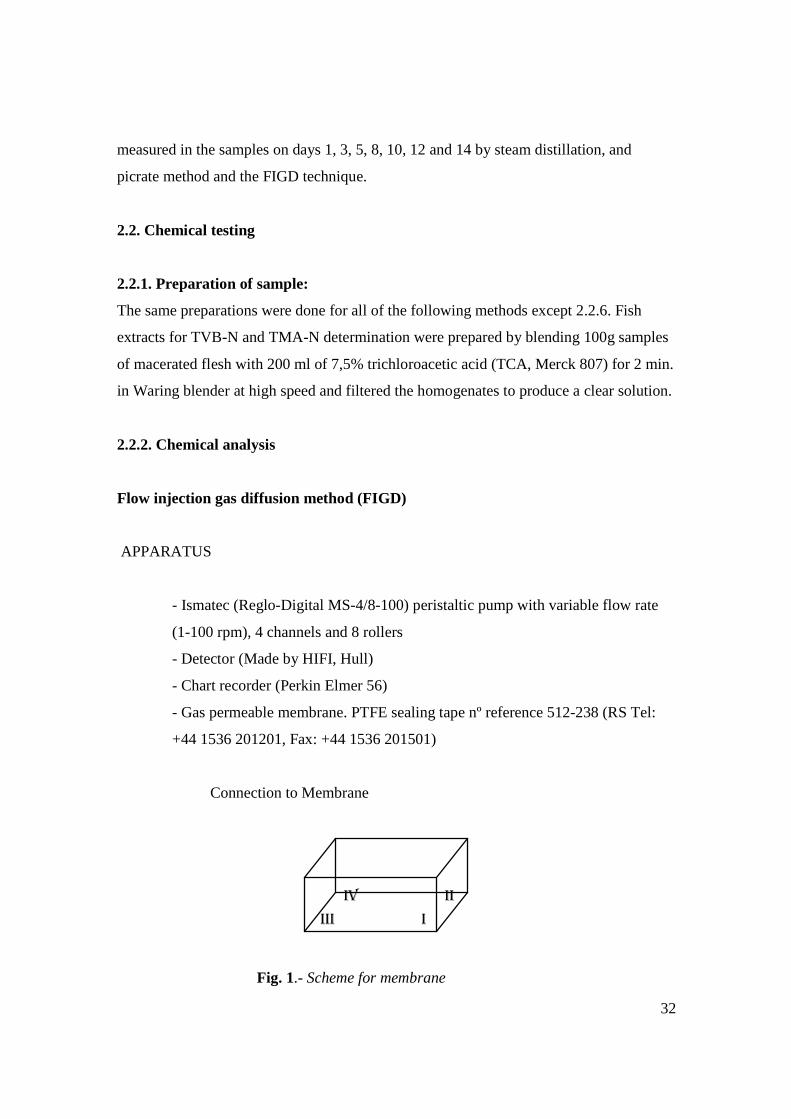
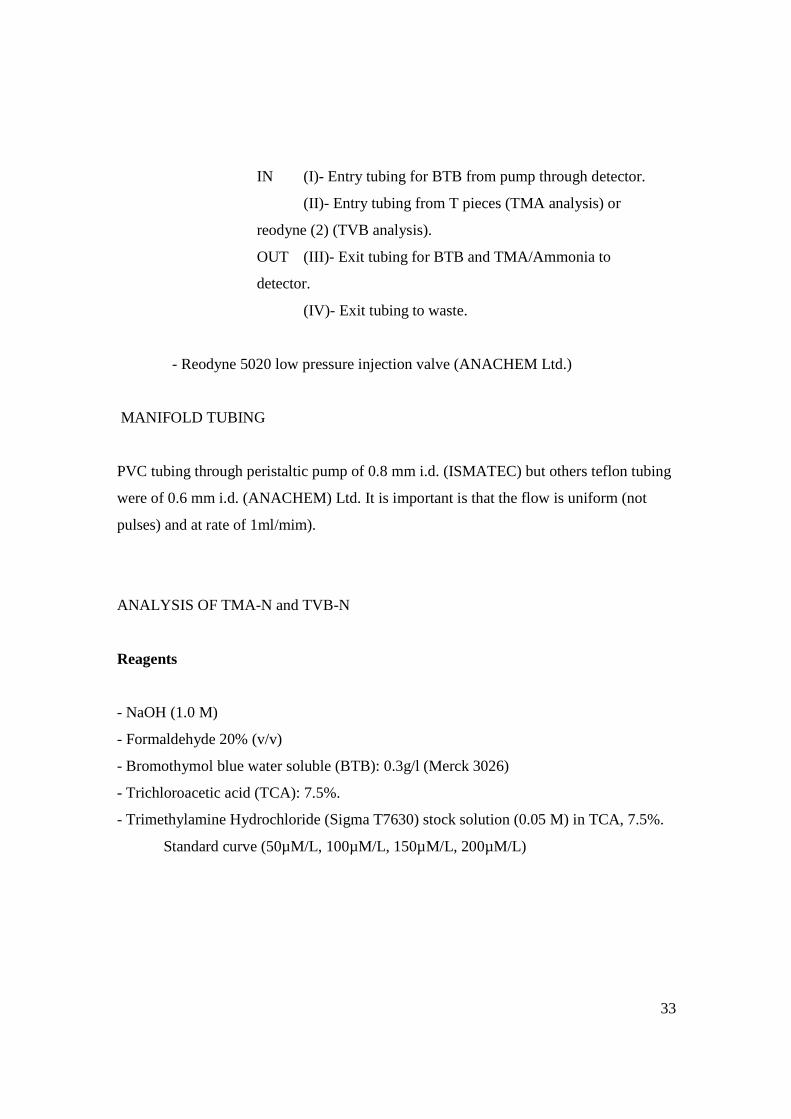
Connection to Membrane
III
IV
I
II
Fig. 1.- Scheme for membrane
33
IN (I)- Entry tubing for BTB from pump through detector.
(II)- Entry tubing from T pieces (TMA analysis) or
reodyne (2) (TVB analysis).
OUT (III)- Exit tubing for BTB and TMA/Ammonia to
detector.
(IV)- Exit tubing to waste.
- Reodyne 5020 low pressure injection valve (ANACHEM Ltd.)
MANIFOLD TUBING
PVC tubing through peristaltic pump of 0.8 mm i.d. (ISMATEC) but others teflon tubing
were of 0.6 mm i.d. (ANACHEM) Ltd. It is important is that the flow is uniform (not
pulses) and at rate of 1ml/mim).
ANALYSIS OF TMA-N and TVB-N
Reagents
- NaOH (1.0 M)
- Formaldehyde 20% (v/v)
- Bromothymol blue water soluble (BTB): 0.3g/l (Merck 3026)
- Trichloroacetic acid (TCA): 7.5%.
- Trimethylamine Hydrochloride (Sigma T7630) stock solution (0.05 M) in TCA, 7.5%.
Standard curve (50µM/L, 100µM/L, 150µM/L, 200µM/L)
34
Calculations
TMA-N and TVB-N are determined as Nitrogen
µM/L(TVB-N) x 10-3 x 14.007 mg/mol x 100g
mg TVB-N /100 g sample=
106 µmol/mol x 333g fish/L
Determination of TVB and TMA using the Flow Injection/ Gas Diffusion (FIGD)
Six standards of ammonia (in the case of the TVB determination) or TMA (in the case of
the TMA determination) in the range of 0-200 micromoles per litre (approximately
equivalent to 0-3 mg TVB or 0-10 mg TMA per 100g fish flesh) were prepared by taking
appropriate dilutions of a 0,5 mM stock solution of ammonium chloride or
trimethylamine crystalline hydrochloride in 7,5% trichloroacetic acid (TCA) solution.
100 microliter quantities of these standards (and samples) were injected into the FIGD
manifold (a Rheodyne 5020 low-pressure injection valve supplied by Anachem, Luton
with a 100-microliter sample loop) which was then closed.
Preparation of the sample:
One part of minced fish muscle was blended with two parts 7,5% TCA solution and
filtered through Whatman No. 1 paper.
Determination of TVB:
The flow of 1,0 M NaOH (1 ml/min) from the peristaltic pump (Ismatec, 4-channel with
variable flow rate) carries the injected liquid (standard or sample) through the mixing coil
alkalising it and releasing its contained nitrogen in the form of ammonia gas. On flowing
through the gas diffusion cell (a laboratory-built gas diffusion cell with channel
dimensions 240mm x 1,5mm x 0,2 mm with a microporous, chemically inert and acid
resistant PTFE membrane RS No. 8003525) this released ammonia passes through the
gas permeable membrane into a 0,3 g/L (pH 6,5) solution of bromothymol blue (BTB)
35
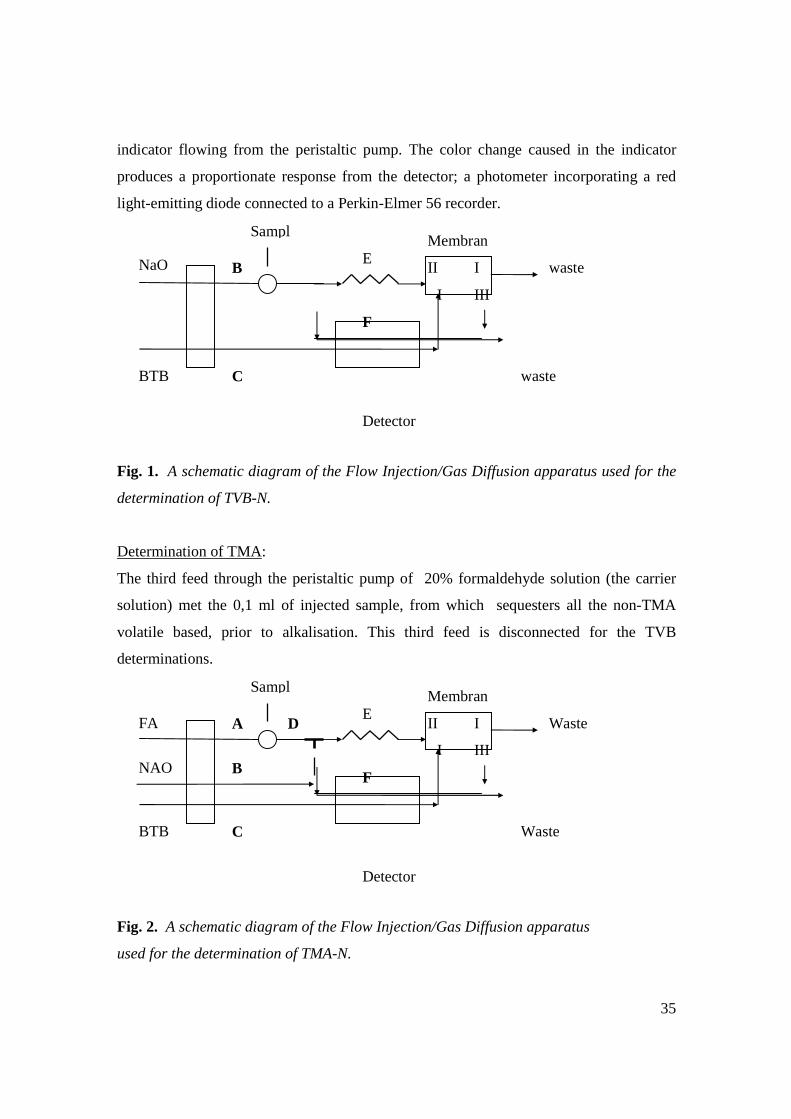
indicator flowing from the peristaltic pump. The color change caused in the indicator
produces a proportionate response from the detector; a photometer incorporating a red
light-emitting diode connected to a Perkin-Elmer 56 recorder.
Fig. 1. A schematic diagram of the Flow Injection/Gas Diffusion apparatus used for the
determination of TVB-N.
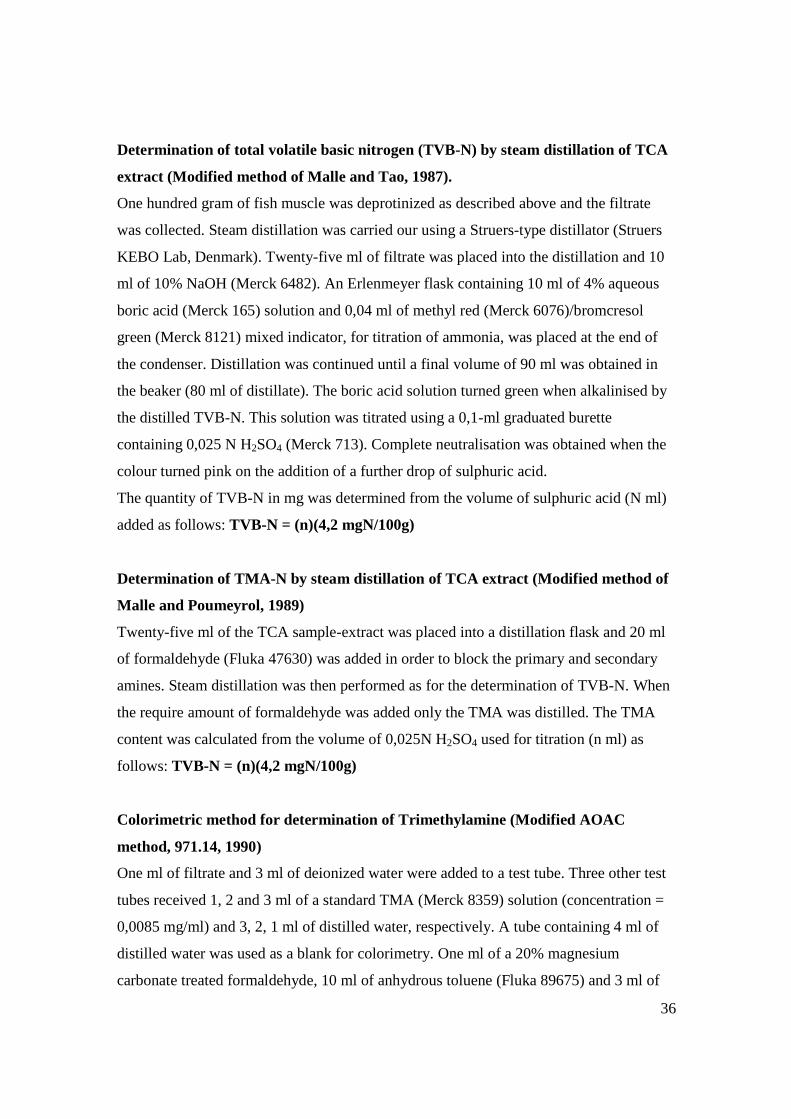
Determination of TMA:
The third feed through the peristaltic pump of 20% formaldehyde solution (the carrier
solution) met the 0,1 ml of injected sample, from which sequesters all the non-TMA
volatile based, prior to alkalisation. This third feed is disconnected for the TVB
determinations.
Fig. 2. A schematic diagram of the Flow Injection/Gas Diffusion apparatus
used for the determination of TMA-N.
FA
NAO
BTB
A
B
D
Sampl
E Membran
Waste
Waste
Detector
C
F
II
I
I
III
NaO
BTB
B
Sampl
E Membran
waste
waste
Detector
C
F
II
I
I
III
36
Determination of total volatile basic nitrogen (TVB-N) by steam distillation of TCA
extract (Modified method of Malle and Tao, 1987).
One hundred gram of fish muscle was deprotinized as described above and the filtrate
was collected. Steam distillation was carried our using a Struers-type distillator (Struers
KEBO Lab, Denmark). Twenty-five ml of filtrate was placed into the distillation and 10
ml of 10% NaOH (Merck 6482). An Erlenmeyer flask containing 10 ml of 4% aqueous
boric acid (Merck 165) solution and 0,04 ml of methyl red (Merck 6076)/bromcresol
green (Merck 8121) mixed indicator, for titration of ammonia, was placed at the end of
the condenser. Distillation was continued until a final volume of 90 ml was obtained in
the beaker (80 ml of distillate). The boric acid solution turned green when alkalinised by
the distilled TVB-N. This solution was titrated using a 0,1-ml graduated burette
containing 0,025 N H2SO4 (Merck 713). Complete neutralisation was obtained when the
colour turned pink on the addition of a further drop of sulphuric acid.
The quantity of TVB-N in mg was determined from the volume of sulphuric acid (N ml)
added as follows: TVB-N = (n)(4,2 mgN/100g)
Determination of TMA-N by steam distillation of TCA extract (Modified method of
Malle and Poumeyrol, 1989)
Twenty-five ml of the TCA sample-extract was placed into a distillation flask and 20 ml
of formaldehyde (Fluka 47630) was added in order to block the primary and secondary
amines. Steam distillation was then performed as for the determination of TVB-N. When
the require amount of formaldehyde was added only the TMA was distilled. The TMA
content was calculated from the volume of 0,025N H2SO4 used for titration (n ml) as
follows: TVB-N = (n)(4,2 mgN/100g)
Colorimetric method for determination of Trimethylamine (Modified AOAC
method, 971.14, 1990)
One ml of filtrate and 3 ml of deionized water were added to a test tube. Three other test
tubes received 1, 2 and 3 ml of a standard TMA (Merck 8359) solution (concentration =
0,0085 mg/ml) and 3, 2, 1 ml of distilled water, respectively. A tube containing 4 ml of
distilled water was used as a blank for colorimetry. One ml of a 20% magnesium
carbonate treated formaldehyde, 10 ml of anhydrous toluene (Fluka 89675) and 3 ml of
37
45% KOH (Merck 5033) were placed in the tubes. The tubes were shaken vigorously by
hand 80 times; 8 ml of the toluene phase was than transferred to a tube containing 0,2 g
of anhydrous sodium sulphate (Merck 6649) and shaken until dehydrated. Five ml of the
dehydrated toluene phase were mixed in another tube with 5 ml of 0,02% picric acid
(Merck 623). Optical densities (OD) were measured using a Cecil Series 2
spectrophotometer at a wavelength of 410 N.M. A standard curve plotted from the
standard solution values was used to determine the quantity of TMA in the samples in mg
from the OD values.
The quantity per 100 ml of fish was given by: (x mg)(300 mg N/100g of fish).
Determination of total basic nitrogen (TVB-N) with the STRUER automatic
distillation unit (Based on the method of N. Antonacopulus, 1968.
Ten grams of macerated fish flesh is placed in a distilling flask (Kjeldahl), 2 g of MgO
(Merck 5862) and 100 ml of distilled water is added. The sample is distilled at a flow of
10 ml/min for 12 min. in a STRUER automatic distillation unit, which has been pre-
heated. The distillate, containing the volatile basic nitrogen is collected in 100 ml of
0,27% boric acid containing 8 drops of Mixed indicator (Merck 6130) and titrated with
0,05 N H2SO4 so it stays at the neutral point during the 12 min. distillation.
Calculation: mg TVB-N = ml 0,1 N acid x 7
38
3. RESULTS AND; 4. DISCUSSION
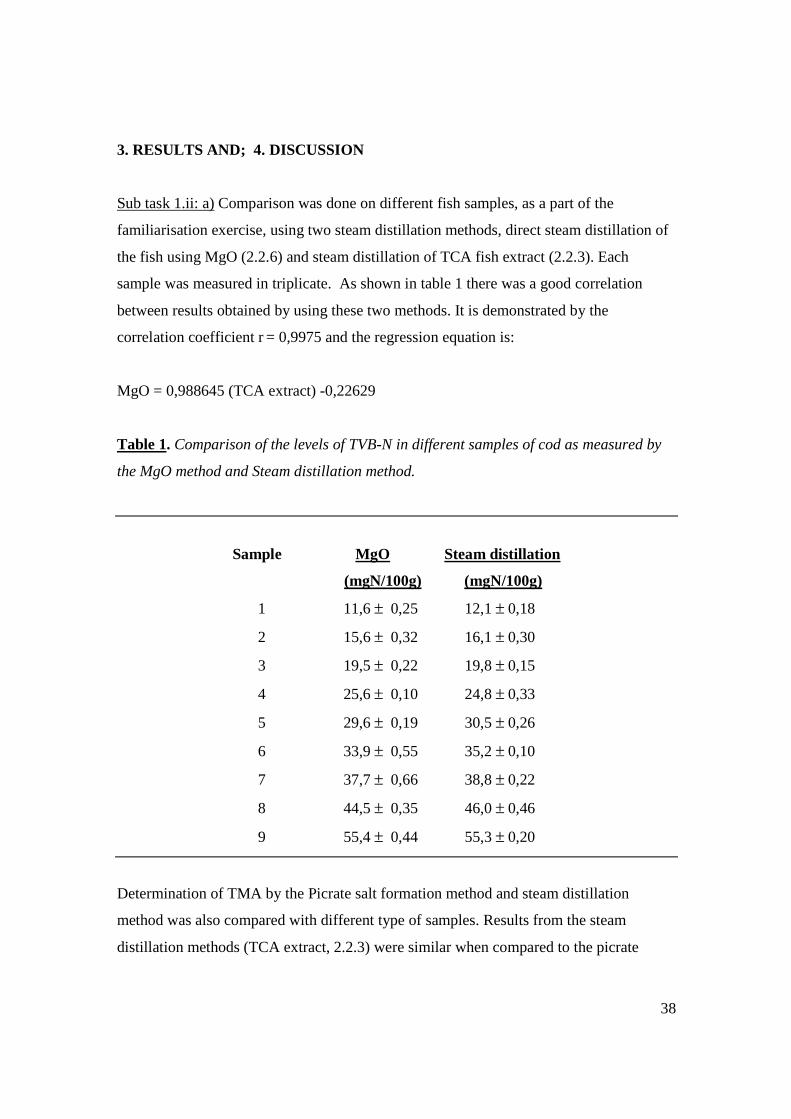
Sub task 1.ii: a) Comparison was done on different fish samples, as a part of the
familiarisation exercise, using two steam distillation methods, direct steam distillation of
the fish using MgO (2.2.6) and steam distillation of TCA fish extract (2.2.3). Each
sample was measured in triplicate. As shown in table 1 there was a good correlation
between results obtained by using these two methods. It is demonstrated by the
correlation coefficient r = 0,9975 and the regression equation is:
MgO = 0,988645 (TCA extract) -0,22629
Table 1. Comparison of the levels of TVB-N in different samples of cod as measured by
the MgO method and Steam distillation method.
Sample MgO Steam distillation
(mgN/100g) (mgN/100g)
1 11,6 ± 0,25 12,1 ± 0,18
2 15,6 ± 0,32 16,1 ± 0,30
3 19,5 ± 0,22 19,8 ± 0,15
4 25,6 ± 0,10 24,8 ± 0,33
5 29,6 ± 0,19 30,5 ± 0,26
6 33,9 ± 0,55 35,2 ± 0,10
7 37,7 ± 0,66 38,8 ± 0,22
8 44,5 ± 0,35 46,0 ± 0,46
9 55,4 ± 0,44 55,3 ± 0,20
Determination of TMA by the Picrate salt formation method and steam distillation
method was also compared with different type of samples. Results from the steam
distillation methods (TCA extract, 2.2.3) were similar when compared to the picrate
39
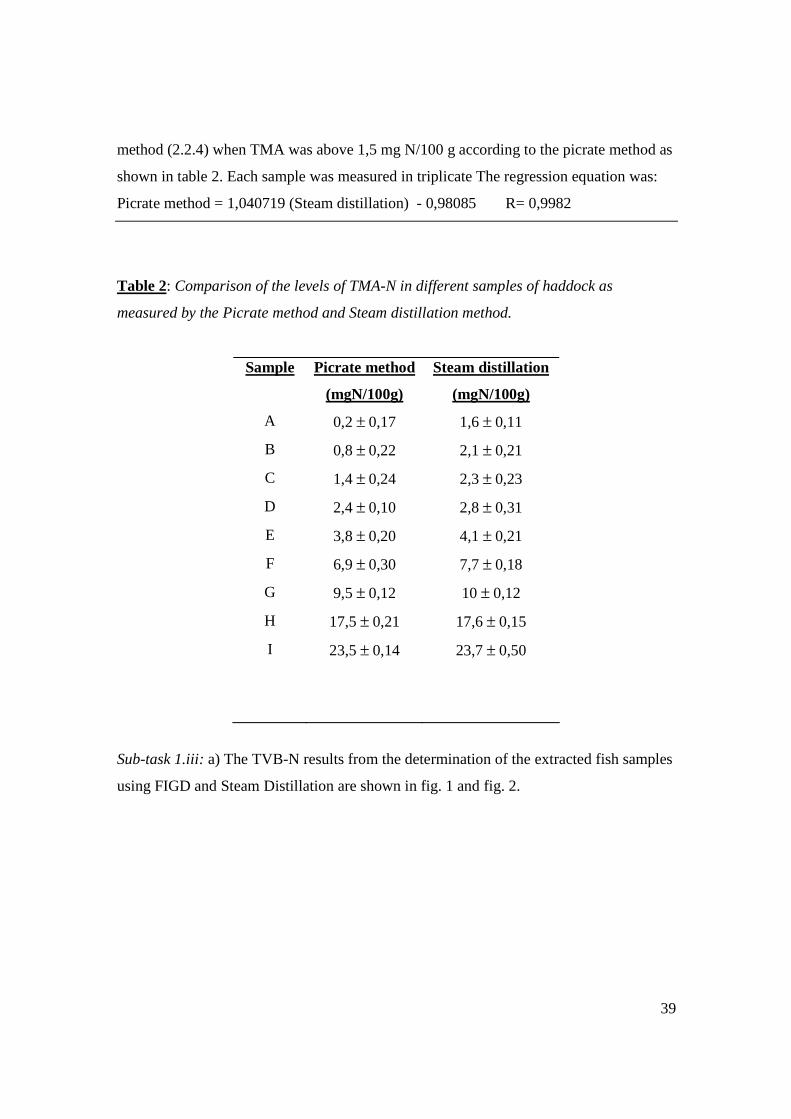
method (2.2.4) when TMA was above 1,5 mg N/100 g according to the picrate method as
shown in table 2. Each sample was measured in triplicate The regression equation was:
Picrate method = 1,040719 (Steam distillation) - 0,98085 R= 0,9982
Table 2: Comparison of the levels of TMA-N in different samples of haddock as
measured by the Picrate method and Steam distillation method.
Sample Picrate method
(mgN/100g)
Steam distillation
(mgN/100g)
A 0,2 ± 0,17 1,6 ± 0,11
B 0,8 ± 0,22 2,1 ± 0,21
C 1,4 ± 0,24 2,3 ± 0,23
D 2,4 ± 0,10 2,8 ± 0,31
E 3,8 ± 0,20 4,1 ± 0,21
F 6,9 ± 0,30 7,7 ± 0,18
G 9,5 ± 0,12 10 ± 0,12
H 17,5 ± 0,21 17,6 ± 0,15
I 23,5 ± 0,14 23,7 ± 0,50
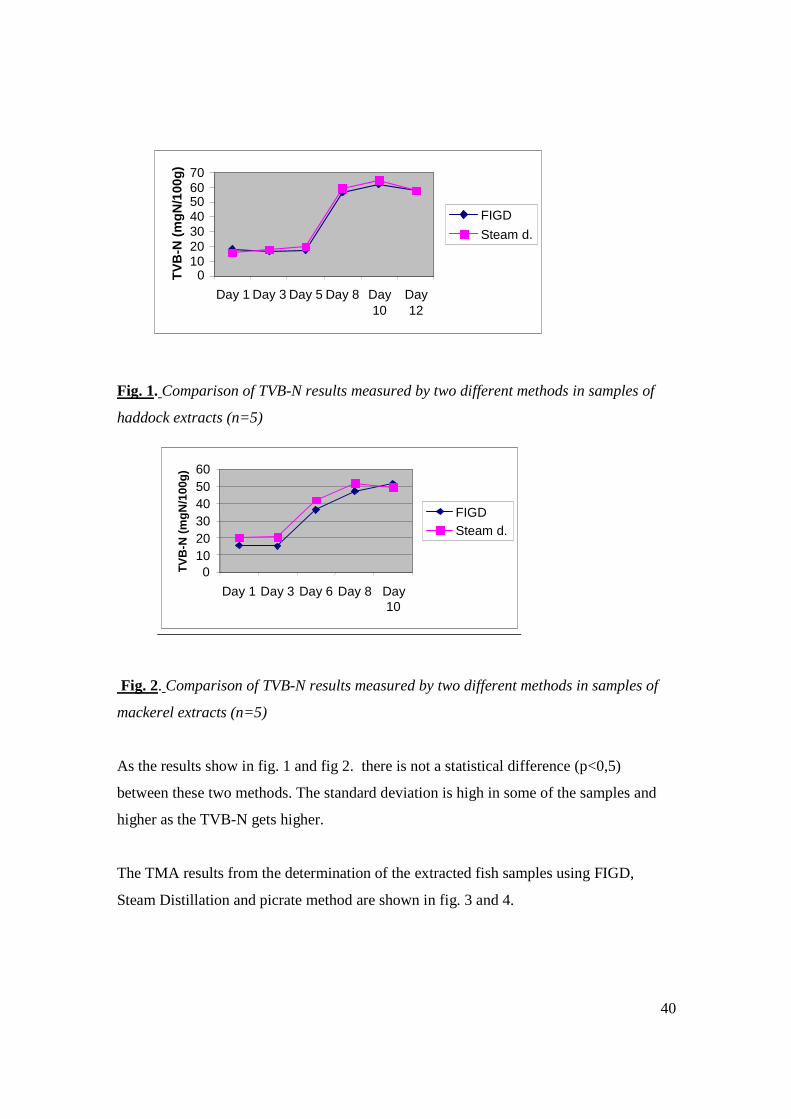
Sub-task 1.iii: a) The TVB-N results from the determination of the extracted fish samples
using FIGD and Steam Distillation are shown in fig. 1 and fig. 2.
40
Fig. 1. Comparison of TVB-N results measured by two different methods in samples of
haddock extracts (n=5)
Fig. 2. Comparison of TVB-N results measured by two different methods in samples of
mackerel extracts (n=5)
As the results show in fig. 1 and fig 2. there is not a statistical difference (p<0,5)
between these two methods. The standard deviation is high in some of the samples and
higher as the TVB-N gets higher.
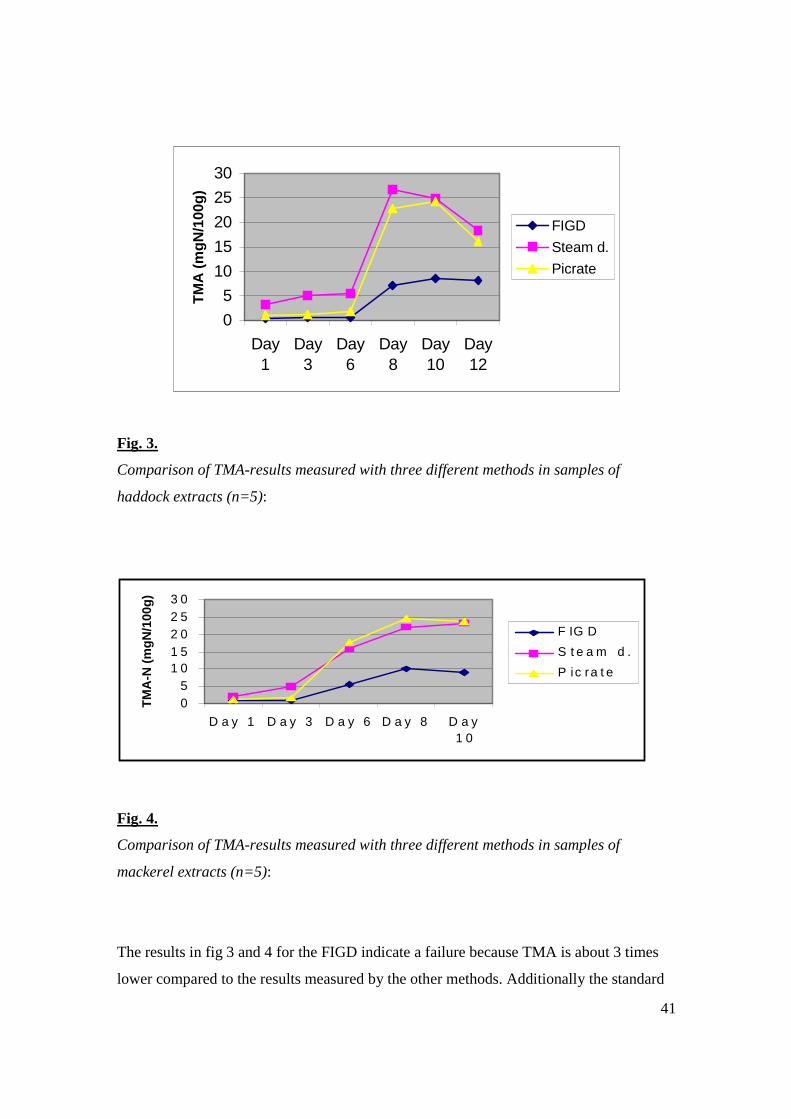
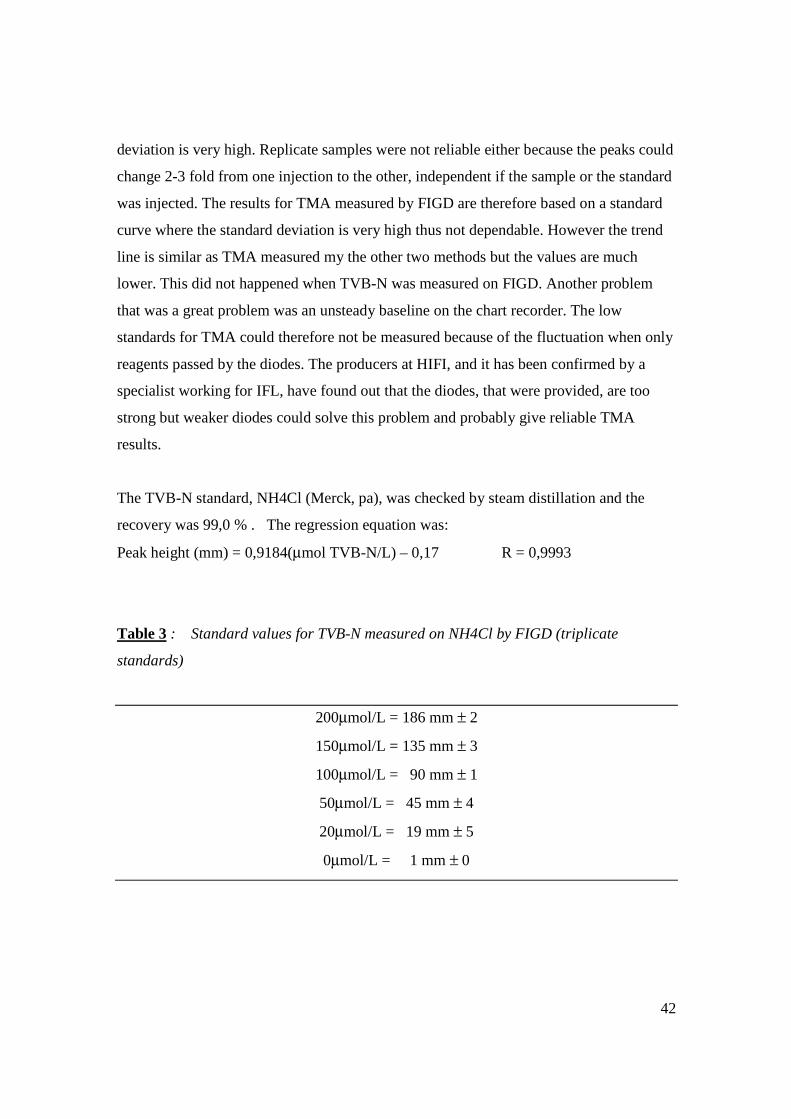
The TMA results from the determination of the extracted fish samples using FIGD,
Steam Distillation and picrate method are shown in fig. 3 and 4.
0 10 20 30 40 50 60 70
Day 1 Day 3 Day 5 Day 8 Day 10
Day 12
TV
B-N
(m
gN
/100
g)
FIGD
Steam d.
0 10 20 30 40 50 60
Day 1 Day 3 Day 6 Day 8 Day 10
TV
B-N
(m
gN
/100
g)
FIGD
Steam d.
41
0
5
10
15
20
25
30
Day1
Day3
Day6
Day8
Day10
Day12
TM
A (
mg
N/1
00g
)
FIGD
Steam d.
Picrate
Fig. 3.
Comparison of TMA-results measured with three different methods in samples of
haddock extracts (n=5):
Fig. 4.
Comparison of TMA-results measured with three different methods in samples of
mackerel extracts (n=5):
The results in fig 3 and 4 for the FIGD indicate a failure because TMA is about 3 times
lower compared to the results measured by the other methods. Additionally the standard
05
1 01 52 02 53 0
D a y 1 D a y 3 D a y 6 D a y 8 D a y1 0
TM
A-N
(m
gN
/100
g)
F IG D
S t e a m d .
P ic ra t e
42
deviation is very high. Replicate samples were not reliable either because the peaks could
change 2-3 fold from one injection to the other, independent if the sample or the standard
was injected. The results for TMA measured by FIGD are therefore based on a standard
curve where the standard deviation is very high thus not dependable. However the trend
line is similar as TMA measured my the other two methods but the values are much
lower. This did not happened when TVB-N was measured on FIGD. Another problem
that was a great problem was an unsteady baseline on the chart recorder. The low
standards for TMA could therefore not be measured because of the fluctuation when only
reagents passed by the diodes. The producers at HIFI, and it has been confirmed by a
specialist working for IFL, have found out that the diodes, that were provided, are too
strong but weaker diodes could solve this problem and probably give reliable TMA
results.
The TVB-N standard, NH4Cl (Merck, pa), was checked by steam distillation and the
recovery was 99,0 % . The regression equation was:
Peak height (mm) = 0,9184(µmol TVB-N/L) – 0,17 R = 0,9993
Table 3 : Standard values for TVB-N measured on NH4Cl by FIGD (triplicate
standards)
200µmol/L = 186 mm ± 2
150µmol/L = 135 mm ± 3
100µmol/L = 90 mm ± 1
50µmol/L = 45 mm ± 4
20µmol/L = 19 mm ± 5
0µmol/L = 1 mm ± 0
43
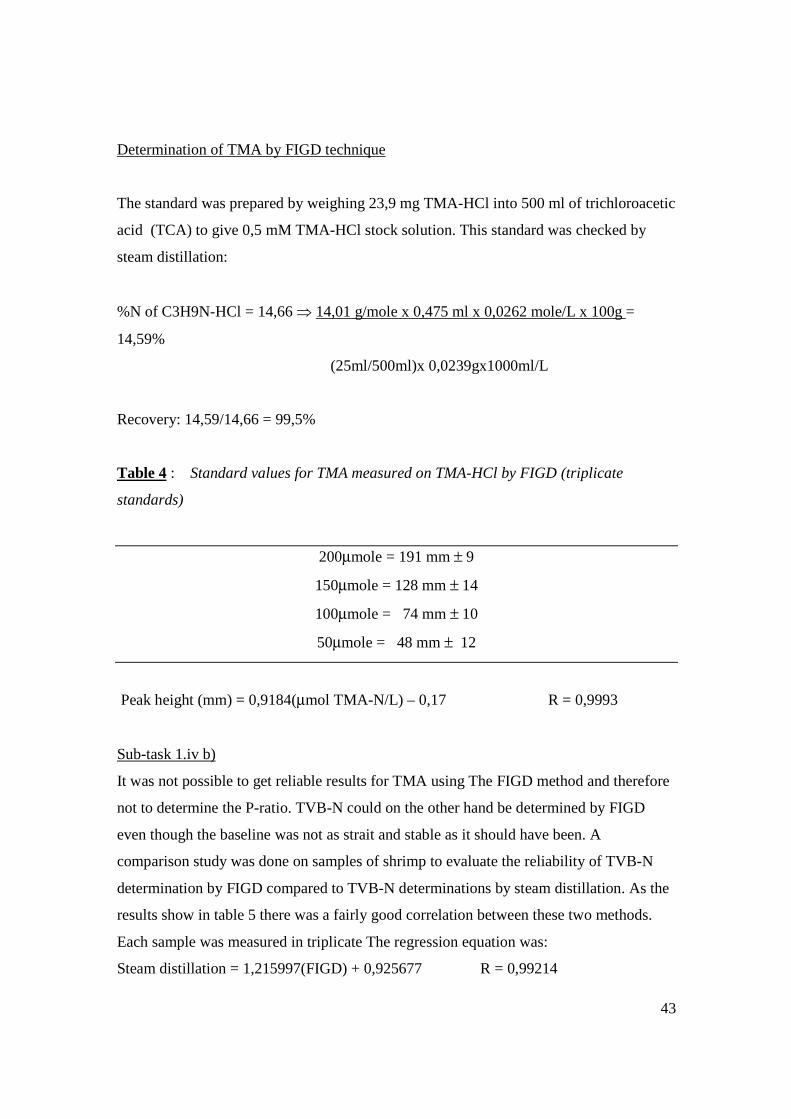
Determination of TMA by FIGD technique
The standard was prepared by weighing 23,9 mg TMA-HCl into 500 ml of trichloroacetic
acid (TCA) to give 0,5 mM TMA-HCl stock solution. This standard was checked by
steam distillation:
%N of C3H9N-HCl = 14,66 ⇒ 14,01 g/mole x 0,475 ml x 0,0262 mole/L x 100g =
14,59%
(25ml/500ml)x 0,0239gx1000ml/L
Recovery: 14,59/14,66 = 99,5%
Table 4 : Standard values for TMA measured on TMA-HCl by FIGD (triplicate
standards)
200µmole = 191 mm ± 9
150µmole = 128 mm ± 14
100µmole = 74 mm ± 10
50µmole = 48 mm ± 12
Peak height (mm) = 0,9184(µmol TMA-N/L) – 0,17 R = 0,9993
Sub-task 1.iv b)
It was not possible to get reliable results for TMA using The FIGD method and therefore
not to determine the P-ratio. TVB-N could on the other hand be determined by FIGD
even though the baseline was not as strait and stable as it should have been. A
comparison study was done on samples of shrimp to evaluate the reliability of TVB-N
determination by FIGD compared to TVB-N determinations by steam distillation. As the
results show in table 5 there was a fairly good correlation between these two methods.
Each sample was measured in triplicate The regression equation was:
Steam distillation = 1,215997(FIGD) + 0,925677 R = 0,99214
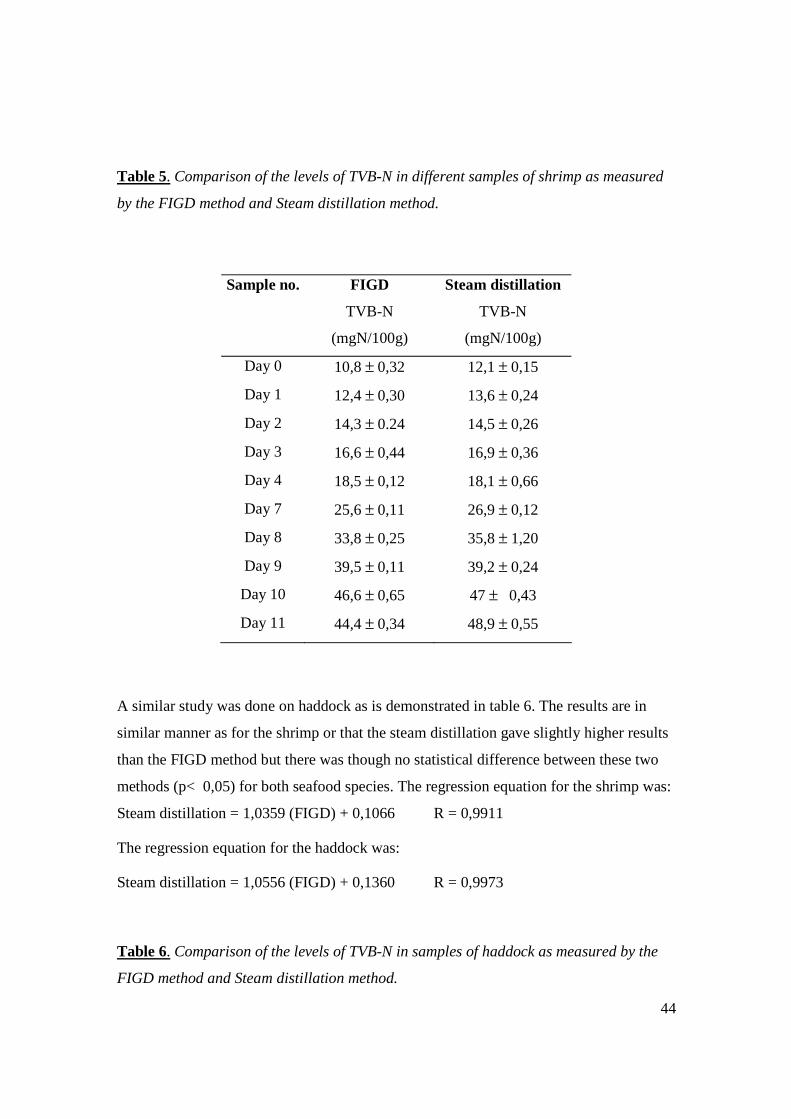
44
Table 5. Comparison of the levels of TVB-N in different samples of shrimp as measured
by the FIGD method and Steam distillation method.
Sample no. FIGD
TVB-N
(mgN/100g)
Steam distillation
TVB-N
(mgN/100g)
Day 0 10,8 ± 0,32 12,1 ± 0,15
Day 1 12,4 ± 0,30 13,6 ± 0,24
Day 2 14,3 ± 0.24 14,5 ± 0,26
Day 3 16,6 ± 0,44 16,9 ± 0,36
Day 4 18,5 ± 0,12 18,1 ± 0,66
Day 7 25,6 ± 0,11 26,9 ± 0,12
Day 8 33,8 ± 0,25 35,8 ± 1,20
Day 9 39,5 ± 0,11 39,2 ± 0,24
Day 10 46,6 ± 0,65 47 ± 0,43
Day 11 44,4 ± 0,34 48,9 ± 0,55
A similar study was done on haddock as is demonstrated in table 6. The results are in
similar manner as for the shrimp or that the steam distillation gave slightly higher results
than the FIGD method but there was though no statistical difference between these two
methods (p< 0,05) for both seafood species. The regression equation for the shrimp was:
Steam distillation = 1,0359 (FIGD) + 0,1066 R = 0,9911
The regression equation for the haddock was:
Steam distillation = 1,0556 (FIGD) + 0,1360 R = 0,9973
Table 6. Comparison of the levels of TVB-N in samples of haddock as measured by the
FIGD method and Steam distillation method.
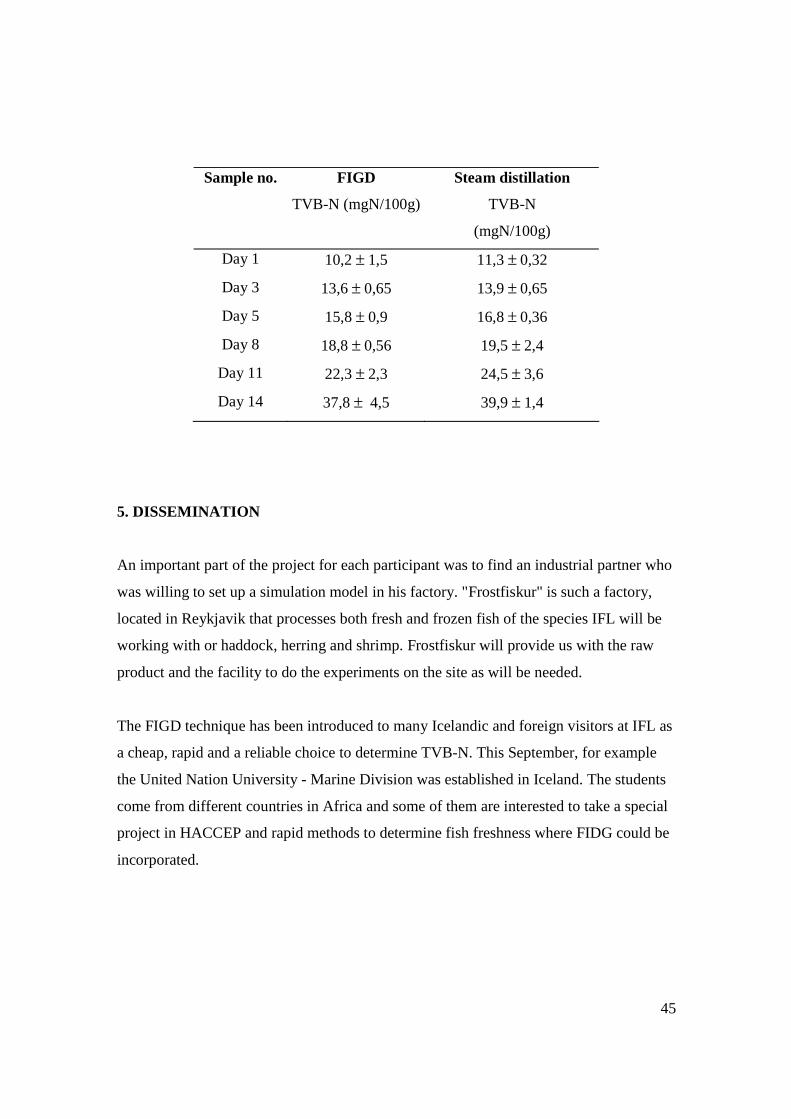
45
Sample no. FIGD
TVB-N (mgN/100g)
Steam distillation
TVB-N
(mgN/100g)
Day 1 10,2 ± 1,5 11,3 ± 0,32
Day 3 13,6 ± 0,65 13,9 ± 0,65
Day 5 15,8 ± 0,9 16,8 ± 0,36
Day 8 18,8 ± 0,56 19,5 ± 2,4
Day 11 22,3 ± 2,3 24,5 ± 3,6
Day 14 37,8 ± 4,5 39,9 ± 1,4
5. DISSEMINATION
An important part of the project for each participant was to find an industrial partner who
was willing to set up a simulation model in his factory. "Frostfiskur" is such a factory,
located in Reykjavik that processes both fresh and frozen fish of the species IFL will be
working with or haddock, herring and shrimp. Frostfiskur will provide us with the raw
product and the facility to do the experiments on the site as will be needed.
The FIGD technique has been introduced to many Icelandic and foreign visitors at IFL as
a cheap, rapid and a reliable choice to determine TVB-N. This September, for example
the United Nation University - Marine Division was established in Iceland. The students
come from different countries in Africa and some of them are interested to take a special
project in HACCEP and rapid methods to determine fish freshness where FIDG could be
incorporated.
46
6. REFERENCES
Antonacopoulos, N. & Vyncke, W. (1989) Determination of volatile basic nitrogen in
fish: a third collaborative study by the West European Fish Technologists Association
(WEFTA). A WEFTA original paper.
Botta, J.R. Evaluation of Seafood Freshness Quality, VCH Publishers, Inc, New York,
p9-33, (1995).
Dyer, W.J., J. Fish. Res. Bd. Can. 6, p351 (1945).
Malle, P. and M. Poumeyrol, J. Food. Protect., 52, p419, (1989).
Tozawa H., K. Enokihara and K. Amano, in "Fish Inspection and Quality Control" (R.
Kreuzer, ed.), Fishing News Books Ltd., London, p187, (1971).

47
PROGRESS REPORT FROM THE ICELANDIC FISHERIES LABORATORIES
Progress Report 2: 01. 10. 1998 - 30. 10. 1999
SUMMARY
The main objective of the study during this period was to determine TMA and TVB in
cod, haddock, herring and shrimp by the FIGD method and to compare it with other
standard methods (TVB WEFTA Codex and TMA Dyer methods). The fish/shrimp
extract was injected into the FIGD manifold that was then closed. The flow of 1,0 M
NaOH from a peristaltic pump carried the injected liquid through a mixing coil
alkalinising it and releasing its contained nitrogen in the form of ammonia gas. On
flowing through the gas diffusion cell this released ammonia passed through the gas
permeable membrane into a bromothymol blue indicator solution flowing from the
peristaltic pump. The colour change caused in the indicator produced a response from the
detector to a chart recorder. Storage studies were done on the fish at two to three different
seasons of the year and on shrimp that were kept in ice under standardised conditions. For
two of the studies the cod and haddock eyes were also measured for TMA and TVB and
compared to the results determined on the fish muscle. Sensory evaluation, by the Quality
Index Method and the Torry scheme using trained panel and bacterial counts, were also a
part of some of the storage experiments.
TMA measured by the FIGD method and the WEFTA Codex method gave similar results
for all species (R2 > 0,96). TVB measured by the FIGD method gave at average 60%
lower results than if measured by the Dyer method for all species. TMA and TVB values
in the cod and haddock eyes were lower than in the fillets but showed a similar
exponential pattern. The detection limit for TMA and TVB by the FIGD method is 0,1
mg N/100 g wet tissue and spiked samples gave at average 99,9 % recovery.
The advantages of the FIGD method:
It was faster and easier to use than comparable methods.
It only required 0,1 ml of extractable sample.
The FIGD equipment is inexpensive (<3000 EURO).
The disadvantages of the FIGD method:
The extraction process and the dilutions of "strong" extracts were limiting factors.
48
The TMA baseline was not as stable as the TVB baseline.
The FIGD- TVB method gave about 60% lower values than the WEFTA Codex TVB
method.
1. INTRODUCTION
The actions in the second year of this project was as is described in the Technical Annex
sub task 1v to 1viii and sub-task 2 i.
Sub-task 1. v to viii: Due to difficulties of transportation and the cost of shipping frozen
fish samples from the subcontractor, AB in Peterhead Scotland, to all the partners
throughout Europe as planned, it was determined, at the meeting in Athens in Feb. ´99, to
use fresh fish samples that each partner was more familiar with. The IFL partner
investigated the relationship between sensory scores from trained panel and the freshness
indicators TMA and TVB using the FIGD technique. The decomposition index had
already been established at IFL for the investigated species, cod, haddock, herring and
shrimp so more effort was put into the validation of the FIGD method against the known
decomposition index and against other methods to determine TMA and TVB.
Sub-task 2.i: The effort to investigate methodologies to obtain exudate from fish samples
instead of using extracts of trichloroacetic acid was carried on.
The TMA and TVB values were determined by the FIGD method to evaluate the spoilage
stage of the most important fish species in Iceland, cod (Gadus Morhua), haddock
(Melanogrammus aeglefinus), herring (Clupea harengus harengus) and Northern shrimp
(Pandalus borealis) and to compare this method with other commonly TMA and TVB
methods. Parallel to this, sensory analysis and microbial counts were also conducted to
determine the freshness quality of the seafood species.
2. MATERIAL AND METHODS
2.1. Experiments
The cod was caught with long-line Southwest of Iceland. It was brought bled, gutted and
iced into 90L boxes on board and brought ashore a few hours after catch. The fish was
kept for storage trial in ice at 2°C. Samples of the fillets and the eyes were taken at 3 to 4
days interval during the storage period. On each day of sampling 3-5 fish were
examined.
49
Three experiments were done on haddock. The haddock was caught SW of Iceland in
December 1998, March 1999 and May 1999, NE of Iceland in floating nets. The fish was
caught one day before the experiment started except in the March trial where the fish was
caught 8 days before the experiment started. It was brought bled, gutted and iced into 90L
boxes on board and brought ashore a few hours after catch. The fish was kept for storage
trial at 2°C in ice. Samples of the fillets and the eyes were taken at 3 to 4 days interval
during the storage period. On each day of sampling 3-5 fish were examined.
The herring was caught in Héraðsflói, NE of Iceland in floating nets and brought ashore
in Neskaupsstaður where it was transferred by flight to IFL in Reykjavík, iced in
insulated boxes. The fish was kept for storage trials at 0°C and 5°C. Samples were taken
at 3 to 4 days intervals during the storage period. On each day of sampling 5 fish were
examined.
The shrimp was harvested NW of Iceland in a shrimp-bottom-trawler net on August 11th
and September 19th 1999. It was brought on shore and samples were iced and packed and
shipped by air to the laboratory in Reykjavík where it was analysed 14-16 hours after
catch.
2.1. Chemical analysis
a) Flow Injection analysis of TMA and TVB: See Project Report 1
b) Determination of TVB by steam distillation of TCA extract according to the WEFTA
Codex Method (Vyncke et al. 1987).
c) Determination of TMA was done by Dyer method, modified by Tozawa (1971).
2.2. Microbial counts
When examined cod- and haddock fillets and the whole shrimp, total viable counts and
selective counts of H2S-producing bacteria were done on iron agar as described by Gram
et al. (1987). The plates were incubated at 22°C for 3 days. Bacteria forming black
colonies on this agar produce H2S from sodium thiosulphate and/or cysteine.
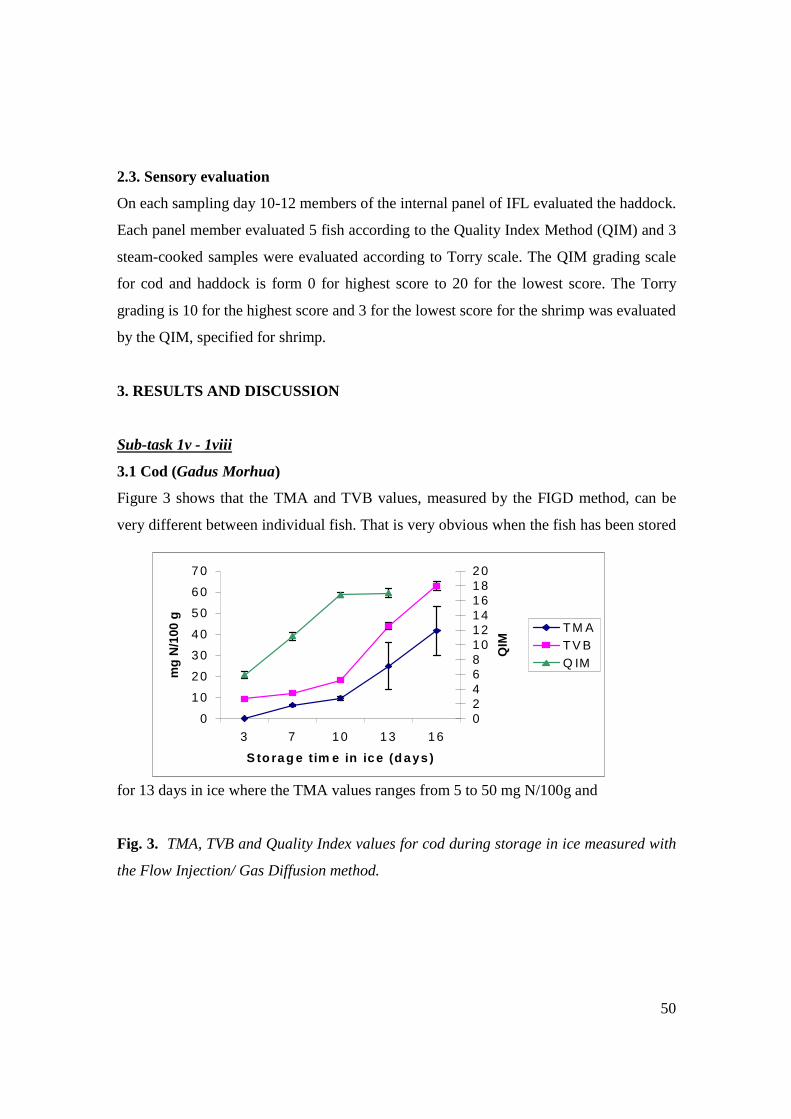
50
2.3. Sensory evaluation
On each sampling day 10-12 members of the internal panel of IFL evaluated the haddock.
Each panel member evaluated 5 fish according to the Quality Index Method (QIM) and 3
steam-cooked samples were evaluated according to Torry scale. The QIM grading scale
for cod and haddock is form 0 for highest score to 20 for the lowest score. The Torry
grading is 10 for the highest score and 3 for the lowest score for the shrimp was evaluated
by the QIM, specified for shrimp.
3. RESULTS AND DISCUSSION
Sub-task 1v - 1viii
3.1 Cod (Gadus Morhua)
Figure 3 shows that the TMA and TVB values, measured by the FIGD method, can be
very different between individual fish. That is very obvious when the fish has been stored
for 13 days in ice where the TMA values ranges from 5 to 50 mg N/100g and
Fig. 3. TMA, TVB and Quality Index values for cod during storage in ice measured with
the Flow Injection/ Gas Diffusion method.
0
10
20
30
40
50
60
70
3 7 10 13 16
S to rag e tim e in ice (d ays )
mg
N/1
00 g
02468101214161820
QIM
T M AT V BQ IM
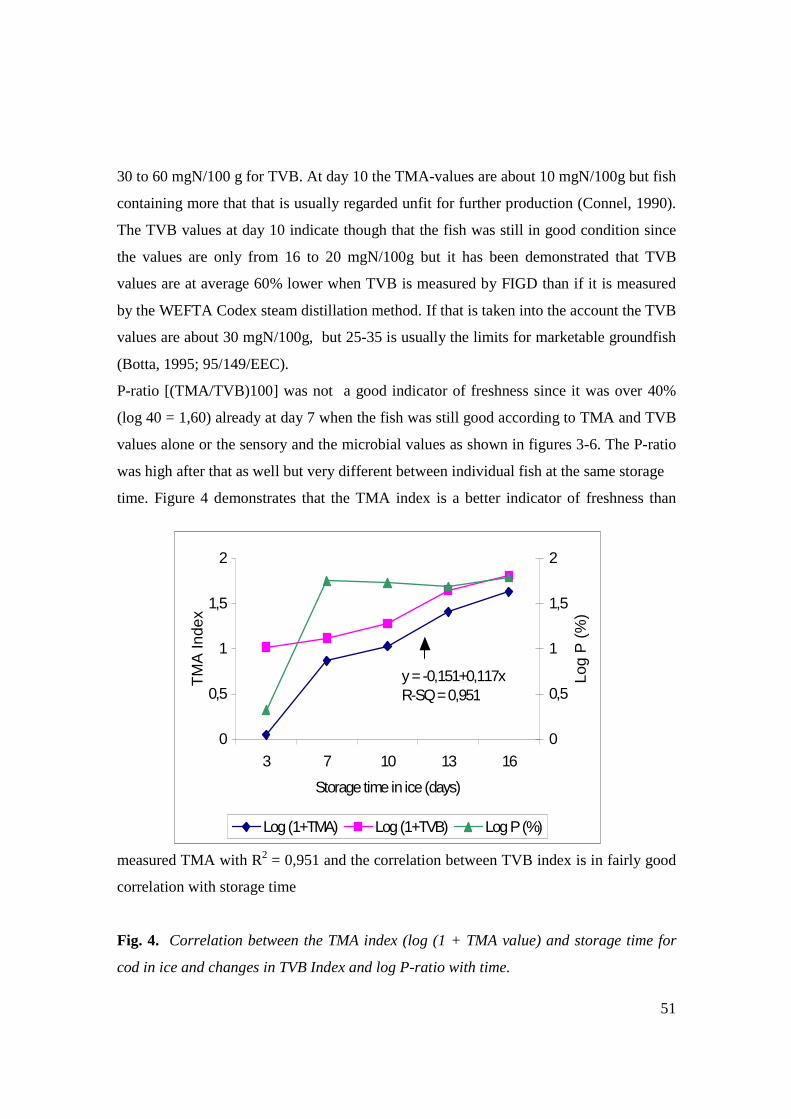
51
30 to 60 mgN/100 g for TVB. At day 10 the TMA-values are about 10 mgN/100g but fish
containing more that that is usually regarded unfit for further production (Connel, 1990).
The TVB values at day 10 indicate though that the fish was still in good condition since
the values are only from 16 to 20 mgN/100g but it has been demonstrated that TVB
values are at average 60% lower when TVB is measured by FIGD than if it is measured
by the WEFTA Codex steam distillation method. If that is taken into the account the TVB
values are about 30 mgN/100g, but 25-35 is usually the limits for marketable groundfish
(Botta, 1995; 95/149/EEC).
P-ratio [(TMA/TVB)100] was not a good indicator of freshness since it was over 40%
(log 40 = 1,60) already at day 7 when the fish was still good according to TMA and TVB
values alone or the sensory and the microbial values as shown in figures 3-6. The P-ratio
was high after that as well but very different between individual fish at the same storage
time. Figure 4 demonstrates that the TMA index is a better indicator of freshness than
measured TMA with R2 = 0,951 and the correlation between TVB index is in fairly good
correlation with storage time
Fig. 4. Correlation between the TMA index (log (1 + TMA value) and storage time for
cod in ice and changes in TVB Index and log P-ratio with time.
0
0,5
1
1,5
2
3 7 10 13 16
Storage time in ice (days)
TM
A In
dex
0
0,5
1
1,5
2Lo
g P
(%
)
Log (1+TMA) Log (1+TVB) Log P (%)
y = -0,151+0,117xR-SQ = 0,951
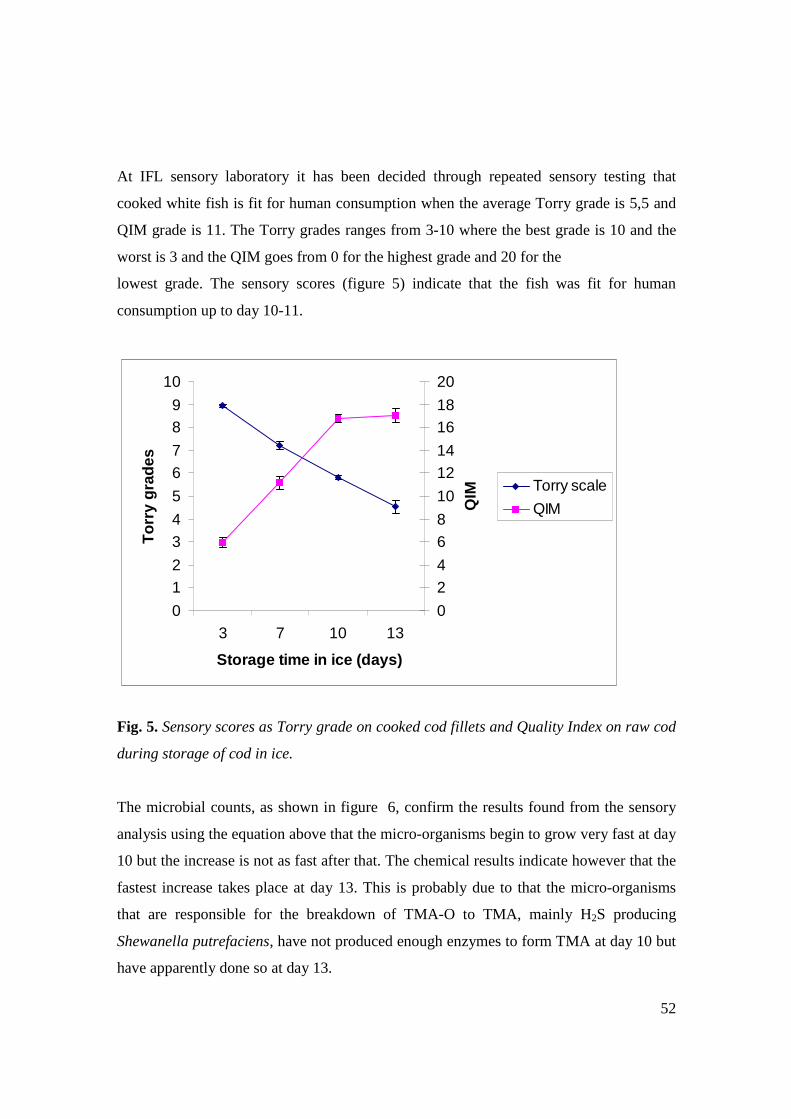
52
At IFL sensory laboratory it has been decided through repeated sensory testing that
cooked white fish is fit for human consumption when the average Torry grade is 5,5 and
QIM grade is 11. The Torry grades ranges from 3-10 where the best grade is 10 and the
worst is 3 and the QIM goes from 0 for the highest grade and 20 for the
lowest grade. The sensory scores (figure 5) indicate that the fish was fit for human
consumption up to day 10-11.
Fig. 5. Sensory scores as Torry grade on cooked cod fillets and Quality Index on raw cod
during storage of cod in ice.
The microbial counts, as shown in figure 6, confirm the results found from the sensory
analysis using the equation above that the micro-organisms begin to grow very fast at day
10 but the increase is not as fast after that. The chemical results indicate however that the
fastest increase takes place at day 13. This is probably due to that the micro-organisms
that are responsible for the breakdown of TMA-O to TMA, mainly H2S producing
Shewanella putrefaciens, have not produced enough enzymes to form TMA at day 10 but
have apparently done so at day 13.
0
12
34
5
67
89
10
3 7 10 13
Storage time in ice (days)
To
rry
gra
des
0
24
68
10
1214
1618
20
QIM Torry scale
QIM
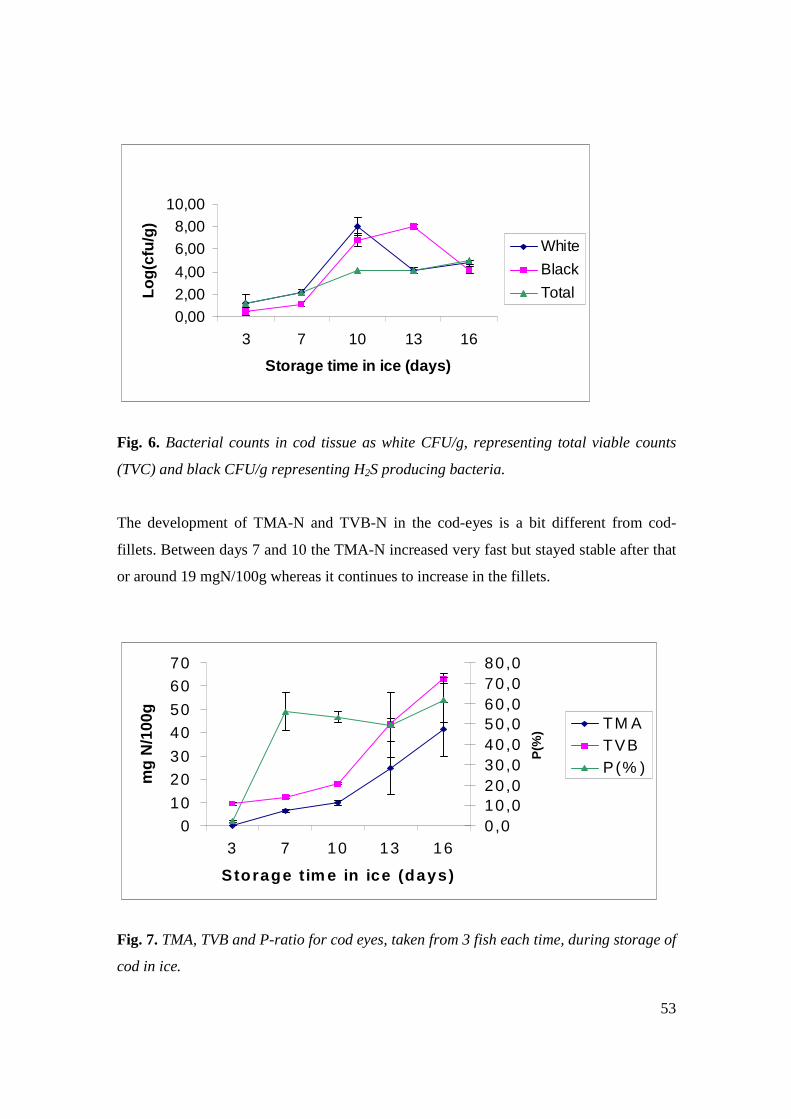
53
Fig. 6. Bacterial counts in cod tissue as white CFU/g, representing total viable counts
(TVC) and black CFU/g representing H2S producing bacteria.
The development of TMA-N and TVB-N in the cod-eyes is a bit different from cod-
fillets. Between days 7 and 10 the TMA-N increased very fast but stayed stable after that
or around 19 mgN/100g whereas it continues to increase in the fillets.
Fig. 7. TMA, TVB and P-ratio for cod eyes, taken from 3 fish each time, during storage of
cod in ice.
0,002,004,00
6,008,00
10,00
3 7 10 13 16
Storage time in ice (days)
Lo
g(c
fu/g
)
White
Black
Total
0
10
20
30
40
50
60
70
3 7 10 13 16
Storage t im e in ice (days)
mg
N/1
00g
0,010,020,030,040,050,060,070,080,0
P(%
) TM ATVBP(% )
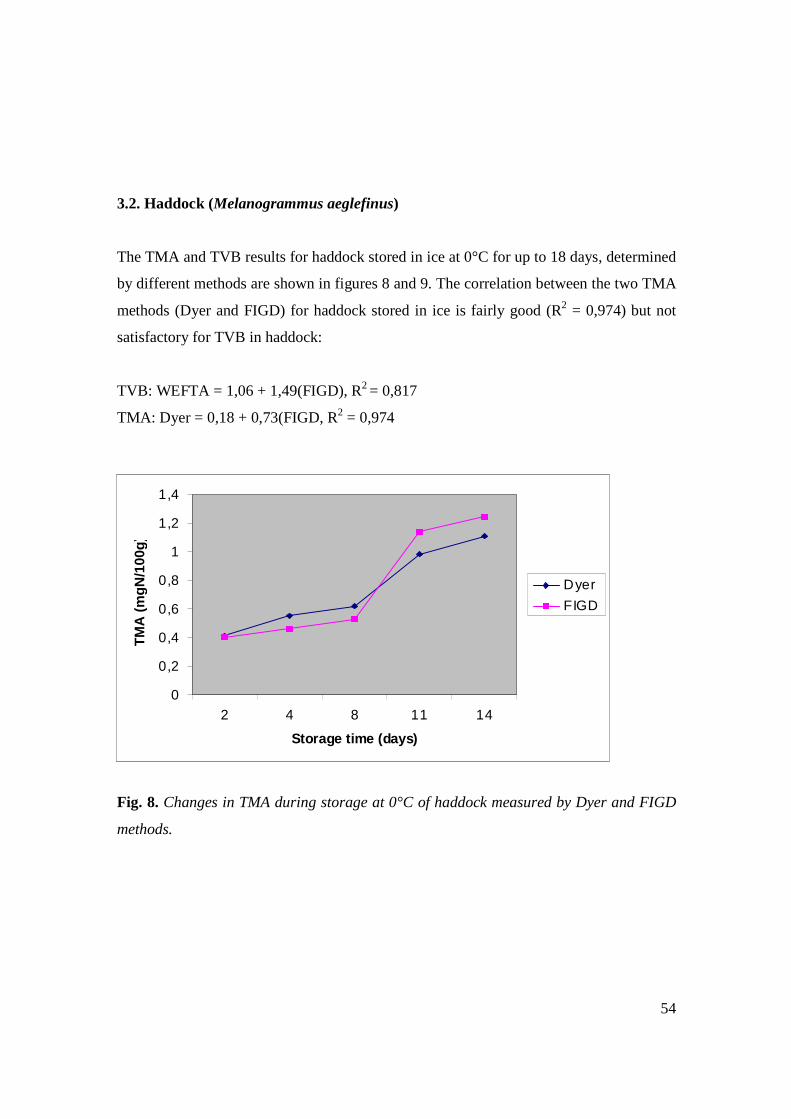
54
3.2. Haddock (Melanogrammus aeglefinus)
The TMA and TVB results for haddock stored in ice at 0°C for up to 18 days, determined
by different methods are shown in figures 8 and 9. The correlation between the two TMA
methods (Dyer and FIGD) for haddock stored in ice is fairly good (R2 = 0,974) but not
satisfactory for TVB in haddock:
TVB: WEFTA = 1,06 + 1,49(FIGD), R2 = 0,817
TMA: Dyer = 0,18 + 0,73(FIGD, R2 = 0,974
Fig. 8. Changes in TMA during storage at 0°C of haddock measured by Dyer and FIGD
methods.
0
0,2
0,4
0,6
0,8
1
1,2
1,4
2 4 8 11 14
Storage time (days)
TM
A (
mg
N/1
00g
)
Dyer
FIGD
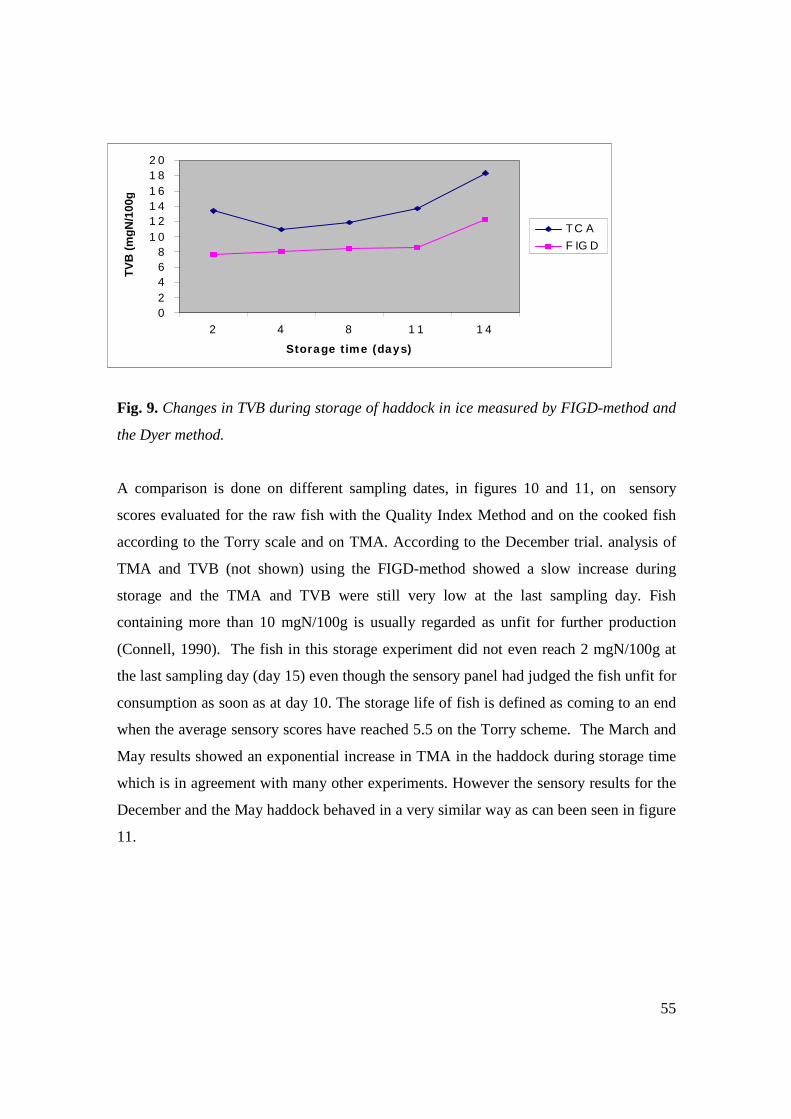
55
Fig. 9. Changes in TVB during storage of haddock in ice measured by FIGD-method and
the Dyer method.
A comparison is done on different sampling dates, in figures 10 and 11, on sensory
scores evaluated for the raw fish with the Quality Index Method and on the cooked fish
according to the Torry scale and on TMA. According to the December trial. analysis of
TMA and TVB (not shown) using the FIGD-method showed a slow increase during
storage and the TMA and TVB were still very low at the last sampling day. Fish
containing more than 10 mgN/100g is usually regarded as unfit for further production
(Connell, 1990). The fish in this storage experiment did not even reach 2 mgN/100g at
the last sampling day (day 15) even though the sensory panel had judged the fish unfit for
consumption as soon as at day 10. The storage life of fish is defined as coming to an end
when the average sensory scores have reached 5.5 on the Torry scheme. The March and
May results showed an exponential increase in TMA in the haddock during storage time
which is in agreement with many other experiments. However the sensory results for the
December and the May haddock behaved in a very similar way as can been seen in figure
11.
02468
1 01 21 41 61 82 0
2 4 8 1 1 1 4
Storage t ime (days)
TV
B (
mg
N/1
00g
)
T C A
F IG D
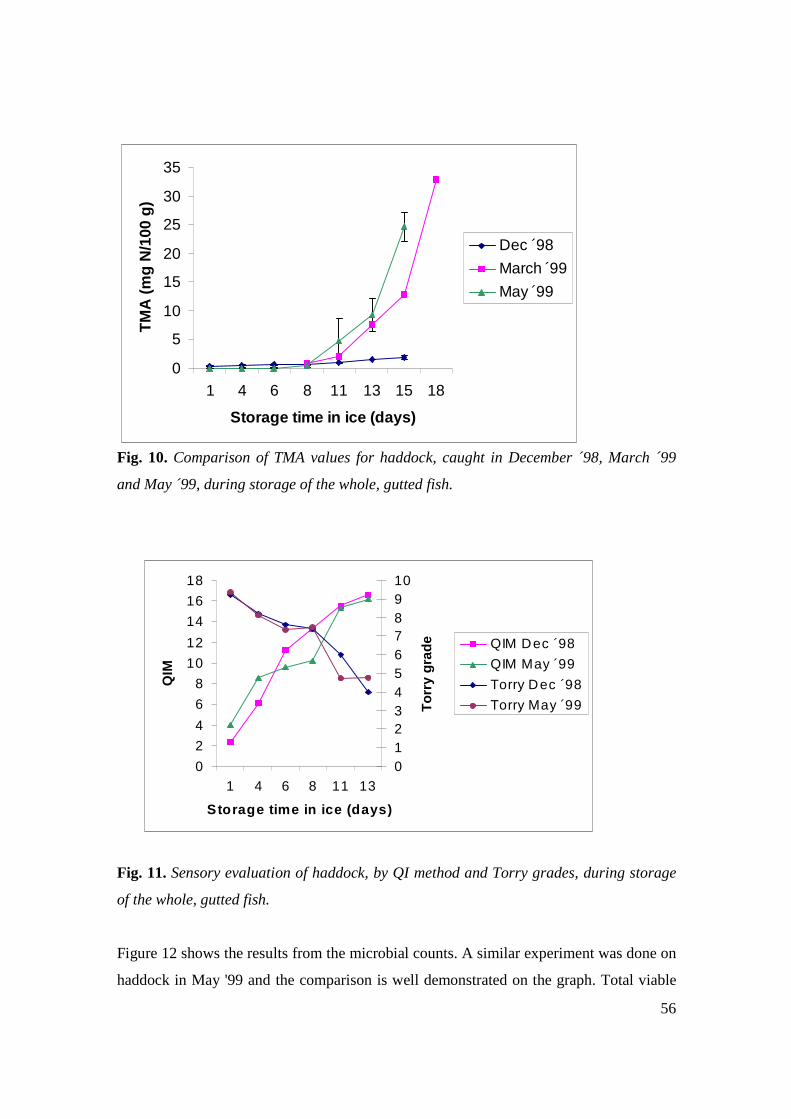
56
Fig. 10. Comparison of TMA values for haddock, caught in December ´98, March ´99
and May ´99, during storage of the whole, gutted fish.
Fig. 11. Sensory evaluation of haddock, by QI method and Torry grades, during storage
of the whole, gutted fish.
Figure 12 shows the results from the microbial counts. A similar experiment was done on
haddock in May '99 and the comparison is well demonstrated on the graph. Total viable
0
5
10
15
20
25
30
35
1 4 6 8 11 13 15 18
Storage time in ice (days)
TM
A (
mg
N/1
00 g
)
Dec ´98
March ´99
May ´99
0
2
4
6
8
10
12
14
16
18
1 4 6 8 11 13
Storage time in ice (days)
QIM
012345678910
To
rry
gra
de QIM Dec ´98
QIM May ´99
Torry Dec ´98
Torry May ´99
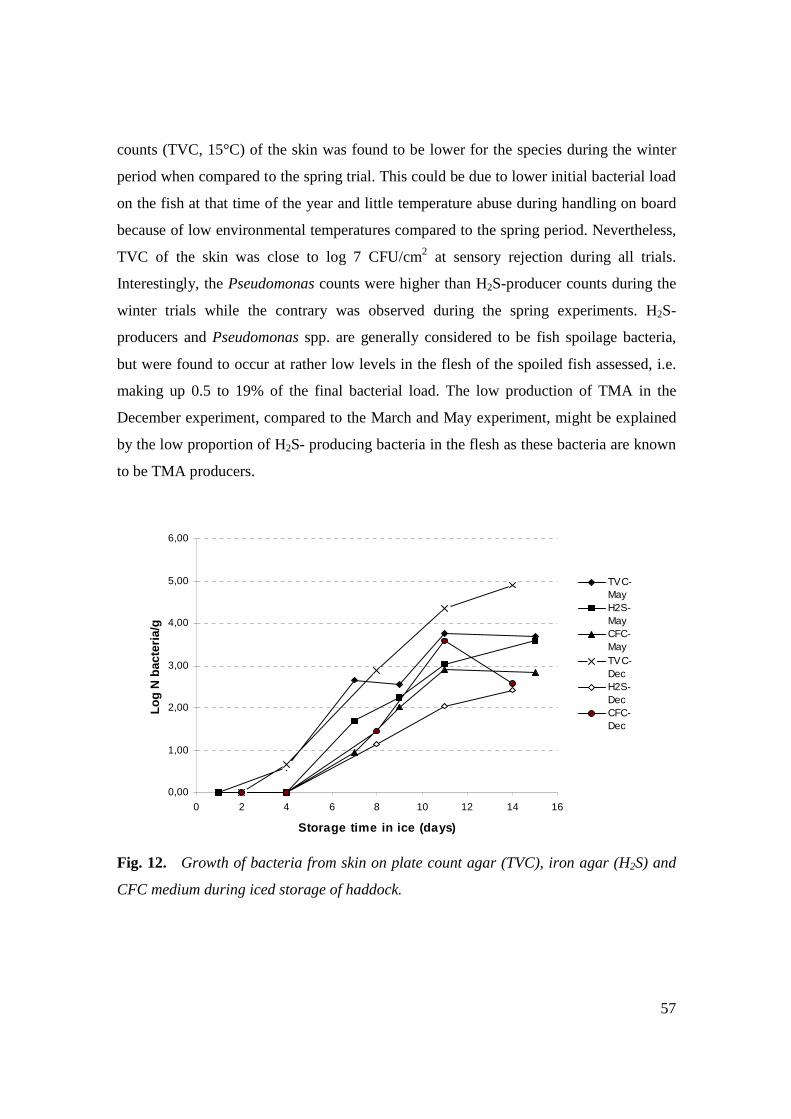
57
counts (TVC, 15°C) of the skin was found to be lower for the species during the winter
period when compared to the spring trial. This could be due to lower initial bacterial load
on the fish at that time of the year and little temperature abuse during handling on board
because of low environmental temperatures compared to the spring period. Nevertheless,
TVC of the skin was close to log 7 CFU/cm2 at sensory rejection during all trials.
Interestingly, the Pseudomonas counts were higher than H2S-producer counts during the
winter trials while the contrary was observed during the spring experiments. H2S-
producers and Pseudomonas spp. are generally considered to be fish spoilage bacteria,
but were found to occur at rather low levels in the flesh of the spoiled fish assessed, i.e.
making up 0.5 to 19% of the final bacterial load. The low production of TMA in the
December experiment, compared to the March and May experiment, might be explained
by the low proportion of H2S- producing bacteria in the flesh as these bacteria are known
to be TMA producers.
Fig. 12. Growth of bacteria from skin on plate count agar (TVC), iron agar (H2S) and
CFC medium during iced storage of haddock.
0,00
1,00
2,00
3,00
4,00
5,00
6,00
0 2 4 6 8 10 12 14 16
Storage time in ice (days)
Lo
g N
bac
teri
a/g
TVC-MayH2S-MayCFC-MayTVC-DecH2S-DecCFC-Dec
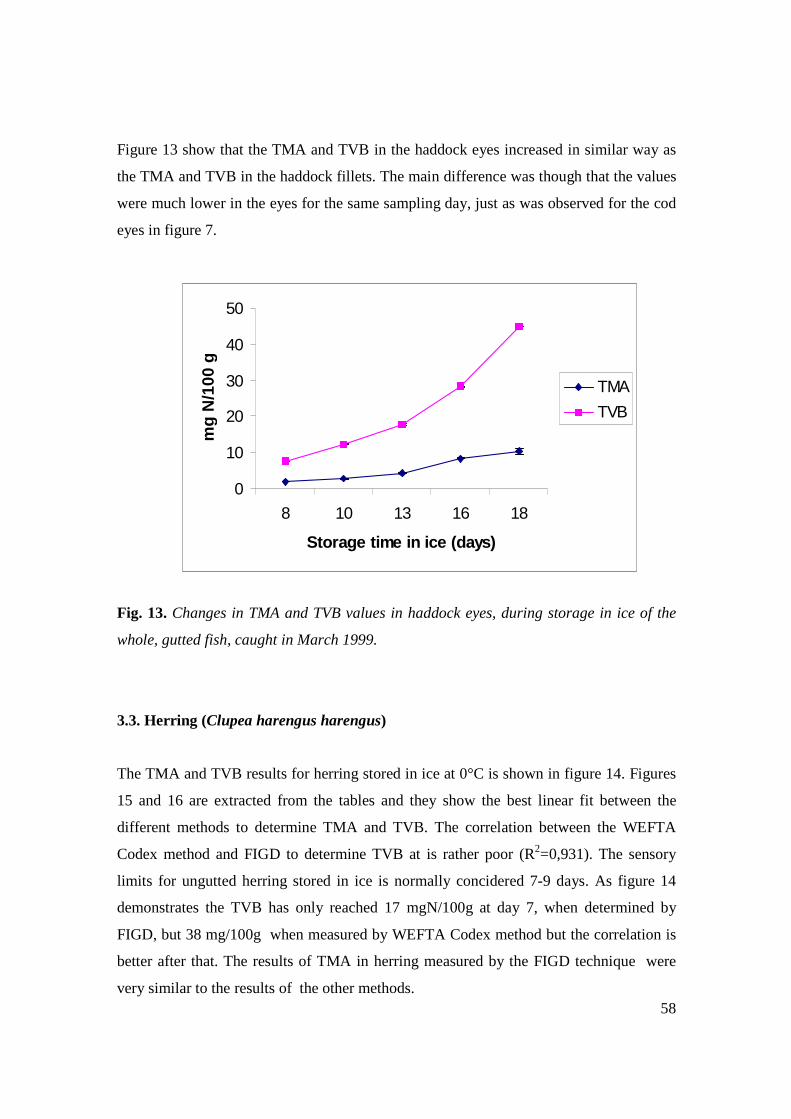
58
Figure 13 show that the TMA and TVB in the haddock eyes increased in similar way as
the TMA and TVB in the haddock fillets. The main difference was though that the values
were much lower in the eyes for the same sampling day, just as was observed for the cod
eyes in figure 7.
Fig. 13. Changes in TMA and TVB values in haddock eyes, during storage in ice of the
whole, gutted fish, caught in March 1999.
3.3. Herring (Clupea harengus harengus)
The TMA and TVB results for herring stored in ice at 0°C is shown in figure 14. Figures
15 and 16 are extracted from the tables and they show the best linear fit between the
different methods to determine TMA and TVB. The correlation between the WEFTA
Codex method and FIGD to determine TVB at is rather poor (R2=0,931). The sensory
limits for ungutted herring stored in ice is normally concidered 7-9 days. As figure 14
demonstrates the TVB has only reached 17 mgN/100g at day 7, when determined by
FIGD, but 38 mg/100g when measured by WEFTA Codex method but the correlation is
better after that. The results of TMA in herring measured by the FIGD technique were
very similar to the results of the other methods.
0
10
20
30
40
50
8 10 13 16 18
Storage time in ice (days)
mg
N/1
00 g
TMA
TVB
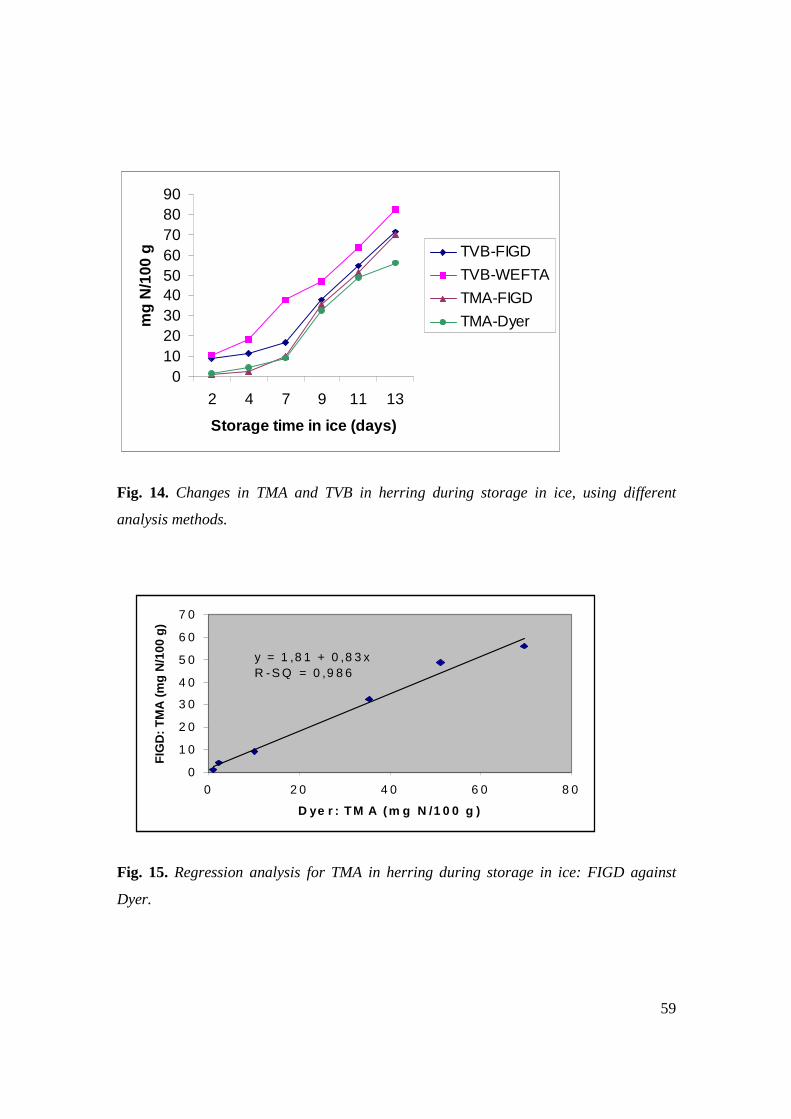
59
Fig. 14. Changes in TMA and TVB in herring during storage in ice, using different
analysis methods.
Fig. 15. Regression analysis for TMA in herring during storage in ice: FIGD against
Dyer.
0
1 0
2 0
3 0
4 0
5 0
6 0
7 0
0 2 0 4 0 6 0 8 0
D ye r : TM A (m g N /1 0 0 g )
FIG
D:
TM
A (
mg
N/1
00 g
)
y = 1 ,8 1 + 0 ,8 3 xR -S Q = 0 ,9 8 6
0102030405060708090
2 4 7 9 11 13
Storage time in ice (days)
mg
N/1
00 g TVB-FIGD
TVB-WEFTA
TMA-FIGD
TMA-Dyer
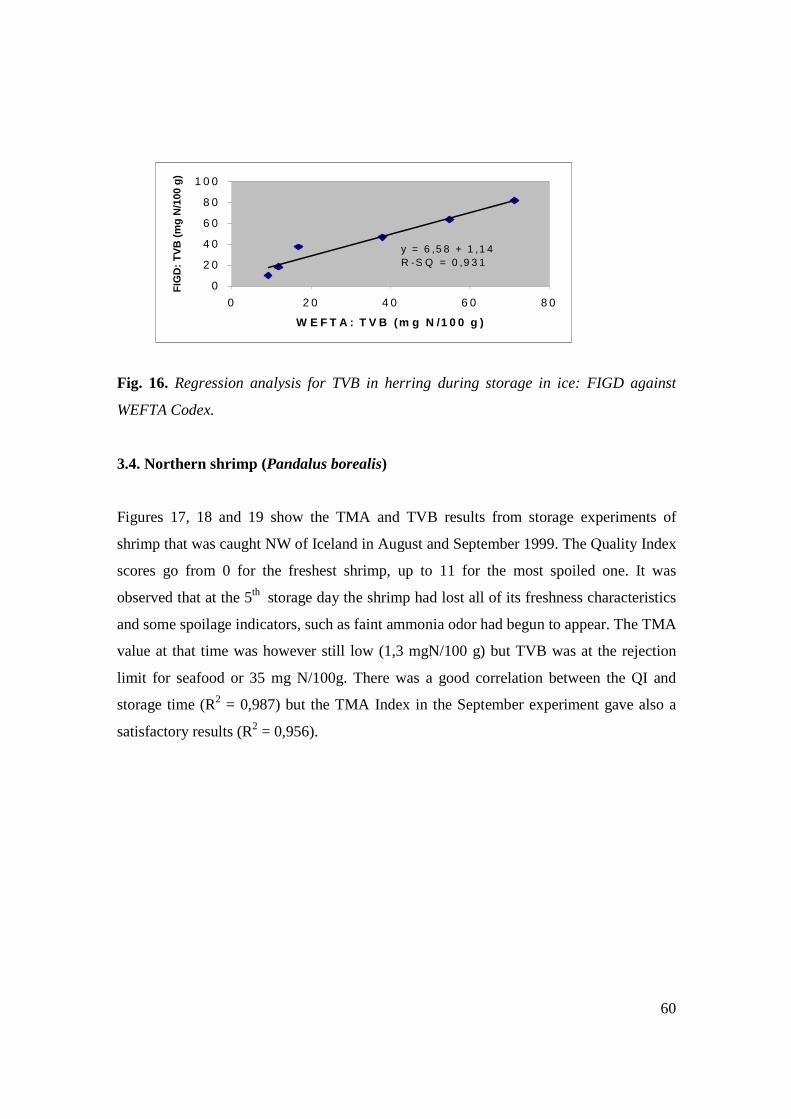
60
Fig. 16. Regression analysis for TVB in herring during storage in ice: FIGD against
WEFTA Codex.
3.4. Northern shrimp (Pandalus borealis)
Figures 17, 18 and 19 show the TMA and TVB results from storage experiments of
shrimp that was caught NW of Iceland in August and September 1999. The Quality Index
scores go from 0 for the freshest shrimp, up to 11 for the most spoiled one. It was
observed that at the 5th storage day the shrimp had lost all of its freshness characteristics
and some spoilage indicators, such as faint ammonia odor had begun to appear. The TMA
value at that time was however still low (1,3 mgN/100 g) but TVB was at the rejection
limit for seafood or 35 mg N/100g. There was a good correlation between the QI and
storage time (R2 = 0,987) but the TMA Index in the September experiment gave also a
satisfactory results (R2 = 0,956).
0
2 0
4 0
6 0
8 0
1 0 0
0 2 0 4 0 6 0 8 0
W E F T A : T V B (m g N /1 0 0 g )
FIG
D:
TV
B (
mg
N/1
00 g
)
y = 6 ,5 8 + 1 ,1 4R -S Q = 0 ,9 3 1
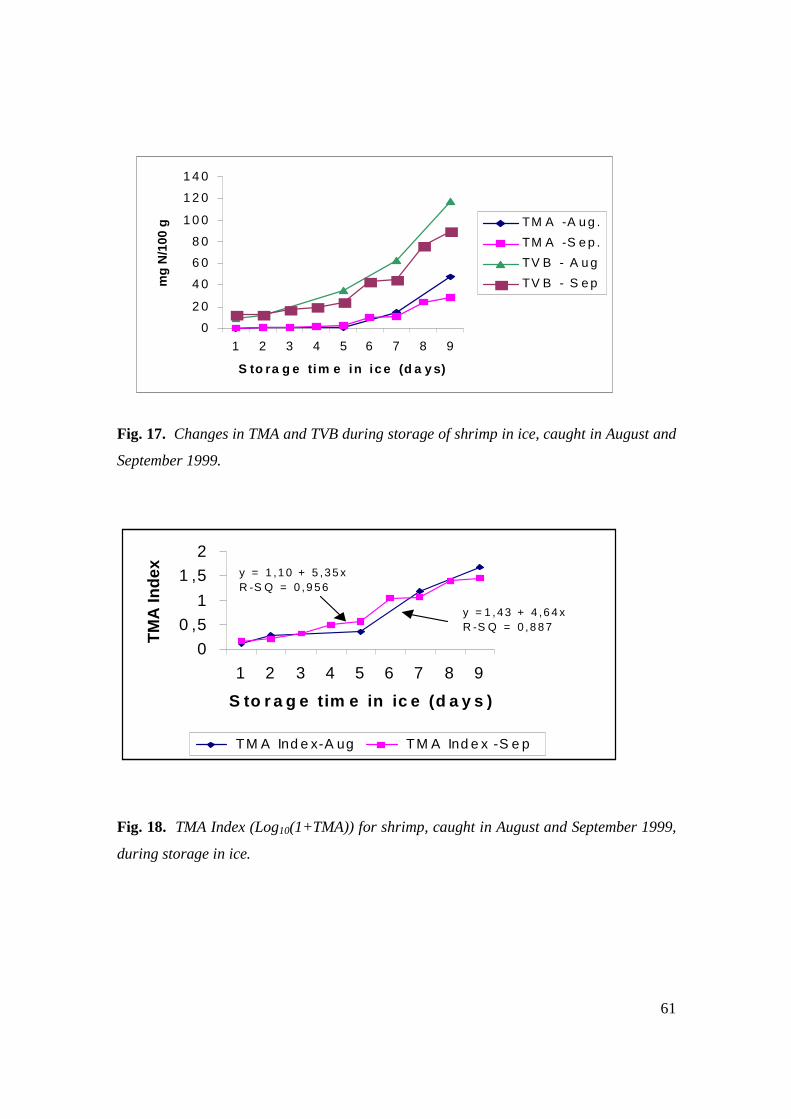
61
Fig. 17. Changes in TMA and TVB during storage of shrimp in ice, caught in August and
September 1999.
Fig. 18. TMA Index (Log10(1+TMA)) for shrimp, caught in August and September 1999,
during storage in ice.
0
0 ,5
1
1 ,5
2
1 2 3 4 5 6 7 8 9
S to r a g e tim e in ic e (d a y s )
TM
A In
dex
TM A Ind e x-A ug TM A Ind e x -S e p
y = 1 ,1 0 + 5 ,3 5 xR -S Q = 0 ,9 5 6
y = 1 ,4 3 + 4 ,6 4 xR -S Q = 0 ,8 8 7
0
2 0
4 0
6 0
8 0
1 0 0
1 2 0
1 4 0
1 2 3 4 5 6 7 8 9
S to ra g e tim e in ic e (d a y s)
mg
N/1
00 g TM A -A u g .
TM A -S e p .
TV B - A u g
TV B - S e p
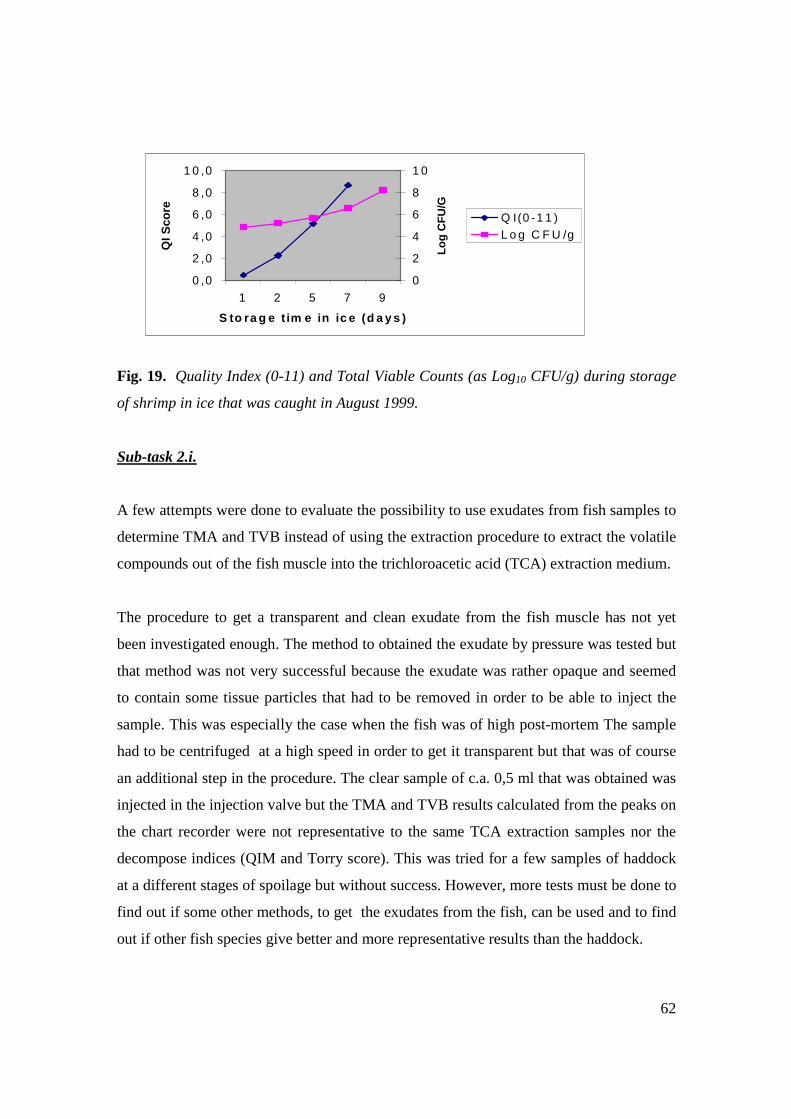
62
Fig. 19. Quality Index (0-11) and Total Viable Counts (as Log10 CFU/g) during storage
of shrimp in ice that was caught in August 1999.
Sub-task 2.i.
A few attempts were done to evaluate the possibility to use exudates from fish samples to
determine TMA and TVB instead of using the extraction procedure to extract the volatile
compounds out of the fish muscle into the trichloroacetic acid (TCA) extraction medium.
The procedure to get a transparent and clean exudate from the fish muscle has not yet
been investigated enough. The method to obtained the exudate by pressure was tested but
that method was not very successful because the exudate was rather opaque and seemed
to contain some tissue particles that had to be removed in order to be able to inject the
sample. This was especially the case when the fish was of high post-mortem The sample
had to be centrifuged at a high speed in order to get it transparent but that was of course
an additional step in the procedure. The clear sample of c.a. 0,5 ml that was obtained was
injected in the injection valve but the TMA and TVB results calculated from the peaks on
the chart recorder were not representative to the same TCA extraction samples nor the
decompose indices (QIM and Torry score). This was tried for a few samples of haddock
at a different stages of spoilage but without success. However, more tests must be done to
find out if some other methods, to get the exudates from the fish, can be used and to find
out if other fish species give better and more representative results than the haddock.
0 ,0
2 ,0
4 ,0
6 ,0
8 ,0
1 0 ,0
1 2 5 7 9
S to ra g e t im e in ic e (d a y s )
QI S
core
0
2
4
6
8
1 0
Lo
g C
FU
/G
Q I(0 -1 1 )L o g C F U /g
63
Sub-task 3.i.
Even though this sub-task has not been the on the work-plan during this period the first
steps have been taken to produce a new FIGD equipment that will be ready for the
industrial partner in due time. The new FIGD will be ready by the end of November 1999
and will have a few advantages over the currently used FIGD.
1. The new FIGD is equipped with a micro-processor (micro-computer) that has the
ability to calculate the signals from the injected standards and the samples and display the
values on a small screen within the unit.
2. It can easily be connected to a computer with a common program such an Excel if
there will be a need for further processing of the results.
3. The use of chart recorder is not essential.
4. It is more compacted than the old one and it can easily be transferred between places
because it is fit up in a sturdy but a handy briefcase.
4. CONCLUSIONS
TMA measured by the FIGD method and the WEFTA Codex method gave similar result
for all species (R2 > 0,96). TVB measured by the FIGD method gave at average 60%
lower results than if measured by the Dyer method for all species.
TMA and TVB values in the cod and haddock eyes were lower than the in the fillets but
showed a similar exponential pattern.
The detection limit for TMA and TVB by the FIGD method is 0,1 mg N/100 g and spiked
samples gave at average 99,9 % recovery.
The advantages of the FIGD method:
It was faster and easier to use than comparable methods.
It only required 0,1 ml of extractable sample.
The FIGD equipment is inexpensive (<3000 EURO).
The disadvantages of the FIGD method:
The extraction process and the dilutions of "strong" extracts were limiting factors.
The TMA baseline was not as stable as the TVB baseline.
The FIGD- TVB method gave about 60% lower values than the WEFTA Codex
method.
64
5. REFERENCES
Anon.: Decision of the European Commission to fix TVB-N limits for certain categories
of fishery products (95/149/EEC).
Antonacopoulos, N. & Vyncke, W. (1989) Determination of volatile basic nitrogen in
fish: a third collaborative study by the West European Fish Technologists Association
(WEFTA). A WEFTA original paper.
Beatty, S.A. and Gibbons, N.E. (1936). The measurement of spoilage in fish. J. Fish Res.
Bd. Can. 3: 77.
Botta, J.R. (1995). Evaluation of Seafood Freshness Quality, VCH Publishers, Inc, New
York, p9-33,
Clinch J.R. (1988). PhD Thesis, University of Hull.
Connell, J.J. (1990). Control of Fish Quality, 3rd ed. Fishing News Ltd., London.
Dyer, W.J. J. Fish. Res. Bd. Can. 6, p351 (1945)
Gill, T.A., and Thompson, J. (1984). Rapid, automated analysis of amines in seafood by
ion-moderated partition HPLC. J. Food Sci., 49:603-606.
Gram, L., Trolle, G. & Huss, H.H. (1987). Detection of specific spoilage bacteria from
fish stored at low (0°C) and high (20°C) temperatures. Int. J. Food Microbiol. 4, 65-72.
Hoogland, P.L. (1958). Grading fish for quality. II. Statistical analysis of the results of
experiments regarding grades and trimethylamine values. J. Fish. Res. Bd. Can. 15: 717.
Oehlenschlälager, J. (1997). Suitability of ammonia-N, dimethylamine-N,
trimethylamine-N, trimethylamine oxide-N and total volatile basic nitrogen as freshness
65
indicators in seafood. In "Methods to determine the freshness of fish. In research and
industry." Nantes conference, November 12-14, 1997.
Ruzika, J. and Hansen, E.H. (1981). Flow Injection Analysis. Wiley, New York.
Sadok, S., Uglow, R., and Haswell, S.J. (1996). Determination of trimethylamine in fish
by flow injection analysis. Analytica Chimica Acta 321, 69-74.
Tozawa, H., Enokihara K. and K. Amano, in "Fish Inspection and Quality Control" (R.
Kreuzer, ed.), Fishing News Books Ltd., London, p187, (1971).
Vyncke, W., Luten, J., BrUnner, K. and Moermans, R. (1987). Determination of total
volatile bases in fish: a collaborative study by the West European Fish Technologists´
assosiation (WEFTA). Z Lebensm Unters Forsch 184: 110-114.
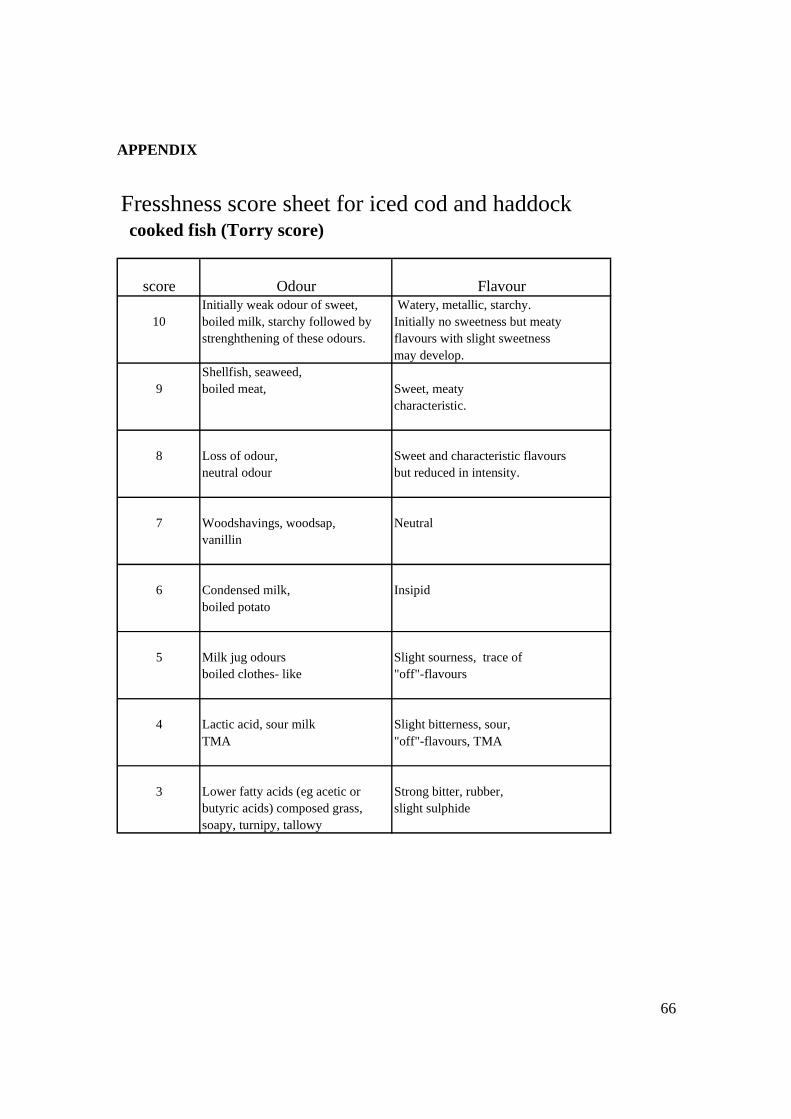
66
APPENDIX
Fresshness score sheet for iced cod and haddock cooked fish (Torry score)
score Odour FlavourInitially weak odour of sweet, Watery, metallic, starchy.
10 boiled milk, starchy followed by Initially no sweetness but meaty strenghthening of these odours. flavours with slight sweetness
may develop.Shellfish, seaweed,
9 boiled meat, Sweet, meatycharacteristic.
8 Loss of odour, Sweet and characteristic flavours neutral odour but reduced in intensity.
7 Woodshavings, woodsap, Neutralvanillin
6 Condensed milk, Insipidboiled potato
5 Milk jug odours Slight sourness, trace of boiled clothes- like "off"-flavours
4 Lactic acid, sour milk Slight bitterness, sour, TMA "off"-flavours, TMA
3 Lower fatty acids (eg acetic or Strong bitter, rubber,butyric acids) composed grass, slight sulphidesoapy, turnipy, tallowy
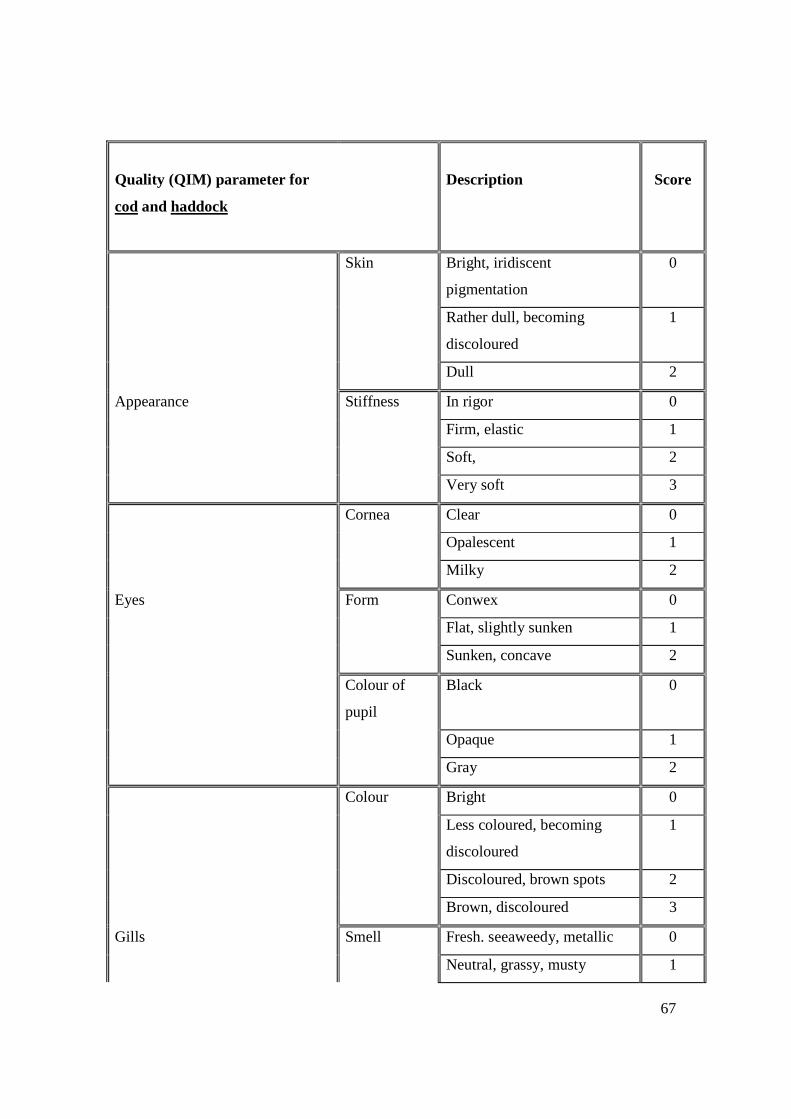
67
Quality (QIM) parameter for
cod and haddock
Description
Score
Skin Bright, iridiscent
pigmentation
0
Rather dull, becoming
discoloured
1
Dull 2
Appearance Stiffness In rigor 0
Firm, elastic 1
Soft, 2
Very soft 3
Cornea Clear 0
Opalescent 1
Milky 2
Eyes Form Conwex 0
Flat, slightly sunken 1
Sunken, concave 2
Colour of
pupil
Black 0
Opaque 1
Gray 2
Colour Bright 0
Less coloured, becoming
discoloured
1
Discoloured, brown spots 2
Brown, discoloured 3
Gills Smell Fresh. seeaweedy, metallic 0
Neutral, grassy, musty 1
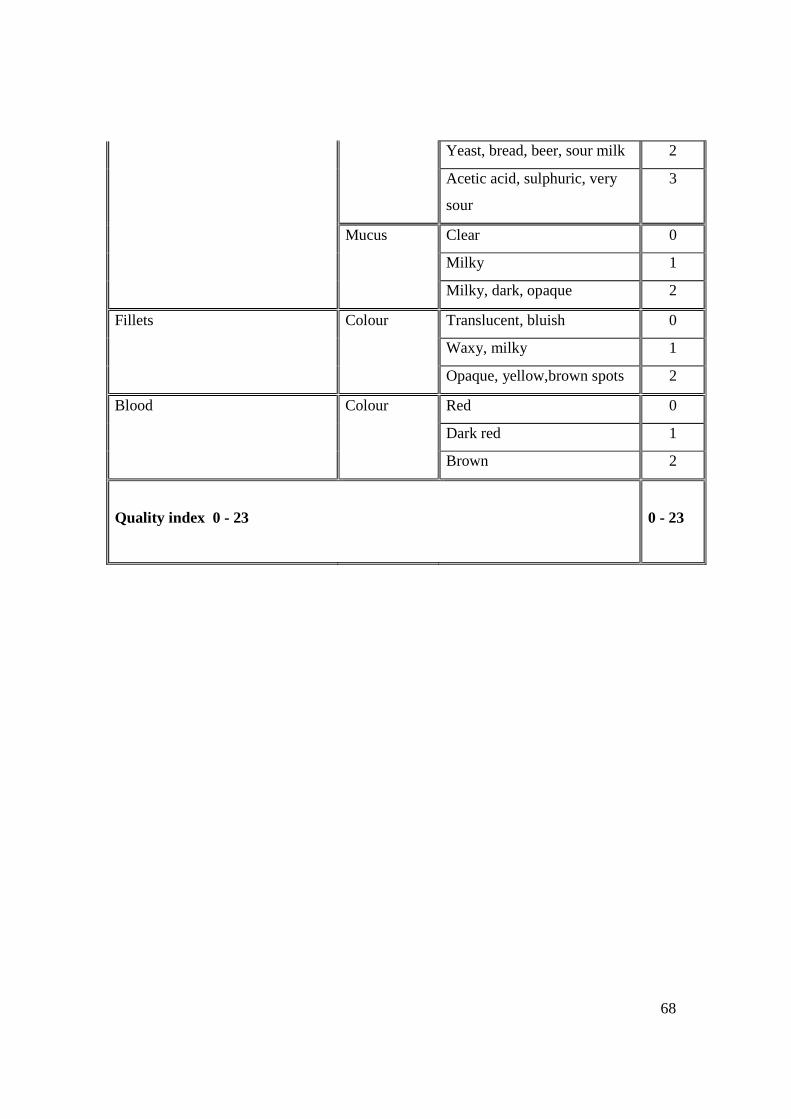
68
Yeast, bread, beer, sour milk 2
Acetic acid, sulphuric, very
sour
3
Mucus Clear 0
Milky 1
Milky, dark, opaque 2
Fillets Colour Translucent, bluish 0
Waxy, milky 1
Opaque, yellow,brown spots 2
Blood Colour Red 0
Dark red 1
Brown 2
Quality index 0 - 23
0 - 23
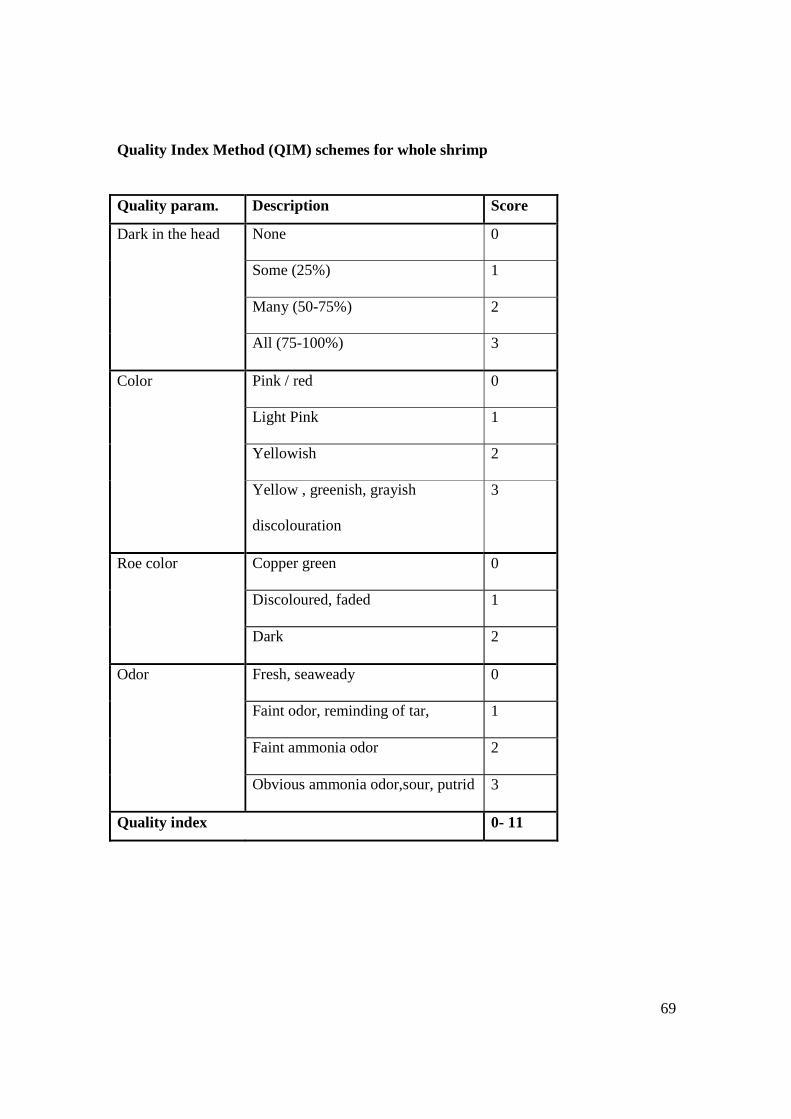
69
Quality Index Method (QIM) schemes for whole shrimp
Quality param. Description Score
Dark in the head None 0
Some (25%) 1
Many (50-75%) 2
All (75-100%) 3
Color Pink / red 0
Light Pink 1
Yellowish 2
Yellow , greenish, grayish
discolouration
3
Roe color Copper green 0
Discoloured, faded 1
Dark 2
Odor Fresh, seaweady 0
Faint odor, reminding of tar, 1
Faint ammonia odor 2
Obvious ammonia odor,sour, putrid 3
Quality index 0- 11
70
PROGRESS REPORT FROM THE ICELANDIC FISHERIES LABORATORIES
Progress Report 3: 01. 10 1999 – 31. 12. 2000.
SUMMARY
In the 3rd and final period of this project, Qualpoiss 2 (FAIR PL. 97.3253), two
comprehensive storage experiments were conducted on cod in co-operation with another
FAIR project called Mustec (FAIR CT98-4076). The experiments took place in
Reykjavík in November 1999 and in Tromsö in May 2000. TMA and TVB were
measured with the FIGD technique and the freshness was also determined using other
non-destructive methods such as measuring the electronic properties by RT-Meter. The
TMA/TVB results were similar in both experiments where the values remained very low
up to day 11 of post mortem age. The RT-meter readings showed better linearity with
storage time. Storage experiments of iced whole gutted haddock and haddock fillets were
also done in order to see if there was a difference in TMA and TVB, measured by FIGD,
between the fillets and the whole haddock. The fillets spoiled faster and showed much
higher TMA and TVB values at the end of the experiments (15-18 days) due to better
access of bacteria to the fish muscle in the fillets. Major part of this period was reserved
for development of improved version of FIGD. The production of the first IFL-FIGD was
finished in September 2000 and it was introduced to the other laboratories participating in
Qualpoiss 2 and Musctec and to a few fish processing plants in Iceland. The IFL-FIGD
version contains microprocessor that automatically calculates the signal from the detector
and dispay results in mgN/100g on a small screen. The chart recorder was therefore not
necessary and the FIGD is compacted in a small easy-to-carry case. Even though the IFL-
FIGD is easier to use than the original FIGD it is still not convenient enough for the
industry and can not distinguish between the freshness stage of the fish for the first week
or more of storage of whole gutted cod or haddock in ice. The FIGD technique is though
beneficial to the fish research laboratories and can replace more inconvenient techniques
to determine TMA and TVB, as has taken place at IFL.
71
1. INTRODUCTION
The IFL tasks for the final year, that covered the period from October 1999 through
December 2000, were divided into 4 periods, A, B, C and D.
A. In the first quarter of the period (October – December 1999) the objectives were:
I. To do comprehensive experiment, in November 1999 in Reykjavik, on cod during
storage in ice by determining TMA, TVB, using the FIGD-technique and other more
commonly used methods. The pH of the fish tissue was also determined and the P-ratio
was calculated. Parallel to these determinations co-operation with another EU-project
called by short name “Mustec”(FAIR CT98-407) was carried out by using non-
destructive methods to evaluate the freshness of the cod during storage. These
measurements involved for example determination of the texture, odour by an electronic
nose, electrical properties of the skin by Torry-meter, Fish-tester and RT-Meter and
different properties of the fish -tissue against light. Results from all these non-destructive
methods and the simple and rapid FIGD-method would give a very comprehensive
indication of the freshness stage of the fish. The usefulness of the FIGD method could
also be evaluated when it was compared with so many different methods to determine
freshness of cod.
II. To develop a simpler and more reliable FIGD-equipment in order to have portable and
more automatic equipment that will be adequate for the industry.
B. The IFL task for the second quarterly report (January to March 2000) period of this
project was divided into three sub-tasks:
I. To observe if there was any difference between two different FIGD detectors. One was
supplied by the co-ordinator (IFHQ-Hull) at the beginning of the project. The other was
handed out by the co-ordinator at the meeting in Portugal in November 1999.
72
II. To compare the recovery of TMA and TVB standards TMA-HCl and NH4Cl
respectively) using the FIGD technique and steam distillation of TCA extract.
III. To carry on with the development of a new and improved type of FIGD equipment.
C. The IFL task for the third quarterly report (April to June 2000) period of this project
was divided into three sub-tasks:
I. To host and organize a plenary meeting in May (10 and 11th) at IFL in Reykjavik,
Iceland, which included a half day work-in where the different FIGD detectors were
compared and the procedure to determine TMA and TVB was exercised.
II. To carry out two storage experiments on haddock fillets and whole haddock stored in
ice in order to find out the difference in TMA and TVB using FIGD technology.
III. To participate in a storage experiment in Tromsö Norway in May 23-31st by using
FIGD to determine TMA, TMAO and TVB in fresh and thawed cod and fresh-farmed
salmon in collaboration with the “Mustec” FAIR CT98-4076 project.
IV. To carry on with the development of a new and improved type of FIGD equipment.
D. The IFL task for the forth-quarterly report (July to December 2000) period of this
project was divided into three sub-tasks:
I. To finish the development of the IFL version of FIGD equipment.
II. To participate in the final plenary and results collation meeting in UB-Barcelona.
III. To introduce the FIGD technique, with emphasis on the IFL version, to other IFL
laboratories, fish processing plants in Iceland, the members of the Mustec project
participants and members of Firskeri Forskning in Tromsö Norway.
73
2. MATERIALS AND METHODS
2.1 Experiments
A I. Experiment. The IFL participant, in collaboration with the Mustec group, carried
out a storage experiment in Reykjavik on cod stored in ice. TMA and TVB
determinations were done on the fillets tissue of the cod with the Flow Injection Gas
Diffusion Method (FIGD). Parallel to this the IFL participant determined pH and the
freshness score according to the electronic properties of the skin with the RT-meter.
The cod was caught in November 1999 in fishing grounds SW of Iceland. It was brought
bled, gutted and iced into 90L boxes on board and brought ashore a few hours after catch.
The fish was kept for storage trial at 0 to 1°C. Samples of the fillets and were taken at 2-3
days interval during the storage period. On each day of sampling 8 fillets of 8 fish were
examined. Pooled sample of the eyes was taken.
CII. Experiment. Fresh haddock fillets, of 2 days post mortem age, were stored in ice in
insulated plastic boxes for up to 14 days at 2°C in May 2000. For comparison, a storage
experiment was done on whole gutted haddock that was stored in ice. Thawed cod fillets,
that were frozen one year earlier, were stored un-iced at 2°C for up to 12 days. Samples
were taken with 2-3 days interval and the TMA and TVB were measured.
CIII. Experiment. Fresh cod was caught alive in N-Norway fishing ground and kept
alive but starved in a cage for 3 weeks before it was slaughtered for the experiment. The
thawed cod got same treatment but it was slaughtered and frozen on April 6th 2000 and
was thus stored frozen for 6 weeks. It was thawed in air for two days before the different
freshness (spoilage) indicators were determined. The fish was frozen at – 40°C for 1 day
and kept in freezer at –30°C after that. Fresh-farmed salmon was slaughtered after 3
weeks starving period.
74
2.2. Chemical analysis
TVB-N was measured with two different methods:
a) Flow Injection Gas Diffusion (FIGD) as descried in the technical annex.
b) Steam distillation of TCA extract as descried in the technical annex with some
modifications that was agreed on during discussion on the Peterhead meeting in July.
One hundred grams of fish were mixed with 200 ml of trichloroacetic acid (TCA).
Twenty-five ml of the TCA extract, 6 ml of Noah (or enough to make the pH of the
solution 11) was transferred into a Kjeldahl flask. The ammonia of the solution was
liberated by steam distillation (on Gerhardt distillatory) into a receiver beaker
containing 20 ml of 3% boric acid and a few drops of mixed indicator. The distillation
was carried on until 100 ml of distillate had been collected. The titration end point
was a colour change from green to grey at pH 5.
TMA-N was also measured using two methods:
c) Flow Injection Gas Diffusion (FIGD) as descried in the technical annex.
FIGD technique:
Reagents: All Chemicals were p.a. Sodium Hydroxide (M): 1,0; Bromothymol blue
pH 6,50 (g/L): 0,3; Formaldehyde: 20%; Trichloroacetic acid (Merck), Ammonium
chloride (NH4Cl) for TVB determination and TMA crystalline HCl standard for TMA
determination.
Flow rate (ml/min): 1,0
Mixing coil (cm): 15
d) Dyer method except KOH was used instead of K2CO3 because it blocked better
the primary and secondary amines. (AOAC, 15th edit.1990).
2.3. Sensory evaluation
On each sampling day 10-12 members of trained panel evaluated the fish. Each panel
member evaluated 5 fish according to the Quality Index Method.
75
2.4. Physical measurements
The RT-Fresh meter measures the electrical resistance of the fish-skin. The values will
decrease with time of storage of post-mortem fish. The RT-meter was used by the IFL
participant but the Torrymeter and the Fish-Testers were used by the Scottish and The
German participants of the Mustec project respectively.
3. RESULTS AND DISCUSSION
AI.
Experiment
Figures 1 shows the changes in TMA and TVB during storage of cod fillets in ice. The
TVB values were determined by the FIGD and the WEFTA Codex method and as has
been demonstrated earlier (Periodic reports 1-3 1999) the TVB values measured by the
FIGD method gives considerable lower values than obtained when TVB was measured
by the WEFTA Codex method. This is especially the case when the "white fish" species,
cod and haddock, were measured but the difference between methods does not seem to be
as much when TVB was measured on shrimp and haddock.
The evolution of pH and the calculated P-ratio is shown in figure 2. The pH is under 7 for
the first 4 days but over the neutral 7 at day 7 and levels off after that. In the case of the
pH it was an indicator of the very fresh fish for the first 4 days but there were no
measurements done on the fillets between day 4 and 7. However it could be stated that at
day 7 the fish has lost its major freshness characteristics and the rise in pH was probably
due to breakdown products from Pseudomanas bacteria. The P-ratio acts in a similar way
as the TMA curve, stays very low from day 1 until day 11 but there is a gap between day
11 and 15 so it can not been confirmed if the low values would have continued up to day
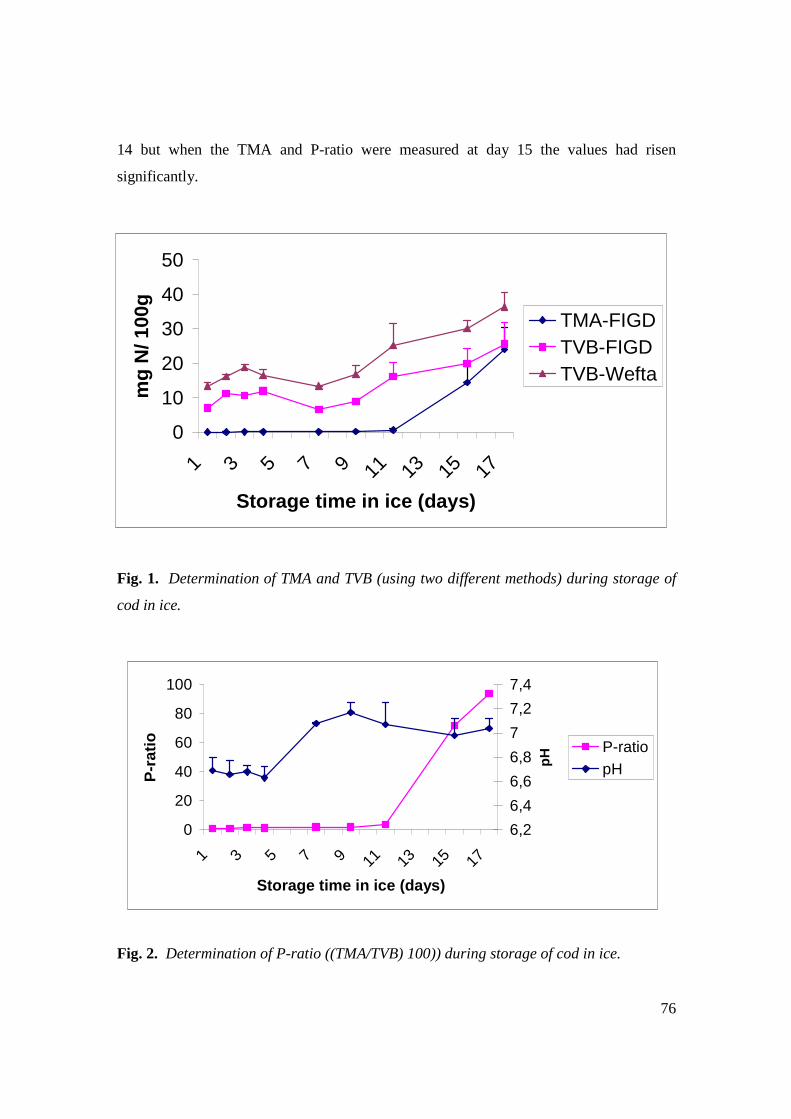
76
14 but when the TMA and P-ratio were measured at day 15 the values had risen
significantly.
Fig. 1. Determination of TMA and TVB (using two different methods) during storage of
cod in ice.
Fig. 2. Determination of P-ratio ((TMA/TVB) 100)) during storage of cod in ice.
0
10
20
30
40
50
1 3 5 7 9 11 13 15 17
Storage time in ice (days)
mg
N/ 1
00g
TMA-FIGDTVB-FIGDTVB-Wefta
0
20
40
60
80
100
1 3 5 7 9 11 13 15 17
Storage time in ice (days)
P-r
atio
6,2
6,4
6,6
6,8
7
7,2
7,4
pH P-ratio
pH
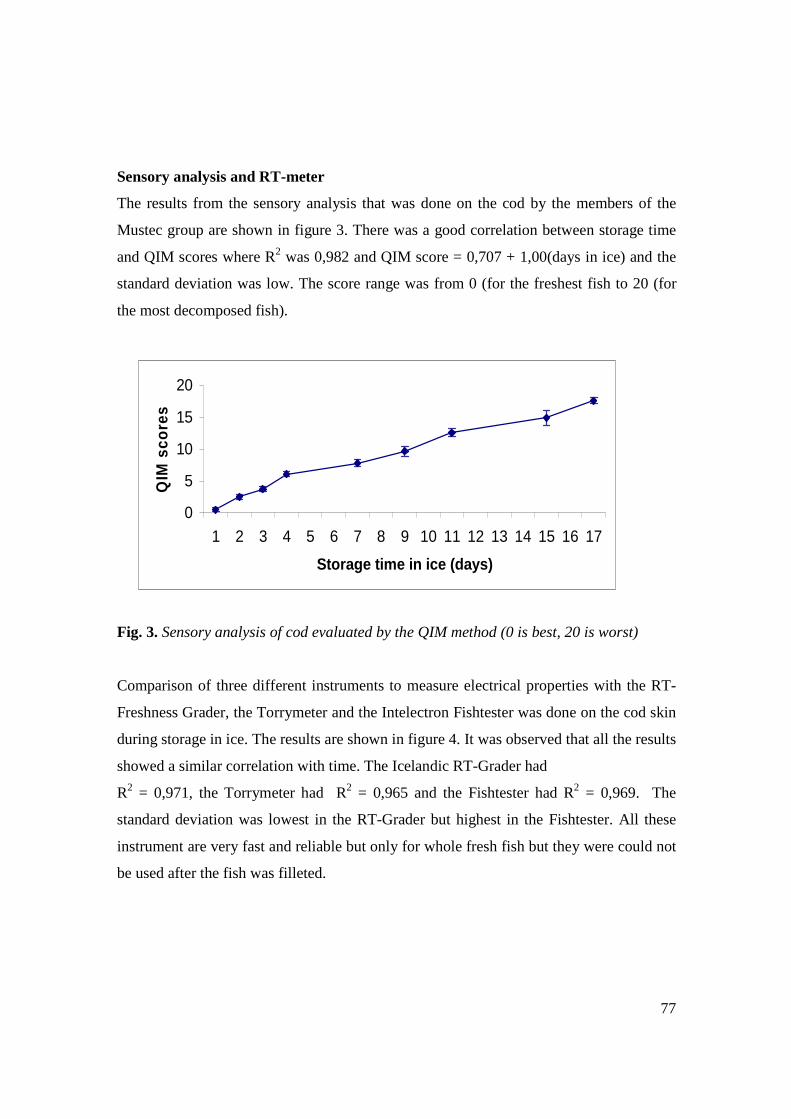
77
Sensory analysis and RT-meter
The results from the sensory analysis that was done on the cod by the members of the
Mustec group are shown in figure 3. There was a good correlation between storage time
and QIM scores where R2 was 0,982 and QIM score = 0,707 + 1,00(days in ice) and the
standard deviation was low. The score range was from 0 (for the freshest fish to 20 (for
the most decomposed fish).
Fig. 3. Sensory analysis of cod evaluated by the QIM method (0 is best, 20 is worst)
Comparison of three different instruments to measure electrical properties with the RT-
Freshness Grader, the Torrymeter and the Intelectron Fishtester was done on the cod skin
during storage in ice. The results are shown in figure 4. It was observed that all the results
showed a similar correlation with time. The Icelandic RT-Grader had
R2 = 0,971, the Torrymeter had R2 = 0,965 and the Fishtester had R2 = 0,969. The
standard deviation was lowest in the RT-Grader but highest in the Fishtester. All these
instrument are very fast and reliable but only for whole fresh fish but they were could not
be used after the fish was filleted.
0
5
10
15
20
1 2 3 4 5 6 7 8 9 10 11 12 13 14 15 16 17
Storage time in ice (days)
QIM
sco
res
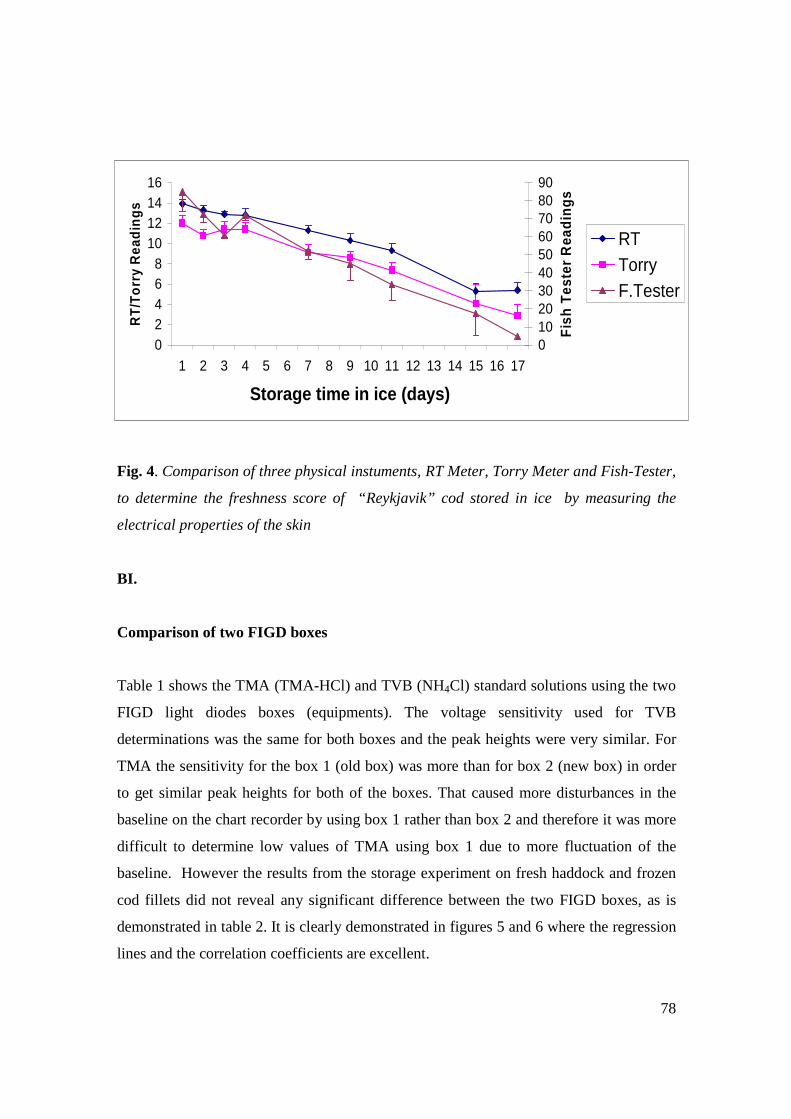
78
Fig. 4. Comparison of three physical instuments, RT Meter, Torry Meter and Fish-Tester,
to determine the freshness score of “Reykjavik” cod stored in ice by measuring the
electrical properties of the skin
BI.
Comparison of two FIGD boxes
Table 1 shows the TMA (TMA-HCl) and TVB (NH4Cl) standard solutions using the two
FIGD light diodes boxes (equipments). The voltage sensitivity used for TVB
determinations was the same for both boxes and the peak heights were very similar. For
TMA the sensitivity for the box 1 (old box) was more than for box 2 (new box) in order
to get similar peak heights for both of the boxes. That caused more disturbances in the
baseline on the chart recorder by using box 1 rather than box 2 and therefore it was more
difficult to determine low values of TMA using box 1 due to more fluctuation of the
baseline. However the results from the storage experiment on fresh haddock and frozen
cod fillets did not reveal any significant difference between the two FIGD boxes, as is
demonstrated in table 2. It is clearly demonstrated in figures 5 and 6 where the regression
lines and the correlation coefficients are excellent.
02468
10121416
1 2 3 4 5 6 7 8 9 10 11 12 13 14 15 16 17
Storage time in ice (days)
RT/
Torr
y R
ead
ing
s
0102030405060708090
Fis
h T
este
r R
ead
ing
s
RTTorryF.Tester
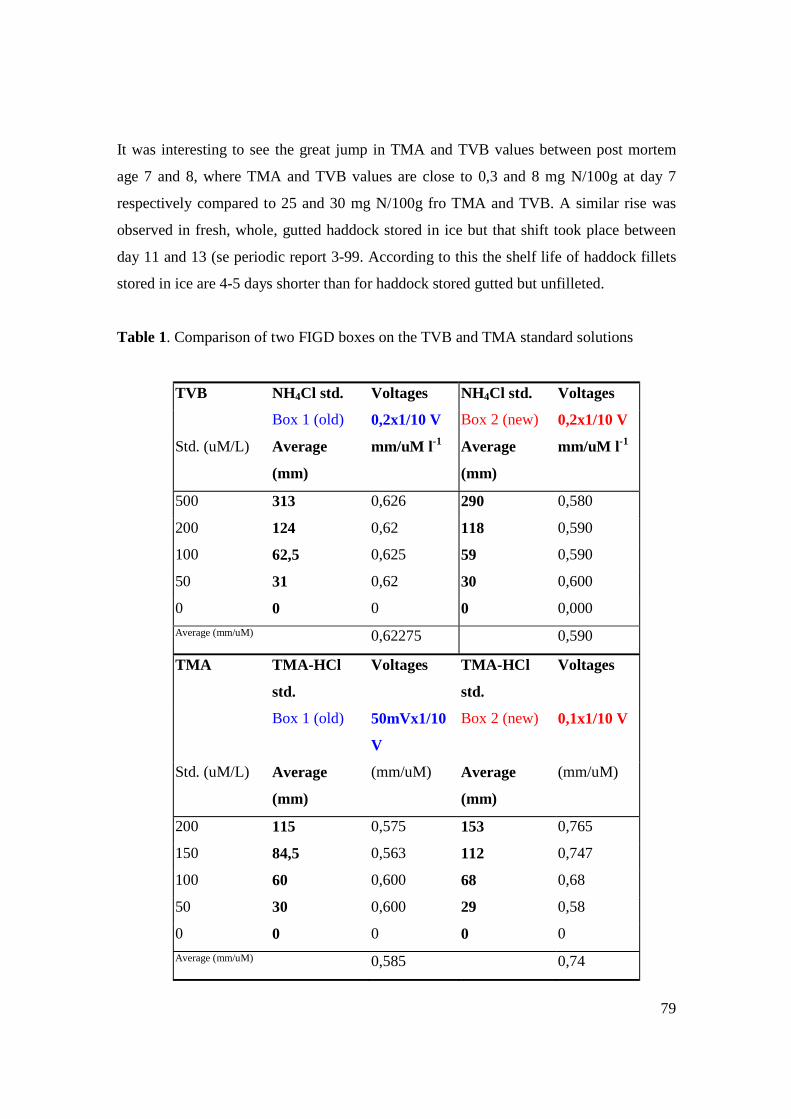
79
It was interesting to see the great jump in TMA and TVB values between post mortem
age 7 and 8, where TMA and TVB values are close to 0,3 and 8 mg N/100g at day 7
respectively compared to 25 and 30 mg N/100g fro TMA and TVB. A similar rise was
observed in fresh, whole, gutted haddock stored in ice but that shift took place between
day 11 and 13 (se periodic report 3-99. According to this the shelf life of haddock fillets
stored in ice are 4-5 days shorter than for haddock stored gutted but unfilleted.
Table 1. Comparison of two FIGD boxes on the TVB and TMA standard solutions
TVB NH4Cl std. Voltages NH4Cl std. Voltages
Box 1 (old) 0,2x1/10 V Box 2 (new) 0,2x1/10 V
Std. (uM/L) Average
(mm)
mm/uM l-1 Average
(mm)
mm/uM l-1
500 313 0,626 290 0,580
200 124 0,62 118 0,590
100 62,5 0,625 59 0,590
50 31 0,62 30 0,600
0 0 0 0 0,000
Average (mm/uM) 0,62275 0,590
TMA TMA-HCl
std.
Voltages TMA-HCl
std.
Voltages
Box 1 (old) 50mVx1/10
V
Box 2 (new) 0,1x1/10 V
Std. (uM/L) Average
(mm)
(mm/uM) Average
(mm)
(mm/uM)
200 115 0,575 153 0,765
150 84,5 0,563 112 0,747
100 60 0,600 68 0,68
50 30 0,600 29 0,58
0 0 0 0 0
Average (mm/uM) 0,585 0,74
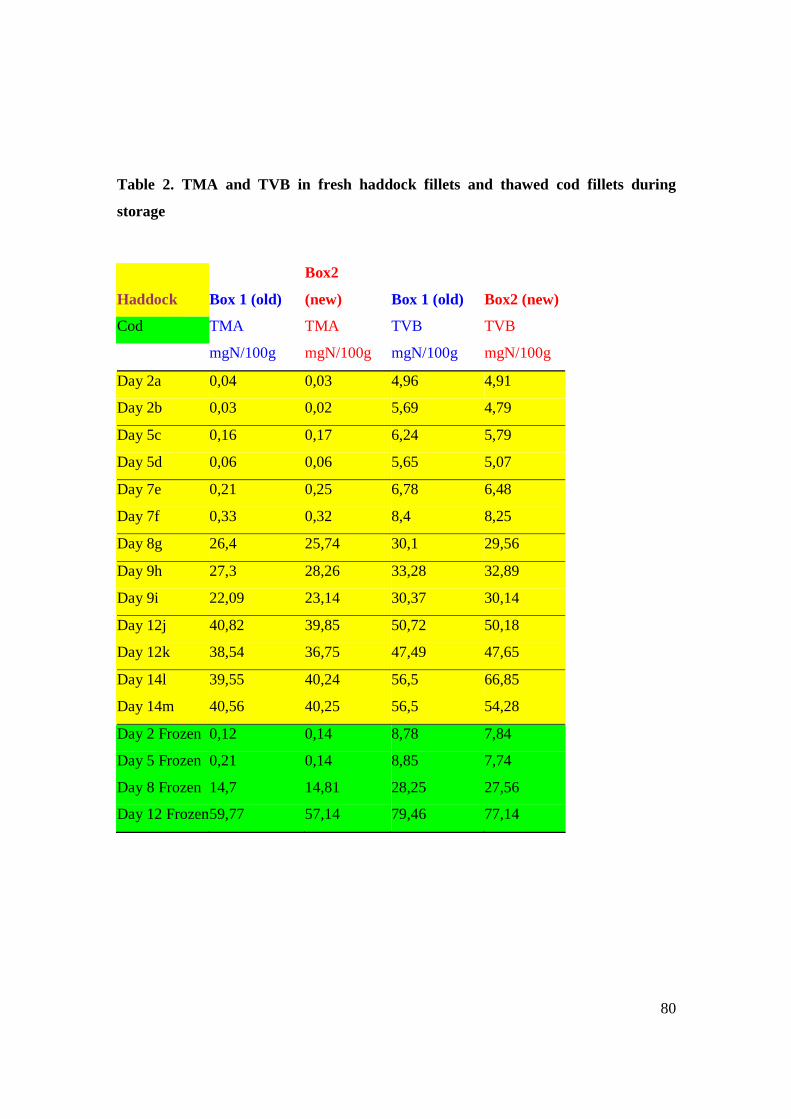
80
Table 2. TMA and TVB in fresh haddock fillets and thawed cod fillets during
storage
Haddock Box 1 (old)
Box2
(new) Box 1 (old) Box2 (new)
Cod TMA TMA TVB TVB
mgN/100g mgN/100g mgN/100g mgN/100g
Day 2a 0,04 0,03 4,96 4,91
Day 2b 0,03 0,02 5,69 4,79
Day 5c 0,16 0,17 6,24 5,79
Day 5d 0,06 0,06 5,65 5,07
Day 7e 0,21 0,25 6,78 6,48
Day 7f 0,33 0,32 8,4 8,25
Day 8g 26,4 25,74 30,1 29,56
Day 9h 27,3 28,26 33,28 32,89
Day 9i 22,09 23,14 30,37 30,14
Day 12j 40,82 39,85 50,72 50,18
Day 12k 38,54 36,75 47,49 47,65
Day 14l 39,55 40,24 56,5 66,85
Day 14m 40,56 40,25 56,5 54,28
Day 2 Frozen 0,12 0,14 8,78 7,84
Day 5 Frozen 0,21 0,14 8,85 7,74
Day 8 Frozen 14,7 14,81 28,25 27,56
Day 12 Frozen 59,77 57,14 79,46 77,14
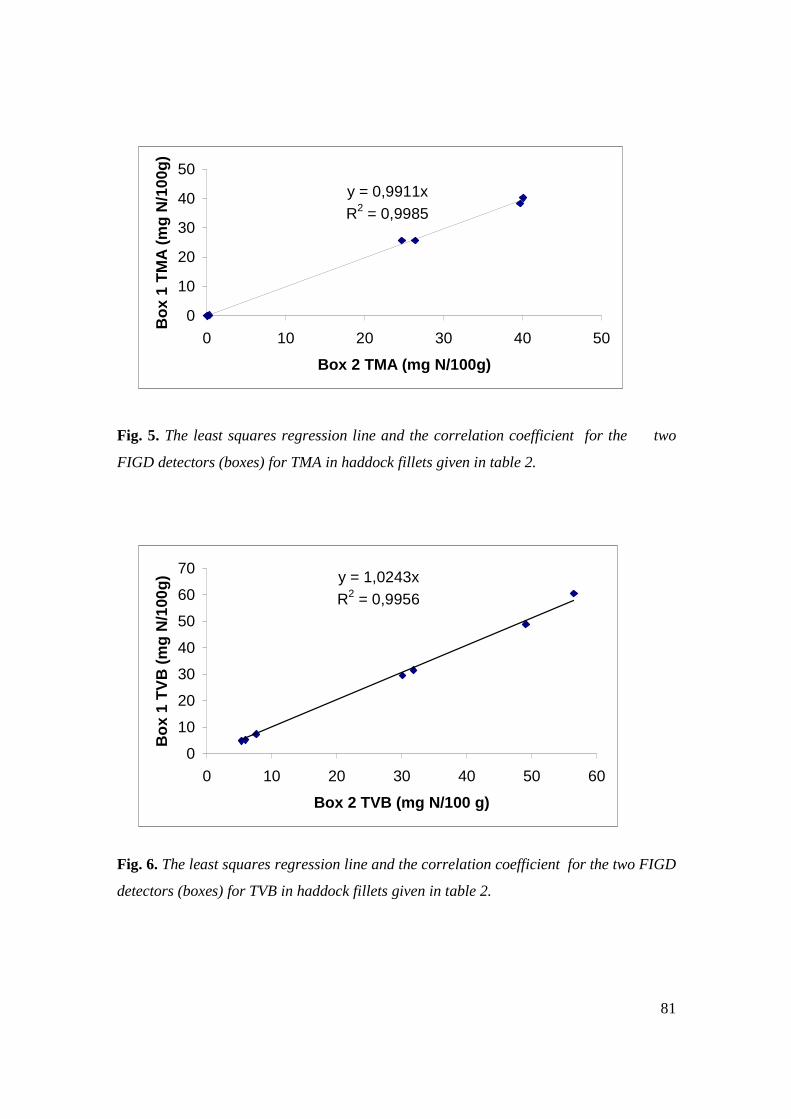
81
Fig. 5. The least squares regression line and the correlation coefficient for the two
FIGD detectors (boxes) for TMA in haddock fillets given in table 2.
Fig. 6. The least squares regression line and the correlation coefficient for the two FIGD
detectors (boxes) for TVB in haddock fillets given in table 2.
y = 0,9911xR2 = 0,9985
0
10
20
30
40
50
0 10 20 30 40 50
Box 2 TMA (mg N/100g)
Bo
x 1
TM
A (
mg
N/1
00g
)
y = 1,0243xR2 = 0,9956
0
10
20
30
40
50
60
70
0 10 20 30 40 50 60
Box 2 TVB (mg N/100 g)
Bo
x 1
TV
B (
mg
N/1
00g
)
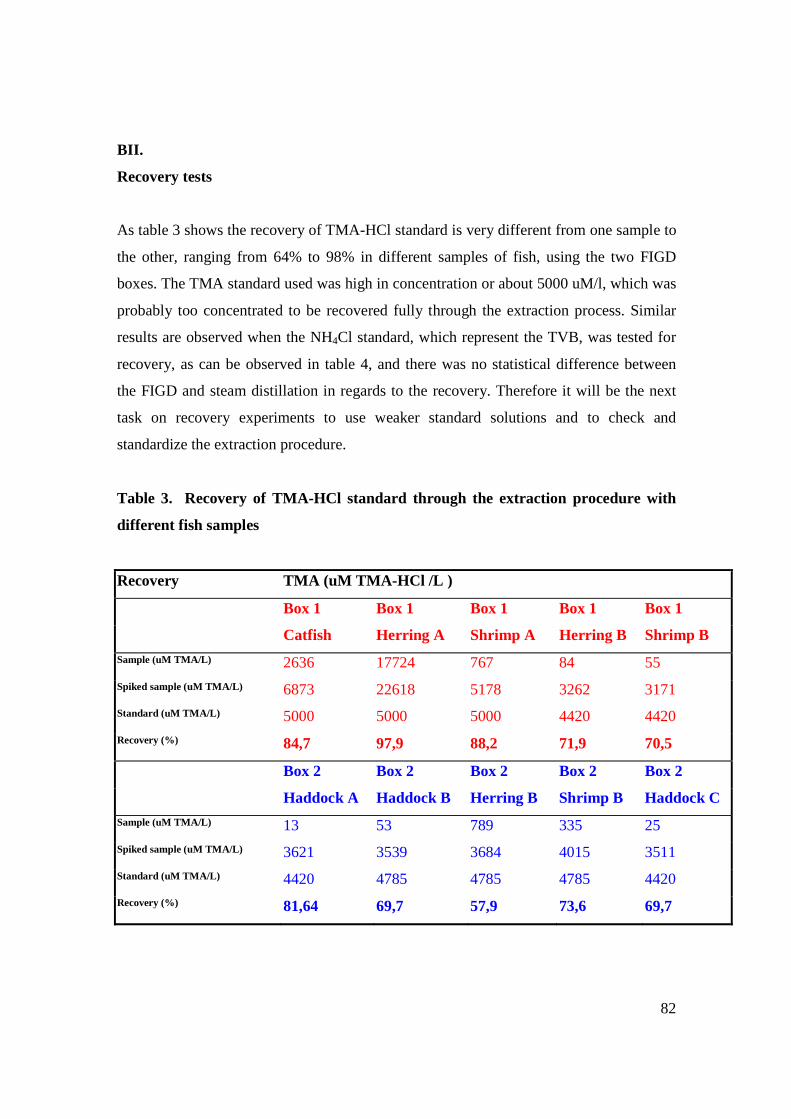
82
BII.
Recovery tests
As table 3 shows the recovery of TMA-HCl standard is very different from one sample to
the other, ranging from 64% to 98% in different samples of fish, using the two FIGD
boxes. The TMA standard used was high in concentration or about 5000 uM/l, which was
probably too concentrated to be recovered fully through the extraction process. Similar
results are observed when the NH4Cl standard, which represent the TVB, was tested for
recovery, as can be observed in table 4, and there was no statistical difference between
the FIGD and steam distillation in regards to the recovery. Therefore it will be the next
task on recovery experiments to use weaker standard solutions and to check and
standardize the extraction procedure.
Table 3. Recovery of TMA-HCl standard through the extraction procedure with
different fish samples
Recovery TMA (uM TMA-HCl /L )
Box 1 Box 1 Box 1 Box 1 Box 1
Catfish Herring A Shrimp A Herring B Shrimp B
Sample (uM TMA/L) 2636 17724 767 84 55
Spiked sample (uM TMA/L) 6873 22618 5178 3262 3171
Standard (uM TMA/L) 5000 5000 5000 4420 4420
Recovery (%) 84,7 97,9 88,2 71,9 70,5
Box 2 Box 2 Box 2 Box 2 Box 2 Haddock A Haddock B Herring B Shrimp B Haddock C
Sample (uM TMA/L) 13 53 789 335 25
Spiked sample (uM TMA/L) 3621 3539 3684 4015 3511
Standard (uM TMA/L) 4420 4785 4785 4785 4420
Recovery (%) 81,64 69,7 57,9 73,6 69,7
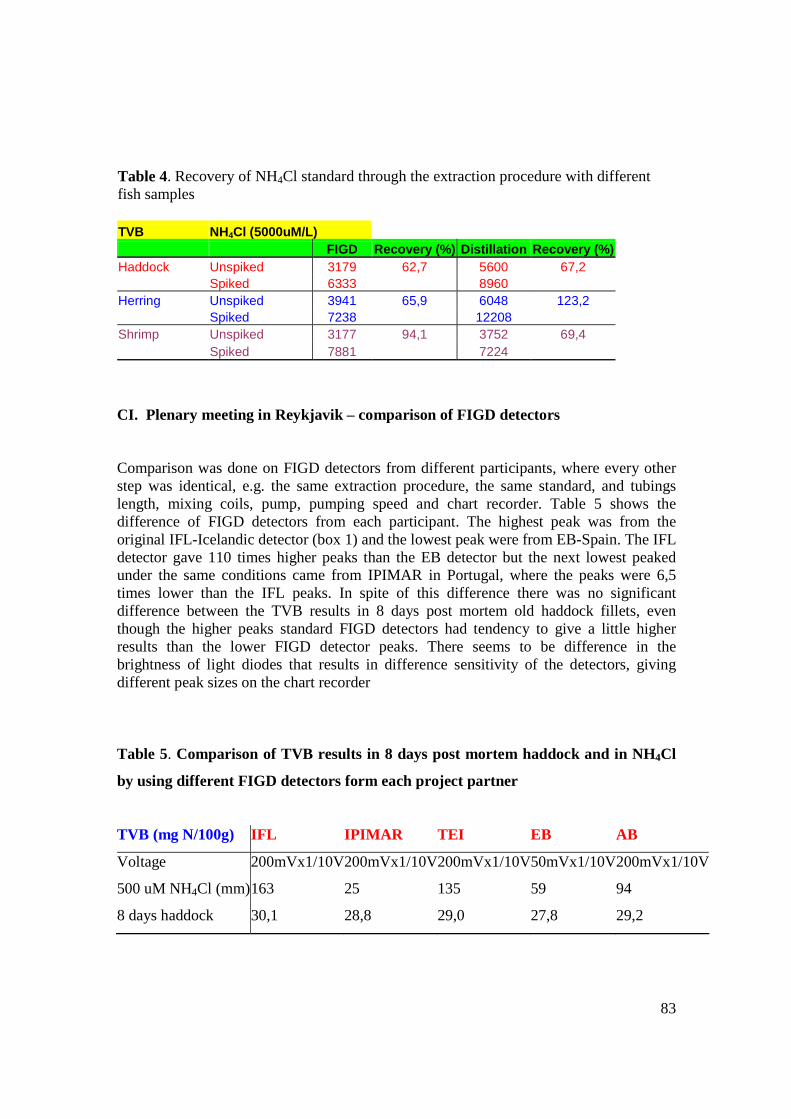
83
CI. Plenary meeting in Reykjavik – comparison of FIGD detectors
Comparison was done on FIGD detectors from different participants, where every other step was identical, e.g. the same extraction procedure, the same standard, and tubings length, mixing coils, pump, pumping speed and chart recorder. Table 5 shows the difference of FIGD detectors from each participant. The highest peak was from the original IFL-Icelandic detector (box 1) and the lowest peak were from EB-Spain. The IFL detector gave 110 times higher peaks than the EB detector but the next lowest peaked under the same conditions came from IPIMAR in Portugal, where the peaks were 6,5 times lower than the IFL peaks. In spite of this difference there was no significant difference between the TVB results in 8 days post mortem old haddock fillets, even though the higher peaks standard FIGD detectors had tendency to give a little higher results than the lower FIGD detector peaks. There seems to be difference in the brightness of light diodes that results in difference sensitivity of the detectors, giving different peak sizes on the chart recorder
Table 5. Comparison of TVB results in 8 days post mortem haddock and in NH4Cl
by using different FIGD detectors form each project partner
TVB (mg N/100g) IFL IPIMAR TEI EB AB
Voltage 200mVx1/10V 200mVx1/10V200mVx1/10V50mVx1/10V200mVx1/10V
500 uM NH4Cl (mm) 163 25 135 59 94
8 days haddock 30,1 28,8 29,0 27,8 29,2
Table 4. Recovery of NH4Cl standard through the extraction procedure with different fish samples TVB NH4Cl (5000uM/L) FIGD Recovery (%) Distillation Recovery (%) Haddock Unspiked 3179 62,7 5600 67,2 Spiked 6333 8960 Herring Unspiked 3941 65,9 6048 123,2 Spiked 7238 12208 Shrimp Unspiked 3177 94,1 3752 69,4 Spiked 7881 7224
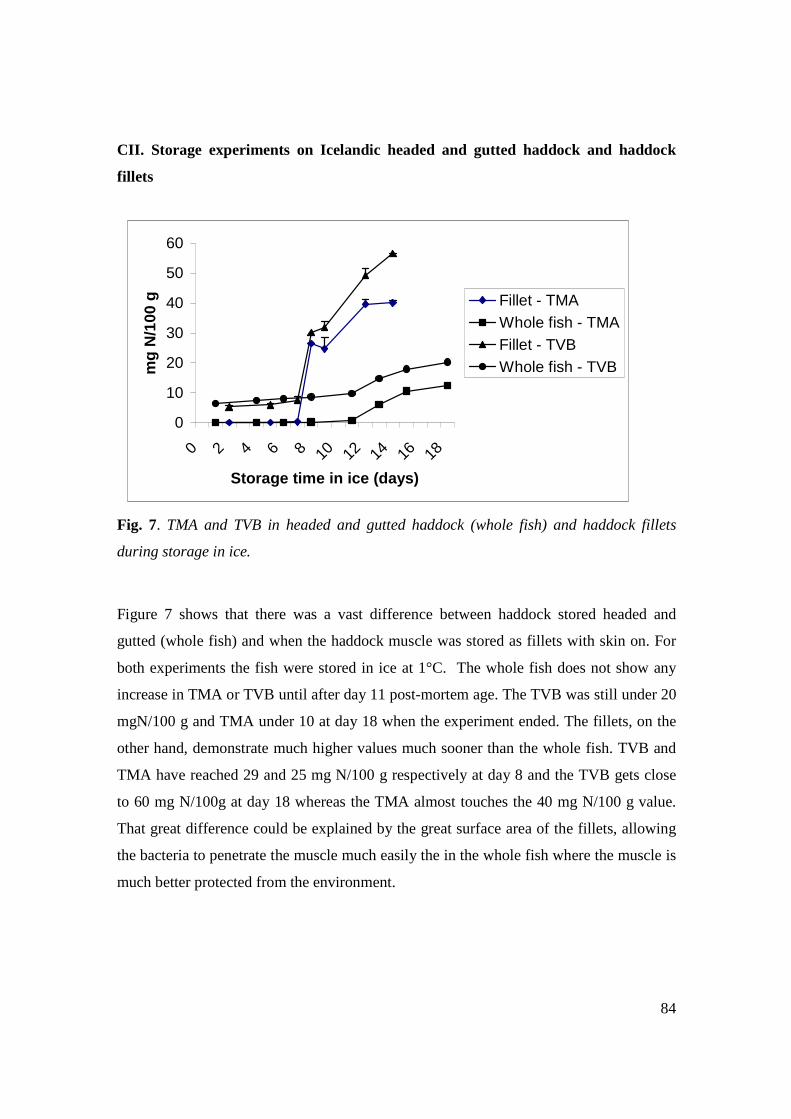
84
CII. Storage experiments on Icelandic headed and gutted haddock and haddock
fillets
Fig. 7. TMA and TVB in headed and gutted haddock (whole fish) and haddock fillets
during storage in ice.
Figure 7 shows that there was a vast difference between haddock stored headed and
gutted (whole fish) and when the haddock muscle was stored as fillets with skin on. For
both experiments the fish were stored in ice at 1°C. The whole fish does not show any
increase in TMA or TVB until after day 11 post-mortem age. The TVB was still under 20
mgN/100 g and TMA under 10 at day 18 when the experiment ended. The fillets, on the
other hand, demonstrate much higher values much sooner than the whole fish. TVB and
TMA have reached 29 and 25 mg N/100 g respectively at day 8 and the TVB gets close
to 60 mg N/100g at day 18 whereas the TMA almost touches the 40 mg N/100 g value.
That great difference could be explained by the great surface area of the fillets, allowing
the bacteria to penetrate the muscle much easily the in the whole fish where the muscle is
much better protected from the environment.
0
10
20
30
40
50
60
0 2 4 6 8 10 12 14 16 18
Storage time in ice (days)
mg
N/1
00 g Fillet - TMA
Whole fish - TMAFillet - TVBWhole fish - TVB
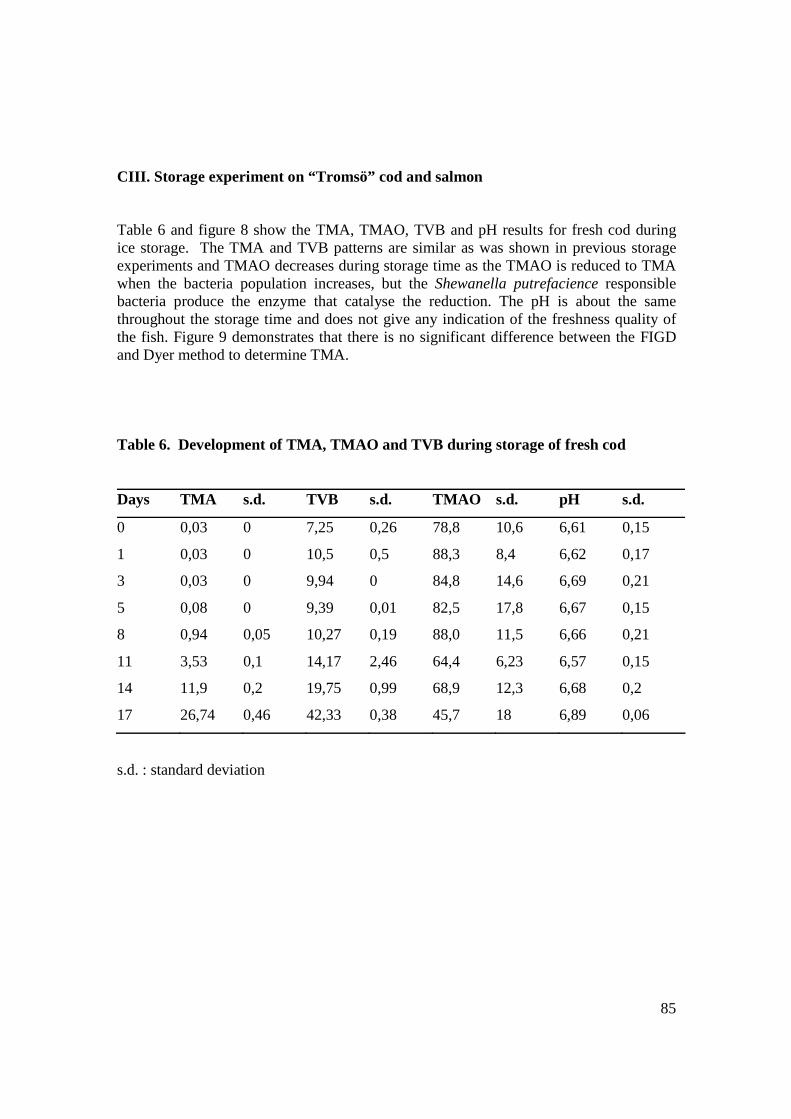
85
CIII. Storage experiment on “Tromsö” cod and salmon
Table 6 and figure 8 show the TMA, TMAO, TVB and pH results for fresh cod during ice storage. The TMA and TVB patterns are similar as was shown in previous storage experiments and TMAO decreases during storage time as the TMAO is reduced to TMA when the bacteria population increases, but the Shewanella putrefacience responsible bacteria produce the enzyme that catalyse the reduction. The pH is about the same throughout the storage time and does not give any indication of the freshness quality of the fish. Figure 9 demonstrates that there is no significant difference between the FIGD and Dyer method to determine TMA.
Table 6. Development of TMA, TMAO and TVB during storage of fresh cod
Days TMA s.d. TVB s.d. TMAO s.d. pH s.d.
0 0,03 0 7,25 0,26 78,8 10,6 6,61 0,15
1 0,03 0 10,5 0,5 88,3 8,4 6,62 0,17
3 0,03 0 9,94 0 84,8 14,6 6,69 0,21
5 0,08 0 9,39 0,01 82,5 17,8 6,67 0,15
8 0,94 0,05 10,27 0,19 88,0 11,5 6,66 0,21
11 3,53 0,1 14,17 2,46 64,4 6,23 6,57 0,15
14 11,9 0,2 19,75 0,99 68,9 12,3 6,68 0,2
17 26,74 0,46 42,33 0,38 45,7 18 6,89 0,06
s.d. : standard deviation
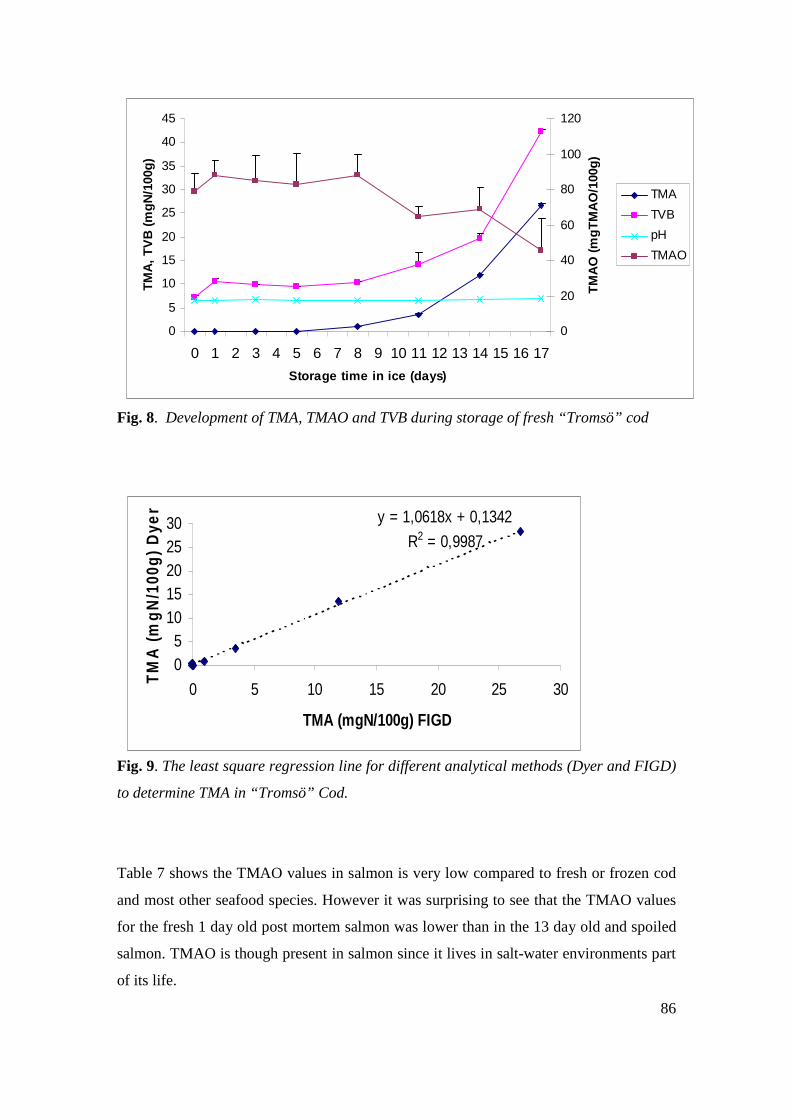
86
Fig. 8. Development of TMA, TMAO and TVB during storage of fresh “Tromsö” cod
Fig. 9. The least square regression line for different analytical methods (Dyer and FIGD)
to determine TMA in “Tromsö” Cod.
Table 7 shows the TMAO values in salmon is very low compared to fresh or frozen cod
and most other seafood species. However it was surprising to see that the TMAO values
for the fresh 1 day old post mortem salmon was lower than in the 13 day old and spoiled
salmon. TMAO is though present in salmon since it lives in salt-water environments part
of its life.
y = 1,0618x + 0,1342
R2 = 0,9987
05
1015202530
0 5 10 15 20 25 30
TMA (mgN/100g) FIGD
TM
A (
mg
N/1
00g
) D
yer
0
5
10
15
20
25
30
35
40
45
0 1 2 3 4 5 6 7 8 9 10 11 12 13 14 15 16 17
Storage time in ice (days)
TM
A,
TV
B (
mg
N/1
00g
)
0
20
40
60
80
100
120
TM
AO
(m
gT
MA
O/1
00g
)
TMA
TVB
pH
TMAO
87
Table 7. Development of TMA, TMAO and TVB during storage of thawed cod and
fresh salmon
SALMON
Days TMA s.d. TVB s.d. TMAO s.d. pH
0 0,03 0 12,55 0,05 8,07 1,13 6,3
13 0,87 0 15,43 0,43 18,79 1,18
THAWED COD
Days TMA s.d. TVB s.d. TMAO s.d. pH
2 0,1 0 11,25 0,17 82,1 22,2 6,3
Similar measurements as were done in the “Tromsö” cod as were done on the
“Reykjavik” cod (see figure 4) using different hand-held instruments to measure the
electrical properties of the fish skin or tissue. As figure 10 shows the electrical tester
readings are almost linear function with days in ice as was the case for the “Reykjavik”
cod the RT-Meter gives slightly better linearity than the other two testers. The electrical
testers give much better linearity with days in ice than TMA and TVB, independent of
which method is used, and the testers give immediate response. However the testers can
only operate properly on fresh, unfrozen and undamaged fish but not on skinless fillets or
thawed fish, whereas FIGD would be more reliable.
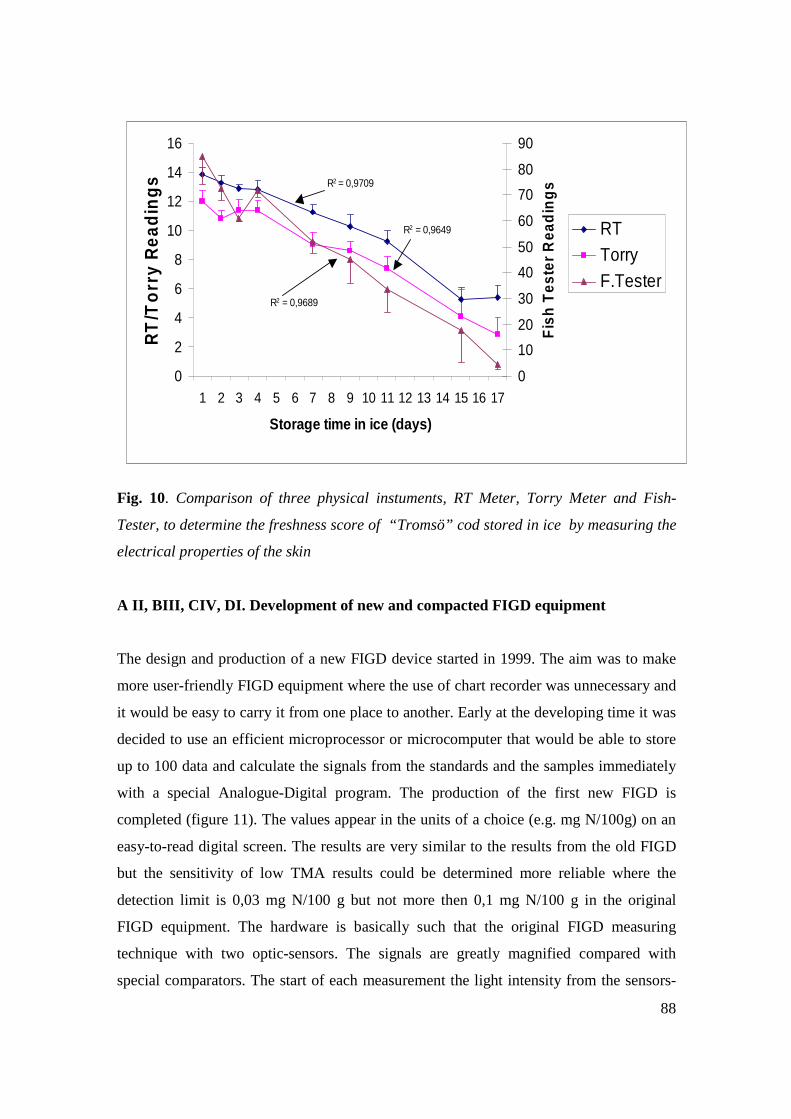
88
Fig. 10. Comparison of three physical instuments, RT Meter, Torry Meter and Fish-
Tester, to determine the freshness score of “Tromsö” cod stored in ice by measuring the
electrical properties of the skin
A II, BIII, CIV, DI. Development of new and compacted FIGD equipment
The design and production of a new FIGD device started in 1999. The aim was to make
more user-friendly FIGD equipment where the use of chart recorder was unnecessary and
it would be easy to carry it from one place to another. Early at the developing time it was
decided to use an efficient microprocessor or microcomputer that would be able to store
up to 100 data and calculate the signals from the standards and the samples immediately
with a special Analogue-Digital program. The production of the first new FIGD is
completed (figure 11). The values appear in the units of a choice (e.g. mg N/100g) on an
easy-to-read digital screen. The results are very similar to the results from the old FIGD
but the sensitivity of low TMA results could be determined more reliable where the
detection limit is 0,03 mg N/100 g but not more then 0,1 mg N/100 g in the original
FIGD equipment. The hardware is basically such that the original FIGD measuring
technique with two optic-sensors. The signals are greatly magnified compared with
special comparators. The start of each measurement the light intensity from the sensors-
0
2
4
6
8
10
12
14
16
1 2 3 4 5 6 7 8 9 10 11 12 13 14 15 16 17
Storage time in ice (days)
RT
/To
rry
Rea
din
gs
0
10
20
30
40
50
60
70
80
90
Fis
h T
este
r R
ead
ing
s
RTTorryF.Tester
R2 = 0,9709
R2 = 0,9649
R2 = 0,9689
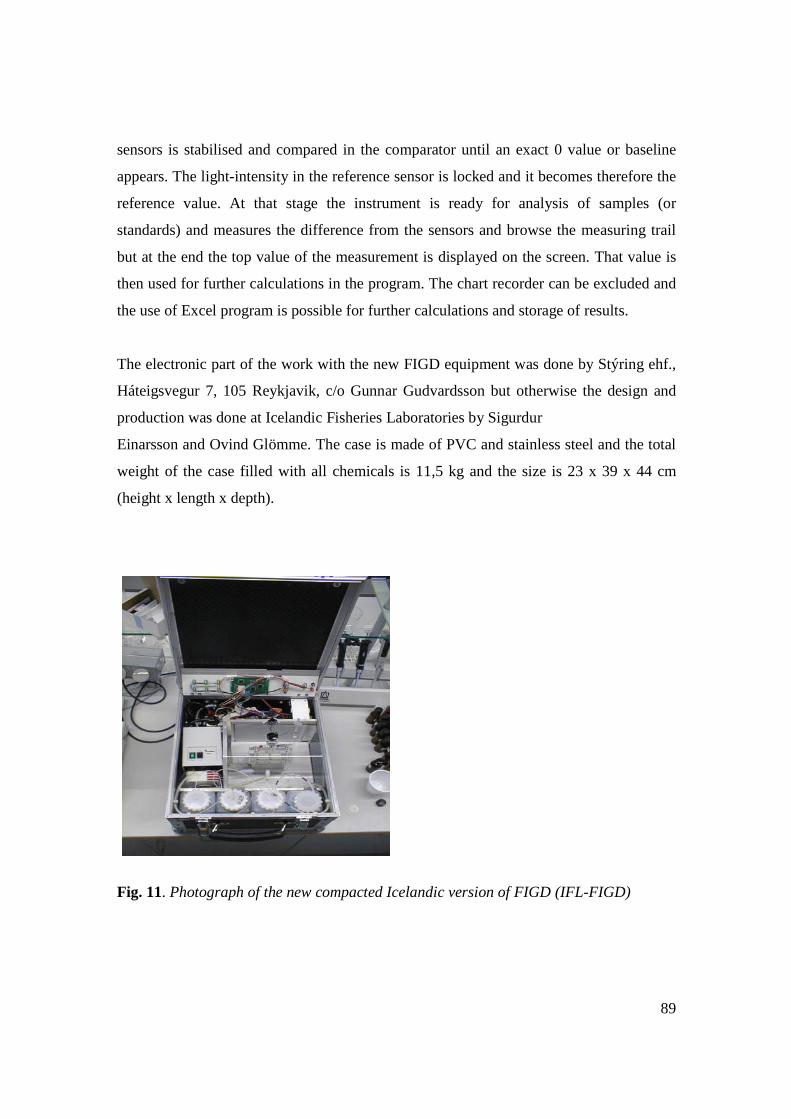
89
sensors is stabilised and compared in the comparator until an exact 0 value or baseline
appears. The light-intensity in the reference sensor is locked and it becomes therefore the
reference value. At that stage the instrument is ready for analysis of samples (or
standards) and measures the difference from the sensors and browse the measuring trail
but at the end the top value of the measurement is displayed on the screen. That value is
then used for further calculations in the program. The chart recorder can be excluded and
the use of Excel program is possible for further calculations and storage of results.
The electronic part of the work with the new FIGD equipment was done by Stýring ehf.,
Háteigsvegur 7, 105 Reykjavik, c/o Gunnar Gudvardsson but otherwise the design and
production was done at Icelandic Fisheries Laboratories by Sigurdur
Einarsson and Ovind Glömme. The case is made of PVC and stainless steel and the total
weight of the case filled with all chemicals is 11,5 kg and the size is 23 x 39 x 44 cm
(height x length x depth).
Fig. 11. Photograph of the new compacted Icelandic version of FIGD (IFL-FIGD)
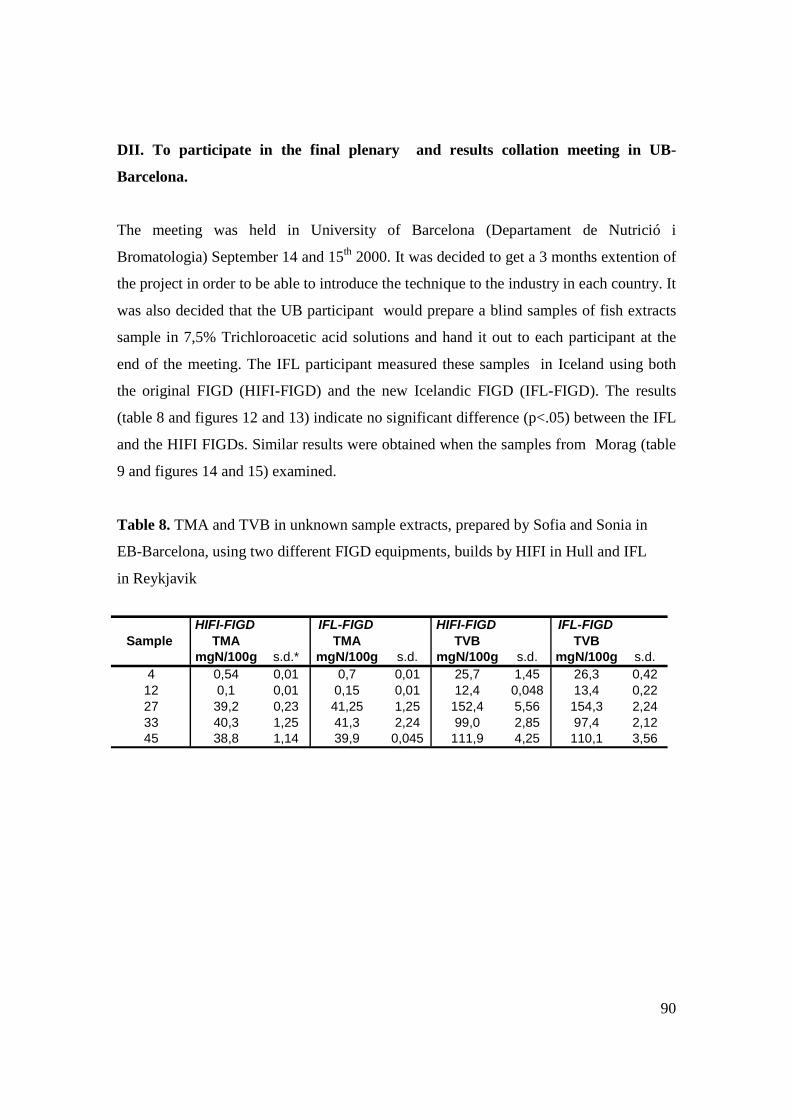
90
DII. To participate in the final plenary and results collation meeting in UB-
Barcelona.
The meeting was held in University of Barcelona (Departament de Nutrició i
Bromatologia) September 14 and 15th 2000. It was decided to get a 3 months extention of
the project in order to be able to introduce the technique to the industry in each country. It
was also decided that the UB participant would prepare a blind samples of fish extracts
sample in 7,5% Trichloroacetic acid solutions and hand it out to each participant at the
end of the meeting. The IFL participant measured these samples in Iceland using both
the original FIGD (HIFI-FIGD) and the new Icelandic FIGD (IFL-FIGD). The results
(table 8 and figures 12 and 13) indicate no significant difference (p<.05) between the IFL
and the HIFI FIGDs. Similar results were obtained when the samples from Morag (table
9 and figures 14 and 15) examined.
Table 8. TMA and TVB in unknown sample extracts, prepared by Sofia and Sonia in
EB-Barcelona, using two different FIGD equipments, builds by HIFI in Hull and IFL
in Reykjavik
HIFI-FIGD IFL-FIGD HIFI-FIGD IFL-FIGDSample TMA TMA TVB TVB
mgN/100g s.d.* mgN/100g s.d. mgN/100g s.d. mgN/100g s.d.4 0,54 0,01 0,7 0,01 25,7 1,45 26,3 0,42
12 0,1 0,01 0,15 0,01 12,4 0,048 13,4 0,2227 39,2 0,23 41,25 1,25 152,4 5,56 154,3 2,2433 40,3 1,25 41,3 2,24 99,0 2,85 97,4 2,1245 38,8 1,14 39,9 0,045 111,9 4,25 110,1 3,56
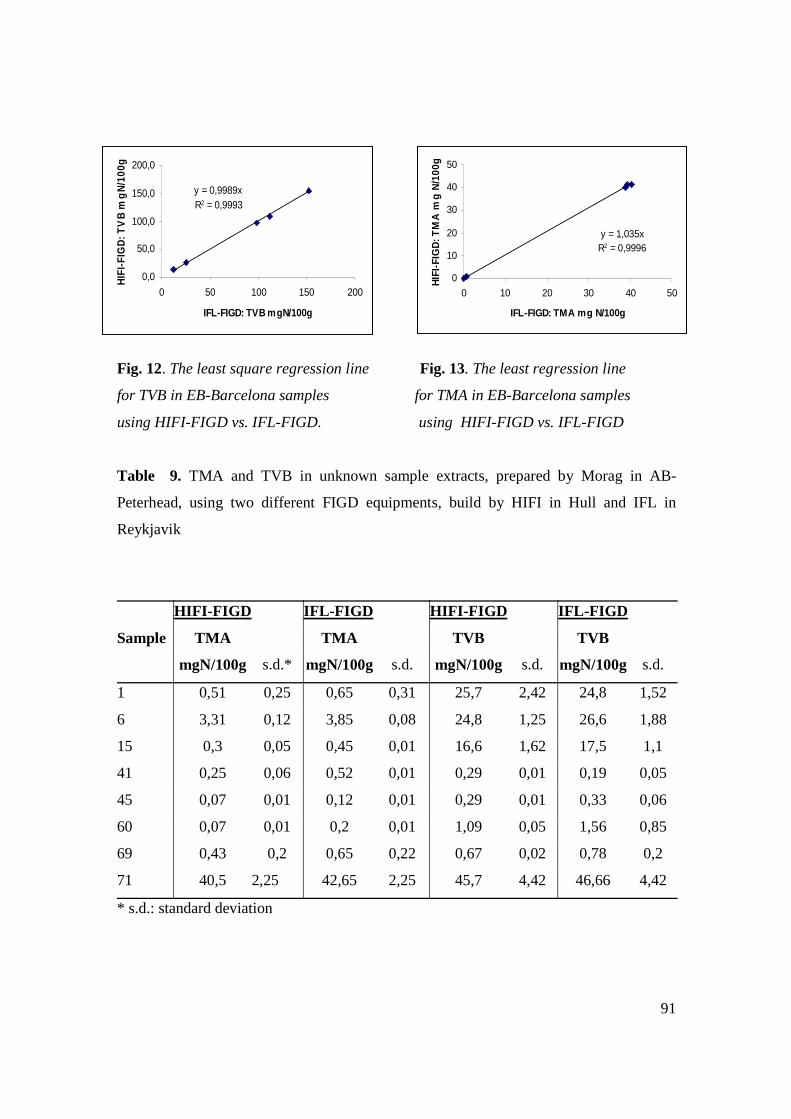
91
Fig. 12. The least square regression line Fig. 13. The least regression line
for TVB in EB-Barcelona samples for TMA in EB-Barcelona samples
using HIFI-FIGD vs. IFL-FIGD. using HIFI-FIGD vs. IFL-FIGD
Table 9. TMA and TVB in unknown sample extracts, prepared by Morag in AB-
Peterhead, using two different FIGD equipments, build by HIFI in Hull and IFL in
Reykjavik
HIFI-FIGD IFL-FIGD HIFI-FIGD IFL-FIGD
Sample TMA TMA TVB TVB
mgN/100g s.d.* mgN/100g s.d. mgN/100g s.d. mgN/100g s.d.
1 0,51 0,25 0,65 0,31 25,7 2,42 24,8 1,52
6 3,31 0,12 3,85 0,08 24,8 1,25 26,6 1,88
15 0,3 0,05 0,45 0,01 16,6 1,62 17,5 1,1
41 0,25 0,06 0,52 0,01 0,29 0,01 0,19 0,05
45 0,07 0,01 0,12 0,01 0,29 0,01 0,33 0,06
60 0,07 0,01 0,2 0,01 1,09 0,05 1,56 0,85
69 0,43 0,2 0,65 0,22 0,67 0,02 0,78 0,2
71 40,5 2,25 42,65 2,25 45,7 4,42 46,66 4,42
* s.d.: standard deviation
y = 0,9989xR2 = 0,9993
0,0
50,0
100,0
150,0
200,0
0 50 100 150 200
IFL-FIGD: TVB mgN/100g
HIF
I-FI
GD
: TV
B m
gN
/100
g
y = 1,035xR2 = 0,9996
0
10
20
30
40
50
0 10 20 30 40 50
IFL-FIGD: TMA mg N/100g
HIF
I-FI
GD
: TM
A m
g N
/100
g
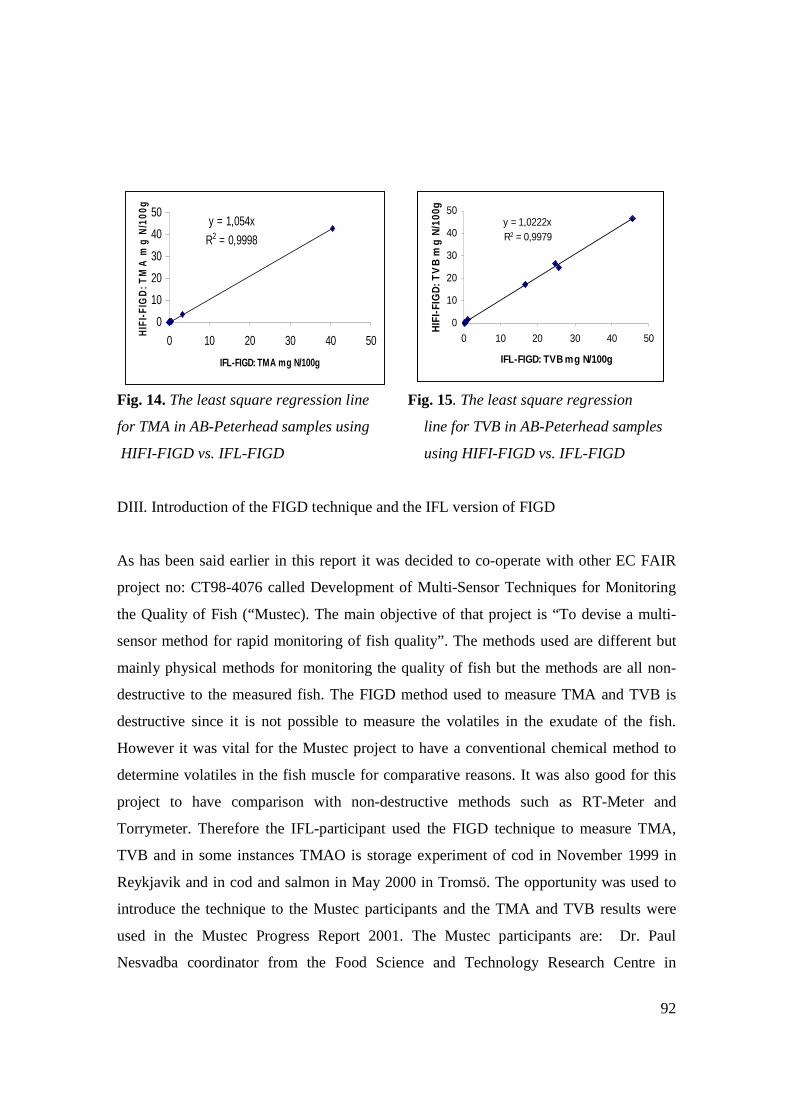
92
Fig. 14. The least square regression line Fig. 15. The least square regression
for TMA in AB-Peterhead samples using line for TVB in AB-Peterhead samples
HIFI-FIGD vs. IFL-FIGD using HIFI-FIGD vs. IFL-FIGD
DIII. Introduction of the FIGD technique and the IFL version of FIGD
As has been said earlier in this report it was decided to co-operate with other EC FAIR
project no: CT98-4076 called Development of Multi-Sensor Techniques for Monitoring
the Quality of Fish (“Mustec). The main objective of that project is “To devise a multi-
sensor method for rapid monitoring of fish quality”. The methods used are different but
mainly physical methods for monitoring the quality of fish but the methods are all non-
destructive to the measured fish. The FIGD method used to measure TMA and TVB is
destructive since it is not possible to measure the volatiles in the exudate of the fish.
However it was vital for the Mustec project to have a conventional chemical method to
determine volatiles in the fish muscle for comparative reasons. It was also good for this
project to have comparison with non-destructive methods such as RT-Meter and
Torrymeter. Therefore the IFL-participant used the FIGD technique to measure TMA,
TVB and in some instances TMAO is storage experiment of cod in November 1999 in
Reykjavik and in cod and salmon in May 2000 in Tromsö. The opportunity was used to
introduce the technique to the Mustec participants and the TMA and TVB results were
used in the Mustec Progress Report 2001. The Mustec participants are: Dr. Paul
Nesvadba coordinator from the Food Science and Technology Research Centre in
y = 1,054x
R2 = 0,9998
0
10
20
30
40
50
0 10 20 30 40 50
IFL-FIGD: TMA mg N/100g
HIF
I-FI
GD
: TM
A m
g N
/100
g
y = 1,0222xR2 = 0,9979
0
10
20
30
40
50
0 10 20 30 40 50
IFL-FIGD: TVB mg N/100g
HIF
I-FI
GD
: TV
B m
g N
/100
g
93
Aberdeen, Mrs Guðrún Ólafsdóttir and Mrs Soffía Vala Tryggvadóttir from Icelandic
Fisheries Laboratories in Reykjavik, Dr. Karsten Heia from Fiskeri forskning in Tromsö,
Dr. Mercedes Careche from CSIC-Instituto del Frio in Madrid, Dr. Jörg Oehenschlager
form Federal Research Centre for Fisheries in Hamburg, Dr. Corrado Di Natale from
University of Rome and Dr. Bo Jörgensen from Danish Institute for Fisheries Research in
Lyngby.
Fiskeri Forskning in Tromsö Norway was especially interested in the FIGD technique
and wanted to try to use it in their lab. I sent Björn Gundersen from FF a FIGD detector
and injection valve and they are now trying for TMA/TVB determinations for fish
storage experiments.
Here in Iceland the new IFL-version of FIGD (fugure 11) has been introduced to other
IFL-branches, in Akureyri and Neskaupsstaður and to members of the larges fish
processing plants in Iceland, Útgerðarfélag Akureyrar (ÚA) and Síldarvinnslan in
Neskaupsstað (SVN). The members of ÚA and SVN were interested for technique and
admitted the it was faster and easier to use than other methods that they were familiar to,
such as Dyer method and the WEFTA steam distillation method of fish extracts. However
the problem of spoiled or decomposed fish is not a major problem today because the
boats (trawlers) do not stay out on sea for more than a week compared to 14 to 20 days as
was common 10-15 years ago. As has been shown in this project and many more, TMA
and TVB values will not increase significantly in most sea foods until after 8-10 days of
iced storage, when the signs of spoilage become more obvious. Determination of TMA
and TVB, either by the FIGD technique or the conventional techniques, gives therefore
little information about the freshness of the fish or prediction about remaining storage life
of fish processed in Iceland, where the owner of the boat and the processing plant is the
same. The fish markets in Iceland is different because the buyer often does not know the
post-mortem age of the fish and how well it was iced and treated onboard the boat.
However it is well known that when there is a great demand for fish, the emphasis on fish
freshness and quality becomes less important.
94
The limitation of the FIGD technique is still too time consuming and requires some skills
to operate, even though the IFL-FIGD is much easier to use and transfer more users-
friendly. It is therefore unlikely that the Icelandic fish markets would be interested to use
this technique as a routine check of the freshness of spoilage state of the fish. They would
probably use FIGD once in a while when there is a disagreement between seller and
buyer judged by sensory analysis of the fish. The use of faster equipment to determine
freshness where the correlation between freshness values and post-mortem age of the fish
is better as well, such as RT-Meter, Torrymeter and Fish-Tester, would be preferred over
FIGD.
The application of FIGD is however very beneficial in a laboratory such as IFL where the
technique can replace more time- chemical and energy consuming techniques such as
steam distillation and Dyer method where toluene and picric acid are used. The FIGD has
already almost replaced other techniques to determine TMA and TVB at IFL in
Reykjavik and it has been taken into the account that the TVB values from FIGD are 60%
lower than TVB values from steam distillation as was explained in previous reports. The
IFL-FIGD could also be useful for fish processing chains where the use of one easy-to-
carry FIGD would be enough instead of having one in every plant.
95
4. FINALIZATION OF TASKS
The IFL initial tasks for the final period’s progress report of this project are described as
tasks 2 and 3 in the proposal.
The aim of task 2 was adaptation of the sampling procedure to make the FIGD
methodology more suitable for commercial, on-line operation as a freshness monitoring
procedure. This included to investigate the adaptation of the sample extract preparation
methodology for a more convenient “on-line” usage methodology where the goal was to
yield about 0,5 ml exudate which would be sufficient for P-ratio determination by the
FIGD method. The results obtained by this method would be compared and validated
against the conventional extract (TCA or PCA) on a whole fish fillet.
It was not possible to finalize all the original tasks that were set in the proposal.
Therefore it was decided at the second plenary meeting in Athens and at the mid-term
progress review meeting in Reykjavik to reorganize the tasks for the final year of the
project.
According to the proposal, task 1 and its subtasks were generally fulfilled even though
the P-ratio was not as good indicator of spoilage as was expected it would be in the
proposal (sub-task 1 vii and viii).
Different methodologies to obtain an exudate form fish sample sufficient to measure both
TMA and TVB were tested. About 100 g of fish tissues was vacuum packed under
different pressure setting in order to squeeze out enough water/liquid of the fish to
measure that could be measured. It was not possible to get a clear liquid, which is
essential for injection into the FIGD. In spite of the milky exudate, due to small peptides
and other small insoluble particles, the exudate was injected into the FIGD injection
valve but it caused clogging problems in the tubings and very random results for the same
sample. Therefore it was agreed at the Reykjavik meeting to use TCA extract instead of
exudate for further work.
96
According to task 3 of the proposal an “on-line” factory trials would be performed using
FIGD methodology to determine TMA and TVB in the fish flesh through handling,
processing, storage, distribution and retail display. The aim was to assess its
appropriateness as an objective test of fish freshness for routine industrial monitoring
schemes. Instead of performing these experiments inside a fish processing plant it was
decided that the IFL participant would take part in an other EC project called “Mustec”
FAIR CT98-4076, where the aim was to use non-destructive methods to determine
freshness of fish. It was very beneficial for both projects to cooperate in such a way. The
two experiments, in Reykjavik and Tromsö, are described in the result chapter and a very
useful comparison was done on different equipments and methods to determine
freshness/spoilage in fresh and thawed cod and salmon.
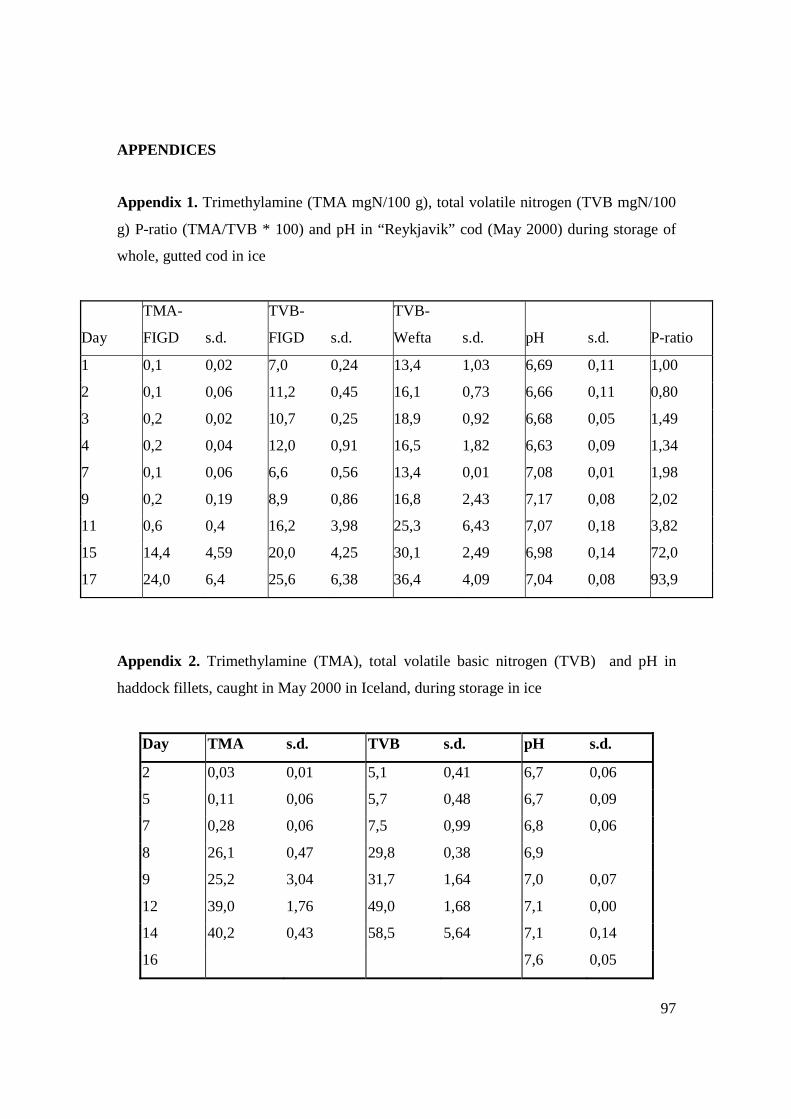
97
APPENDICES
Appendix 1. Trimethylamine (TMA mgN/100 g), total volatile nitrogen (TVB mgN/100
g) P-ratio (TMA/TVB * 100) and pH in “Reykjavik” cod (May 2000) during storage of
whole, gutted cod in ice
Day
TMA-
FIGD s.d.
TVB-
FIGD s.d.
TVB-
Wefta s.d. pH s.d. P-ratio
1 0,1 0,02 7,0 0,24 13,4 1,03 6,69 0,11 1,00
2 0,1 0,06 11,2 0,45 16,1 0,73 6,66 0,11 0,80
3 0,2 0,02 10,7 0,25 18,9 0,92 6,68 0,05 1,49
4 0,2 0,04 12,0 0,91 16,5 1,82 6,63 0,09 1,34
7 0,1 0,06 6,6 0,56 13,4 0,01 7,08 0,01 1,98
9 0,2 0,19 8,9 0,86 16,8 2,43 7,17 0,08 2,02
11 0,6 0,4 16,2 3,98 25,3 6,43 7,07 0,18 3,82
15 14,4 4,59 20,0 4,25 30,1 2,49 6,98 0,14 72,0
17 24,0 6,4 25,6 6,38 36,4 4,09 7,04 0,08 93,9
Appendix 2. Trimethylamine (TMA), total volatile basic nitrogen (TVB) and pH in
haddock fillets, caught in May 2000 in Iceland, during storage in ice
Day TMA s.d. TVB s.d. pH s.d.
2 0,03 0,01 5,1 0,41 6,7 0,06
5 0,11 0,06 5,7 0,48 6,7 0,09
7 0,28 0,06 7,5 0,99 6,8 0,06
8 26,1 0,47 29,8 0,38 6,9
9 25,2 3,04 31,7 1,64 7,0 0,07
12 39,0 1,76 49,0 1,68 7,1 0,00
14 40,2 0,43 58,5 5,64 7,1 0,14
16 7,6 0,05
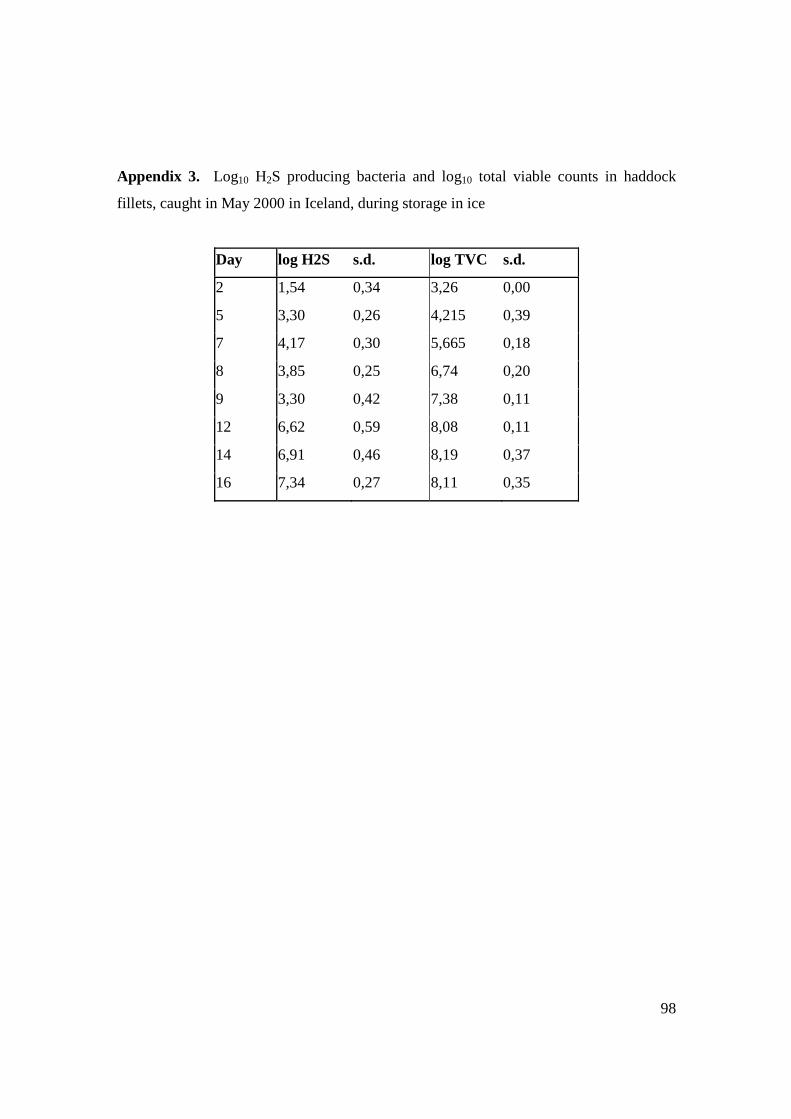
98
Appendix 3. Log10 H2S producing bacteria and log10 total viable counts in haddock
fillets, caught in May 2000 in Iceland, during storage in ice
Day log H2S s.d. log TVC s.d.
2 1,54 0,34 3,26 0,00
5 3,30 0,26 4,215 0,39
7 4,17 0,30 5,665 0,18
8 3,85 0,25 6,74 0,20
9 3,30 0,42 7,38 0,11
12 6,62 0,59 8,08 0,11
14 6,91 0,46 8,19 0,37
16 7,34 0,27 8,11 0,35
99
REFERENCE
Anonymous. (1995). Decision of the European Commission to fix TVB-N limits for certain categories of fishery products. 95/149/EEC. Antonacopoulos, N. & Vyncke, W. (1989). Determination of volatile basic nitrogen in fish: a third collaborative study by the West European Fish Technologists Association (WEFTA). A WEFTA original paper Beatty, S.A. & Gibbons, N.E. (1936). The measurement of spoilage in fish. Journal of the Fisheries Research Board of Canada. 3, 77-91. Botta, J.R. (1995). Evaluation of Seafood Freshness Quality. Pp. 9-30., New York: VCH Publishers, Inc,. Clinch, J.R. (1988). PhD Thesis, University of Hull. Connell, J.J. (1995). Control of Fish Quality, 4 ed. Pp: 152-160. London: Fishing News Books Ltd., Dyer W.J., Dyer, F.E & Snow, M. (1945). Amines in fish muscle. I. Colorimetric determination of trimethylamine as the picrate salt. Journal of Fisheries Research Board of Canada, 6, 351-358. Gill, T.A. & Thompson J. (1984). Rapid automated analysis of amines in seafood by ion moderated partition HPLC. Journal of Food Science, 49, 603-606. Gram, L., Trolle, G. & Huss, H.H. (1987). Detection of specific spoilage bacteria from fish stored at low (0°C) and high (20°C) temperatures. International Journal of Food Microbiology, 4, 65-72. Hoogland, P.L. (1958). Grading fish for quality. 2. Statistical analysis of the results of experiments regarding grades and trimetylamine values. Journal of the Fisheries Research Board of Canada, 15, 717-728. Oehlenschläger, J. (1997). Suitability of ammonia-N, dimethylamine-N, trimethylamine-N, trimethylamine oxide-N and total volatile basic nitrogen as freshness indicators in seafoods. In: Methods to determine the freshness of fish. In research and industry (edited by G. Olafsdottir et al.). Pp. 92-99. Nantes conference, November 12-14. Paris: International Institute of Refrigeration. Ruzicka, J. and Hansen, E.H. (1981). Flow Injection Analysis. New York: Wiley. Sadok, S., Uglow, R. & Haswell, S.J. (1996). Determination of trimethylamine in fish by flow injection analysis. Analytical Chimica Acta, 321, 69-74. Torry Advisory Note no. 91. (1989). Sensory assessment of fish quality. Aberdeen: Torry Research Station.
100
Tozawa, H., Enokihara K & Amano K. (1971). Proposed modification of Dyer's method for trim ethylamine determination in cod fish. In: Fish Inspection and Quality Control (edited by R. Kreuzer). Pp. 187-190. London: Fishing News Books Ltd. Vyncke, W., Luten, J., Brunner, K. and Moermans, R. (1987). Determination of total volatile bases in fish: a collaborative study by the West European Fish Technologists´ association (WEFTA). Zeitschrift fur Lebensmittel Untersuchung Forschung, 184: 110-114.