Embed Size (px)
Citation preview
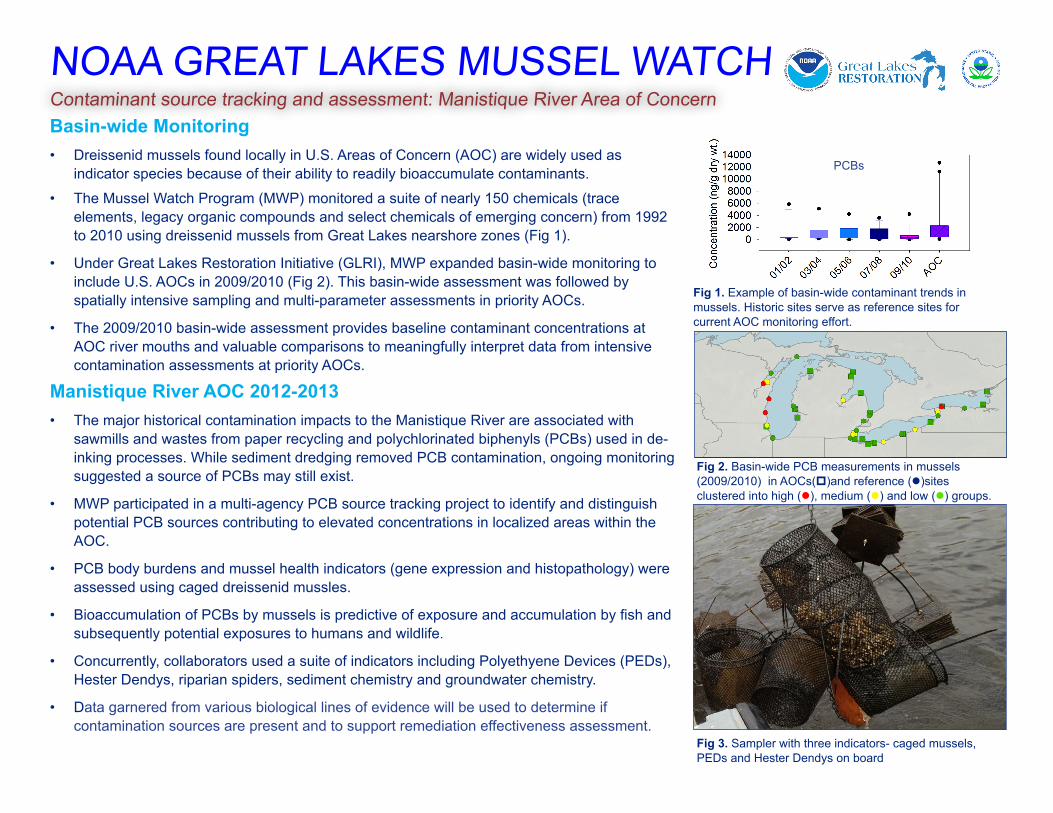
NOAA GREAT LAKES MUSSEL WATCH Contaminant source tracking and assessment: Manistique River Area of Concern
Manistique River AOC 2012-2013• The major historical contamination impacts to the Manistique River are associated with
sawmills and wastes from paper recycling and polychlorinated biphenyls (PCBs) used in de-inking processes. While sediment dredging removed PCB contamination, ongoing monitoring suggested a source of PCBs may still exist.
• MWP participated in a multi-agency PCB source tracking project to identify and distinguish potential PCB sources contributing to elevated concentrations in localized areas within the AOC.
• PCB body burdens and mussel health indicators (gene expression and histopathology) were assessed using caged dreissenid mussles.
• Bioaccumulation of PCBs by mussels is predictive of exposure and accumulation by fish and subsequently potential exposures to humans and wildlife.
• Concurrently, collaborators used a suite of indicators including Polyethyene Devices (PEDs), Hester Dendys, riparian spiders, sediment chemistry and groundwater chemistry.
• Data garnered from various biological lines of evidence will be used to determine if contamination sources are present and to support remediation effectiveness assessment.
Basin-wide Monitoring• Dreissenid mussels found locally in U.S. Areas of Concern (AOC) are widely used as
indicator species because of their ability to readily bioaccumulate contaminants.
• The Mussel Watch Program (MWP) monitored a suite of nearly 150 chemicals (trace elements, legacy organic compounds and select chemicals of emerging concern) from 1992 to 2010 using dreissenid mussels from Great Lakes nearshore zones (Fig 1).
• Under Great Lakes Restoration Initiative (GLRI), MWP expanded basin-wide monitoring to include U.S. AOCs in 2009/2010 (Fig 2). This basin-wide assessment was followed by spatially intensive sampling and multi-parameter assessments in priority AOCs.
• The 2009/2010 basin-wide assessment provides baseline contaminant concentrations at AOC river mouths and valuable comparisons to meaningfully interpret data from intensive contamination assessments at priority AOCs.
Fig 1. Example of basin-wide contaminant trends in mussels. Historic sites serve as reference sites for current AOC monitoring effort.
Fig 2. Basin-wide PCB measurements in mussels (2009/2010) in AOCs(p)and reference (l)sites clustered into high (l), medium (l) and low (l) groups.
Fig 3. Sampler with three indicators- caged mussels, PEDs and Hester Dendys on board
PCBs
2013 Manistique Sites
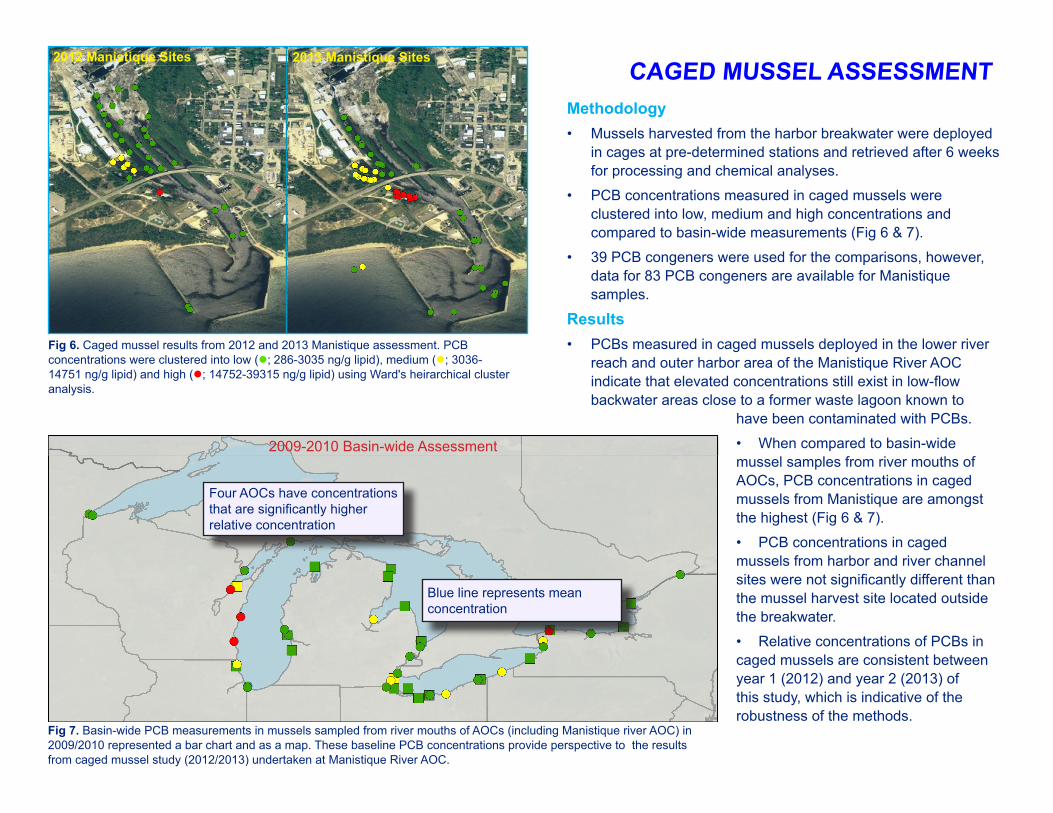
Methodology• Mussels harvested from the harbor breakwater were deployed
in cages at pre-determined stations and retrieved after 6 weeks for processing and chemical analyses.
• PCB concentrations measured in caged mussels were clustered into low, medium and high concentrations and compared to basin-wide measurements (Fig 6 & 7).
• 39 PCB congeners were used for the comparisons, however, data for 83 PCB congeners are available for Manistique samples.
Results• PCBs measured in caged mussels deployed in the lower river
reach and outer harbor area of the Manistique River AOC indicate that elevated concentrations still exist in low-flow backwater areas close to a former waste lagoon known to
have been contaminated with PCBs.
• When compared to basin-wide mussel samples from river mouths of AOCs, PCB concentrations in caged mussels from Manistique are amongst the highest (Fig 6 & 7).
• PCB concentrations in caged mussels from harbor and river channel sites were not significantly different than the mussel harvest site located outside the breakwater.
• Relative concentrations of PCBs in caged mussels are consistent between year 1 (2012) and year 2 (2013) of this study, which is indicative of the robustness of the methods.
2012 Manistique Sites
Fig 6. Caged mussel results from 2012 and 2013 Manistique assessment. PCB concentrations were clustered into low (l; 286-3035 ng/g lipid), medium (l; 3036-14751 ng/g lipid) and high (l; 14752-39315 ng/g lipid) using Ward's heirarchical cluster analysis.
St. Clai
r Rive
r
Minnes
ota Poin
t
St. Law
rence
Rive
r
Menom
inee R
iver
Osweg
o Rive
r
Whit
e Lak
e
Roche
ster
Muske
gon L
ake
St. Lou
is Rive
r
Calumet
Breakw
ater
Hammon
d Mari
na
Ashtab
ula R
iver
Black R
iver
Detroit
Rive
r
Buffalo
Rive
r
Manist
ique R
iver
Clinton
Rive
r
Maumee
Rive
r
Sagina
w Rive
r
Cuyah
oga R
iver
Wau
kega
n Harb
or
Presqu
e Isle
Bay
River R
aisin
Niagara
Rive
r
Milwau
kee B
ay
Green B
ay Fox
Rive
r
Shebo
ygan
Rive
r
Eightee
nmile
Cree
k
Con
cent
ratio
n ng
/g li
pid
0
5000
10000
15000
20000
25000
Fig 7. Basin-wide PCB measurements in mussels sampled from river mouths of AOCs (including Manistique river AOC) in 2009/2010 represented a bar chart and as a map. These baseline PCB concentrations provide perspective to the results from caged mussel study (2012/2013) undertaken at Manistique River AOC.
2009-2010 Basin-wide Assessment
Four AOCs have concentrations that are significantly higher relative concentration
Blue line represents mean concentration
CAGED MUSSEL ASSESSMENT
020406080
100120
Site 2 Site 3 Site 4
Fold
Cha
nge
00.5
11.5
22.5
3
Site 2 Site 3 Site 4
Fold
Cha
nge
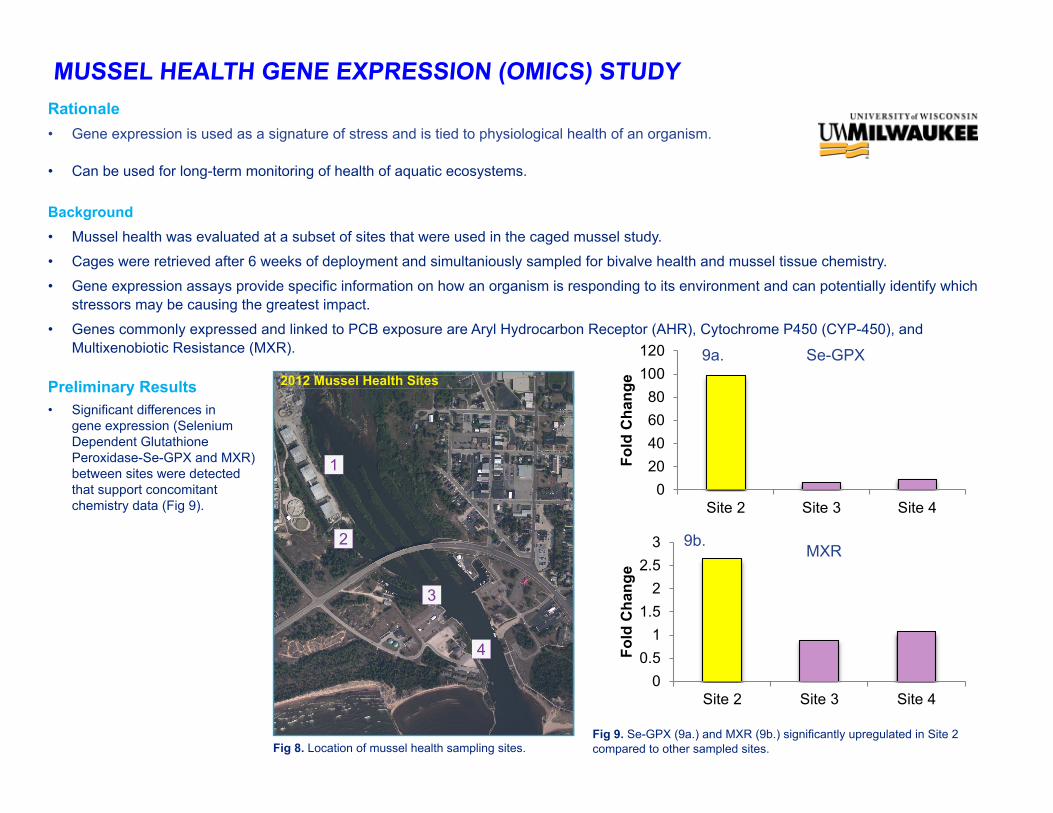
MUSSEL HEALTH GENE EXPRESSION (OMICS) STUDYRationale• Gene expression is used as a signature of stress and is tied to physiological health of an organism.
• Can be used for long-term monitoring of health of aquatic ecosystems.
Background• Mussel health was evaluated at a subset of sites that were used in the caged mussel study.
• Cages were retrieved after 6 weeks of deployment and simultaniously sampled for bivalve health and mussel tissue chemistry.
• Gene expression assays provide specific information on how an organism is responding to its environment and can potentially identify which stressors may be causing the greatest impact.
• Genes commonly expressed and linked to PCB exposure are Aryl Hydrocarbon Receptor (AHR), Cytochrome P450 (CYP-450), and Multixenobiotic Resistance (MXR).
Fig 8. Location of mussel health sampling sites.
2012 Mussel Health Sites
1
2
3
4
Fig 9. Se-GPX (9a.) and MXR (9b.) significantly upregulated in Site 2 compared to other sampled sites.
Se-GPX
MXR
9a.
9b.
Preliminary Results• Significant differences in
gene expression (Selenium Dependent Glutathione Peroxidase-Se-GPX and MXR) between sites were detected that support concomitant chemistry data (Fig 9).
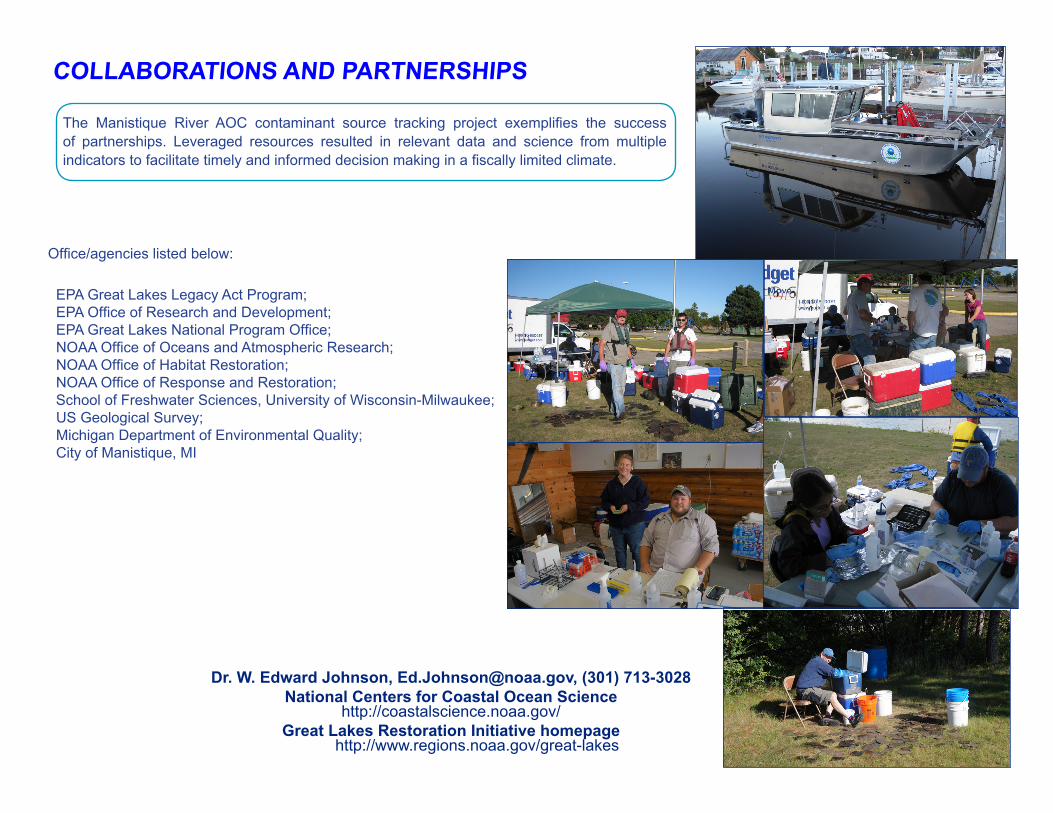
Office/agencies listed below:
EPA Great Lakes Legacy Act Program; EPA Office of Research and Development; EPA Great Lakes National Program Office; NOAA Office of Oceans and Atmospheric Research; NOAA Office of Habitat Restoration; NOAA Office of Response and Restoration; School of Freshwater Sciences, University of Wisconsin-Milwaukee; US Geological Survey; Michigan Department of Environmental Quality; City of Manistique, MI
COLLABORATIONS AND PARTNERSHIPS
Dr. W. Edward Johnson, [email protected], (301) 713-3028National Centers for Coastal Ocean Science
http://coastalscience.noaa.gov/ Great Lakes Restoration Initiative homepage
http://www.regions.noaa.gov/great-lakes
The Manistique River AOC contaminant source tracking project exemplifies the success of partnerships. Leveraged resources resulted in relevant data and science from multiple indicators to facilitate timely and informed decision making in a fiscally limited climate.


![Cold Water and High Ice Cover on Great Lakes in Spring 2014 · tion (NOAA) CoastWatch Program [Leshkevich et al., 1996], and the NOAA Great Lakes Ice Atlas [Assel, 2003; Wang et al.,](https://img.pdfslide.net/doc/110x75/5f4528fa73c78d62b34683db/cold-water-and-high-ice-cover-on-great-lakes-in-spring-2014-tion-noaa-coastwatch.jpg)