Embed Size (px)
Citation preview

NOAA TECHNICAL REPORT NESDIS 82
OFFICE OF SYSTEMS DEVELOPMENT GROUND SYSTEMS DIVISIONWASHINGTON, D.C.
October 1994
AN INTRODUCTION TO THE GOES I-M IMAGER AND SOUNDERINSTRUMENTS AND THE GVAR RETRANSMISSION FORMAT
PREPARED BYRAYMOND J. KOMAJDA
THE MITRE CORPORATION
EDITED BYKEITH MCKENZIE
OFFICE OF SYSTEMS DEVELOPMENT
U.S. DEPARTMENT OF COMMERCENATIONAL OCEANIC AND ATMOSPHERIC ADMINISTRATION
NATIONAL ENVIRONMENTAL SATELLITE, DATA, AND INFORMATION SERVICE
PREFACE
This document is an update of NOAA Technical Report NESDIS 33, published in October, 1987. It is addressed to experienced direct readout users of the GOES Mode AAA processed instrumentdata. Readers wanting a greater familiarity with Mode AAA are referred to the following documents:
GOES GH Data Book, Hughes Aircraft Company, March 1986
Operational VAS Mode AAA Format, Specification, NOAA/NESDIS Office of Systems Development, February 1987, SFP002
The purpose of this document is to acquaint these users with the characteristics of the processedinstrument data that are available from the new series of GOES satellites, GOES I-M. This documentincludes a comparison of the GOES D-H VAS instrument with the instruments on the GOES I-Mseries of satellites and a definition of the processed instrument data format for GOES I-M. It is theintent of this document to provide direct readout (Mode AAA) users with sufficient backgroundinformation for them to phaseover to GOES I-M.
The topic of this report is the GVAR processed data as it will be retransmitted to direct readoutusers. Information on the spacecraft, the imaging and sounding instruments, and the ground system ispresented only to provide sufficient background and context for an understanding of the GVAR format. GVAR contains Imager and Sounder data. The otheron-board instruments and their data and the special purpose transponders are not addressed in thisreport.
GOES I was launched April 13, 1994; redesignated GOES-8 upon attaining geostationary orbit, itis undergoing checkout through October, 1994. The remaining spacecraft in the GOES I-M series arein various stages of assembly. GOES-J is scheduled for launch in 1995; its instruments are in test at thistime.
The defining document for the GVAR format is Section 3 of Space Systems/Loral OperationsGround Equipment (OGE) Interface Specification DRL 504-02-1, Contract NAS5-29500. The mostrecent version available at the time of publication is Revision C dated 01/28/94. Much of the materialcontained herein is compiled directly from documents delivered to theGovernment under contract by Ford Aerospace and Communications Corporation, SpaceSystems/Loral, and their subcontractors.

TABLE OF CONTENTSTABLE OF CONTENTS
1.0 INTRODUCTION. . . . . . . . . . . . . . . . . . . . . 11.0 INTRODUCTION. . . . . . . . . . . . . . . . . . . . . 1 1.1 GOES Program . . . . . . . . . . . . . . . . . . 1 1.1 GOES Program . . . . . . . . . . . . . . . . . . 1 1.2 GOES I-M Spacecraft System . . . . . . . . . . . 2 1.2 GOES I-M Spacecraft System . . . . . . . . . . . 2 1.3 GOES I-M Ground System . . . . . . . . . . . . . 4 1.3 GOES I-M Ground System . . . . . . . . . . . . . 4
2.0 THE IMAGER AND THE SOUNDER. . . . . . . . . . . . . . 82.0 THE IMAGER AND THE SOUNDER. . . . . . . . . . . . . . 8 2.1 Instrument Description . . . . . . . . . . . . . 8 2.1 Instrument Description . . . . . . . . . . . . . 8 2.2 Key Features . . . . . . . . . . . . . . . . . .11 2.2 Key Features . . . . . . . . . . . . . . . . . .11 2.3 Instrument Operational Modes . . . . . . . . . .19 2.3 Instrument Operational Modes . . . . . . . . . .19
3.0 GVAR. . . . . . . . . . . . . . . . . . . . . . . . .203.0 GVAR. . . . . . . . . . . . . . . . . . . . . . . . .20 3.1 Scan Format. . . . . . . . . . . . . . . . . . .20 3.1 Scan Format. . . . . . . . . . . . . . . . . . .20 3.2 Imager Data--Blocks 0-10 . . . . . . . . . . . .22 3.2 Imager Data--Blocks 0-10 . . . . . . . . . . . .22 3.4 Bandwidth Considerations and 3.4 Bandwidth Considerations and Sector Scanning Limits . . . . . . . . . . . . .27 Sector Scanning Limits . . . . . . . . . . . . .27 3.5 Transmission Delays and Preprocessing 3.5 Transmission Delays and Preprocessing Delays of GVAR Blocks. . . . . . . . . . . . . .29 Delays of GVAR Blocks. . . . . . . . . . . . . .29 3.6 Encoding . . . . . . . . . . . . . . . . . . . .30 3.6 Encoding . . . . . . . . . . . . . . . . . . . .30 3.7 Receiver Considerations. . . . . . . . . . . . .30 3.7 Receiver Considerations. . . . . . . . . . . . .30 3.8 Earth Location . . . . . . . . . . . . . . . . .31 3.8 Earth Location . . . . . . . . . . . . . . . . .31 3.9 Calibration. . . . . . . . . . . . . . . . . . .31 3.9 Calibration. . . . . . . . . . . . . . . . . . .31
4.0 OPERATIONAL SCHEDULES . . . . . . . . . . . . . . . .344.0 OPERATIONAL SCHEDULES . . . . . . . . . . . . . . . .34
REFERENCES . . . . . . . . . . . . . . . . . . . . . . . .41REFERENCES . . . . . . . . . . . . . . . . . . . . . . . .41
GLOSSARY . . . . . . . . . . . . . . . . . . . . . . . . .42GLOSSARY . . . . . . . . . . . . . . . . . . . . . . . . .42
APPENDIX A APPENDIX A OPERATIONAL IN-ORBIT CALIBRATION. . . . . . . . . . . . .44OPERATIONAL IN-ORBIT CALIBRATION. . . . . . . . . . . . .44
LIST OF FIGURES LIST OF FIGURES Figure 1-1 GOES I-M Spacecraft. . . . . . . . . . . . . . 4Figure 1-1 GOES I-M Spacecraft. . . . . . . . . . . . . . 4Figure 1-2 GOES I-M Ground System . . . . . . . . . . . . 7Figure 1-2 GOES I-M Ground System . . . . . . . . . . . . 7Figure 2-1 GOES I-M Instrument Assemblies . . . . . . . . 8Figure 2-1 GOES I-M Instrument Assemblies . . . . . . . . 8Figure 2-2 Sounder Filter Wheel . . . . . . . . . . . . . 9Figure 2-2 Sounder Filter Wheel . . . . . . . . . . . . . 9Figure 2-3 Scan Operation . . . . . . . . . . . . . . . .10Figure 2-3 Scan Operation . . . . . . . . . . . . . . . .10Figure 2-4 Imager Scan Frame. . . . . . . . . . . . . . .17Figure 2-4 Imager Scan Frame. . . . . . . . . . . . . . .17Figure 2-5 Sounder Scan Frame . . . . . . . . . . . . . .18Figure 2-5 Sounder Scan Frame . . . . . . . . . . . . . .18Figure 3-1 GVAR Format. . . . . . . . . . . . . . . . . .22Figure 3-1 GVAR Format. . . . . . . . . . . . . . . . . .22Figure 3-2 Imager Detector Configuration. . . . . . . . .24Figure 3-2 Imager Detector Configuration. . . . . . . . .24Figure 3-3 Imager Scan Lines. . . . . . . . . . . . . . .25Figure 3-3 Imager Scan Lines. . . . . . . . . . . . . . .25Figure 4-1 Routine Mode Schedule. . . . . . . . . . . . .37Figure 4-1 Routine Mode Schedule. . . . . . . . . . . . .37
Figure 4-2 Rapid Scan Mode Schedule . . . . . . . . . . .38Figure 4-2 Rapid Scan Mode Schedule . . . . . . . . . . .38Figure 4-3 Full Disk Mode Schedule. . . . . . . . . . . .38Figure 4-3 Full Disk Mode Schedule. . . . . . . . . . . .38
LIST OF TABLES LIST OF TABLES Table 1-1 GOES Comparison . . . . . . . . . . . . . . . . 5Table 1-1 GOES Comparison . . . . . . . . . . . . . . . . 5Table 2-1 Imager Features . . . . . . . . . . . . . . . .13Table 2-1 Imager Features . . . . . . . . . . . . . . . .13Table 2-2 Sounder Features. . . . . . . . . . . . . . . .14Table 2-2 Sounder Features. . . . . . . . . . . . . . . .14Table 2-3 Imager Performance. . . . . . . . . . . . . . .15Table 2-3 Imager Performance. . . . . . . . . . . . . . .15Table 2-4 Sounder Spectral and Sensitivity Performance. .16Table 2-4 Sounder Spectral and Sensitivity Performance. .16Table 3-1 GVAR Format--Information Field. . . . . . . . .21Table 3-1 GVAR Format--Information Field. . . . . . . . .21Table 3-2 Block Sequencing Priority . . . . . . . . . . .26Table 3-2 Block Sequencing Priority . . . . . . . . . . .26Table 4-1 Day-1 Sectors . . . . . . . . . . . . . . . . .35Table 4-1 Day-1 Sectors . . . . . . . . . . . . . . . . .35Table 4-2 GVAR Data Volume for Day-1 Sectors. . . . . . .37Table 4-2 GVAR Data Volume for Day-1 Sectors. . . . . . .37Table 4-3 Imager Priority Frame Flags . . . . . . . . . .39Table 4-3 Imager Priority Frame Flags . . . . . . . . . .39Table 4-4 Sounder Priority Scan Flags . . . . . . . . . .40Table 4-4 Sounder Priority Scan Flags . . . . . . . . . .40

Page 1
1.0 INTRODUCTION
The National Oceanic and Atmospheric Administration (NOAA) operates a GeostationaryOperational Environmental Satellite (GOES) system with multiple satellites to provide continuousmonitoring of the earth's environment. The National Aeronautics and Space Administration (NASA) isresponsible for procuring and launching new satellites for NOAA and the other civilian agencies. TheNASA Goddard Space Flight Center (GSFC) and NOAA have been given responsibility for procuringthe necessary space-segment hardware and support services to meet the mission requirements. In1985, NASA contracted with the Ford Aerospace and Communications Corporation (FACC),Western Development Laboratories, Palo Alto, California, for five GOES spacecraft (I, J, K, L, andM), collectively known as GOES I-M. The GOES Variable (GVAR) format is the retransmissionformat for processed instrument data from these spacecraft.
The primary mission of the GOES program is the continuous and reliable collection of environmentaldata in support of weather forecasting and related services. Spacecraft and ground based systemswork together to accomplish this mission.
1.1 GOES Program
Since 1974, geostationary satellites have been used to collect and disseminate environmental data. GOES sensors provide two-dimensional cloud and temperature imagery in both visible and infraredspectra, radiometric data providing the capability to determine the three-dimensional structure ofatmospheric temperature and water vapor distribution, and solar and near space environmental data. Inaddition to broadcasting GVAR, transponders on the GOES spacecraft also support the DataCollection System (DCS), Search and Rescue, and Weather Facsimile (WEFAX); the DCS relaysdata from thousands of environmental sensing platforms distributed throughout the western hemisphere. Specific applications of the meteorological data include severe storm detection, monitoring, andtracking; wind measurements from cloud motion; sea surface thermal features; precipitation estimates;frost monitoring; rescue operations; and research.
1.2 GOES I-M Spacecraft System
The GOES spacecraft configuration is based on FACC's Indian Satellite (INSAT) design. Itssix-sided main body carries the Imager, the Sounder, and Space Environment Monitor (SEM)instruments. A continuous-drive solar array is attached to the south panel through a yoke assembly,and a solar sail is mounted off the north panel to offset solar pressure torque. See Figure 1-1.
There are significant differences between the GOES I-M series of spacecraft and the predecessorGOES D-H series that impact the requirements for the ground system. The GOES D-H satellites werebuilt by the Hughes Aircraft Company using a passive spin-stabilized attitude control system. TheGOES I-M satellites use a three-axis attitude control system, implying thatthe three axes of the satellite

Page 2
will remain stationary relative to their pointing axis. These satellites use internal momentum wheels toprovide attitude control. The satellites require corrective action from the ground to compensate for theeffects of thermal gradients, solar winds, and radiance gradients. The mirror in each instrument movesin two dimensions. Unlike the GOES D-H series, GOES I-M series satellites have separate Imagerand Sounder instruments that operate independently and simultaneously.
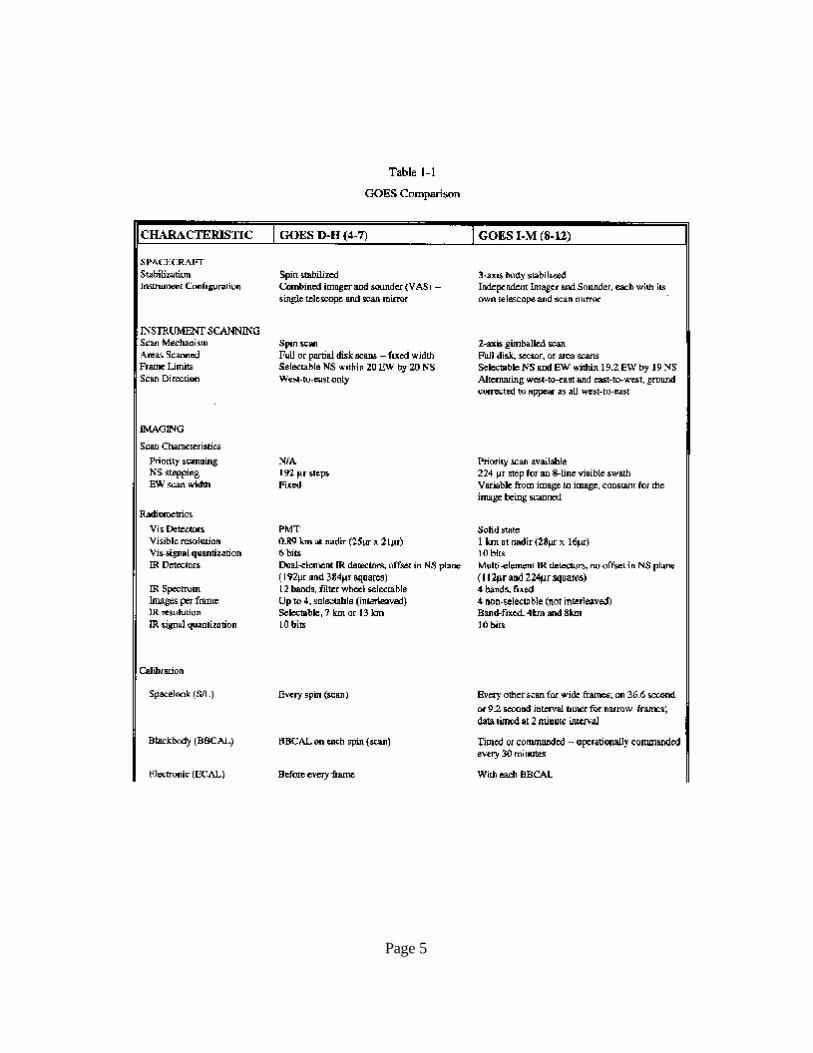
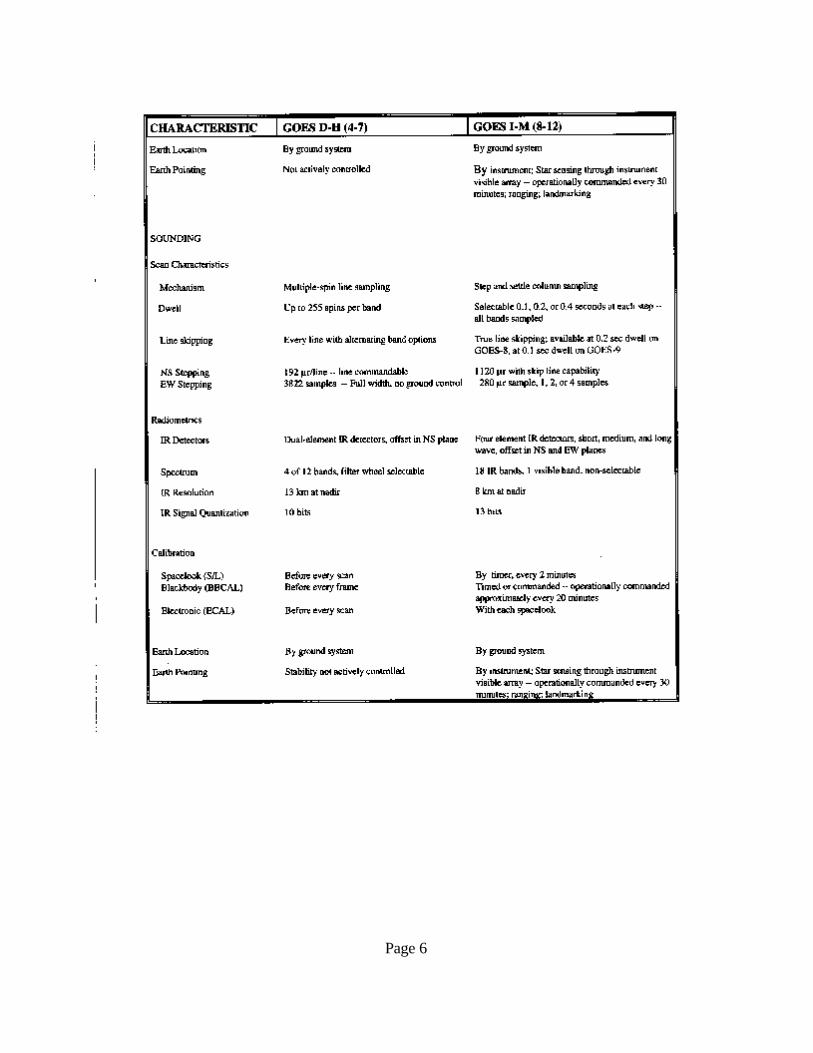
These differences necessitate major changes in the product processing systems. The navigationaccuracy (the ability to point to a specific latitude and longitude on the earth's surface) and registrationaccuracy (the ability to point to the same point on earth on successive images) are fundamental to thevalue of GOES I-M meteorological data. Table 1-1 compares the majorcharacteristics of the present series GOES D-H satellites with the GOES I-M series.
1.3 GOES I-M Ground System
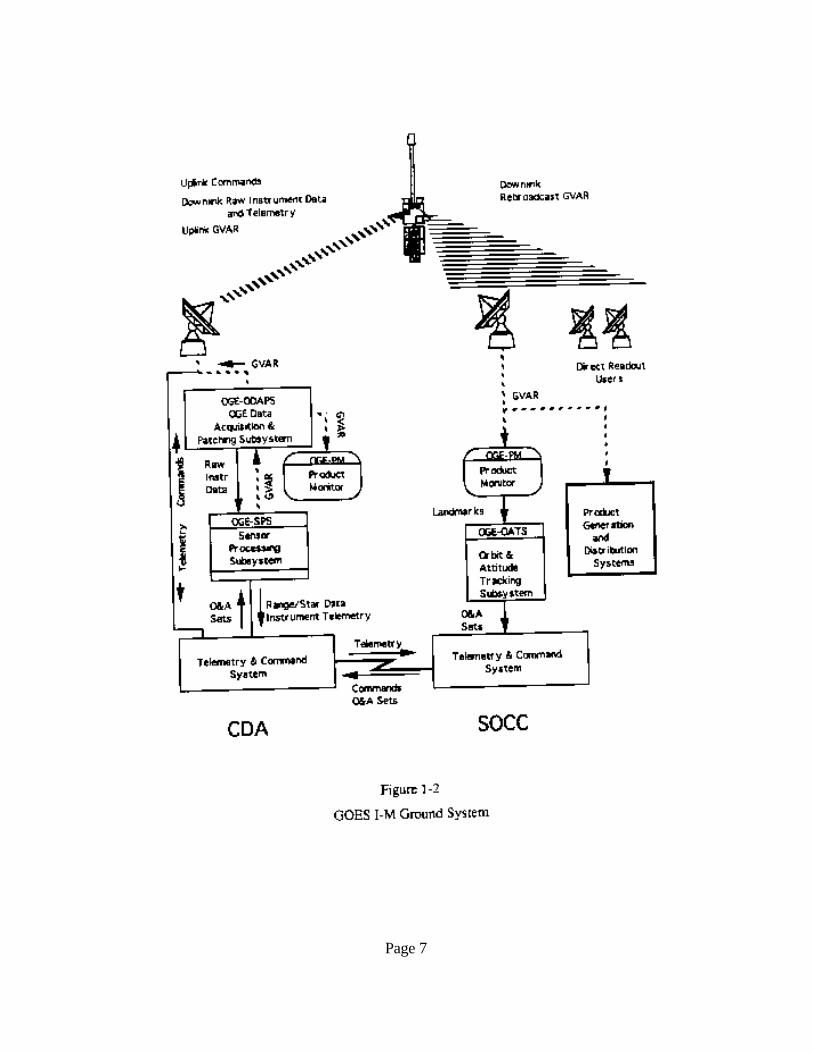
As with the predecessor GOES System, the GOES I-M Ground System is physically dividedbetween two locations, the Satellite Operations Control Center (SOCC) at Suitland, Maryland, and theCommand and Data Acquisition (CDA) station at Wallops, Virginia (see Figure 1-2). The SOCC isresponsible for continuous monitoring and supervision of the spacecraft and instruments. The SOCCplans and schedules spacecraft and ground system activities to satisfy the mission requirements. TheCDA station is the principal terrestrial interface with the GOES satellites. It provides communicationwith the GOES spacecraft. In general, those components closely associated with real time productionof the GVAR data stream derived from the raw instrument data, and with retransmitting this streamthrough the spacecraft, are located at the CDA. The remaining components primarily those associatedwith scheduling and planning and off-line engineering and analysis functions, are located at the SOCCfor normal operation, but are backed up by redundant copies at the CDA for continued operationduring communication outages or catastrophic failures of the SOCC.
Command schedule generation is performed at the SOCC with commands being relayed to theCDA station by way of the telemetry and command system. Commands are uplinked to the spacecraftby the transmit/receive systems at the CDA, which also receives and processes spacecraft telemetrydata.
The GOES I-M Imager and Sounder data communications system function similarly to itscounterpart in the GOES D-H system. The raw output data stream from the spacecraft is received atthe CDA station, where it is demodulated, processed, and output in the GVAR format by the SensorProcessing System (SPS) component of the OGE. After processing by the SPS, the calibrated,earth-located, GVAR formatted data stream is transmitted from the CDA to the spacecraft which, inturn, retransmits it to Direct Readout earth stations.
The Orbit and Attitude Tracking System (OATS) component of the OGE assists in navigation

Page 3
(Orbit and Attitude Determination) of the GOES I-M Spacecraft. The Product Monitors (PMs) assistthe OATS by extracting landmark information from the Imager and Sounder data inaddition to providing image quality control and coefficients for SPS normalization and coregistrationfunctions.

Page 4
Page 5
Page 6
Page 7
Page 8
2.0 THE IMAGER AND THE SOUNDER
The GOES I-M Imager and Sounder have increased capabilities compared with the instrumentsonboard the GOES D-H satellites. The GOES I-M instruments have more spectral channels, higherresolution IR and Sounder, increased sensitivity, more rapid area coverage, and much improvedlocation accuracy over previous GOES systems. They have flexibility of scan parameters and completeindependence of the two instruments.
A body-stabilized satellite with one surface continually oriented toward the earth provides theplatform for the instruments. The full-time operation of the Imager and Sounder permits maximumsensitivity and flexibility of control, enhancing synoptic, aperiodic, and mesoscale observations.
The GOES I-M satellites carry a five-channel (four infrared and one visible) Imager and a19-channel (18 infrared and one visible) Sounder. This system provides capabilities not available in thepredecessor GOES in that the GOES I-M Imager has: a) simultaneous imaging from all infrared andvisible channels and b) higher IR resolution (4km) in the surface and cloud detection channels. GOESI-M Sounder quality is improved by having: a) total isolation and independence from imaging, b) moreand narrower spectral channels, c) spatial resolution reduced to 8km and d) sufficient sensitivity for fullquality soundings to be derived from each atmospheric column.
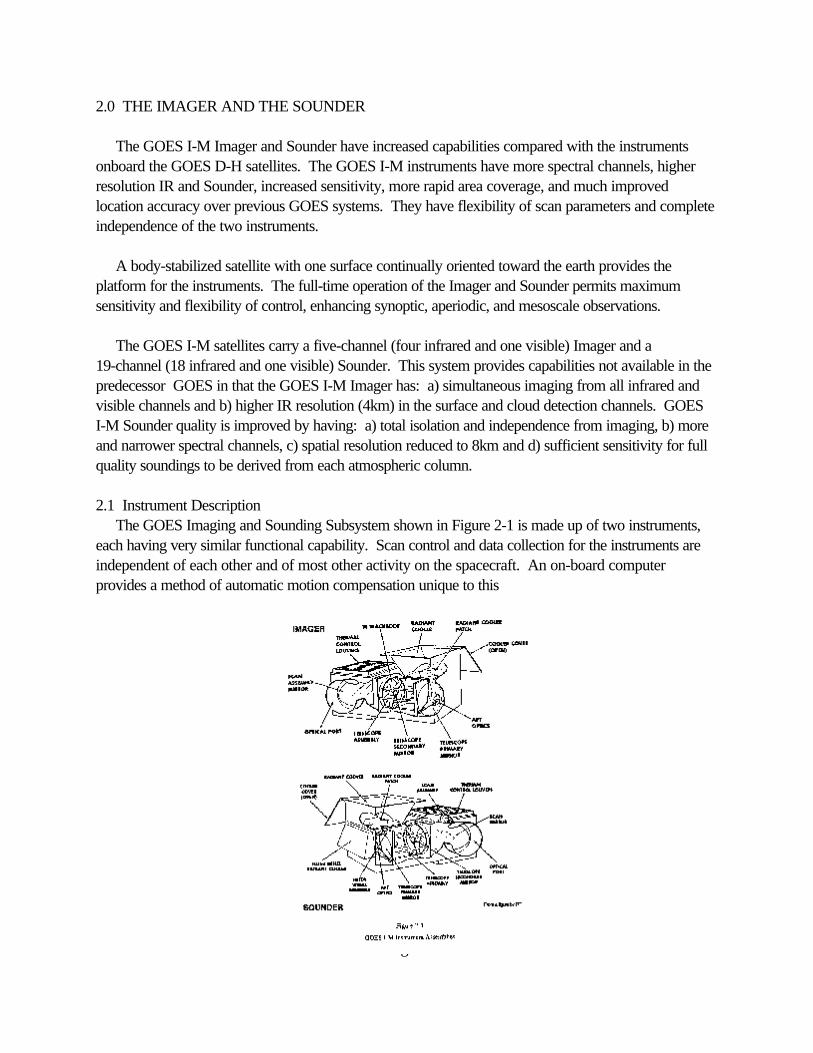
2.1 Instrument Description The GOES Imaging and Sounding Subsystem shown in Figure 2-1 is made up of two instruments,each having very similar functional capability. Scan control and data collection for the instruments areindependent of each other and of most other activity on the spacecraft. An on-board computerprovides a method of automatic motion compensation unique to this
Page 9
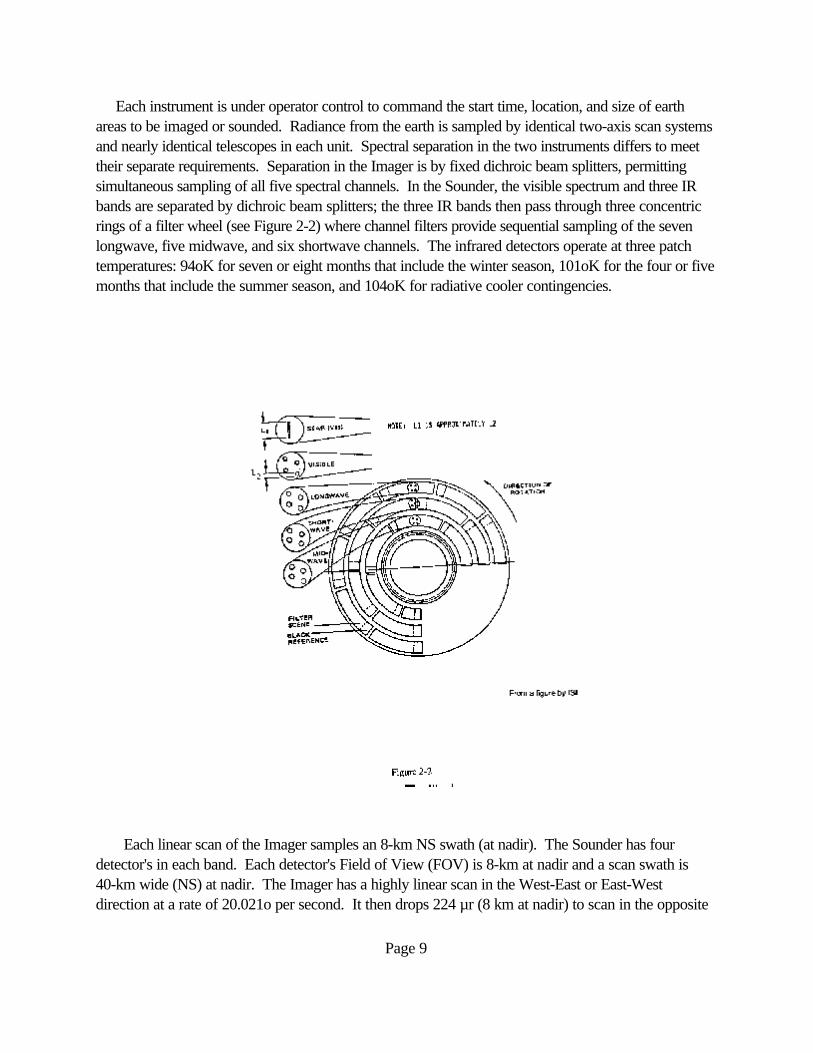
Each instrument is under operator control to command the start time, location, and size of earthareas to be imaged or sounded. Radiance from the earth is sampled by identical two-axis scan systemsand nearly identical telescopes in each unit. Spectral separation in the two instruments differs to meettheir separate requirements. Separation in the Imager is by fixed dichroic beam splitters, permittingsimultaneous sampling of all five spectral channels. In the Sounder, the visible spectrum and three IRbands are separated by dichroic beam splitters; the three IR bands then pass through three concentricrings of a filter wheel (see Figure 2-2) where channel filters provide sequential sampling of the sevenlongwave, five midwave, and six shortwave channels. The infrared detectors operate at three patchtemperatures: 94oK for seven or eight months that include the winter season, 101oK for the four or fivemonths that include the summer season, and 104oK for radiative cooler contingencies.
Each linear scan of the Imager samples an 8-km NS swath (at nadir). The Sounder has fourdetector's in each band. Each detector's Field of View (FOV) is 8-km at nadir and a scan swath is40-km wide (NS) at nadir. The Imager has a highly linear scan in the West-East or East-Westdirection at a rate of 20.021o per second. It then drops 224 µr (8 km at nadir) to scan in the opposite

Page 10
direction to continue a frame. The Sounder steps at a fixed pattern rate of 0.1 seconds for each 280 µr(10 km at nadir) in the West-East or East-West direction, then steps down (or up) 1120 µr (40 km) tothe next contiguous scan to continue a frame. See Figure 2-3.
Interactive operation of the instruments and spacecraft permits independent operation of theindividual scan systems, yet maintains the pointing accuracy of each optical system. This isaccomplished by a Mirror Motion Compensation (MMC) algorithm on the spacecraft which recognizes
the scan mirror motions and their physical effect on the spacecraft. A counteracting signal is developedand fed to both instruments to apply the appropriate corrections that maintain the scan mirror angleaccuracy with respect to the earth.

Page 11
Star reference data collection is performed by each instrument. This permits regular determinationof optical references. These features that reduce pointing errors permit the total system to achieve highaccuracies with respect to ground coordinates.
Each instrument's optical assembly measures approximately 18" x 18" x 42". A 9" long sun shieldextends from the scan cavity and a 24" square by 12" extension shields the radiative cooler. Theseparate electronics module for each instrument, containing nearly all the control and signal processingcircuitry, is located across from the optical assembly.
Raw Imager data is transmitted at 2.6208 Mbps. The Sounder has a much lower rate at 0.040Mbps.
2.2 Key Features
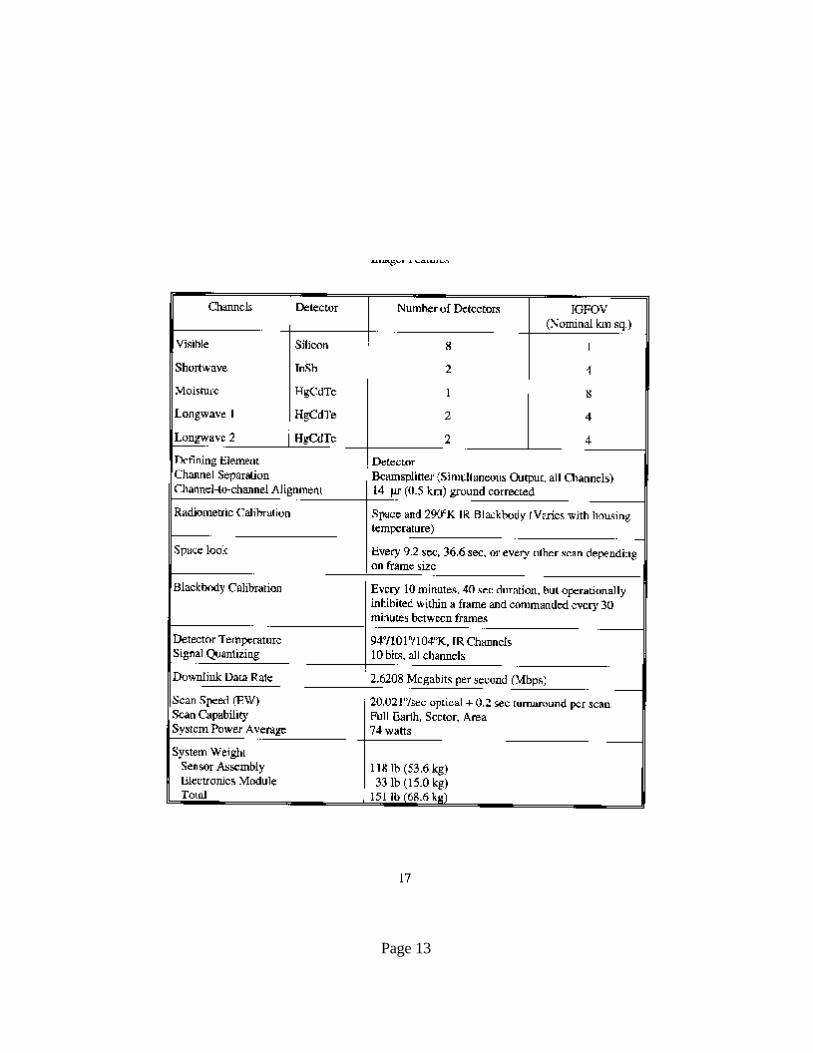
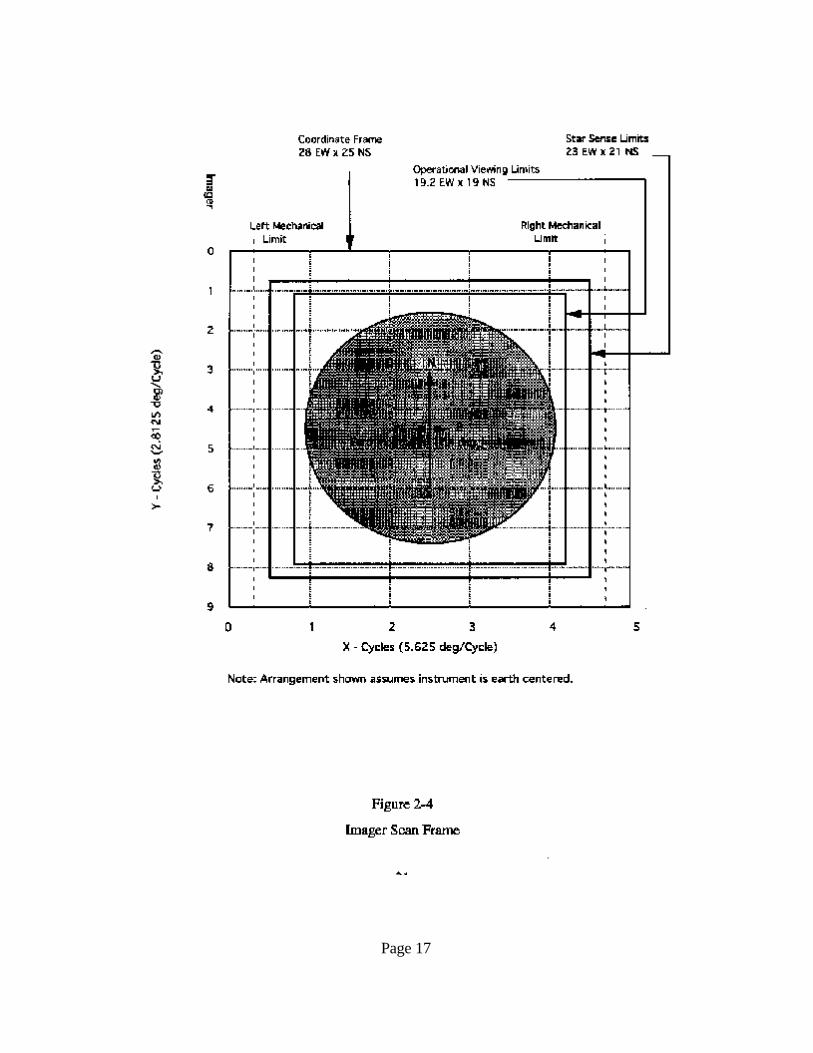
General characteristics of the two units are summarized and their performance is given in Tables2-1, 2-2, 2-3, and 2-4. Figures 2-4 and 2-5 show the coordinate frames and scan limits for theinstruments. Prime features of these instruments are as follows:
+ Scan control
- Commandable frame size and location.
- Imager and Sounder mechanically independent and fully stable against other instrument's motion(MMC).
- Capability to interrupt long duration frames to permit priority (storm watch) observations -- notexpected to be used operationally.
- Repeat-frame option, similar to Rapid Interval Scan Operations (RISOPS) -- not expected tobe used operationally due to lack of control of frame start time.
+ Position Location and Frame Overlay Accuracies
- Imager pixel locations accurate to 4 km at nadir, at noon ± 8 hours; registration betweenrepeated images from 53 µr and 210 µr depending upon time of day and time between frames.
- Sounder sample locations accurate to 10 km at nadir, at all times; registration between repeatedsoundings of 280 µr.
+ Long Term Stability and Calibration
Page 12
- Space reference used for short term radiance reference.
- Full aperture blackbody reference used for regular slope (radiance per output count) calibrationapproximately every half hour to offset diurnal variation.
+ Application to Weather and Climate. Typical imaging scenarios, based on some approximations oftime required for image generations, are
- A full earth image requires 30 minutes, including overhead functions.
- An area scan of 3000 km by 3000 km requires 3 minutes.
- A 1000 km by 1000 km area requires 45 seconds.
Combinations of these frames may be pre-programmed and repeated. It is possible, though notoperationally planned, to interrupt one frame with another (priority), such as for continuous storm watchthrough a period of scheduled synoptic images. Small area (mesoscale) images may be positionedprecisely and repeated as required for the planned purpose.
Page 13

Page 14

Page 15

Page 16
Page 17

Page 18
Page 19
2.3 Instrument Operational Modes
At any given time, each instrument is in one of six modes:
+ Normal Scan Frame -- The instrument is scanning some portion of the earth/space withincommanded rectangular scan limits.
+ Priority Scan Frame -- Scanning in this mode is identical to scanning in a normal scan frame. However, a priority scan frame may be started when the instrument is in idle mode or when it isin normal scan frame mode. That is, a priority scan frame may interrupt a normal scan frame. If apriority frame interrupts a normal frame, then when the priority scan frame is completed the normal scanframe resumes from the point of interruption. In the Imager, upon returning to a normal frame froma completed priority frame, scanning is resumed at the beginning of the scan line that was interrupted. There are two levels of priority. See Section 4 for the operational uses of this mode.
+ Star Sense/Sequence -- The instrument slews to just beyond the location of a star, and holdsthat position for a commanded period of time as the star drifts across the field of view.
+ Space Look -- Based on the expiration of a timer, the ongoing operation, e.g., frame scan, isinterrupted while the instrument slews to space, collects data for a fixed period of time, and resumes theinterrupted operation.
+ Blackbody Calibration -- Based on the expiration of a timer (10 minutes for the Imager and thenonly out of frame; 20 minutes for the Sounder, either in or out of frame), the instrument performs aspace look followed by a view of the internal blackbody. Operationally the timer is disabled andblackbody calibrations are commanded approximately every 30 minutes for the Imager between scanframes, and every 15 minutes for the Sounder.
+ Idle -- The instrument remains in idle mode whenever no other operation is being performed.
Any of the above modes can be terminated by a scan reset command. In response to a scan reset,the instrument slews to nadir, performs a blackbody calibration, returns to nadir, and enters idle mode,and performs system reinitialization.

Page 20
3.0 GVAR
This section defines the structure and content of the GVAR (GOES I-M Variable) processedinstrument data transmission format. This format is primarily used to transmit meteorological datameasured by the Imager and Sounder instruments. Additionally, parameters associated with themeasuring instrumentation are transmitted in the format, as are auxiliary products.
The GVAR format has its origins in the Operational VAS Mode AAA (Triple A) format. The AAAformat featured a fixed length format composed of twelve equal size blocks. These blocks aretransmitted synchronous with the spin of the earlier GOES, i.e., one complete 12-block sequenceoccurs for each rotation of the satellite.
With the advent of the three-axis stabilized GOES employing a two-degree of freedom imaging scanmirror and a separate independent sounding instrument, the range and flexibility of satellite operationsare increased. The use of a fixed length transmission format would have required that operationallimitations be placed on the satellite's capabilities. The GVAR format was developed to permit full useof the new capabilities while maintaining as much commonality with AAA reception equipment aspossible.
GVAR is generated by the Sensor Processing System (SPS), a portion of the Operations GroundEquipment (OGE). Each SPS, one per spacecraft, generates a separate GVAR data stream. The SPScalibrates and normalizes Imager and Sounder data and generates gridding and earth location data forImager data.
GVAR data words are in Gould floating point format.
3.1 Scan Format
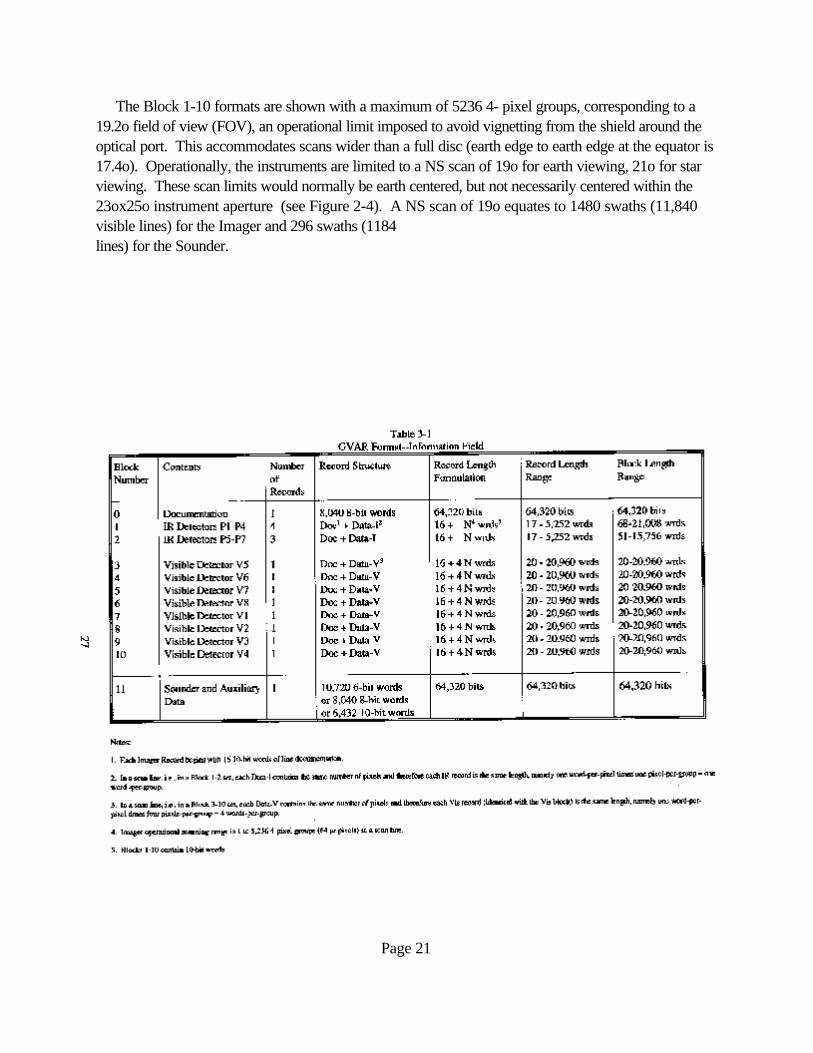
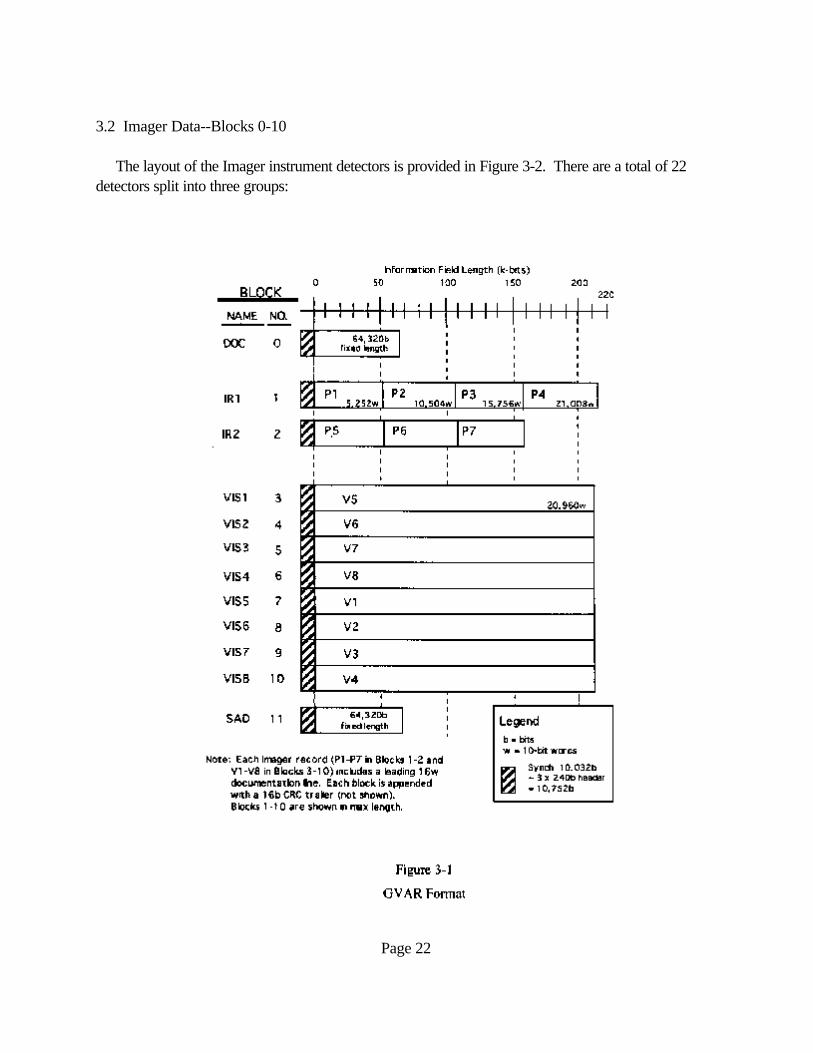
The GVAR transmission sequence is depicted in Figure 3-1. It consists of twelve distinct blocksnumbered 0 through 11. Blocks 0 through 10 are transmitted as a contiguous set for each Imager scanswath (eight lines). Block 10 will be followed by a variable number of Block 11s according to whatdata is available for transmission. Each GVAR Block is transmitted with a 10,032-bit synchronizationcode, a 720-bit header (3 copies of a 240-bit sequence), the variable length information field containing1-4 records and a 16-bit Cyclic Redundancy Check (CRC) trailer. Blocks 0 and 11 are fixed, equallength blocks of 64,320 bits each in the information field. The information fields in Blocks 1 through 10vary in length directly in accordance with the width of the Imager scan line. The formula for computingthe total number of bits downlinked in GVAR Blocks 0-10, including synchronization fields, headersand trailers, in a single scan is 185,168 + 390 x N, where N is the number of mirror 4-pixel groups (4 x16 µr pixels) in the scan line. The formula for computing the number of words in the Information Fieldsonly in GVAR Blocks 0-10 for a single scan is 8,280 + 39 x N, yielding a range of 8,280 to 212,484words. Table 3-1 provides further details about the structure of the GVAR format information field.
Page 21
The Block 1-10 formats are shown with a maximum of 5236 4- pixel groups, corresponding to a19.2o field of view (FOV), an operational limit imposed to avoid vignetting from the shield around theoptical port. This accommodates scans wider than a full disc (earth edge to earth edge at the equator is17.4o). Operationally, the instruments are limited to a NS scan of 19o for earth viewing, 21o for starviewing. These scan limits would normally be earth centered, but not necessarily centered within the23ox25o instrument aperture (see Figure 2-4). A NS scan of 19o equates to 1480 swaths (11,840visible lines) for the Imager and 296 swaths (1184lines) for the Sounder.
Page 22
3.2 Imager Data--Blocks 0-10
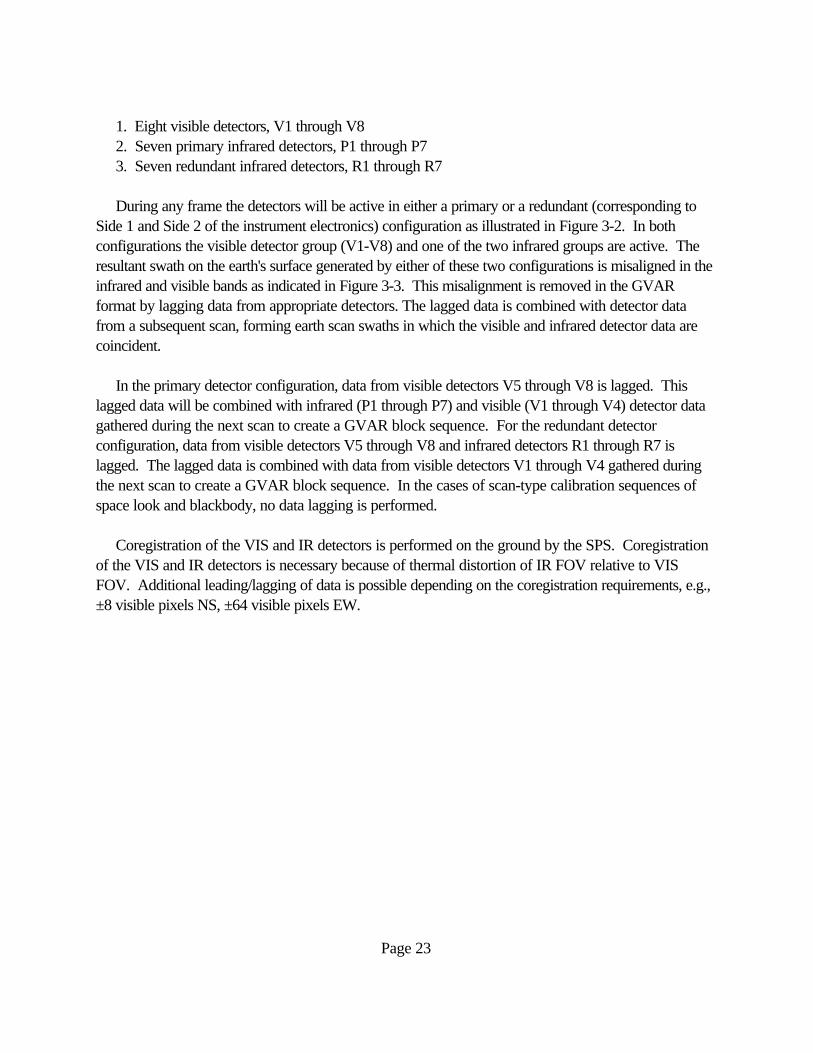
The layout of the Imager instrument detectors is provided in Figure 3-2. There are a total of 22detectors split into three groups:
Page 23
1. Eight visible detectors, V1 through V8 2. Seven primary infrared detectors, P1 through P7 3. Seven redundant infrared detectors, R1 through R7
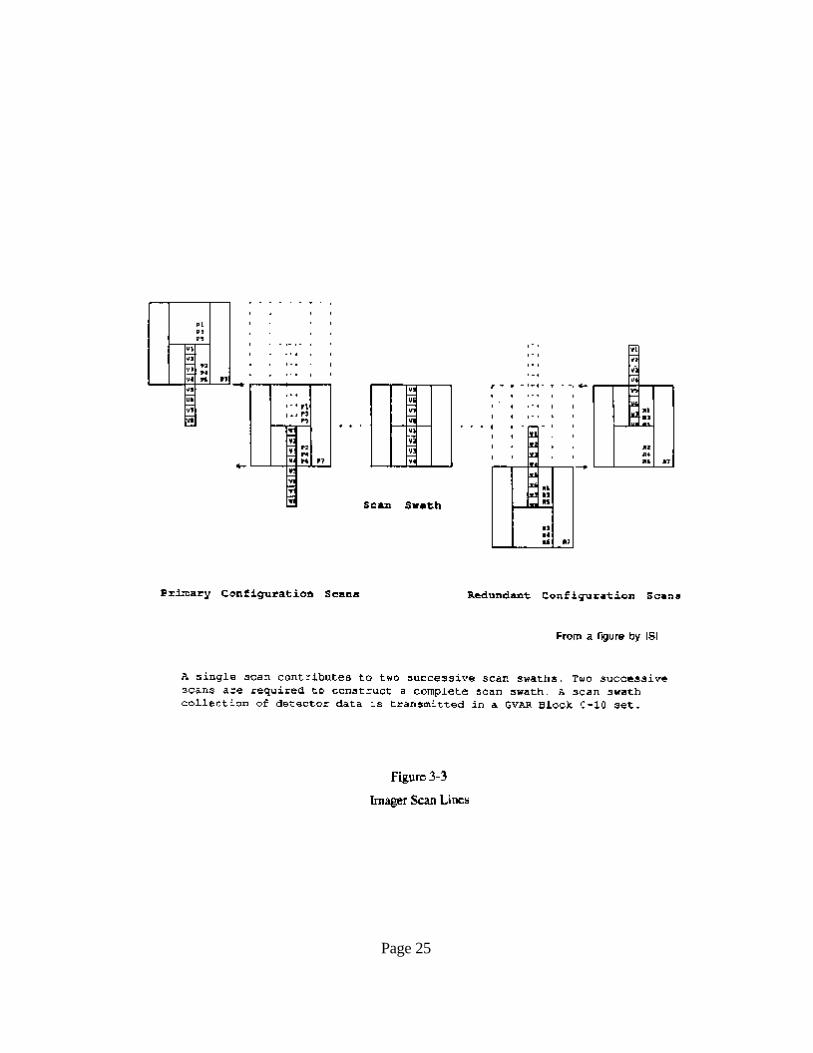
During any frame the detectors will be active in either a primary or a redundant (corresponding toSide 1 and Side 2 of the instrument electronics) configuration as illustrated in Figure 3-2. In bothconfigurations the visible detector group (V1-V8) and one of the two infrared groups are active. Theresultant swath on the earth's surface generated by either of these two configurations is misaligned in theinfrared and visible bands as indicated in Figure 3-3. This misalignment is removed in the GVARformat by lagging data from appropriate detectors. The lagged data is combined with detector datafrom a subsequent scan, forming earth scan swaths in which the visible and infrared detector data arecoincident.
In the primary detector configuration, data from visible detectors V5 through V8 is lagged. Thislagged data will be combined with infrared (P1 through P7) and visible (V1 through V4) detector datagathered during the next scan to create a GVAR block sequence. For the redundant detectorconfiguration, data from visible detectors V5 through V8 and infrared detectors R1 through R7 islagged. The lagged data is combined with data from visible detectors V1 through V4 gathered duringthe next scan to create a GVAR block sequence. In the cases of scan-type calibration sequences ofspace look and blackbody, no data lagging is performed.
Coregistration of the VIS and IR detectors is performed on the ground by the SPS. Coregistrationof the VIS and IR detectors is necessary because of thermal distortion of IR FOV relative to VISFOV. Additional leading/lagging of data is possible depending on the coregistration requirements, e.g.,±8 visible pixels NS, ±64 visible pixels EW.

Page 24
Page 25
Page 26
3.3 Non-Imager Data--Block 11
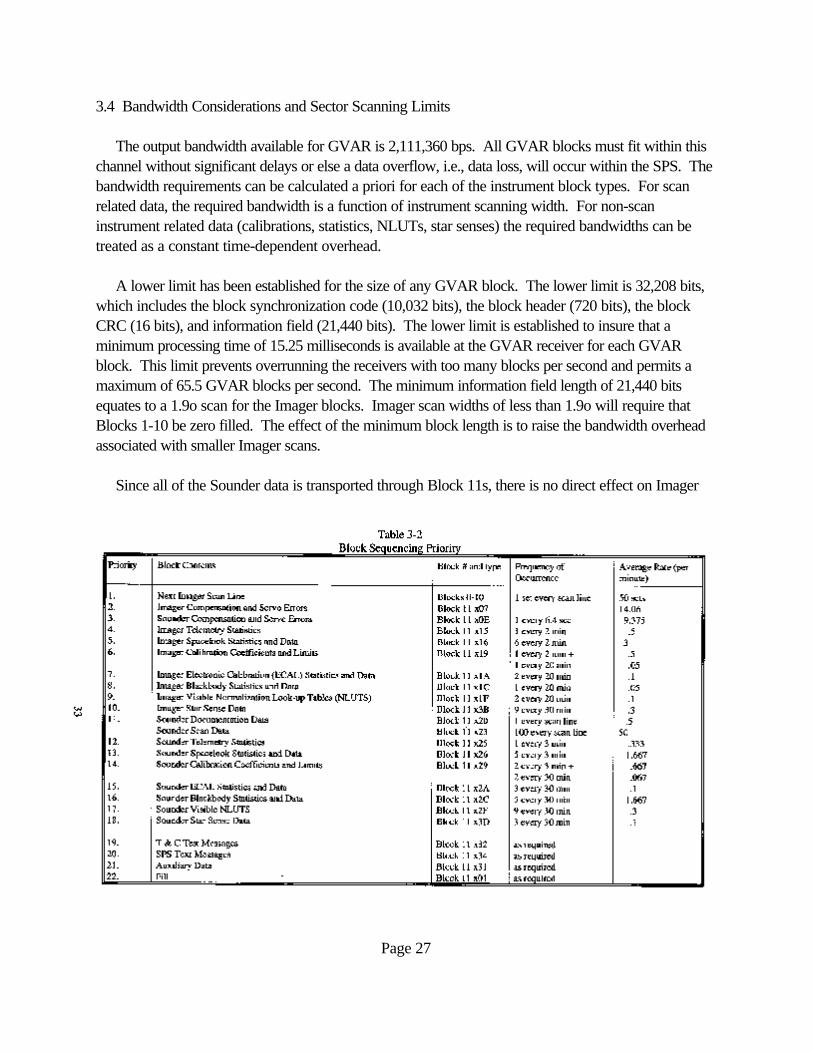
A scan by the Imager instrument will result in the generation of GVAR Blocks 0-10. Thetransmission of Blocks 0-10 will be followed by the transmission of a variable number of Block 11s (0to n) according to the nature of the data available for transmittal. The priority followed in determiningwhat data to transmit next is shown in Table 3-2.
When the Imager is actively scanning, there is not always sufficient time to transmit all of thegenerated Block 11s between consecutive Block 0-10 sets. There is always sufficient time for allSounder data Block 11s generated during simultaneous operation of both instruments. The number ofBlock 11s that appear contiguously is the number there is time for, i.e., until the next Block 0-10 set isready for output.
Note in Table 3-2 that the total effective rate of generation of non- fill Block 11s is about 80 perminute (1.3 per second) when both instruments are actively scanning. A full width Imager scan takes1.16 seconds including turnaround. So, while Block 11s are being generated at about the same rateas Block 0-10 sets, and while it is true that the SPS will generate fill Block 11s in otherwise idle timebetween Block 0-10 sets, it is NOT true that a Block 11 will necessarily appear every few Block 0-10sets. Rather, because the SPS buffers many scan lines of Imager data before assembling and outputtingGVAR Block 0-10 sets, the GVAR data stream can contain many consecutive Block 0-10 sets withoutany intervening Block 11s.
Page 27
3.4 Bandwidth Considerations and Sector Scanning Limits
The output bandwidth available for GVAR is 2,111,360 bps. All GVAR blocks must fit within thischannel without significant delays or else a data overflow, i.e., data loss, will occur within the SPS. Thebandwidth requirements can be calculated a priori for each of the instrument block types. For scanrelated data, the required bandwidth is a function of instrument scanning width. For non-scaninstrument related data (calibrations, statistics, NLUTs, star senses) the required bandwidths can betreated as a constant time-dependent overhead.
A lower limit has been established for the size of any GVAR block. The lower limit is 32,208 bits,which includes the block synchronization code (10,032 bits), the block header (720 bits), the blockCRC (16 bits), and information field (21,440 bits). The lower limit is established to insure that aminimum processing time of 15.25 milliseconds is available at the GVAR receiver for each GVARblock. This limit prevents overrunning the receivers with too many blocks per second and permits amaximum of 65.5 GVAR blocks per second. The minimum information field length of 21,440 bitsequates to a 1.9o scan for the Imager blocks. Imager scan widths of less than 1.9o will require thatBlocks 1-10 be zero filled. The effect of the minimum block length is to raise the bandwidth overheadassociated with smaller Imager scans.
Since all of the Sounder data is transported through Block 11s, there is no direct effect on Imager
Page 28
block length. However, Blocks 11s may contain only small amounts of meaningful data whentransporting non-Sounder data, e.g., text messages.
The Imager and Sounder each has a bandwidth requirement component that is dependent on thescan width of the instrument and a component that is nearly independent of the scan width. Sparebandwidth available for any combination of Imager and Sounder scan widths is measured in units ofspare Block 11s (75,088 bits) available per second. There are conditions under which the availablebandwidth of 2,111,360 bps will be exceeded by the requirements of the two instruments. Theseconditions arise from three primary sources of GVAR overhead:
1. The 10,032-bit block synchronization code (13.4% of each Block 11).
2. The 21,440-bit minimum data length requirement imposed for small GVAR blocks (1-10).
3. The Sounder Documentation Block 11 prefixing each Sounder scan line output.
For each of these three sources, the most negative effects are found at small scan width where theoverheads outweigh the instrument data being transported. For the Imager, the synchronization codeand the minimum data length represent over 90% of the visible data bandwidth requirement for a 0.2oscan width. A similar scan width for the Sounder yields 57% of bandwidth requirement being allocatedfor non-instrument data. As the scan widths for each instrument are increased, the percentage of theGVAR output bandwidth allocated to overheads declines, approaching 5% for the Imager visible data,and 13.4% for Sounder scan data.
In addition to the instrument data, the GVAR stream must also provide transport for auxiliary dataand text messages (from the SPS operator and the telemetry & command system). The text messagesare low-rate in the sense that the ingest channels available for their reception at the SPS are narrow,9600 bps. Additionally, their expected frequency of occurrence is very small. The auxiliary data, onthe other hand, has a relatively wide ingest channel (57,344 bps) and its expected usage rate is to bedetermined. To provide room for each of these three sources within the GVAR stream, time for onespare Block 11 per second has been allocated. Adequate bandwidth exists to support all functions forboth instruments as well as the text and auxiliary data if the following scan width constraints areobserved:
Imager: No constraints if Sounder is inactive (not scanning). If Sounder is active, then Imager scanwidth should be greater than 0.3o.
Sounder: No constraints if Imager is inactive. If Imager scan width is less than 14.4o, then theSounder scan width should be greater than 0.3o. If the Imager scan width is greater than 14.4o, thenthe Sounder scan width should be greater than 0.6o.
Page 29
These constraints can be violated without the loss of any instrument data. The only penalty incurredby doing so is to increase the time required to complete the transmission of any text and auxiliary datathat may be ready for GVAR output.
3.5 Transmission Delays and Preprocessing Delays of GVAR Blocks
The GVAR data stream is transmitted from the spacecraft at a carrier rate of 2,111,360 bps. TheGVAR formatted data is received by a user after some variable amount of time delay from the point atwhich the data was actually measured by the satellite instrumentation.
Block delays have four components:
1. Satellite-to-Sensor Processing System (SPS): raw data (raw downlink)
2. SPS processing time (two to 40 seconds)
3. SPS-to-Satellite: GVAR transmission (processed uplink)
4. Satellite-to-user: GVAR transmission (processed downlink)
The block transmission time for each of items 1,3, and 4 above, is approximately 0.5 seconds. SPSprocessing time, however, can be up to 40 seconds in duration. SPS processing transforms the rawdata into GVAR formatted data. The raw Imager data arrives in alternate west-to- east andeast-to-west scans; reordering the east-to-west scans to appear in west-to-east order in GVARnecessitates a minimum delay of one scan, which can be a full second for a large frame. The bufferingprocess is used to perform west-to-east ordering and to lag visible detector data to enable creation ofvisually overlaid (coregistered) infrared scan lines. Additionally, data for four of the visible detectorswill be delayed (lagged) one more instrument scan time to overlay the next set of infrared data. However, calibration is performed on recently received data after a spacelook occurs; i.e., the firstgroup of scan lines in a frame are buffered until a spacelook occurs and all subsequent scan lines arebuffered between spacelooks; the time between spacelooks, and therefore the buffer accumulation timeprior to the first Block 0-10 set, is 36.6 (or 9.2) seconds for frames narrower than full disk. Instead ofrequiring actual spaceclamps to obtain calibration data, full disk frames are calibrated by overscanningthe image to include 400 IR samples beyond earth edge on one side -- this effectively providesspacelook data for calibration at an interval of approximately every two seconds. At this point,transmission of Blocks 0-10 is enabled. Regardless of the calibration mechanism, 9.2 secondspaceclamp, 36.6 second spaceclamp, or alternate scan scanclamp, calibration samples are included inGVAR as a set of four Block 11s queued up for transmission every two minutes -- the four Block 11scontain the most recent spacelook samples from the two-minute interval.

Page 30
A similar buffering process is performed on the Sounder data by the SPS, primarily to permitwest-to-east ordering. Calibration of the Sounder data is performed after all of the raw data for a scanline swath has been received. The calibration procedure generates 76 arrays (one array for each of 19Sounder channels by four detectors) of calibrated pixel information plus sounder visible information. These arrays, along with the original raw downlinked Sounder Data blocks, are then sectioned andpackaged into the Block 11 format for Sounder sensor data. A full-width (19.2o) Sounder scan willrequire 101 Block 11s for complete transmission. It takes the Sounder 120 seconds to scan 19.2o atits fastest rate of 0.16o/sec (two and four times as long at its slower rates). Consequently, the bufferingprocess for the Sounder data takes that long. The subsequent calibration and Block 11 sectioning willtake between 10 and 15 seconds to perform. Calibrated Sounder blocks are then queued for outputalong with other Block 11 products. Finally, transmission of the 101 Block 11s could take anywherefrom 3.1 (no concurrent imaging) to 38 seconds (concurrent full-width imaging).
3.6 Encoding
Prior to biphase modulation, the data to be retransmitted undergoes three stages of encoding. Theencoding scheme is identical to that used with Mode AAA:
1. All even number eight-bit bytes (regardless of word length) are complemented; the first bytefollowing initial synchronization is byte number one.
2. The second stage involves PN coding. The PN sequence is generated by a shift register whoseinput is the output of an exclusive-OR gate. Bits 8 and 15 (MSB) of the shift register are theinputs to this gate. The output of the gate is combined with a data line using a second exclusive-ORgate.
3. The PN coded data stream described above is passed through an NRZ-S differential encodingprocess. This process produces a transition for each logic zero input and none otherwise.
3.7 Receiver Considerations
Direct read-out stations configured for the GOES-7 Mode AAA processed data stream requiresome modifications to receive GOES-8 imagery in the GVAR format.
+ If the front end demodulator is tunable, it must be retuned to the new 65.7 MHz IF-- assuming the Local Oscillator (L.O.) frequency is 1620 MHz., since GVAR is 1685.7 MHz. vs.1687.1 MHz. for Mode AAA. + If the demodulator is not tunable, it must be replaced it with one tuned to 65.7 MHz.
Page 31
This can sometimes be done by replacing crystal oscillator and matched filter components withoutreplacing the whole demodulator unit. Users are advised to check with the manufacturer. This assumesthe Local Oscillator (L.O.) frequency is 1620 MHz. since GVAR is 1685.7 MHz. vs. 1687.1MHz. for Mode AAA. + The bit synchronizer should handle GVAR with no changes. + If the frame synchronizer reads the Mode AAA header (with particular regard to word andblock sizes) and responds accordingly, and if it ignores block type and block ordering, then it willprobably operate correctly with GVAR. Users should contact the frame synchronizer manufacturerregarding this. When processing GVAR, a user device should not use the data valid flag in the header to turn itselfon or off. This flag merely indicates the validity of the data in the block, and not the frame status. There are separate flags for frame status in the Imager documentation block (Block 0) and the Sounderdocumentation block (one of the Block 11 types). 3.8 Earth Location
GVAR does not contain an earth location array for the Imager due to bandwidth limitations. Anearth location array is provided with GVAR Sounder data that maps each pixel into a specific lat/lonpoint. An algorithm to convert Imager scan line and pixel coordinates to earth Lat/Lon is available insoftware programmed in Fortran 77. The software, and its accompanying documentation, known asthe Earth Location User's Guide (ELUG), was produced by Integral Systems, Inc. (ISI - Lanham,Maryland).
3.9 Calibration
In orbit, the infrared channels of both the Imager and Sounder are calibrated with data taken as theyview space and their on-board blackbodies. The SPS at Wallops, VA applies calibration to thescene data in real time. The SPS also normalizes the visible-channel data to minimize east-west stripingin the images. The visible channels are not calibrated in orbit because the GOES I-M instruments donot have on- board calibration targets in the visible.
The calibration coefficients (three per channel/detector) and the scaling coefficients (two perchannel) are also contained in GVAR. Users can derive the radiances from counts in the retransmitteddata stream by inverting the scaling operation. They can retrieve the raw data from the radiances byinverting the calibration. For the Sounder, GVAR will contain both raw and calibrated data. For theImager, it will only contain the calibrated data, because the GVAR data stream has insufficient

Page 32
bandwidth to contain both. GVAR also contains statistical data and telemetry information formonitoring the calibration and instrument performance.
When an instrument receives radiation emitted and/or reflected from a scene, it puts out a signalrelated to the intensity of the received radiation. Calibration is the process quantifying that relationship. Since the relationship is nearly linear (see reference 8), it can be determined by measuring theinstrument's responses (in digital counts) to radiation from two targets at known, but different,temperatures. The imager and sounder make these measurements by observing space (whosetemperature is effectively zero in the infrared) and internal blackbodies, whose temperatures areconstantly monitored. In orbit, an instrument's calibration relationship is almost always varying, becauseit depends on the temperatures of the instrument's components, transmissivities of the mirrors and otheroptics components, etc., and these properties may vary diurnally, seasonally, and with instrument age. Therefore, the instruments need to be calibrated frequently.
Blackbody calibration is based on the expiration of a timer, 10 minutes for the Imager and 20minutes for the Sounder. Imager calibration occurs only out of frame, i.e., not while a frame scan is inprogress; if the timer expires while a scan is in progress, the blackbody calibration occurs uponcompletion of the frame. Sounder blackbody calibration occurs either in or out of frame, uponexpiration of the timer, but after any dwell that might be in progress. The instrument performs a spacelook followed by a view of the internal blackbody. Operationally the timer is disabled and blackbodycalibrations are commanded approximately every 30 minutes for the Imager between scan frames, andevery 15 minutes for the Sounder.
The Imager can perform spacelooks in two ways. The scan can be interrupted and the mirrorpointed to space to take a reading; this is called a spaceclamp. Or the scan frame can be made suchthat either the east side or the west side extends beyond earth edge, beyond earth shine, into space,making the instrument scan space; this is called a scanclamp.
Spaceclamps are performed upon the execution of a timer. The timer is selectable at 9.2 secondsor 36.6 seconds; the timer restarts upon expiration so that spacelooks are at fixed intervals. Upontimer expiration, the Imager completes the line it is scanning, slews horizontally to the preselected sideto a point 10.4E from nadir to perform the spacelook, performs a turnaround sequence, and resumesscanning the frame. Therefore, the time between two spacelooks may vary by up to two seconds (plusor minus) from the timer interval. The turnaround sequence includes retracing the last line three times,so the duration of the interruption is proportional to the width of the frame. And, of course, the totalamount of time the scan is interrupted is proportional to the number of spacelooks performed, andtherefore, to the total size of the frame. A set of six Block 11s containing spacelook data will begenerated every two minutes, or once at the end of the frame for shorter duration frames.
In scanclamp mode the frame scan is never interrupted, but the frame actually scanned extends outinto space, beyond the area of meteorological interest. The frame edge extends beyond earth edge,
Page 33
beyond earth shine (a 0.5E wide ring around the earth), and out into space far enough to acquire apreset number of samples. Initially, the number of samples obtained by the GOES-8 Imager will be400 IR samples, 64 r on center, for a displacement of 1.47E beyond earth shine. Scanclamp modewill typically be used for full disk frames, making the frame boundary lie 1.97E beyond earth edge at theequator, or 10.67E from nadir. In a full disk frame scanned thusly, with the overscan into space appliedonly to one side of the earth, i.e., every other scan line, space calibration data is obtained every 2.2seconds. The full width of an Imager frame scanned in this mode typically will not be seen in theGVAR data. Instead, in GVAR the frame will contain only the portion of meteorological interest, thewidth of the frame typically truncated at earth edge. As in spaceclamp mode, a set of six Block 11scontaining spacelook data will be generated every two minutes.
The Sounder operates only in spaceclamp mode with a 2 minute timer, asynchronous to the framestart. The spaceclamp occurs upon expiration of the timer and after completion of any 0.1 secondsounding.

Page 34
4.0 OPERATIONAL SCHEDULES
Sector scanning, as opposed to full disk scanning, is the standard mode of operation for the GOESI-M series with the scanning of almost any local sector area technically possible. There are threedefined modes of operation -- Routine, Rapid Scan, and Full Disk. The Imager and the Sounder eachhas its own schedule. Due to spacecraft housekeeping requirements every six hours, each dailyschedule consists of four repetitions of a basic six-hour schedule. This has the effect of synchronizingImager and Sounder operation every six hours. Each six- hour schedule is composed of six one-hourschedules, which also repeat, but with major exceptions, first to accommodate the spacecrafthousekeeping, and, secondly if necessary, to accommodate a sector that is not scanned every hour. The hourly schedule for each instrument is a result of National Weather Service requirements forproducts.
+ The Routine mode is the normal mode of operation. In this mode the Imager will scan a fulldisk every three hours, with a Northern Hemisphere, CONUS, and Southern Hemisphere sectorscanned in each half-hour not occupied by a full disk scan or spacecraft housekeeping. The Sounder's Routine Mode will scan a Full Region Northern Hemisphere sector each hour for the firstfour hours of each six-hour cycle; the fifth hour contains seasonally dependent sectors, and the sixthhour contains a Limited Regional sector. See figure 4-1.
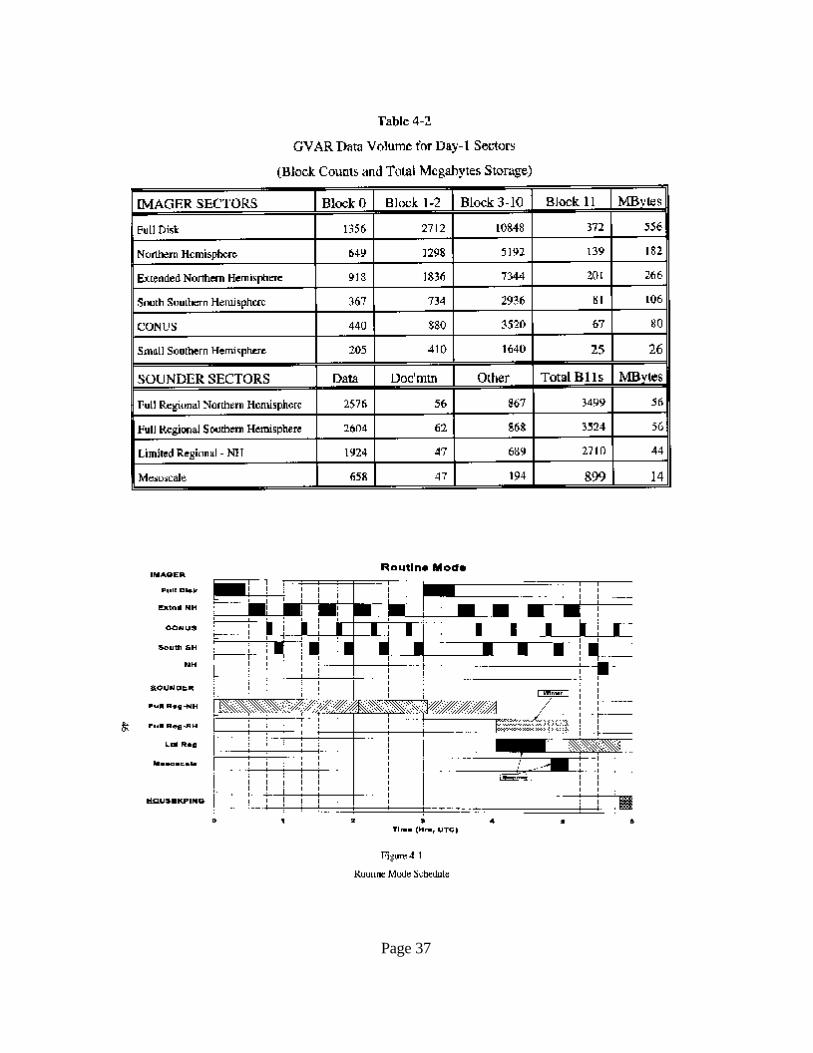
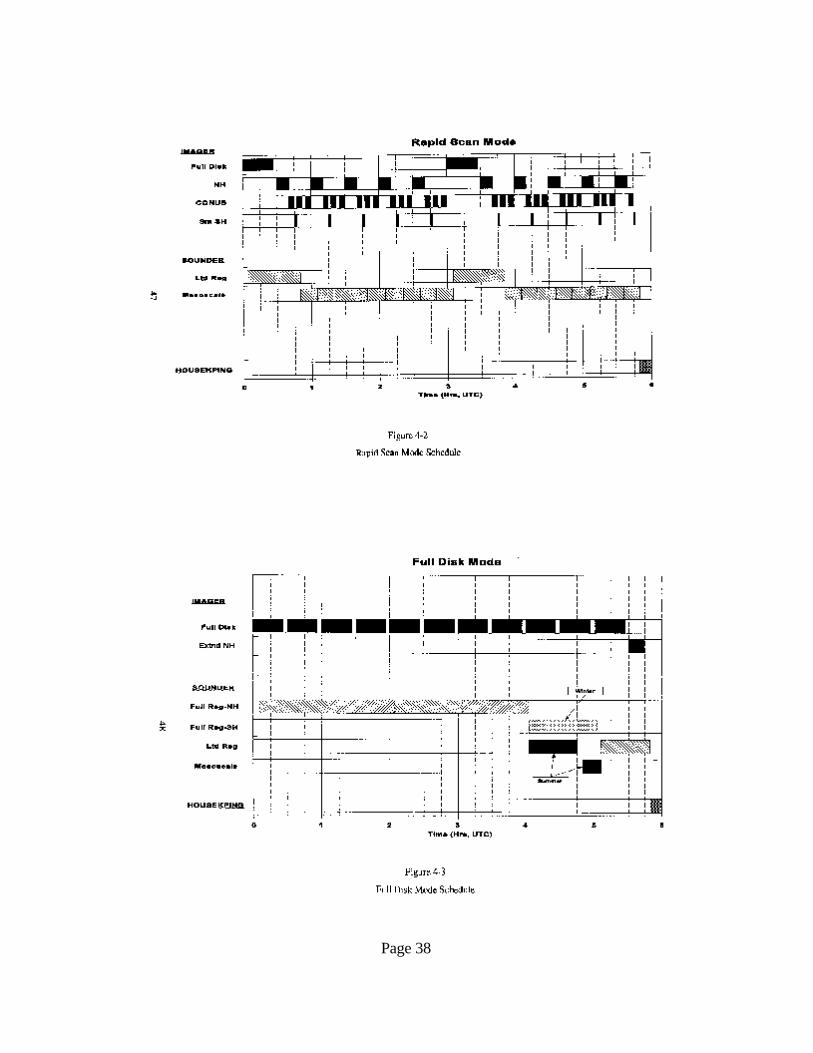
+ The Rapid Scan mode will be enacted when the onset of severe weather is suspected. TheImager, in the half-hour periods not devoted to Full Disk sectors, will scan a Northern hemispheresector, three repetitions of the CONUS sector, and a Small Souther Hemisphere sector. Thiseffectively rescans the CONUS four times each half- hour except during full disk scans and spacecrafthousekeeping. The Sounder will scan a Limited Regional sector for a 45-minute period each threehours; otherwise it will repeatedly scan a half-hour Mesoscale sector. See figure 4-2.
+ Full Disk mode is reserved for non-routine operations. In this mode the Imager will repeatedlyscan the Full Disk every half-hour except for spacecraft housekeeping. the Sounder's Full DiskMode schedule is the same as its Routine schedule. See figure 4-3.
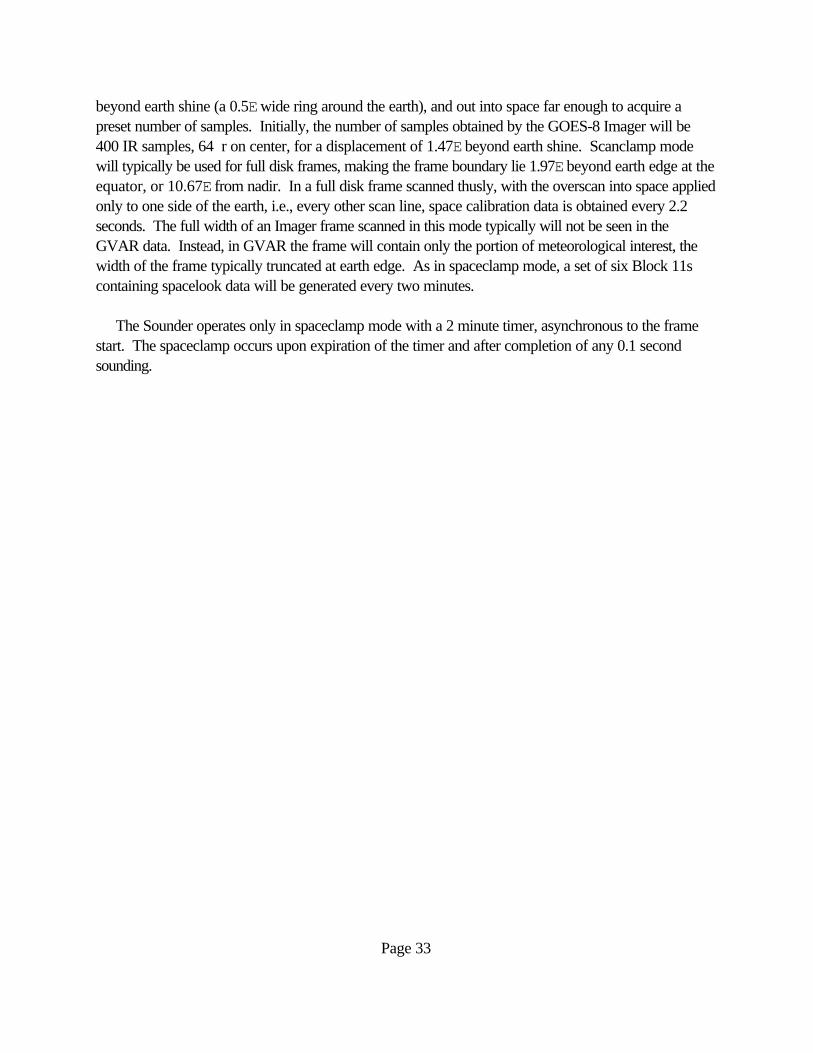
Sectors are described in Table 4-1. These sectors and schedules support the operationalrequirements of the National Centers and other, non-NWS users of GOES imagery (e.g., internationalWEFAX). These products and schedules are subject to change due to changing spacecraft operationalrequirements or changing requirements of the National Weather Service.
Page 35
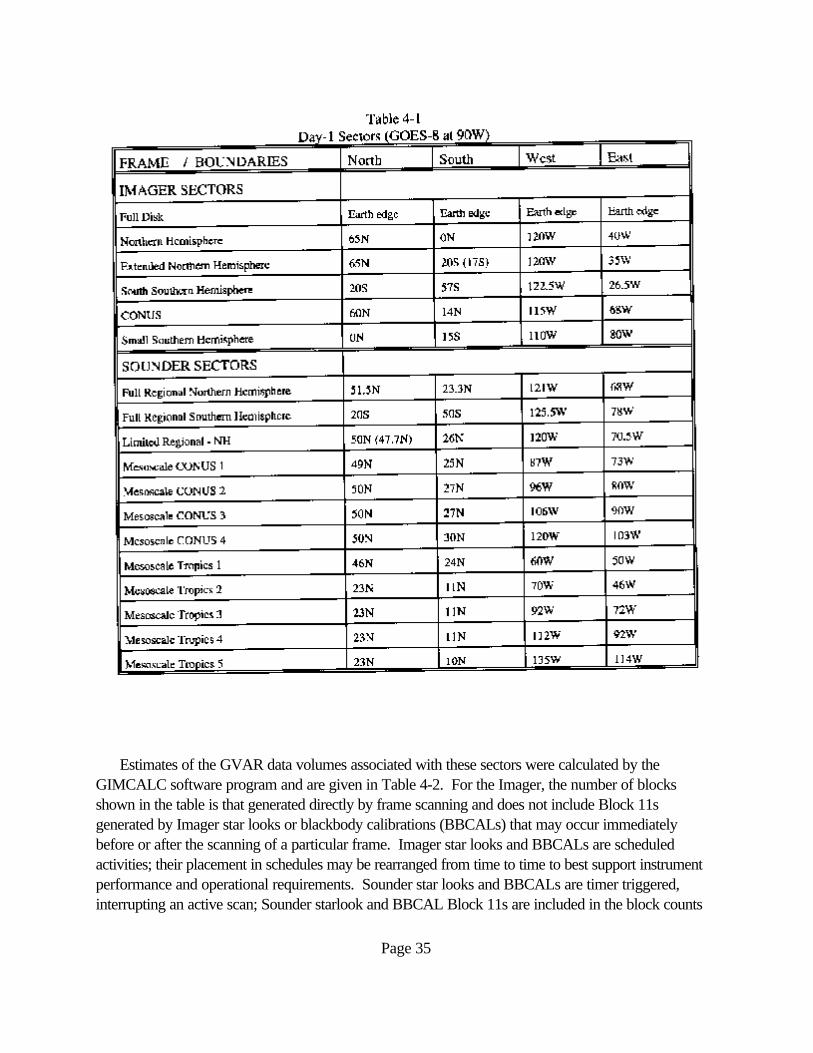
Estimates of the GVAR data volumes associated with these sectors were calculated by theGIMCALC software program and are given in Table 4-2. For the Imager, the number of blocksshown in the table is that generated directly by frame scanning and does not include Block 11sgenerated by Imager star looks or blackbody calibrations (BBCALs) that may occur immediatelybefore or after the scanning of a particular frame. Imager star looks and BBCALs are scheduledactivities; their placement in schedules may be rearranged from time to time to best support instrumentperformance and operational requirements. Sounder star looks and BBCALs are timer triggered,interrupting an active scan; Sounder starlook and BBCAL Block 11s are included in the block counts

Page 36
in the table. Actual block counts may be slightly different if sector boundaries are adjusted or if thespacecraft is situated at a different longitude. Storage requirements in megabytes are based on twobytes per GVAR data word.
Page 37
Page 38

Page 39
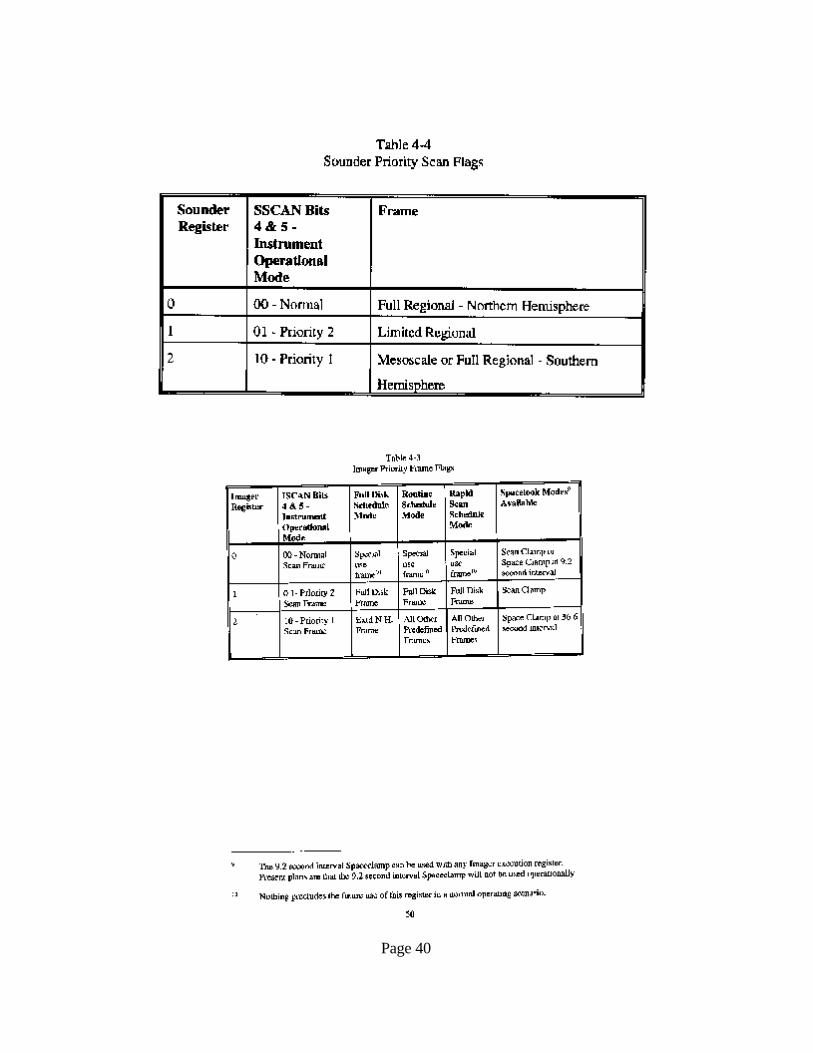
Each instrument maintains four command registers, corresponding to command levels numbered 0through 3. Level numbers indicate command priority, with 3 being the highest. Level 0 is used fornormal frame commands, levels 1 and 2 are priority frame commands, and level 3 is starsense/sequence. Operationally, only one frame command will be sent at a time, so only one prioritylevel will be in use at any time.
While NESDIS is not presently planning to interrupt GOES-8 Imager frame scans with "nested"(interrupting) priority frames, the various priority levels will appear in the GVAR Block-0 ISCAN flag. These priority levels are associated with frame execution registers in the instrument; the variousspacelook modes are constrained to certain registers; so each frame will have the "priority" associatedwith its spacelook mode. Full disk frames, which will be scanned in scanclamp spacelook mode, willbe of priority 2; all other frames will be of priority 1. Register 0 is currently reserved for specialoperations -- appearance of a "normal frame" (ISCAN flags 4 & 5 set to 00) may indicate anexceptional situation and the frame may not be useable for production applications or operationalpurposes. Tables 2-5 and 2-6 summarize the use of the registers/priorities for the Imager and theSounder, respectively. NESDIS may change this practice on GOES-8 or following satellites andimplement priority frame interrupts (nested frames) as a part of the operational scenario.
Page 40
Page 41
The Sounder Scan Data Block (Block 11 priority 11 in Table 3-2) contains fields that indicatewhether the current stream of Sounder data (Block 11s) are parts of a normal or a priority Sounderframe and whether the Block 11 is the first, last, or an intermediate Block in the frame.
Star Sense, Space Look, and BBCAL for the Imager and for the Sounder are later indicated by theoccurrence of the corresponding Block 11, see Table 3-2. When both instruments are in Idle modeand no other Block 11s are incoming, GVAR consists of a stream of Fill Block 11s (priority 22 inTable 3-2).
Page 42
REFERENCES
Ford Aerospace and Communications Corporation (1987), Operations Ground Equipment (OGE)Interface Specification (from NASA S-480- 21A), Palo Alto, CA; superseded by SpaceSystems/Loral (1994), Operations Ground Equipment (OGE) Interface Specification, DRL 504- 02,Palo Alto, CA (with Section 3 commonly known as the GVAR Format specification)
Ford Aerospace and Communications Corporation (1987), Operations Ground Equipment (OGE)System Design, Analysis, and Implementation Plan (SDAIP), DRL 504-01, Palo Alto, CA.;superseded by Space Systems/Loral (1994), Operations Ground Equipment (OGE) Operations andMaintenance Manual, DRL 504-06, Palo Alto, CA
Integral Systems, Inc. (1987), The Imager/Sounder To Operations Ground Equipment (OGE) InterfaceControl Document Of The GOES I,J,K,L, & M Spacecraft, ISI-SP-36-004, Lanham, MD (commonlyknown as the downlink document); superseded by Space Systems/Loral (1992), Imager/Sounder ToOperations Ground Equipment (OGE) Interface Control Document, Palo Alto, CA
E. W. Koenig (1986), The GOES-NEXT Imager and Sounder, Ft. Wayne, IN, Aerospace/OpticalDivision ITT
R. J. Komajda and K. McKenzie (1987), An Introduction To the GOES I- M Imager and SounderInstruments and the GVAR Retransmission Format, NOAA Technical Report NESDIS 33,Washington, DC
ITT Aerospace/Communications Division (1993), Imager Operational Reference Manual, SDRL-60,Fort Wayne, IN
ITT Aerospace/Communications Division (1993), Sounder Operational Reference Manual, SDRL-61,Fort Wayne, IN
John Savides (1992), Geostationary Operational Environmental Satellite GOES I-M SystemDescription, Palo Alto, CA, Space Systems/Loral
Space Systems/Loral (undated, available 1994), GOES I-M DataBook, DRL 101-08, Palo Alto, CA
R. J. Komajda (1994), GIMCALC Users Manual, McLean, VA
Space Systems/Loral (1994), Earth Location Users Guide For The GOES I-M Spacecrafts, DRL504-11, Palo Alto, CA
Page 43
GLOSSARY
Acronyms
AAA Mode Triple-A (Processed instrument data format for current GOES)
BB BlackbodyBBCAL Blackbody calibrationbps bits per second
CDA Command and Data Acquisition Station (NOAA)CONUS The contiguous 48 of the United StatesCRC Cyclic Redundancy Check
ECAL Electronic calibrationEW East-West
FACC Ford Aerospace and Communications CorporationFOV Field of View (given in either angular or earthsurface spatial units)
GSFC Goddard Space Flight Center (NASA)GOES Geostationary Operational Environmental SatelliteGVAR GOES Variable (processed instrument data format for GOES I-M)
IFOV Instantaneous Field of ViewIGFOV Instantaneous Geometric Field of ViewIMC Image Motion CompensationIR Infrared
K Kilo (thousand) or Kelvin degrees (temperature)Kbps Kilobits per second (thousand bits per second)
µr microradiansmr milliradiansµm micro-metersMMC Mirror Motion CompensationMbps Megabits per second (million bits per second)
n/a not applicableNLUTS Normalization Look-up TablesNS North-South
Page 44
OATS Orbit and Attitude Tracking System (of OGE)OGE Operations Ground Equipment (i.e., SPS , OATS, PM,and ODAPS)
PID Processed Instrument Data (e.g., AAA or GVAR)
RID Raw Instrument DataRISOPS Rapid Interval Scan Operations
SAR Search and Rescue (GOES transponder)SEM Space Environment Monitor (GOES instruments)SOCC Satellite Operations Control Center (NOAA)SPS Sensor Processing System (of OGE)
T&C Telemetry and CommandTCS Telemetry and Command System
WEFAX Weather Facsimile

Page 45
APPENDIX A
OPERATIONAL IN-ORBIT CALIBRATION
This paper was presented at the American Meteorological Society 7th Conference on SatelliteMeteorology and Oceanography, Monterey, CA, June 6-10, 1994.
OPERATIONAL IN-ORBIT CALIBRATION OF GOES-I IMAGER AND SOUNDER
Michael P. Weinreb*NOAA/NESDIS
Washington, DC 20233
William C. Bryant, Jr., Marvin S. Maxwell, and James C. BremerSwales and Associates, Inc.
Beltsville, MD 20705
1. INTRODUCTION
Radiometric calibration of the GOES I-M imagers and sounders is a multi-stage processbeginning before the launch of each satellite and extending throughout its life. Before launch, theinstruments' performance is characterized under controlled conditions by their manufacturer (ITT, Ft.Wayne, IN) and by the GOES I-M prime contractor (Space Systems/Loral Palo Alto, CA). In orbit,the infrared channels will be calibrated with data taken as they view space and their on-boardblackbodies. The calibration will be applied to the scene data in real time in the ground system atNOAA's Command and Data Acquisition Station at Wallops, VA. At the same time, thevisible-channel data will be normalized to minimize east-west striping in the images. The visible channelswill not be calibrated in orbit, because the GOES I-M instruments do not have on-board calibrationtargets in the visible.
2. CALIBRATION OF INFRARED CHANNELS
In orbit, each instrument views space and its on- board warm blackbody to provide data tocalibrate its infrared channels. Each instrument's blackbody is in front of its optical chain and fills itsoptical aperture, providing a full-system calibration. The calibration equation (one for each infraredchannel), which relates sensor output x (in digital counts) to scene radiance R (mW/[m2-sr-cm-1]) is
R = qx2 + mx + b.
Page 46
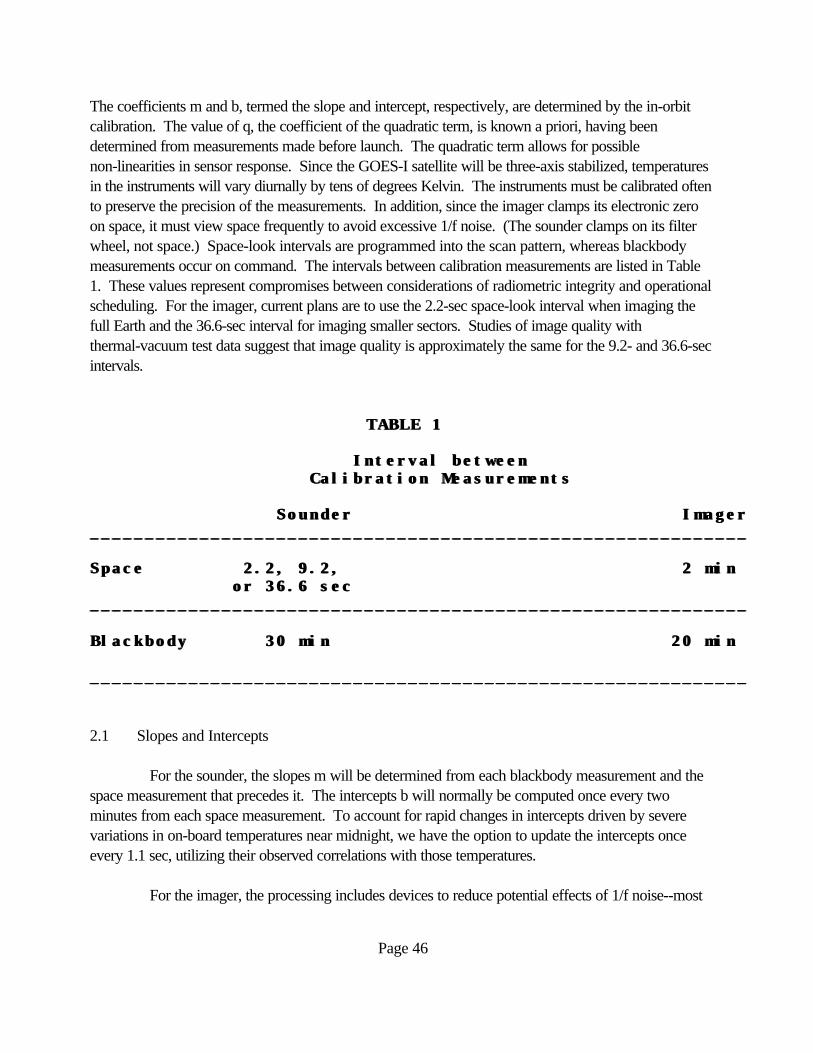
The coefficients m and b, termed the slope and intercept, respectively, are determined by the in-orbitcalibration. The value of q, the coefficient of the quadratic term, is known a priori, having beendetermined from measurements made before launch. The quadratic term allows for possiblenon-linearities in sensor response. Since the GOES-I satellite will be three-axis stabilized, temperaturesin the instruments will vary diurnally by tens of degrees Kelvin. The instruments must be calibrated oftento preserve the precision of the measurements. In addition, since the imager clamps its electronic zeroon space, it must view space frequently to avoid excessive 1/f noise. (The sounder clamps on its filterwheel, not space.) Space-look intervals are programmed into the scan pattern, whereas blackbodymeasurements occur on command. The intervals between calibration measurements are listed in Table1. These values represent compromises between considerations of radiometric integrity and operationalscheduling. For the imager, current plans are to use the 2.2-sec space-look interval when imaging thefull Earth and the 36.6-sec interval for imaging smaller sectors. Studies of image quality withthermal-vacuum test data suggest that image quality is approximately the same for the 9.2- and 36.6-secintervals.
TABLE 1TABLE 1 Interval between Interval between Calibration Measurements Calibration Measurements
Sounder Imager Sounder Imager________________________________________________________________________________________________________________________
Space 2.2, 9.2, 2 minSpace 2.2, 9.2, 2 min or 36.6 sec or 36.6 sec________________________________________________________________________________________________________________________
Blackbody 30 min 20 minBlackbody 30 min 20 min
________________________________________________________________________________________________________________________
2.1 Slopes and Intercepts
For the sounder, the slopes m will be determined from each blackbody measurement and thespace measurement that precedes it. The intercepts b will normally be computed once every twominutes from each space measurement. To account for rapid changes in intercepts driven by severevariations in on-board temperatures near midnight, we have the option to update the intercepts onceevery 1.1 sec, utilizing their observed correlations with those temperatures.
For the imager, the processing includes devices to reduce potential effects of 1/f noise--most
Page 47
notably low frequency "drifts" in the signal. Since the blackbody and space measurements are notsimultaneous, drift may render them incompatible and corrupt the computation of the calibration slope. To ameliorate this problem, we estimate the signal from space at the time of the blackbody measurementby interpolating the signal linearly between the preceding and following space looks.
If there is drift between two successive space looks, the calibration intercepts may becomeinvalid during the interval between them. We remove the effect of the linear component of the drift byinterpolating the intercept values to the time of each scene pixel. This means that the intercepts areupdated pixel by pixel.
The use of detector arrays may make some subtle effects of noise in the calibration moreapparent. The imager and sounder use north-south arrays of detectors in most spectral channels--all, infact, except channel 3 of the imager. With each scan of the earth, adjacent detectors sweep outadjacent east-west lines. Because the noise is uncorrelated among the detectors of an array,noise-induced errors in slope computations may cause line-to-line radiance biases. In images, this couldcause east-west stripes. The pattern of the stripes would change after each blackbody measurement. Although pre-launch test results suggest that this effect should be relatively weak, we plan to incorporatealgorithms in the ground system shortly after launch to minimize it.
2.2 Quadratic Term
The coefficient q of the quadratic term was determined in pre-launch thermal-vacuum tests asa function of two parameters--the temperature of the instrument's detector patch and the temperature ofits baseplate. A table of q vs these two temperatures is stored in the ground system. When GOES-I isin orbit, we measure those temperatures and estimate the appropriate value of q by interpolating in thetable.

Page 48
In the thermal vacuum tests, for each setting of baseplate temperature and patch temperature,the values of q were determined as follows: The instrument was illuminated by an external blackbodyequipped with temperature sensors whose calibration is traceable to the National Institute of Standardsand Technology. The output of the instrument (in digital counts) was recorded as the temperature of theblackbody was stepped between 200K and 320K in seven approximately equal-radiance increments. Radiances in each channel were computed from the temperatures of the blackbody. The value of q wasthen determined from a least square fit of a quadratic to the radiance-vs-count data. As an example ofthis process, Figure 1 shows the residuals of linear and quadratic fits to the data in channel 3 (6.7 um) ofthe GOES-I imager.
Figure 1. Residuals from linear fit (filled circles) and quadratic fit (triangles) to calibration data inchannel 3 of GOES-I imager (from Cousins et al., 1993).
(The residuals are in units of percent of the peak radiance, which corresponds to approximately 320K,and are plotted against radiance. The error bar at the right side of the plot is an estimate of the singlesample noise.) The residuals of the linear fit exhibit a distinct curvature, indicating the need for a
Page 49
higher-order fit. The quadratic is sufficient, since its residuals and any pattern they may exhibit areinsignificant in comparison to measurement noise.
2.3 Data Flow
When the GOES-I is in orbit, raw imager and sounder data will be transmitted to theCommand and Data Acquisition Station (CDA) continuously in real time. Raw imager data will be in10-bit words, raw sounder data in 13-bit words. Calibration processing for the infrared channels,culminating in the retransmission of the data to users, will take place at the CDA in real time. In theprocessing, the calibration coefficients will be computed as previously discussed, and they will beapplied to the raw data, converting them to radiances. The radiances will then be scaled linearly so thatthey utilize the full 10-bit (imager) or 16-bit (sounder) word length of the retransmitted data stream. Thecalibration coefficients (three per channel/detector) and the scaling coefficients (two per channel) willalso be in the retransmitted data stream. Users can derive the radiances from counts in the retransmitteddata stream by inverting the scaling operation. They can retrieve the raw data from the radiances byinverting the calibration. (For the sounder, the retransmitted data stream will contain both raw and"calibrated" data. For the imager, it will only contain the "calibrated" data, because the retransmitteddata stream has insufficient bandwidth to contain both.) The data stream will also contain statistical dataand telemetry information for monitoring the calibration and instrument performance.
3. NORMALIZATION OF VISIBLE-CHANNEL DATA
The imager uses a north-south array of eight silicon diode detectors to image the earth, and thesounder uses an array of four similar detectors, primarily for cloud detection. With each rotation of thescan mirror, the imager thus produces eight adjacent east-west lines and the sounder, four. The visibledetector-channels are not calibrated in orbit, but the retransmitted data stream will contain coefficientsdetermined before launch that convert instrument output (in counts) to radiance (W/[m2-sr-u]) andreflectance factor or albedo (on a scale of 0-1). Since detector responsivities can vary unpredictably,the pre-launch calibration may not be valid after launch.
Without in-orbit calibration, the images will be susceptible to striping. Striping will be reduced bythe normalization of each detector's output to the output of a stable reference detector (see below). Thenormalization will be applied in real time at the CDA at Wallops, VA through application ofnormalization look-up tables (NLUTs) to the raw scene data.
Image quality will be monitored daily off line at NESDIS in Suitland, MD. If striping becomessignificant, new NLUTs will be generated at NESDIS and transmitted electronically to Wallops. Because detector responsivities are expected to vary slowly, at least in the short term, it is expected thata given NLUT will remain valid for periods of the order of a month or longer.
The technique for generating NLUTs involves matching the empirical distribution functions (EDFs)
Page 50
of the raw data from each detector to the EDF of the raw data from the reference detector (Weinreb etal., 1989). The reference detector will be chosen after launch as the one with the best combination ofsuch characteristics as long-term stability and maximum use of the count range of the data systemwithout clipping at the upper and lower limits.
When the GOES-I is in orbit, the data flow for the visible-channel data will be similar to that for theinfrared. The raw data from the imager and sounder will be transmitted to the CDA as 10-bit and 13-bitwords, respectively. In the CDA, the raw data will be normalized, but no calibration will be applied. Theretransmitted data stream will contain the normalized data in 10-bit words (imager) and 16-bit words(sounder). The retransmitted data stream will also carry the normalization look-up tables, the identity ofthe reference detector, and the date the normalization look-up tables were created. In addition, it willcontain the pre-launch calibration coefficients (three per detector, but with the quadratic coefficientsidentically zero) and the factor that converts radiance to reflectance factor. If users wanted to apply thepre-launch calibration to the normalized data, they should apply the calibration coefficients for thereference detector to the data from all detectors.
4. ACKNOWLEDGEMENTS
We are grateful to Roy Galvin of ITT and R. Heinrichs, D. Cousins, and E. Wack of MIT/LincolnLaboratory, who analyzed the infrared calibration data from the thermal/vacuum tests. The GOES I-Mgrounds system, including the calibration-processing software, was developed by Internal Systems, Inc.(ISI) of Lanham, MD. We appreciate the assistance and cooperation we received from numerous ISIemployees.
5. REFERENCES
Cousins, D., E.C. Wack, and R.M. Heinrichs, 1993: GOES SN03 imager final thermal vacuum IR calibration results. MIT Lincoln Laboratory Project Report NOAA-5, 163pp.
Weinreb, M.P., R. Xie, J.H. Lienesch, and D.S. Crosby, 1989: Destriping GOES images by matchingempirical distribution functions. Remote Sens. Environ.,29, 185-195.
* Corresponding author address: Michael P. Weinreb, Satellite Research Laboratory, NOAA/NESDIS, Washington, D.C. 20233.